Article

Pore Characteristics, Oil Contents and Factors Influencing Laminated Shale in the First Member of the Qingshankou Formation in the Gulong Sag, Northern Songliao Basin

1
School of Earth Sciences and Engineering, Xi’an Shiyou University, Xi’an 710065, China
2
Shanxi Key Laboratory of Petroleum Accumulation Geology, Xi’an Shiyou University, Xi’an 710065, China
3
Exploration and Development Research Institute of Daqing Oilfield Co., Ltd., Daqing 163712, China
4
Heilongjiang Provincial Key Laboratory of Continental Shale Oil, Daqing 163712, China
5
State Key Laboratory of Continental Dynamics, Department of Geology, Northwest University, Xi’an 710069, China
6
Production Engineering and Research Institute of Daqing Oilfield Co., Ltd., Daqing 163453, China
*
Author to whom correspondence should be addressed.
Minerals 2023, 13(9), 1220; https://doi.org/10.3390/min13091220
Submission received: 17 July 2023 / Revised: 20 August 2023 / Accepted: 14 September 2023 / Published: 17 September 2023
(This article belongs to the Special Issue Geochemical Characterization of Source Rocks in Oil and Gas Fields)

Abstract

:
To clarify the reservoir characteristics of laminated shale, the occurrence mechanism of shale oil and its influencing factors in the Gulong Sag, northern Songliao Basin, are studied to better guide the exploration and development of shale oil there. First, X-ray diffraction (XRD) and field-emission scanning electron microscopy (FE-SEM) are used to characterize the pore types, pore geneses and factors influencing the pore volume in the study area. Second, the organic matter of the samples is extracted with a mixture of dichloromethane and methanol. Total organic carbon (TOC), nitrogen adsorption and Rock-Eval tests are performed on the samples before and after extraction to reveal the pore size distribution after extraction. The factors influencing free and adsorbed shale oil and the lower limit of pore size are discussed in detail. The results show that interparticle pores (interP pores), intraparticle pores (intraP pores), organic matter pores (OM pores) and microfractures can be found in the laminated shale (Q1) in the Gulong Sag, Songliao Basin, and that the interP pores and intercrystalline pores in clay minerals are the main pores. The FE-SEM results show that the diameters of interP pores vary from several hundred nanometers to several microns, and their morphologies are mainly triangular, strip-shaped or irregular. The morphology of the intercrystalline pores in the clay minerals is generally irregular, depending on the crystal type and arrangement of clay minerals. According to the characteristics of the nitrogen adsorption and desorption curves, the pore morphologies are mainly slit-shaped pores, parallel-plate-shaped pores and ink-bottle-shaped pores. The pore size distribution is mostly bimodal, and the pore volume contribution is the greatest in the pore size range of 10~20 nm. Before and after extraction, the overall characteristics of the pore size distribution change only slightly, but the number of micropores increases significantly. Different minerals have different degrees of influence on the proportions of micropores, mesopores and macropores. Quartz mainly inhibits the formation of micropores, while the overall effect on mesopores and macropores is positive depending on the diagenetic period. Feldspar has a strong positive correlation with the micropore and mesopore proportions but is not highly correlated with the macropore proportions. The influence of the carbonate mineral content on the pore volume is not obvious because of its complex composition. The TOC content and vitrinite reflectance (Ro) are the two most important factors controlling free oil and adsorbed oil, and the contents of mineral components, such as felsic minerals, carbonate minerals and clay minerals, have no obvious correlation with shale oil content. With increasing pore volume, the contents of free oil and adsorbed oil increase, but the proportion of adsorbed oil decreases gradually. The correlation between the specific surface area and adsorbed oil content is poor. At normal temperatures and pressures, the lower limit of the pore diameters that can contain free oil is 4 nm, and the lower limit of the pore diameters that can contain movable oil is 10 nm.

1. Introduction

With the increasing demand for oil and gas worldwide and the annual decline in conventional oil and gas production, unconventional oil and gas have become important resources and have been widely studied [1]. Along with the successful development of shale oil in North America [2,3,4], which has changed the world energy pattern [5], the development of shale oil in China has gradually increased [6]. In addition, China has great potential for shale oil resources, with recoverable resources reaching 131.8 × 10⁸ t [7]. For example, the Chang 7 shale oil in the Ordos Basin [8], middle Permian Lucaogou Formation shale oil in the Junggar Basin [9] and Eocene Kong 2 member shale oil in the Bohai Bay Basin are all major areas of production [10], but the shale oils mentioned above are hybrid or interlayer shale oils. The Gulong shale in the Songliao Basin is a pure oil reservoir, which shows the development of laminar structures and foliation fractures in this study area. Due to the complex tectonic evolution background, diverse sedimentary environment and strong heterogeneity of reservoir rock and reservoir space, it is difficult to develop [11]. Gulong shale oil resources are as large as 54.5 × 10⁸ t, and many wells have obtained more than 13 t of industrial oil flow per day [12]. However, there is a high proportion of low-producing oil wells in Gulong shale, which increases costs. Research has shown that laminated shale has a variety of laminae forms and combination types, complex fabric characteristics and strong heterogeneity, which directly affects reservoir performance and the accumulation of shale oil; thus, reservoir properties and oil content are key issues in shale oil research [13]. Therefore, the identification of laminated shale pores and oil content not only is helpful for the selection of sweet spots but also has a practical guiding role in improving the exploration success rate.
Previous studies have shown that the Gulong shale oil in the Songliao Basin is mainly stored in a complex nanoscale pore–fracture system [14], and its reservoir properties are affected by many factors, such as the mineral content, total organic carbon (TOC) [15,16], organic matter maturity [17] and depth. The first member of the Qingshankou Formation (Q1) in the Gulong Depression mainly features interparticle pores, intraparticle pores, organic matter pores and microfractures [18,19,20], among which the pore size varies from several hundred nanometers to several microns [21]. The organic matter pores are closely related to the maturity of the sample. Generally, organic matter pores gradually increase in number when Ro exceeds 0.7% and reach a peak value when Ro = 1.1% [22]. The pore size distribution of the Q1 shale mainly presents a bimodal pattern, with peak values located at 10 nm and 40 nm [23]. When shale is in the mature stage, carbonate minerals have a positive effect on the porosity, which is mainly related to dissolution [24]. The pore volume shows an exponential or irregular trend with the change in the shale burial depth [25]. There is an obvious negative correlation between the TOC content and pore volume, but the destruction of micropores by organic matter mainly occurs at the low-maturity stage [26]. When organic matter maturity is low, hydrocarbon generation is weak, mainly due to the increase in the number of micropores. With the increase in maturation, organic matter generates many hydrocarbons, and the porosity of organic matter and dissolution increase [27]. When the organic matter enters a high-overmaturity stage, the organic matter is consumed substantially, and the porosity tends to be stable or slightly increases [28].
The pore volume determines the reservoir capacity of oil and gas, while the occurrence state and mobility of shale oil affect the development [29]. Previous studies have concluded that shale oil mainly exists in a pore–fracture system in free and adsorbed states [30,31]. Free shale oil easily flows and exists in intercrystalline pores, solution pores and the fractures of larger pores, while adsorbed shale oil has difficulty flowing and exists in organic matter pores and clay mineral pores [32]. According to the difference in small-angle scattering experiments, Sun et al. (2017) [33] speculated that Shahejie Formation shale oil in the Dongying Depression mainly exists in a pore size range of 2–50 nm. Bao (2018) [34] determined the lower limit of pore size that can contain free oil to be 10 nm by analyzing the pore size range corresponding to the oil expelled during the vacuum extraction process under a scanning electron microscope. According to Li’s (2015) [35] statistics on the correlation between the pore development of different pore sizes and the oil content of Cretaceous shales in the Songliao Basin, shale oil mainly exists in pores larger than 20 nm. Shi (2021) [36] classified laminated Paleogene organic-rich shales in the Bohai Bay Basin and studied the genesis and physical properties of different laminated shales, concluding that the proportion of intergranular pores and microfractures with good lamina continuity is higher in the Paleogene organic-rich shales in the Bohai Bay Basin, while the proportion of intergranular pores and shrinkage fractures with poor continuity is higher in the other shales. Organic matter in shale is the main factor controlling adsorbed oil, while quartz and carbonate minerals have no obvious relationship with the adsorbed oil content [37]. With increasing thermal maturity, the proportion of adsorbed oil gradually decreases, while the proportion of free oil gradually increases. The TOC content is positively correlated with the contents of free oil and adsorbed oil. Although previous studies have been conducted on the pore types, distribution characteristics, influencing factors and occurrence mechanisms of shale oil to a certain extent, due to the strong heterogeneity and considerable range in shale maturity, there is a lack of comparative analysis of the pore types, pore geneses and pore size distributions of shale with different lithofacies and maturity, as well as the occurrence characteristics and factors influencing shale oil. Therefore, 9 samples with a wide range of maturity were selected from the first section of Q1 in the Gulong Sag, ranging from mature (0.87%) to high maturity (1.51%). On the basis of X-ray diffraction (XRD), TOC and sedimentary structure analysis, the pore morphologies, pore types, pore geneses, pore size distributions and factors influencing the pore volume of different lithofacies were analyzed using scanning electron microscopy (SEM) and nitrogen adsorption. The main factors controlling the distributions of free oil and adsorbed oil and the lower pore size limit for containing oil in different states were analyzed by pyrolysis data obtained before and after extraction.

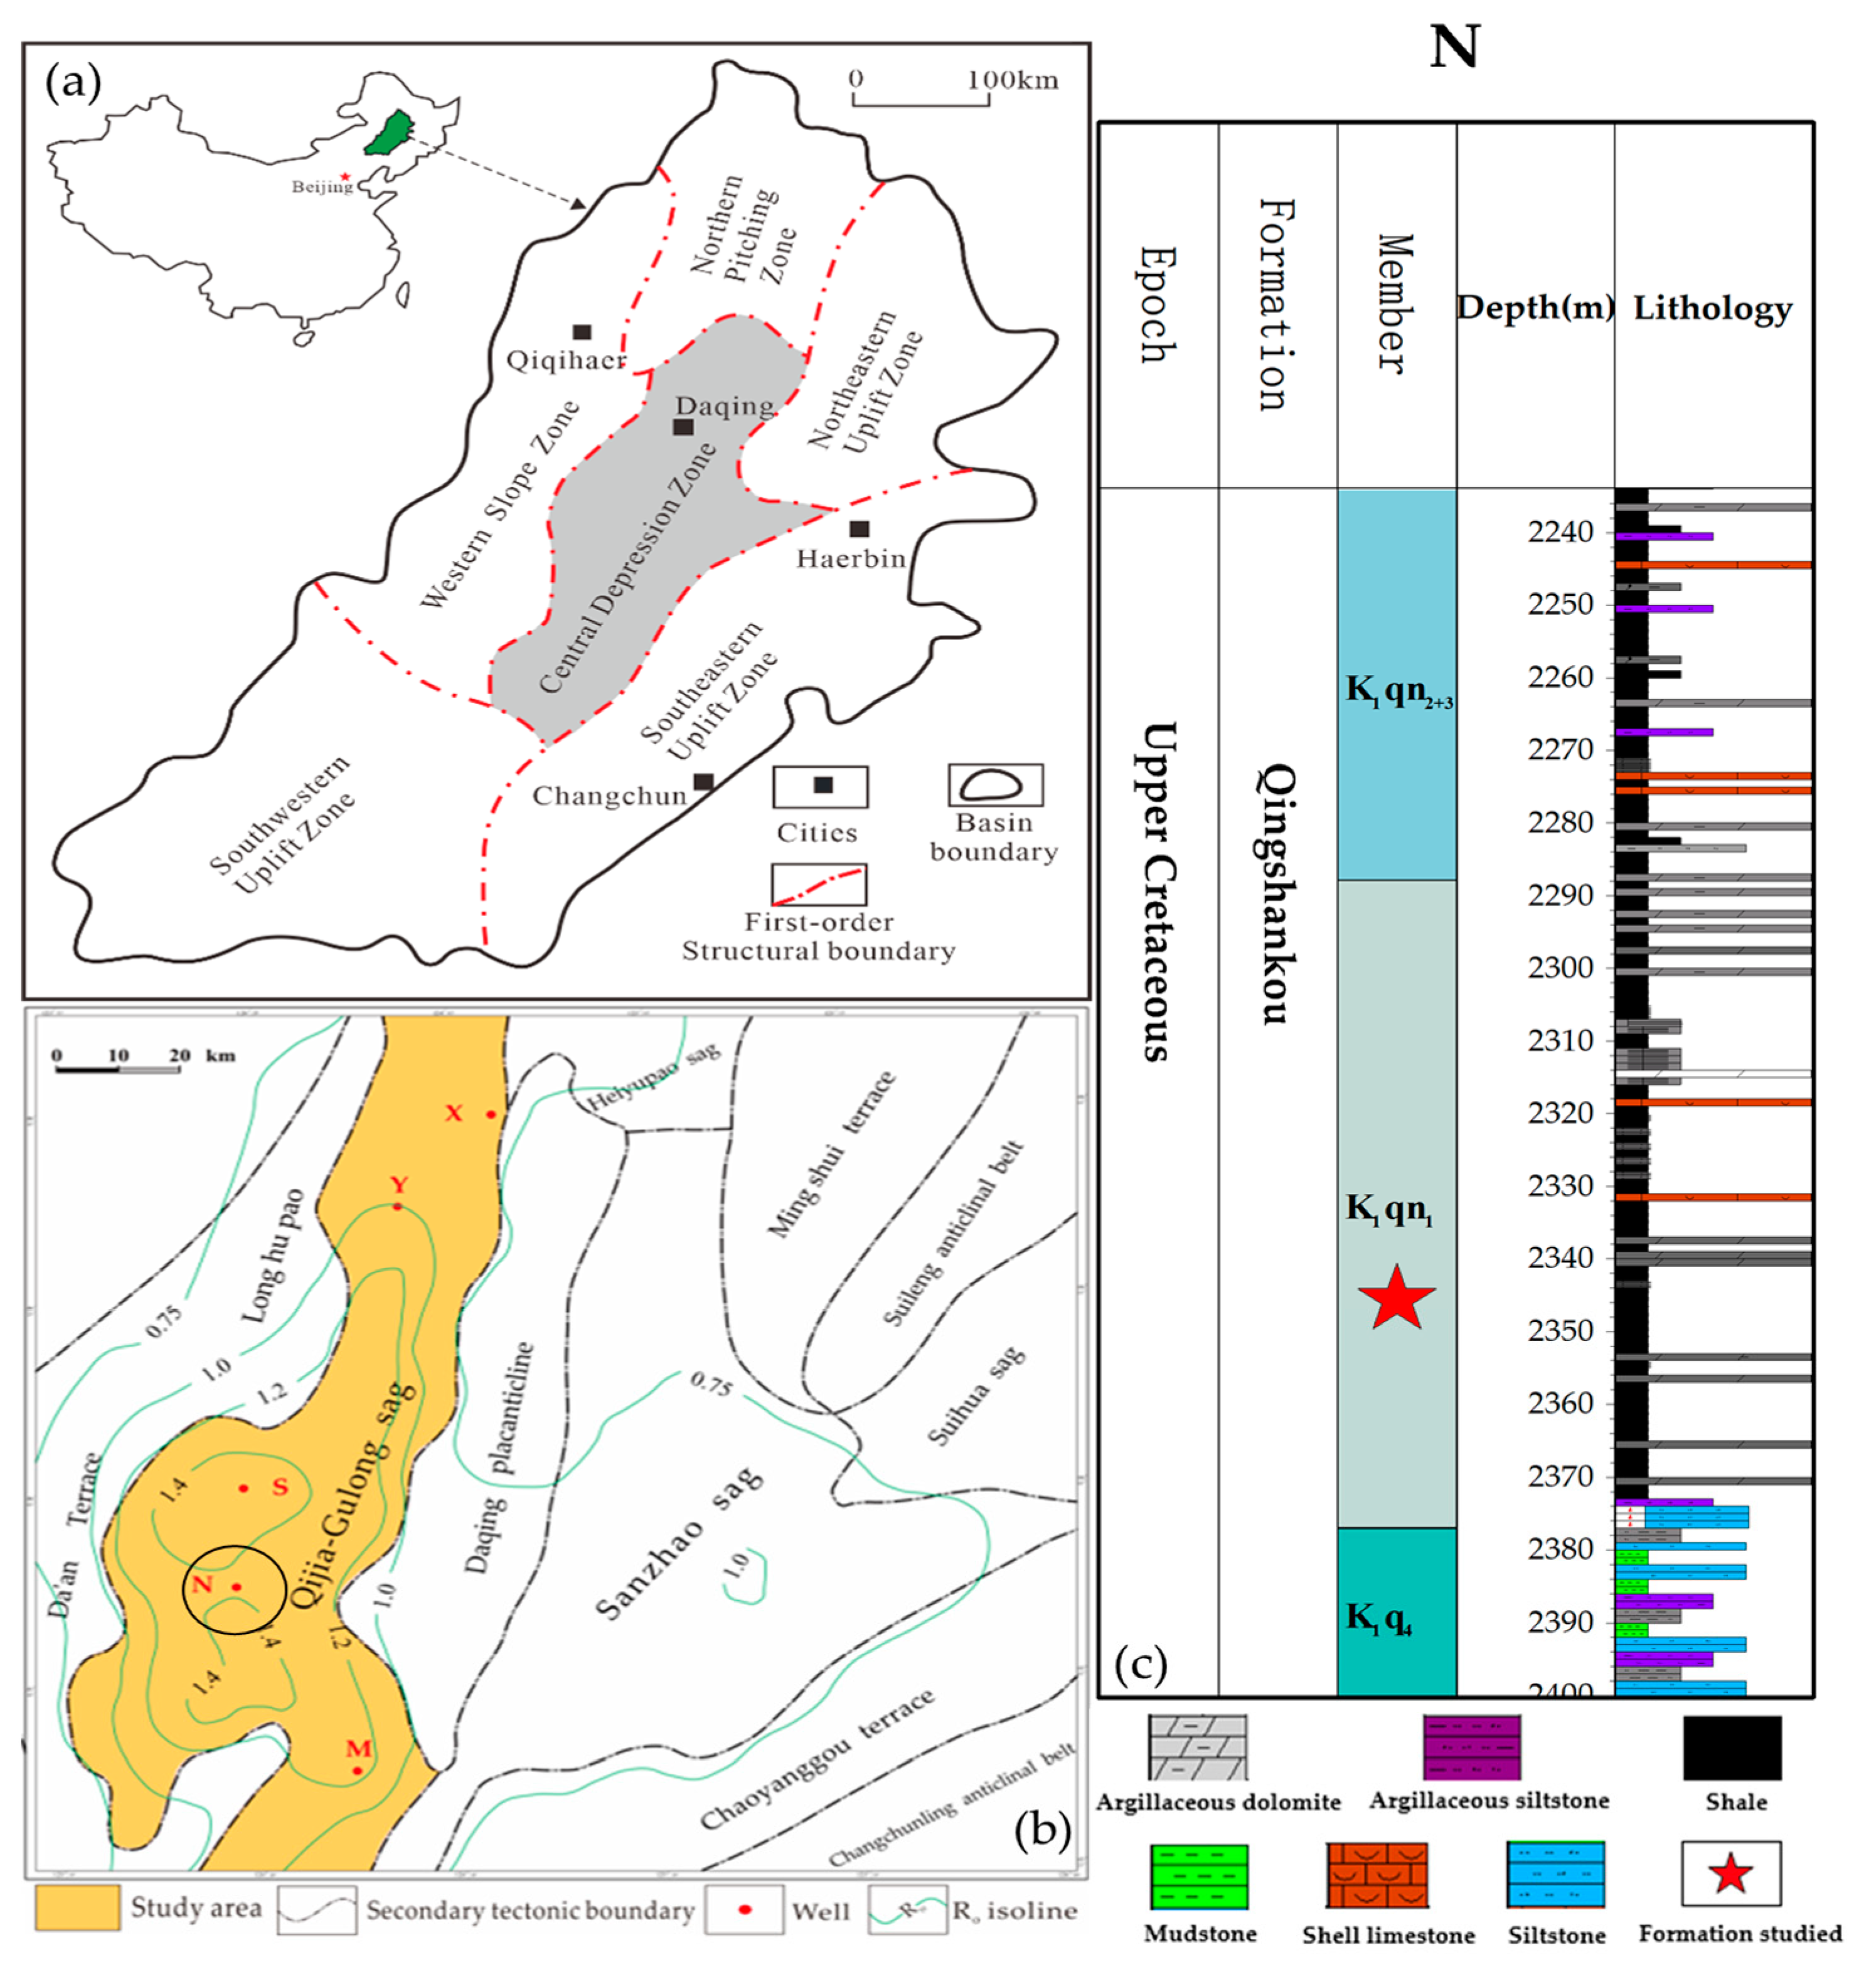
2. Geological Setting

The Songliao Basin is in Northeast China and covers an area of 26 × 104 km2. The formation and evolution of this basin have experienced complex tectonic changes, with pre-Paleozoic and Paleozoic metamorphic rocks and igneous rocks as its basement, Cretaceous strata as its main oil-bearing strata and strata with varying degrees of development from the Cretaceous to the Cenozoic as the cap rock [38], making it a large continental sedimentary basin. It can be divided into six first-order structural units, namely, the western slope area, the northern plunge area, the northeast uplift area, the southeast uplift area, the southwest uplift area and the central depression area (Figure 1a).
The research area is in the Qijia–Gulong Depression within the central depression, which is the main hydrocarbon-generating depression in the basin (Figure 1b). The Late Cretaceous Qingshankou Formation was deposited during a large-scale and stable lake flooding period, with a warm and humid climate, abundant algae and accelerated sedimentation rate, resulting in a semideep to deep lake reducing environment [39], which provided good conditions for the formation of high-quality shale. The Qingshankou Formation is subdivided into three members: Q1 to Q3. The lake basin area was the largest during the sedimentary period of the first member of the Qingshankou Formation [40], resulting in mainly black shale and dark gray mudstone, with thinly layered shell limestone, siltstone, argillaceous siltstone and argillaceous dolomite. The accumulated thickness of muddy shale accounts for 80%~85% of the total thickness of Q1, which has excellent hydrocarbon generation potential (Figure 1c).

3. Samples and Methods

3.1. Samples

In this paper, the laminated shale of Q1 in the Gulong Sag, Songliao Basin, is studied. Nine organic-rich shale samples with different TOCs and maturity levels from 2175.14 to 2518.6 m were selected from five wells in the northern, central and southern portions of the depression for study.

3.2. Methods

Whole-rock analysis, TOC analysis, Rock-Eval analysis, low-temperature nitrogen physisorption and field-emission (FE)-SEM analysis were carried out on nine samples selected from the study area.
The whole rock was analyzed using a D8AA25 X-ray diffractometer (Bruker, Billerica, MA, USA), (Cu Kα radiation, λ = 0.15418 nm, 40 kV, 100 mA). First, the sample was manually ground with a pestle to 80~100 mesh and then pressed to keep the surface flat and uniform so that no particles were obviously visible. At 20 °C and 70% relative humidity, the scan was performed in a range of 5 to 45° 2θ, with steps of 0.02° and 2 s. The width of the receiving slit was 0.3 mm. Finally, the sample powder was put into the instrument for detection, and the monochrome Cu Kα X-ray radiation and mineral weight percentage were analyzed three times. Then, the XRD spectrum was obtained. The relevant data of the spectrum were read and compared with the standard XRD data of minerals to determine the mineral types, and the area under the main intensity peak curve of each mineral was used to calculate the relative mineral percentage semiquantitatively.
For SEM, an SEM4000 scanning electron microscope from Zeiss was used for observation and imaging (Jena, Germany). First, the selected was cut to reveal a fresh flat surface, and physical polishing was carried out. Then, the sample chip was cleaned, fixed and dried. The sample chip (1 cm× 1 cm× 2 mm) was polished by Ar-ion and plated with a 10 nm thick gold film. Finally, a secondary electron image was generated at an acceleration voltage of 8–10 kV.
The TOC content was measured using a CS-230 carbon and sulfur analyzer (LECO Corporation, St. Joseph, MI, USA). First, the samples were crushed to a particle size of less than 0.2 mm with a mass of no less than 10 g. The samples were treated with 5% HCl at 80 °C to remove carbonate and then washed with deionized water to remove residual HCl. Second, the treated powder was mixed with iron powder and tungsten–tin alloy as additives, with O2 as the combustion gas and N2 as the carrier gas. The combustion temperature was raised to 3000 °C. Finally, the TOC content was obtained by analyzing the amount of CO2 released from organic matter combustion.
Pyrolysis of rocks is a method for quantifying hydrocarbon content in rocks. First, the surface of the sample was cleaned and crushed to 100 mesh; then, the sample was put into the cracking furnace. During the pyrolysis stage (N2 environment), the initial isothermal temperature was 300 °C for 3 min, and the free hydrocarbon (S1) in the sample was released. The temperature was raised 25 °C/min to 650 °C, the pyrolysis products in kerogen (S2) were released by pyrolysis, and the maximum temperature of hydrocarbon generation (Tmax) was measured.
A Micromeritics ASAP 2020 Plus surface area analyzer (Micromeritics Instrument Corporation, Norcross, GA, USA) was used to plot the isotherm by measuring the amount of nitrogen absorbed by the sample at p/po under a series of nitrogen partial pressures. The specific surface area value, pore volume and pore size distribution characteristics can be calculated and explained by a variety of theoretical models, but not all methods are suitable for the calculation of a certain value, and each method has the most suitable theoretical calculation model due to the limitation of its formula. For example, the pore size distribution can be characterized by using both the Barrett–Joyner–Halenda (BJH) and density functional theory (DFT) models, but the BJH model is mainly suitable for the characterization of mesopores, while the DFT model can not only be applied to the characterization of mesopores but can also characterize some micropores more clearly [41,42]. Therefore, according to previous studies, the Brunauer–Emmett–Teller (BET) model is more suitable for calculating the specific surface area value [43], the BJH method is more accurate for calculating the average pore diameter and pore volume and DFT is more advantageous for predicting the pore size distribution [44].
The extraction process uses a mixture of dichloromethane and methanol as solvents to extract hydrocarbons from samples using Soxhlet extraction. First, the sample was pulverized to 60 mesh. Soxhlet extraction was performed for 72 h with a mixture of 25:2 dichloromethane and methanol in a Soxhlet plant for 48 h at 70 °C. After extraction, the sample was vacuum-dried at 80 °C for 12 h to remove moisture; then, the sample was retrieved and measured to quantify the flowing oil in the shale sample. After the extraction experiment, the shale sample particles with residual oil were recovered and dried at 105 °C. Subsequently, TOC, pyrolysis and nitrogen adsorption–desorption experiments were carried out on the extracted samples again, and the experimental process was consistent with the above, so it is not repeated here.

4. Results

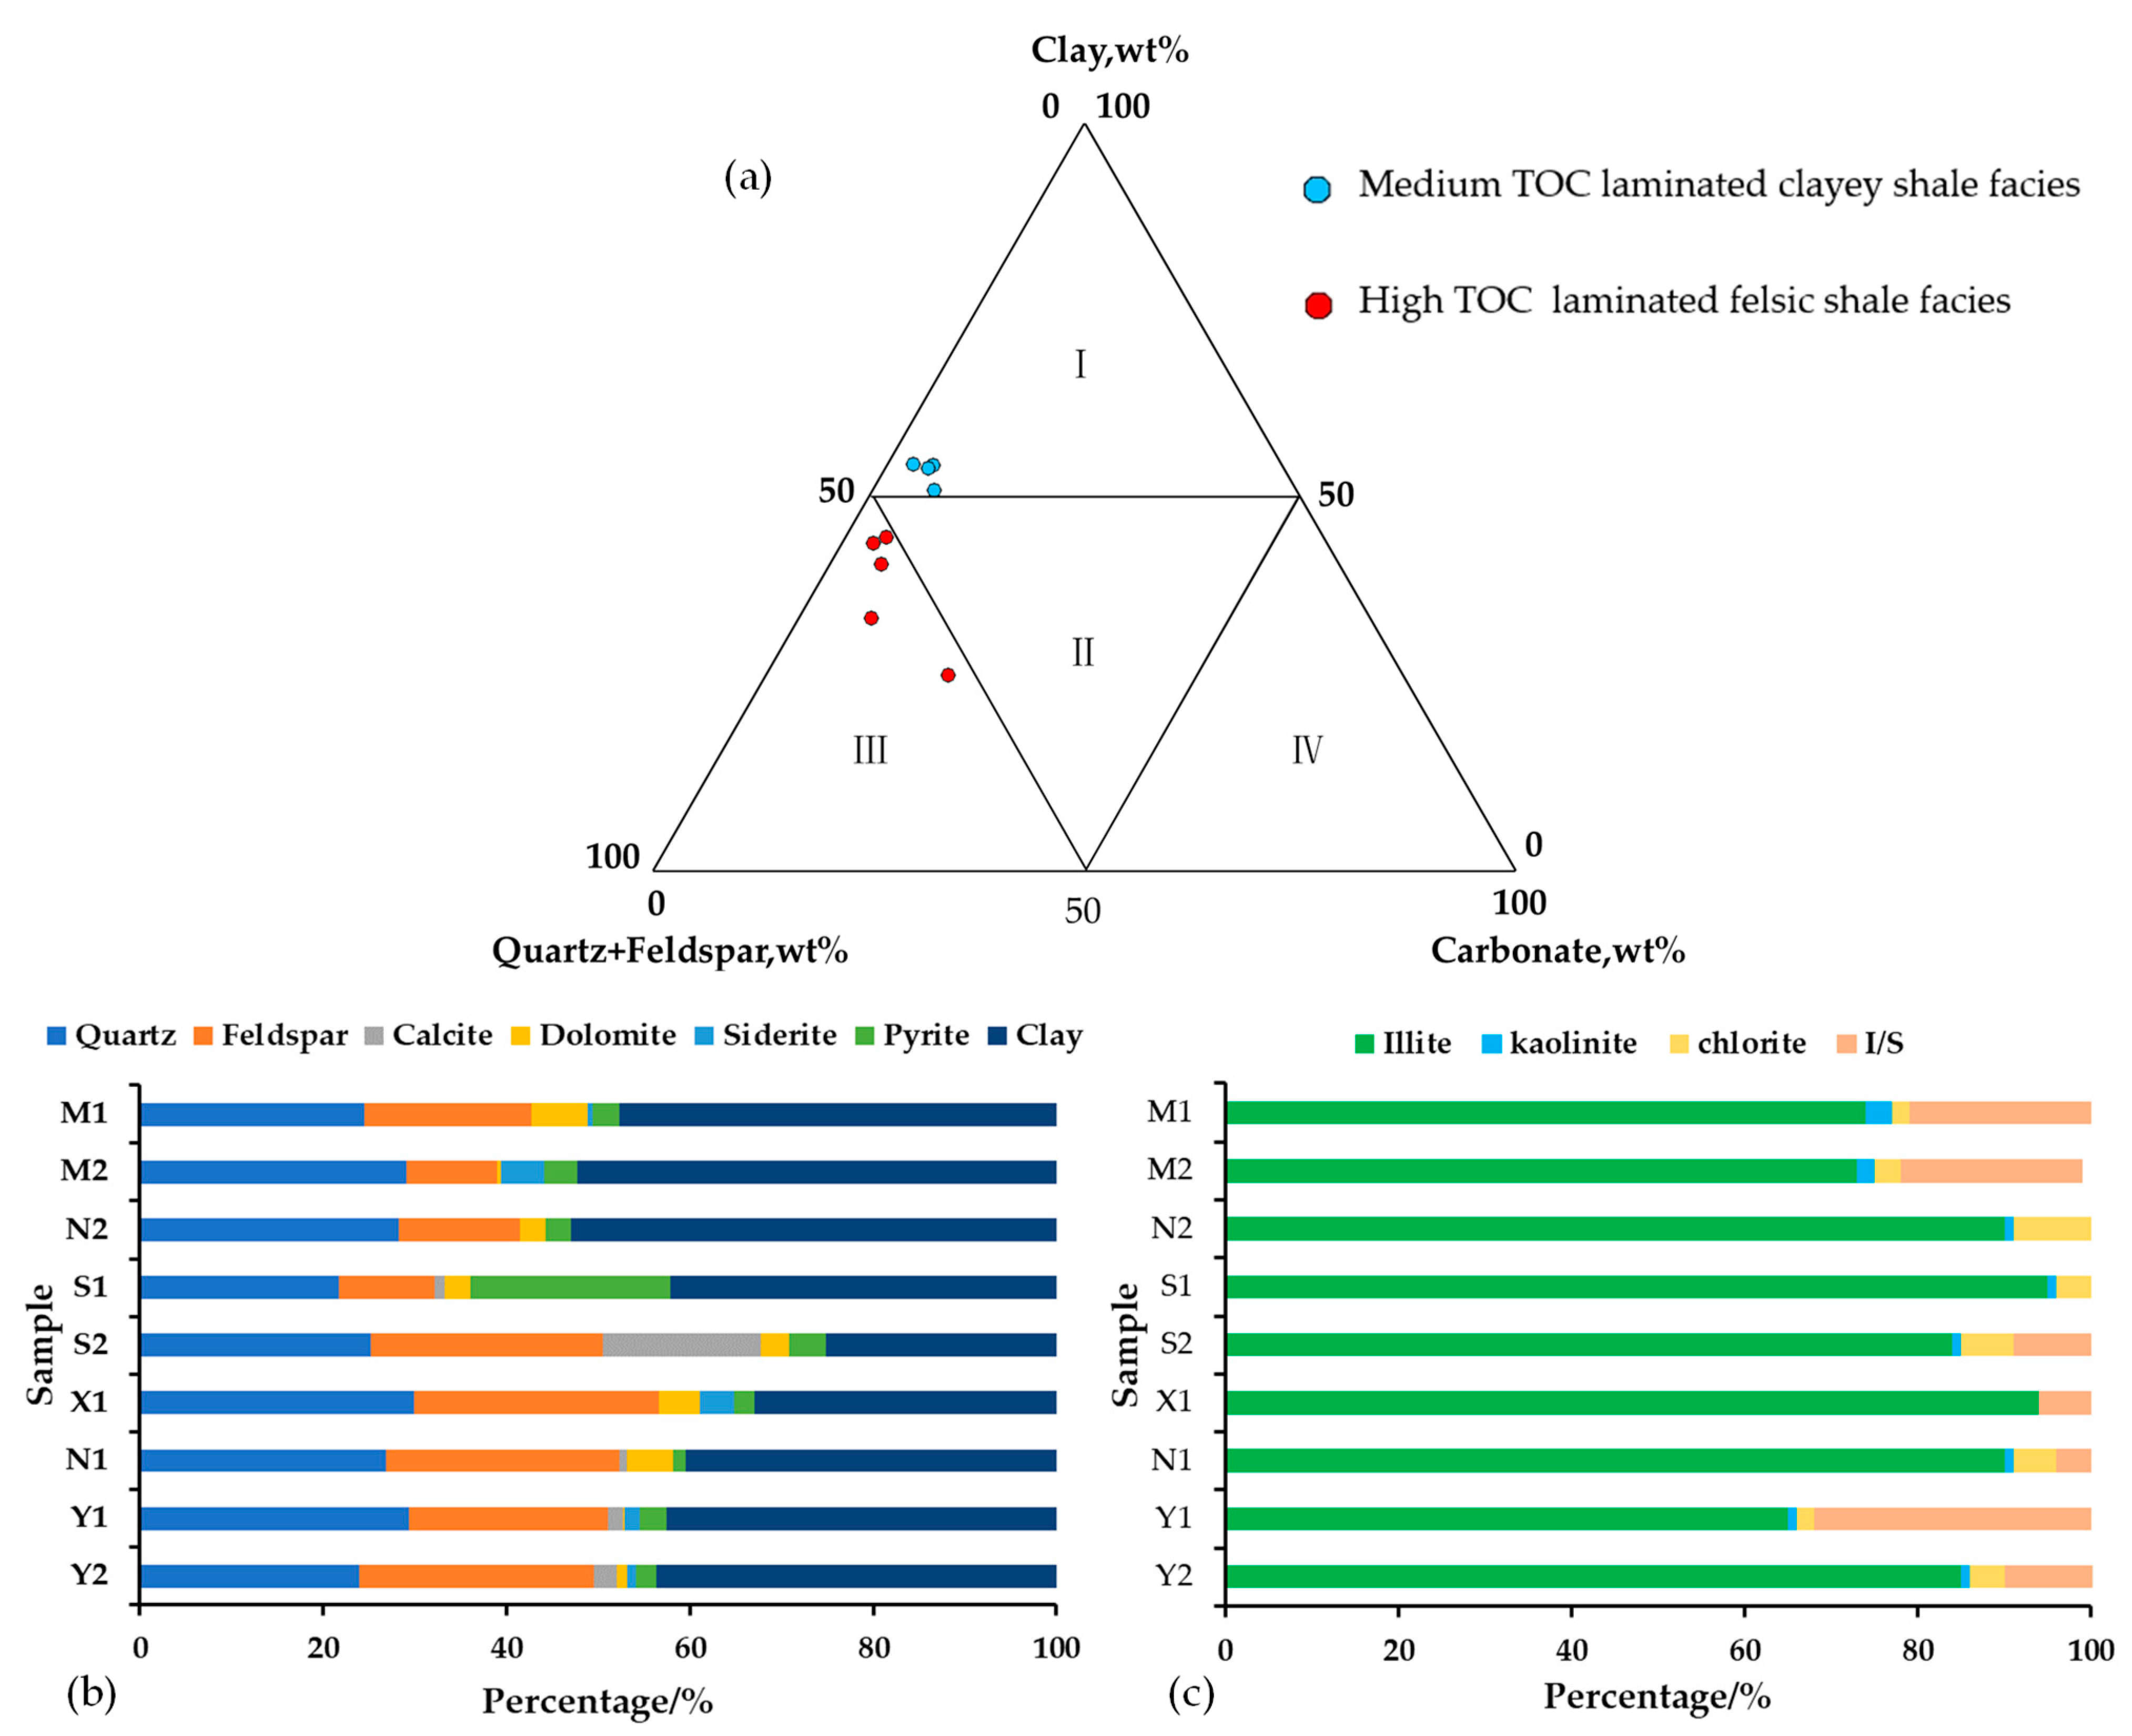
4.1. Shale Mineral Composition Characteristics

The main minerals in the laminated shale in Q1 of the Gulong Depression include quartz, feldspar, carbonates and clay minerals. With reference to the lithofacies classification scheme proposed by Shi in 2019 for shale in Es3l-Es4u in the Jiyang Depression [45], the Q1 laminated shale in the Gulong Sag mainly contains two lithofacies: laminated clayey shale facies with moderate TOC contents and laminated felsic shale facies with high TOC contents (Figure 2a).
Clay minerals account for the highest proportion, ranging from 25.1% to 53%, with an average of 42.2%. The quartz contents are 21.7%~29.9%, with an average of 26.5%. The feldspar contents are 9.9%~26.7%, the average is 19.6%, the composition is potassium feldspar and plagioclase and plagioclase is the main feldspar. The carbonate is composed of calcite, dolomite and siderite, with contents of 2.8%~20.3% and an average of 6.8% (Figure 2b, Table 1). In this rock, pyrite is generally developed, and its contents range from 1.4% to 21.8%, with an average of 4.9% (Figure 2b, Table 1).
The clay minerals include illite, kaolinite, chlorite and illite/smectite (I/S) (Figure 2c). The highest proportion is illite, with contents of 65%~95% and an average of 83.3%. It is followed by I/S, with contents of 0%~32%, and an average of 11.6%. The average contents of chlorite and kaolinite are low, at 3.9% and 1.1%, respectively.

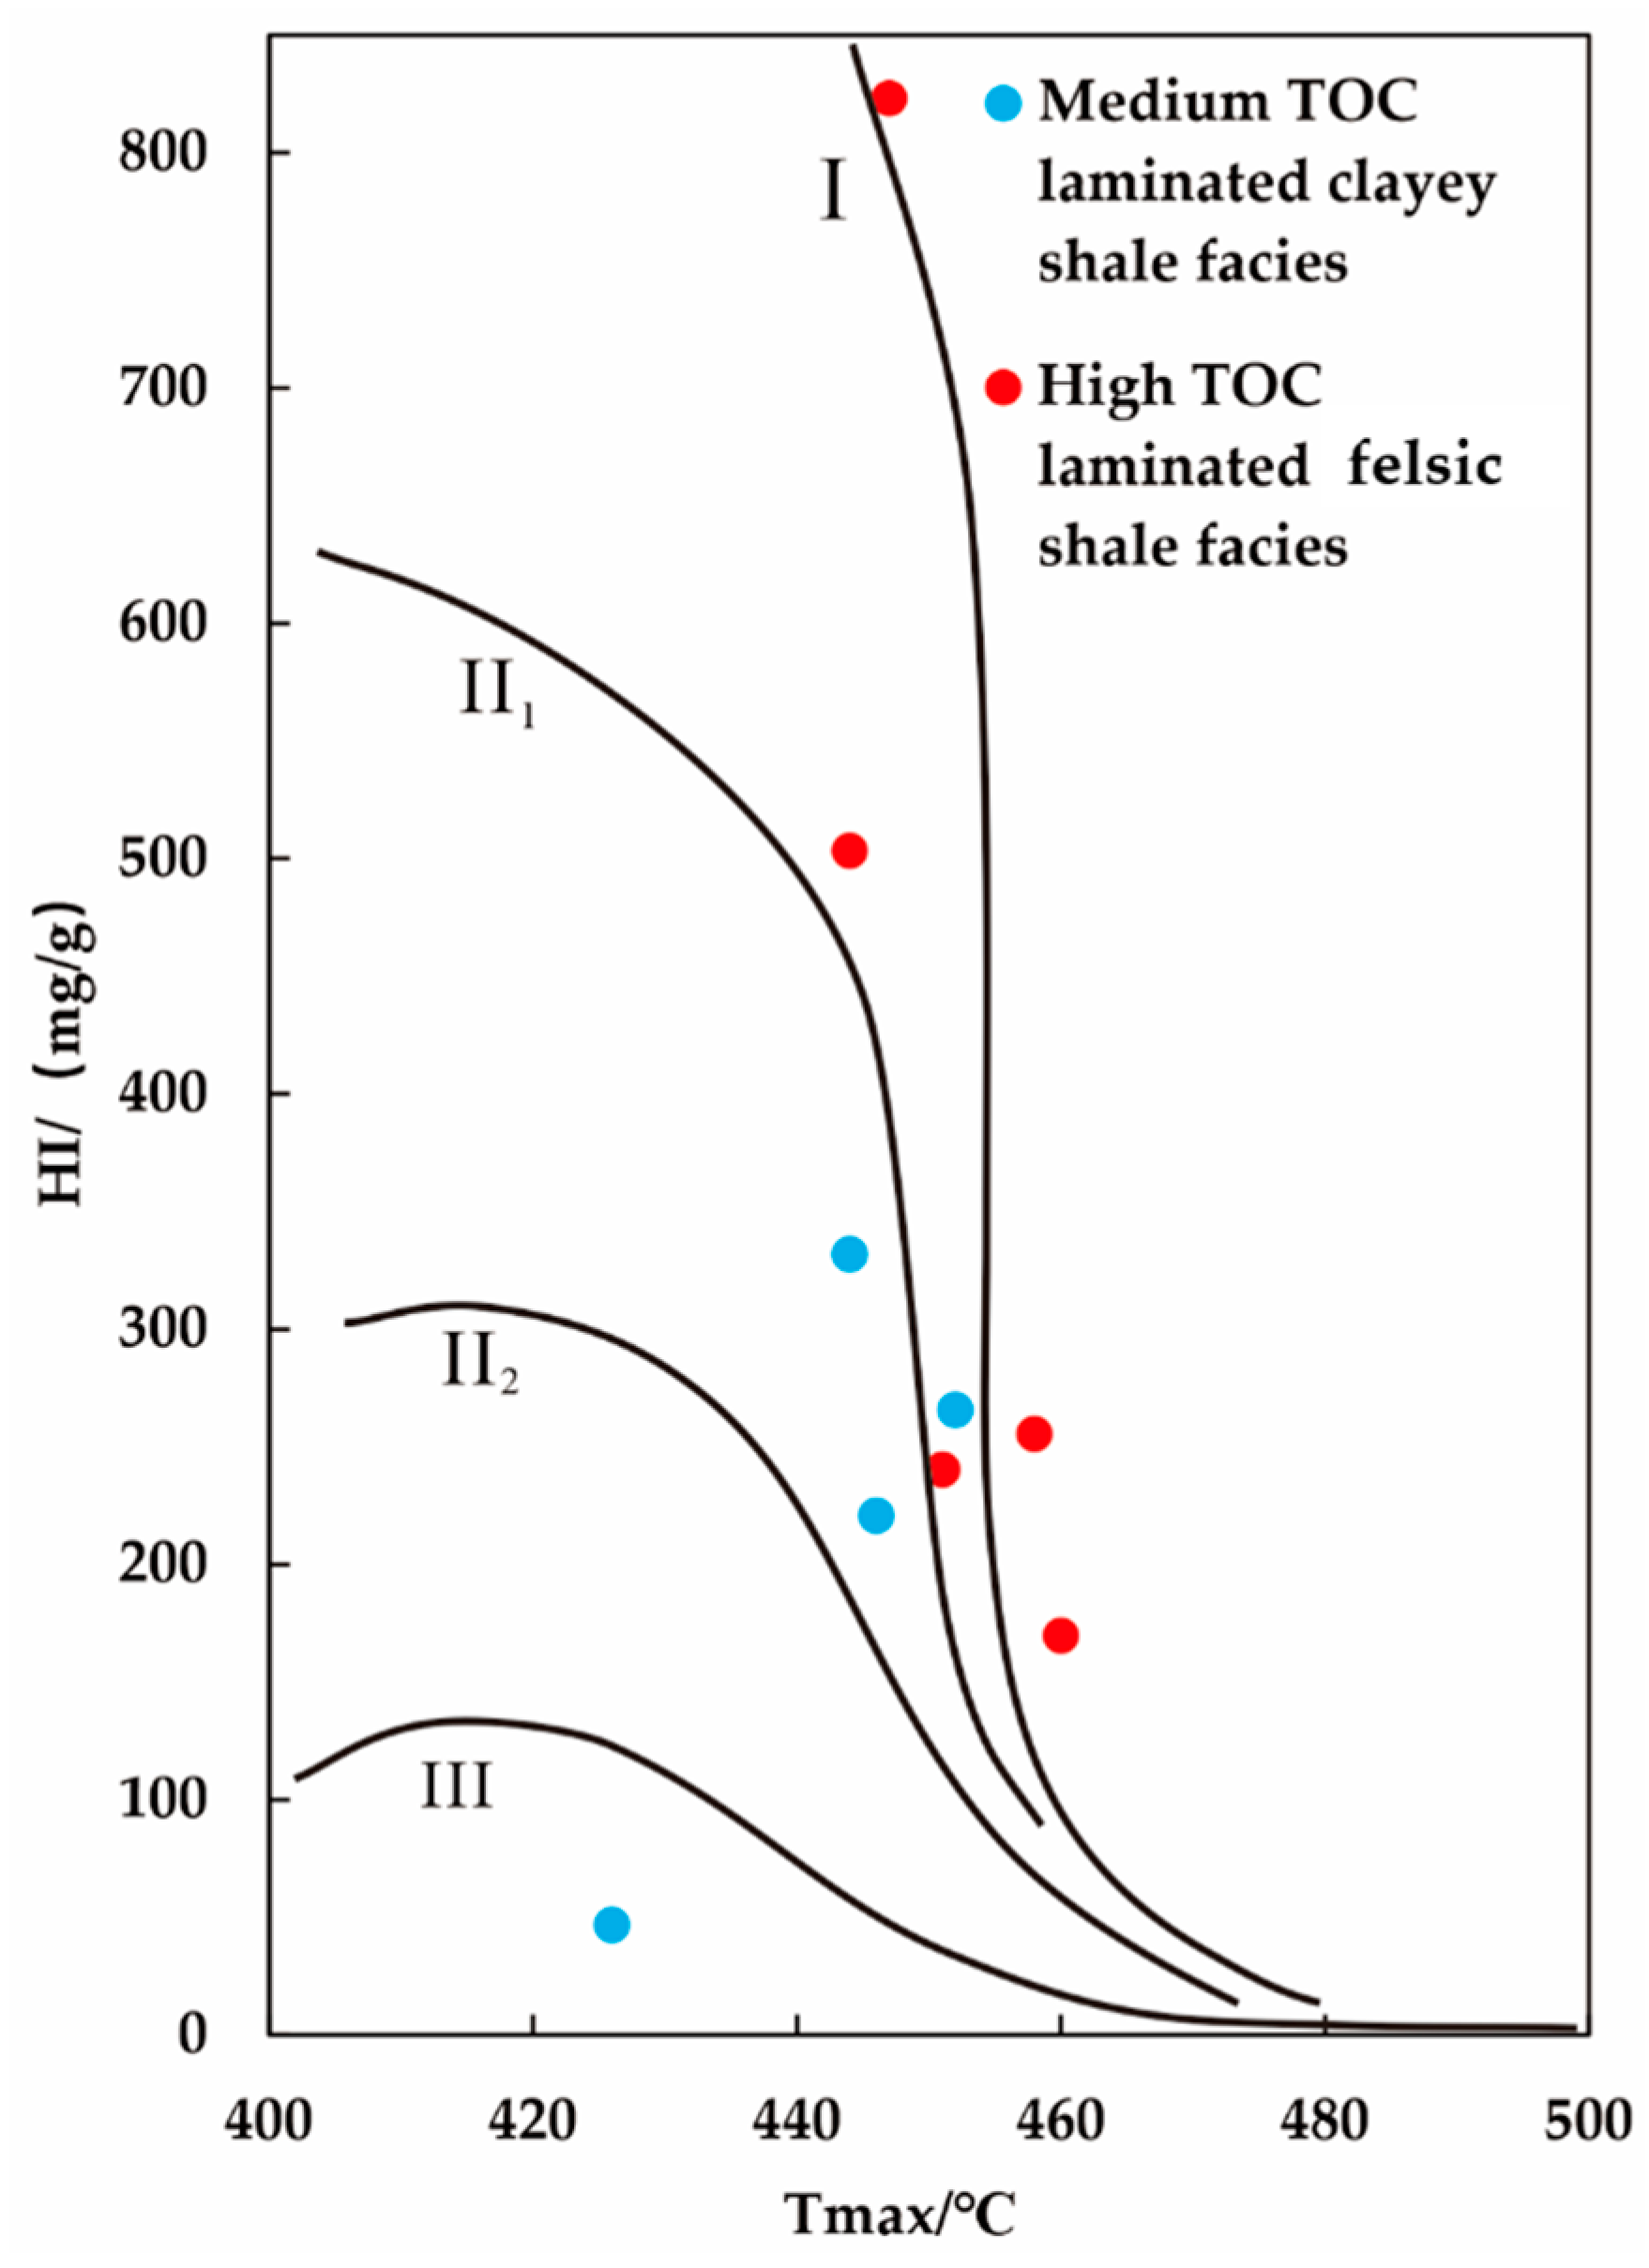
4.2. Organic Geochemical Characteristics of Shale

For the pre-extracted shale samples, the TOC contents are 1.26%~2.52%, with an average of 1.98%. The contents of residual hydrocarbon, S1, are 1.18~3.26 mg/g, with an average of 2.29 mg/g. The contents of pyrolyzed hydrocarbon S2 are 0.59~18.44 mg/g, with an average of 6.57 mg/g. The hydrogen index (HI) contents are 47~823 mg/g, and the average is 403.3 mg/g. For the extracted shale samples, the TOC contents are 1.02%~2.09%, with an average value of 1.58%, which is 20.2% lower than that of the pre-extracted shale samples. The contents of S1 are 0.01~0.11 mg/g, with an average of 0.05 mg/g, indicating that the majority of the soluble organic matter had been extracted. The contents of S2 range from 0.18 to 15.35 mg/g, with an average of 3.1 mg/g, indicating that soluble organic matter is also an important part of S2. The HI values range from 18 to 771 mg/g, with an average of 175.39 mg/g (Table 2).
The difference in the Tmax value before and after extraction is significant, which is mainly related to the high content of soluble organic matter in shale. A graph showing the relationship between Tmax after extraction and HI before extraction is shown in Figure 3 [46], revealing that the organic matter types of Q1 shale are mainly type II1 and type I, which is consistent with the results of previous studies [47].
The shale Ro values of Q1 in the Gulong Sag range from 0.87% to 1.51%, with an average of 1.24%, indicating the mature to highly mature evolutionary stage. After extraction, the Tmax values range from 426 °C to 460 °C, with an average of 447.56 °C, indicating the mature evolutionary stage, which is less mature than that indicated by Ro. The main reason for this trend is that the pyrolyzed hydrocarbon, S2, after extraction is low, resulting in a distortion of the Tmax value [48].

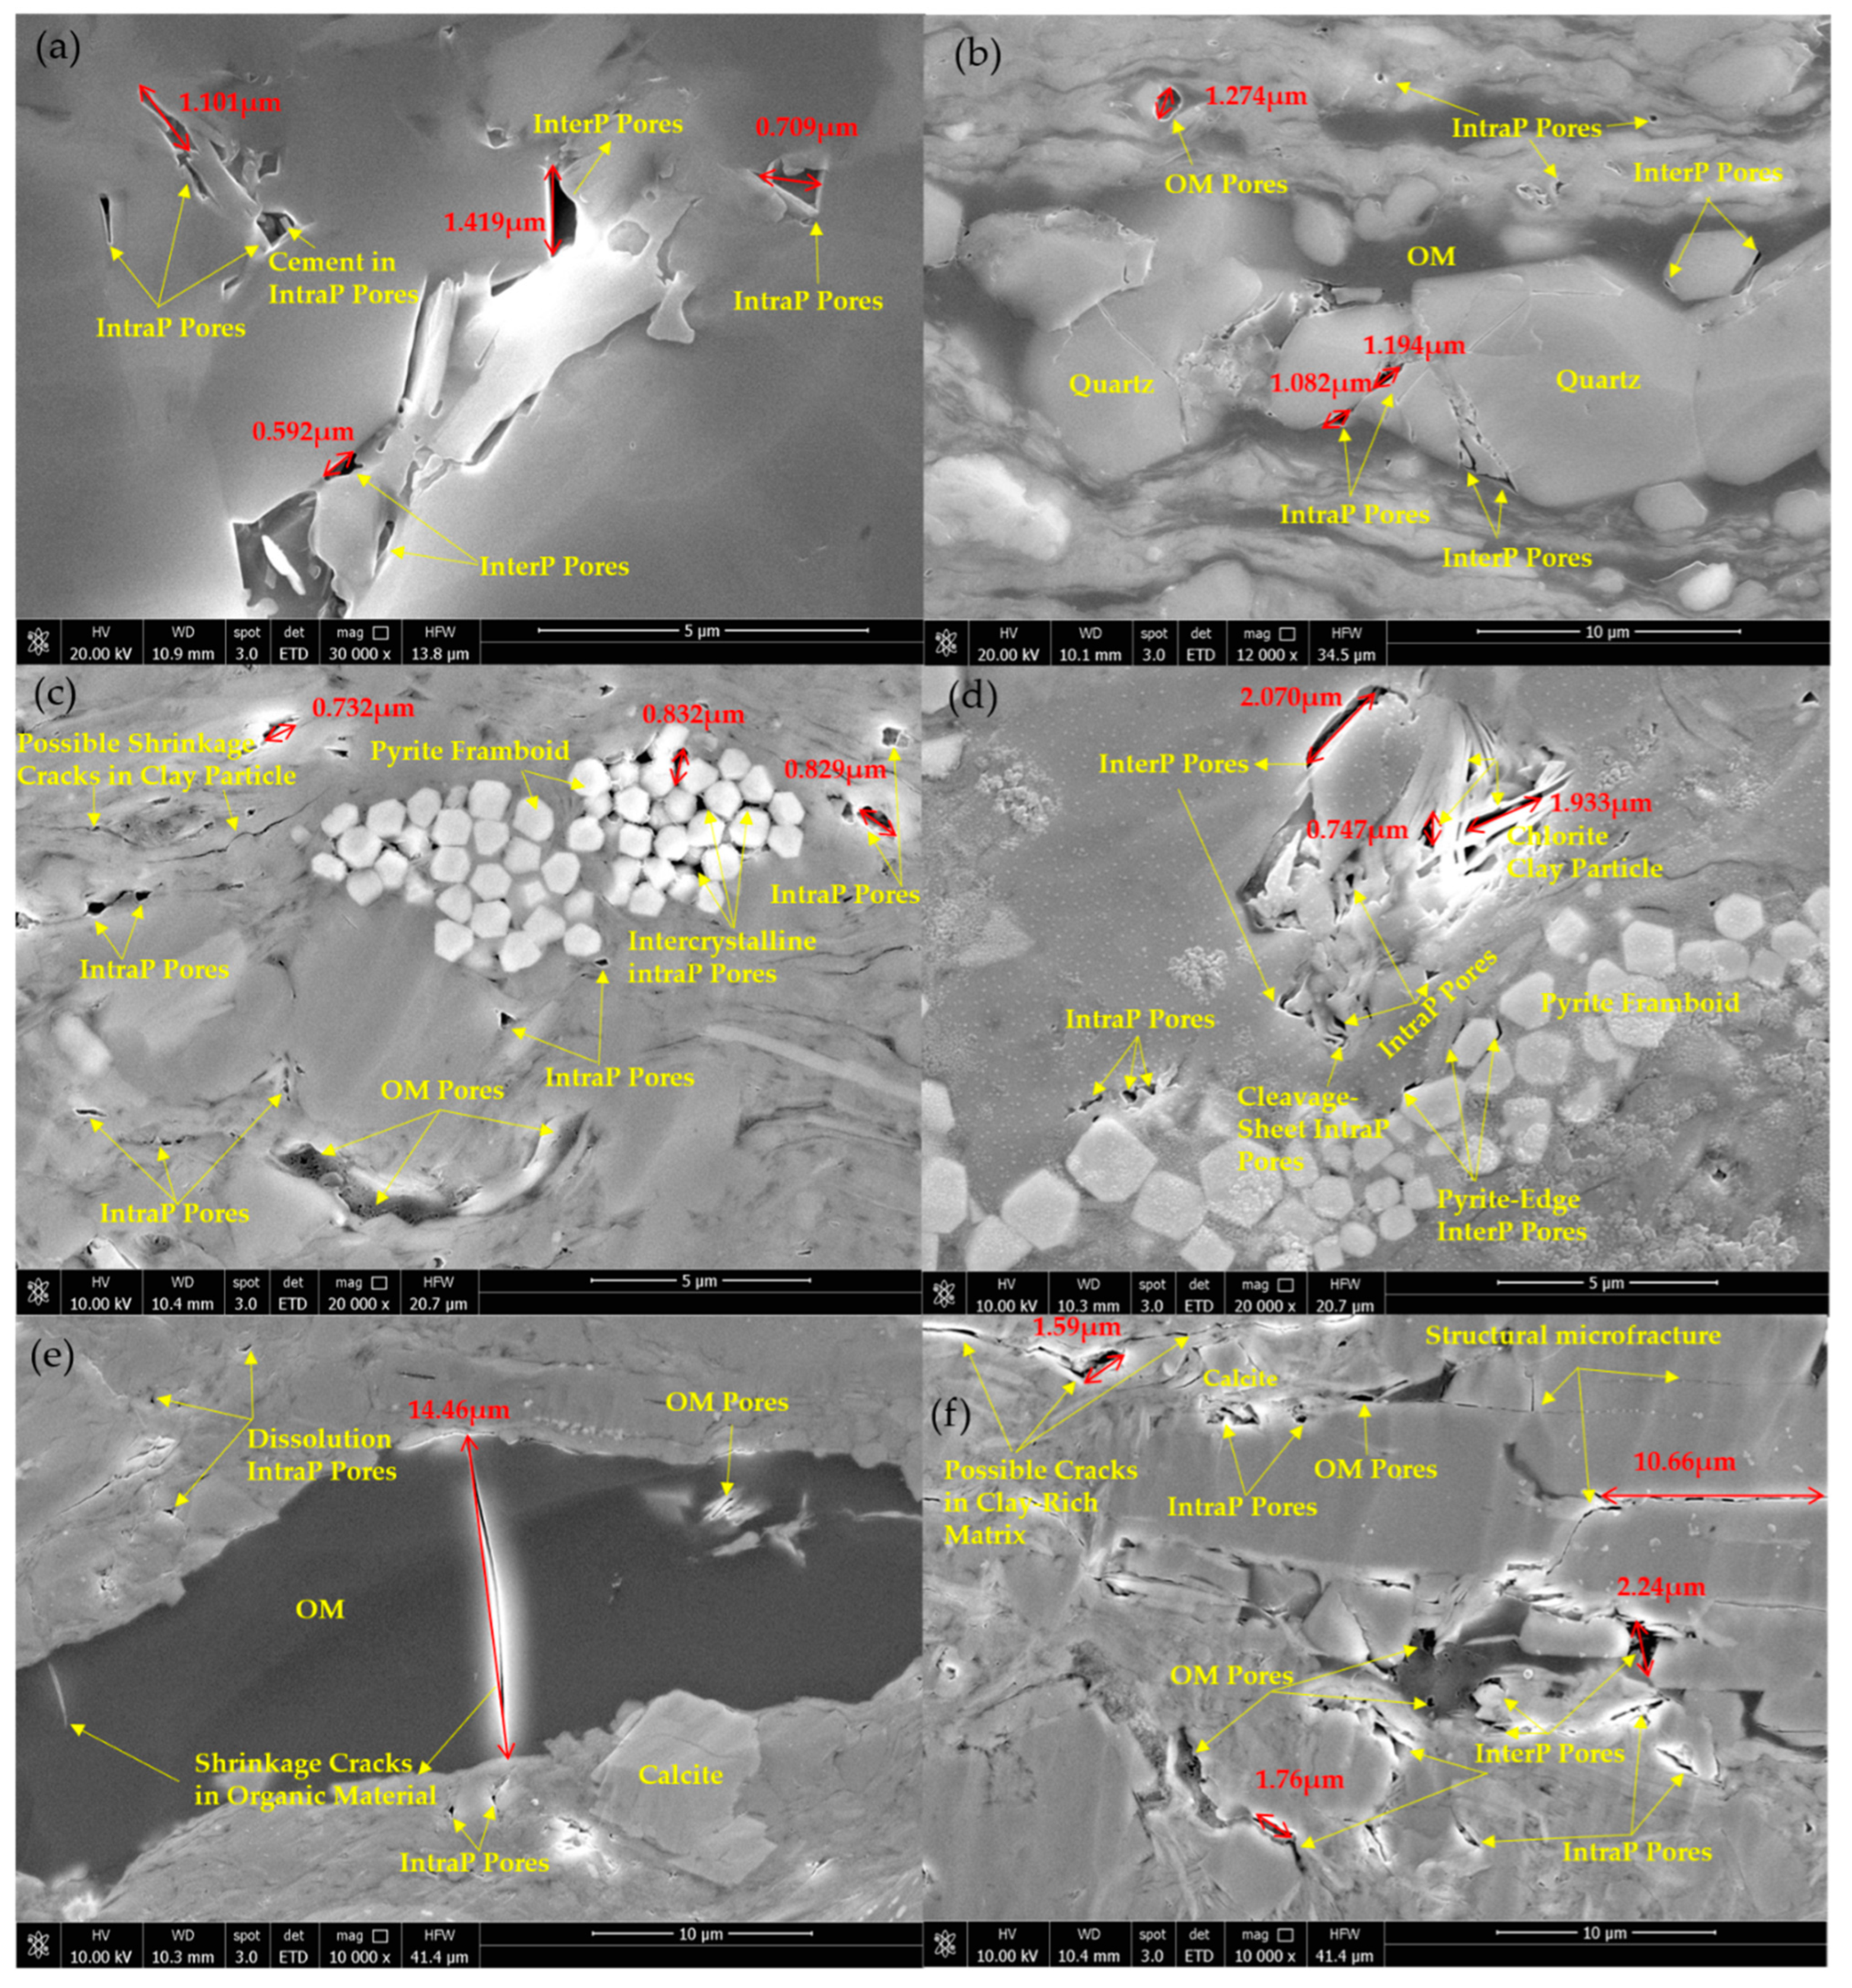
4.3. Shale Pore Types and Genesis

Based on the shale pore classification scheme proposed by Loucks et al. 2012 [49], the pore types of laminated shale samples in Q1 in the Gulong Sag, Songliao Basin, can be mainly divided into interparticle pores, intraparticle pores, organic matter pores and microfractures (Figure 4).

4.3.1. Interparticle Pores

Interparticle pores often develop between rigid minerals, such as quartz, calcite, potassium feldspar and plagioclase. In the process of burial, due to the increasing pressure of the overlying strata, triangles or long strips are mostly formed by extrusion (Figure 4a,d), which preserves them, and sometimes they may be cemented and blocked by calcite, pyrite and other minerals, thereby becoming irregular. In addition, the pores are generally large; most of them have pore sizes >1 μm, but they are basically isolated and have poor connectivity. Alternatively, organic matter enters the oil generation window and begins to generate hydrocarbon and contract with increasing maturity, allowing interparticle pores to form between rigid minerals and organic matter [50], and such interparticle pores tend to be irregular in shape (Figure 4b). These pores can also be formed at the contact between clay minerals and rigid minerals (Figure 4f), and the pore diameters of interparticle pores formed by the latter two causes are generally smaller.

4.3.2. Intraparticle Pores

The intraparticle pores in the studied rock are mainly dissolution pores, clay mineral interlayer pores and intercrystalline pores within pyrite framboids. The dissolution pores are generally small, with sizes ranging from 100 to 300 nm, and the shapes are mostly circular; the dissolution pores are scattered and poorly connected (Figure 4e). The intraparticle pores of clay minerals are caused by the directional arrangement of clay minerals. The intraparticle pores of chlorite can reach 1.93 μm, which is a kind of pore with a large pore size among intraparticle pores. The shapes are mostly slit-shaped; the long axis can reach 2 μm, and the short axis is generally approximately 200 nm (Figure 4d). The shapes of pyrite intercrystalline pores are mostly spheroidal, strawberry-shaped and clustered (Figure 4c,d). They are mostly distributed in rhomboidal areas between pyrite crystals but are often filled with organic matter, and the pore size is generally several hundred nanometers.

4.3.3. Organic Matter Pores

The organic pores, including kerogen pores and asphalt pores, are mostly round, long and irregular. The length of the long organic matter pores varies from tens to hundreds of nanometers, and the distribution is relatively concentrated (Figure 4e). Circular and irregular organic pores are also often clustered, with small pore sizes, usually tens of nanometers, and have poor connectivity (Figure 4c). In summary, the pore sizes in organic matter are generally small, usually on the order of nanometers, and pore sizes on the order of microns are rare.

4.3.4. Microfracture

The fractures mainly include clay mineral drying-related shrinkage fractures, organic matter hydrocarbon-generation-related shrinkage fractures and structural microfractures. Clay particles usually have cracks around them due to drying (Figure 4c,f). The crack shapes are mainly serrated, with lengths generally of approximately 2 μm. The hydrocarbon-generated contraction joints of organic matter are mostly distributed in long strips in the interior of organic matter (Figure 4e) or at the edges, and these crack lengths can reach 14 μm. The shape of the structural microfractures is similar to that of the above fractures, with multiple fractures developing together and fracture lengths up to 11 μm (Figure 4f).

4.4. Pore Structure Characteristics of Shale Based on the Nitrogen Adsorption Method

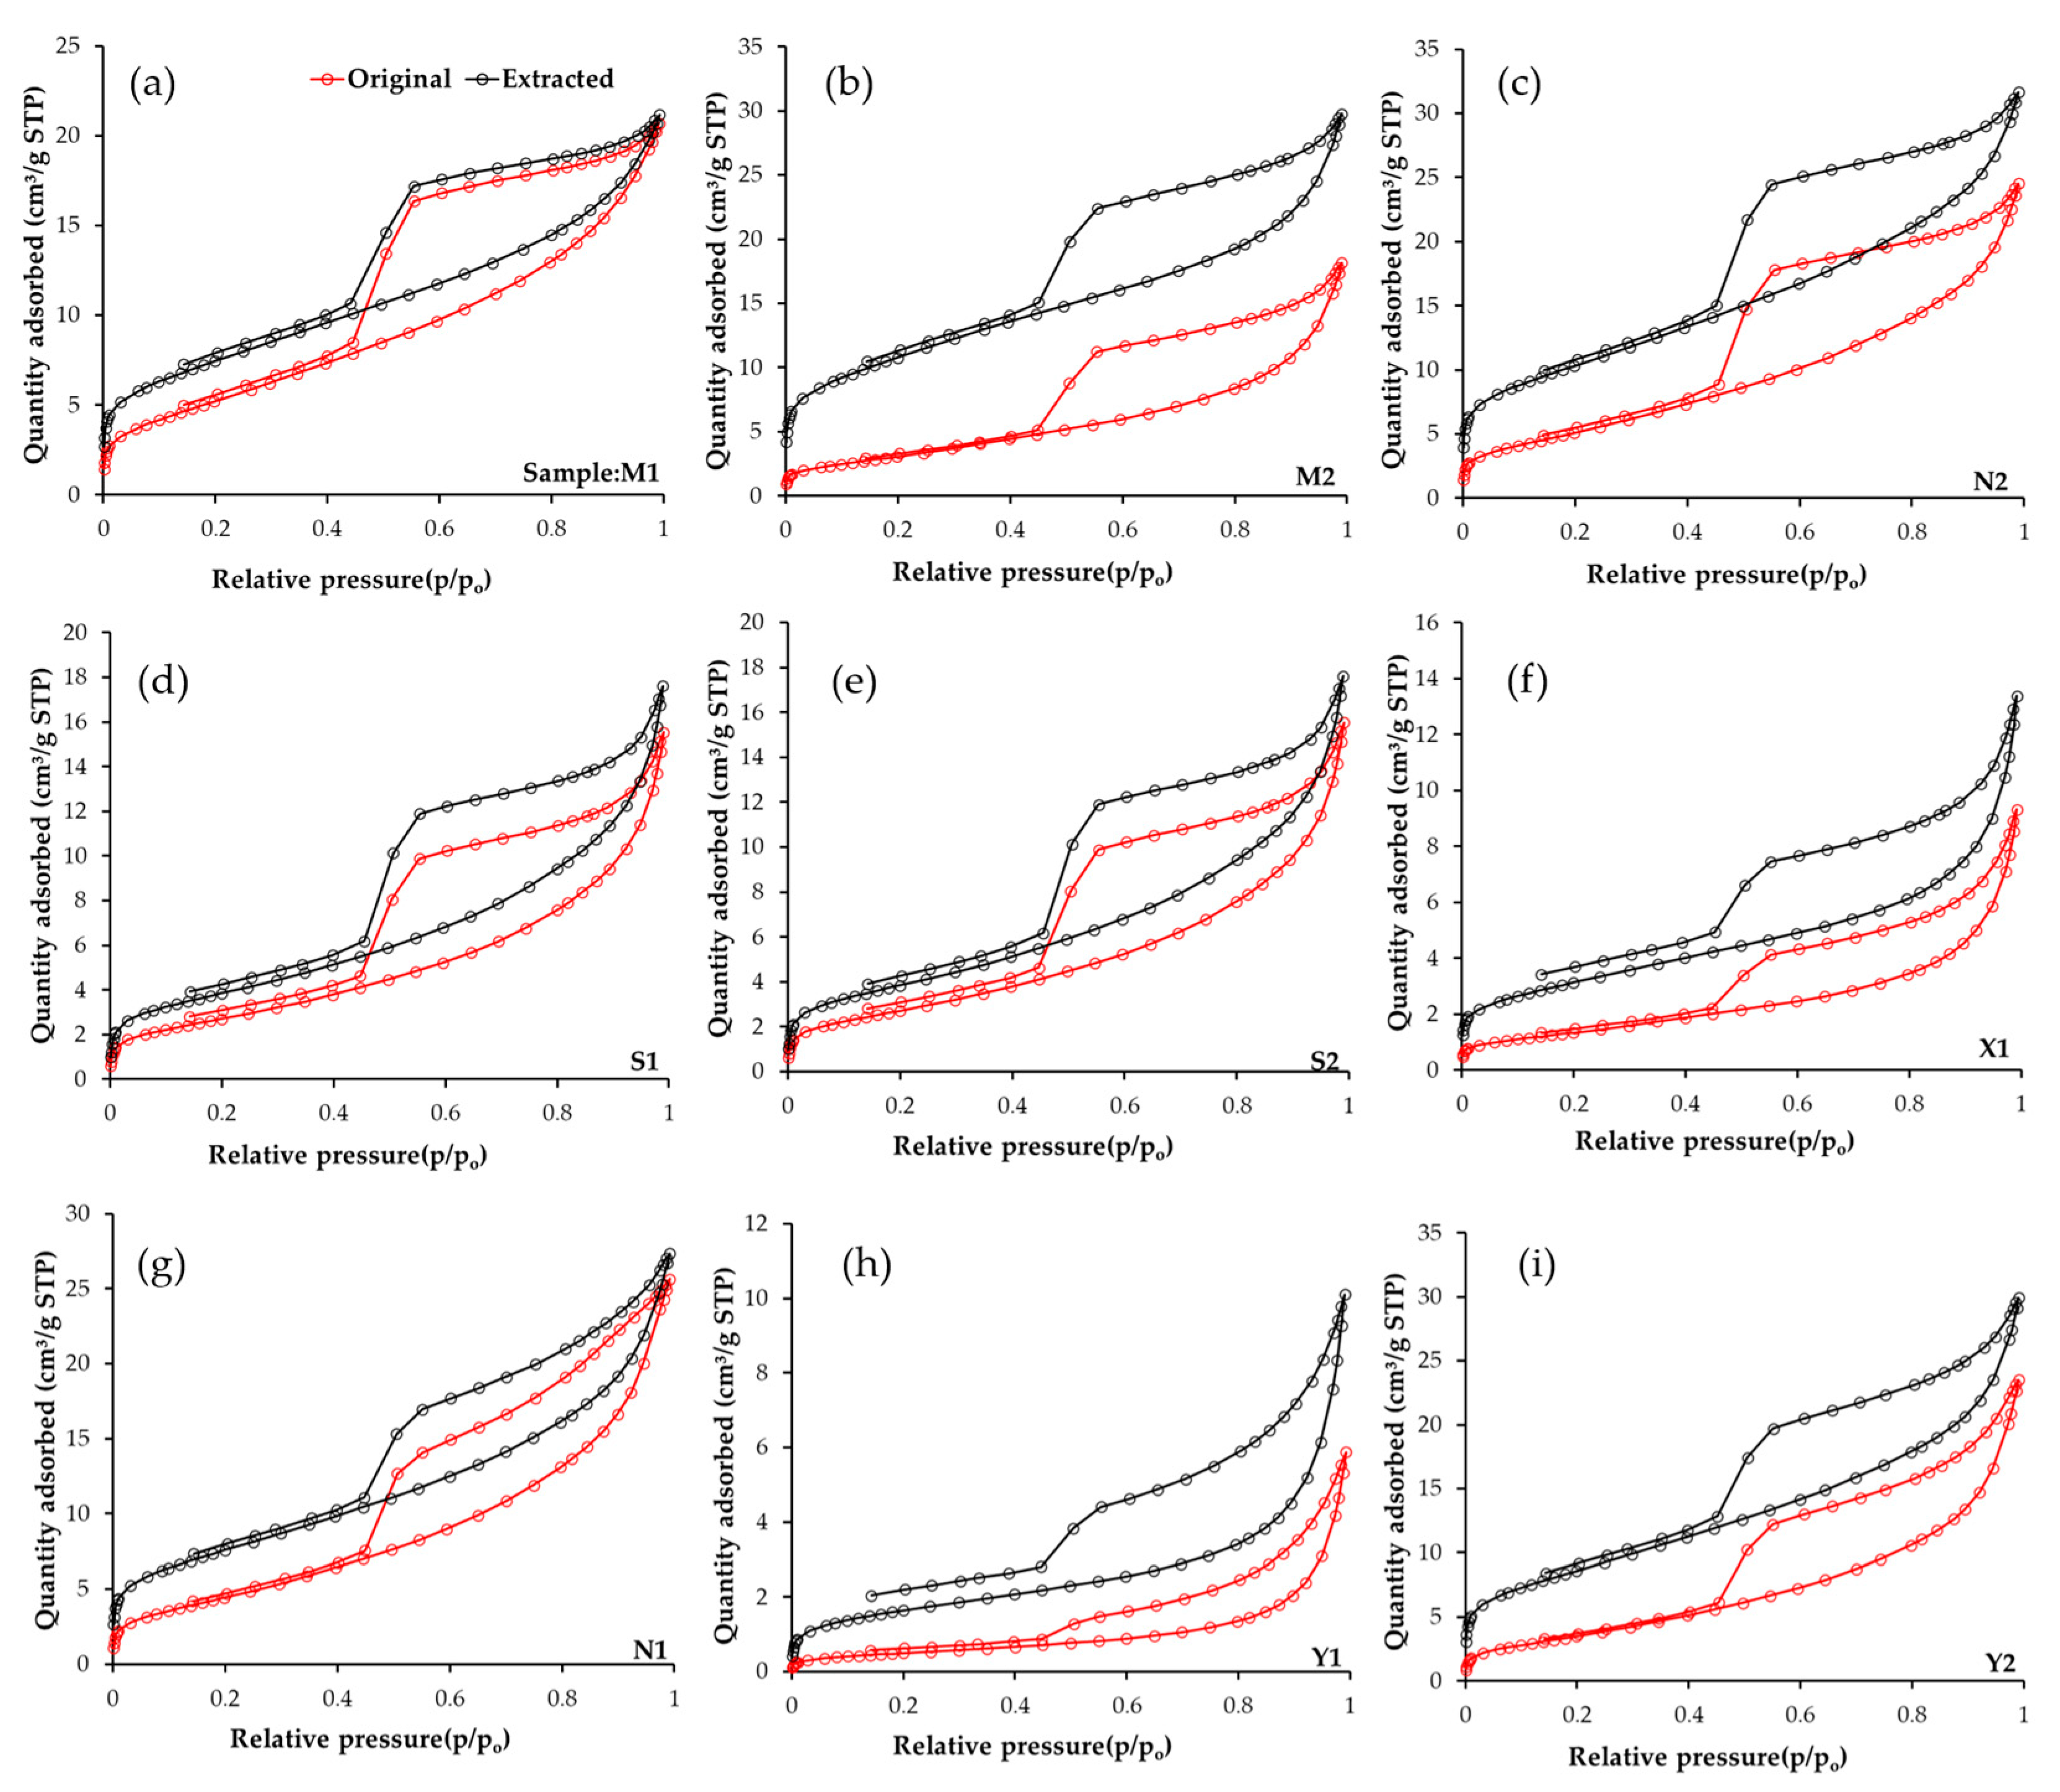
4.4.1. Isothermal Adsorption–Desorption Curve

According to the International Union of Pure and Applied Chemistry (IUPAC) physical isotherm classification scheme [51], the nitrogen adsorption and desorption curves of the original shale samples of the Q1 shale in the Gulong Sag all indicate type IV(a) shale (Figure 5). A hysteretic loop is produced for each sample due to mesopore development. A hysteretic loop is caused by the mismatch between the desorption curve and adsorption curve under the same pressure caused by capillary condensation during nitrogen desorption of mesopores [52]. According to the morphology of the hysteresis loops, a transitional hysteresis between H2(a) and H3 and a strong hysteresis between H3 and H4 are mainly present in the Gulong shale. The hysteresis types of samples X1 and Y1 are transitional types between H3 and H4 (Figure 5f,h). The H3 hysteresis loop indicates that the pore shape is dominated by slit-shaped pores formed by the accumulation of flaky particles, such as the pores between clay minerals. The H4 hysteresis loop is similar to the H3 hysteresis loop in that the adsorption branch is composed of type I and type II shale isotherms. Compared with the H3 curve, the isotherm is slightly gentle and usually related to narrow slit-shaped pores. The other samples are the transitional between H2(a) and H3 (Figure 5a–e,g,i), and the pore morphologies include ink bottle shapes and parallel slab–slit shapes. The difference between the two hysteresis types is that the transition type between H3 and H4 has a gentle adsorption–desorption branch and is similar to the combination of type I and type II isotherms, while the transition type between H2(a) and H3 has a steeper desorption branch.
The shale samples after extraction are all transitional types between H2(a) and H3. A comparison of the shale samples before partial extraction reveals that the transitional type between H2(a) and H3 before extraction and H3 and H4 after extraction not only shows that many micropores are added to the samples but also indicates that the shale oil in the original pores is extracted. The pore morphology changes from narrow or slit-shaped pores to ink-bottle-shaped pores [53]. Notably, some shale samples, such as X1 and Y1, show disagreement between the desorption curve and adsorption curve at low relative pressure after extraction, which may be caused by the expansion of porous nonrigid structural particles or an irreversible chemical reaction between the adsorbate and adsorbent [52].

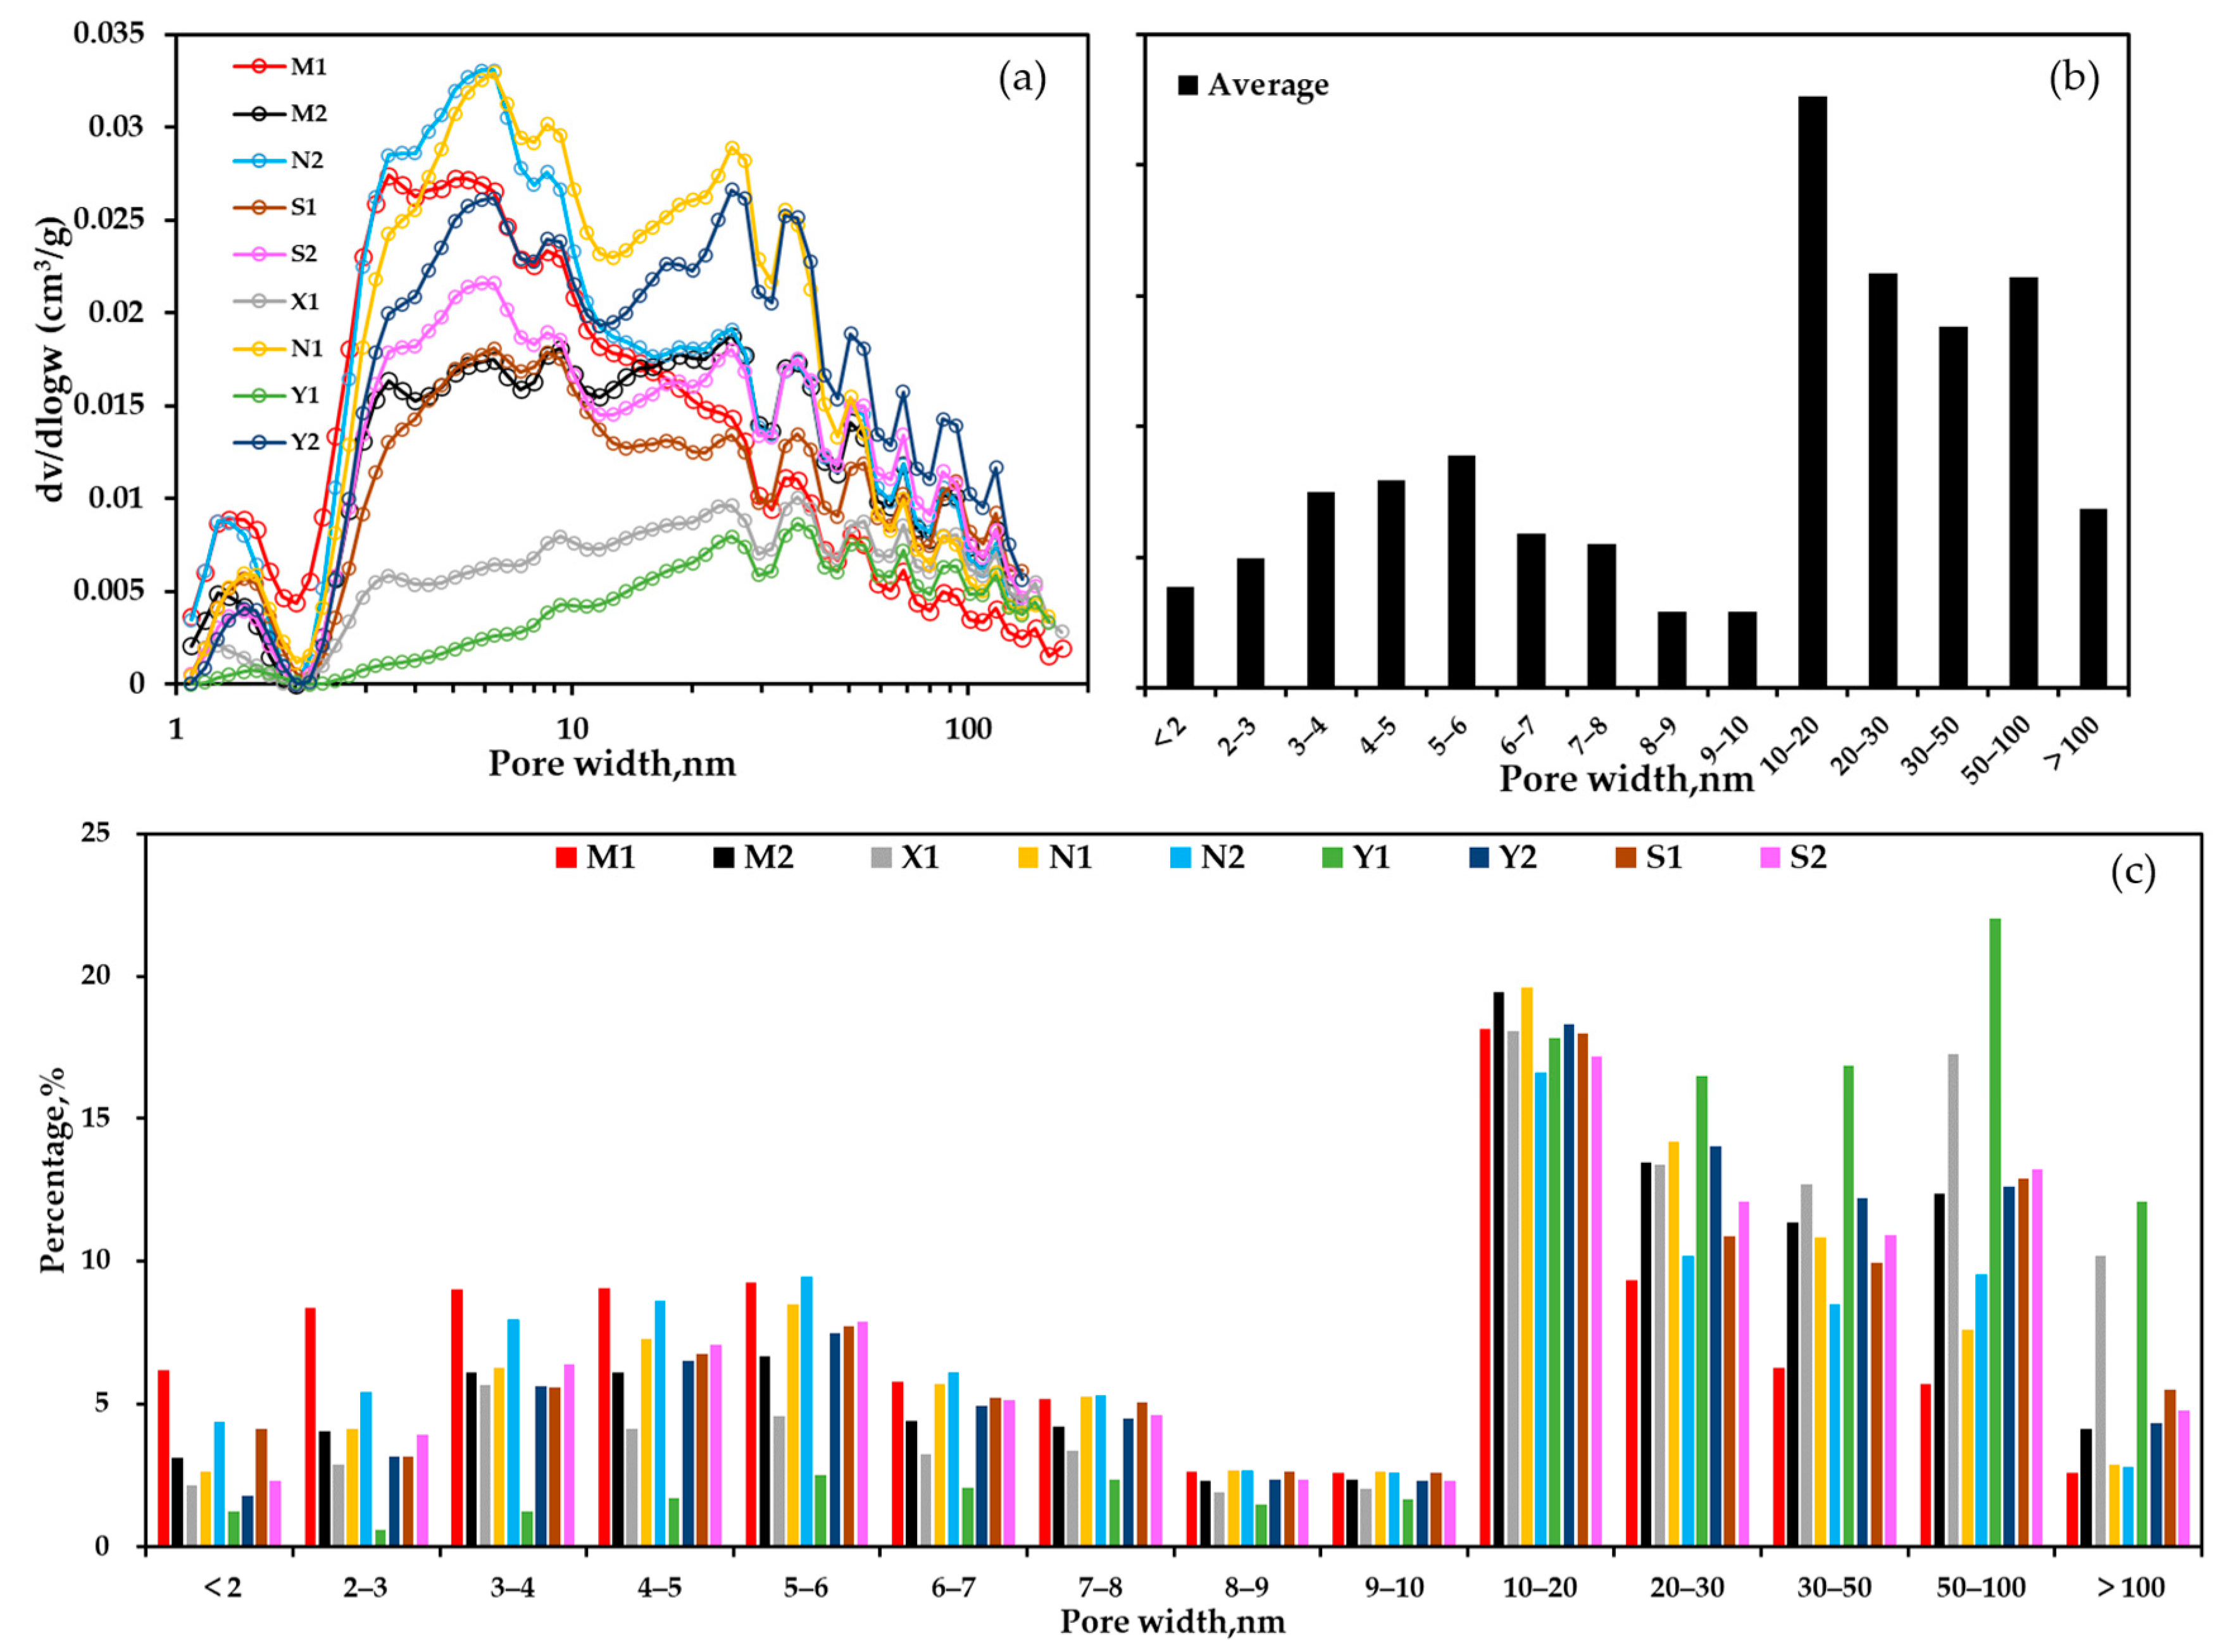
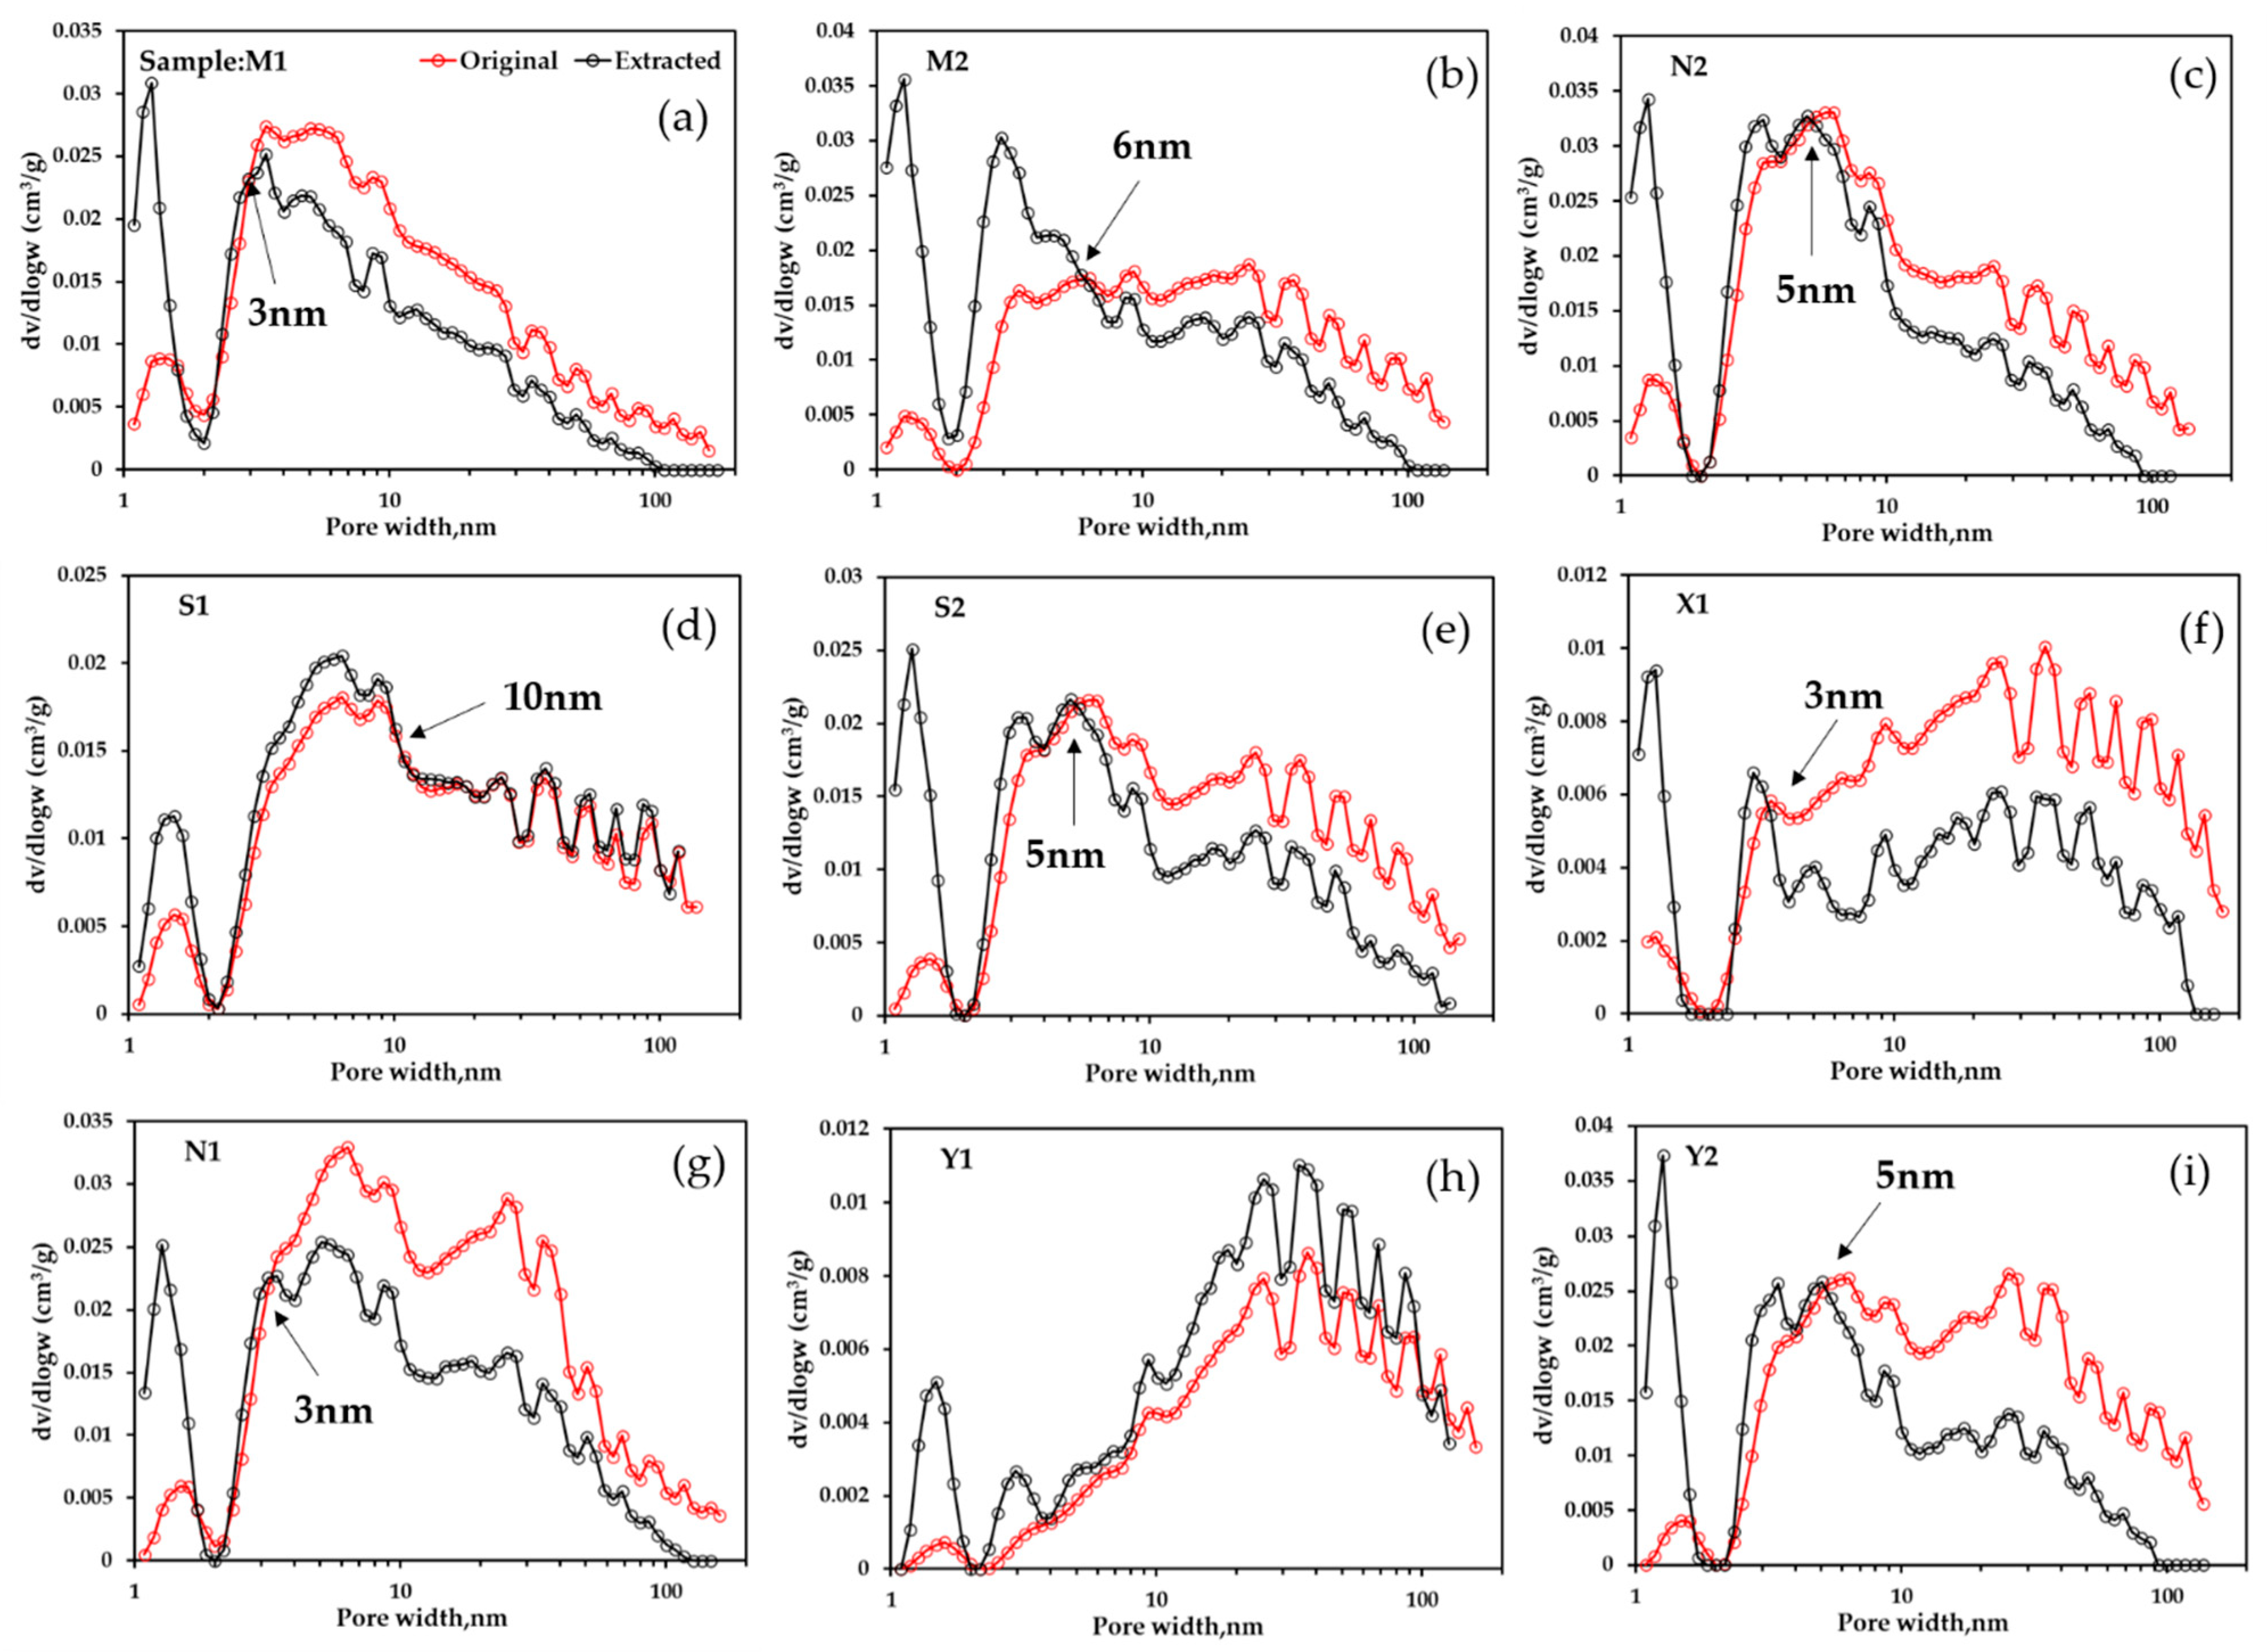
4.4.2. Pore Size Distribution

The shale pores of Q1 of the Qijia–Gulong Sag in the Songliao Basin are in the pore size range from 1 nm to 150 nm, and the distribution of pore sizes varies. The distribution of the X1 and Y1 samples is unimodal, and the pore size of both samples peaks at approximately 40 nm. The other samples show a bimodal distribution, with peaks at approximately 5 nm and 30 nm (Figure 6a). The overall distribution trends are similar, with the 6 nm pore size as the dividing line, and the contribution of pore volume increases gradually during the change in the pore size from 1 to 6 nm. As the pore size increases from 6 nm to 10 nm, the pore volume contribution gradually decreases, the peak value is reached in the pore size range of 10 nm to 20 nm, and the pore volume is the largest and then gradually decreases. However, the pore volume contribution rate of pores with sizes of 10 nm can be used as the watershed value, the pore volume contribution rate of pores with sizes of larger than 10 nm is 60%, and the pore volume contribution rate of pores with sizes of smaller than 10 nm is 40% (Figure 6b). The pore volume contribution of most samples is similar in the 2–10 nm range, and the Y1 sample shows the least pore volume contribution in that range. When the pore size is larger than 10 nm, the pore volume contribution shows a rapid increase and reaches a peak at 50–100 nm (Figure 6c).
The pore size distribution of the extracted Gulong samples is similar to that of the pre-extracted Gulong samples (Figure 7), but the difference is that the nitrogen adsorption capacity of different pore sizes increases or decreases after extraction of the same sample, except for the Y1 sample. Notably, M1, X1 and N1 are bound by a pore size of 3 nm. For pore sizes less than 3 nm, the pore volume value after extraction is greater than that before extraction. For pore volumes greater than 3 nm, the pore volume after extraction is smaller than that before extraction. The N2, S2 and Y2 samples are limited to 5 nm. The limits of the M2 and S1 samples are 6 nm and 10 nm, respectively, but the pore volume of the S1 sample changes only slightly when the pore diameter is larger than 10 nm. The pore volume of the Y1 samples after extraction is greater than that before extraction in the full pore size range.

5. Discussion

5.1. Factors Influencing Shale Pore Volume

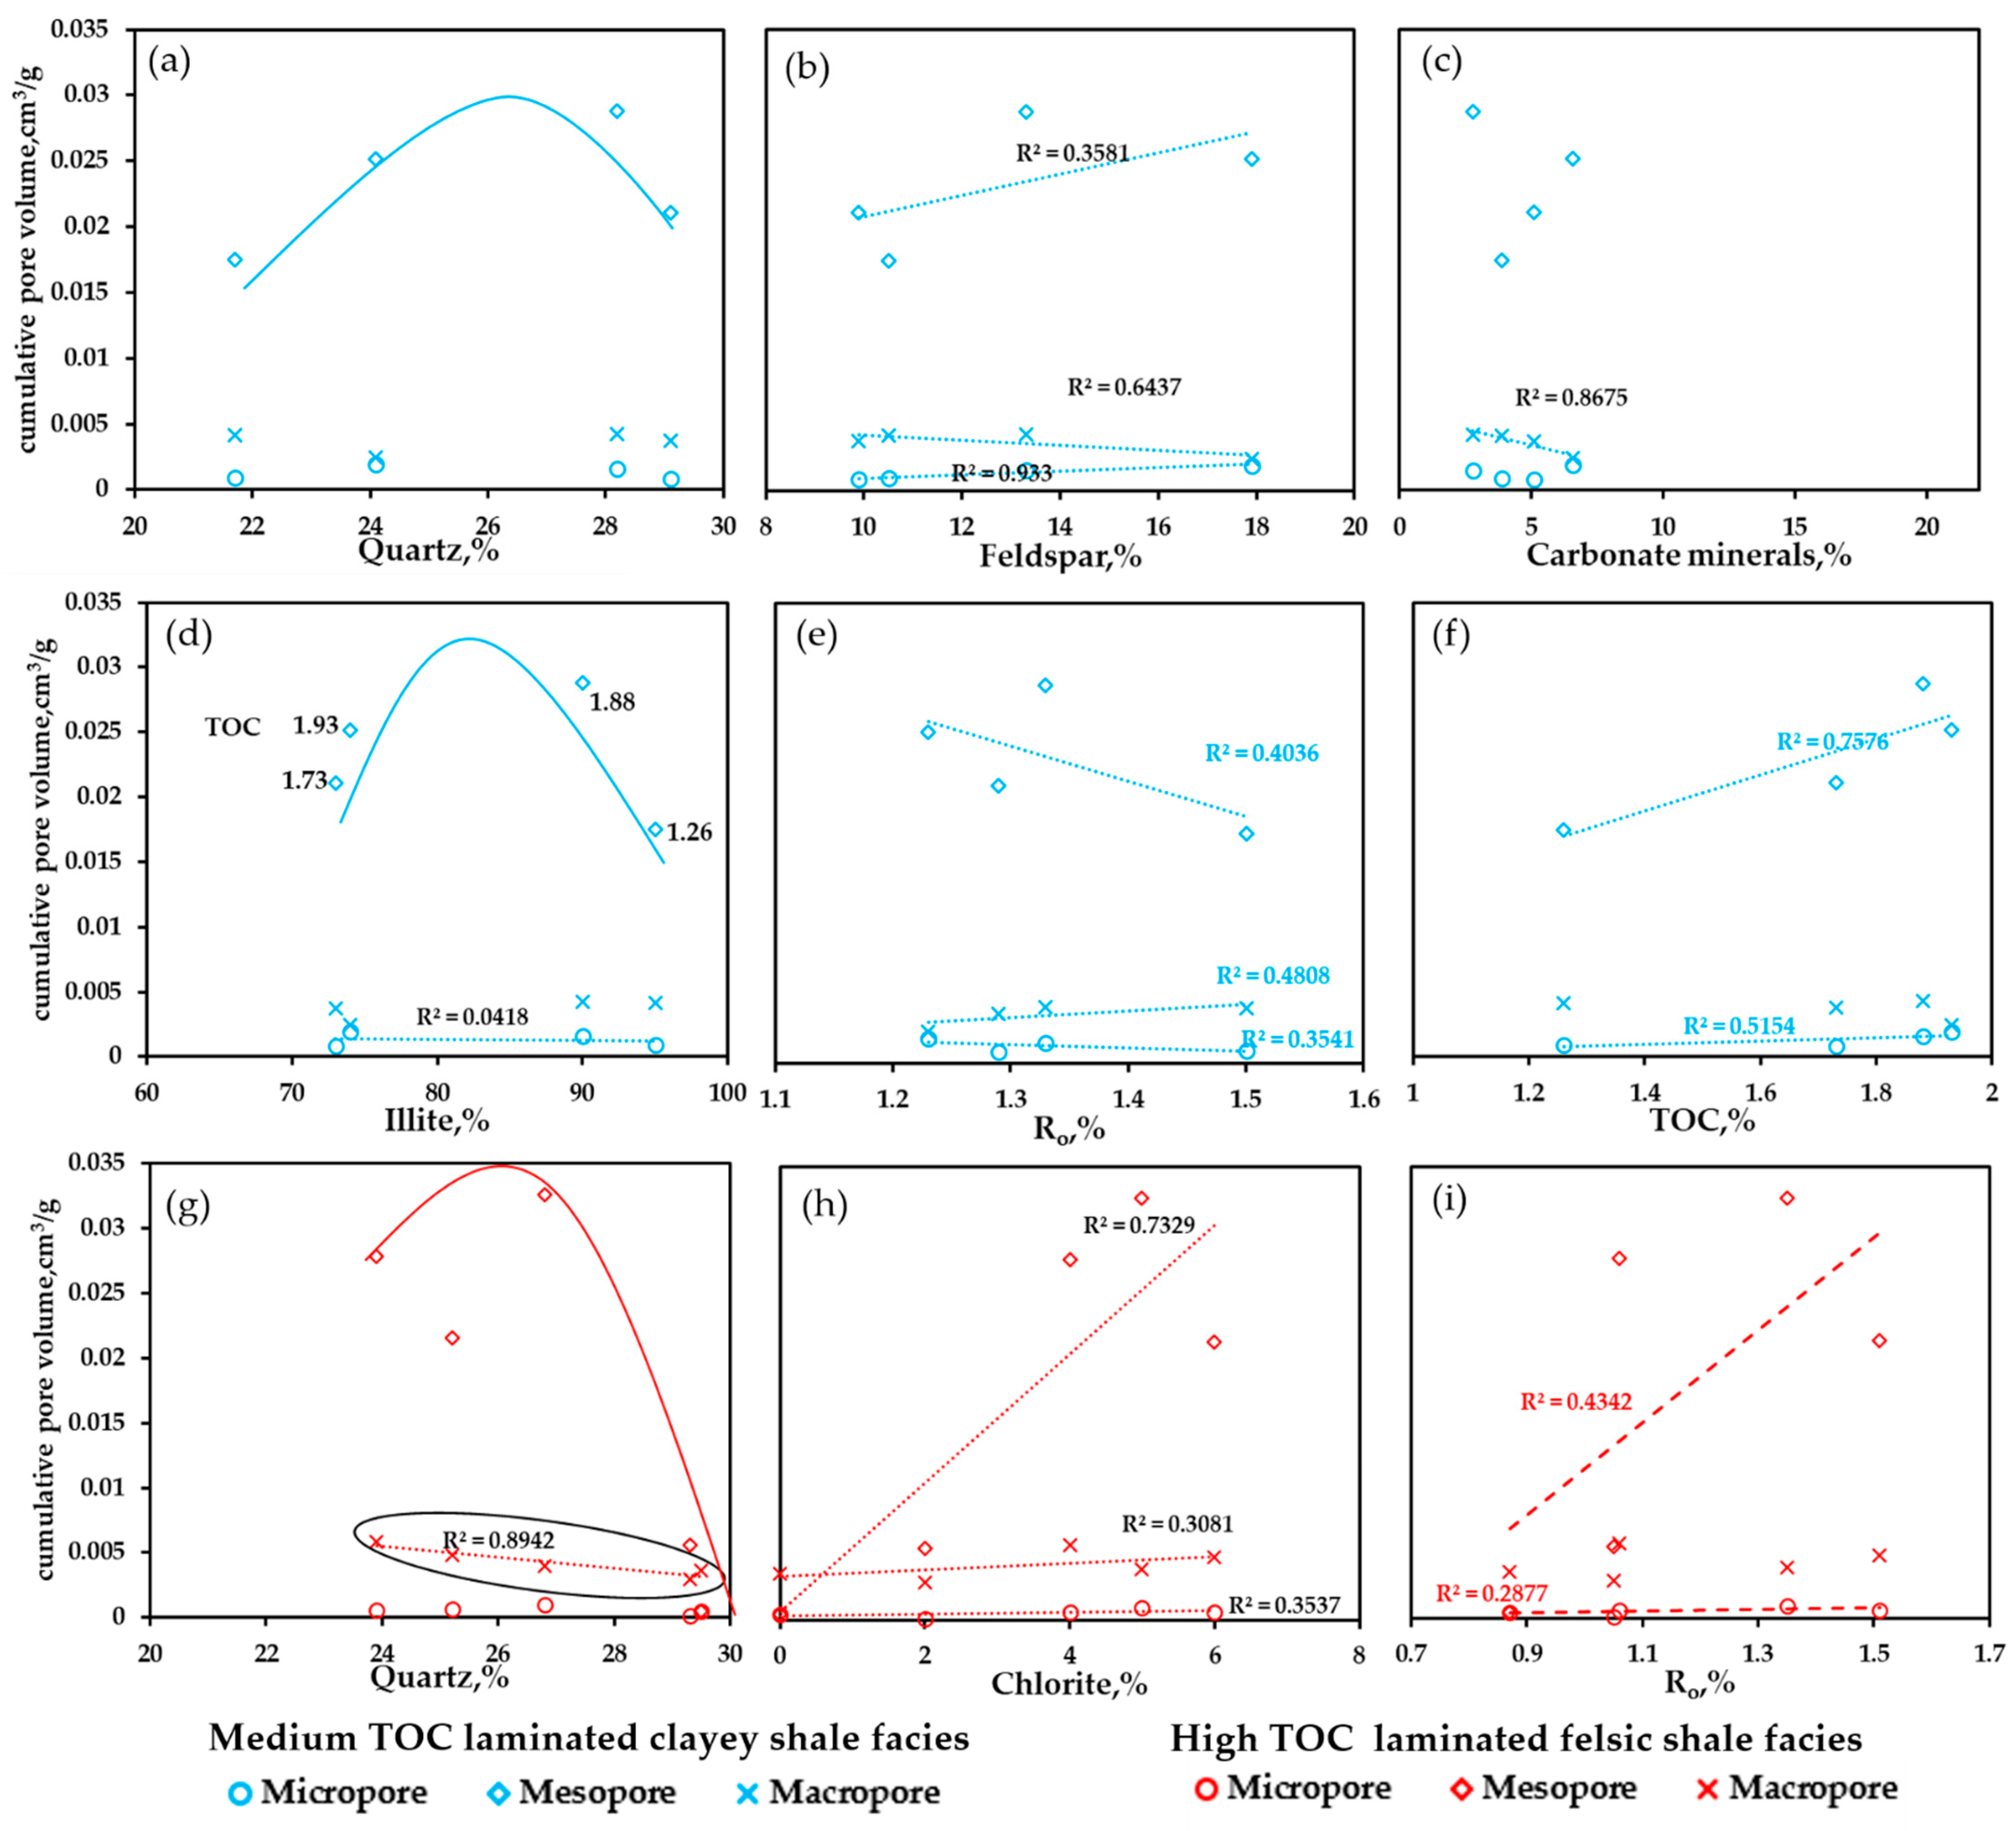
5.1.1. Mineral Composition and Content

The factors affecting the pore volume of laminated shale in Q1 in the Gulong Sag, Songliao Basin, are discussed according to two lithofacies: laminated clayey shale facies with moderate TOC contents and laminated felsic shale facies with high TOC contents. The factors influencing pores, such as the mineral composition, content, organic matter type, maturity, TOC content and burial depth, are very complex [54]. Each factor has a different effect on different pore volumes, so the pores are divided into micropores (1~2 nm), mesopores (2~50 nm) and macropores (50~200 nm) for discussion.
Quartz and feldspar are the main brittle minerals in the laminated clayey shale facies with moderate TOC contents. In the range of micropores, quartz content showed a weak negative correlation with the volume of micropores (Figure 8a), indicating that quartz is not conducive to the development of micropores, which may be due to the stable physical and chemical properties of quartz, which does not easily dissolve and produce micropores; moreover, the increase in quartz content will cause a “run effect” to occupy the pores in minerals such as chlorite that easily produce micropores [55]. The feldspar content has a high positive correlation with the volume of micropores (Figure 8b). Compared with quartz, feldspar is less stable and is easily corroded by acidic fluids released by carbonate minerals or organic matter in the process of thermal evolution, resulting in many dissolution pores.
For mesopore pores, the pore volume first increases and then decreases with increasing quartz content (Figure 8a), and the inflection point occurs when the quartz content is approximately 27%. It is speculated that the pore volume begins to decrease as the quartz content increases and that the overgrowth of quartz becomes more obvious. The feldspar content was positively correlated with the mesopore volume (Figure 8b).
There is a negative correlation between macropore volume and quartz content (Figure 8a) because, according to the Tmax values determined here and in previous studies, the main body of Q1 is in the middle diagenetic A2 stage, and a local part is in the middle diagenetic B stage [56]; that is, the main body is in the hydrocarbon generation stage, the primary intergranular pores and secondary pores develop and the local clay is transformed to form many organic pores and clay intergranular pores [57]. However, due to the overgrowth of most quartz, at this stage, the contact mode between quartz particles will become mosaic contact, resulting in rock densification and pore plugging, resulting in a reduction in pore volume. The feldspar content is negatively correlated with the macropore volume (Figure 8b). While feldspar is eroded by acidic fluid, potassium feldspar can fill larger intergranular pores with secondary minerals [22], which is why the feldspar content is positively correlated with the pore volume of micropores and mesopores. For macropore volume, the positive correlation is small or even negative.
There is a good negative correlation between carbonate minerals and macropore volume (Figure 8c), which is speculated to be caused by the plugging of pores by carbonate minerals in the form of cement. The correlations between carbonate minerals and micropores and mesopores are not very strong, which proves that carbonate minerals have little influence on the above types of pore scales, or because the composition of carbonate minerals is more complex and the influencing factors on pores are more complex, there is no strong correlation.
Illite is the most abundant component in clay minerals and has no obvious correlation with the volume of micropores. With increasing illite content, the mesopore volume first increases and then decreases, and the higher the organic matter content of the sample, the larger the mesopore volume that is generated. This may be because the higher the organic matter content, the more liquid hydrocarbons fill the pores, resulting in a positive correlation between illite content and macropore volume with a strong positive correlation (Figure 8d). In summary, because the morphology of the illite under scanning electron microscopy is flocculent, it can produce many nanoscale pores, so the overall pores of all scales are positively correlated with illite.
For laminated felsic shale facies with a high organic matter, the quartz content is weakly negatively correlated with the micropore volume (Figure 8g). The volume of mesopores first increases and then decreases with increasing quartz content. There is a strong negative correlation between quartz content and macropore volume (Figure 8g), and the reason is similar to that of the laminated clay shale facies with moderate TOC contents, which will not be discussed in further detail here.
Chlorite contributes a relatively small proportion of the mineral composition and has a positive correlation with the mesopore volume. It is speculated that chlorite linings in pores can inhibit pressure dissolution to a certain extent and effectively inhibit quartz overgrowth [58]. The correlation between micropores and macropores is weak (Figure 8h).

5.1.2. Organic Matter Content

For the laminated clay shale facies with moderate TOC contents, the pore volume of organic matter is moderately or weakly positively correlated (Figure 8g). In the process of hydrocarbon generation, organic matter will produce organic acids to dissolve carbonate, phosphate rock and other minerals, resulting in dissolution pores; second, the organic matter itself will shrink to produce organic matter pores [59]. Both types of organic matter have a positive effect on pore volume. However, the increase in organic matter content may not necessarily increase the pore volume because the resulting bitumen will fill the pores, resulting in a decrease in pore volume [60,61].

5.1.3. Maturity

The influence of maturity on pores is extremely complex. It can not only control the evolution degree of organic matter and, thus, the structure of organic matter pores but also cause the transformation of clay minerals, thus changing the pore characteristics of clay minerals [62]. Maturity represents the different evolutionary stages and characteristics of organic matter in different periods. In the immature stage of organic matter, organic matter usually has no pores. When it is in the mature stage, organic matter generates hydrocarbon, which produces organic matter pores. In addition, for shales of different types or different layers in different basins, the formed organic matter pores are different. Huo et al. believe that organic matter pores start to form when Ro is 0.7% and rapidly increase when Ro is 0.7%~1.2% [63]. For the laminated clayey shale facies with moderate TOC contents, the volume of micropores and mesopores decreases with increasing maturity (Figure 8e). This may be because liquid hydrocarbons in the oil generation stage preferentially fill micropores and mesopores and finally fill macropores, so macropores and maturity still maintain a positive correlation [64].

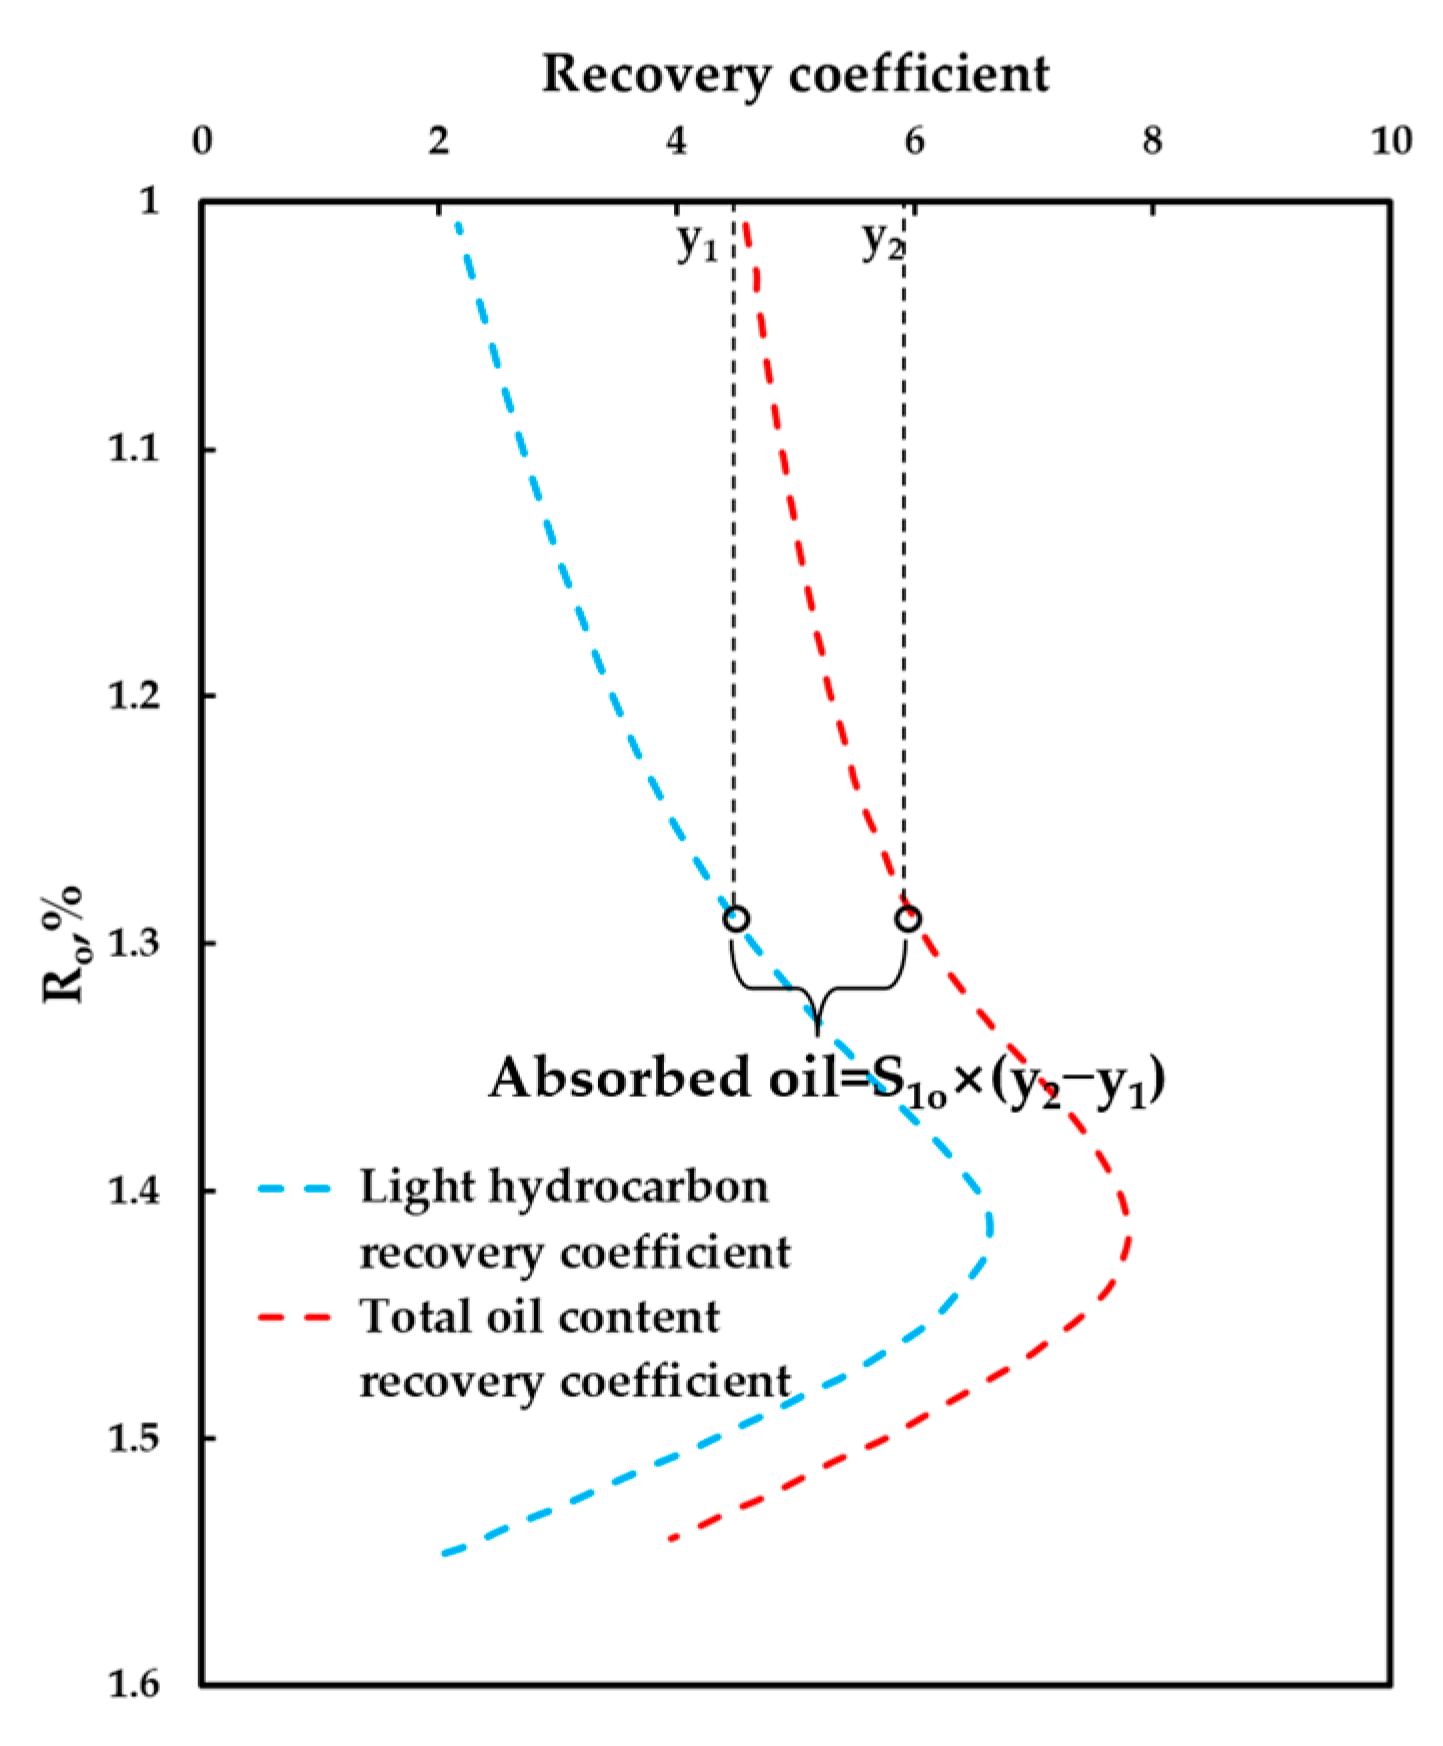
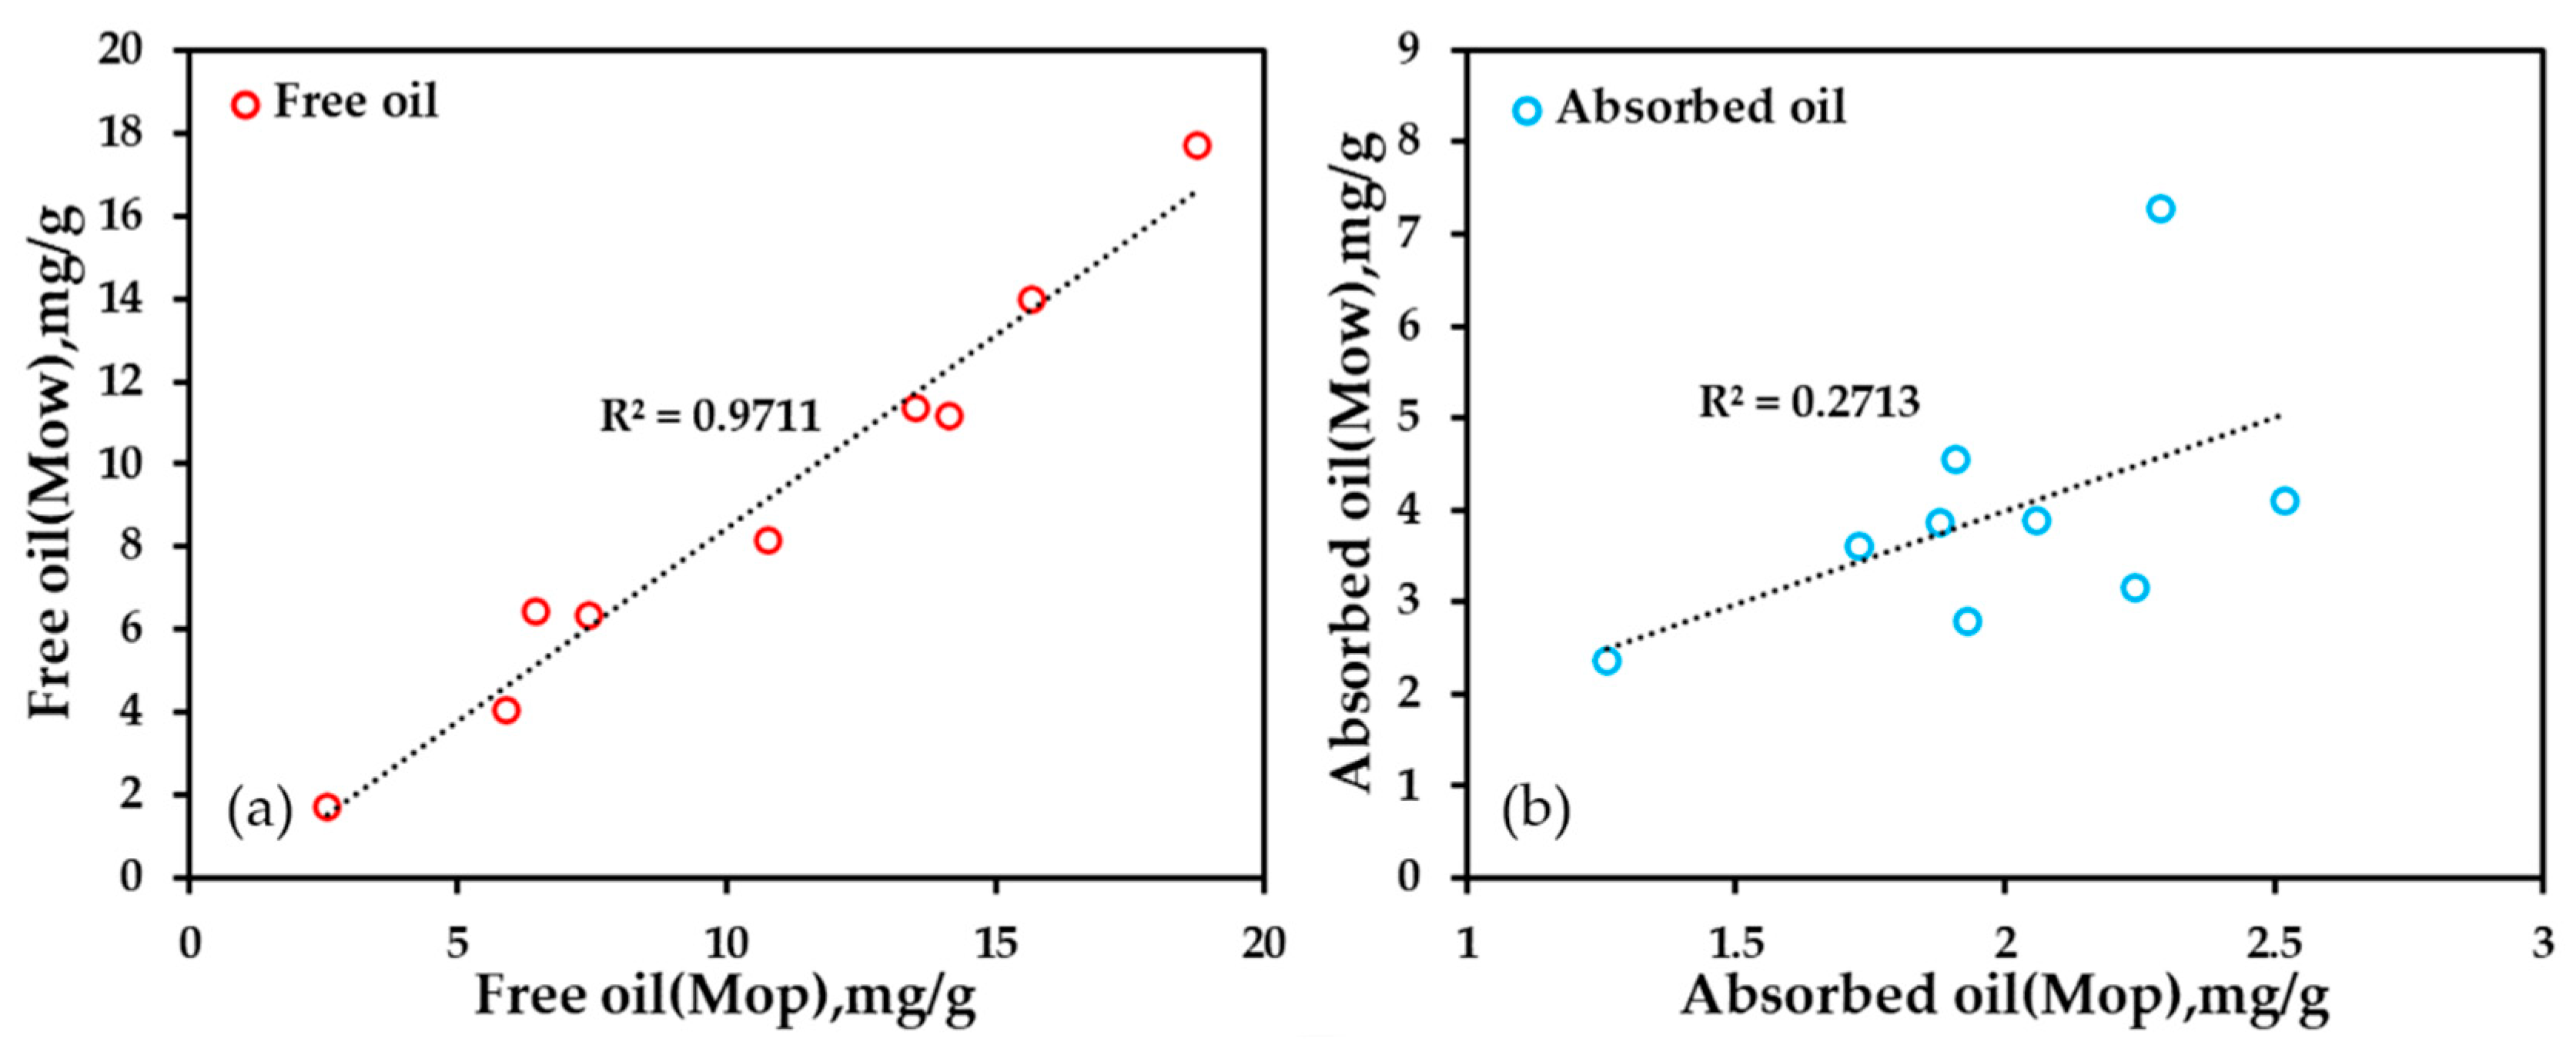
5.2. Occurrence Characteristics of Shale Oil

It is generally believed that shale oil exists in three states: free, dissolved and adsorbed. However, it mainly exists in the shale pore–fracture network in the form of free and adsorbed states [31]. Free shale oil exists in a large pore–fracture network and can flow freely in theory. The adsorbed oil interacts with the surfaces of minerals or organic matter, so there is basically no fluidity. At present, the experiments used to evaluate the oil content of shale mainly include the nuclear magnetic resonance (NMR) method [65], organic solvent extraction method [66], multistep pyrolysis method [67] and conventional pyrolysis method. However, regardless of the kind of experimental method, light hydrocarbon loss in the process of coring and preparation of experimental samples is a problem. The conventional pyrolysis of S1 may not represent all the free oil, and S2 may not represent the complete pyrolysis of kerogen into hydrocarbons [68]. Therefore, light hydrocarbon recovery and heavy hydrocarbon correction are needed to accurately characterize the free oil content in the pyrolysis of S1.
The light hydrocarbon recovery part of S1 in this paper is calculated according to the total oil content and light hydrocarbon recovery coefficient of shales of different maturities (Figure 9) proposed by Wang Min et al. (2022) [69], and the heavy hydrocarbon correction is discussed later. If the calculation of the adsorbed oil content is characterized only by S2o (before extraction)–S2e (after extraction), the oil stability index (OSI) value calculated by S2o–S2e is greater than 100 mg/g, except for the S1 sample. According to the oil transcendence effect theory proposed by Jarvie et al. (2012) [70], if the OSI value is greater than 100 mg/g, the excess part is regarded as the mobile oil amount (Table 3) and should be included in the free oil content. In summary, the formulas of free oil and adsorbed oil used in this paper are as follows:
Free oil = S1o × Lhrc + (S2o − S2e − |TOC × 100|),
Adsorbed oil = S2o − S2e − (S2o − S2e − |TOC × 100|) = |TOC × 100|
Note: S1o—before extraction of S1 measured by conventional pyrolysis; S2o − S2e—(before extraction)S2-(after extraction) S2; and OSI—(S2o − S2e)/TOC × 100.
Lhrc is the light hydrocarbon recovery coefficient (Figure 10a), and the calculated values are presented in the columns showing the methods of this paper in Table 3.
To verify the difference between free oil and adsorbed oil calculated by different methods, this paper also applies the method of Wang Min et al. (2022) (also described as the Wang Min method) to calculate the content of free oil, total oil and adsorbed oil of selected samples:
Free oil = S1o × Lhrc,
Total oil= S1o × Torc,
Adsorbed oil = Total oil − Free oil = S1o × (Torc − Lhrc)
Torc is the total oil content recovery coefficient (Figure 10a), and the calculation results are presented in the column showing the method of Wang Min in Table 3.
The calculation results of free oil and adsorbed oil in this paper are compared with those of Wang Min (Figure 10), and there was little difference in the contents of free oil calculated by the two methods (Figure 10a). The correlation of adsorbed oil is not obvious, and the content of adsorbed oil calculated by the Wang Min method is higher than that in this paper (Figure 10b). The Wang Min method is based on NMR, but the method is not currently advanced. The calculation formula of adsorbed oil in this paper combines the empirical theory of Jarvie et al. (2012) [70], but it does not consider the influence of maturity on adsorbed oil; OSI = 100 mg/g changes with different maturities.

5.3. Factors Controlling Shale Oil

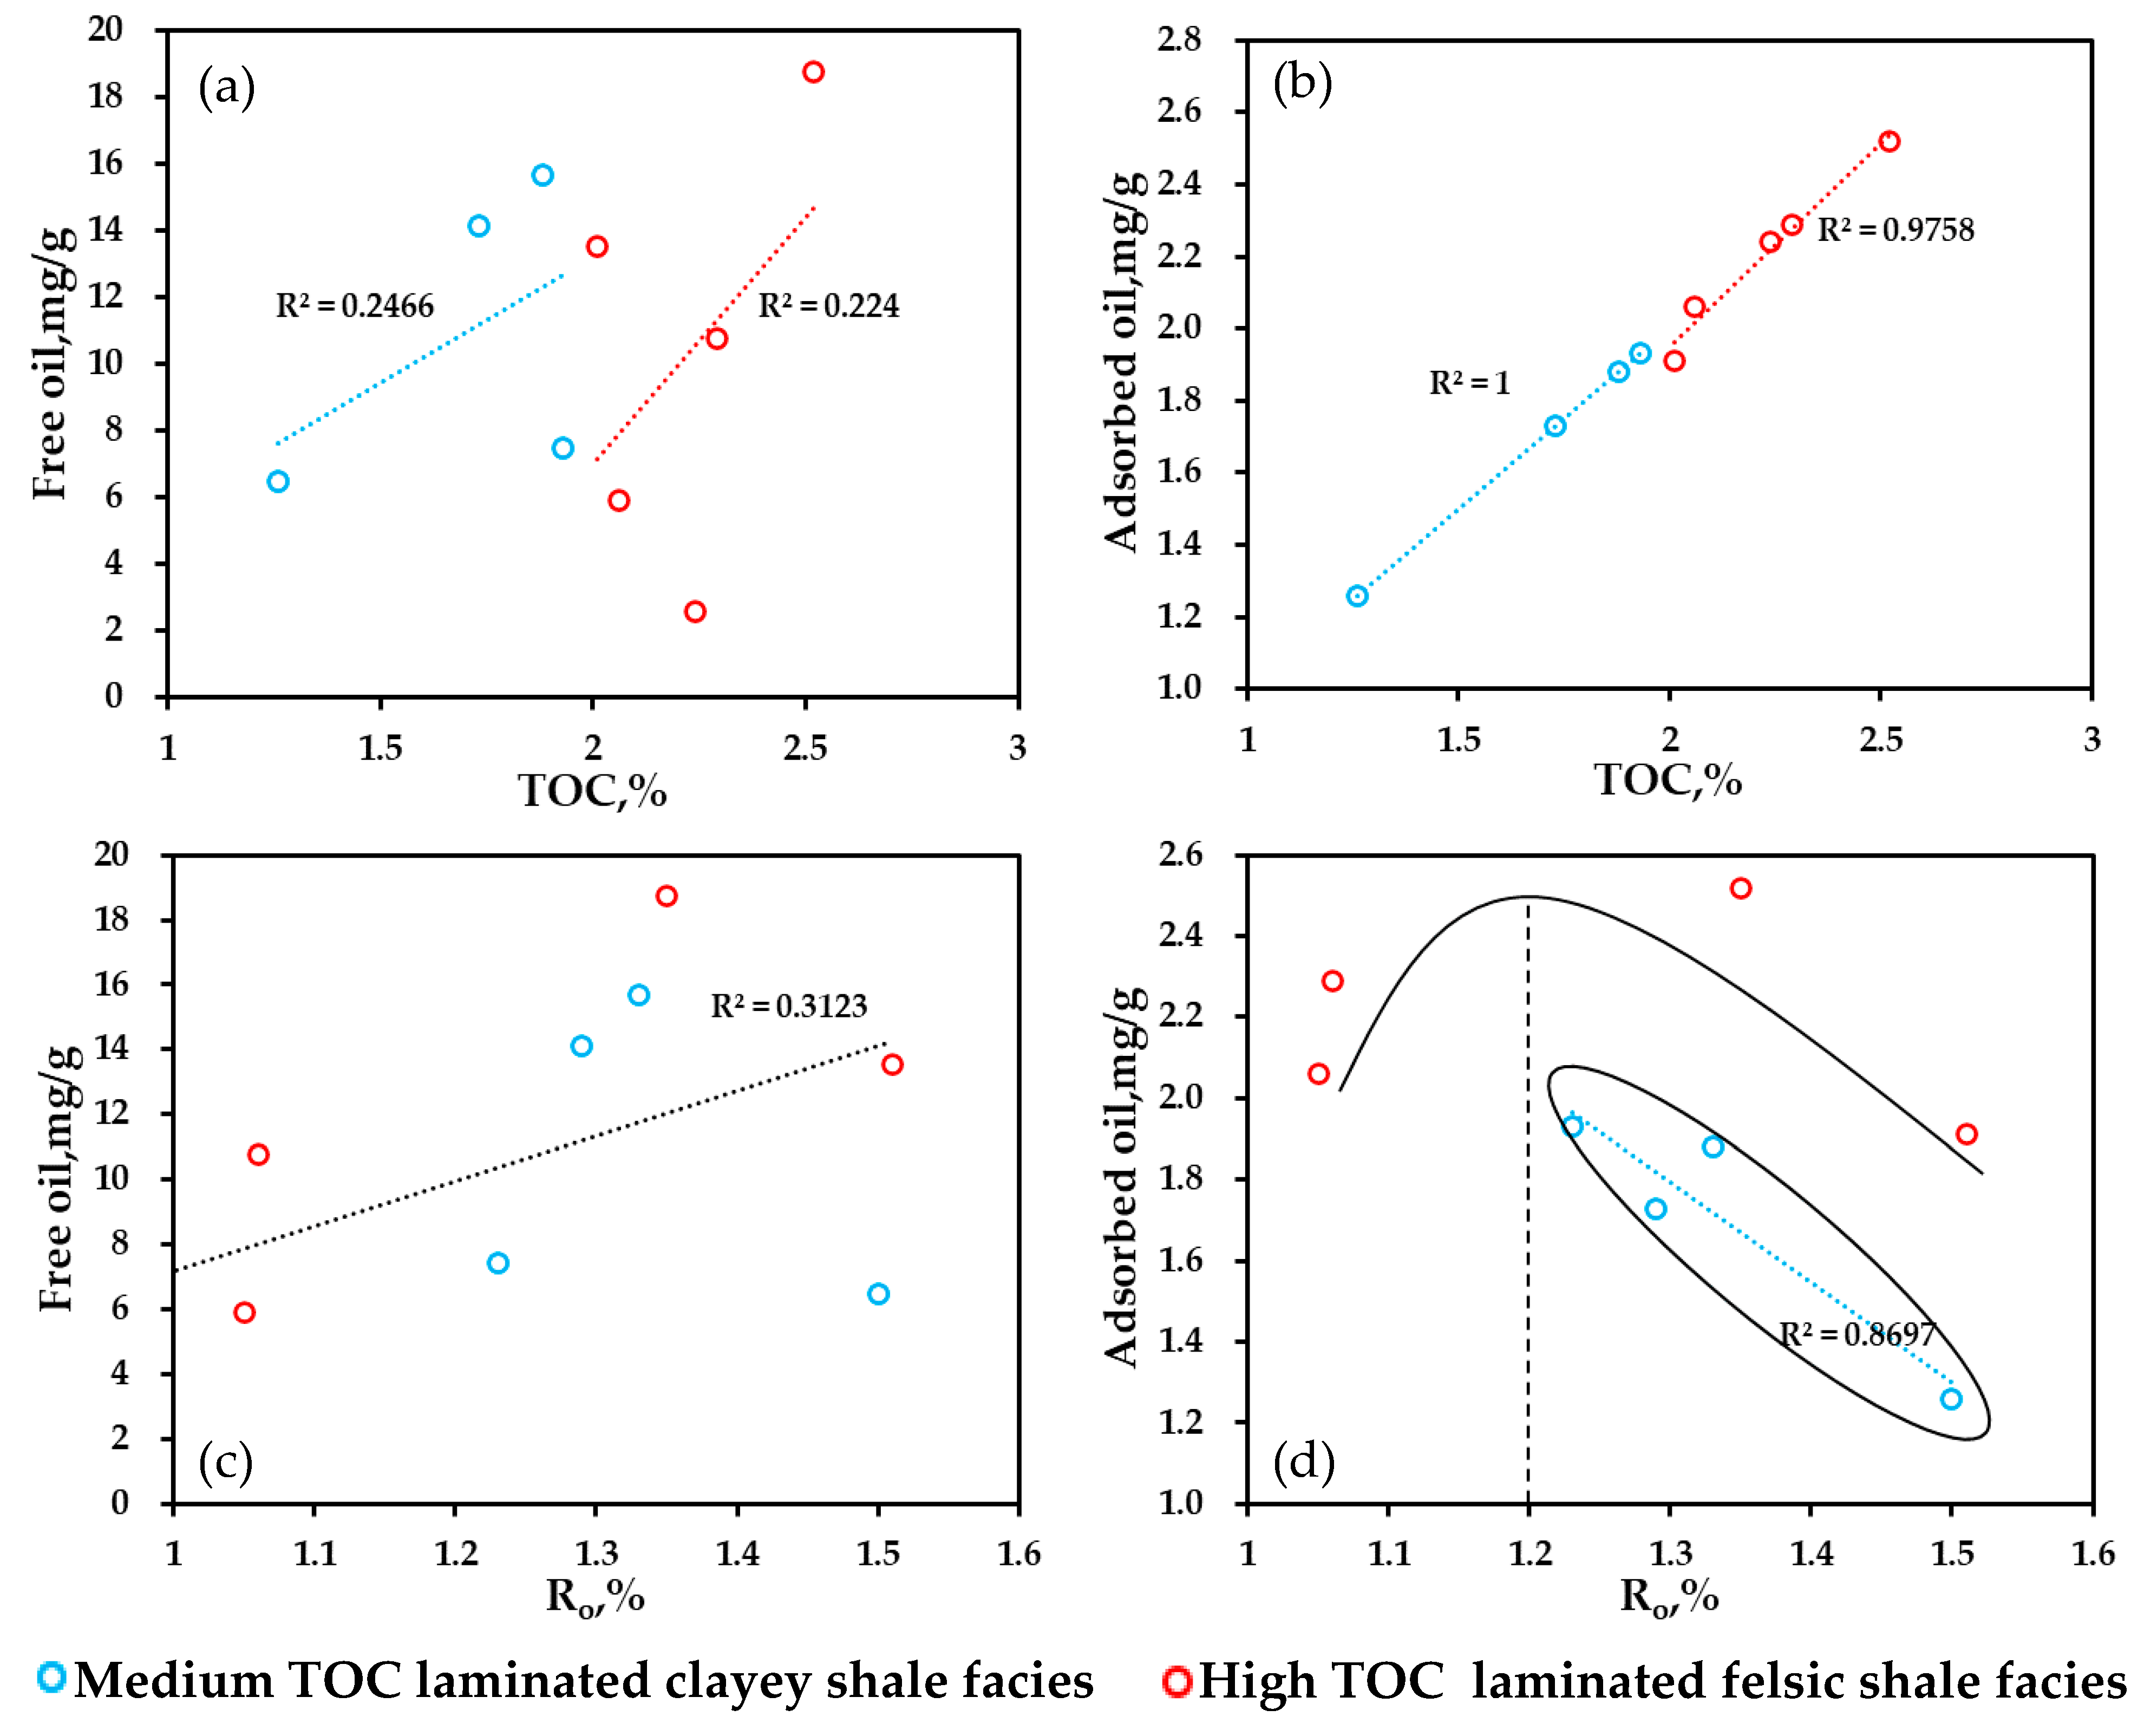
5.3.1. TOC Control on the Oil Content

The increase in the organic matter content has a positive effect on the free oil of the two lithofacies, resulting in a positive correlation (Figure 11a). This is mainly because the TOC content represents the residual organic carbon content, and the increase in TOC content represents the increase in the hydrocarbon content that can be produced per unit of mass. After meeting its own residual oil and gas demand in various forms, it begins to discharge outwardly in a free state, so there is a positive correlation between the two. Since the calculated results of adsorbed oil in this paper are consistent with the TOC values, the relationship between them is not discussed in this paper (Figure 11b).

5.3.2. Ro Control on the Oil Content

With the evolution of maturity, the content of free oil increases continuously (Figure 11c), and the content of adsorbed oil shows a trend of first increasing and then decreasing (Figure 11d). Consistent with the current understanding in the literature [71], the main hydrocarbon generation window of the Gulong shale is Ro = 0.8%~1.2%, and the adsorbed oil rapidly increases in this interval, which is consistent with the large amount of kerogen cracking in the hydrocarbon generation stage. After Ro becomes greater than 1.2%, it undergoes a higher thermal evolutionary stage, and the content of adsorbed oil begins to decline, but the free oil continues to increase, which is speculated to be due to the conversion of the heavy components in the adsorbed oil to light components. The adsorbed oil of samples of laminated clayey shale facies with moderate TOC contents is mainly formed after an Ro of 1.2% is reached, so there is no trend of adsorbed oil increasing with the evolution of Ro (Figure 11d).

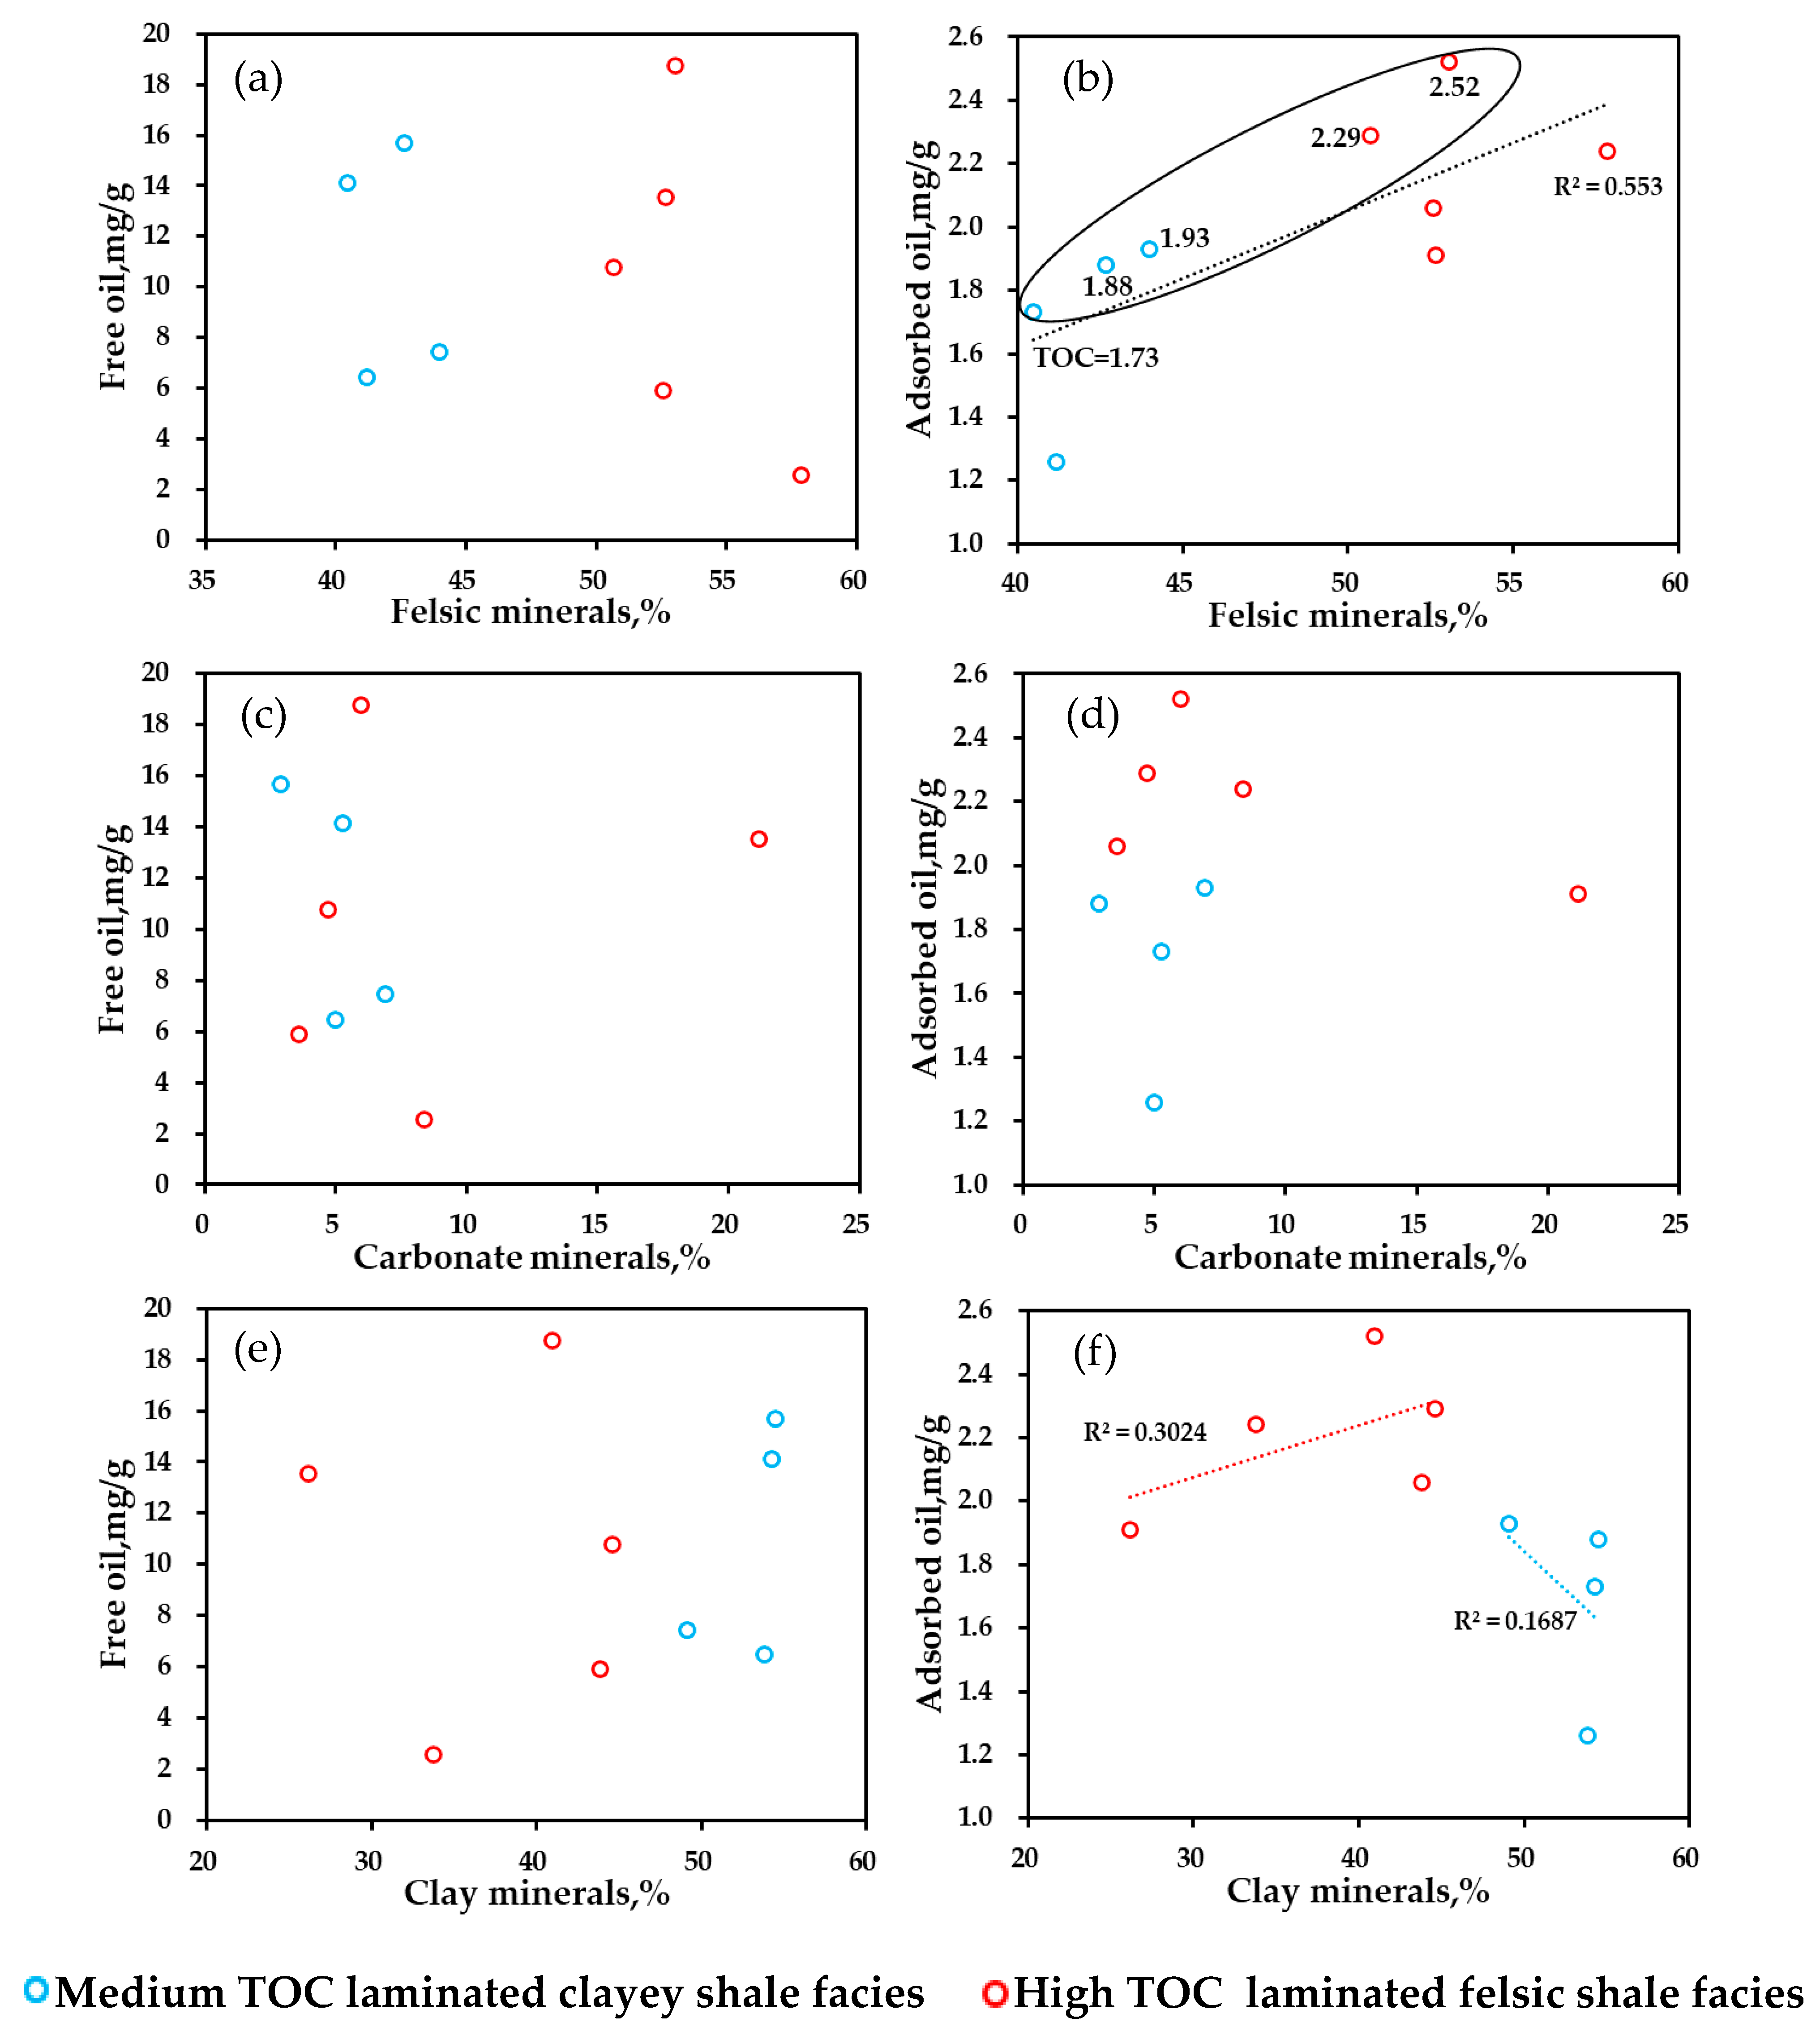
5.3.3. Relationship between Free Oil, Adsorbed Oil and Mineral Composition

There is no correlation between free oil and the felsic mineral content (Figure 12a). There is a positive correlation between adsorbed oil and the felsic mineral content. Essentially, the adsorbed oil content increases with increasing TOC content (Figure 12b). There is also no correlation between free oil and adsorbed oil and carbonate minerals (Figure 12c,d) because, in the oil–water–rock three-phase state, both calcite and dolomite show hydrophilic characteristics, resulting in a low adsorbed hydrocarbon content [72]. The clay mineral content is not correlated with free oil (Figure 12e) but has a variable correlation with adsorbed oil. The positive correlation for the laminated felsic shale facies with high TOC contents may be due to the relatively large specific surface area of clay minerals, and some clay minerals have certain oil wettability during diagenetic evolution, which can provide certain surface adsorption sites for adsorbed oil [73]. The reason for the negative correlation of the laminated clayey shale facies with moderate TOC contents is speculated to be due to the high maturity of the lithofacies (Ro values between 1.23% and 1.50%) (Figure 12f). The change in the mineral content affects the size and structure of pore throats, but it also indirectly affects the occurrence space of adsorbed oil while having no significant effect on the free oil.

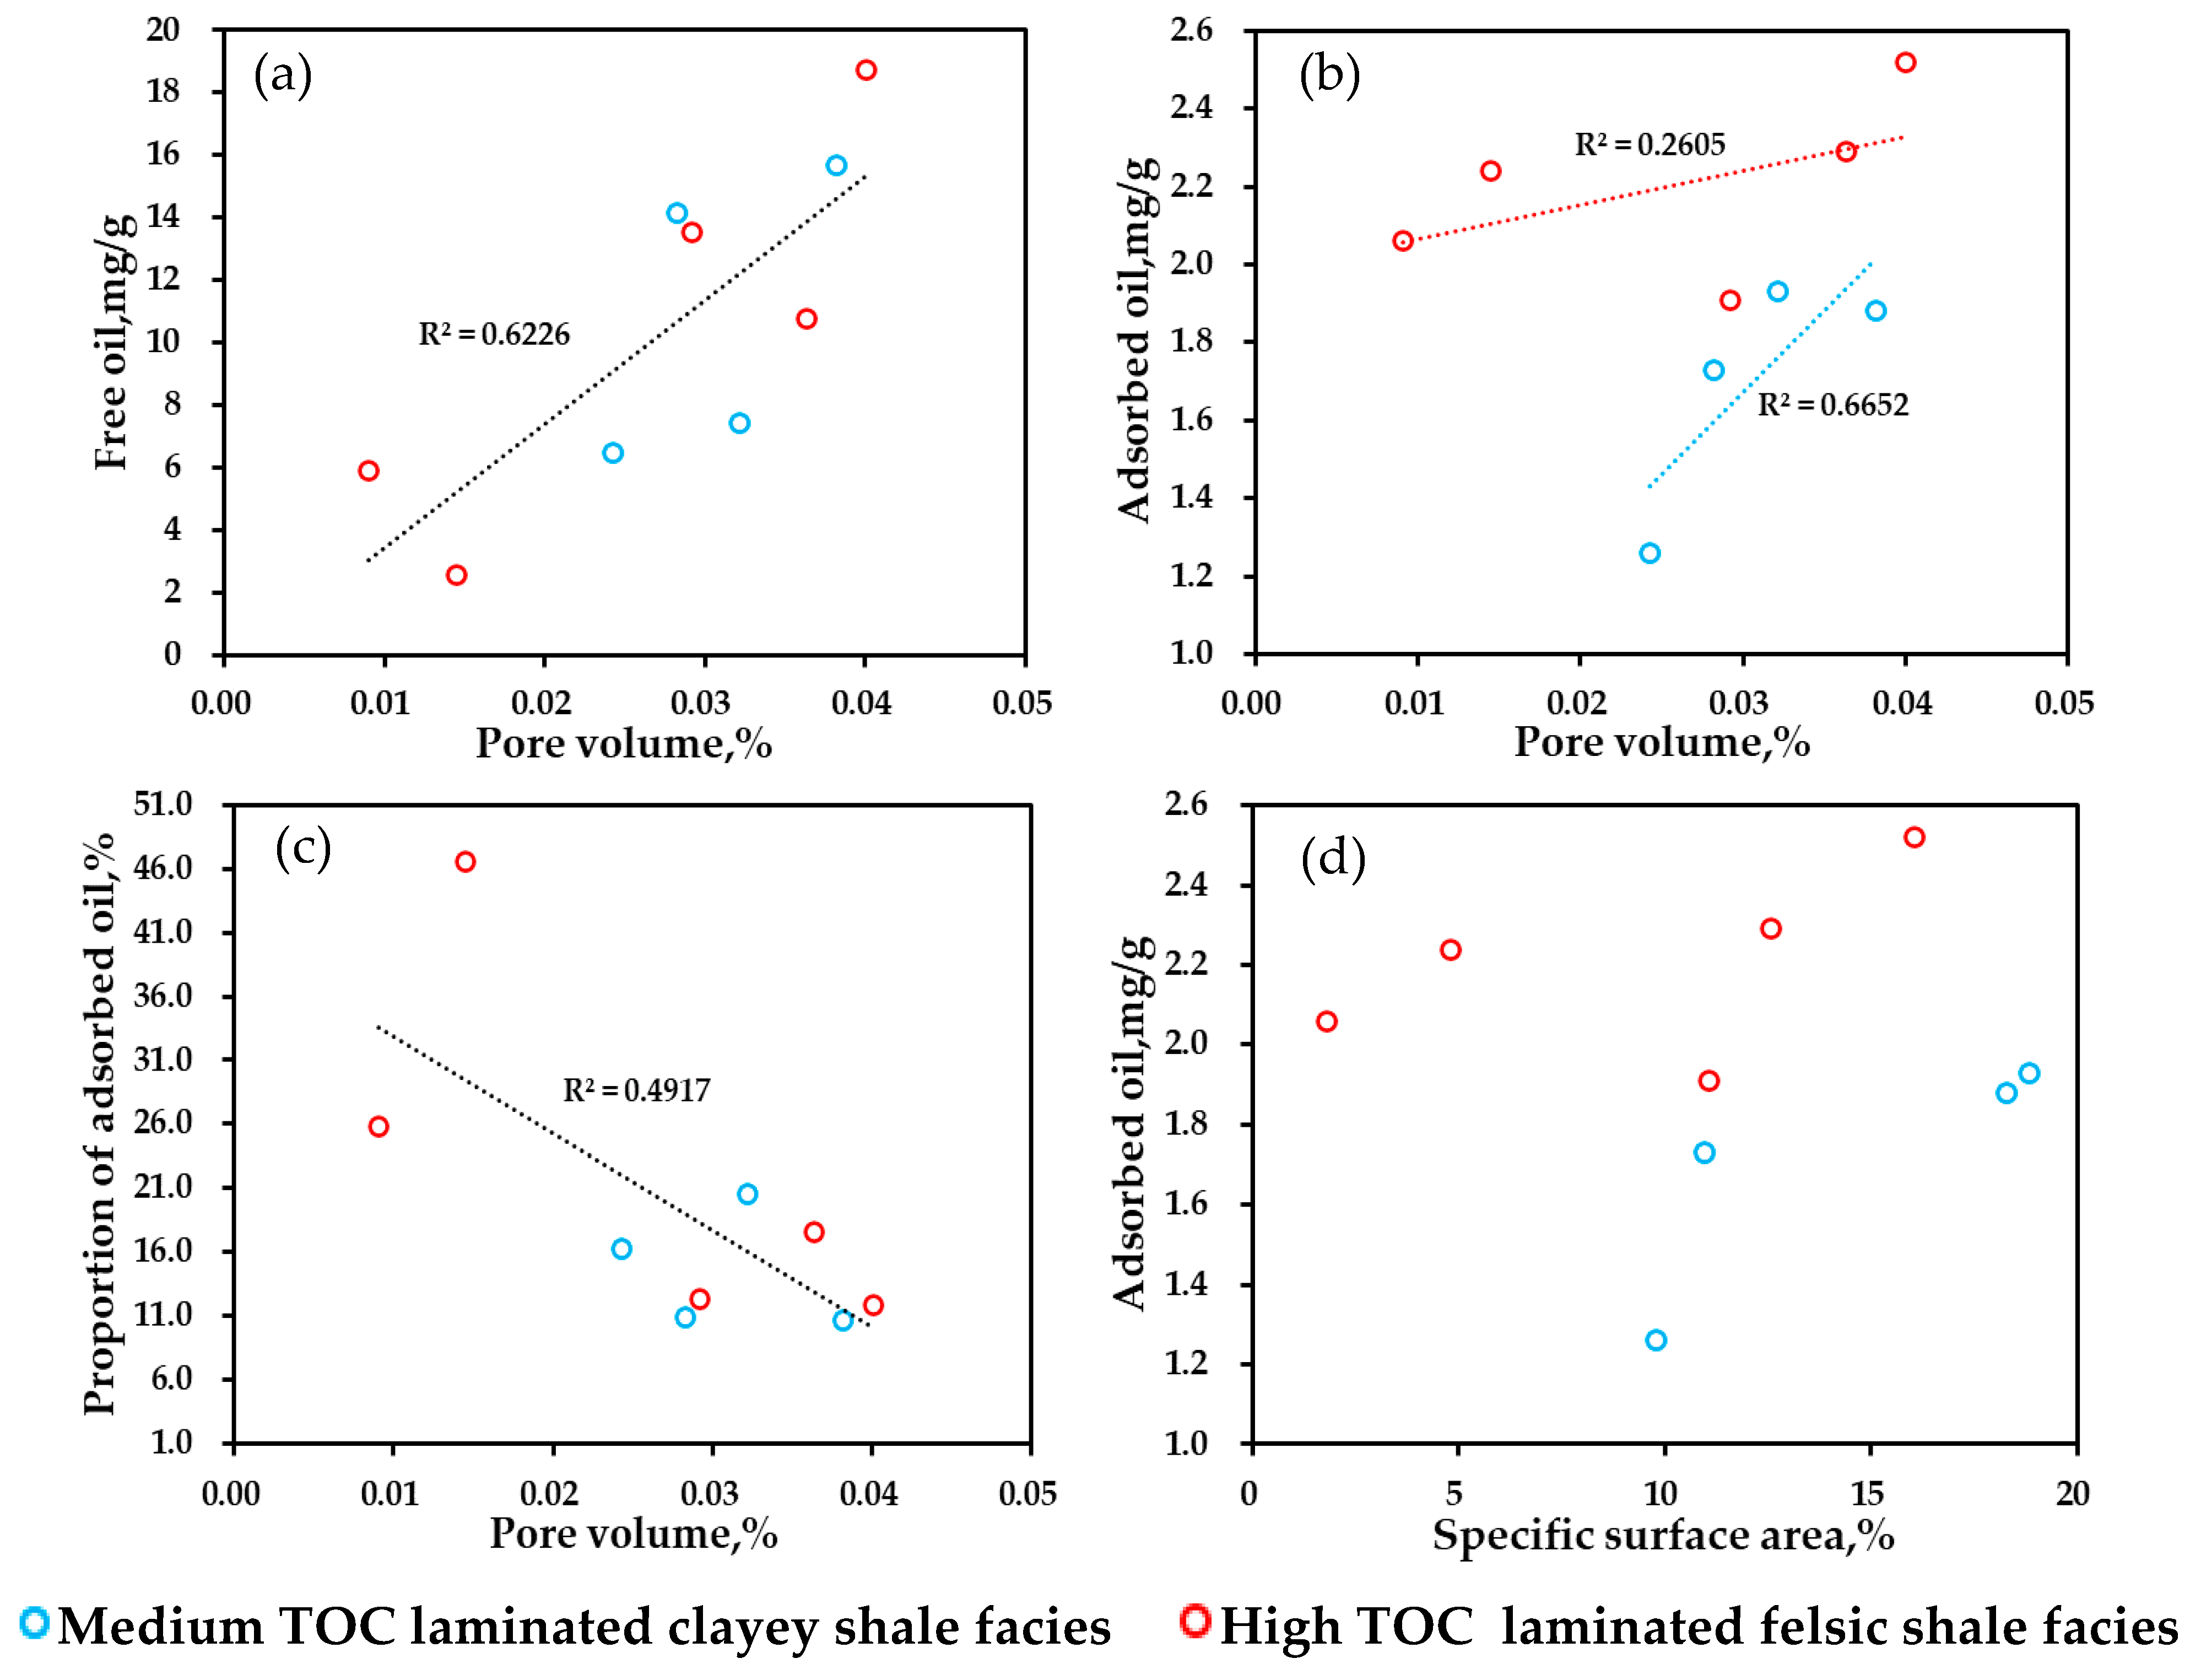
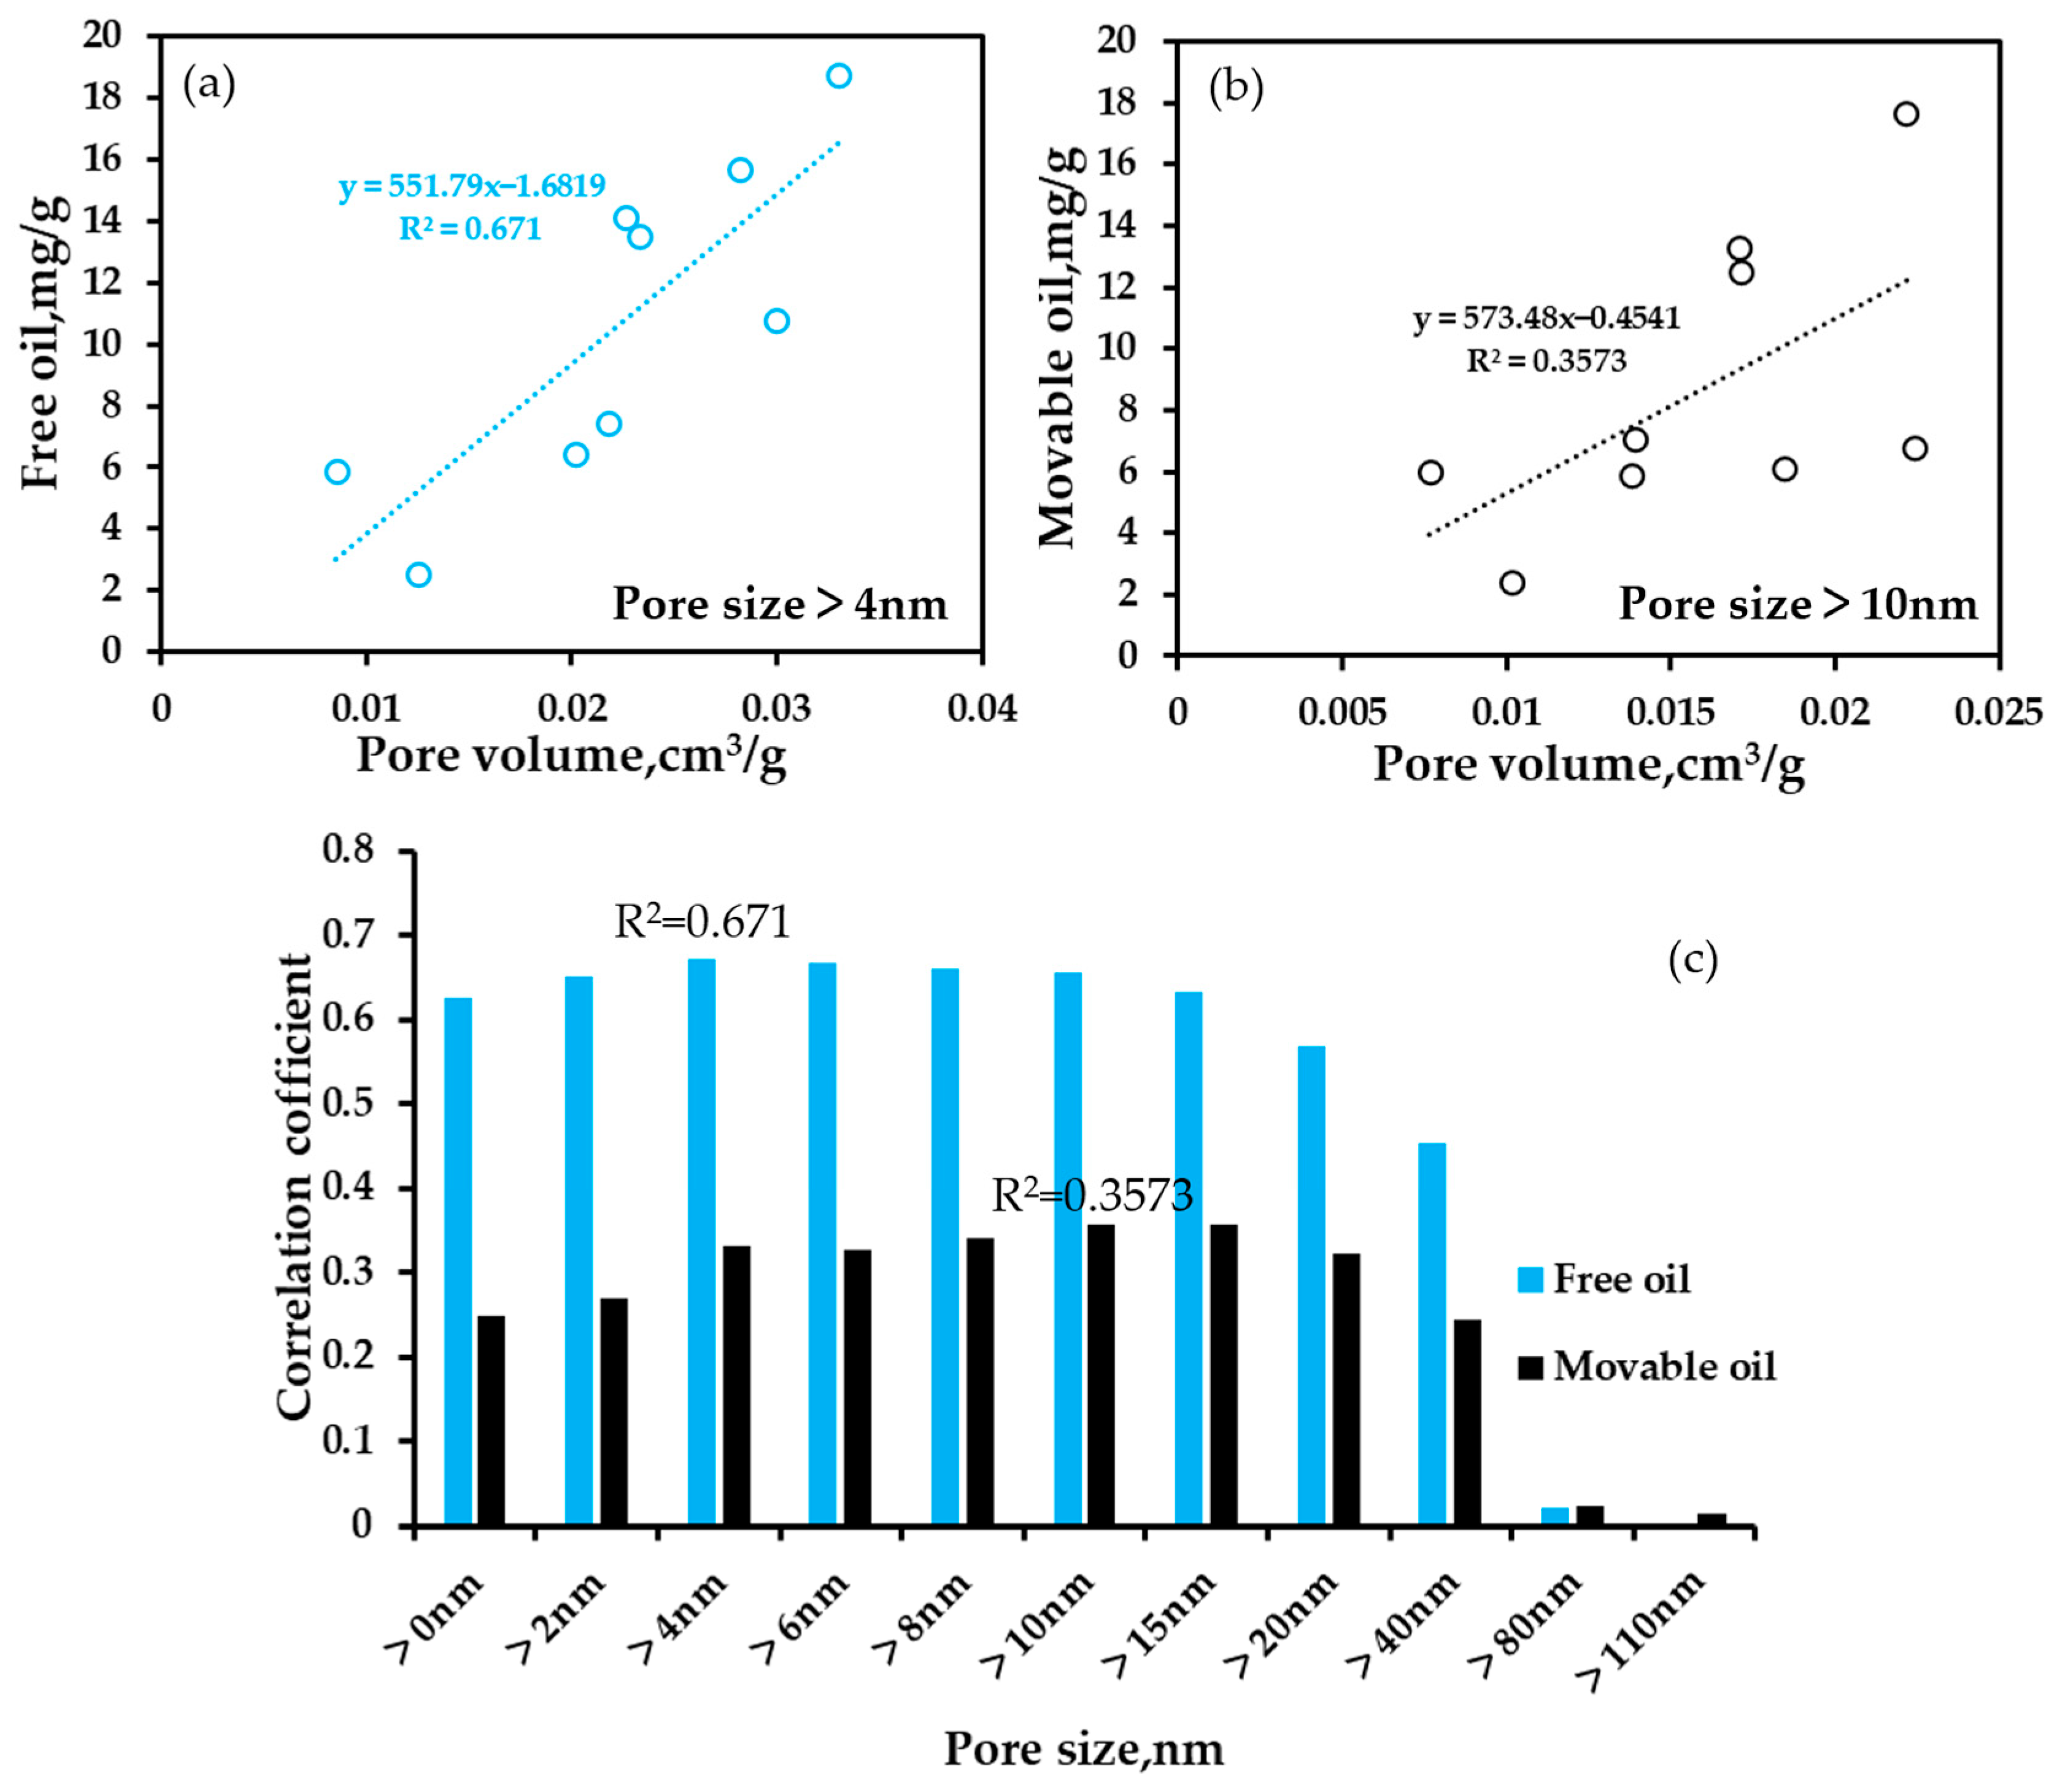
5.3.4. Control of the Pore Size and Pore Volume on Shale Oil

The pore size distribution range of the Gulong shale is large; they are mainly nanopores and a few micropores, so the average pore size is not representative when characterizing the shale pore size. Therefore, the pore volume is used to explore its factors. With increasing pore volume, the content of free oil increases (Figure 13a), and the content of adsorbed oil also increases (Figure 13b), but the proportion of adsorbed oil decreases (Figure 13c); that is, the content of free oil has a relatively high growth rate per unit pore volume, so the proportion of mobile oil in shale oil increases. The relationship between adsorbed oil and the specific surface area is complicated (Figure 13d). On the one hand, the selected samples in this paper have high maturity. As mentioned above, when Ro is greater than 1.2%, a large amount of adsorption oil cracks and transforms, resulting in an increasing content of free oil. On the other hand, lacustrine shale pores show mixed wetting characteristics, and some clay minerals do not adsorb hydrocarbons on the surface because of water wetting, so the correlation between the specific surface area and adsorbed oil content is poor [74].

5.4. Lower Limit of the Pore Size of Shale Oil

With increasing pore volume, the proportion of adsorbed oil gradually decreases, and the proportion of free oil and mobile oil gradually increases (mobile oil is defined as the part of oil corrected for free oil minus heavy hydrocarbons). By using the method of Wang Min et al. (2015) [75] to infer the possible pore diameter of shale oil occurrence by statistical principles, the lower limit of the pore diameter of shale oil occurrence in Q1 was determined. The cumulative values of pore volumes under different pore sizes obtained by nitrogen adsorption were used to establish the correlation coefficients with free oil and mobile oil (Figure 14a,b) and the table showing the distribution relationship, respectively. According to the statistical results (Table 4), the correlation between free oil and mobile oil and pore volume gradually increases with the gradual increase in the pore size, and the correlation coefficient of free oil reaches a peak value of 0.671 when the pore size reaches 4 nm and then gradually decreases. The correlation coefficient of movable oil reaches a peak value of 0.3573 when the pore diameter is 10 nm and then gradually decreases. In other words, free oil may accumulate in pores larger than 4 nm, accounting for 81% of the total pore volume, which is similar to previous research results [52,75]. However, mobile oil accumulates in pores larger than 10 nm, occupying 60% of the total pore volume (Figure 14c).
Notably, no correlation coefficients exceed 0.68, indicating that shale oil with different occurrence states is affected by factors other than the pore size. The peak correlation coefficient between the mobile oil and the pore volume is only 0.3573, which may be caused by the low correlation due to the lack of maturity when selecting the heavy hydrocarbon correction coefficient.

6. Conclusions

Through XRD, FE-SEM and TOC analyses and before and after extraction pyrolysis experiments, the mineral composition, pore genesis, pore size distribution, factors influencing the pore volume and factors influencing Q1 in the Gulong Sag, Songliao Basin, as well as the factors influencing shale oil in different occurrence states and the lower limit of pore size occurrence, were studied, which has significance for shale oil sweet spot identification and prediction. The following can be concluded:
(1) The main mineral components of laminated shale in Q1 in the Gulong Depression are quartz, feldspar, carbonate and clay minerals. Clay minerals account for the highest proportion, followed by quartz. The lithofacies are divided into laminated clayey shale facies with moderate TOC contents and laminated felsic shale facies with high TOC contents.
(2) The pore types of laminated shale in Q1 in the Gulong Depression can be divided into interparticle pores, intraparticle pores, organic matter pores and microfractures. Pores with a variety of scales are developed, including micropores, mesopores and macropores. The pore shapes are mainly slit-shaped pores, parallel-plate-shaped pores and ink-bottle-shaped pores. The pore sizes are mainly distributed in the ranges of 5~6 nm and 10~20 nm, and the pore volume contribution is the largest in the range of 10~20 nm. The pore diameter distribution has little change before and after extraction, and the difference is that the pore size increases or decreases before and after extraction.
(3) The content of quartz is negatively correlated with the volume of micropores and macropores. The correlation of quartz content with the mesopore pore volume is first positive and then negative. The content of feldspar has a strong positive correlation with both micropores and mesopores, while the positive correlation between feldspar content macropores is weak, and a negative correlation is possible. Due to the complex composition of carbonate minerals, the correlation with the pore volume of different sizes is weak. The presence of illite and chlorite tends to increase the pore volume for different pore sizes.
(4) The influence of the organic matter content on the pore volume shows a positive correlation trend. However, an increase in organic matter content does not necessarily increase pore volume because the resulting bitumen can also fill and reduce pores. The influence of maturity on the pore volume is complicated, and different maturity stages have different influences on the pore volume.
(5) TOC and Ro are the main factors controlling the distributions of free oil and adsorbed oil, while the mineral composition has a limited controlling effect on shale oil and affects and changes the pore structure to produce different effects on shale oil. With increasing pore volume, the content of free oil increases, and the content of adsorbed oil also increases, but the proportion of adsorbed oil decreases.
(6) At normal temperature and pressure, the lower limit of the pore size of free oil is approximately 4 nm, and the lower limit of the pore size of movable oil is approximately 10 nm.

Author Contributions

Conceptualization, Y.B.; methodology, Y.B.; software, Y.B., Y.Z. (Yuxuan Zhang) and G.C.; formal analysis, Y.Z. (Yuxuan Zhang); investigation, Y.B. and Y.Z. (Yuxuan Zhang); data curation, Y.Z. (Yuxuan Zhang) and H.P.; writing—original draft preparation, Y.Z. (Yuxuan Zhang); writing—review and editing, Y.B.; visualization, Y.Z. (Yuxuan Zhang) and Y.Z. (Yang Zhang); supervision, Y.B. and J.L.; project administration, Y.B. and J.L. All authors have read and agreed to the published version of the manuscript.

Funding

This work was supported by the National Natural Science Foundation of China (No.: 42372155), the Key Laboratory of the Education Department of Shaanxi Province (No.: 18JS090) and the Natural Science Foundation of Shaanxi Province (No.: 2017JM4014).

Data Availability Statement

Not applicable.

Conflicts of Interest

The authors declare no conflict of interest.

References

  1. Zou, C.; Zhu, R.; Wu, S.; Yang, Z.; Tao, S.; Yuan, X.; Hou, L.; Yang, H.; Xu, C.; Li, D.; et al. Types, characteristics, genesis and prospects of conventional and unconventional hydrocarbon accumulations: Taking tight oil and tight gas in China as an instance. Shiyou Xuebao/Acta Pet. Sin. 2012, 33, 173–187. [Google Scholar]
  2. Soeder, D.J. The successful development of gas and oil resources from shales in North America. J. Pet. Sci. Eng. 2018, 163, 399–420. [Google Scholar] [CrossRef]
  3. Cardott, B.J. Thermal maturity of Woodford Shale gas and oil plays, Oklahoma, USA. Int. J. Coal Geol. 2012, 103, 109–119. [Google Scholar] [CrossRef]
  4. Wang, P.; Chen, Z.; Jin, Z.; Jiang, C.; Sun, M.; Guo, Y.; Chen, X.; Jia, Z. Shale oil and gas resources in organic pores of the Devonian Duvernay Shale, Western Canada Sedimentary Basin based on petroleum system modeling. J. Nat. Gas Sci. Eng. 2018, 50, 33–42. [Google Scholar] [CrossRef]
  5. Curiale, J.A.; Curtis, J.B. Organic geochemical applications to the exploration for source-rock reservoirs—A review. J. Unconv. Oil Gas Resour. 2016, 13, 1–31. [Google Scholar] [CrossRef]
  6. Zou, C.; Dong, D.; Wang, Y.; Li, X.; Huang, J.; Wang, S.; Guan, Q.; Zhang, C.; Wang, H.; Liu, H.; et al. Shale gas in China: Characteristics, challenges and prospects (I). Pet. Explor. Dev. 2015, 42, 753–767. [Google Scholar] [CrossRef]
  7. Zou, C.; Yang, Z.; Dong, D.; Zhao, Q.; Chen, Z.; Feng, Y.; Li, J.; Wang, X. Formation, Distribution and Prospect of Unconventional Hydrocarbons in Source Rock Strata in China. Earth Sci. 2022, 47, 1517–1533. [Google Scholar]
  8. You, J.; Liu, Y.; Li, Y.; Zhou, D.; Zheng, Q.; Yang, Y.; Shi, J.; Gao, H. Influencing factor of Chang 7 oil shale of Triassic Yanchang Formation in Ordos Basin: Constraint from hydrothermal fluid. J. Pet. Sci. Eng. 2021, 201, 108532. [Google Scholar] [CrossRef]
  9. Zhang, S.; Liu, C.; Liang, H.; Wang, J.; Bai, J.; Yang, M.; Liu, G.; Huang, H.; Guan, Y. Paleoenvironmental conditions, organic matter accumulation, and unconventional hydrocarbon potential for the Permian Lucaogou Formation organic-rich rocks in Santanghu Basin, NW China. Int. J. Coal. Geol. 2018, 185, 44–60. [Google Scholar] [CrossRef]
  10. Zhao, X.; Pu, X.; Jin, F.; Han, W.; Shi, Z.; Cai, A.; Wang, A.; Guan, Q.; Jiang, W.; Zhang, W. Geological characteristics and key exploration technologies of continental shale oil sweet spots: A case study of Member 2 of Kongdian Formation in the Cangdong sag in the Huanghua depression, Bohai Bay Basin. Pet. Res. 2019, 4, 97–112. [Google Scholar] [CrossRef]
  11. Guowen, Z.H.U.; Xiaojun, W.A.N.G.; Jinyou, Z.; Zhao, L.; Yunfeng, B.; Ying, Z.; Xiuli, F.; Huasen, Z. Enrichment conditions and favorable zones for exploration and development of continental shale oil in Songliao Basin. Acta Pet. Sin. 2023, 44, 110–124. [Google Scholar]
  12. Zhu, R.; Zhang, J.; Li, M.; Cai, Y.; Wu, S.; Liu, C.; Zhang, S.; Kang, Y. Advancesand Key Issues In The Basic Research Of Non-Marine Shale Oil Enrichment. Acta Geol. Sin. 2023. [Google Scholar]
  13. Sun, L.; Liu, H.; He, W.; Li, G.; Zhang, S.; Zhu, R.; Jin, X.; Meng, S.; Jiang, H. An analysis of major scientific problems and research paths of Gulong shale oil in Daqing Oilfield, NE China. Pet. Explor. Dev. 2021, 48, 527–540. [Google Scholar] [CrossRef]
  14. Li, S.Z.; Zhou, Z.; Nie, H.K.; Zhang, L.F.; Song, T.; Liu, W.B.; Li, H.H.; Xu, Q.C.; Wei, S.Y.; Tao, S. Progress, challenges and prospects of unconventional oil and gas development of CNPC. China Pet. Explor. 2022, 27, 1–11. [Google Scholar]
  15. Curtis, J.B. Fractured Shale-Gas Systems. Bulletin 2002, 86, 1865. [Google Scholar] [CrossRef]
  16. Kuila, U.; Prasad, M.; Derkowski, A.; McCarty, D.K. Compositional Controls on Mudrock Pore-Size Distribution: An Example from Niobrara Formation. In Proceedings of the SPE All Days, Presented at the SPE Annual Technical Conference and Exhibition, San Antonio, TX, USA, 8–10 October 2012; p. SPE-160141-MS. [Google Scholar] [CrossRef]
  17. Han, H.; Ding, Z.; Dong, C.; Liu, Y.; Chen, S.; Lu, J.; Xue, Y.; Peng, S.; Gao, Y. Fractal characteristics of bulk-mudrock, washed, and kerogen samples of Chang 7 member mudrocks from the Ordos Basin, China. J. Pet. Sci. Eng. 2018, 170, 592–606. [Google Scholar] [CrossRef]
  18. Mastalerz, M.; Schimmelmann, A.; Drobniak, A.; Chen, Y. Porosity of Devonian and Mississippian New Albany Shale across a maturation gradient: Insights from organic petrology, gas adsorption, and mercury intrusion. AAPG Bull. 2013, 97, 1621–1643. [Google Scholar] [CrossRef]
  19. Wang, X.; Wang, M.; Li, J.; Shao, H.; Deng, Z.; Wu, Y. Thermal maturity: The controlling factor of wettability, pore structure, and oil content in the lacustrine Qingshankou shale, Songliao Basin. J. Pet. Sci. Eng. 2022, 215, 110618. [Google Scholar] [CrossRef]
  20. He, W.; Liu, B.; Zhang, J.; Bai, L.; Tian, S.; Chi, Y. Geological Characteristics and Key Scientific and Technological Problems of Gulong Shale Oil in Songliao Basin. Earth Sci. 2023, 48, 49–62. [Google Scholar]
  21. Feng, Z.; Liu, B.; Shao, H.M.; Wang, C.; Hong, S.X.; Wang, J.P.; Pan, H.F.; Wang, Y.C.; Zhang, A.D.; Tian, S.S. The Diagenesis Evolution and Accumulating Performance of the Mud Shale in Qingshankou Formation in Gulong Area, Songliao Basin; Petroleum Geology & Oilfield Development: Daqing, Chaina, 2020; Volume 39, pp. 72–85. [Google Scholar] [CrossRef]
  22. Zeng, W. Pore structure and shale oil potential of Qingshankou Formation shale in Songliao Basin. Guangzhou Institute of Geochemistry. Chin. Acad. Sci. 2020, 41, 5. [Google Scholar] [CrossRef]
  23. Liu, B.; Nakhaei-Kohani, R.; Bai, L.; Wen, Z.; Gao, Y.; Tian, W.; Yang, L.; Liu, K.; Hemmati-Sarapardeh, A.; Ostadhassan, M. Integrating advanced soft computing techniques with experimental studies for pore structure analysis of Qingshankou shale in Southern Songliao Basin, NE China. Int. J. Coal Geol. 2022, 257, 103998. [Google Scholar] [CrossRef]
  24. Reed, R.M.; Loucks, R.G.; Javie, D.M.; Ruppel, S.C. Morpholosy, Dstiution and Genceis of nanometer scale pores in the Msispp Banett Shale. In Proceedings of the AAPG Convention and Ehibition, San Antonio, TX, USA, 20–23 April 2008. [Google Scholar]
  25. Siever, R. Burial history and diagenetic reaction-kinetics. AAPG Bull. 1983, 67, 684–691. [Google Scholar]
  26. Cao, X. Pore Characteristics and It’s Evolution Law of the Late Cretaceous Qingshankou Formation Shale in the Songliao Basin; China University of Geosciences: Beijing, China, 2020. [Google Scholar] [CrossRef]
  27. Chalmers, G.R.; Bustin, R.M.; Power, L. Apore by any other name Wouldbe As Smal: The Impotnce Ofmeso and microscopy in shale gas capacity. In Proceedings of the AAPG Annual Convention and Exhition, Denver, CO, USA, 7–10 June 2009. [Google Scholar]
  28. Bahadur, J.; Radlinski, A.P.; Melnichenko, Y.B.; Mastalerz, M.; Schimmelmann, A. Smal-agle and ultsasllngle neutron scattering (SANS/USANS) study of New Albany shale: A treatise on microporosity. Energy Fuels 2015, 29, 567–576. [Google Scholar] [CrossRef]
  29. Sun, M. Characteristics of Pore Structure and Its Constrainson Gas Accumulation and Migration in Marine Shaleof South China; China University of Geosciences: Beijing, China, 2017. [Google Scholar]
  30. Wu, S.; Zou, C.; Zhu, R.; Yuan, X.; Yao, J.; Yang, Z.; Sun, L.; Bai, B. Reservoir Quality Characterization of Upper Triassic Chang 7 Shale in Ordos Basin. Earth Sci. 2015, 40, 1810–1823. [Google Scholar] [CrossRef]
  31. Zou, C.; Yang, Z.; Cui, J.; Zhu, R.; Hou, L.; Tao, S.; Yuan, X.; Wu, S.; Lin, S.; Wang, L.; et al. Formation mechanism, geological characteristics and development strategy of nonmarine shale oil in China. Pet. Explor. Dev. 2013, 40, 15–27. [Google Scholar] [CrossRef]
  32. Wang, X.J.; Ning, F.X.; Hao, X.F.; Wang, Y.; Yang, W.Q.; Yin, Y. Paleogene shale oil occurrence features: A case of Jiyang depression. Sci. Technol. Eng. 2017, 17, 39–48. [Google Scholar]
  33. Sun, C.; Yao, S.; Li, J.; Liu, B.; Liu, H.; Xie, Z. Characteristics of pore structure and effectiveness of shale oil reservoir space in Dongying Sag, Jiyang Depression, Bohai Bay Basin. J. Nanosci. Nanotechnol. 2017, 17, 6781–6790. [Google Scholar] [CrossRef]
  34. Bao, Y. Effective reservoir spaces of Paleogene shale oil in the Dongying Depression, Bohai Bay Basin. Pet. Geol. Exp. 2018, 40, 479–484. [Google Scholar] [CrossRef]
  35. Li, J.; Shi, Y.; Huang, Z.; Wang, W.; Cao, Q.; Lu, S. Pore characteristics of continental shale and its impact on storage of shale oil in northern Songliao Basin. J. China Univ. Pet. (Ed. Nat. Sci.) 2015, 39, 27–34. [Google Scholar]
  36. Shi, J.; Jin, Z.; Liu, Q.; Zhang, T.; Fan, T.; Gao, Z. Laminar Characteristics of Lacustrine Organic-Rich Shales and Their Significance for Shale Reservoir Formation: A Case Study of the Paleogene Shales in the Dongying Sag, Bohai Bay Basin, China. J. Asian Earth Sci. 2021, 223, 104976. [Google Scholar] [CrossRef]
  37. Dang, W.; Zhang, J.; Nie, H.; Wang, F.; Tang, X.; Jiang, S.; Wei, X.; Liu, Q.; Li, P.; Li, F.; et al. Microscopic occurrence characteristics of shale oil and their main controlling factors: A case study of the 3rd submember continental shale of Member 7 of Yanchang Formation in Yanan area, Ordos Basin. Acta Pet. Sin. 2022, 43, 507–523. [Google Scholar]
  38. Song, Z.; Qin, Y.; George, S.C.; Wang, L.; Guo, J.; Feng, Z. A biomarker study of depositional paleoenvironments and source inputs for the massive formation of Upper Cretaceous lacustrine source rocks in the Songliao Basin, China. Palaeogeogr. Palaeoclimatol. Palaeoecol. 2013, 385, 137–151. [Google Scholar] [CrossRef]
  39. Jia, J.; Bechtel, A.; Liu, Z.; Strobl, S.A.; Sun, P.; Sachsenhofer, R.F. Oil shale formation in the Upper Cretaceous Nenjiang Formation of the Songliao Basin (NE China): Implications from organic and inorganic geochemical analyses. Int. J. Coal Geol. 2013, 113, 11–26. [Google Scholar] [CrossRef]
  40. He, W.Y.; Meng, Q.A.; Fu, X.L.; Zheng, Q.; Su, Y.X.; Cui, K.N. Geochemical Study of the Sedimentary Eenvironment and Its Organic Matter Enrichment Mechanism in Qingshankou Formation Shale, Gulong Sag, Songliao Basin. Acta Sedimentol. Sin. 2022. Available online: https://kns.cnki.net/kcms/detail/62.1038.P.20221109.1118.001.html (accessed on 20 August 2023).
  41. Barrett, E.P.; Joyner, L.G.; Halenda, P.P. The Determination of Pore Volume and Area Distributions in Porous Substances. I. Computations from Nitrogen Isotherms. J. Am. Chem. Soc. 1951, 73, 373–380. [Google Scholar] [CrossRef]
  42. Villarroel-Rocha, J.; Barrera, D.; Sapag, K. Introducing a self-consistent test and the corresponding modification in the Barrett, Joyner and Halenda method for pore-size determination. Microporous Mesoporous Mater. 2014, 200, 68–78. [Google Scholar] [CrossRef]
  43. Brunauer, S.; Emmett, P.H.; Teller, E. Adsorption of Gases in Multimolecular Layers. J. Am. Chem. Soc. 1938, 60, 309–319. [Google Scholar] [CrossRef]
  44. Webb, P.A.; Orr, C. Analytical Methods in Fine Particle Technology: Norcross; Micromeritics Instrument Corp.: Norcross, GA, USA, 1997; p. 301. [Google Scholar]
  45. Shi, J.; Jin, Z.; Liu, Q.; Huang, Z. Lithofacies classification and origin of the Eocene lacustrine fine-grained sedimentary rocks in the Jiyang Depression, Bohai Bay Basin, Eastern China. J. Asian Earth Sci. 2020, 194, 104002. [Google Scholar] [CrossRef]
  46. Espitalié, J.; Marquis, F.; Barsony, I. Geochemical Logging. In Analytical Pyrolysis; Elsevier: Amsterdam, The Netherlands, 1984; pp. 276–304. [Google Scholar] [CrossRef]
  47. Bai, L.-H.; Liu, B.; Du, Y.-J.; Wang, B.-Y.; Tian, S.-S.; Wang, L.; Xue, Z.-Q. Distribution characteristics and oil mobility thresholds in lacustrine shale reservoir: Insights from N2 adsorption experiments on samples prior to and following hydrocarbon extraction. Pet. Sci. 2022, 19, 486–497. [Google Scholar] [CrossRef]
  48. Chen, Z.H.; Jiang, C.Q. A revised method for organic porosity estimation in shale reservoirs using Rock-Eval data: Example from Duvernay Formation in the Western Canada Sedimentary Basin. AAPG Bull. 2016, 100, 405–422. [Google Scholar] [CrossRef]
  49. Loucks, R.G.; Reed, R.M.; Ruppel, S.C.; Hammes, U. Spectrum of pore types and networks in mudrocks and a descriptive classification for matrix-related mudrock pores. AAPG Bull. 2012, 96, 1071–1098. [Google Scholar] [CrossRef]
  50. Clarkson, C.R.; Freeman, M.; He, L.; Agamalian, M.; Melnichenko, Y.B.; Mastalerz, M.; Bustin, R.M.; Radliński, A.P.; Blach, T.P. Characterization of tight gas reservoir pore structure using USANS/SANS and gas adsorption analysis. Fuel 2012, 95, 371–385. [Google Scholar] [CrossRef]
  51. Sing, K.S.W. Reporting physisorption data for gas/solid systems with special reference to the determination of surface area and porosity (Recommendations 1984). Pure Appl. Chem. 1985, 57, 603–619. [Google Scholar] [CrossRef]
  52. Thommes, M. Physisorption of gases, with special reference to the evaluation of surface area and pore size distribution (IUPAC Technical Report). Chem. Int. 2016, 38, 25. [Google Scholar] [CrossRef]
  53. Wang, M.; Ma, R.; Li, J.; Lu, S.; Li, C.; Guo, Z.; LI, Z. Occurrence mechanism of lacustrine shale oil in the Paleogene Shahejie Formation of Jiyang Depression, Bohai Bay Basin, China. Pet. Explor. Dev. 2019, 46, 789–802. [Google Scholar] [CrossRef]
  54. Fu, H.; Wang, X.; Zhang, L.; Gao, R.; Li, Z.; Xu, T.; Zhu, X.; Xu, W.; Li, Q. Investigation of the factors that control the development of pore structure in lacustrine shale: A case study of block X in the Ordos Basin, China. J. Nat. Gas Sci. Eng. 2015, 26, 1422–1432. [Google Scholar] [CrossRef]
  55. Ross, D.J.K.; Marc Bustin, R. The importance of shale composition and pore structure upon gas storage potential of shale gas reservoirs. Mar. Pet. Geol. 2009, 26, 916–927. [Google Scholar] [CrossRef]
  56. Liu, B.; Wang, Y.; Tian, S.; Guo, Y.; Wang, L.; Yasin, Q.; Yang, J. Impact of thermal maturity on the diagenesis and porosity of lacustrine oil-prone shales: Insights from natural shale samples with thermal maturation in the oil generation window. Int. J. Coal Geol. 2022, 261, 104079. [Google Scholar] [CrossRef]
  57. Shao, H.; Gao, B.; Pan, H.; Chen, G.; Li, L. Diagenesis-pore evolution for Gulong shale in Songliao Basin. Pet. Geol. Oilfield Dev. Daqing. 2021, 40, 56–67. [Google Scholar]
  58. Huang, X.; Duan, D.; Liu, B.; Li, B.; Ding, F. Origin Mechanism of Chlorite and Its Impact on Reservoir Properties in Huagang Formation, Xihu Depression. J. Jilin Univ. (Earth Sci. Ed.) 2021, 51, 669–679. [Google Scholar] [CrossRef]
  59. He, W.; Wang, M.; Wang, X.; Meng, Q.; Wu, Y.; Lin, T.; Li, J.; Zhang, J. Pore Structure Characteristics and Affecting Factors of Shale in the First Member of the Qingshankou Formation in the Gulong Sag, Songliao Basin. ACS Omega 2022, 7, 35755–35773. [Google Scholar] [CrossRef]
  60. Guo, H.; Jia, W.; Peng, P.; Zeng, J.; He, R. Evolution of organic matter and nanometer-scale pores in an artificially matured shale undergoing two distinct types of pyrolysis: A study of the Yanchang Shale with Type II kerogen. Org. Geochem. 2017, 105, 56–66. [Google Scholar] [CrossRef]
  61. Chen, J.; Xiao, X. Evolution of nanoporosity in organic-rich shales during thermal maturation. Fuel 2014, 129, 173–181. [Google Scholar] [CrossRef]
  62. Zhong, L.W.; Zhang, H.; Yuan, Z.R.; Lei, C.L. Influence of specific pore area and 1 pore volume of coal on adsorption capacity. Coal Geol. Explor. 2002, 30, 26–28. [Google Scholar]
  63. Huo, Q.; Zeng, H.; Fu, L. Accumulating characteristics and pore evolution for Member Qing-1 mud shale in North Songliao Basin. Pet. Geol. Oilfield Dev. Daqing 2019, 38, 1–8. [Google Scholar]
  64. Huang, W.; Zhou, X.P.; Liu, J.Y.; He, T.T. Characteristics and controlling factors of pore structure of shale in the seventh member of Yanchang Formation in Huachi area, Ordos Basin. Nat. Gas Geosci. 2022, 33, 1951–1968. [Google Scholar] [CrossRef]
  65. Li, J.; Jiang, C.; Wang, M.; Lu, S.; Chen, Z.; Chen, G.; Li, J.; Li, Z.; Lu, S. Adsorbed and free hydrocarbons in unconventional shale reservoir: A new insight from NMR T1–T2 maps. Mar. Pet. Geol. 2020, 116, 104311. [Google Scholar] [CrossRef]
  66. Qian, M.; Jiang, Q.; Li, M.; Li, Z.; Liu, P.; Ma, Y.; Cao, T. Quantitative characterization of extractable organic matter in lacustrine shale with different occurrences. Pet. Geol. Exp. 2017, 39, 278–286. [Google Scholar] [CrossRef]
  67. Jiang, Q.; Li, M.; Qian, M.; Li, Z.; Li, Z.; Huang, Z.; Zhang, C.; Ma, Y. Quantitative characterization of shale oil in different occurrence states and its application. Pet. Geol. Exp. 2016, 38, 842–849. [Google Scholar] [CrossRef]
  68. Tingting, C.; Qigui, J.; Menhui, Q.; Peng, L.; Zhiming, L.; Guoliang, T.; Maowen, L. Key technologies for pyrolysis analysis of shale oil contentLJD. Acta Pet. Sin. 2023, 4442, 329–3384. [Google Scholar]
  69. Wang, M.; Li, M.; Li, J.; Xu, L.; Shao, H.; Yu, C. Ll Tingting. Comparative anlysis of test methods for shale oil content. Acta Pet. Sinica 2022, 43, 1758–1769. [Google Scholar]
  70. Jarvie, D.M. Shale Resource Systems for Oil and GasPart 2-Shale-oil Resource Systems. In Shale Reservoirs—Giant Resources for the 21st Century; American Association of Petroleum Geologists: Tulsa, OK, USA, 2012. [Google Scholar] [CrossRef]
  71. Zeng, H.; Huo, Q.; Zhang, X. Quantitative analysis on occurrence evolution of Gulong shale oil in Songliao Basin. Pet. Geol. Oilfield Dev. Daqing 2022, 41, 80–90. [Google Scholar]
  72. Tian, S.; Erastova, V.; Lu, S.; Greenwell, H.C.; Underwood, T.R.; Xue, H.; Zeng, F.; Chen, G.; Wu, C.; Zhao, R. Understanding Model Crude Oil Component Interactions on Kaolinite Silicate and Aluminol Surfaces: Toward Improved Understanding of Shale Oil Recovery. Energy Fuels 2018, 32, 1155–1165. [Google Scholar] [CrossRef]
  73. Barclay, S.A.; Worden, R.H. Effects of Reservoir Wettability on Quartz Cementation in Oil Fields. In Quartz Cementation in Sandstones; Worden, R.H., Morad, S., Eds.; Blackwell Publishing Ltd.: Oxford, UK, 2000; pp. 103–117. [Google Scholar] [CrossRef]
  74. Zeng, W.; Song, Z.; Zhou, G. Pore structure of Qingshankou Formation shales in Songliao Basin and its geological sgnificance. J. China Univ. Pet. (Ed. Nat. Sci.) 2021, 45, 35–41. [Google Scholar]
  75. Wang, M.; Yang, J.; Wang, Z.; Lu, S. Nanometer-Scale Pore Characteristics of Lacustrine Shale, Songliao Basin, NE China. PLoS ONE 2015, 10, e0135252. [Google Scholar] [CrossRef] [PubMed]
Figure 1. (a) Geographic location and first-order structural unit map of the Songliao Basin. (b) Location map of the secondary structural unit and study area in the central depression of the Songliao Basin. (c) Lithologic profile of Q1 in well N in the study area.
Minerals 13 01220 g001
Figure 2. Mineral composition of laminated shale in Q1 in the Gulong Sag, Songliao Basin. (a) Lithologic ternary diagram (modified and simplified from Shi et al., 2019 [45]): I—clayey shale facies, II—mixed shale facies, III—felsic shale facies, IV—lime-dolostone shale facies. (b) Histogram of the mineral contents. (c) Histogram of the clay mineral contents.
Minerals 13 01220 g002
Figure 3. Map showing the organic matter type of laminated shale in Q1 of the Gulong Sag, Songliao Basin.
Minerals 13 01220 g003
Figure 4. FE-SEM image of laminated shale in Q1, Gulong Sag, Songliao Basin. (a) M1 sample: laminated clayey shale facies with a moderate TOC content, Ro = 1.23% and burial depth of 2198.21 m. (b) M2 sample: laminated clayey shale facies with a moderate TOC content, Ro = 1.29% and burial depth of 2263.63 m. (c) Sample Y2: laminated felsic shale facies with a high TOC content, Ro = 1.06% and burial depth of 2375.61 m. (df) Sample N1: laminated felsic shale facies with a high TOC content, Ro = 1.35% and burial depth of 2335.62 m.
Minerals 13 01220 g004
Figure 5. Before and after extraction: isothermal adsorption–desorption curve of Q1 shale in the Gulong Sag, Songliao Basin. (ai) Isothermal adsorption-desorption curves of M1—Y2 samples before and after extraction.
Minerals 13 01220 g005
Figure 6. (a) Pore volume distribution with different pore sizes of laminated shale in Q1 of the Gulong Sag, Songliao Basin. (b) Average pore diameter histogram of laminated shale in Q1 in the Gulong Sag, Songliao Basin. (c) Pore size distribution of laminated shale in Q1 in the Gulong Sag, Songliao Basin.
Minerals 13 01220 g006
Figure 7. Pore size distribution of shale before and after extraction in Q1 of the Gulong Sag, Songliao Basin. (ai) Pore size distribution of M1—Y2 before and after extraction.
Minerals 13 01220 g007
Figure 8. Figure showing the factors influencing the pore volume of laminated shale in Q1 of the Gulong Sag, Songliao Basin. (a) Correlation between quartz content and pore volume of medium TOC laminated clayey shale facies; (b) Correlation between feldspar content and pore volume of medium TOC laminated clayey shale facies; (c) Correlation between carbonate minerals content and pore volume of medium TOC laminated clayey shale facies; (d) Correlation between illite content and pore volume of medium TOC laminated clayey shale facies; (e) Correlation between Ro and pore volume of medium TOC laminated clayey shale facies; (f) Correlation between TOC content and pore volume of medium TOC laminated clayey shale facies; (g) Correlation between Quartz content and pore volume of high TOC laminated felsic shale facies; (h) Correlation between chlorite content and pore volume of high TOC laminated felsic shale facies; (i) Correlation between Ro and pore volume of high TOC laminated felsic shale facies.
Minerals 13 01220 g008
Figure 9. Total oil content and light hydrocarbon recovery coefficient of lacustrine facies shale with different maturities (modified from Wang et al., 2022) [69].
Minerals 13 01220 g009
Figure 10. (a) Correlation graphs of free oil obtained by different calculation methods. (b) Correlation diagram of adsorbed oil obtained by different calculation methods. Note: Mop—the results were calculated using the method in this paper; Mow—the results were calculated using the method of Wang Min.
Minerals 13 01220 g010
Figure 11. Correlations between (a) free oil and TOC content; (b) adsorbed oil and TOC content; (c) free oil and Ro; and (d) adsorbed oil and Ro.
Minerals 13 01220 g011
Figure 12. Correlations between (a) free oil and felsic minerals; (b) adsorbed oil and felsic minerals; (c) free oil and carbonate minerals; (d) adsorbed oil and carbonate minerals; (e) free oil and clay minerals; and (f) adsorbed oil and clay minerals.
Minerals 13 01220 g012
Figure 13. Correlations between (a) free oil and pore volume and (b) adsorbed oil and pore volume; (c) the proportion of adsorbed oil and pore volume; and (d) adsorbed oil and the specific surface area.
Minerals 13 01220 g013
Figure 14. (a) Volume of pores with diameters > 4 nm vs. free oil. (b) Volume of pores with diameters >10 nm vs. movable oil. (c) Histogram of the correlation coefficient between free oil and adsorbed oil for different pore sizes.
Minerals 13 01220 g014
Table 1. Mineral composition of laminated shale in Q1 in the Gulong Sag, Songliao Basin.
SampleDepth (m)Relative Percent of Minerals (wt.%)Relative Percent of Clay (wt.%)
QuartzFeldsparCalciteDolomiteSideritePyriteClayIlliteKaoliniteChloriteI/S
M12198.2124.518.20.06.10.62.947.7743221
M22262.6329.19.90.00.44.73.652.3732321
N22347.2428.213.30.02.80.02.75390190
S12503.621.710.51.12.80.021.842.195140
S22518.625.225.317.33.00.04.125.184169
X12175.1429.926.70.04.63.62.233.094006
N12335.6226.825.50.85.10.01.440.490154
Y12325.129.321.81.60.21.72.842.6651232
Y22375.6123.925.62.61.10.92.343.6851411
Table 2. Geochemical characteristics of laminated shale in Q1, Gulong Sag, Songliao Basin.
SampleDepth
(m)
Ro
(%)
Rock-Eval (Original)Rock-Eval (Extracted)
TOC
(wt.%)
Tmax
(°C)
S1
(mg HC/g)
S2
(mg HC/g)
HI
(mg HC/g)
TOC
(wt.%)
Tmax
(°C)
S1
(mg HC/g)
S2
(mg HC/g)
HI
(mg HC/g)
M12198.211.231.934471.675.132661.554520.062.12137
M22262.631.291.733912.485.743321.174440.051.0388
N22347.241.331.884042.74.152211.54460.030.5738
S12503.61.51.262971.550.59471.024260.110.1818
S22518.61.512.013962.964.592401.554510.040.5133
X12175.140.872.244451.1818.448231.994470.0115.35771
N12335.621.352.523833.144.281702.094600.030.7134
Y12325.11.052.064441.6910.375031.614440.16.48402
Y22375.611.062.294173.265.852551.714580.050.9857
Table 3. Table of free oil and adsorbed oil contents of laminated shale in Q1 of the Gulong Sag, Songliao Basin.
Method of This PaperMethod of Wang Min
SampleTOCRoS1oS2o − S2eOSIFree OilAdsorbed OilTotal Oil ContentFree OilAdsorbed Oil
M11.931.231.673.01155.967.451.939.176.372.80
M21.731.292.484.71272.2514.131.7314.7611.153.60
N21.881.332.703.58190.4315.681.8817.8413.983.86
S11.261.501.550.4132.546.461.268.836.462.37
S22.011.512.964.08213.6113.521.9115.9111.354.56
X12.240.871.183.09137.952.572.244.881.723.16
N12.521.353.143.57141.6718.752.5221.7917.704.09
Y12.061.051.693.89188.835.912.067.974.083.89
Y22.291.063.264.87212.6610.762.2915.458.187.27
Table 4. Comparison between the free and mobile oil contents and pore volume for different pore sizes.
Volume of Pores with Diameters > Pore Size (nm)
SampleFree Oil (mg/g)Movable Oil (mg/g)024681015204080110
M17.4515.9130.0320.0290.0220.0190.0160.0140.0110.0090.0050.0020.002
M214.13413.3130.0280.0270.0230.0210.0190.0170.0140.0130.0080.0040.003
N215.6766.1080.0380.0360.0280.0250.0210.0180.0150.0130.0080.0030.002
S16.4647.0480.0240.0230.0200.0180.0150.0140.0110.0100.0070.0040.003
S213.52412.5050.0290.0280.0230.0210.0190.0170.0140.0130.0090.0050.004
X12.5702.4350.0140.0140.0130.0120.0110.0100.0090.0080.0060.0040.003
N118.75217.7020.0400.0380.0330.0280.0240.0220.0180.0160.0100.0030.002
Y15.9075.9820.0090.0090.0080.0080.0080.0080.0070.0060.0050.0030.002
Y210.7636.7770.0360.0350.0300.0280.0240.0220.0190.0170.0120.0060.004
Correlation coefficients (R2)Free oil0.6260.65110.6710.66620.66030.65550.63320.56750.45240.02050.0008
Movable oil0.24780.26960.33230.32630.34020.35730.35550.32280.24290.02330.0133
Average proportion (%)10095817465605046301611
Disclaimer/Publisher’s Note: The statements, opinions and data contained in all publications are solely those of the individual author(s) and contributor(s) and not of MDPI and/or the editor(s). MDPI and/or the editor(s) disclaim responsibility for any injury to people or property resulting from any ideas, methods, instructions or products referred to in the content.

