Article

Revealing the Secrets behind the Color and Sea-Wave Patterns of Larimar

1
Institute of Earth Sciences (Geology Program), Chinese Culture University, Taipei 111396, Taiwan
2
Laboratorio Dominicano de Ámbar y Gemas, Santo Domingo 10149, Dominican Republic
3
Institute of Earth Sciences, National Taiwan Ocean University, Keelung 202301, Taiwan
4
Institute of Earth Sciences, Acdemia Sinica, Taipei 115201, Taiwan
5
Department of Collection Management, National Taiwan Museum, Taipei 100007, Taiwan
6
Department of Geosciences, National Taiwan University, Taipei 106319, Taiwan
7
Research Center for Future Earth, National Taiwan University, Taipei 106319, Taiwan
8
Institute of Mineral Resources Engineering, National Taipei University of Technology, Taipei 106344, Taiwan
*
Author to whom correspondence should be addressed.
Minerals 2023, 13(9), 1221; https://doi.org/10.3390/min13091221
Submission received: 30 July 2023 / Revised: 30 August 2023 / Accepted: 14 September 2023 / Published: 17 September 2023
(This article belongs to the Special Issue Gem Deposits: Mineralogical and Gemological Aspects)

Abstract

:
In the last century, a blue–green colored gemstone known as Larimar with a special sea-wave pattern was discovered in the Dominican Republic. Larimar is composed of the mineral pectolite, which has a chemical composition of NaCa2Si3O8(OH) and is usually white in color. Cu2+ has always been considered to be the primary genesis of the blue color shown in Larimar, because native copper often grows together with Larimar. To clarify whether copper is the main reason for the origin of blue–green pectolite, we utilized laser ablation inductively coupled plasma mass spectrometry (LA-ICP-MS) techniques to analyze trace elements in the pectolite samples and compared the relationship between elements and colors. The results show that vanadium and iron are the main origins of the sky-blue and green color of Larimar. We also discovered that it is not only the chemical elements that affect the color shades of the mineral, but the orientation of the radial fiber crystals also plays a critical role. The sea-wave pattern and the changes in the color saturation of radial pectolite are due to the transmittance of visible light through different viewed angles under changing crystal orientations. Our results reveal the chemical and physical factors behind the color and sea-wave pattern of Larimar. In addition, to our knowledge, this is the first time that the formation age of Larimar has been proven to be approximately equal to or younger than 40 ka, using the U-Th dating of calcite growth together with pectolite.

1. Introduction

In 1974, Miguel Méndez, a jewelry craftsman, met a German woman at his wife’s beauty salon in the Dominican Republic, and she showed him a beautiful unknown blue–green stone. Méndez immediately thought it was turquoise, but the customer told him it was another mineral from the Dominican Republic. The first location where Larimar was discovered by Miguel Méndez and Norman Rilling, a US Peace Corps geologist, was the coast of Playa Bahoruco, Barahona (Figure 1) [1]. Now, the main mining area of this gemstone is in the Filipinas Larimar Mine.
The unknown blue–green stone was sent by Rilling and Méndez to the Smithsonian Institution, who initially told them it was not a naturally occurring mineral. As a second attempt, they sent a larger sample to the Smithsonian Institute. Samples were also sent to institutes in Japan, Russia, Germany, and other countries, which allowed the stone to be confirmed as the mineral pectolite. Méndez took the first two syllables from his daughter’s name, “Larissa”, and combined it with “mar”, which means “ocean” in Spanish, and named this blue–green gemstone “Larimar.”
Mr. Miguel Méndez dictated the discovery story of Larimar to our second author, Yu-Hong Shih, who went to the Dominican Republic to mine amber (Figure 2). He also personally traveled to the Filipinas Larimar Mine, Los Checheses (Figure 1), in the mountains northwest of Baoruco [2,3] and entered the mine for sampling and collection.
In recent years, the blue–green gemstone “Larimar,” with a sea-wave pattern, has appeared in the gemstone market. It has a higher commercial value because of its charming sky-blue color (Figure 3). The most famous deposits of pectolite ores are distributed in Italy, Germany, and Russia in Europe; New Jersey, Nevada, Arkansas, and California in North America; the Dominican Republic, Brazil, and Argentina in Latin America; Japan and India in Asia; Tanzania and Madagascar in Africa; Australia and New Zealand in Oceania, etc. However, the unique blue–green pectolite with a sea-wave pattern and fibrous radial texture occurs only in the Dominican Republic [1,2,4,5,6].
Pectolite is a variety of a single-chain mineral of the pyroxenoid group, with a Mohs hardness of approximately 4.5–5. Pectolite (NaCa2Si3O8(OH)) is generally found in geological contexts very similar to those of zeolites, i.e., in the cavities of hydrothermally altered mafic igneous rocks, including basalts, particularly in those with alkaline affinity [7]. Generally, pectolite can be colorless, white, gray, yellow, etc., and its common crystal habits are platy, prismatic, needle, and radial. A notable, orange-colored pectolite is known as serandite (Na(Mn2+,Ca)2Si3O8(OH)), and it is formed by the substitution of the transition metal ion Mn2+ in the Ca2+ position [8,9]. Due to the presence of native copper particles within the Larimar and the wall rock (Figure 4), Cu2+ ion is considered to be the cause of coloration of the blue–green pectolite, as is the case with other blue–green minerals, such as azurite, shattuckite, turquoise, chrysocolla, etc. In addition, the color shade of the sea-wave pattern is assumed to be dependent on the copper ion concentration [2]. However, in addition to copper, significant concentrations of vanadium have also been detected in Larimar and its wall rock [10,11]. Therefore, the cause of Larimar coloration has yet to be determined. Larimar is only found in the south of the Dominican Republic, in Barahona Province (Figure 1). Pectolite and other minerals fill the cavities or veins in basalt, which can be classified as Ti-depleted tholeites and Ti-rich alkali basalt [12,13]. Basaltic lava flows and pyroclastic flows overlay the limestone formations, or form dikes and disks in the limestone. There were two periods of high magmatic activity in the geologic history of the area: the first occurred at 92–74 Ma, while the second period, which was dominated by the formation of diabase dykes, occurred at approximately 53 Ma. A detailed geological profile of the local area and the mineral composition of the rocks were mentioned by Escuder-Viruete et al. (2016) [13].
The Larimar samples collected for this study occurred as fragments wrapped in laterite (Figure 5), basalt fissure filling (Figure 6), and also as calcite and pectolite that filled plant fossils (Figure 7 and Figure 8). Most of the laterite contains muddy blocks and pyroclastic conglomerates of basaltic and ultramafic rocks, and these conglomerates mainly consist of highly weathered or metasomatic rocks, like hematized rocks (Figure 9) or serpentinite. The hematization is mostly the result of the oxidation of pyroxene and other mafic minerals in the wall rocks [3] caused by oxidative fluids. According to some research, the sea-wave pattern was believed to be related to the plant structures, because the pectolite and calcite filled in the plant fossils (Figure 8) [10]. Studies related to the carbonization of plant fossils associated with Larimar have been published [14]. No one knows why unique blue–green pectolite occurs in this locality or the chemical and physical mechanisms for its blue–green color and the special sea-wave pattern in the spherulitic structure of Larimar. In this study, it is hoped that these thought-provoking questions can be answered.
The Filipinas mine, where Larimar is currently mined, mainly utilizes the tunnel mining method to extract the samples. Figure 10 shows a rough estimate of the proportions of pectolite mined from the different layers of the mine. The pores in the weathered basalt on the surface are mainly filled with white pectolite. As the depth increases, blue–green pectolites gradually appear in a layer where carbonaceous plants (Figure 7 and Figure 8) are also present between altered basalts and paleosol. The abundance of blue and green pectolites increases in the highly weathered red soil and debris layers, which contain more hematite clasts. After passing through the limestone formation beneath the paleosol layer, a basaltic breccia layer appears, and the amount of bluish pectolite decreases again.

2. Materials and Methods

In this study, the mineral composition and fabric textures of a series of samples were preliminarily identified through polarizing microscopy observation. Micro-Raman spectroscopy was used to confirm the mineralogical composition of the mixtures. An ultraviolet–visible (UV–Vis) spectrometer was used to distinguish the hue of Larimar. Finally, SEM–EDS (Scanning Electron Microscopy with Energy-Dispersive X-Ray Spectroscopy) and LA-ICP-MS (Laser Ablation Inductively Coupled Plasma Mass Spectrometry) were used to analyze the chemical variations in the different tone areas. In addition, the chemical compositions of laterite and red basalt were further analyzed by ICP-MS in order to understand whether Larimar’s composition is related to laterite and/or highly oxidized red basalt (Figure 5 and Figure 9). Furthermore, the relationship between the growth of pectolite and the symbiotic calcite was inspected through the observation of thin sections under a polarizing microscope. Calcite dating was also conducted to hypothesize the age of the Larimar formation. The instruments and methods applied in this study were as follows:

2.1. UV–Visible Spectrometer

Color determination was performed using a UV–Visible spectrometer, model RT-100, manufactured by AMA Photonics. The samples were polished to a thickness of 1 mm and then analyzed with transmitted light to confirm the accuracy of color observed with the naked eye.

2.2. Micro-Raman Spectrometer

Micro-mineral analysis was conducted using the LabRAM HR, produced by the Horiba Jobin Yvon Company; the excitation light source was a 532 nm argon-ion laser, the beam diameter was 1 μm, the analysis band range was set to 100–1600 cm−1, and the wavenumber resolution was within ±1 cm−1. Before the experiment, it was necessary to calibrate the Raman characteristic peak at 520 cm−1 with a silicon wafer and confirm that the range offset position was within ±1 cm−1. The obtained data were compared with the Crystal Sleuth software, and the database source was based on the RRUFF database, established by the University of Arizona.

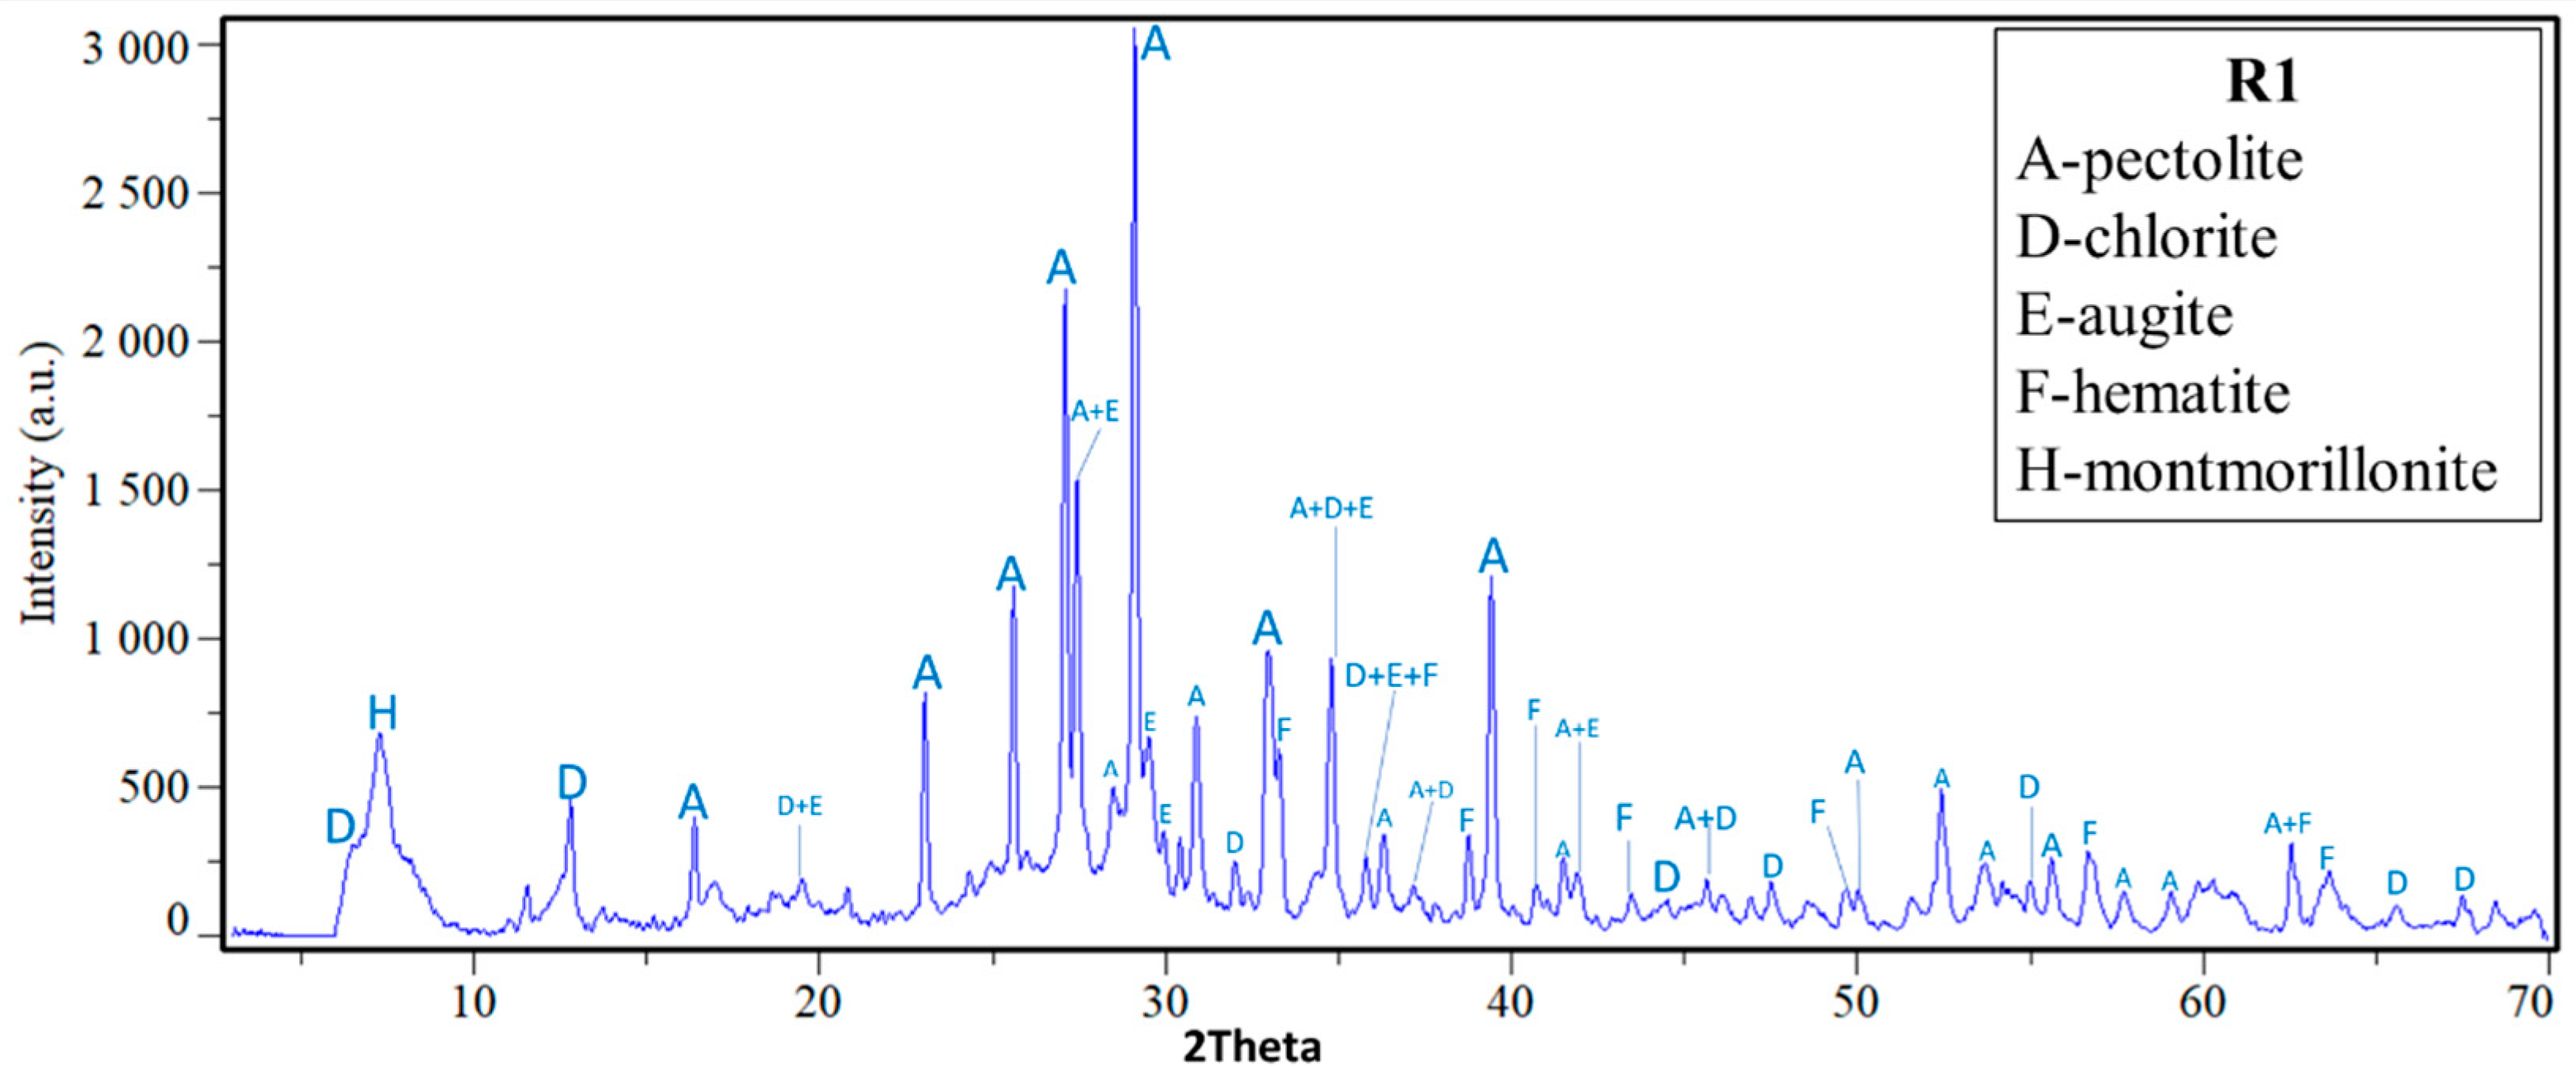
2.3. X-ray Diffractometer (XRD)

Both paleosol and rock fragments were ground to powders. The sample powder was flattened on a holder to be analyzed by the XRD (D2 Phaser, manufactured by the Bruker Company in the United States) with X-ray from a Cu-kα wavelength at 1.5406 Å. The operating conditions were: a voltage of 30 kV, current of 10 mA, 2θ range from 3° to 70°, and scan rates of 4.5°/min and 0.6°/min. The measured data were compared with the database of the International Center for Diffraction Data.

2.4. Scanning Electron Microscope and Energy Dispersive X-ray Spectrometer (SEM–EDS)

Using the FE-SEM Model S-4800 manufactured by Hitachi, the surfaces of each of the samples were plated with platinum (Pt) or carbon (C). A small strip of copper tape was attached to increase conductivity. After identifying the main elements in minerals on single points through EDS, the trace element compositions were then determined using the LA-ICP-MS.

2.5. Laser Ablation Inductively Coupled Plasma Mass Spectrometry (LA-ICP-MS)

LA-ICP-MS was conducted using an Agilent 7900 quadrupole ICP mass spectrometer accompanied by a Photon Machines Analyte G2 laser ablation system from CETAC Technologies at the Institute of Earth Sciences, Academia Sinica. The laser ablation system ablated holes with a diameter of approximately 30 μm on the sample surface, at a laser repetition rate of 5 Hz and an energy density of approximately 6.7 J/cm2. The analyzing time for each spot included 30 s of the background noise for elimination and 70 s of the sample intensity after laser ablation. NIST-610 from the National Institute of Standards and Technology was used as the external standard, and NIST-612 and BCR-2G were used as the reference materials. The percentage of calcium content in the main elements analyzed by EDS was taken as the internal standard for comparison with the contents of other trace elements. Data reduction was performed using the GLITTER 4.4 software immediately following each ablation analysis.

2.6. Inductively Coupled Plasma Mass Spectrometry (ICP-MS)

For this analysis, approximately 0.25 g of the solid powdered sample was digested with an acid solution (2:2:1:1) of HF-HClO3-HClO4 and then dried and re-dissolved in heated 50% HCl again. Finally, the sample was diluted in the HCl solution for ICP-MS analysis. An ICP-MS Perkin Elmer ELAN 9000 Spectrometer was used to analyze the trace elements of the dissolved rock samples.

2.7. U-Th Dating

For dating with the U-Th technique, a powdered sample of intergrown calcite weighing approximately 0.00672 g was extracted (Figure 11) [15,16]. The analysis was conducted in a Class 10,000 geochemistry clean room with Class 1000 benches [17]. Uranium and thorium isotopic compositions and concentrations were determined via multi-collector ICP-MS (MC-ICP-MS), Thermo Fisher NEPTUNE. The decay constants used for age calculation are listed in the study of Cheng et al., 2013. Uncertainties in U-Th data and date are given at the two-sigma (2σ) level.

3. Results

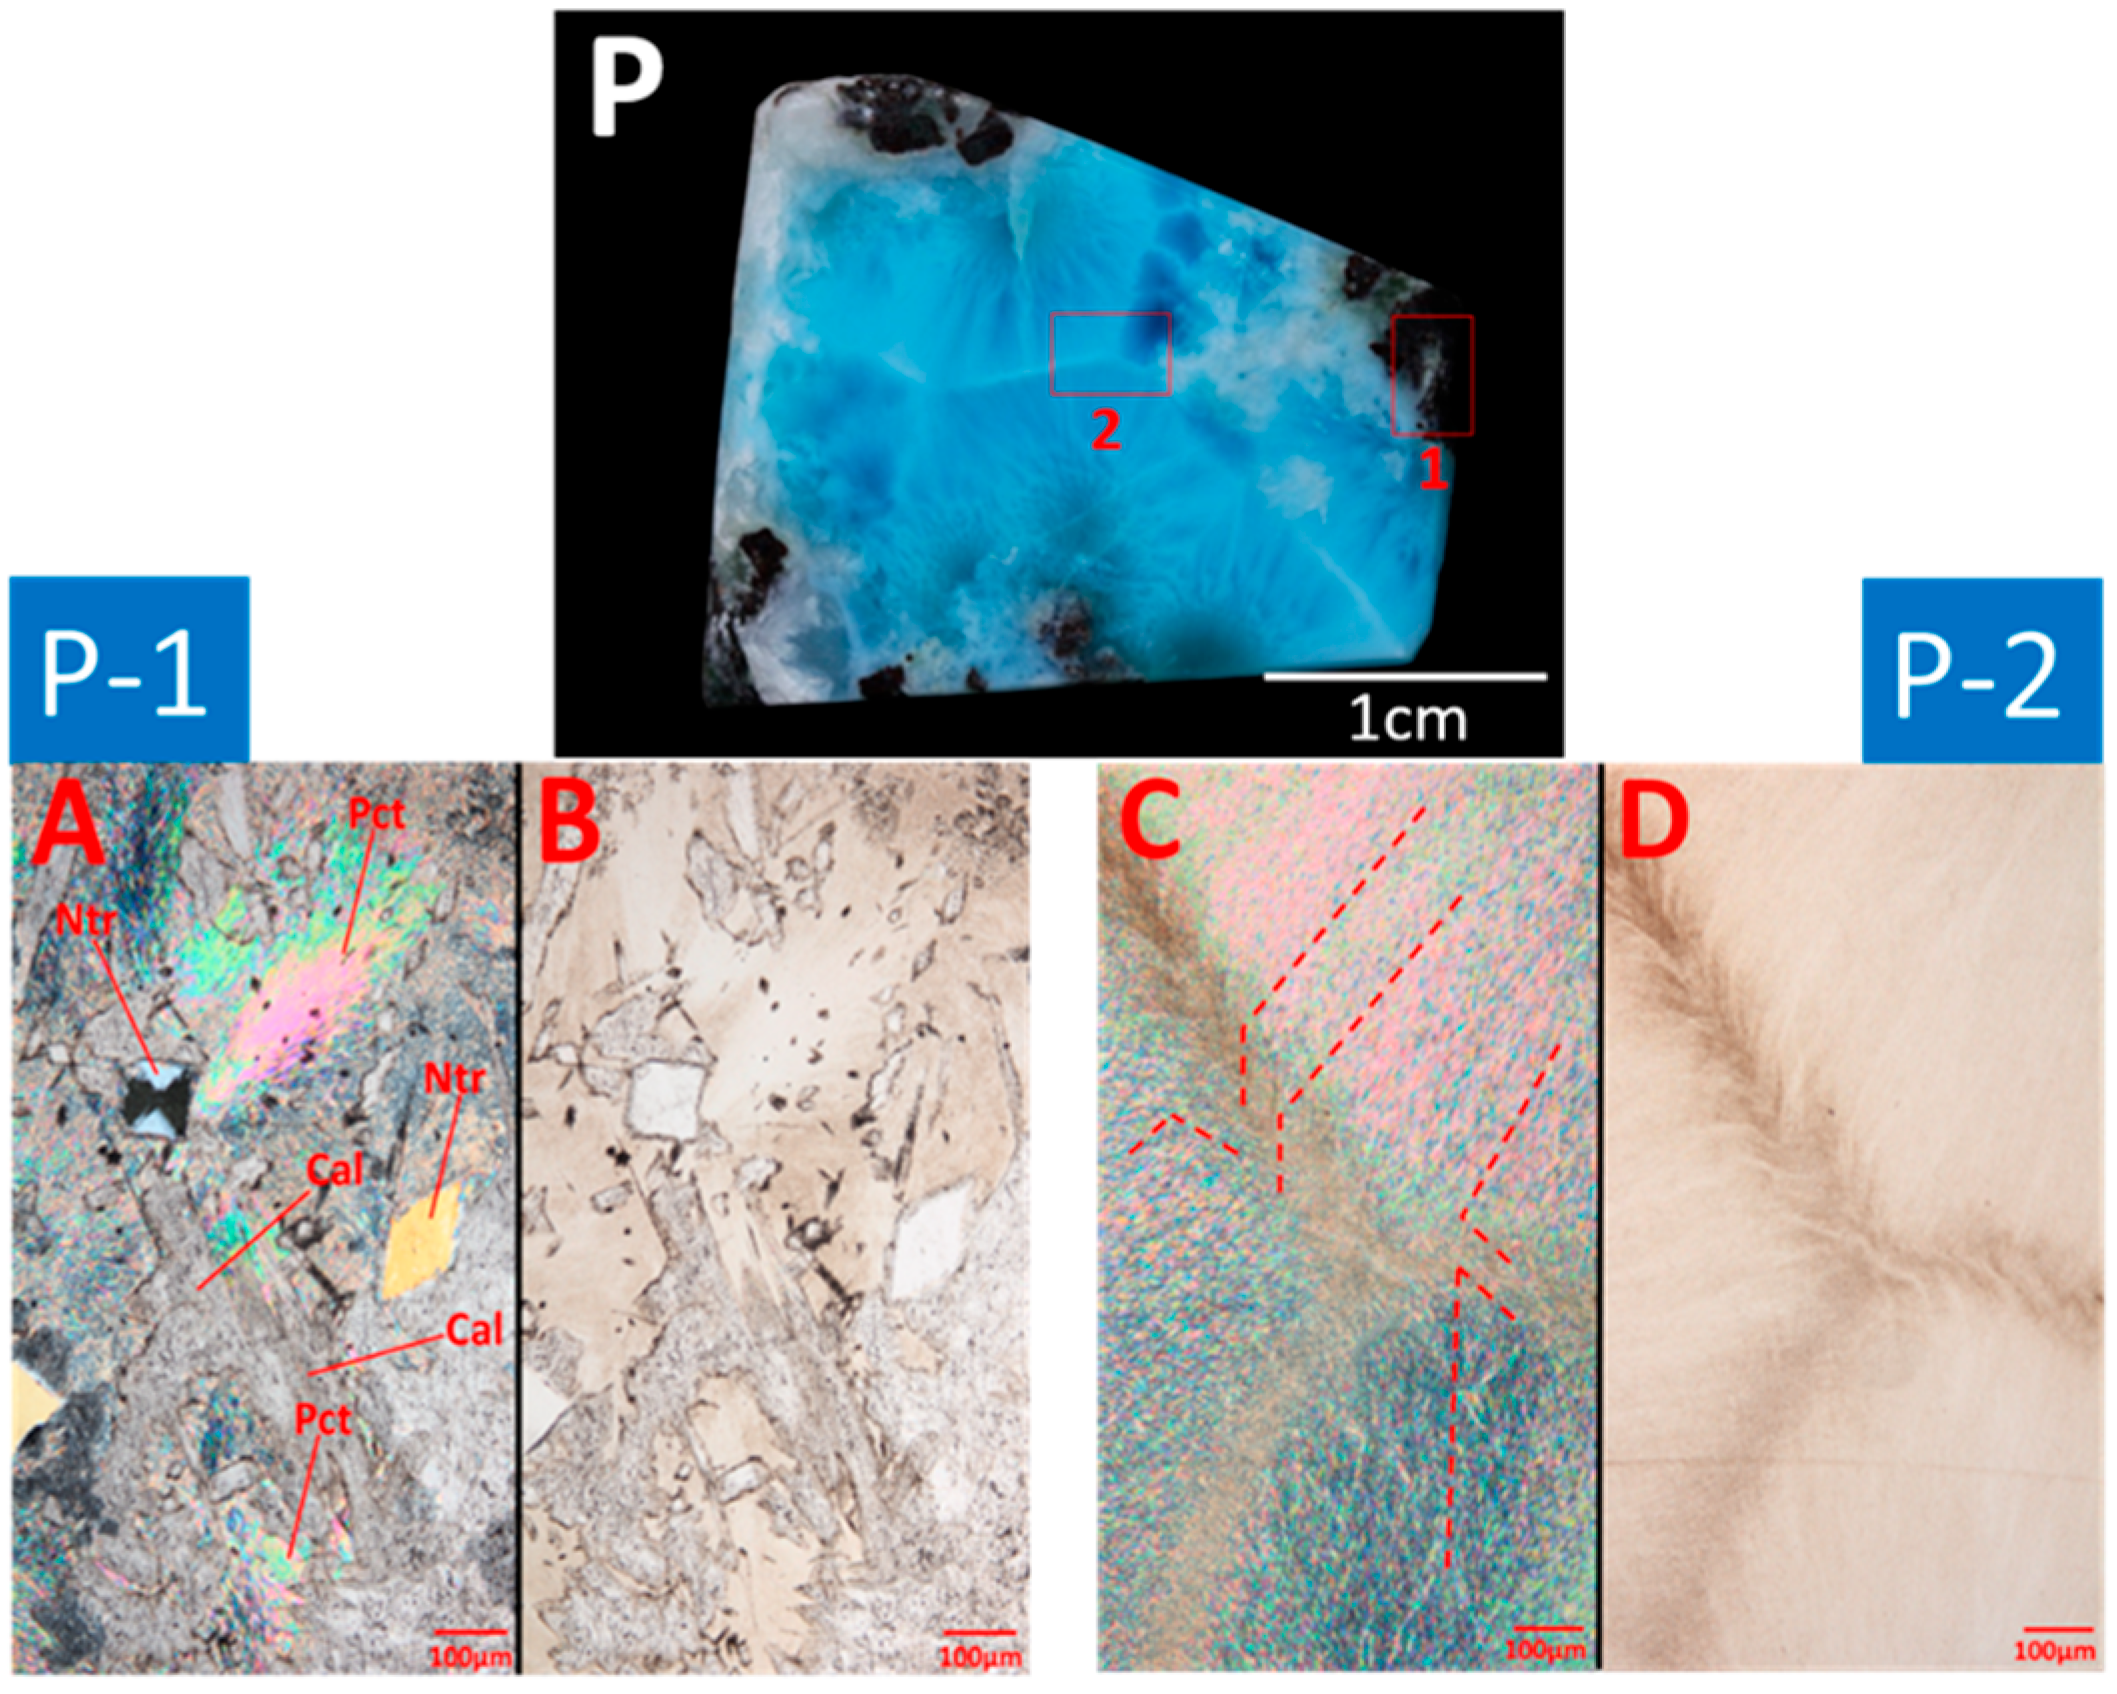
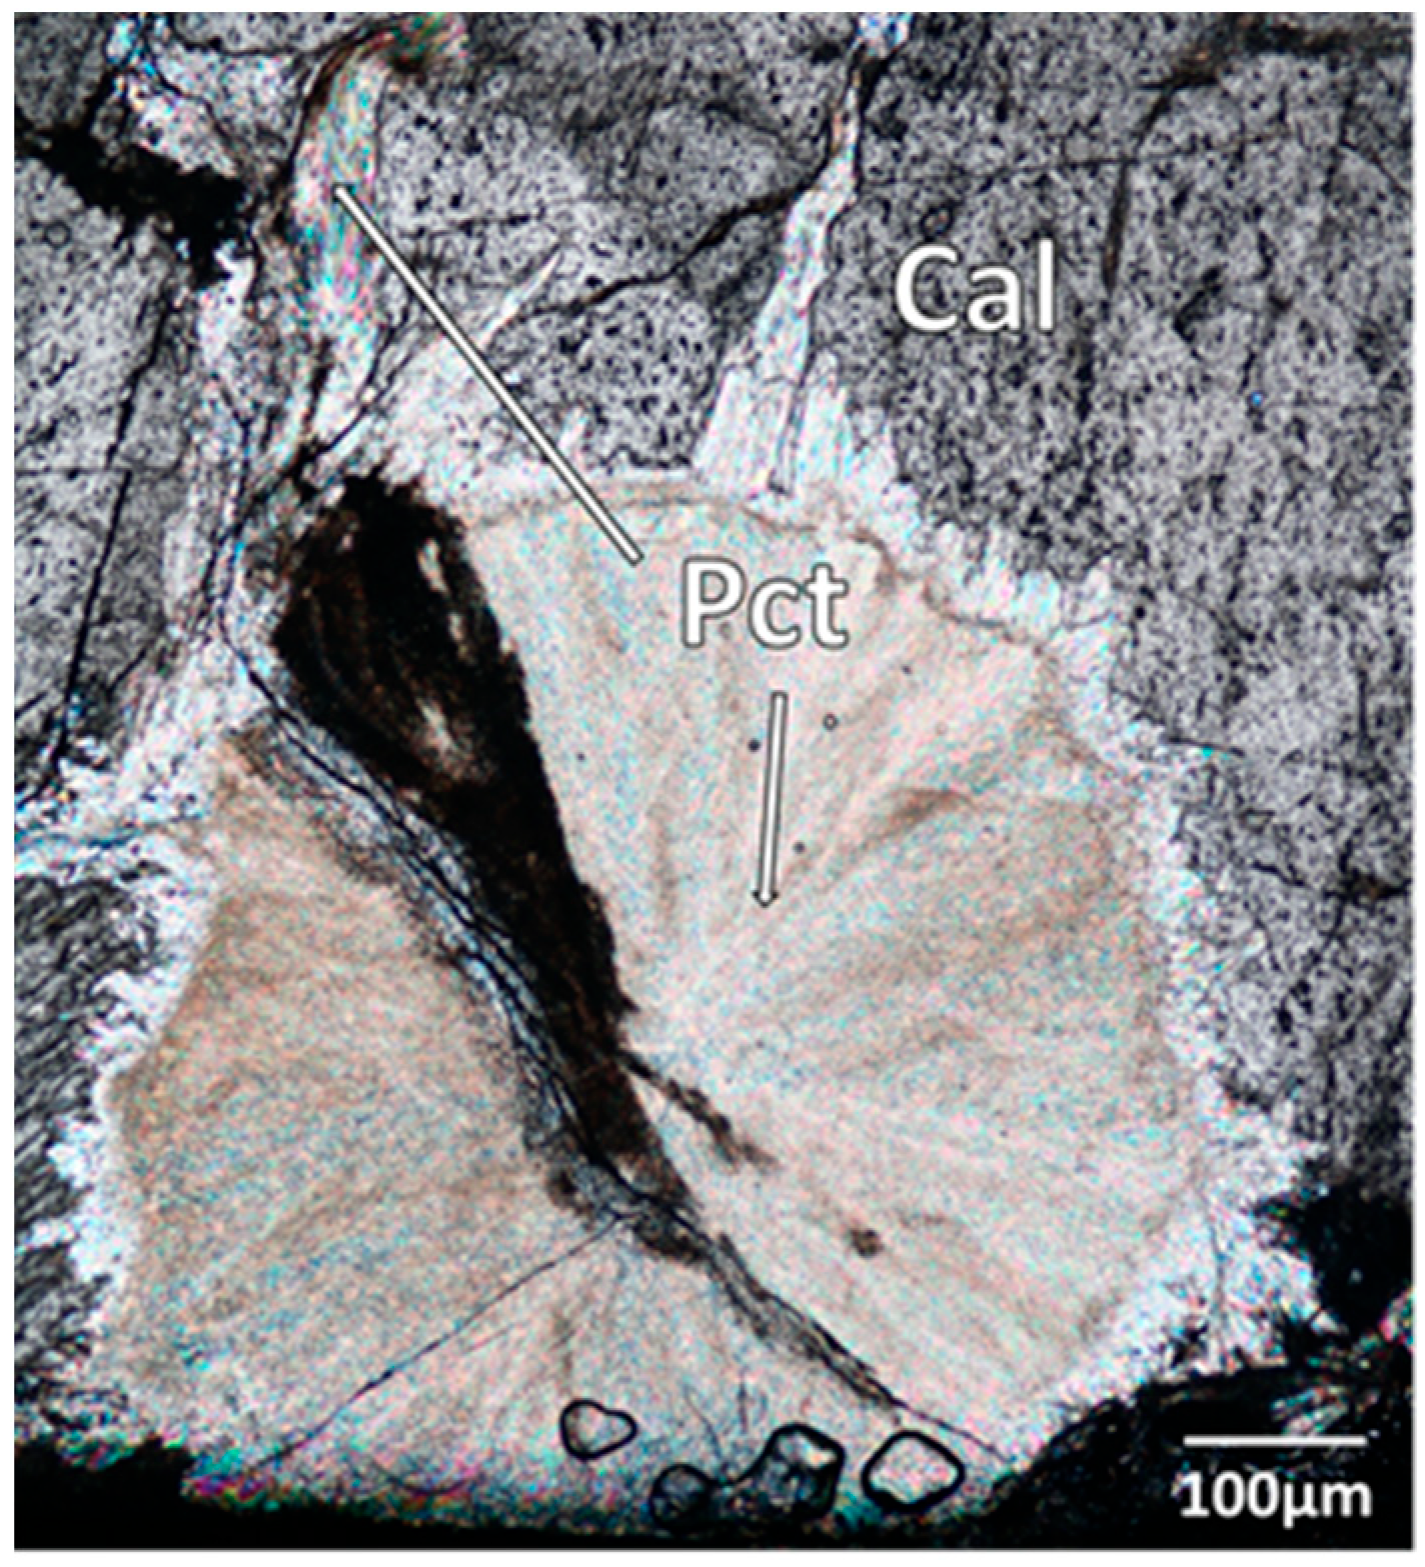
3.1. Micro-Texture Observations under a Polarized Microscope

Due to the fact that the polarizing microscopy observations highlight the coexisting structures among natrolite, calcite, and pectolite, we specifically chose one sample where the three minerals were present simultaneously near the host rock, with an emphasis on the white wavy pattern characteristic. To better understand the nature of the enigmatic sea-wave pattern with radial fiber crystals in the Larimar (Figure 3), the thin sections at different positions in sample P were observed: in particular, one close to the wall rock (section P-1) and the other near the triple junction of the white streaks (section P-2) were observed (Figure 12). Under a polarized light microscope, in section P1, it was observed that Larimar was mainly composed of radial pectolite with intergrowth of anhedral calcite and euhedral natrolite (Figure 12A,B). The presence of these minerals was also confirmed by micro-Raman spectroscopy and SEM–EDS analysis. We also found that such pectolite aggregates with radial spheroids mostly grow inward from the host rock. The calcite observed was penetrated by pectolite, and sometimes blue pectolite filled the fissures of calcite (Figure 11). Natrolite was present in long prismatic crystals. The vertical long axis sections were square or rhombus-shaped, and their crystals were completely wrapped in calcite and pectolite. The Supplementary File indicates the evidence of natrolite growth along the host rock and the replacement by later-stage pectolite (Figures S1 and S2).
Therefore, the order of crystal growth between these three minerals should be natrolite → calcite → pectolite. In addition, pectolite was observed in P-2 with a white streak consisting of extremely fine radial fibers (Figure 13C,D) with high-order interference colors. It can be seen that spherulitic fibers developed from different crystal nuclei are in contact on the boundary. The crystal development direction is uneven and disordered due to a lack of space.

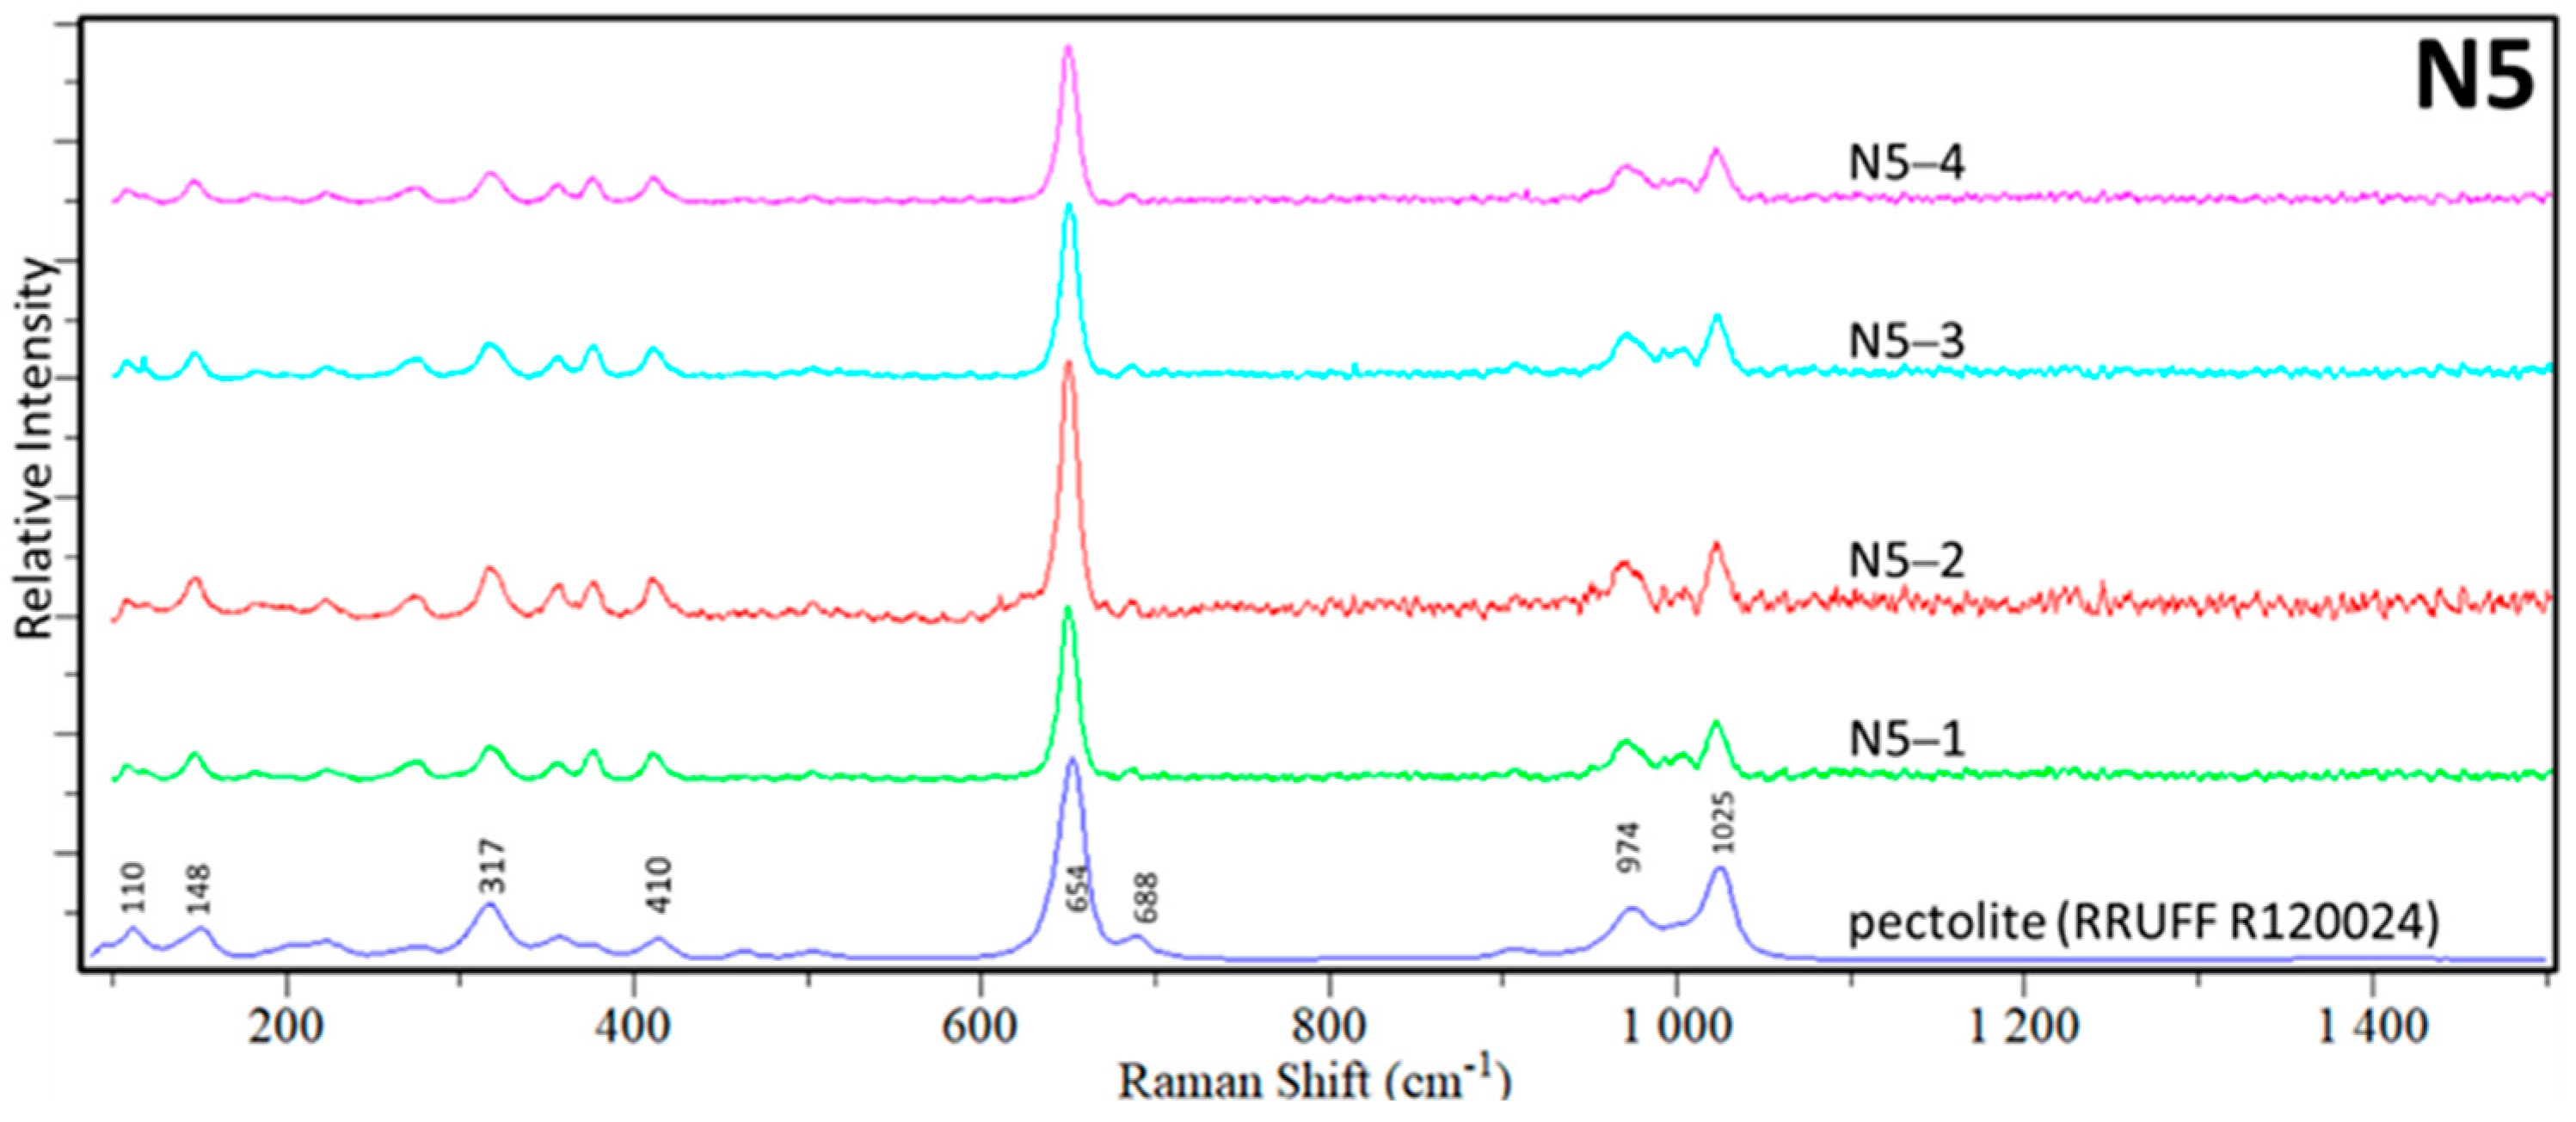
3.2. Mineral Identification by Micro-Raman Analyses

To the naked eye, fine grains of native copper can occasionally be seen near the host rock side, along with long prismatic natrolite crystals and white calcite. In order to ensure that pectolite was present in the positions, we intended to use LA-ICP-MS analysis and avoid analyzing other minerals, and we first confirmed the presence of pure pectolite at each point of analysis with a micro-Raman spectrum. In this study, nine samples were selected (N1–N9), including white–colorless, bluish, and greenish samples (Figure 13). All results of the Raman spectrum from N1 to N9 are shown in the Supplementary File (Figures S3–S11). All positions are pure pectolites, but here, we only display the identification results of example N5 from the micro-Raman spectrum (Figure 14).

3.3. The Color of Larimar through UV–Vis

In order to check whether the color tones seen by the naked eye were consistent with the instrumental analysis data, samples N1 and N5 (Figure 13) were ground to a thickness of 1 mm. Transmission UV–Vis absorption spectroscopy, with a spot diameter of 5 mm, was used. The analysis results showed that the Larimar was not pure blue but rather a mixture of blue and green. The only difference was the proportion of blue to green color. The results of this analysis were consistent with the naked eye observations. All results of UV–Vis are shown in the Supplementary File (Figures S12–S16).

3.4. Chemical Compositions of Pectolite

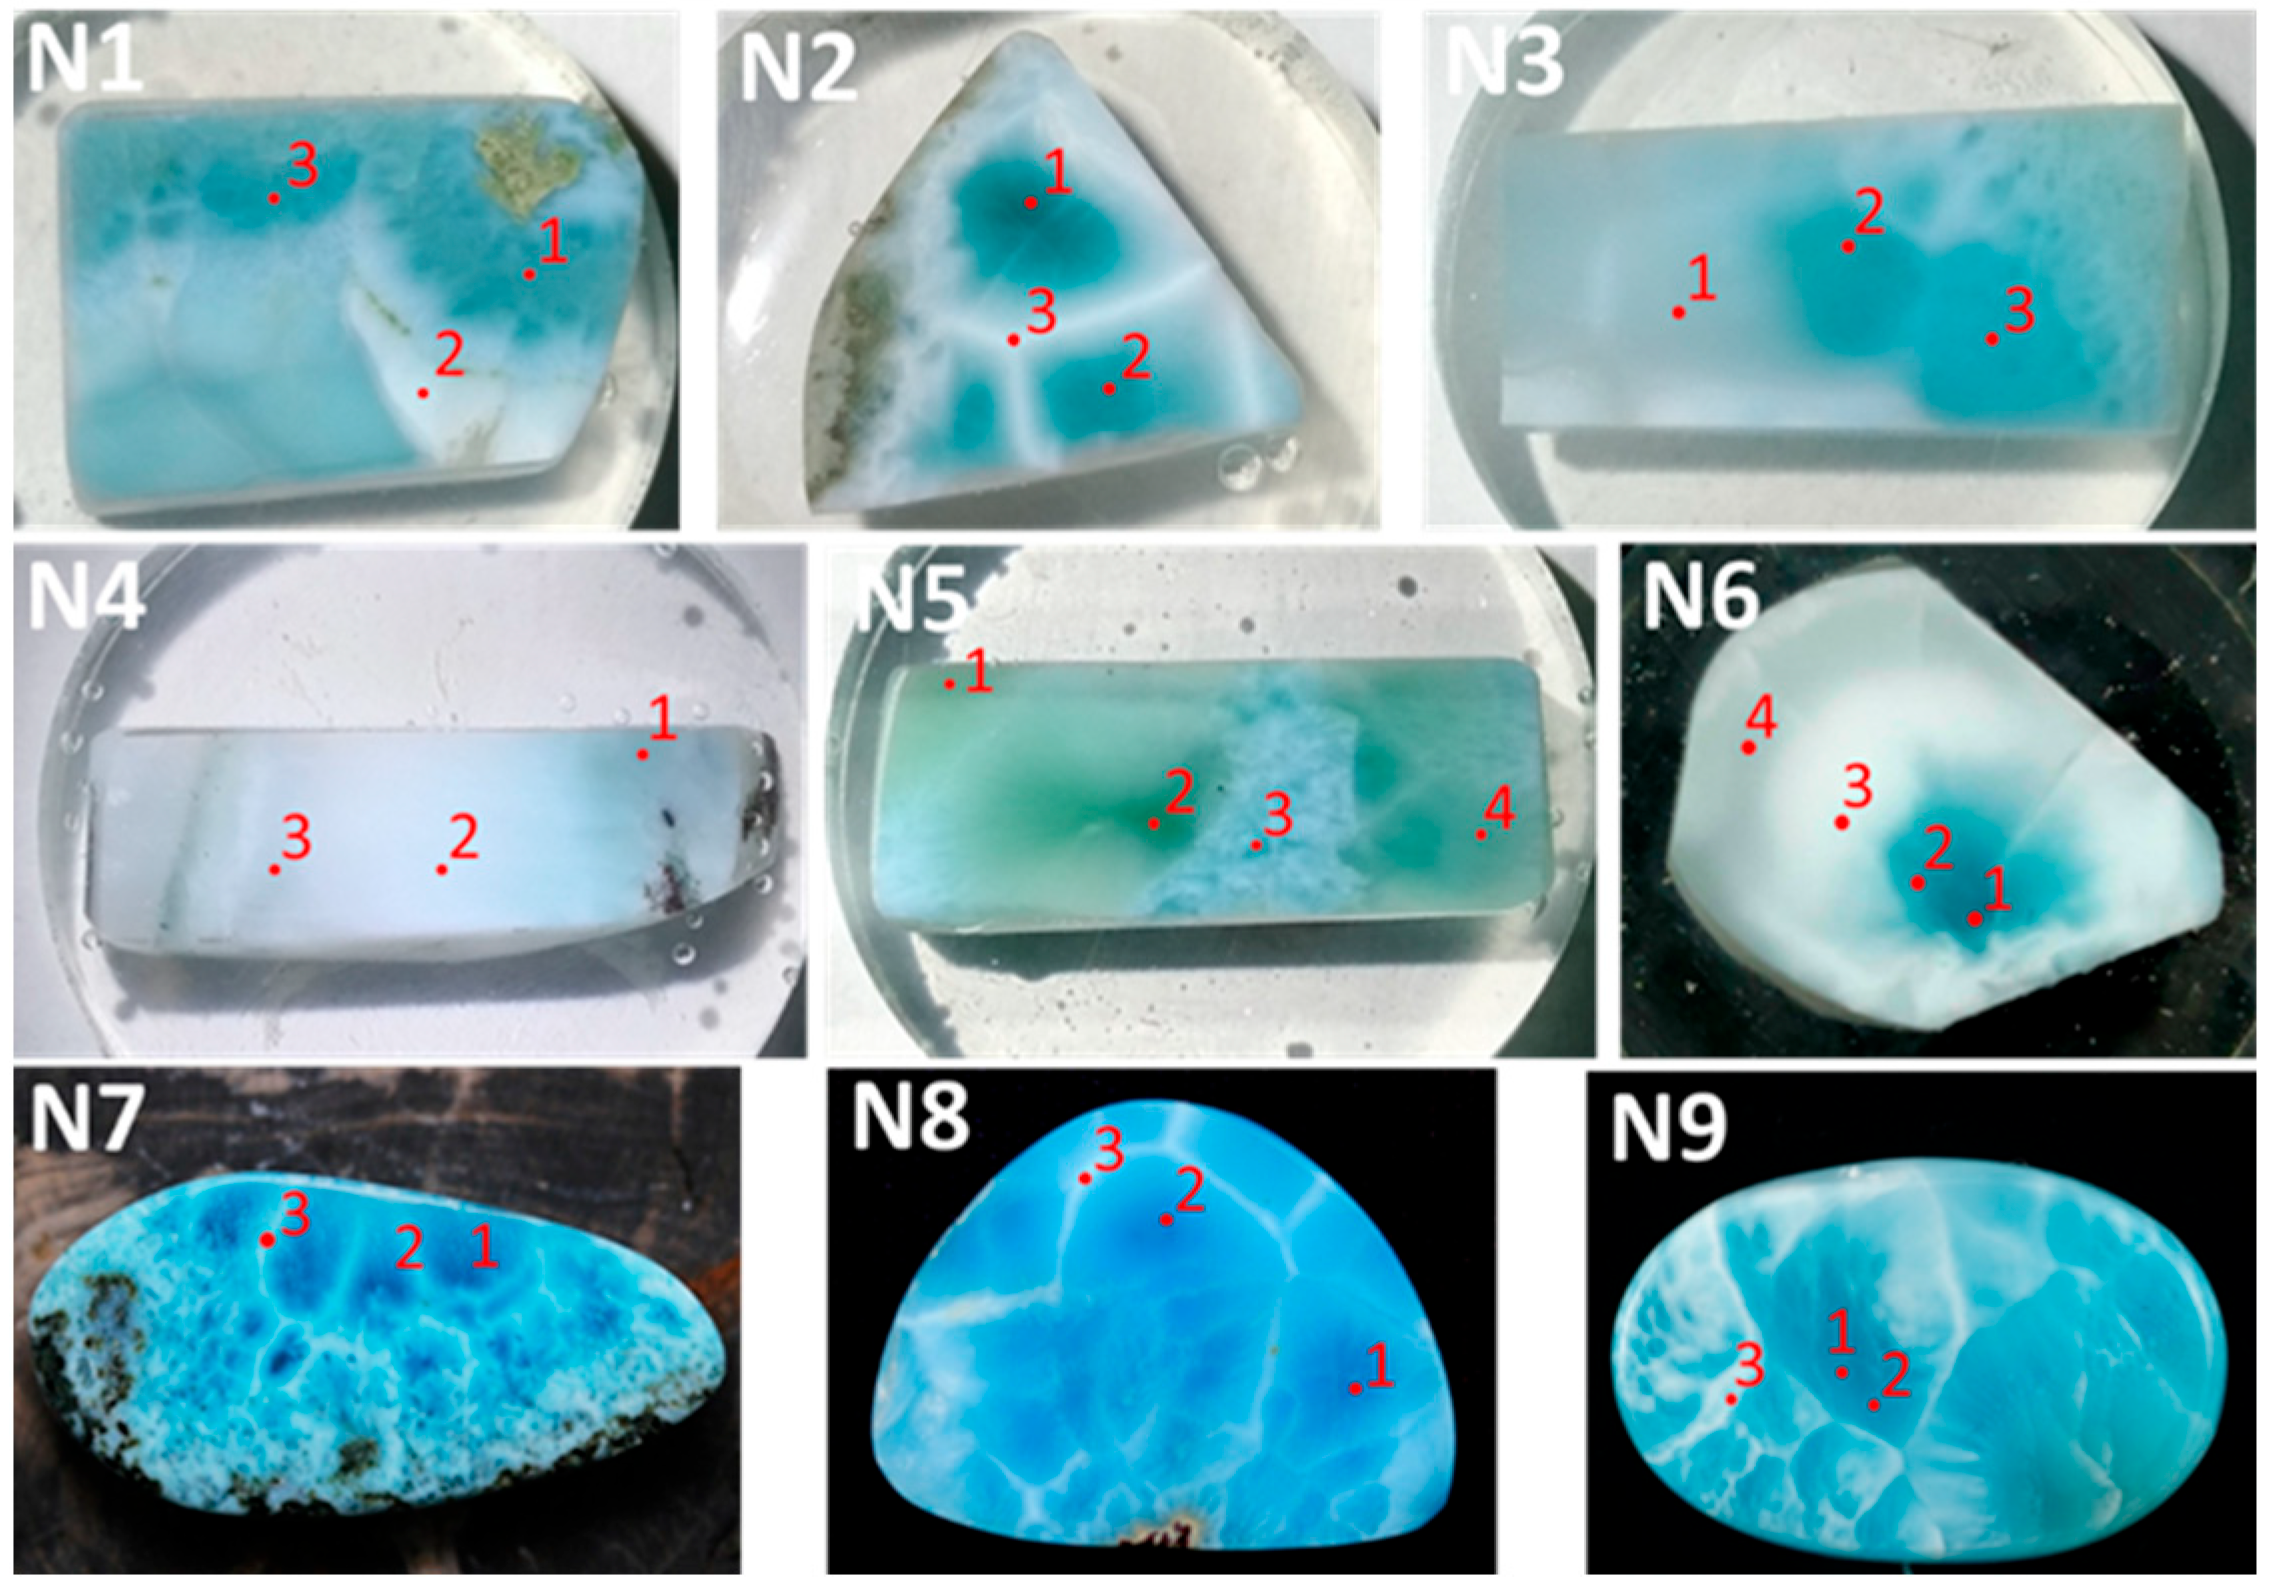
3.4.1. Major Elements by EDS

In this experiment, the percentages of major elements from EDS analysis at the selected points served as a semi-quantitative analysis to confirm mineral compositions after the experiments of micro-Raman spectroscopy. The percentage of Ca in pectolite was chosen as the internal standard of LA-ICP-MS. The differences in transition metal elements may have contributed to the Larimar coloration. The main element analysis results are shown in Table 1. The Na2O content ranges between 7.0 and 11.3 wt%, the CaO content between 30.2 and 36.5 wt%, and the SiO2 content between 56.2 and 59.2 wt%.

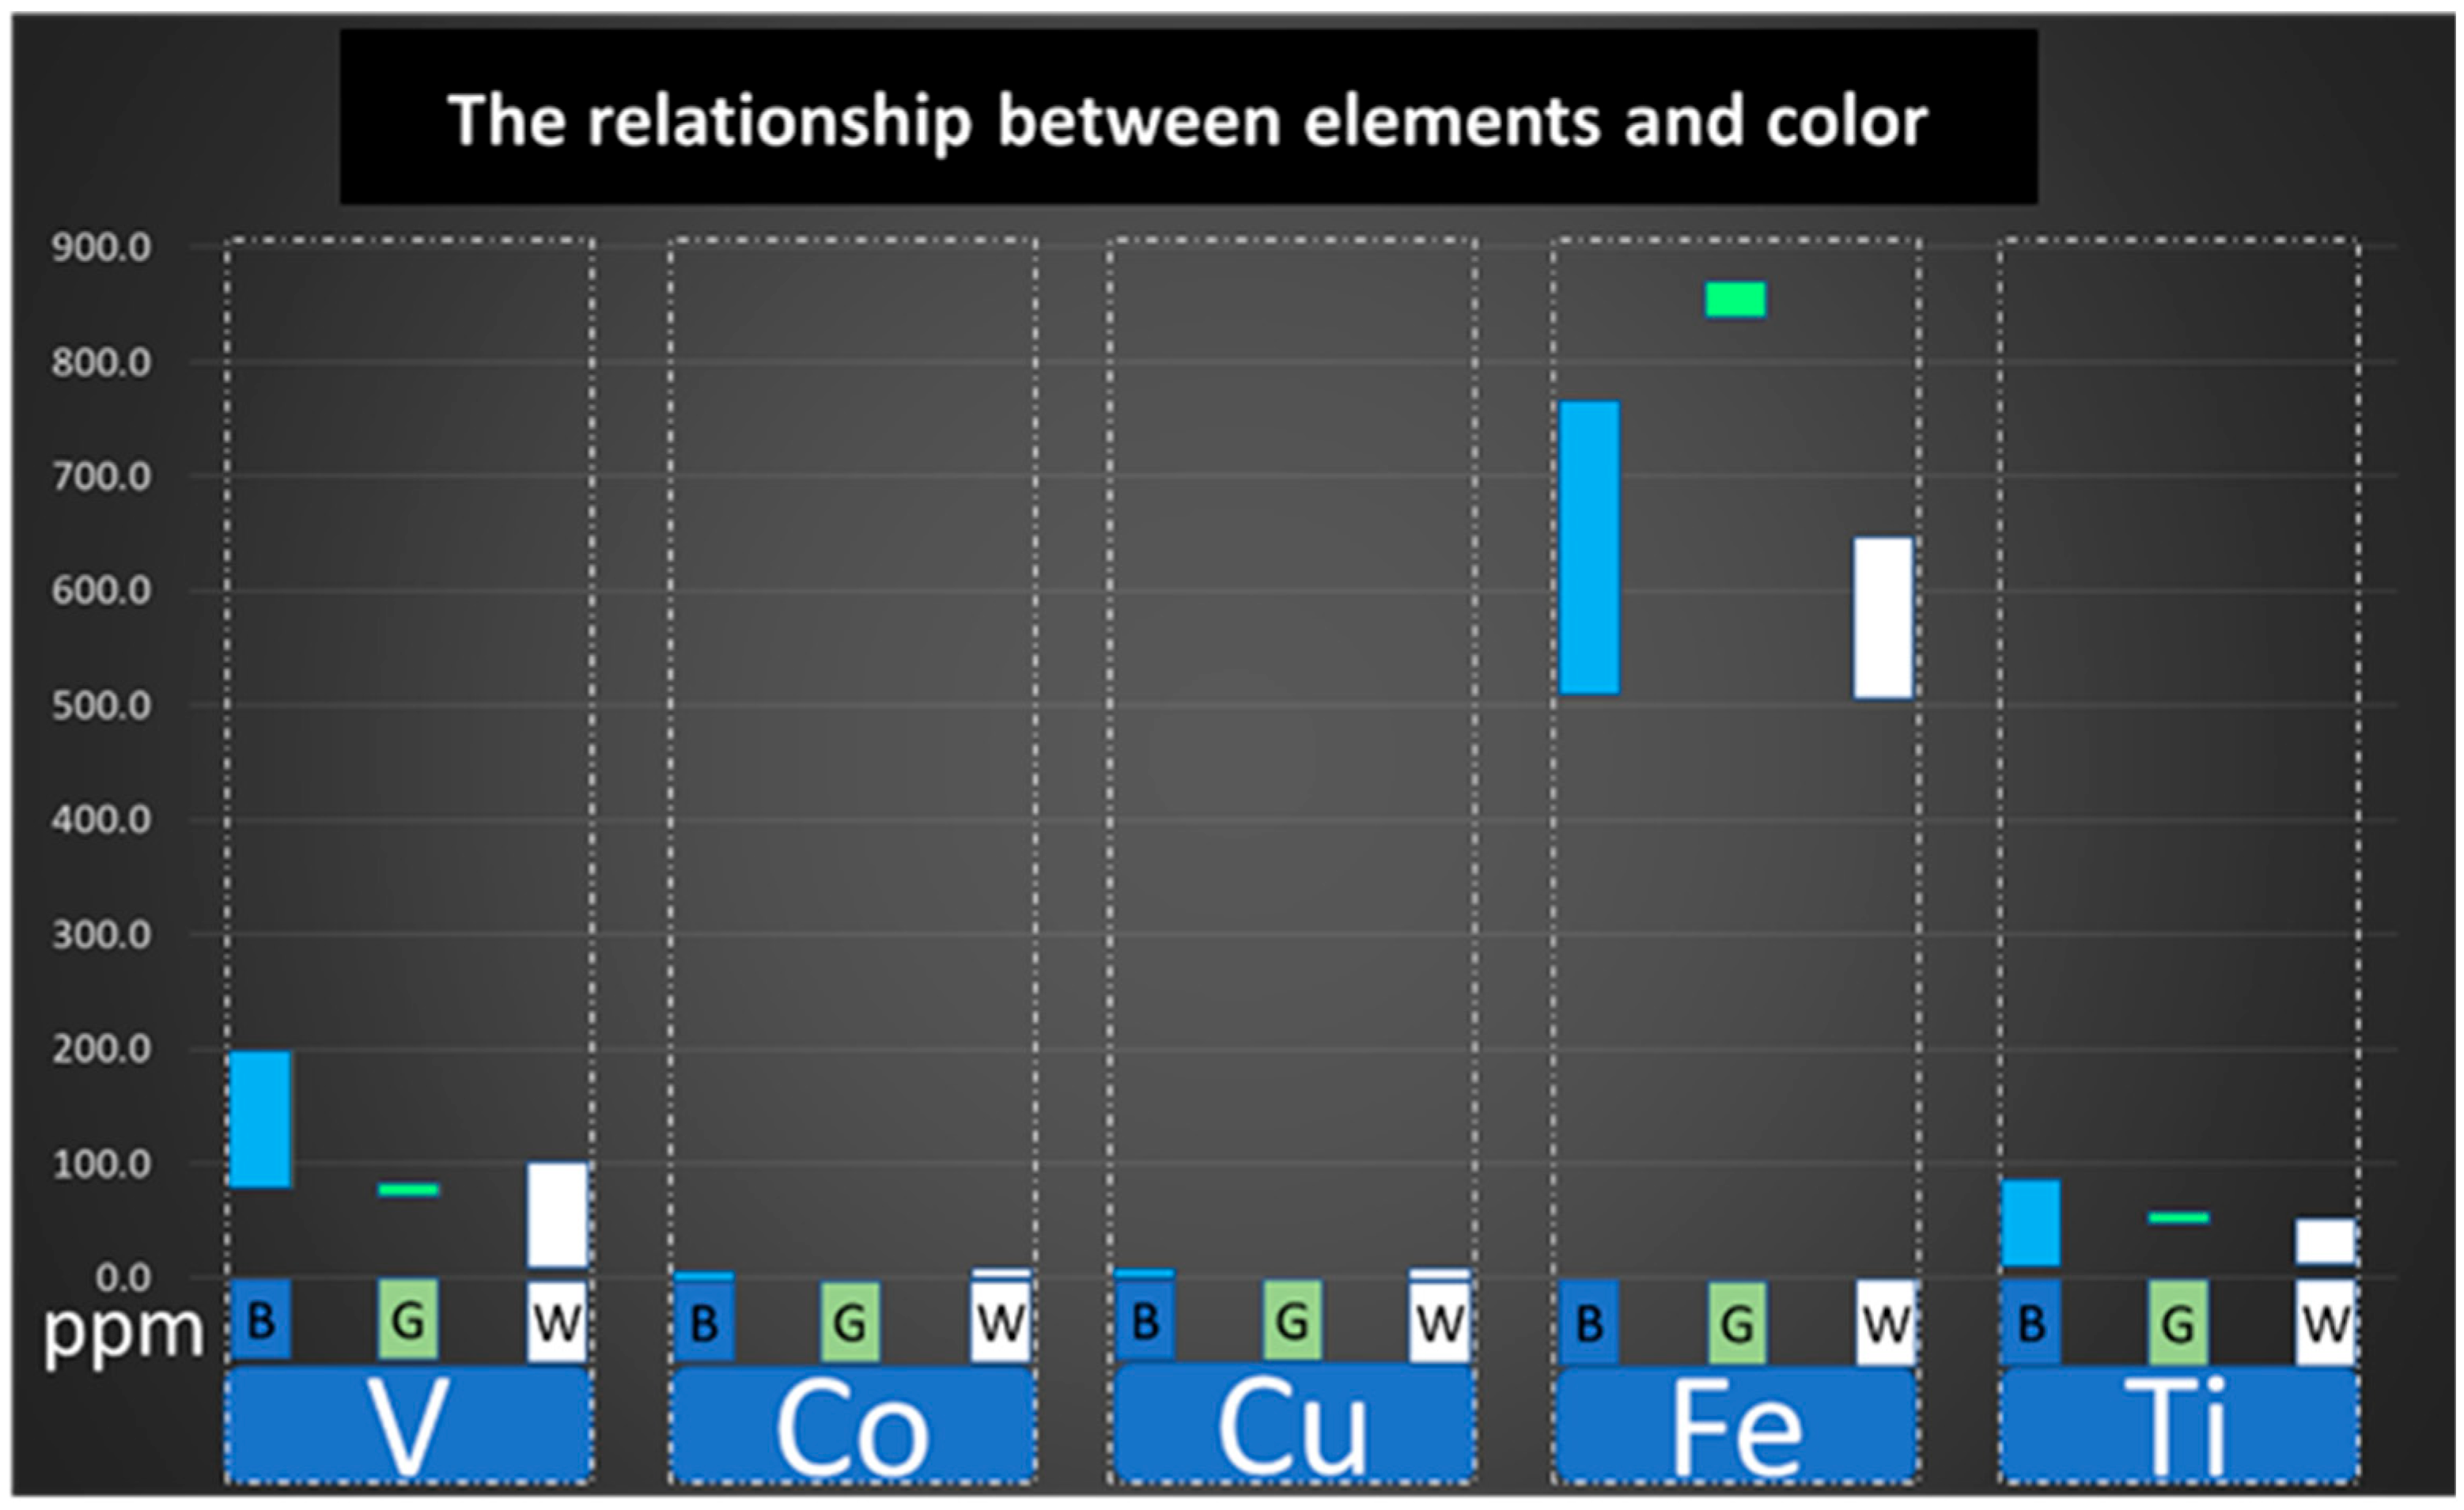
3.4.2. Minor and Trace Elements of Pectolites by LA-ICP-MS

LA-ICP-MS was used to analyze the trace elements, such as V, Co, Cu, Ti, and Fe, that may be the cause of the blue and green coloration. The results are shown in Table 2. From major to minor, the abundances of the elements follow this order: Fe > V > Ti > Cu > Co. The following are the correlations between the five elements and color in pectolites. We compared the concentrations of the above elements with the exhibited color of Larimar in Figure 15 and obtained the following results:
  • Iron: The average value of the iron element in green pectolite was 851.8 ppm, which was significantly higher than the average of 585.5 ppm in blue pectolite and 548.5 ppm in the white or colorless parts.
  • Vanadium: The average value of vanadium in the blue part was as high as 133.3 ppm, which was significantly higher than that in the green and white parts, which was between approximately 8.1 and 86.8 ppm.
  • Titanium: The analytical value ranged between 11.0 and 85.7 ppm, and no correlation with hue was found.
  • Cobalt: The content was very low and uniform, between approximately 0.1 and 0.3 ppm, and no correlation with hue was found.
  • Copper: The analytical value ranged between 0.1 and 6.5 ppm, and no correlation with hue was found.

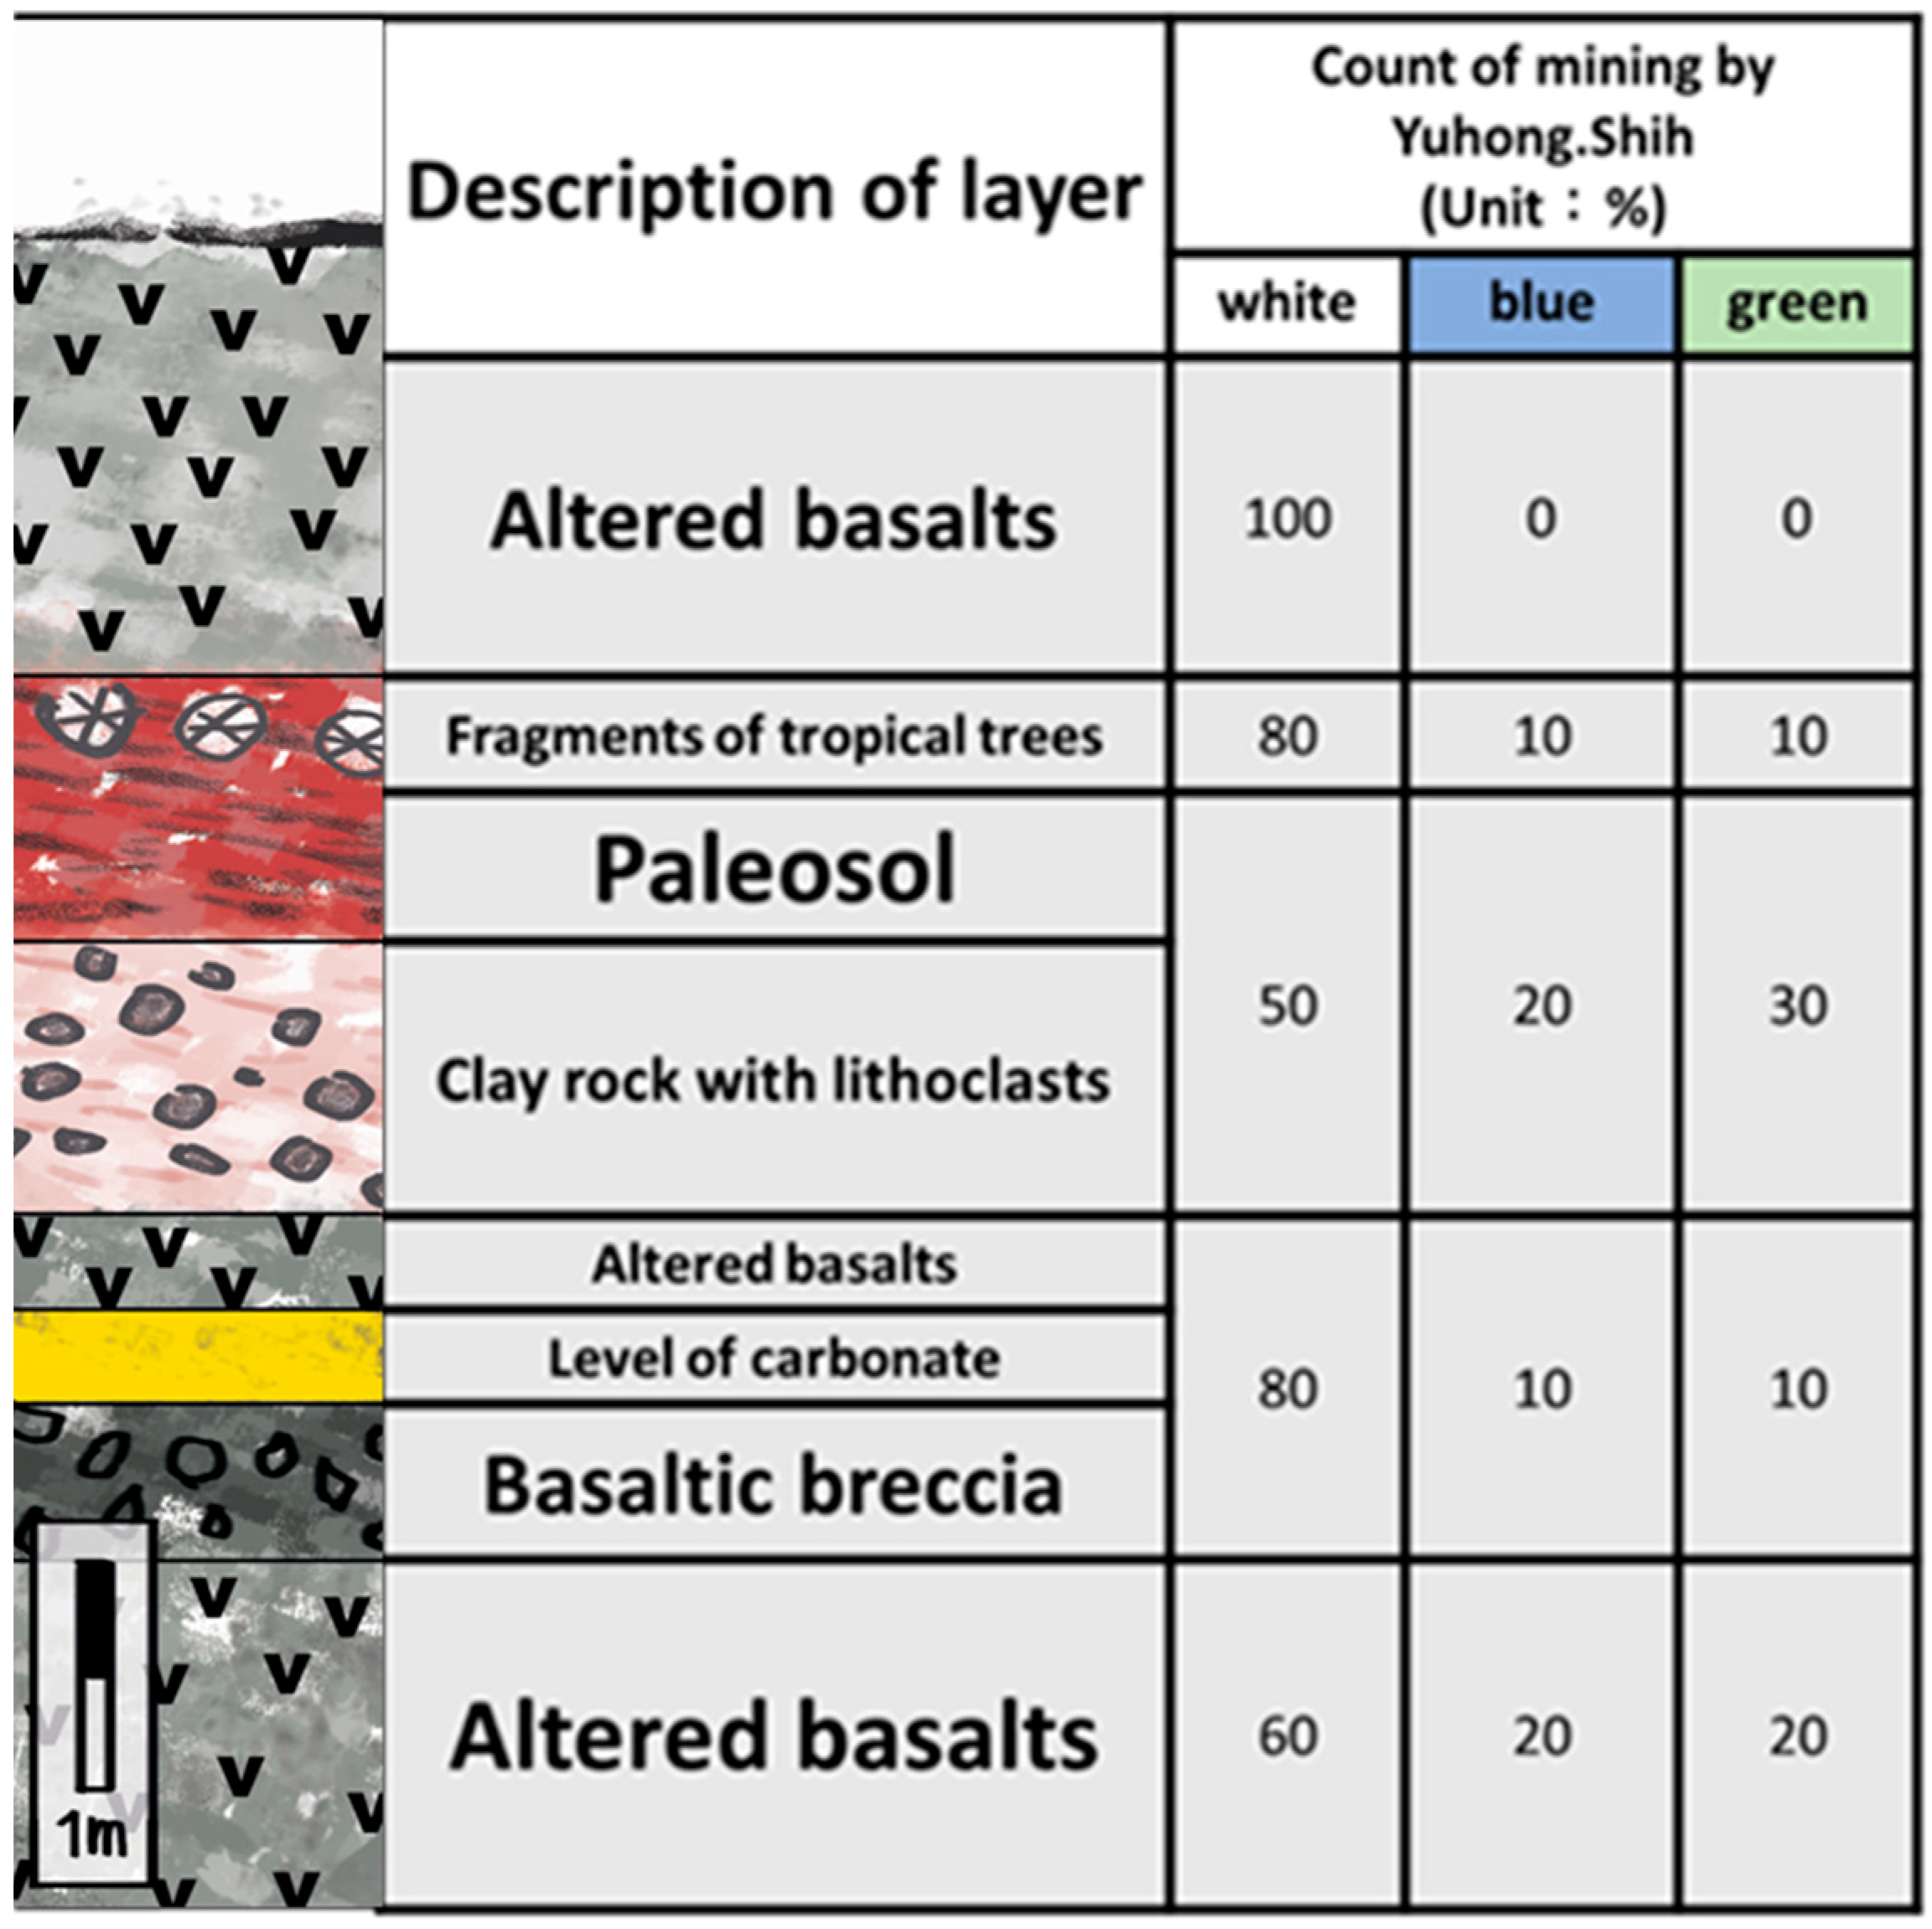
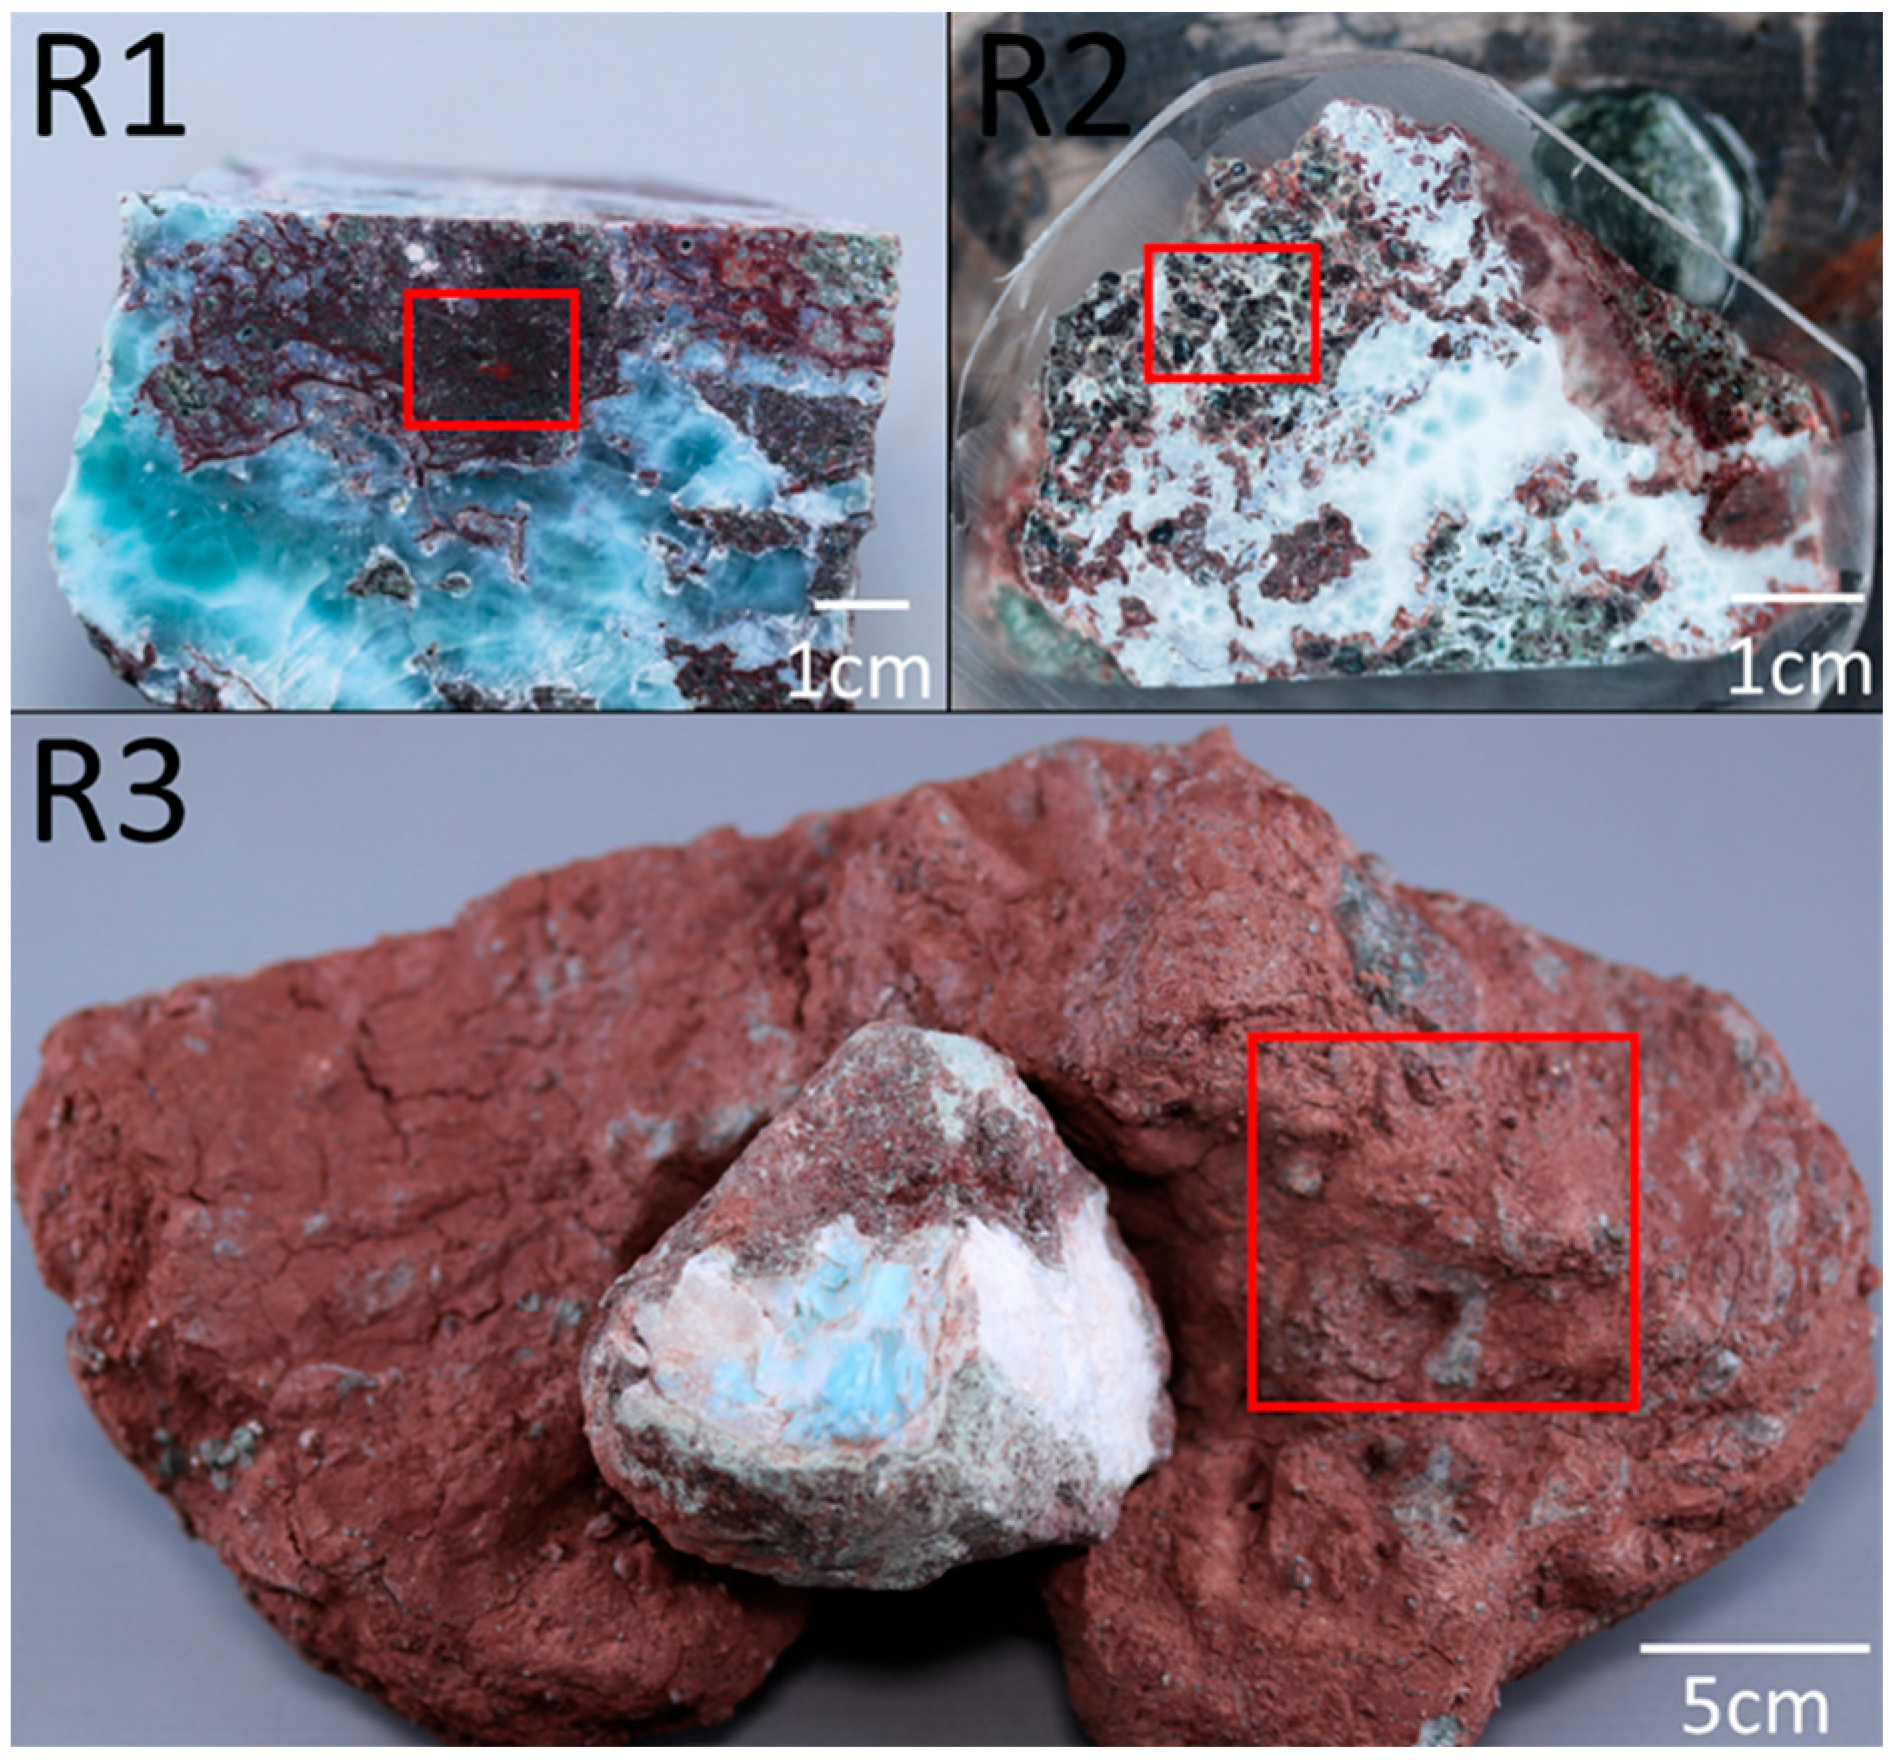
3.4.3. Minor and Trace Element Analysis of Host Rocks by ICP-MS

As for the wall rock, we chose the fragments of altered basalt and the laterite sample, which formed a more bluish Larimar, as the objects for analysis (R1, R2, and R3) (Figure 16). In order to avoid the influence of pectolite composition, most pectolite had been removed before the experiment, and only the host rock (R1 and R2) and laterite (R3) were analyzed by using ICP-MS. The analysis results of possible chromogenic elements are summarized in Table 3. The experimental results showed that iron, vanadium, cobalt, copper, and titanium are present in the wall rocks. Among them, the content of iron, copper, and titanium is much higher than that of cobalt and vanadium, which also means that the wall rocks containing these metal elements may be the cause for pectolite appearing blue–green. However, the elements that enter pectolite are mainly iron, vanadium, and titanium, while the content of copper and cobalt is minimal.

3.5. U-Th Dating of Calcite and the Age of Larimar

The results of determined U-Th isotopic compositions and contents are listed in Table 4. The content of 238U in the sample is 67.23 × 10⁻⁹ g/g, and that of 232Th is 5251 × 10−12 g/g. The 230Th age of the sample formation was 393 ± 41 kyr BP. From the previous observations under a polarizing microscope, the growth sequence of minerals should first be natrolite, then calcite, and, finally, pectolite. The last fluid intrusion occurred during the pectolite formation period. Therefore, we believe that the isotopes of calcite may have been reset again by later hydrothermal fluid. Consequently, the age of this calcite could be close to the time of pectolite formation. We speculated that the time of genesis of the Larimar should have been approximately 400,000 years ago or later. This age is much younger than the formation age of the igneous rocks, which had already formed before 53 Ma [13,18].

4. Discussion

4.1. The Mechanisms of Coloration for Larimar

According to the analysis results with LA-ICP-MS, the elements V and Fe revealed the highest correlation with the color of Larimar (Figure 15). However, the first study of Larimar indicated that copper is the main coloration element based on microprobe analysis [2]. Their light-blue and dark-blue pectolites contained 0.01 wt% and 0.03 wt% CuO, respectively, while V, Fe, and Ti were both undetectable. The detection limit for microprobe analysis was approximately 0.01 wt% and its analysis error should be larger than ±2%; hence, the CuO content cannot explain the obvious differences in coloration. Bente et al. (1991) first discovered that the blue color in pectolite was due to vanadium, rather than copper; the V, in fact, showed a significant increase, passing from white (4 ppm), greenish (2 ppm), and light-blue (67 ppm) to dark-blue (134 ppm) [20]. Moreover, Espí (2017) compared the concentrations of the trace elements V, Cu, Cr, and Mn and concluded that blue pectolite had higher vanadium (143 ppm) and copper (58 ppm) in their samples [11]. In our research, we found that V and Fe are the main chromophore agents for the bluish and greenish colors of pectolites, respectively (Table 2 and Figure 15). However, previous studies have not addressed whether the Fe element affects the color of Larimar [2,11,20]. For this study, the total contents of V and Fe were lower than the critical concentrations of 600 ppm that resulted in white or transparent pectolite (Table 2). Although the Ti also showed a slight correlation with the bluish color, its contents showed no noticeable variation between the colors. It was really beyond our prediction that the concentration of Cu was found to be too low in our samples. Perhaps our sampling points were too far away from those containing native copper to avoid the influence of this element.
The bluish and greenish colors were affected by the contents of V and Fe, based on the results of Figure 15. There is a competitive relationship between V and Fe in the blue–green pectolites. To ascertain the electronic states of iron and vanadium, it was necessary to utilize the X-ray photoelectron spectroscopy (XPS) instrumentation for measurement. XPS is a quantitative spectroscopic technique that is used to determine the electronic states of the elements involved. However, the concentration of the element needs to be higher than 0.1 wt% and the concentrations of V and Fe were not high enough to be detected. According to the theoretical crystal radius, the radii of V2+, V3+, V4+, and V5+ vary from 0.93 Å to 0.68 Å, occupying an octahedron site in a six-coordination position. The crystal radii of Fe2+ and Fe3+ also ranged from 0.92 Å to 0.69 Å [21] (Table 5). Therefore, the radii of V and Fe are very close, and they can exchange each other. Among vanadium silicates and sulfate, V4+ will appear blue, and V3+ will appear green (Supplementary File, Table S1). However, silicate minerals containing V2+ have not been discovered yet. Therefore, it is speculated that V4+ may be the cause of the bluish color in silicate minerals, such as cavansite and pentagonite. Additionally, we needed to consider whether the V4+ ion replaced the position of Si4+ or Ca2+ in the pectolite lattice. If V4+ replaced the Si4+ ion, it would have to be in a four-coordination position. However, there is no four-coordination for the V4+ ion, because its ion radius of 0.72 Å is larger than that of the Si4+ ion. Therefore, V4+ must be exchanged with Ca2+ in a six-coordinated form. Furthermore, Ca2+ has a larger crystal ion radius of approximately 1.14 Å (Table 5), which is close to Fe2+ in the range of 0.75 Å~0.92 Å. Due to the high-spin state, Fe2+ and V4+ have similar crystal ion radii when they are six-coordinated, and they may partly replace the six-coordinated Ca2+. These inferences match the results in Figure 15, which indicate a higher Fe content and lower V concentration in the greenish samples. The coexistence and competition between V4+ and Fe2+ for replacement in the Ca2+ sites account for the blue and green colors in pectolite. If V4+ substitutes for Ca2+ ions, the issue of charge balance needs to be considered. The chemical substitution reaction would be as follows: V4+ + ☐ ↔ 2Ca2+, resulting in a defected cavity. On the other hand, the question remains regarding exactly which type of iron ion causes the mineral to exhibit a green color. According to our statistics, the majority of silicates containing Fe2+ tended to appear green, while those containing Fe3+ exhibited colors ranging from yellow to reddish-brown (Supplementary File, Table S1). However, it is worth noting that the color of Larimar disappears at 240 °C [11]. To investigate whether V4+ is responsible for the formation of color centers in minerals, we also tried to heat the bluish and greenish Larimar at 250 °C for different durations. The fading of the blue color was most prominent, ultimately leaving a gloomy green color during 216 h (Supplementary File, Figure S17). This implies that the color center structure of V4+ existing within the bluish Larimar leads to the blue color disappearing under conditions of heating.

4.2. Geological Genesis of Larimar and Its Formation from the Altered Basalts

We also investigated the mineralogical composition of pectolite samples, rock fragments, and laterite through X-ray Powder Diffractometry (XRD). According to these analyses, the rock sample of the wall (R1) is made up of an assemblage of minerals, such as pectolite, chlorite, augite, hematite, and montmorillonite; among these, chlorite, augite, and hematite are rich in iron (Figure 17). The presence of these minerals in wall rocks represents the source of Fe for the Larimar (Table 3). The green hue is often distributed near the wall rocks (Figure 18), demonstrating the diffusion of Fe2+ from the wall rocks into the Larimar. According to previous research, the fresh basalts in this location show a high concentration of V (163~389 ppm) and Fe2O3 (9.96~14.09 wt%) [13]. In our study, we analyzed the V and Fe contents in weathered basalt and red soils (samples R2 and R3); the V content is between 75 and 145 ppm while the Fe content is between 4.0 and 8.8% wt%. (Table 3). The fresh basalt showed the highest V and Fe contents. This may imply that V and Fe were dissolved by hydrothermal fluids from the fresh basalt and then precipitated in the cavity and fracture of the weathered basalt. A previous study showed that the temperature of the hydrothermal fluids of the veins was between approximately 200 to 340 °C, and the precipitation processes of the vein formation were as follows: natrolite → hematite + blue pectolite → white pectolite + calcite + native copper [18]. However, in the case of our samples, the sequence of formation of minerals turns out to be different, i.e., natrolite → calcite → pectolite. Natrolite initially grew on the surface of the host rock (Supplementary File, Figures S1 and S2), and then calcite was subsequently precipitated (Figure 12). Finally, pectolite eventually filled all of the remaining spaces of the cavity of weathered basalt. According to our previous synthesis experiments for the zeolite group and pectolite, if the formation environment contains aluminum ion, zeolites will easily precipitate in hydrothermal fluids [22]. Hydrothermal synthetic pectolite is formed only when there are low aluminum contents, while calcite precipitates before pectolite at a temperature of about 150~210 °C [23]. This would indicate that, at this location, natrolite was initially formed in the initial aluminum-rich environment before calcite and pectolite, and, subsequently, some of the natrolite was replaced by pectolite (Supplementary File, Figure S2). Furthermore, according to another study [18], the veins would have formed at a temperature between 200 to 340 °C; hence, we deduce that the formation temperature of the system can vary widely. The geological profiles of basalt layers here include several limestone formations [13], so the fluid passed through these layers and precipitated calcite. In our hypothesis, the original hydrothermal fluid should be acidic and oxidized to dissolve enough Fe, Cu, and V, because Cu dissolves easily in highly acidic water. When the fluid passed through the limestone layer, the fluid became neutral, and this led to the precipitation of native copper. During the process of progressive alkalization of the hydrothermal fluid, minerals are precipitated according to this sequence: natrolite, hematite, calcite, and pectolite. Different trace concentrations of Larimar were interpreted as different sampling layers in the location. The results of our U-Th dating revealed a very young age for calcite precipitation, and this age might have been reset by subsequent hydrothermal events associated with the formation of pectolite. Therefore, this age could potentially represent the formation age of calcite and/or pectolite. In summary, we hypothesize that the V and Fe may have been initially dissolved from the weathered basalt and subsequently incorporated into the blue–green pectolite under hydrothermal conditions.

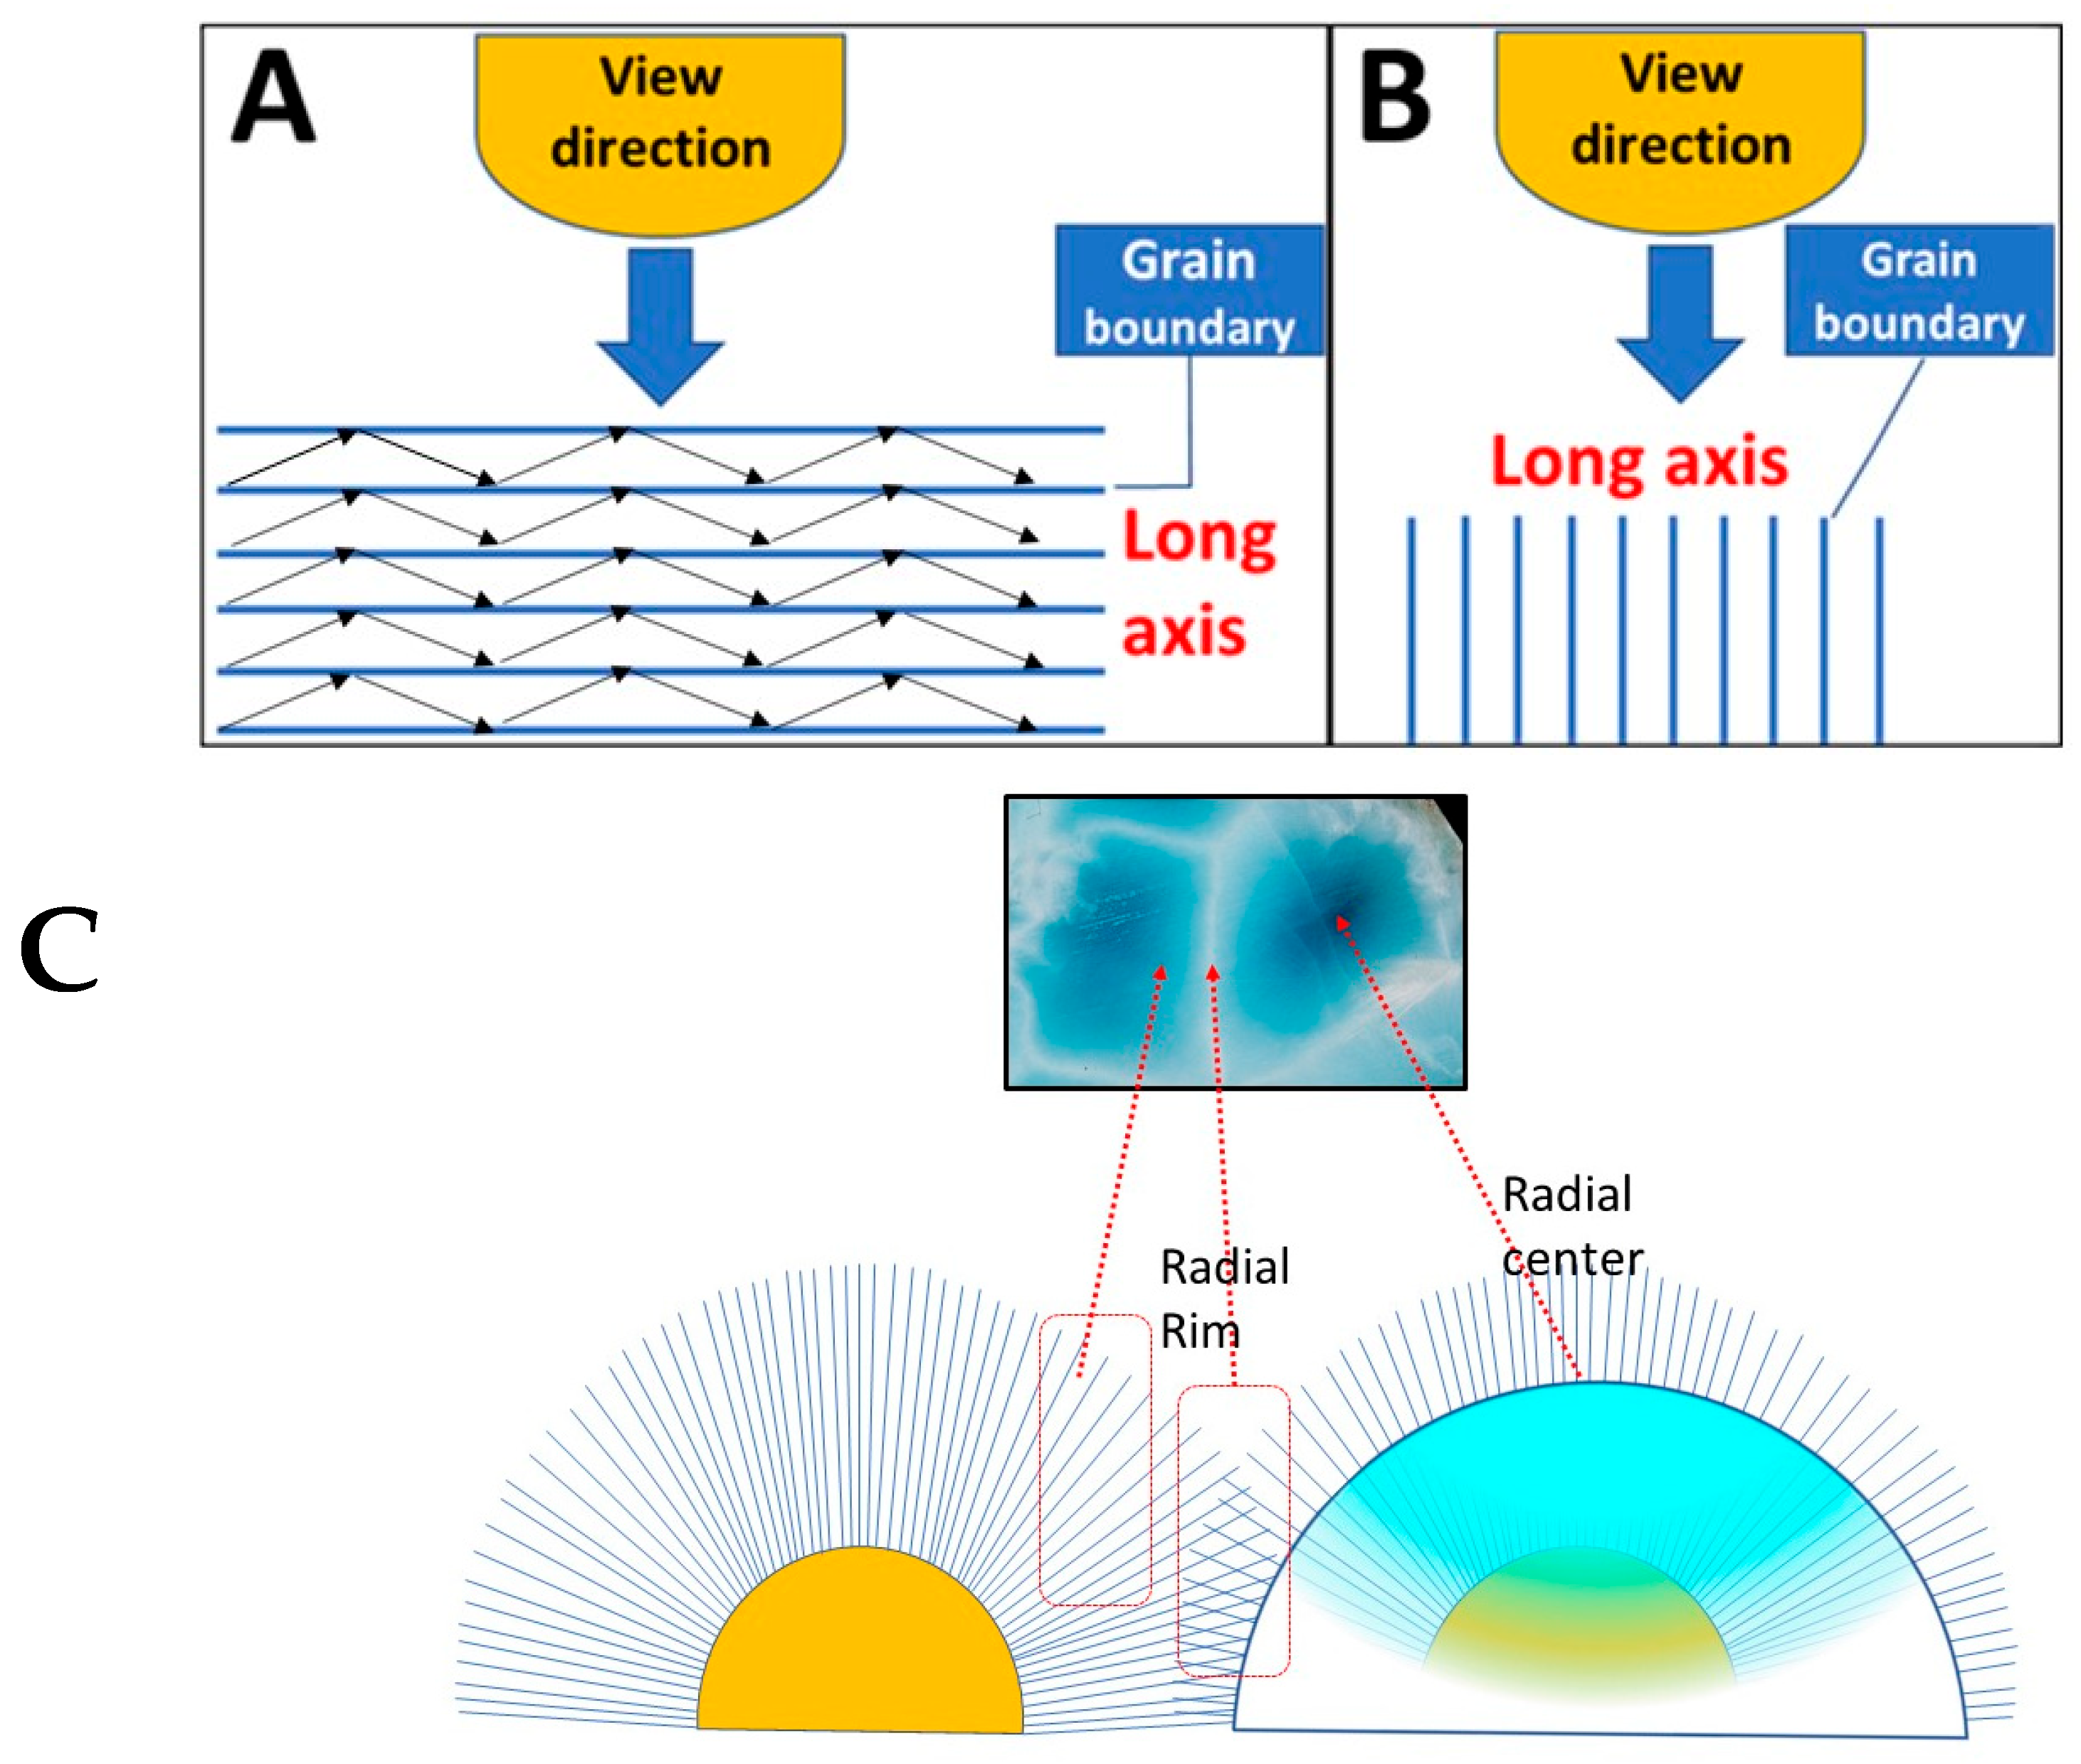
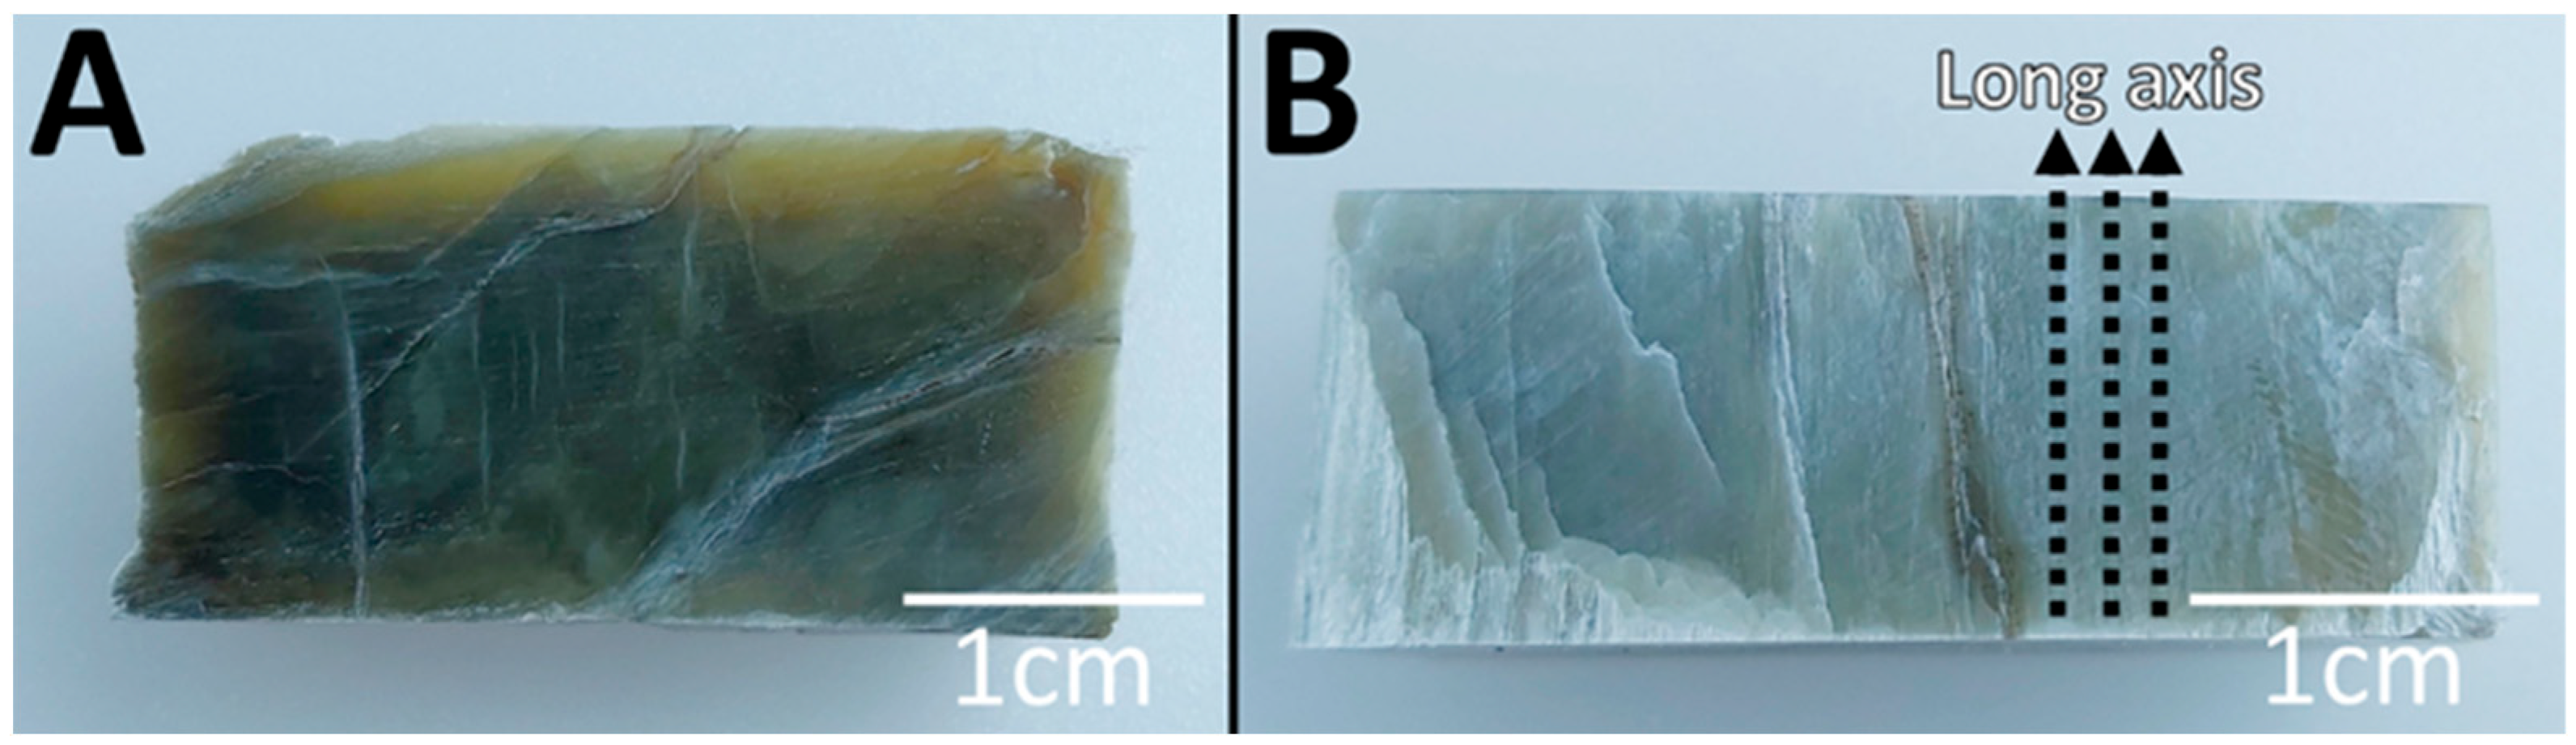
4.3. Optical Effect of Fibrous Textures

Dr. Heinz-Jürgen Bernhardt, from the Ruhr University Bochum, also studied three samples and analyzed the crystals of pectolites; however, he did not find the reason justifying color changes from blue to white from the radial center to the edge of the pectolite [11]. Our LA-ICP-MS analyses showed that vanadium is the element causing the bluish color of Larimar (Table 2); in fact, its content in the most intense blue samples was higher than 100.0 ppm. In the fibrous crystals of sample N6 from the radial center to the edge (Figure 13), the points N6-1, N6-2, N6-3, and N6-4 corresponded to blue, light blue, white, and colorless, respectively. At these points, we observe that the vanadium concentrations decrease gradually, from 85.4 ppm to 8.1 ppm (see Table 2). This further demonstrates that changes in vanadium concentration may indeed cause color variation. However, comparing the data in Figure 13 and Table 2, we observe that the vanadium content at the junction ends of the radial fibrous crystals in N7-3 and N9-3 also had values up to 101.0 ppm and 86.8 ppm, yet these two positions appeared as white streaks. This leads us to assume that, in addition to vanadium concentration, other physical factors may exist that control the change in color shades seen with the naked eye, giving Larimar the sea-wave characteristic and white streaks.
According to the results of microscopic thin-section observation, the white streaks of Larimar are caused by the change in the fibrous crystal direction in the junction positions (Figure 12D). When observed from different angles, some parts of the white streaks gradually transitioned to a dark-blue color (Figure 19A,B). When light passed through the sample, the white streak areas were relatively less transparent, while the radiating spherical center was more transparent (Figure 19C). According to another polarized microscopic photograph in Figure 20, it is confirmed that the fiber crystals in pectolite have a radial or spherulitic texture. Because the fiber crystals are growing from many nuclei sources, in the late stages of crystallization, the fiber crystals start to grow in chaotic directions due to the competition for the remaining growth space on the edges (Figure 12C,D). This implies that transmitted light would have to overcome more granular boundaries due to the chaotic crystal directions, resulting in a decrease in transmitted light and an increase in reflected light to display the white color (Figure 19A,C).
According to Snell’s law, when light passes from a material with a larger refractive index to a material with a lower one, total reflection will occur. This is equivalent to the principle of the optical fiber effect. Light with an incident angle greater than the critical angle will continuously undergo total reflection inside the fiber. The greater the refractive index difference between the inside of the fiber and the external medium, the better the effect of total reflection. According to the formula of critical angle, θc = arcsin (n2/n1), n1 is a medium with a high refractive index and n2 is a medium with a low refractive index. In the case of Larimar, pectolite has the higher refractive index (n1) of approximately 1.645, and the refractive index of air (n2) is approximately 1. The critical angle is 37°, based on the difference between the refractive indices n1 and n2. Thus, if the incident angle of light entering the crystal is greater than 37°, it can be reflected in the pectolite crystals. Therefore, it is speculated that most of the light inside the crystal of pectolite has a path closer to the long axis of the crystal due to the large refraction angle (Figure 21A). Therefore, when the line of sight is vertical to the long axis of the crystals, it is difficult for the light to transmit through the crystals because of the multiple granular boundaries (Figure 21A). When the long axis of the crystal is parallel to the line of sight, our view is that it would be easier to observe the natural colors of the pectolite crystals (Figure 21B). Therefore, the radial ball crystals will display different degrees of light penetration under the crystal angle changes (Figure 21C). In the radial center, the natural and dark color is observed; in the radial rim, more light is reflected and a white color is observed.
Based on the discussions above, we can divide the causes of white color in Larimar into physical and chemical factors. In the case of chemistry, the white or colorless color of pectolite is due to the scarce presence of chromophore elements. The physical mechanisms indicate the penetration and reflection of light based on the line of sight in relation to the crystal directions. These unique optical properties of fibrous minerals are also seen in other minerals, such as pink natrolite from Indonesia and cat’s-eye nephrite with a parallel fiber arrangement. The color variations are observed in different directions for fibrous nephrite (Figure 22). When our line of sight is parallel to the fiber direction, the natural color of nephrite is seen (Figure 22A), but the color becomes whiter if our view is vertical to the fibers (Figure 22B).

5. Conclusions

The analyses through UV–Vis have shown that the color of the Larimar is a mixture of blue and green. Furthermore, results from the LA-ICP-MS analysis led us to speculate that two elements may be the main cause of color: a high vanadium content causes the color to appear bluish, while a higher abundance of iron makes the greenish color. It has now been potentially confirmed that both V4+ and Fe2+ simultaneously replace Ca2+ positions in the pectolite structure. V4+ is speculated as being the main chromogenic mechanism responsible for the color center defects. Therefore, the process of heating pectolite at 250 °C may result in a fading effect of the blue color, while the green color is retained. The greenish parts in the samples of Larimar are often distributed on the contact boundaries of wall rocks. This implies the presence of augite, hematite, and chlorite in the host rock to offer the source of iron in Larimar crystals.
In addition, we investigated the physical optical phenomenon caused by the radial fiber arrangement structure, which affects the visual color observed. The radial rims of chaotic crystals increase the reflection of light, causing the “white streak” in the spherulitic boundary. When the long axis of the crystal is parallel to the line of sight in the radial center, it allows the dark-blue color of Larimar to be seen.
Pectolite, calcite, natrolite, and other minerals are deposited mainly by secondary filling in the pores or fissures of weathered basalt. In addition, due to the extremely high copper content in the wall rocks, a small amount of native copper or hematite can be seen in the ore veins distributed close to the wall rocks, yet we found that the copper content in the pectolite crystals was relatively low. Therefore, we speculate that Na, Si, Al, Ca, Fe, V, Cu, and other elements were dissolved from the highly oxidized basalt by an acidic hydrothermal fluid in the early stages of Larimar formation. As the acidic fluid penetrated the carbonate formation and carbon plant underlying the altered basalt (Figure 10), the pH of the hydrothermal fluid gradually increased and the temperature decreased, leading to the precipitation of native copper, hematite, natrolite, calcite, and then pectolite, filling in the veins and cavities of basalts. Combining the observations under the polarizing microscope, the growing sequence of minerals in the ore veins is natrolite, calcite, and then pectolite. According to the U-Th dating results of calcite, the pectolite is thought to have formed around 400,000 years ago or later.

Supplementary Materials

The following supporting information can be downloaded at: https://www.mdpi.com/article/10.3390/min13091221/s1, Figure S1: (A) Natrolite initiates its growth as columnar crystals along the periphery of the host rock, displaying transparent and well-formed crystal structures. Later on, blue pectolite fills the entire cavity during the later stages. (B) Hexagonal prismatic crystals of natrolite are enclosed within the interior of blue pectolite. (C) SEM image of a vertical c-axis section of natrolite; Figure S2: Portions of the natrolite crystals have undergone surface dissolution, with some sections being replaced by later-stage pectolite, preserving pseudomorphic features; Figure S3: Raman analysis results of sample N1, but the results indicated the presence of fluorescence interference; Figure S4: Raman analysis results of sample N2; Figure S5: Raman analysis results of sample N3; Figure S6: Raman analysis results of sample N4; Figure S7: Raman analysis results of sample N5; Figure S8: Raman analysis results of sample N6; Figure S9: Raman analysis results of sample N7; Figure S10: Raman analysis results of samples N8; Figure S11: Raman analysis results of sample N9; Figure S12: UV–Vis result of sample N1; Figure S13: UV–Vis result of sample N2; Figure S14: UV–Vis result of sample N3; Figure S15: UV–Vis result of sample N4; Figure S16: UV–Vis result of sample N5; Figure S17: The results of heating Larimar to 250 °C display a gradual change in color. Among these changes, the fading of the blue color is most prominent, ultimately leaving a gloomy green color. (A) the initial color of two samples at 0 h, (B) fading of blue color and thickening of green and black color after heating 216 h; Table S1: Mineral compositions and coloration by vanadium and iron ions.

Author Contributions

H.-M.H. prepared the manuscript and carried out most experiments; Y.-H.S. supported all samples and interviewed the discoverer of Larimar; H.-F.C. provided the idea, coordinated, and obtained funding; H.-Y.L. offered instruction of LA-ICP-MS; J.-N.F. offered the technique of XRF; C.-C.S. helped with the U-Th dating; B.-S.Y. supported the ICP-MS for rock samples. All authors have read and agreed to the published version of the manuscript.

Funding

The main funding of this study was sponsored by the National Science and Technology Council, Taiwan (NSTC, grant number 109-2116-M-019-006; 110-2116-M-019-006 to H.-F.C.). U-Th dating was also supported by NSTC (110-2123-M-002-009; 111-2116-M-002-022-MY3 to C.-C.S.; 111-2926-I-002-510-G to H.-M.H. and C.-C.S.), the Higher Education Sprout Project of the Ministry of Education, Taiwan, ROC (112L901001 to C.-C.S.), and the National Taiwan University (110L8907 to C.-C.S.). The LA-ICP-MASS was also supported by NSTC (110-2116-M-001-007; 111-2116-M-001-012 to H.-Y.L.).

Acknowledgments

The UV–Vis instrument was supported by Shu-Hong Lin, Taiwan Union Lab of Gem Research, Taipei.

Conflicts of Interest

The authors declare no conflict of interest.

References

  1. Woodruff, R.E. Larimar, beautiful, blue and baffling. Lapid. J. 1986, 39, 26–32. [Google Scholar]
  2. Woodruff, R.E.; Fritsch, E. Blue pectolite from the Dominican Republic. Gems Gemol. 1989, 25, 216–225. [Google Scholar] [CrossRef]
  3. Krzysztof, B.; Natkaniec-Nowak, L.; Rak, Z.; Stasica, J.; Heflik, W.; Mościcki, J.; Peña, M.; Muñoz, R.; George, C. Dominican larimar mining- current state and future prospects. Minerals 2022, 12, 181. [Google Scholar]
  4. Altamura, B. Larimar: A Pectolite Rock & Prized Lapidary Material. Nittany Mineralogical Society Bulletin, 4–6 May 2016. [Google Scholar]
  5. Koivula, J.I.; Misiorowski, E.B. Gem News: Pectolite. Gems Gemol. 1986, 22, 114. [Google Scholar]
  6. Woodruff, R.E. The new Caribbean gem. Aboard 1987, 11, 6–7, 35, 58–59. [Google Scholar]
  7. Nesse, W. Introduction to Optical Mineralogy; Oxford University Press: New York, NY, USA, 2013; p. 361. [Google Scholar]
  8. Ohashi, Y.; Finger, L.W. The role of octahedral cations in pyroxenoid crystal chemistry. I. Bustamite, wollastonite, and the pectolite-schizolite-serandite series sample SRN, from Rouma, Island of Los, Guinea. Am. Mineral. 1978, 63, 274–288. [Google Scholar]
  9. Tarassoff, P.; Horváth, L. Connoisseur’s Choice: Serandite, Mont Saint-Hilaire, Montérégie, Québec, Canada. Rocks Miner. 2019, 94, 350–357. [Google Scholar] [CrossRef]
  10. Espí, J.A.; Pérez-Puig, C. El proyecto sobre el estudio geológico y realización de infraestructura de apoyo a la minería del Larimar en la República Dominicana. Publicación Tecnológica Docente Esc. Minas Madr. 2009, 6, 102–113. (In Spanish) [Google Scholar]
  11. Espí, J.A. Estudio de fibras y colores del Larimar Dominicano. Boletín Geológico Min. 2017, 128, 783–801. (In Spanish) [Google Scholar] [CrossRef]
  12. Girard, D.; Beck, C.; Stephan, J.F.; Blanchet, R.; Maury, R. Pétrologie, géochimie et signification géodynmaique de quelques formations volcaniques crétacees péri-caraflaes. Bull. Société Géologique Fr. 1982, S7, 535–544. (In Spanish) [Google Scholar] [CrossRef]
  13. Escuder-Viruete, J.; Joubert, M.; Adad, M.; Pérez-Calera, F.; Gabites, J. The basaltic volcanism of the Dumisseau Formation in the Sierra de Bahoruco, SW Dominican Republic: A record of the mantle plume-related magmatism of the Caribbean Large Igneous Province. Lithos 2016, 254, 67–83. [Google Scholar] [CrossRef]
  14. Wagner, M.; Wachowiak, J.; Kowalczyk, J.; Natkaniec-Nowak, L.; Heflik, W.; Georges, C. Petrographic and mineralogical studies of fossil charcoal from Sierra de Bahoruco (Barahona Province, Dominican Republic). Int. J. Coal Geol. 2017, 173, 142–149. [Google Scholar] [CrossRef]
  15. Shen, C.C.; Wu, C.C.; Cheng, H.; Edwards, R.L.; Hsieh, Y.T.; Gallet, S.; Chang, C.C.; Li, T.Y.; Lam, D.D.; Kano, A.; et al. High-precision and highresolution carbonate 230Th dating by MC-ICP-MS with SEM protocols. Geochim. Cosmochim. Acta 2012, 99, 71–86. [Google Scholar] [CrossRef]
  16. Cheng, H.; Edwards, R.L.; Shen, C.C.; Polyak, V.J.; Asmerom, Y.; Woodhead, J.; Hellstrom, J.; Wang, Y.; Kong, X.; Spötl, C.; et al. Improvements in 230Th dating, 230Th and 234U half-life values, and U-Th isotopic measurements by multi-collector inductively coupled plasma mass spectrometry. Earth Planet Sci. Lett. 2013, 371, 82–91. [Google Scholar] [CrossRef]
  17. Shen, C.C.; Cheng, H.; Edwards, R.L.; Moran, S.B.; Edmonds, H.N.; Hoff, J.A.; Thomas, R.B. Measurement of attogram quantities of 231Pa in dissolved and particulate fractions of seawater by isotope dilution thermal ionization mass spectroscopy. Anal. Chem. 2003, 75, 1075–1079. [Google Scholar] [CrossRef] [PubMed]
  18. Alvarado, G.E.; Verdeja, E.; Rodríguez, J.; Barrantes, M. Contribution on the larimar host rock (Dominican Petrographic Republic) and some notes about its origin. Boletín Geológico Min. 2017, 128, 767–782. (In Spanish) [Google Scholar] [CrossRef]
  19. Hiess, J.; Condon, D.J.; McLean, N.; Noble, S.R. 238U/235U systematics in terrestrial U-bearing minerals. Science 2012, 335, 1610–1614. [Google Scholar] [CrossRef]
  20. Bente, K.; Thum, R.; Wannemacher, J. Colored pectolites, so-called “Larimar”, from Sierra de Baoruco, Barahona Province, southern Dominican Republic. Neues Jahrb. Für Mineral. Monatshefte (J. Mineral. Geochem.) 1991, 1, 14–22. (In Spanish) [Google Scholar]
  21. Shannon, R.D. Revised Effective Ionic Radii and Systematic Studies of Interatomic Distances in Halides and Chalcogenides. Acta Crystallogr. Sect. 1976, 32, 751–761. [Google Scholar] [CrossRef]
  22. Chen, H.F.; Fang, J.N.; Lo, H.J.; Song, S.R.; Chung, S.H.; Chen, Y.L.; Lin, I.C.; Li, L.J. Syntheses of zeolites of the gismondine group. West. Pac. Earth Sci. 2002, 2, 331–346. [Google Scholar]
  23. Chen, H.F.; Song, S.R.; Lo, H.J.; Li, L.J.; Fang, N.F.; Chen, Y.L.; Lin, I.C.; Liu, Y.J.; Liu, C.M.; Kuo, L.W. Dissolution of Na2O·CaO·nSiO2 glasses in Na2CO3 solution for long-term and short-term experiments. J. Non-Cryst. Solids 2005, 351, 1417–1425. [Google Scholar] [CrossRef]
Figure 1. The location of the Larimar mine and its original discovery—Playa Bahoruco.
Minerals 13 01221 g001
Figure 2. Photo of Yu-Hong Shih (left), the second author of this article, and Miguel Méndez (right), the discoverer of Larimar, who met at the first Dominican National Congress, where the conference defined Larimar as the National Stone of the Dominican Republic.
Minerals 13 01221 g002
Figure 3. Larimar gem with sea-wave features.
Minerals 13 01221 g003
Figure 4. Spots of native copper crystals grown within interstitial Larimar.
Minerals 13 01221 g004
Figure 5. Larimar fragments wrapped in laterite.
Minerals 13 01221 g005
Figure 6. Larimar-filled basalt fissures.
Minerals 13 01221 g006
Figure 7. Plant fossil with unapparent Larimar replacement.
Minerals 13 01221 g007
Figure 8. Plant fossil completely replaced by calcite and Larimar.
Minerals 13 01221 g008
Figure 9. Basalt with hematite mineralization.
Minerals 13 01221 g009
Figure 10. Geological profile of the Larimar mine area and the proportion of differently colored pectolites in the different layers. The geological column was modified from Espí and Pérez-Puig (2009) [10], and the count was finished by our second author.
Minerals 13 01221 g010
Figure 11. Blue–green pectolite in the interstice of calcite; the red square is the sampling position for U-Th dating. The light-blue pectolite filled in the fissure of calcite.
Minerals 13 01221 g011
Figure 12. Two thin sections were made from sample P: one is P-1 (photos A and B), near the wall rock, and the other is P-2 (photos C and D), located at the triple junction of white streaks. In P-1, we can observe the symbiosis of the three minerals: pectolite (Pct), calcite (Cal), and natrolite (Ntr). P-2 is mainly composed of fine fibrous pectolite. (Photos A and C: crossed nicol; photos B and D: open nicol.
Minerals 13 01221 g012
Figure 13. Raman and elemental analysis points of each sample. The number 1, 2, 3 and 4 on the photos means the analyzed position of Micro-Raman and chemical composition.
Minerals 13 01221 g013
Figure 14. The Raman spectrum of each analysis point in sample N5, all of which were determined to be pectolite after comparison to the RRUFF database.
Minerals 13 01221 g014
Figure 15. Histogram of Larimar’s color and element correlations. The column-shaped color blocks represent the color of the pectolite: B for blue color, G for green color, and W for white and colorless.
Minerals 13 01221 g015
Figure 16. Sample photos of wall rocks R1, R2, and laterite R3. The red rectangle is sampling area.
Minerals 13 01221 g016
Figure 17. XRD plot of the sample R1.
Minerals 13 01221 g017
Figure 18. These photos show that green Larimar is distributed almost against the wall rocks.
Minerals 13 01221 g018
Figure 19. Observing Larimar from different angles; the red square frames in (A,B) are at the same position. However, the original dark-blue color in (A) turned white when it was flipped by 180°. (C) was used for the observation of penetrating light, and the transmittance at the white streaks was low.
Minerals 13 01221 g019
Figure 20. Larimar growing with radial fibers. Pectolite grew later than calcite and penetrated into the cracks of calcite (Pct: pectolite, Cal: calcite).
Minerals 13 01221 g020
Figure 21. (A) The line of sight is perpendicular to the long axis of the fiber, and more light is reflected to the naked eye, leading to a white color. (B) When the line of sight is parallel to the long axis of the fiber, light passes directly through the crystals to our eyes, and the natural color can be seen. (C) Different directions of the radial ball crystals display a natural color in the cutting center and white reflection at the edge of the crystal boundary.
Minerals 13 01221 g021
Figure 22. (A) The long axis of the fibrous nephrite is perpendicular to the page, which allows its natural color to be seen. (B) The long axis of crystals is parallel to the page for observation. The multi-layer grain boundary barrier causes light reflection, resulting in a white color and less light penetration.
Minerals 13 01221 g022
Table 1. Semi-quantitative results of EDS analyses on the marked points of each sample from Figure 13 (unit: wt%). The colors displayed in the “Spot” column represent the color of pectolite observed with the naked eye.
SampleSpotColorNa2OCaOSiO2Total
N11Greenish blue8.133.558.4100.0
2White8.832.558.7100.0
3Greenish blue8.332.559.2100.0
N21Greenish blue9.533.257.4100.1
2Greenish blue8.333.957.8100.0
3White9.033.557.5100.0
N31White8.433.957.699.9
2Greenish blue8.334.357.399.9
3Greenish blue8.334.357.399.9
N41Light blue8.832.558.7100.0
2White8.832.758.5100.0
3White9.032.358.7100.0
N51Light green8.333.558.2100.0
2Green8.133.658.4100.1
3Blue7.933.658.5100.0
4Green7.934.058.099.9
N61Greenish blue10.232.557.3100.0
2Greenish blue11.131.257.6100.0
3White10.832.656.6100.0
4White11.330.258.6100.0
N71Blue9.034.756.3100.0
2Blue8.035.656.5100.0
3White7.735.157.2100.0
N81Blue7.635.357.1100.0
2Blue8.736.055.3100.0
3White7.735.556.9100.0
N91Greenish blue8.335.356.5100.0
2Greenish blue7.036.556.6100.0
3White9.234.156.8100.0
Table 2. LA-ICP-MS analysis results of Larimar on the marked points of each sample from Figure 13 (unit: ppm). The colors displayed in the “Spot” column represent the color of pectolite observed with the naked eye.
SampleSpotColorVCoCuFeTi (ppm)
N11Greenish blue198.30.35.0765.185.7
2White58.80.23.7543.639.2
3Greenish blue197.60.26.5626.064.8
N21Greenish blue129.70.23.7528.411.2
2Greenish blue111.10.23.9545.112.1
3White41.40.23.8537.820.5
N31White13.80.23.7543.929.5
2Greenish blue84.70.23.7507.713.8
3Greenish blue93.80.23.7514.511.8
N41Light blue107.10.34.7669.875.9
2White35.20.13.8546.420.7
3White21.40.23.6501.926.3
N51Light green71.60.23.7869.450.4
2Green77.10.23.7838.053.9
3Blue140.20.23.7633.219.8
4Green82.50.23.7848.048.0
N61Greenish blue85.40.23.8568.415.0
2Greenish blue78.40.23.6538.814.3
3White43.00.23.9564.512.1
4White8.1-3.9587.851.0
N71Blue170.10.23.8689.333.8
2Blue159.60.23.7677.438.1
3White101.00.23.7646.731.7
N81Blue139.60.13.9509.513.8
2Blue141.00.23.7523.714.7
3White60.10.23.7506.619.4
N91Greenish blue153.20.14.1545.311.3
2Greenish blue142.30.23.8526.511.0
3White86.80.10.1505.711.0
Average White47.00.23.4548.526.1
Blue133.30.24.1585.527.9
Green77.00.23.7851.850.7
Table 3. Results of trace element analysis in Larimar wall rocks.
ElementsVCoCuFeTi
Unitppmppmppmwt%wt%
R1145.040.32042.94.00.4
R289.052.3285.06.60.5
R375.088.4116.98.80.8
Table 4. Uranium and thorium isotopic compositions and 230Th ages of calcite within the Larimar.
Sample238U232Thδ234U[230Th/238U]230Th/232ThAge
(kyr ago)
Age
(kyr BP)
δ234Uinitial
ID10−9g/g a10−12g/gMeasured aActivity cAtomic (×10−6)UncorrectedCorrected c,dCorrected b
Calcite67.23±0.115251±157.9±4.90.9837±0.0078207.7±1.7395±41393±4124±15
Analytical errors are 2σ of the mean. a [238U] = [235U] × 137.818 (±0.65‰) (Hiess et al., 2012) [19]; δ234U = ([234U/238U]activity − 1) × 1000. b 234Uinitial corrected was calculated based on 230Th age (T), i.e., δ234Uinitial = δ234Umeasured × eλ234*T, and T is the corrected age. c [230Th/238U]activity = 1 − e−λ230T + (δ234Umeasured/1000)[λ230/(λ230 − λ234)](1 − e−(λ230−λ234)T), where T is the age. Decay constants used are available in Cheng et al. (2013) [16]. d Age corrections, relative to AD 1950, were calculated using an estimated atomic 230Th/232Th ratio of 4 (±2) × 10−6. Those are the values for a material at secular equilibrium, with the crustal 232Th/238U value of 3.8. The errors are arbitrarily assumed to be 50%.
Table 5. The possible cations and their ionic radii in pectolite [21].
ElementsCoordination NumberShannon–Prewitt Crystal Radius
V2+60.93 Å
V3+60.78 Å
V4+60.72 Å
V5+60.68 Å
Fe2+60.75 Å (low spin)
0.92 Å (high spin)
Fe3+60.69 Å (low spin)
0.79 Å (high spin)
Si4+40.4 Å
Ca2+61.14 Å
Disclaimer/Publisher’s Note: The statements, opinions and data contained in all publications are solely those of the individual author(s) and contributor(s) and not of MDPI and/or the editor(s). MDPI and/or the editor(s) disclaim responsibility for any injury to people or property resulting from any ideas, methods, instructions or products referred to in the content.

