Article

Research on Fractal Characteristics and Influencing Factors of Pore-Throats in Tight Sandstone Reservoirs: A Case Study of Chang 6 of the Upper Triassic Yanchang Formation in Huaqing Area, Ordos Basin, China

1
State Key Laboratory of Oil and Gas Reservoir Geology and Exploitation, Chengdu University of Technology, Chengdu 610059, China
2
Institute of Sedimentary Geology, Chengdu University of Technology, Chengdu 610059, China
3
No. 2 Gas Production Plant, PetroChina Changqing Oilfield Company, Yulin 710016, China
4
School of Earth Sciences and Engineering, Xi’an Shi You University, Xi’an 710065, China
*
Author to whom correspondence should be addressed.
Minerals 2023, 13(9), 1137; https://doi.org/10.3390/min13091137
Submission received: 25 July 2023 / Revised: 11 August 2023 / Accepted: 23 August 2023 / Published: 28 August 2023

Abstract

:
In recent years, tight sandstone oil and gas have been an important area for unconventional oil and gas exploration and development in China. It is of great significance to clarify the pore-throat structure characteristics of tight sandstone reservoirs to guide production practices. This study takes the tight sandstone of the sixth member of the Yanchang Formation in the Huaqing area, Ordos Basin, as an example, based on experimental methods such as high-pressure mercury intrusion, cast thin sections and scanning electron microscopy. At the same time, the pore-throat structure of tight sandstone reservoirs is divided into three types using the tube-bundle and spherical fractal models. The corresponding pore and throat radius distribution, pore-throat combination mode and influencing factors of various pore-throats are studied. The results show that the fractal dimension of type I pore-throats is the smallest, and the distribution of their pore-throat radii is the most uniform. They are dominated by intercrystalline pores and dissolution pores with tube-bundle throats and small pores with small throats. Type II pore-throats have the largest fractal dimension and the worst pore-throat uniformity. They are dominated by residual primary intergranular pores with necked throats and large pores with small throats. The type III pore-throat fractal dimension is in the middle, mainly composed of residual dissolved intergranular pores with pore-reduced throats, sheet-like and curved sheet-like throats, and large pores with large throats. The influence of different pore-throat combinations on the reservoir is reflected in the different characteristics of mercury injection parameters. The main influencing factors for the differences in the fractal dimensions of different pore-throats are diagenesis, rock composition and pore-throat combination type. Diagenesis and rock composition, in turn, affect the type and development degree of pore-throats, as well as the combination of pore-throats. The purpose of this study was to clarify the internal connection modes of different homogeneous pore-throats and their influencing factors, enrich the theoretical basis for the study of tight sandstone reservoirs and provide theoretical guidance for their exploration and development.

1. Introduction

The fractal dimension was first proposed by mathematician Mandelbrot in 1975 [1,2,3]. The fractal dimension is a general term for figures, structures and phenomena that have no characteristic length but have similarities. It reflects the basic properties of a wide range of objects in nature, that is, the self-similarity between part and part and between part and whole in form, function and information [4,5]. It is a mathematical statistical theory to study the self-similarity of objects, and it is a relatively accurate quantitative representation reflecting the inhomogeneity of the basic properties of a formation in three-dimensional space [6,7]. After decades of exploration and research, the fractal dimension has become relatively mature in the fields of physics [8], mathematics [9], geology [10,11] and materials [12] and has achieved corresponding results. In the field of geology, it is mainly used in coal seams [13,14], tight sandstone reservoirs [15], mud shale [16,17] and other pore structure characterization [18,19]; reservoir heterogeneity characterization [20]; and determining the influencing factors of reservoir densification [21]. The data relied on mainly come from experiments such as high-pressure mercury intrusion [2,3,5], constant-rate mercury intrusion [22], nitrogen adsorption [16], CT scanning [23] and nuclear magnetic resonance [24,25].
Previous researchers have performed much research on the pore-throat structure of different tight sandstone reservoirs based on mercury intrusion data using fractal dimensions [3,5,15]. However, most of them only use a fractal model to study the pore-throat structure, and the results obtained are not comprehensive and objective. Research on the factors that cause differences in the different types of pore-throat structures is not detailed enough [21,22]. In this study, the sixth member of the Upper Triassic Yanchang Formation (hereafter referred to as the Chang 6 Member) in the Huaqing area of the Ordos Basin was examined, based on high-pressure mercury intrusion data, combined with experimental methods such as cast thin sections, scanning electron microscopy and two fractals (a sphere and a tube bundle), which were used at the same time. A model was developed to study the fractal characteristics of tight sandstone reservoirs. Innovations were achieved in the methodology for classifying pore-throats, classifying the pore-throat types and clarify the relationships between the fractal characteristics of different types of pore-throat and reservoir physical properties and parameters related to mercury intrusion. The reasons for the different pore-throat types were studied in detail, and the main pore and throat combination types in various pore-throat types were clarified. This study provides a theoretical basis for the exploration and exploitation of tight sandstone reservoirs.

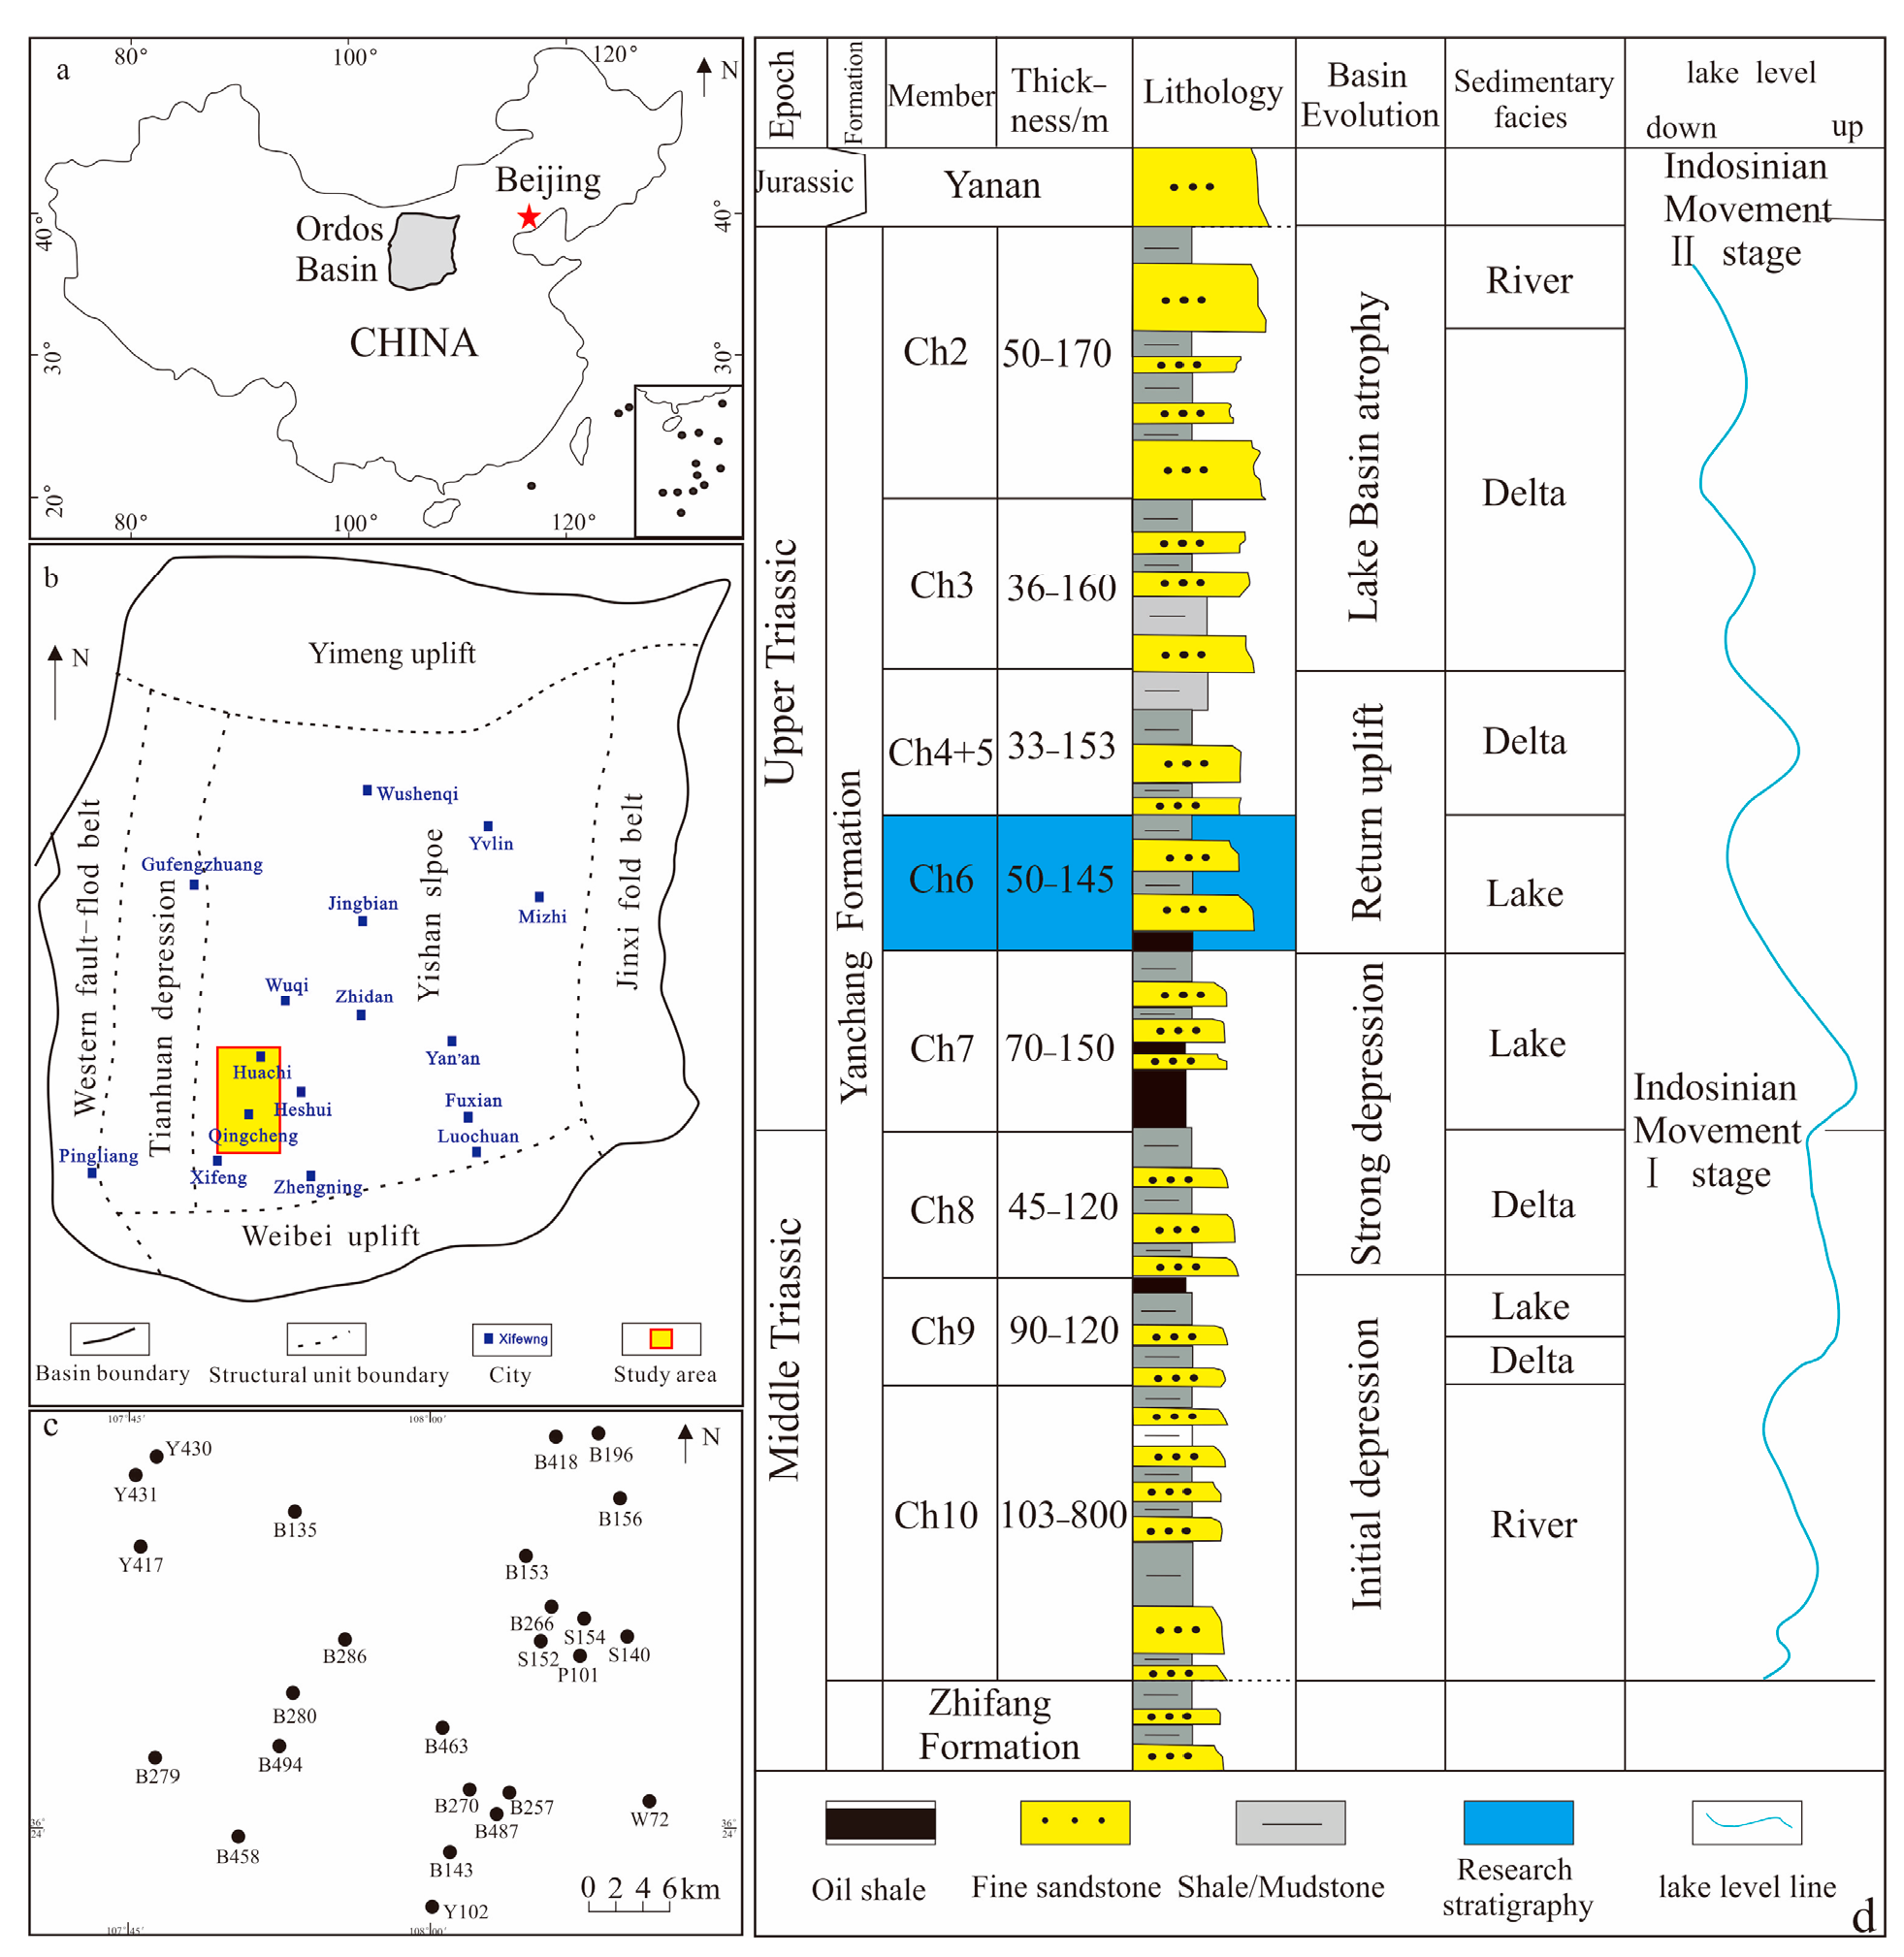
2. Geological Setting

The Ordos Basin mainly experienced the Luliang Movement, the Jinning Movement, the Caledonian Movement [26,27], the Hercynian Movement [28,29], the Indosinian Movement and the Himalayan Movement [30,31]. The contour of the basin tends to be obvious from the late Indosinian Movement, when the deposition centre is biased to the south of the basin, but the subsidence centre is biased to the west of the basin [32]. The overall uplift of the basin occurred during the Himalayan Movement, when the lake basin tended to disappear, forming the current basin pattern. The entire basin is relatively complete from bottom to top, and the Silurian to Lower Carboniferous strata are mainly missing [33]. The Huaqing area is located southwest of the Yishaan slope (Figure 1b). The Upper Triassic Yanchang Formation is divided into 10 oil layers from bottom to top, which are called Chang 10 to Chang 1. The lake basin had the largest area during the Chang 7 period after experiencing the process of water inflow and outflow during lake basin expansion [34,35], shrinkage and disappearance, and the lake basin in the Chang 6 period was in the shrinking stage [36] (Figure 1c). Gravity flow deposits were mainly developed in the study area [37], and the scale of sand body deposits is large, forming favourable reservoirs.
The distribution of sand bodies in the Chang 6 reservoir in the study area varies greatly on the plane, with different thicknesses [38]. The sedimentary environment is mainly delta and lake [39,40]. The frequencies of mudstone interlayers are also different, and mudstone interlayers have a certain impact on the continuity of the reservoir [41]. The lithology is mainly composed of siltstone, fine sandstone, argillaceous siltstone, silty mudstone, etc. [42,43]. The reservoir belongs to tight sandstone reservoirs with low porosity (5 ≤ porosity ≤ 10), extra-low porosity (porosity ≤ 5) and ultra-low permeability (permeability ≤ 1), and the relationship between porosity and permeability is good [44]. Affected by compaction, the macroscopic and microscopic heterogeneity of the reservoir is considerable [45,46].

3. Experimental Data and Methods

3.1. Experimental Data

In this study, the research on the rock composition and storage space type of the Chang 6 reservoir in the Huaqing area was based on 546 cast thin section data, scanning electron microscopy and other experimental testing methods. The thin sections were impregnated with red-dyed epoxy. Parameters such as reservoir porosity, permeability, sorting coefficient, mercury removal efficiency, capillary pressure and mercury injection saturation were obtained through 59 high-pressure mercury intrusion experiments. Scanning electron microscopy was performed using a JSM-7500F instrument at room temperature. The cast thin sections were identified using a ZEISS Z1 polarizing microscope at 20 °C and ambient humidity of 50% for rock composition and pore types. The experimental instruments used for high-pressure mercury porosimetry were an American Corelab CM300 and an American Autopore IV9505 mercury porosimeter. The samples were dried at 105 °C to constant weight before testing. The mercury intrusion experiment included pressurized mercury injection and reduced-pressure mercury removal. The maximum experimental pressure was 200 MPa.
The calculation of the pore-throat radius was obtained using the capillary pressure calculation formula (Equation (1)) [2,3], where Pc = the capillary pressure between the mercury and air, R is the pore-throat radius, σ is the interfacial tension taken as 480 dyn/cm and θ is the contact angle between mercury and the rock surface, which is 140°. The fractal dimension of the capillary pressure was obtained through the establishment of a spherical fractal model and a tube-bundle fractal model.
P c = 2 σ c o s θ R

3.2. Fractal Dimension Model

Currently, there are two main methods for calculating the fractal dimension of the high-pressure mercury intrusion capillary pressure curve: the sphere-type model and the tube-bundle-type model. The calculation formula is as follows (Table 1). According to the calculation formulas of the two models, the two models should be suitable for pore-throats with a mercury injection gradient of less than 1 (lg(1 − SHg)) and greater than 1 (lg SHg). In this study, two models are used to obtain the fractal dimension of the high-pressure mercury intrusion capillary pressure to characterize the full pore-throat. The fractal dimension of the sphere can be determined using the double logarithmic curve relationship between 1 − SHg and Pc. The fractal dimension of the tube bundle can be determined using the double logarithmic curve relationship between SHg and Pc. The fractal dimension of porous lithology is mostly distributed between 2 and 3. The smaller the fractal dimension value, the more uniform the pore-throat size distribution and the smaller the reservoir heterogeneity. The larger the value, the more disordered the pore-throat size distribution of the reservoir and the greater the heterogeneity of the reservoir.

4. Results

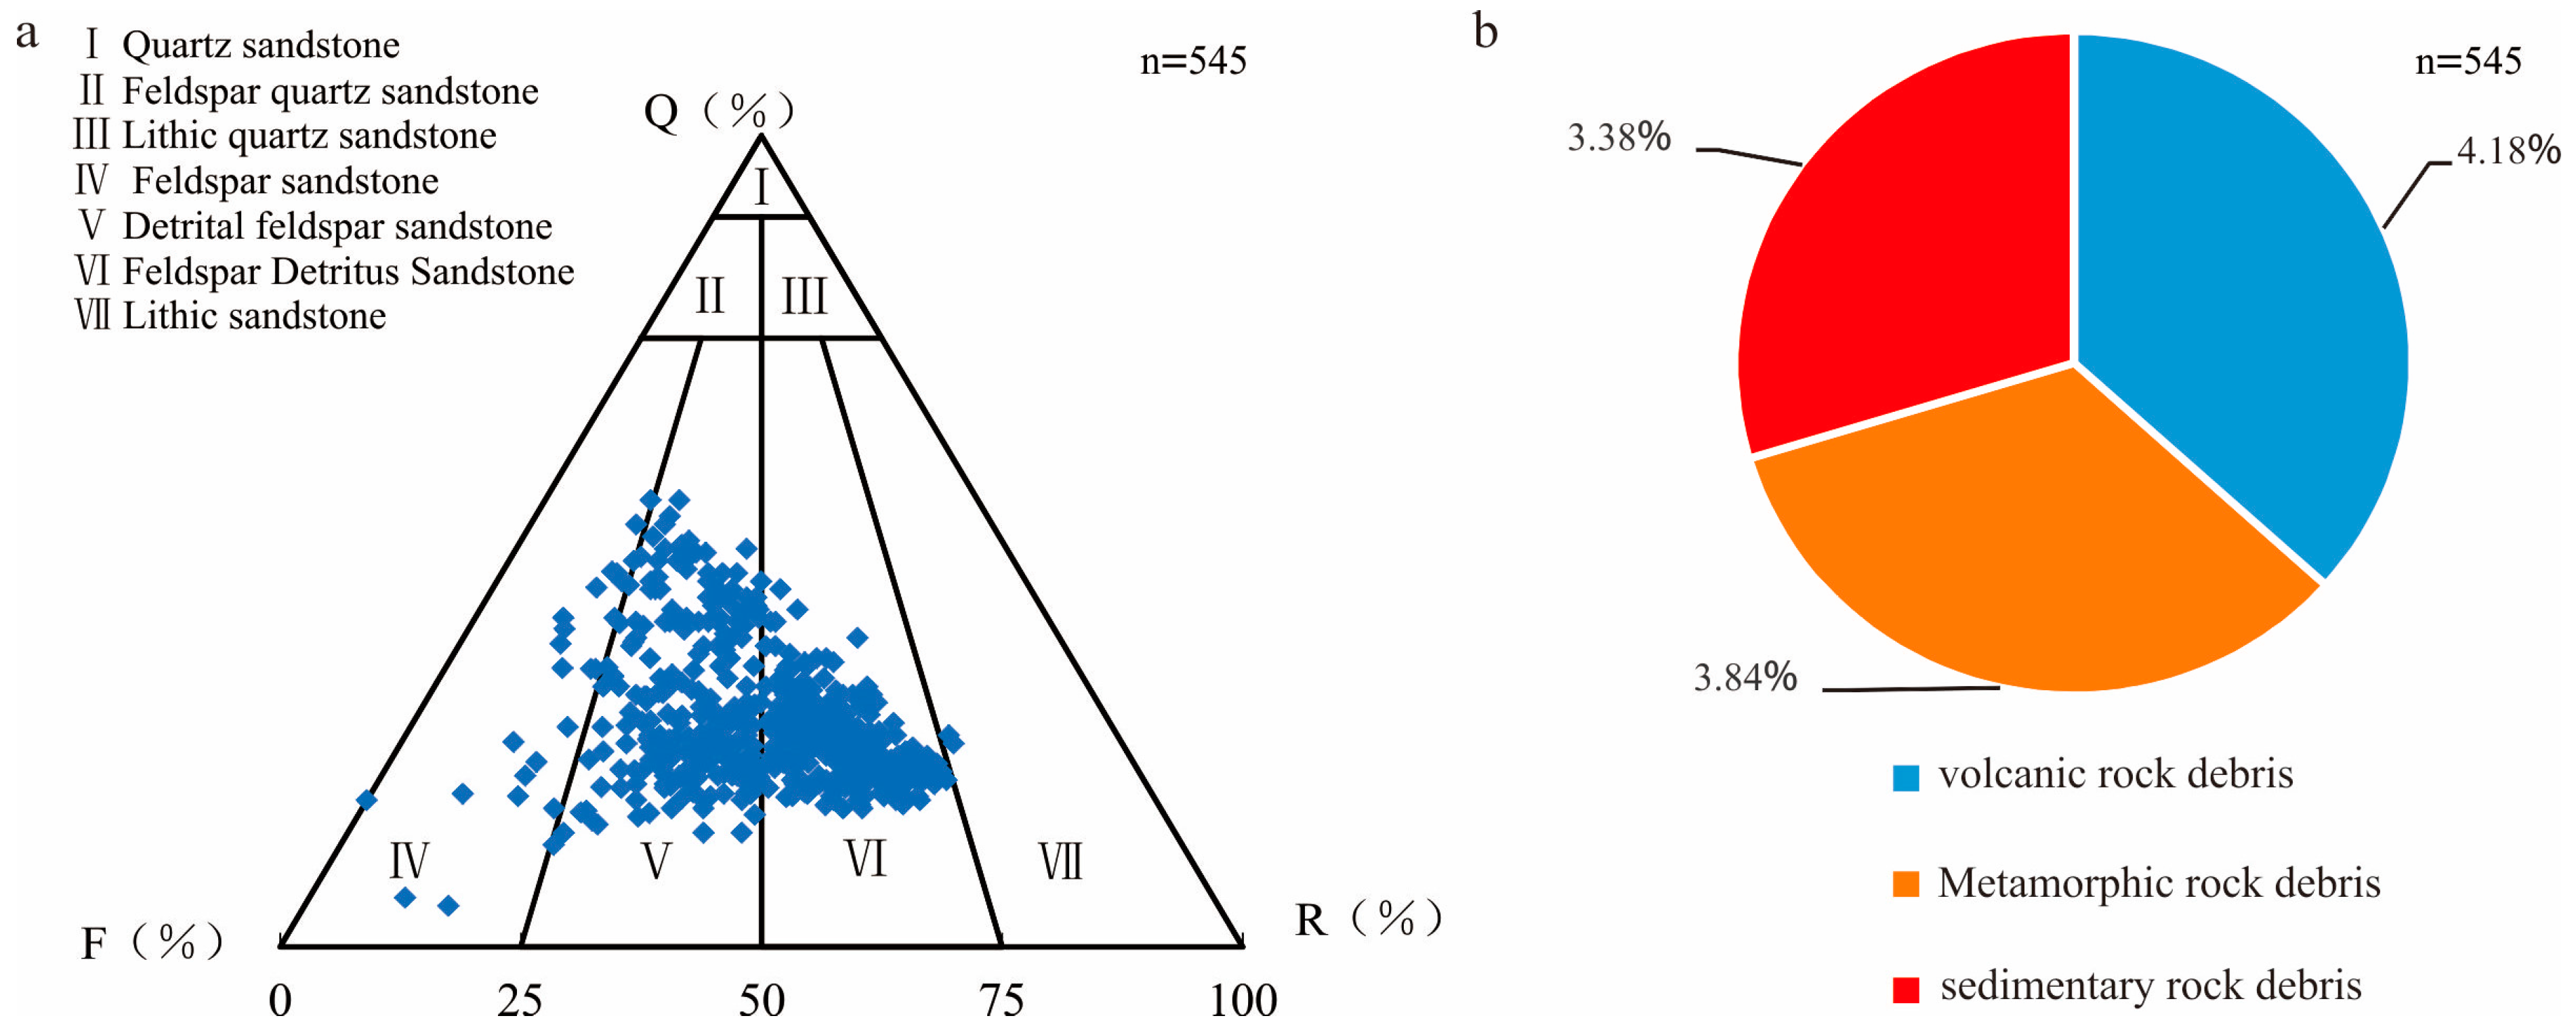
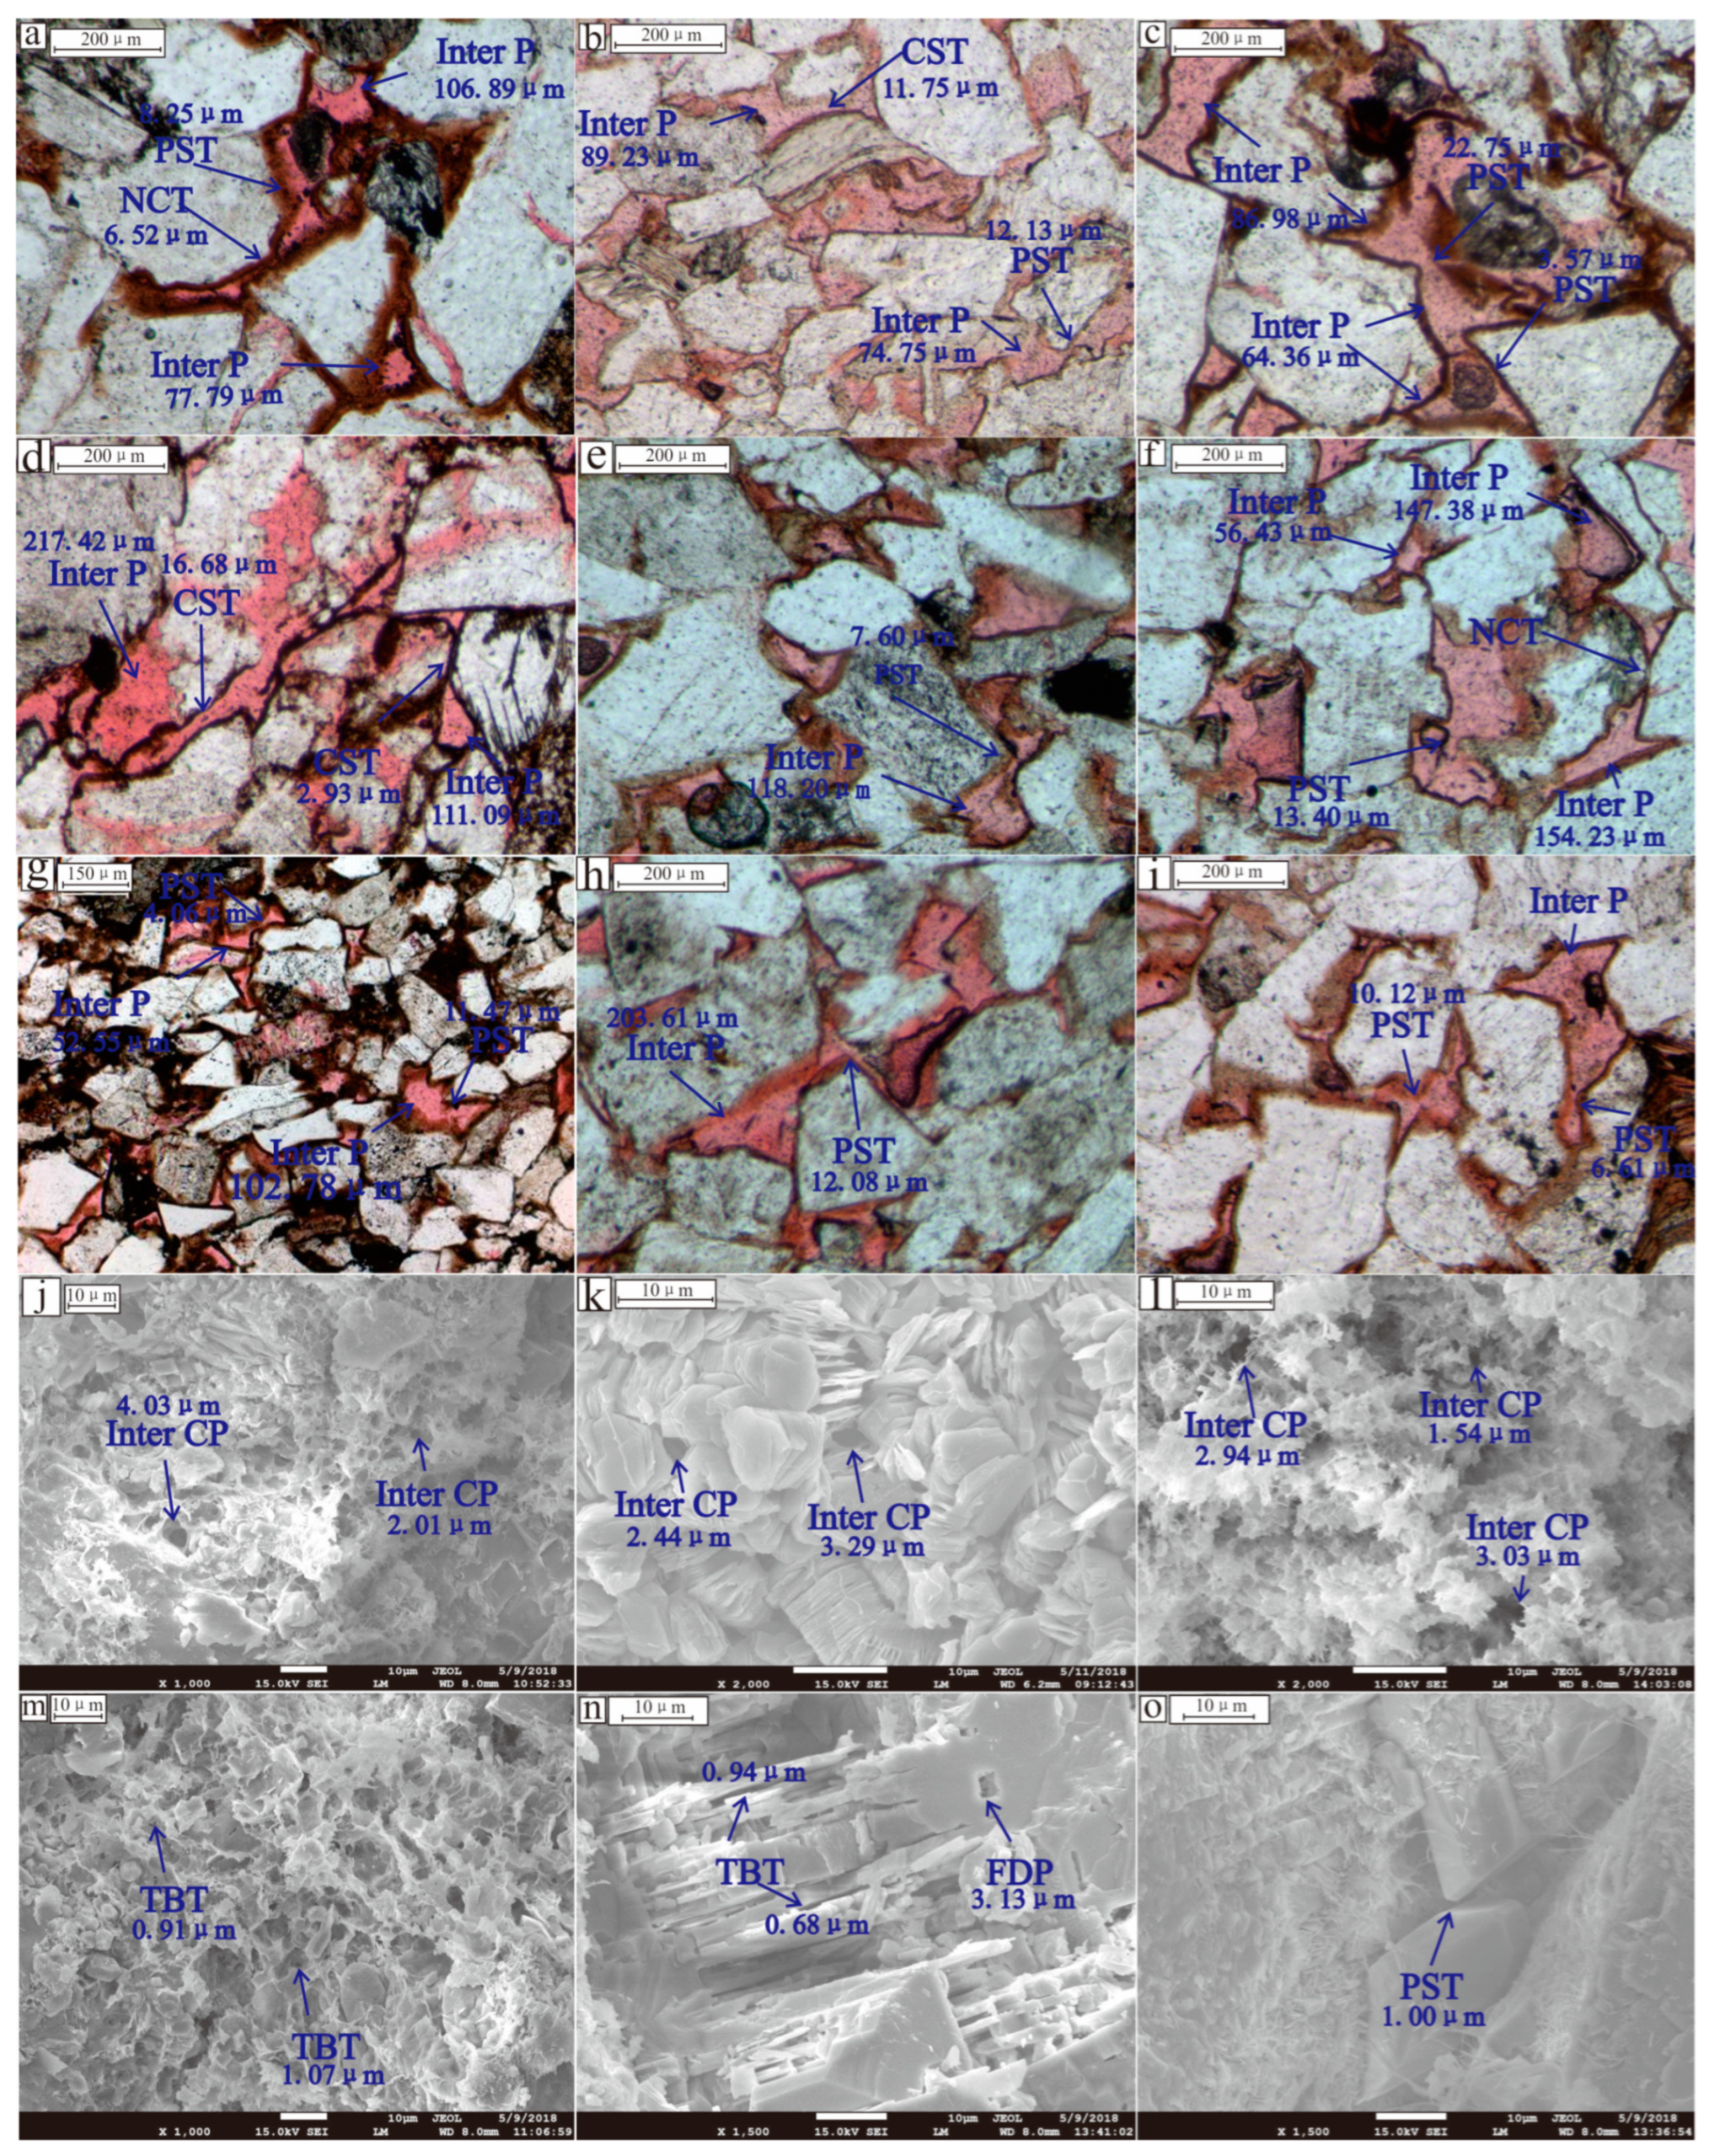
4.1. Petrological Features

The lithology of the Chang 6 reservoir in the study area is mainly grey-dark grey fine siltstone, and plant debris and stem fossils can be seen in the core (Figure 2a–c). The sedimentary environment comprises a delta and shallow lake. According to the Folk sandstone classification standard, the Chang 6 reservoir sandstone in the study area is mainly composed of feldspar lithic sandstone and lithic feldspar sandstone and a small amount of feldspar sandstone and lithic sandstone (Figure 3). The quartz content is between 5% and 55%, with an average of 27.61%. The feldspar content is between 9.2% and 59%, with an average of 36.72%. The content of debris is between 2% and 34.7%, with an average of 11.41%. Among them, the content of volcanic debris is the highest, with an average of 4.18%, followed by metamorphic debris, with an average of 3.84%, and the content of sedimentary debris is the lowest, with an average of 3.38% (Figure 3), of which carbonate debris is dominant. The mica content is between 1% and 28.3%, with an average of 8.01%. The clay mineral content is between 0.2% and 69%, with an average of 9.31%. The carbonate cement content is between 0.2% and 73%, with an average of 4.86%. The siliceous content is between 0.2% and 6%, with an average of 1.59% (Table 2). The particles are mainly in point-line contact, the sorting is poor–medium, and the rounding is mainly subangular (Figure 2d–f).

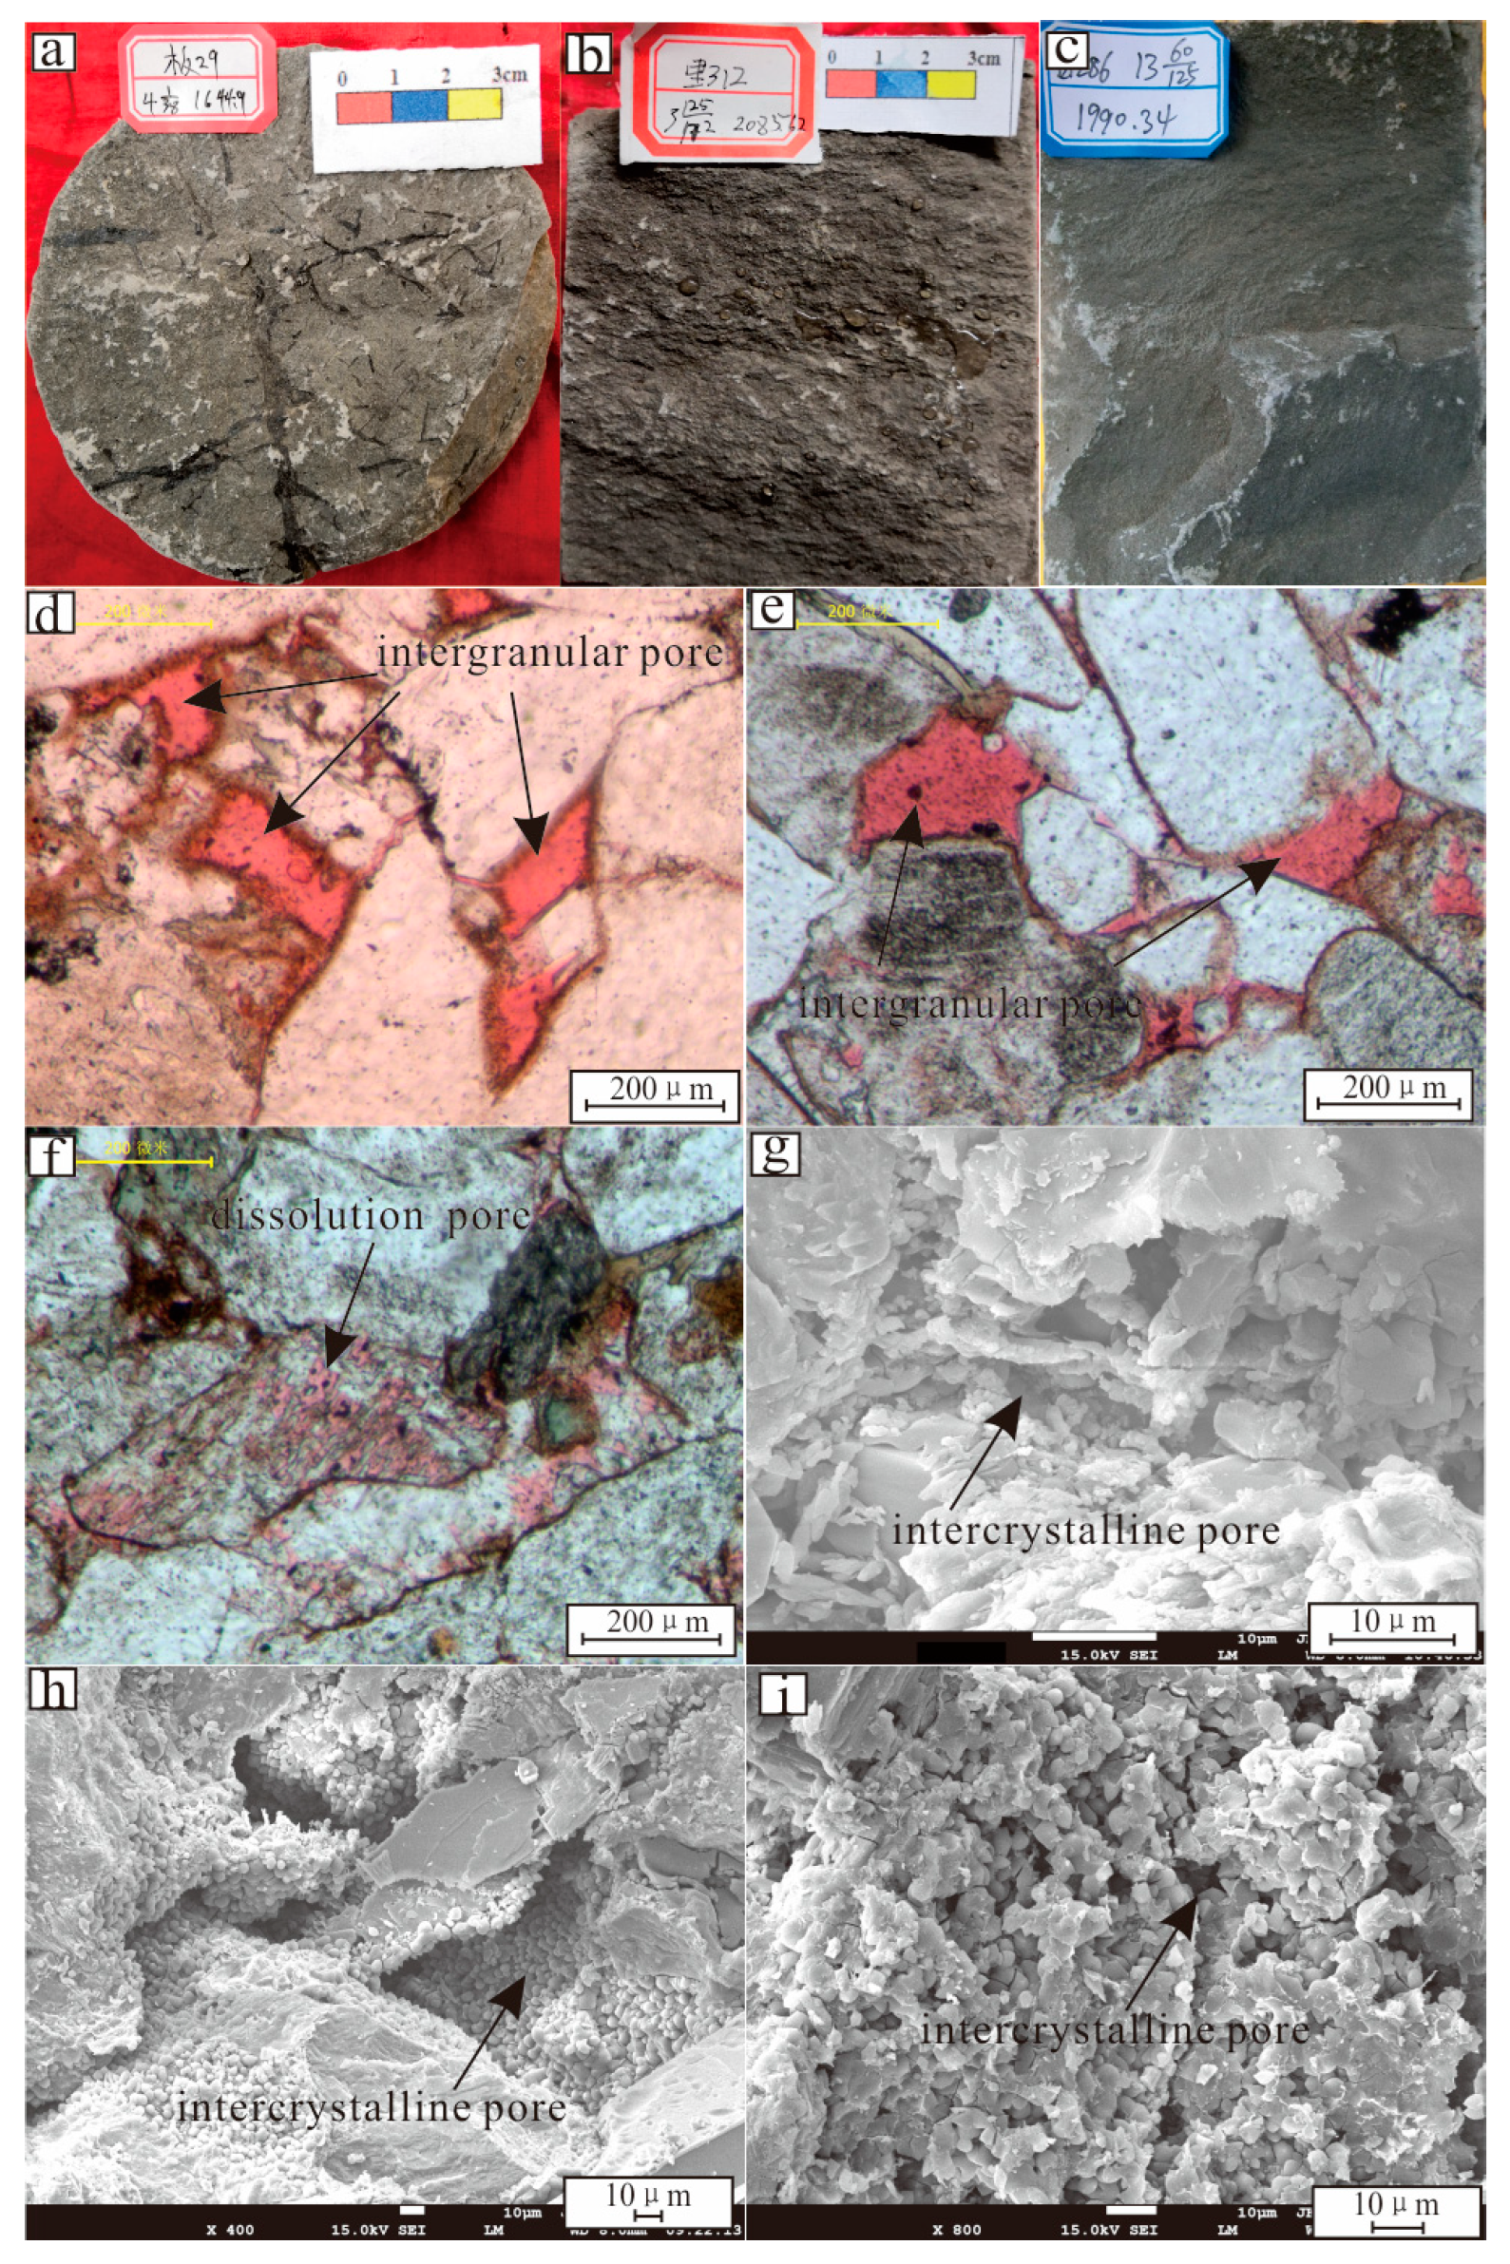
4.2. Reservoir Characteristics

The pore types of the Chang 6 reservoir in the Huaqing area mainly include intergranular pores, dissolved pores, intercrystalline pores and microfractures, among which intergranular pores and feldspar-dissolved pores are the most developed. The intergranular pore volume is distributed between 0.1% and 6.5%, with an average of 1.32%, accounting for 58.93% of the total pore space. The feldspar-dissolved pores are distributed in the range of 0.1%~3%, with an average of 0.66%, accounting for 29.46% of the total pore space. The intergranular dissolved pores are distributed between 0.2% and 1.5%, with an average of 0.01%, accounting for 0.45% of the total pore space. The distribution of dissolved pores in debris is between 0.1% and 1%, with an average of 0.13%, accounting for 5.8% of the total pore space. The distribution of intercrystalline pores is between 0.1% and 2.3%, with an average of 0.08%, accounting for 3.57% of the total pore space. Microcracks are distributed between 0.1% and 1.8%, with an average of 0.04%, accounting for 1.79% of the total pore space (Table 3).
Analysis of the pore-throat structure and pore-throat radius of Chang 6 reservoir samples in the study area was conducted using mercury intrusion capillary pressure (MICP). The maximum mercury saturation is distributed between 17.79% and 90.22%. The displacement pressure distribution is 0.832~10.782. The mercury removal efficiency is distributed between 13.91 and 44.05. The sample with the maximum mercury saturation is sample 10, and that with the smallest is sample 11, with values of 90.22% and 17.79%, respectively (Figure 4a). However, the peak distribution of the pore-throat radius of the two is basically the same, and both are distributed in the range of 0.008~0.04 μm (Figure 4b). This shows that the maximum mercury saturation does not reflect the distribution of the pore-throat radius in the reservoir but reflects the connectivity and homogeneity between the pore-throats. The greater the maximum mercury saturation, the better the pore-throat connectivity in the reservoir. According to the median pressure, the curves were divided into three categories: greater than 9.17 MPa, including samples 1, 3, 4, 5, 6, 7, 9 and 10; greater than 3.78 MPa and less than 9.17 MPa, including samples 8, 12, 13 and 15; and greater than 0 and less than 3.78 MPa, including samples 14 and 16. The pore-throat radius peaks of these three types of samples are distributed in the ranges of 0.008~0.04 μm, 0.04~0.1 μm and 0.1~0.5 μm, corresponding to three different peaks from small to large in the pore-throat radius distribution diagram. This shows that the median pressure has a good corresponding relationship with the pore-throat radius distribution, and the smaller the median pressure, the larger the peak value of the pore-throat radius. The distribution span of each mercury injection parameter in the Chang 6 reservoir is large, indicating that the Chang 6 reservoir in the study area has a diverse pore-throat size distribution, complex pore-throat connectivity, and strong reservoir heterogeneity.

4.3. Fractal Features

It can be seen from the related formulas of the spherical fractal model and the tube-bundle fractal model (Equations (2)–(10)) that the two models should be suitable for mercury injection gradients of less than 1 (lg(1 − SHg)) and greater than 1 (lg SHg). Rather than choosing one of them to characterize reservoir physical properties and pore structure as previously thought [47,48]. This study adopted the above two fractal models at the same time and used the high-pressure mercury intrusion data of the above 16 samples to study the pore structure of the Chang 6 reservoir in the study area. Taking a mercury input gradient value of 1 as the boundary, the tube-bundle fractal model was used for pore-throats with a mercury input gradient of greater than 1, and the tube-bundle fractal model was used for pore-throats with a mercury input gradient of less than 1. The typical curves of the two models are shown in Figure 5.
The tube-bundle fractal model can be divided into two types according to whether there are obvious turning points in the curve. The curves with obvious turning points were divided into two categories: I and II (Figure 5a). Curves without turning points were classified into Class I or Class II according to the size of their fractal dimension and the distribution range of the abscissa and ordinate values of the curve (Figure 5b). The typical curve of the spherical fractal model was also classified into two categories according to the presence or absence of distinct inflection points (Figure 5c,d). For pore-throat samples with two segments in the spherical fractal model, the proportion of the porosity of the two sections and the contribution of each section to the total porosity were calculated separately. Finally, using the weighted average of the porosity of each pore space, the total fractal dimension of the entire pore space was obtained (Formula (11)). In the formula, D is the average fractal dimension, D1 and D2 are the fractal dimensions of the two segments, respectively, and φ1 and φ2 are the proportions of the pore-throats of the two segments.
D = D 1 × φ 1 + D 2 × φ 2 φ 1 + φ 2
The correlation between the capillary pressure corresponding to the inflection point of the class I and class II curves and the capillary pressure corresponding to the peak value of the pore-throat radius is relatively good (R2 = 0.9052) (Figure 6a). This shows that the inflection point of the fractal dimension of the tube bundle has good correspondence with the peak value of the pore-throat radius, which can be used as the basis for dividing the pore-throat size. Combined with the boundary between the tube-bundle fractal model and the spherical fractal model, the pore-throats corresponding to the spherical model were classified as class III. Therefore, the pore-throat structure of the reservoir was divided into three categories (Figure 6b). Class I represents smaller pore-throats, class II represents medium pore-throats, and class III represents larger pore-throats.
The statistics of the three types of pore-throat fractal numbers for the 16 samples are shown in Table 4. lg(1 − SHg) and lg (Pc), and lg (SHg) and lg (Pc) have good correlation. The average R2 values are 0.9619, 0.9646 and 0.9441, respectively. This shows that the pore-throat structure of the Chang 6 reservoir in the Huaqing area has obvious fractal characteristics.
The fractal dimension of class I pores and throats is distributed in the range of 2.1289 to 2.9477, with an average of 2.4453. The contribution to porosity is distributed in the range of 0.4286~5.2826, with an average of 2.3873. The fractal dimension of class II pore-throats is distributed in the range of 3.1433 to 6.222, with an average of 4.3972. The contribution to porosity is distributed in the range of 0.4286 to 7.4, with an average of 2.4996. The fractal dimension of class III pore-throats is distributed in the range of 2.1376 to 3.3559, with an average of 2.6688. The contribution to porosity ranges from 0.7475 to 7.0227, with an average of 3.2419. The type I pore-throat fractal dimension is the smallest, and the type II pore-throat fractal dimension is the largest. The heterogeneity of small pore-throats is weaker than that of large pore-throats, and the heterogeneity of medium pore-throats is the strongest. Type III pore-throats contribute the most to reservoir porosity, followed by type II pore-throats, and type I pore-throats contribute the least. In tight sandstone reservoirs, the major influences on porosity are large and medium pore-throats.

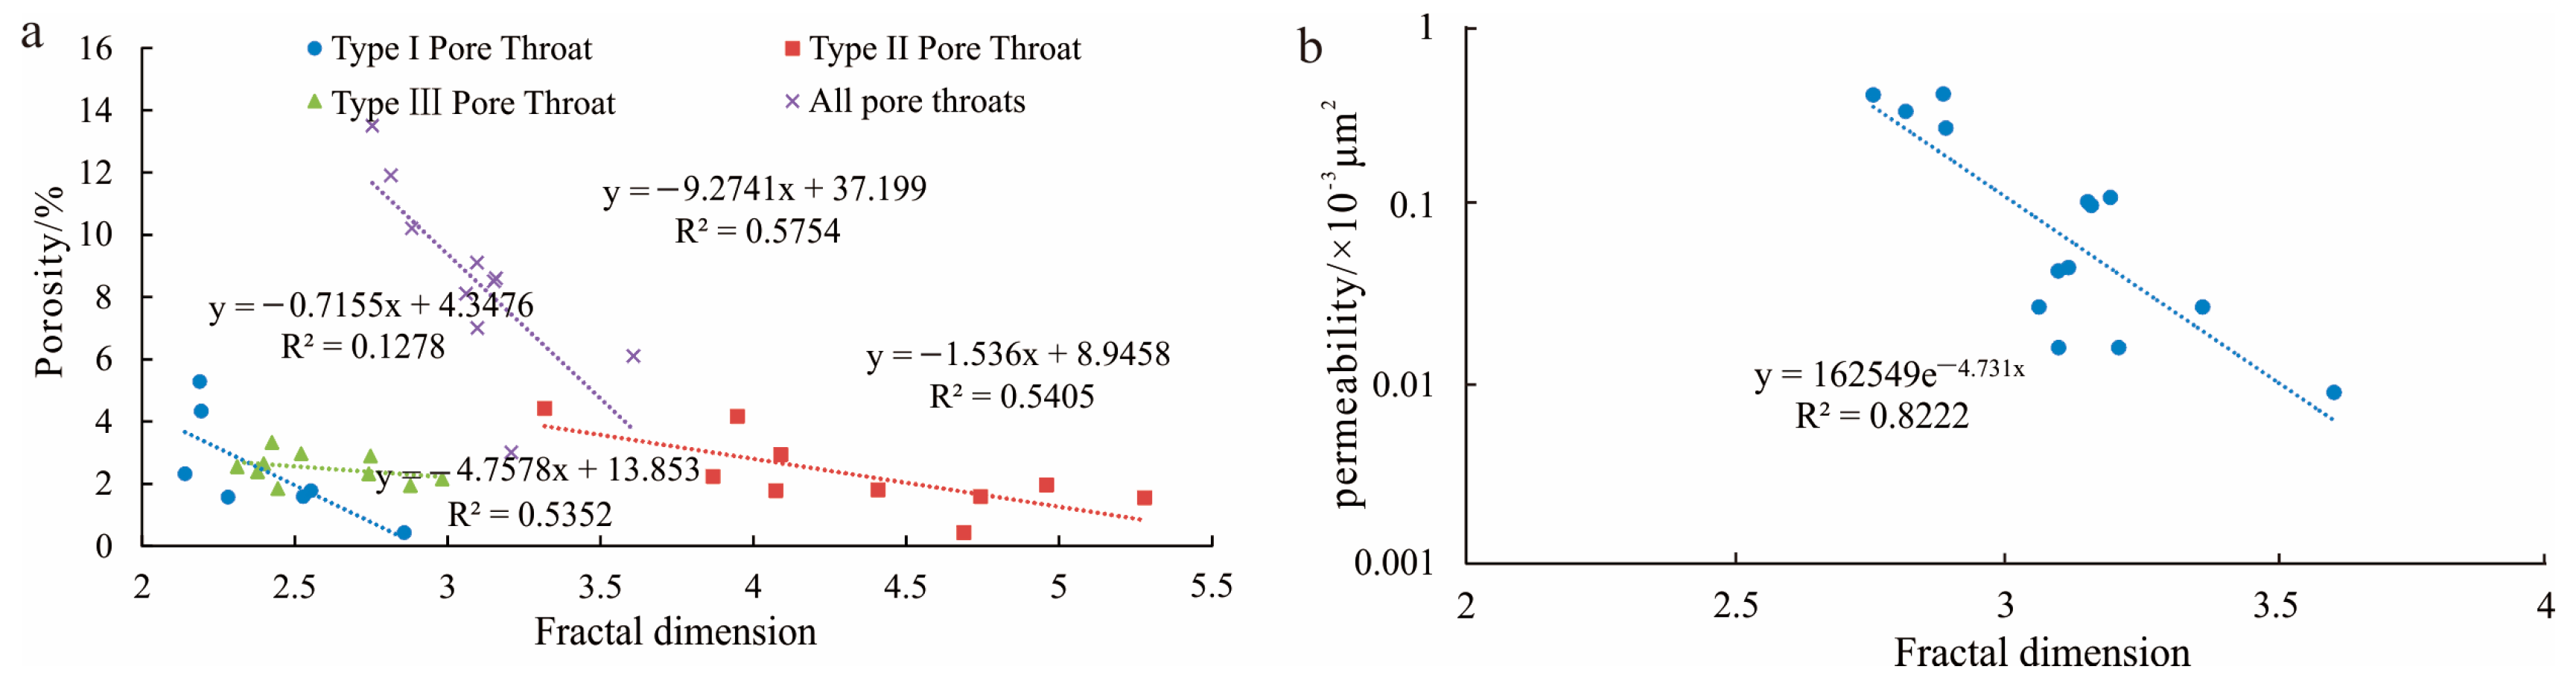
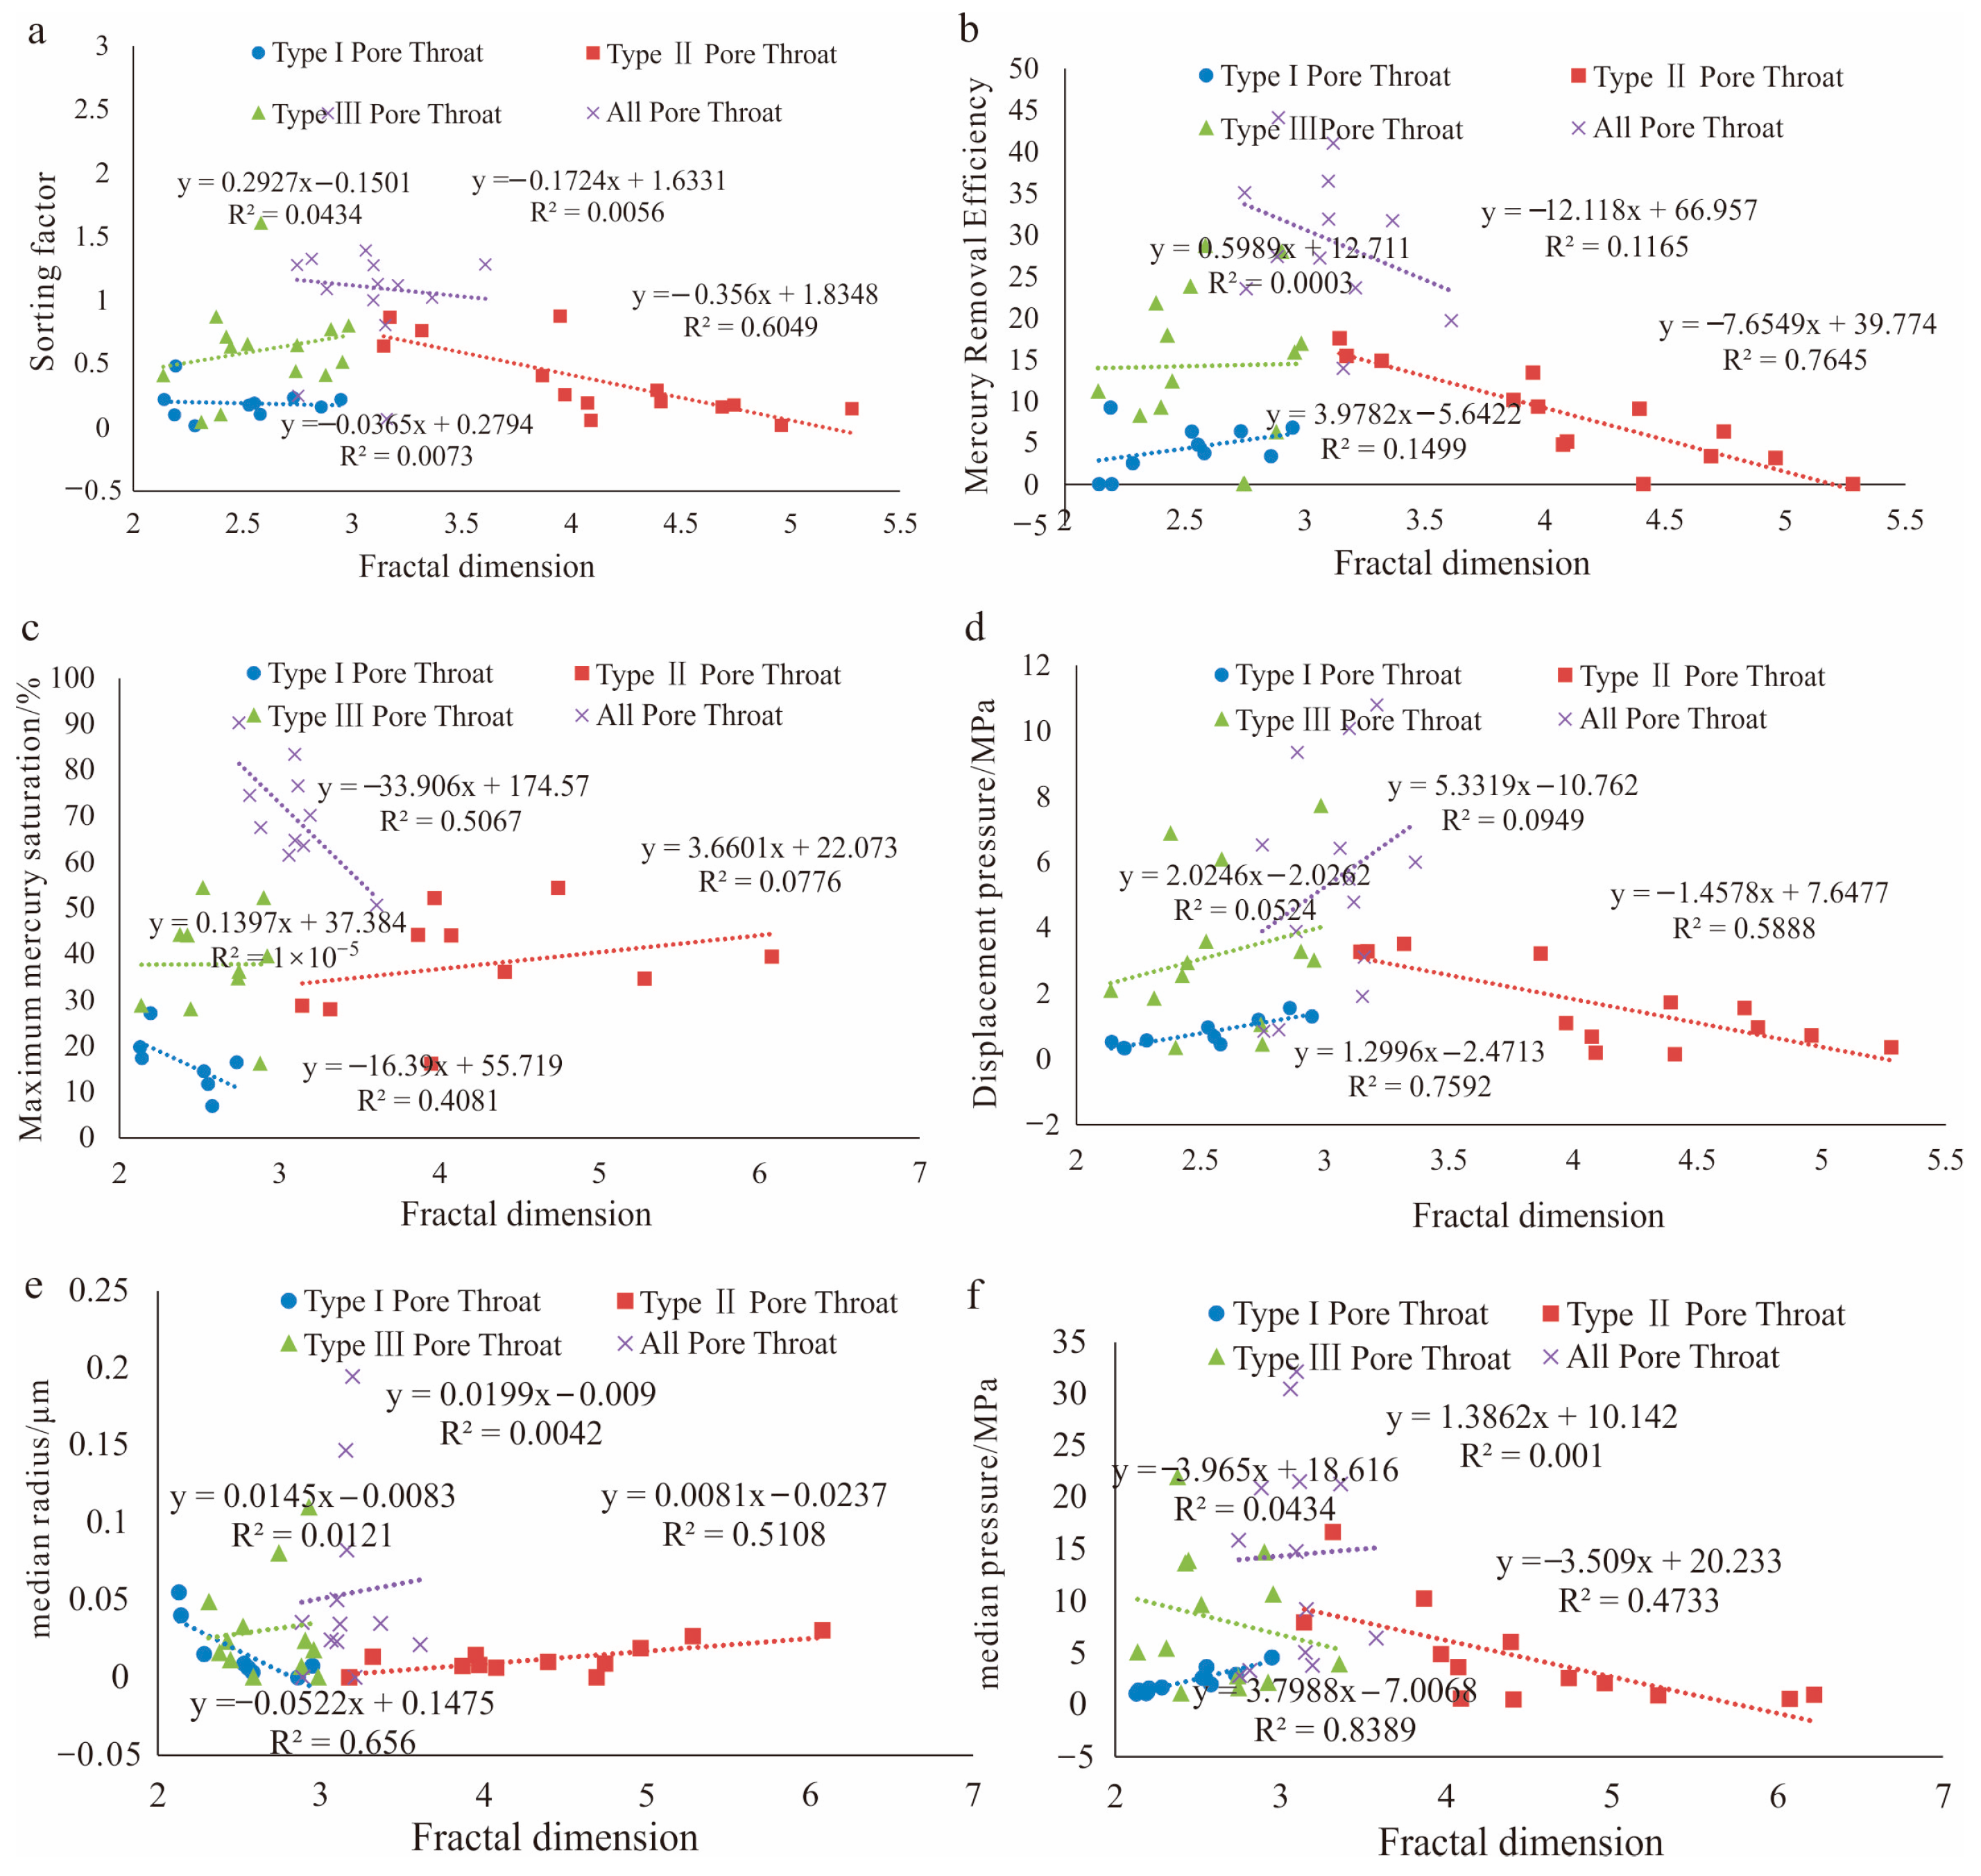
4.4. Relationships between Fractal Features and Reservoir Physical Properties

In addition to characterizing the uniformity of pore-throats in the reservoir, the fractal dimension can also characterize the roughness of the particle surface. The roughness of the particle surface affects the migration and accumulation of oil and gas in the reservoir. These effects will manifest in the porosity and permeability of the reservoir. Therefore, studying the correlation between the fractal dimension and porosity and permeability is of great significance to clarify the contribution of various pore-throats to porosity and permeability. The relationships between the fractal dimensions of types I, II and III and the total fractal dimension and their corresponding porosities are negatively correlated (Figure 7a). The R2 values are 0.5352, 0.5405, 0.1278 and 0.5754, respectively. There is an obvious negative correlation between the total fractal dimension and the total permeability, with an R2 of 0.8222 (Figure 7b). The smaller the fractal dimension, the greater the porosity and permeability, the smaller the difference between the pore and throat radii in the reservoir, the better the average distribution of the pore-throats and the better the permeability. The larger the fractal dimension, the rougher the particle surface and the larger the difference between the pore and throat radii, which is not conducive to the migration and accumulation of oil and gas.

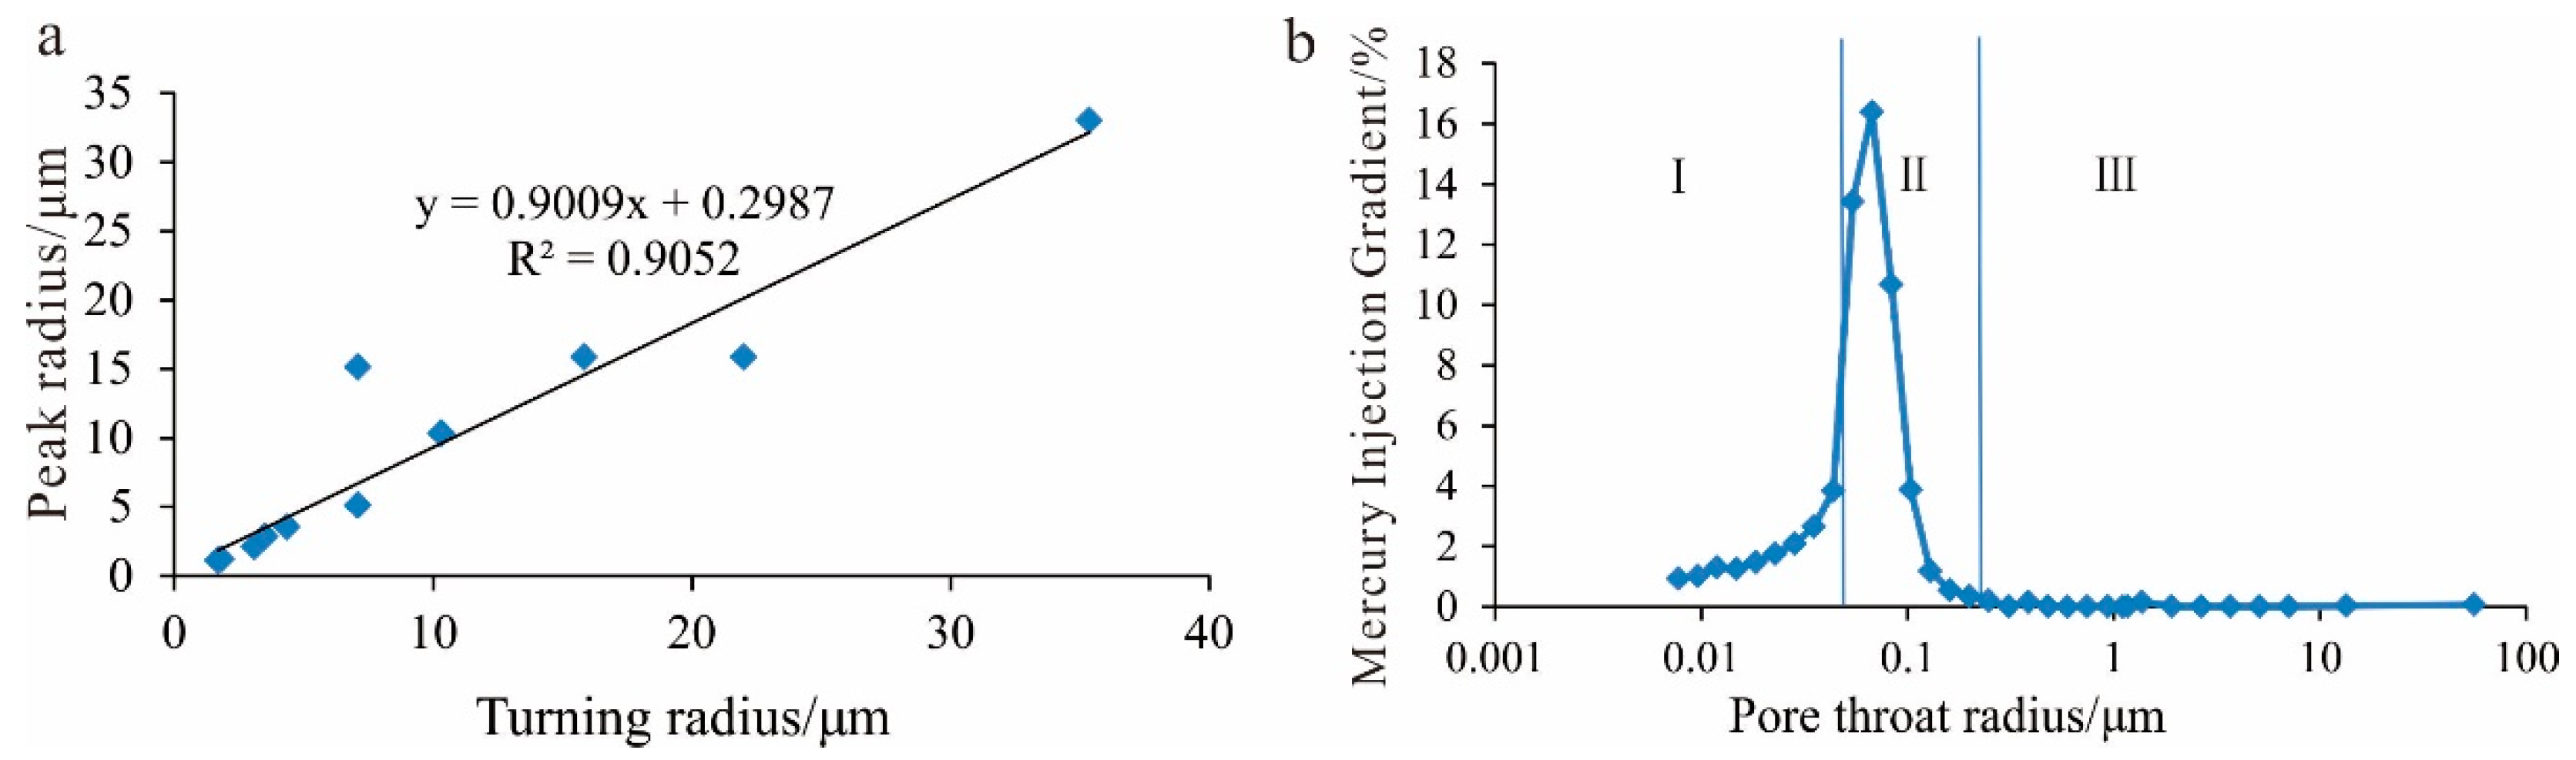
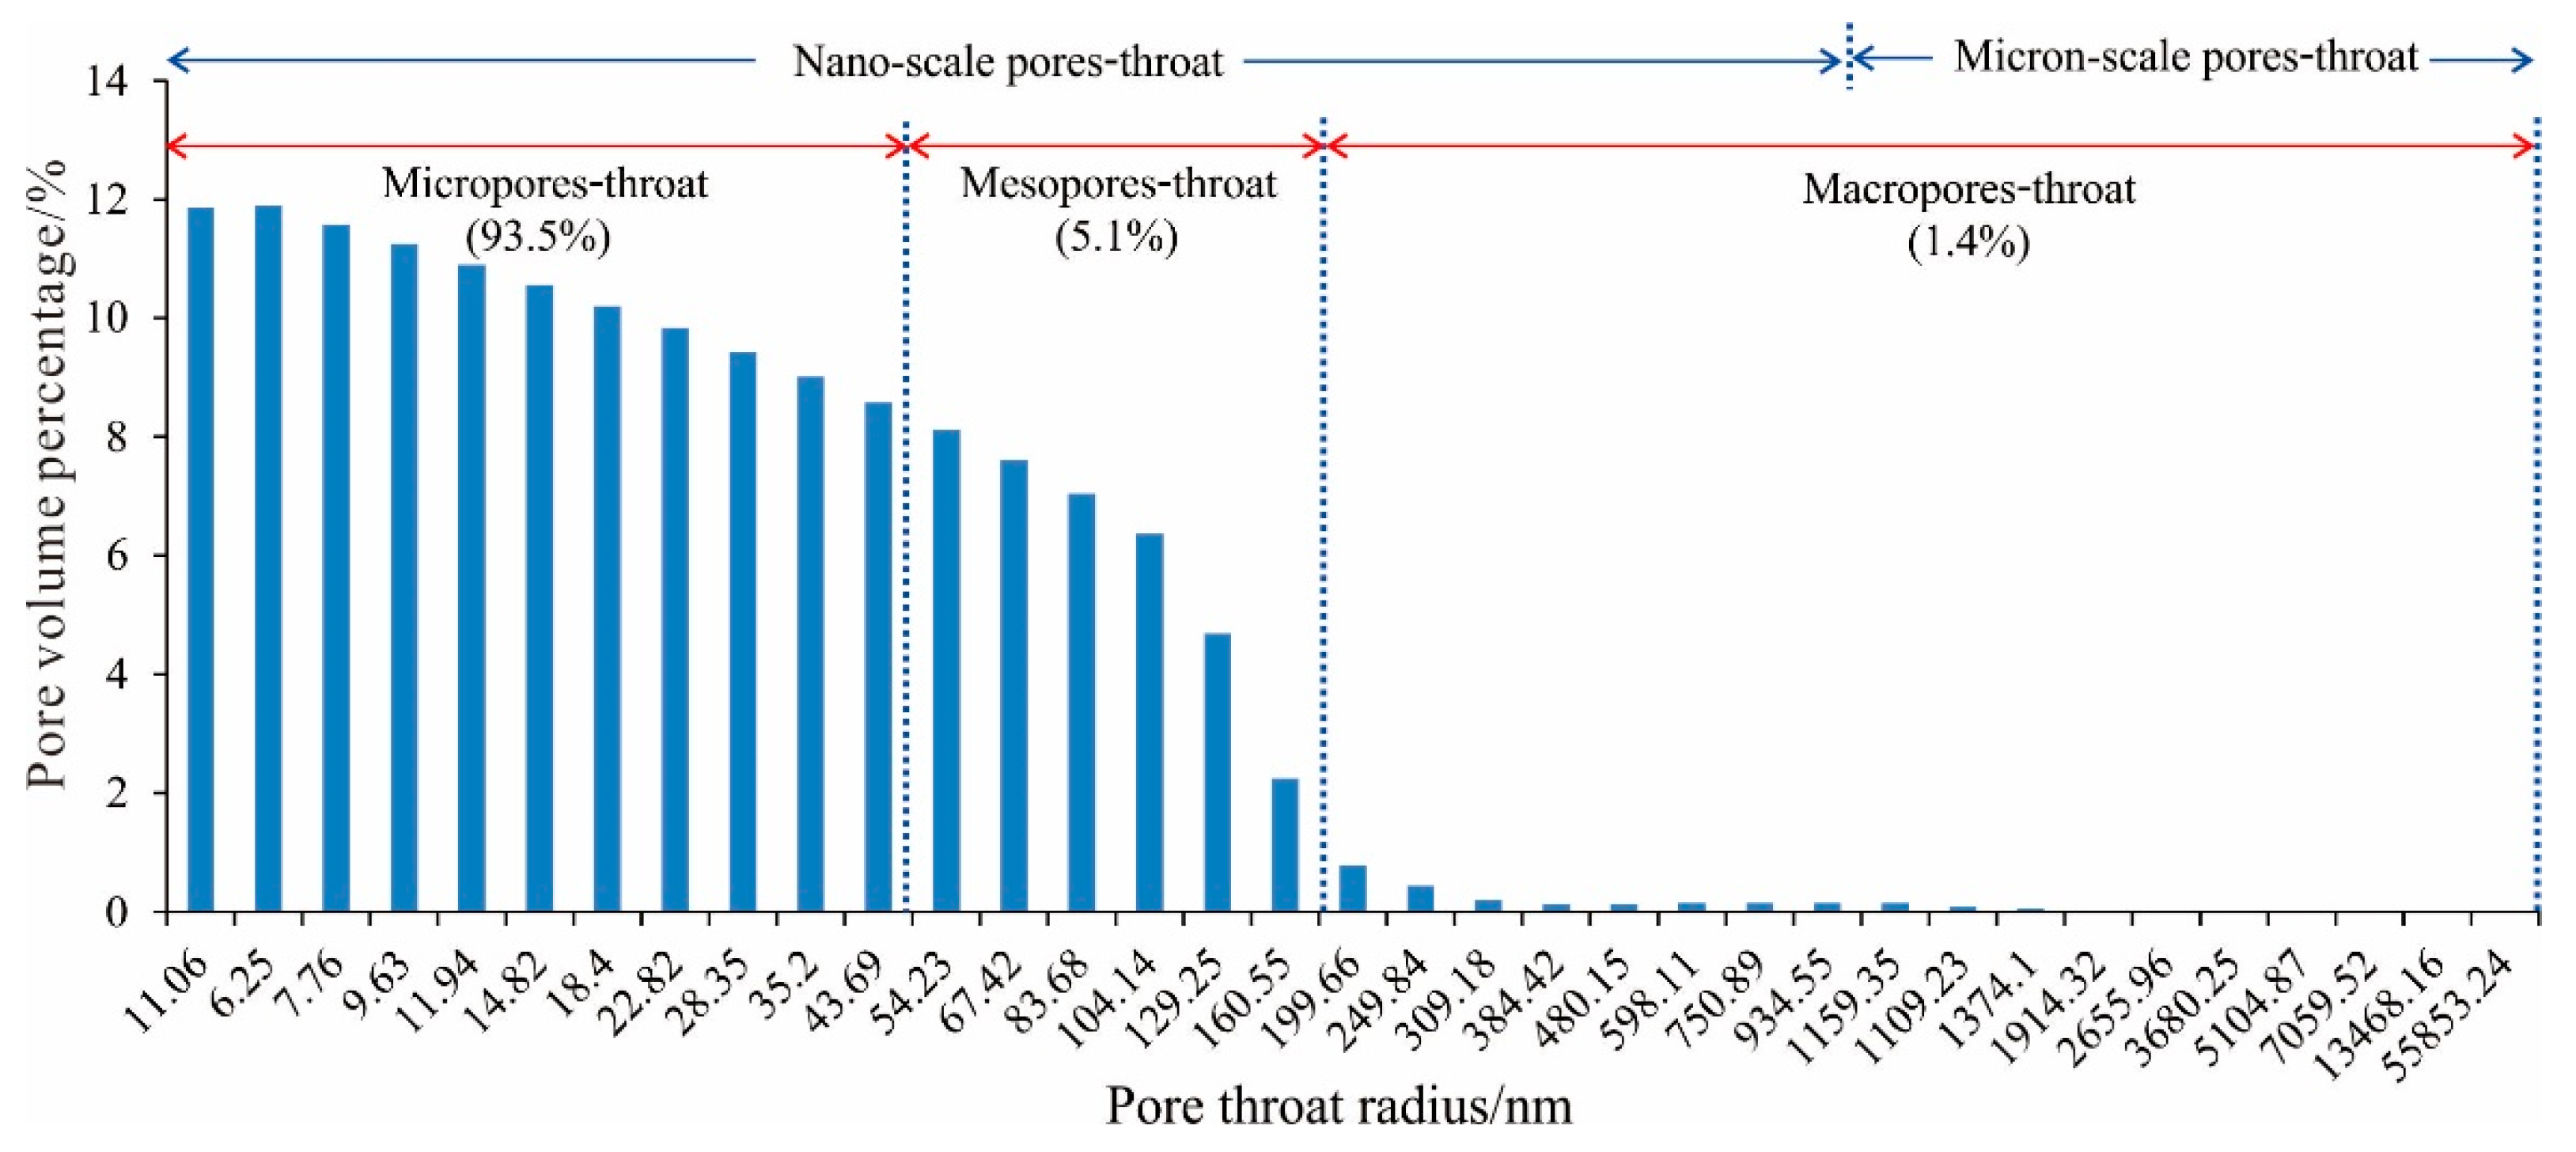
4.5. Pore-Throat Distribution Characteristics

Many studies have been performed on the distribution of pore-throat radii in tight sandstone reservoirs, and it is believed that the pore-throat radius is mainly distributed between 0.01 and 0.2 μm [49,50]. Through the classification of pore-throat radii by fractal dimension, combined with the high-pressure mercury injection experiment, the percentage of different types of pore-throat radius volume in the total pore-throat volume was calculated (Table 5). The results show that the main types of pore-throats in the Chang 6 reservoir in the study area are nanoscale pore-throats, and microscale pore-throats are less developed (Figure 8). Among them, macropores (>200 nm) account for 1.4% of the total pore-throat volume, mesopores (54~200 nm) account for 5.1% of the total pore volume, and micropores (<54 nm) account for 93.5% of the total pore volume. Small pores with pore-throat radii of <54 nm are the main storage space of tight sandstone reservoirs.

4.6. Effects of Different Types of Pore-Throats on Reservoirs

The sorting coefficient is a parameter that reflects the concentration of pore-throat distribution in the reservoir. The smaller the sorting coefficient, the more uniform the pore-throat distribution. Among the three types of pore-throats in the Chang 6 reservoir in the study area, only type II pore-throats have an obvious negative correlation with the sorting coefficient (R2 = 0.6049). The correlation between type I and type III pore-throats and the sorting coefficient is not obvious, and the R2 values are 0.0073 and 0.0434, respectively (Figure 9a). This shows that the concentration degree of medium pore-throats in tight sandstone reservoirs is closely related to the fractal dimension. The larger the fractal dimension of the medium pore-throat, the more uniform the pore-throat distribution.
The mercury removal efficiency can reflect the uniformity of pore and channel size in the reservoir. The greater the mercury removal efficiency, the more uniform the size of the pores and throats. The fractal dimension of type II pore-throats is significantly negatively correlated with mercury removal efficiency (R2 = 0.7645). There is no obvious correlation between the fractal dimensions of the pore-throats of type I and type III and the mercury removal efficiency, with R2 values of 0.1499 and 0.0003, respectively (Figure 9b). This shows that the uniformity of the pore-throats in the reservoir is mainly controlled by the medium pore-throats. The more uniform the distribution of medium pore-throats, the more uniform the distribution of pore-throats in the reservoir.
The fractal dimension of type I pore-throats is significantly negatively correlated with the maximum mercury saturation (R2 = 0.4081). There is no significant correlation between the fractal dimensions of type II and type III pore-throats and the maximum mercury saturation, and the R2 values are 0.0776 and 0.00005, respectively (Figure 9c). It is shown that the smaller pore-throats with the upper limit of oil and gas content in the reservoir, the more uniform the distribution of the smaller pore-throats, and the greater the potential for oil and gas accumulation in the reservoir.
The displacement pressure refers to the minimum pressure at which mercury enters the rock sample. Type I pore-throats are significantly positively correlated with displacement pressure (R2 = 0.7592). Type II pore-throats are significantly negatively correlated with displacement pressure (R2 = 0.5888). There is no obvious correlation between the type III pore-throat and the displacement pressure (R2 = 0.052) (Figure 9d). This shows that in the type I pore-throats, the displacement pressure gradually increases with the deterioration of the uniformity of the pore-throats. In type II pore-throats, the displacement pressure gradually decreases as the uniformity of the pore-throats deteriorates. The homogeneity of type III pore-throats has no significant effect on the displacement pressure.
The median radius can approximately represent the average pore-throat radius. The fractal dimension of class I pore-throats is significantly negatively correlated with the median radius (R2 = 0.656). The fractal dimension of class II pore-throats is positively correlated with the median radius (R2 = 0.5108). The fractal dimension of class II pore-throats is positively correlated with the median radius (R2 = 0.5108) (Figure 9e). This shows that in the type I pore-throat, with the decrease in pore-throat uniformity, the average pore-throat radius decreases. In type II pore-throats, the average pore-throat radius gradually increases as the pore-throat uniformity decreases. Type III pore-throats have no significant effect on the average pore-throat radius.
The smaller the median pressure, the better the permeability of the rock. The fractal dimension of the type I pore-throat is significantly positively correlated with the median pressure (R2 = 0.8389). Type II pore-throats are significantly negatively correlated with the median pressure (R2 = 0.4733). There is no significant correlation between class III pore-throats and median pressure (R2 = 0.043) (Figure 9e,f). This shows that the more uniform the pore-throats in the type I pore-throats, the better the rock infiltration performance. In type II pore-throats, the worse the pore-throat uniformity, the better the rock percolation. Type III pore-throats have no significant effect on rock percolation.
It can be seen from the abovementioned analysis that the effects of the three types of pore-throats on the displacement pressure, median pressure and median radius show diametrically opposite results, indicating that the effects of different pore-throat radii on the reservoir are different.

5. Discussion

5.1. The Features of Pore-Throats

The factors affecting the uniformity of different types of pore-throats are mainly the pore-throat size and the combination relationship between pores and throats [51,52,53,54,55]. The pore radius of intergranular pores (inter P) in the Chang 6 tight sandstone reservoir in the study area is generally distributed in the range of 5.5~210 μm (Figure 10a,b,g,f). The radius of the feldspar dissolution pores (FDP) is generally in the range of 3.1~146 μm (Figure 10n). The radius of intercrystalline pores (inter CP) is generally developed in the range of 3.1~146 μm (Figure 10j,k,l). The pore-shrinking throats (PSTs), slice-shaped throats (SSTs) and curved sheet throats (CSTs) generally have a radius greater than 2 μm, and the maximum can reach more than 10 μm (Figure 10c,e,f). The radii of neck-contracted throats (NCTs) and tube-bundle throats (TBTs) are generally less than 1 μm (Figure 10 m,n) (Table 6).
From the distribution of the fractal dimensions of different types of pore-throats (Figure 10 and Figure 11), it can be seen that the fractal dimensions of type I and type III pore-throats are generally lower. The fractal dimension of class II pore-throats is generally larger. The distribution of type I and type III pore-throats is relatively uniform, and the differences between the pore and throat radii of type II pore-throats is large. Combined with the distribution of the pore-throat radius, it is considered that type I pore-throats are mainly composed of small pores equipped with small throats, type III pore-throats are mainly composed of large pores equipped with large throats, and type II pore-throats are mainly composed of large pores equipped with small throats.
Intergranular pores (inter P), pore-shrinking throats (PSTs), slice-shaped throats (SSTs) and curved sheet throats (CSTs) are mainly developed in type III reservoirs. The pore-throat combination modes are mainly inter P—PST, inter P—SST, and CST (Figure 10b,c,e). They are mainly composed of large pores with large throats and strong pore-throat connectivity, which is conducive to oil and gas migration and accumulation. Type II pore-throats are mainly composed of residual primary intergranular pores and necked throats. Type II pore-throats are mainly composed of inter P-NCT (Figure 10f). The radius of the NCT is small, and oil and gas are easily blocked by it during the migration process. The connectivity between the two pores connected by it is poor, and no effective connection can be generated, which is not conducive to oil and gas migration and accumulation. Type I pore-throats are mainly composed of inter CP-TBT (Figure 10j,k,l) and FDP-TBT (Figure 10n) and are equipped with small throats for small pores. In general, from the perspective of pore-throat combinations, the reservoir connectivity corresponding to type III pore-throats is the best, that of type I reservoirs is poor, and that of type II reservoirs is the worst.

5.1.1. The Distribution of Mercury Intrusion Parameters

There are obvious differences in the distribution of mercury removal efficiency, maximum mercury injection saturation, displacement pressure and median pressure corresponding to different pore-throat types (Figure 11). The reason for this difference is mainly the size difference in various pores and throats and their combined relationships.
The pores in type I pore-throats are mainly inter CP of clay minerals and FDP with a small radius. The throats are mainly TBT in clay minerals and feldspar-dissolved pores. The pore and throat radii are generally small, and the gap is not large. Therefore, the distribution of the fractal dimension and mercury intrusion parameters is relatively concentrated, and a larger displacement pressure is generated by overcoming the smaller throat size.
The pore types in type II are mainly inter P, and the throats are mainly NCT produced via compaction. The pore radius is large, the distribution range is wide, the throat radius is small and the gap between the pore radius and the throat radius is large (Figure 10). The combination of pore-throats with different sizes determines that this type of pore-throat has a larger fractal dimension. The mercury removal efficiency and the maximum mercury saturation vary widely.
The pore types in type III pore-throats are mainly inter P with larger pore diameters, and the throat types only include PST, SST and CST. Type III pore-throats are mainly large pores with large throats. Therefore, the fractal dimension is smaller, and the mercury removal efficiency and maximum diameter mercury saturation are higher than those of type I pore-throats.

5.1.2. Analysis of the Reasons for the Difference

The sorting coefficient and mercury removal efficiency can reflect the uniformity of pore-throats in the reservoir. Only the fractal dimension of type II pore-throats has a significant correlation with the sorting coefficient and mercury removal efficiency (Figure 11a,b). This indicates that pore-throats with large radius differences are mainly developed in the reservoirs corresponding to type II pore-throats.
The fractal dimension of type I pore-throats is significantly negatively correlated with the maximum mercury saturation, while the fractal dimensions of type II and III pore-throats have no significant correlation with it (Figure 11c). This shows that the pores with small radii have a controlling effect on the amount of mercury input. This shows that the content and connectivity of small pores in the reservoir also affect the oil saturation.
The fractal dimensions of type I pore-throats and type II pore-throats are significantly positively correlated with displacement pressure, while the fractal dimension of type III pore-throats has no significant correlation with displacement pressure and median pressure (Figure 11d,e). This shows that the minimum pressure affecting the entry of mercury into the rock sample is determined by tube-bundle throats and necked throats with small throat radii.

5.2. Different Factors of Pore-Throat Homogeneity

On the basis of using fractal dimensions to study the pore-throat structure of reservoirs based on various experimental methods, predecessors believe that the main factors causing the differences in the properties of various pore-throats are sedimentation [56,57], diagenesis [58,59,60], rock composition and pore-throat structure.

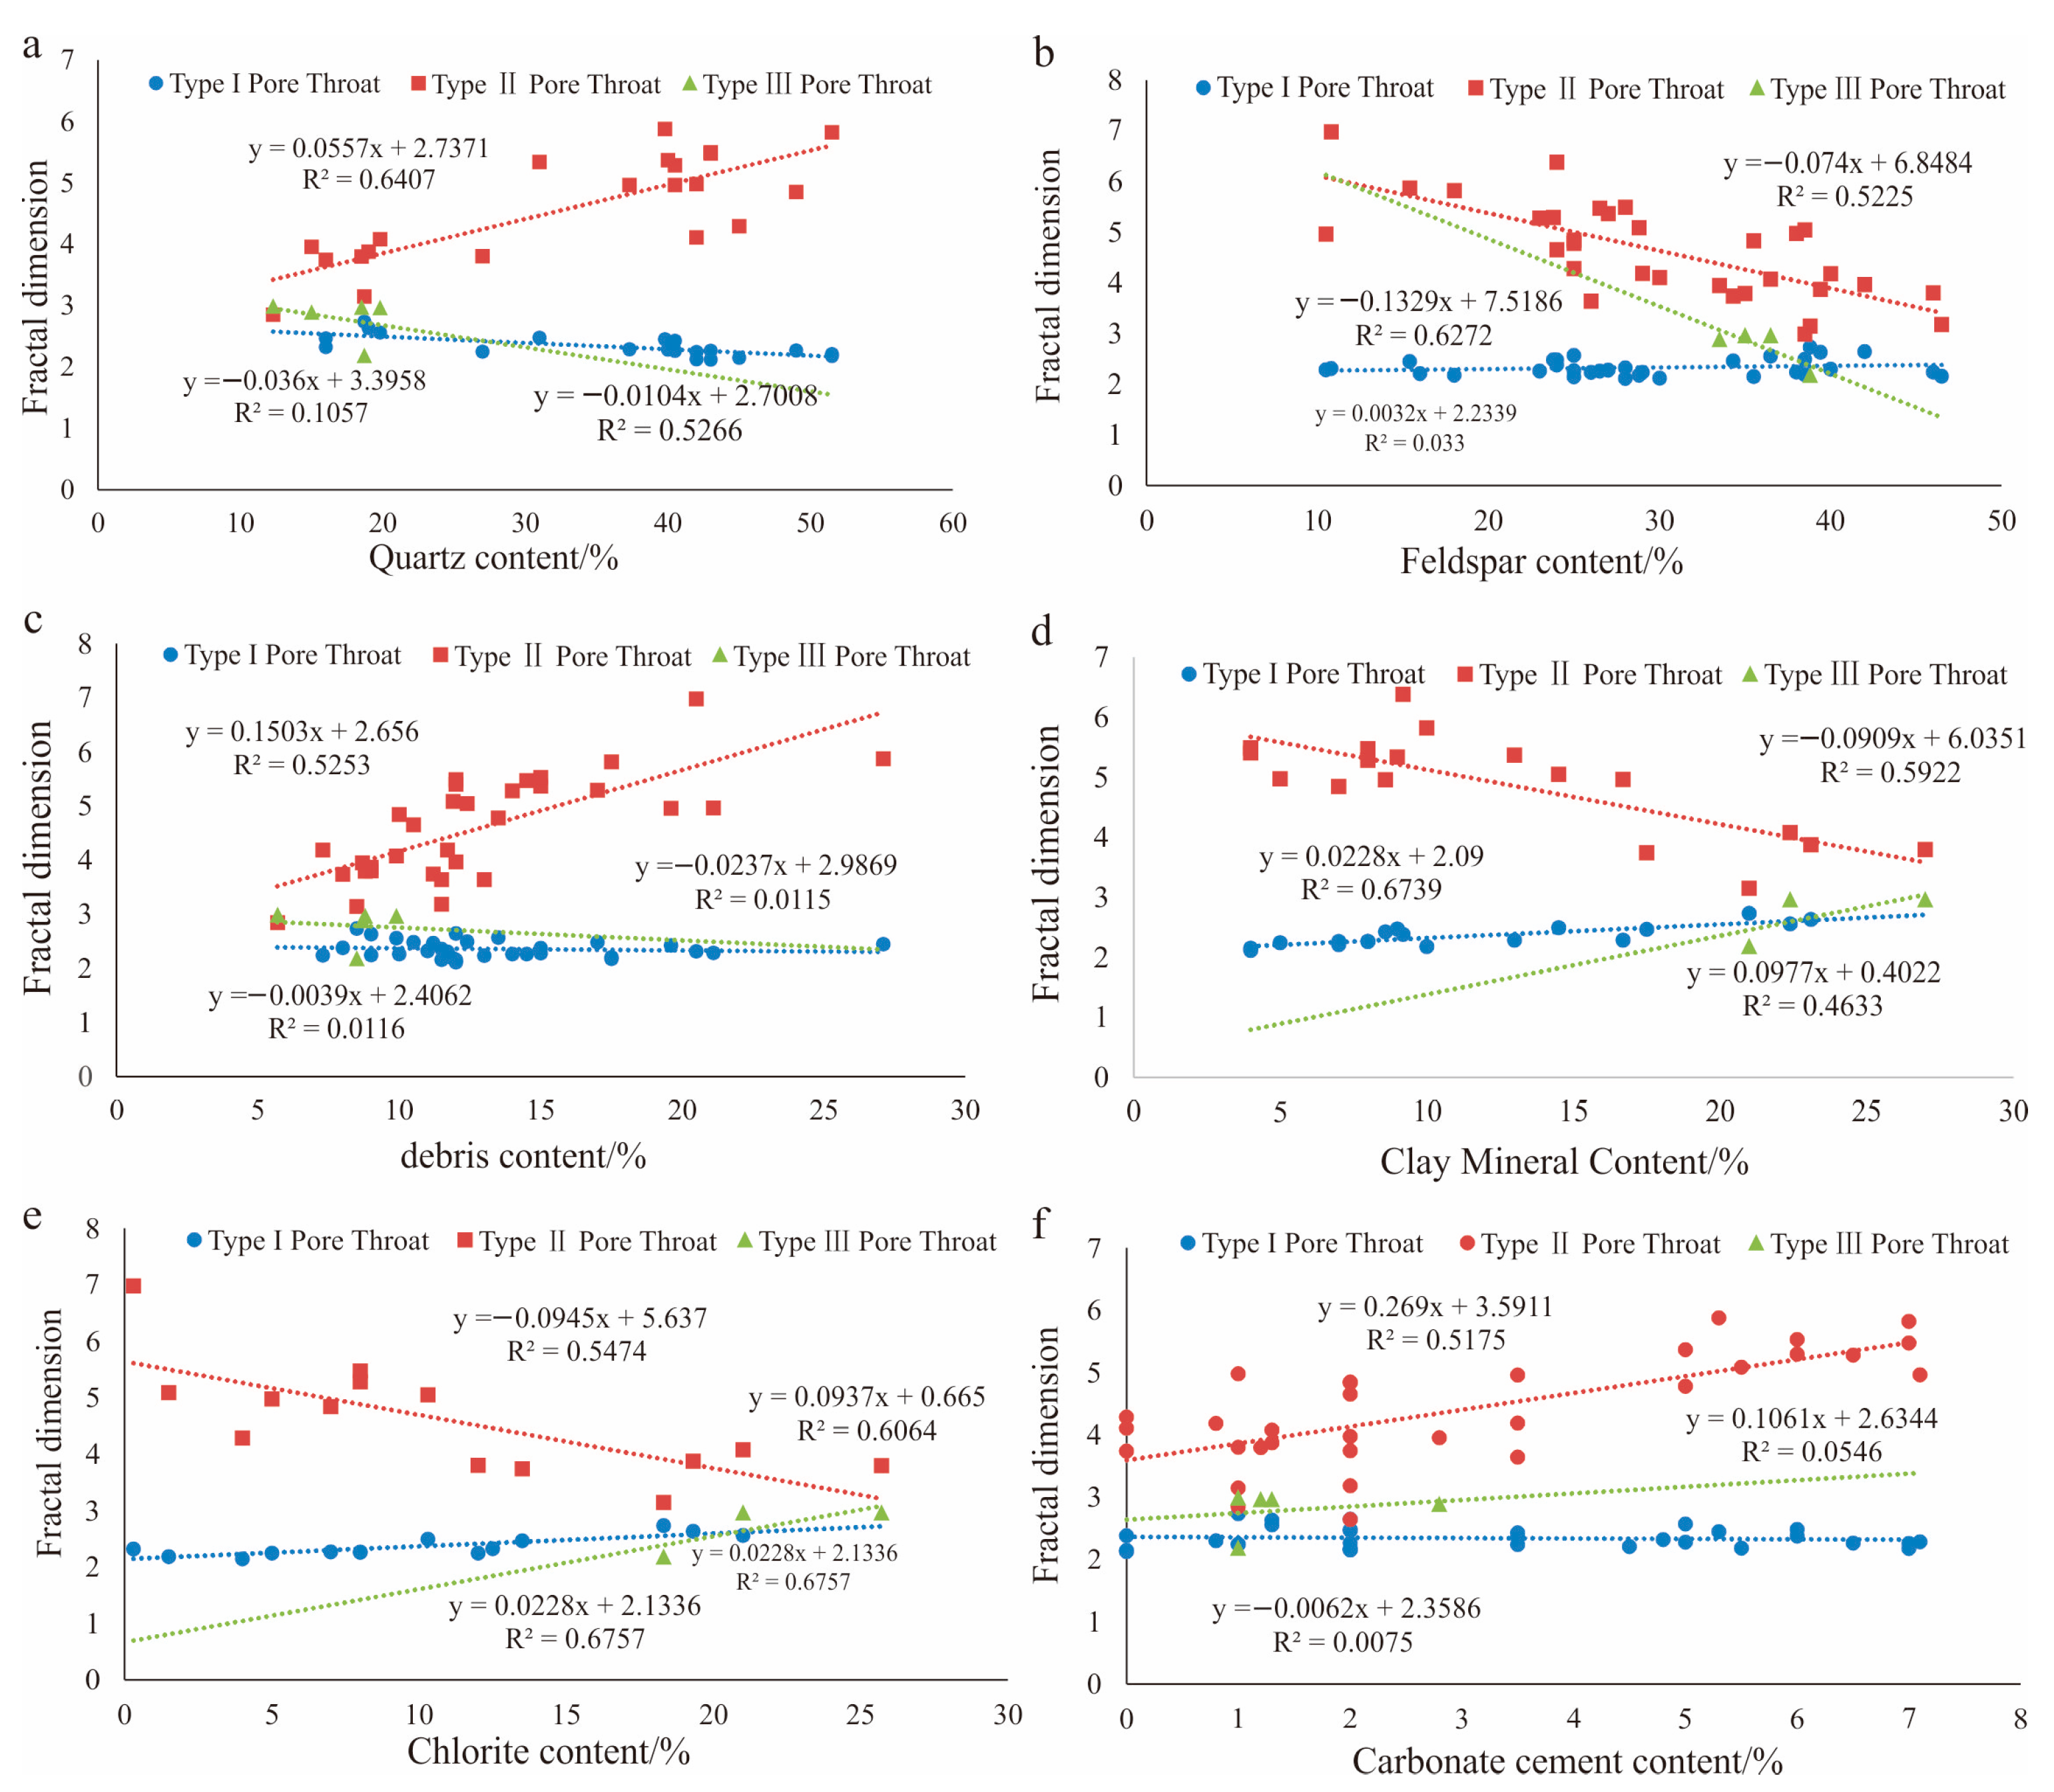
5.2.1. The Influence of Rock Composition

The fractal dimension of type Ⅰ pore-throats has an obvious negative correlation with the quartz content (R2 = 0.5266). The fractal dimension of type II pore-throats has an obvious positive correlation with the quartz content (R2 = 0.6407). There is no obvious correlation between type III reservoirs and quartz (R2 = 0.1057) (Figure 12a). The fractal dimensions of type II and III pore-throats and feldspar content have obvious negative correlations, with R2 values of 0.5225 and 0.6272, respectively. There is no obvious correlation between the fractal dimension of class Ⅰ pore-throats and feldspar (R2 = 0.033) (Figure 12b). The fractal dimension of type II pore-throats have a significant positive correlation with the debris content (R2 = 0.5253). There is no obvious correlation between the fractal dimension of type I and type III pore-throats and the content of debris, and the R2 values are 0.0116 and 0.0115, respectively (Figure 12c). The three types of pore-throat fractal dimensions have good correlations with clay minerals and chlorite. The fractal dimension of class I pore-throats is significantly positively correlated with clay minerals and chlorite, with R2 values of 0.6739 and 0.6757, respectively. The fractal dimension of type II pore-throats is significantly negatively correlated with clay minerals and chlorite, with R2 values of 0.5922 and 0.5474, respectively. The fractal dimension of type III pore-throats is significantly positively correlated with clay minerals and chlorite, with R2 values of 0.4633 and 0.6757, respectively (Figure 12d,e). There is a good positive correlation between the fractal dimension of the type Ⅱ pore-throat and the carbonate cement content (R2 = 0.5175). There is no obvious correlation between type I and type III pore-throats and carbonate cements, and the R2 values are 0.0075 and 0.0546, respectively (Figure 12f).
In conclusion, quartz has a positive effect on the homogeneity of smaller pore-throats, and clay minerals have a destructive effect on the homogeneity of smaller pore-throats. Quartz and carbonate cements are not conducive to the preservation of the homogeneity of medium pore-throats, while feldspar, clay minerals and chlorite have positive significance for the preservation of the homogeneity of medium pore-throats. Feldspar has a positive effect on the homogeneity of larger pore-throats, and clay minerals and chlorite have a destructive effect on the homogeneity of larger pore-throats. Therefore, the fractal dimension can be used to evaluate the effect of rock composition on the uniformity of various pore-throats in the reservoir.

5.2.2. The Influence of Diagenesis

Previous researchers have performed much research on the effect of diagenesis on the pore-throats of reservoirs [56,59,60,61]. It is generally believed that compaction will cause the reservoir porosity loss rate of tight sandstone reservoirs in the study area to reach approximately 30%~50% [62,63,64]. Compaction reduces the content of primary intergranular pores in the reservoir, making point–line, concave–convex contact between particles. The throats produced via compaction mainly include PST, NCT, SST and CST (Figure 13). Cementation is another important factor for porosity reduction in reservoirs [62,63], resulting in a large amount of pore space being filled with cement. The resulting throat is mainly NCT. Dissolution is a rare diagenesis in reservoirs that can increase the storage space [65,66]. Dissolution pores produced via dissolution are mainly connected by TBT [56,67]. The pore types in Class I reservoirs are mainly inter CP and FDP, and throats are mainly TBT, which are greatly affected by dissolution and less affected by compaction. The pore types in Type II and Type III reservoirs are mainly inter P and FDP, and the throats are mainly PST, SST, CST and NCT. The transformation of storage space is more obvious.
In conclusion, the factors affecting the mercury injection parameters of various pore-throats in the Chang 6 tight sandstone reservoir in the study area are the pore-throat radius and the combination of pores and throats of different sizes. The factors that cause the difference in pore-throat properties mainly include rock composition and diagenesis.

6. Conclusions

Based on high-pressure mercury intrusion data, combined with cast thin sections and scanning electron microscopy, this study also uses the tube-bundle model and spherical model to study the fractal dimensions of pore-throat structures in tight sandstone reservoirs and classify pore-throats. The influencing factors of pore-throat differences are discussed, and the following main conclusions are drawn.
  • We divide the pore-throat structure of tight sandstone reservoirs into three categories. Types I, II and III represent small, medium and large pore-throats, respectively. The fractal dimension of type I pore-throats is distributed in the range of 2.1289~2.9477, with an average of 2.4453, and these pore-throats have the best uniformity. The fractal dimension of type II pore-throats is distributed in the range of 3.1433 to 6.222, with an average of 4.3972, and their pore-throat homogeneity is the worst. The fractal dimension of type III pore-throats is distributed in the range of 2.1376 to 3.3559, with an average of 2.6688, and the uniformity of these pore-throats is moderate.
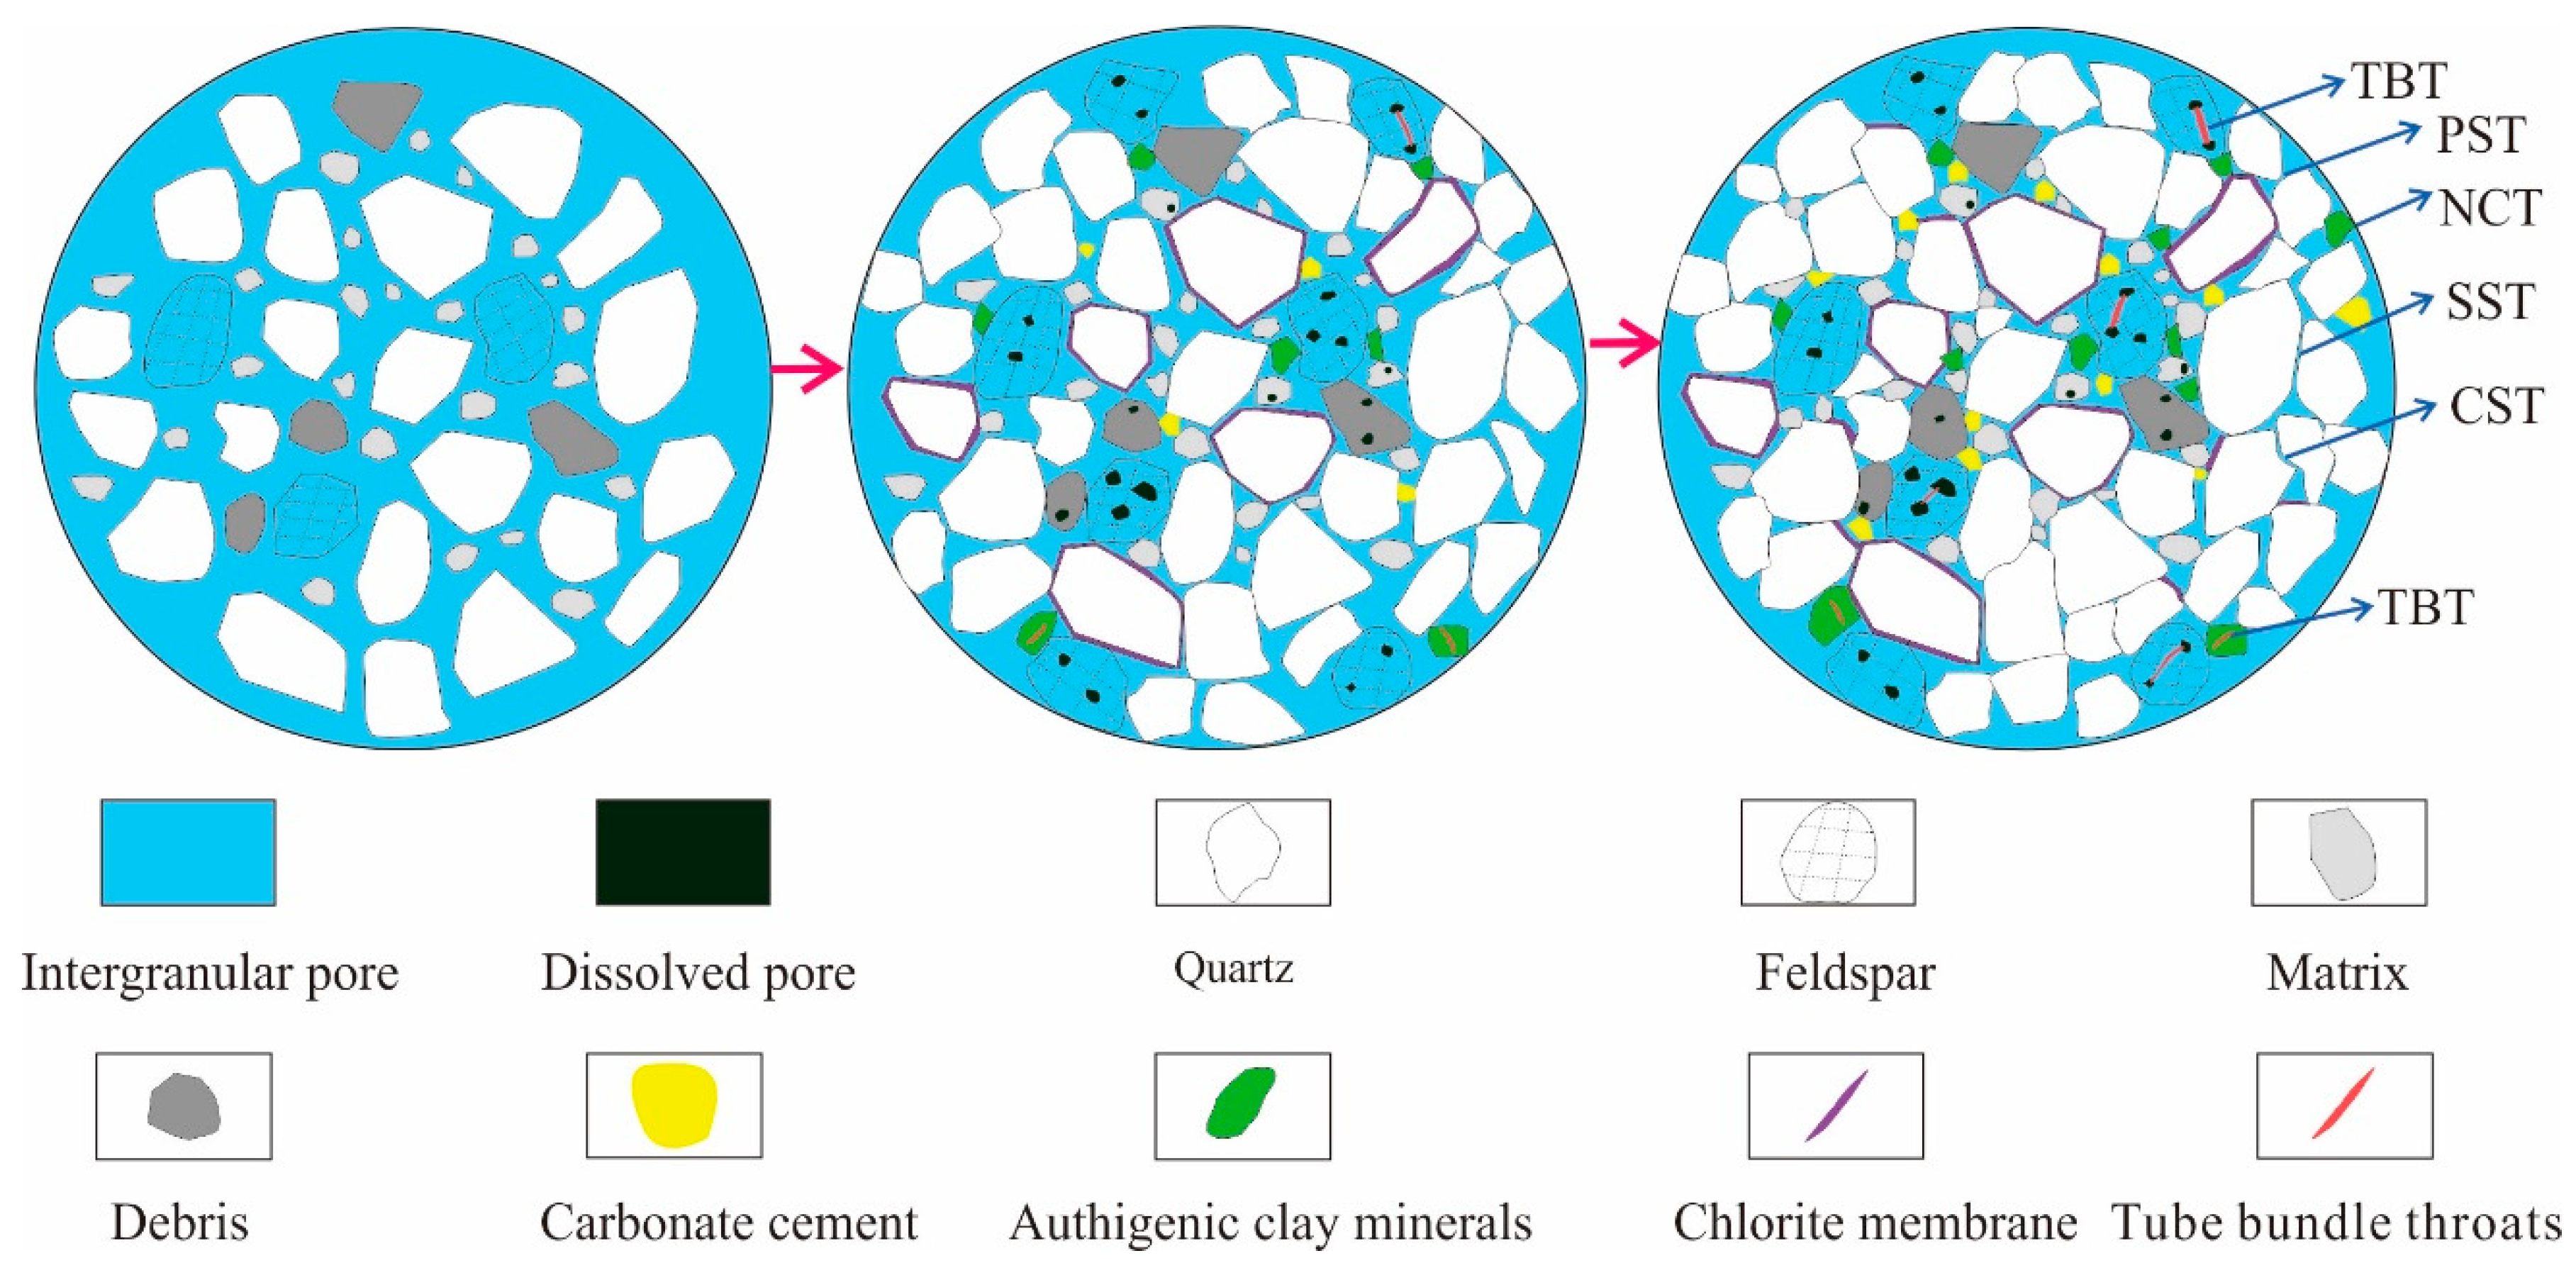
  • Type I pore-throats are mainly tube-bundle throats with intercrystalline pores and dissolution pores and small throat with small pores. Type II pore-throats are mainly necked throats with residual primary intergranular pores and small throats with large pores. Type III pore-throats are mainly composed of pore-reduced throats, lamellar and curved lamellar throats with residual primary intergranular pores, and large throats with large pores.
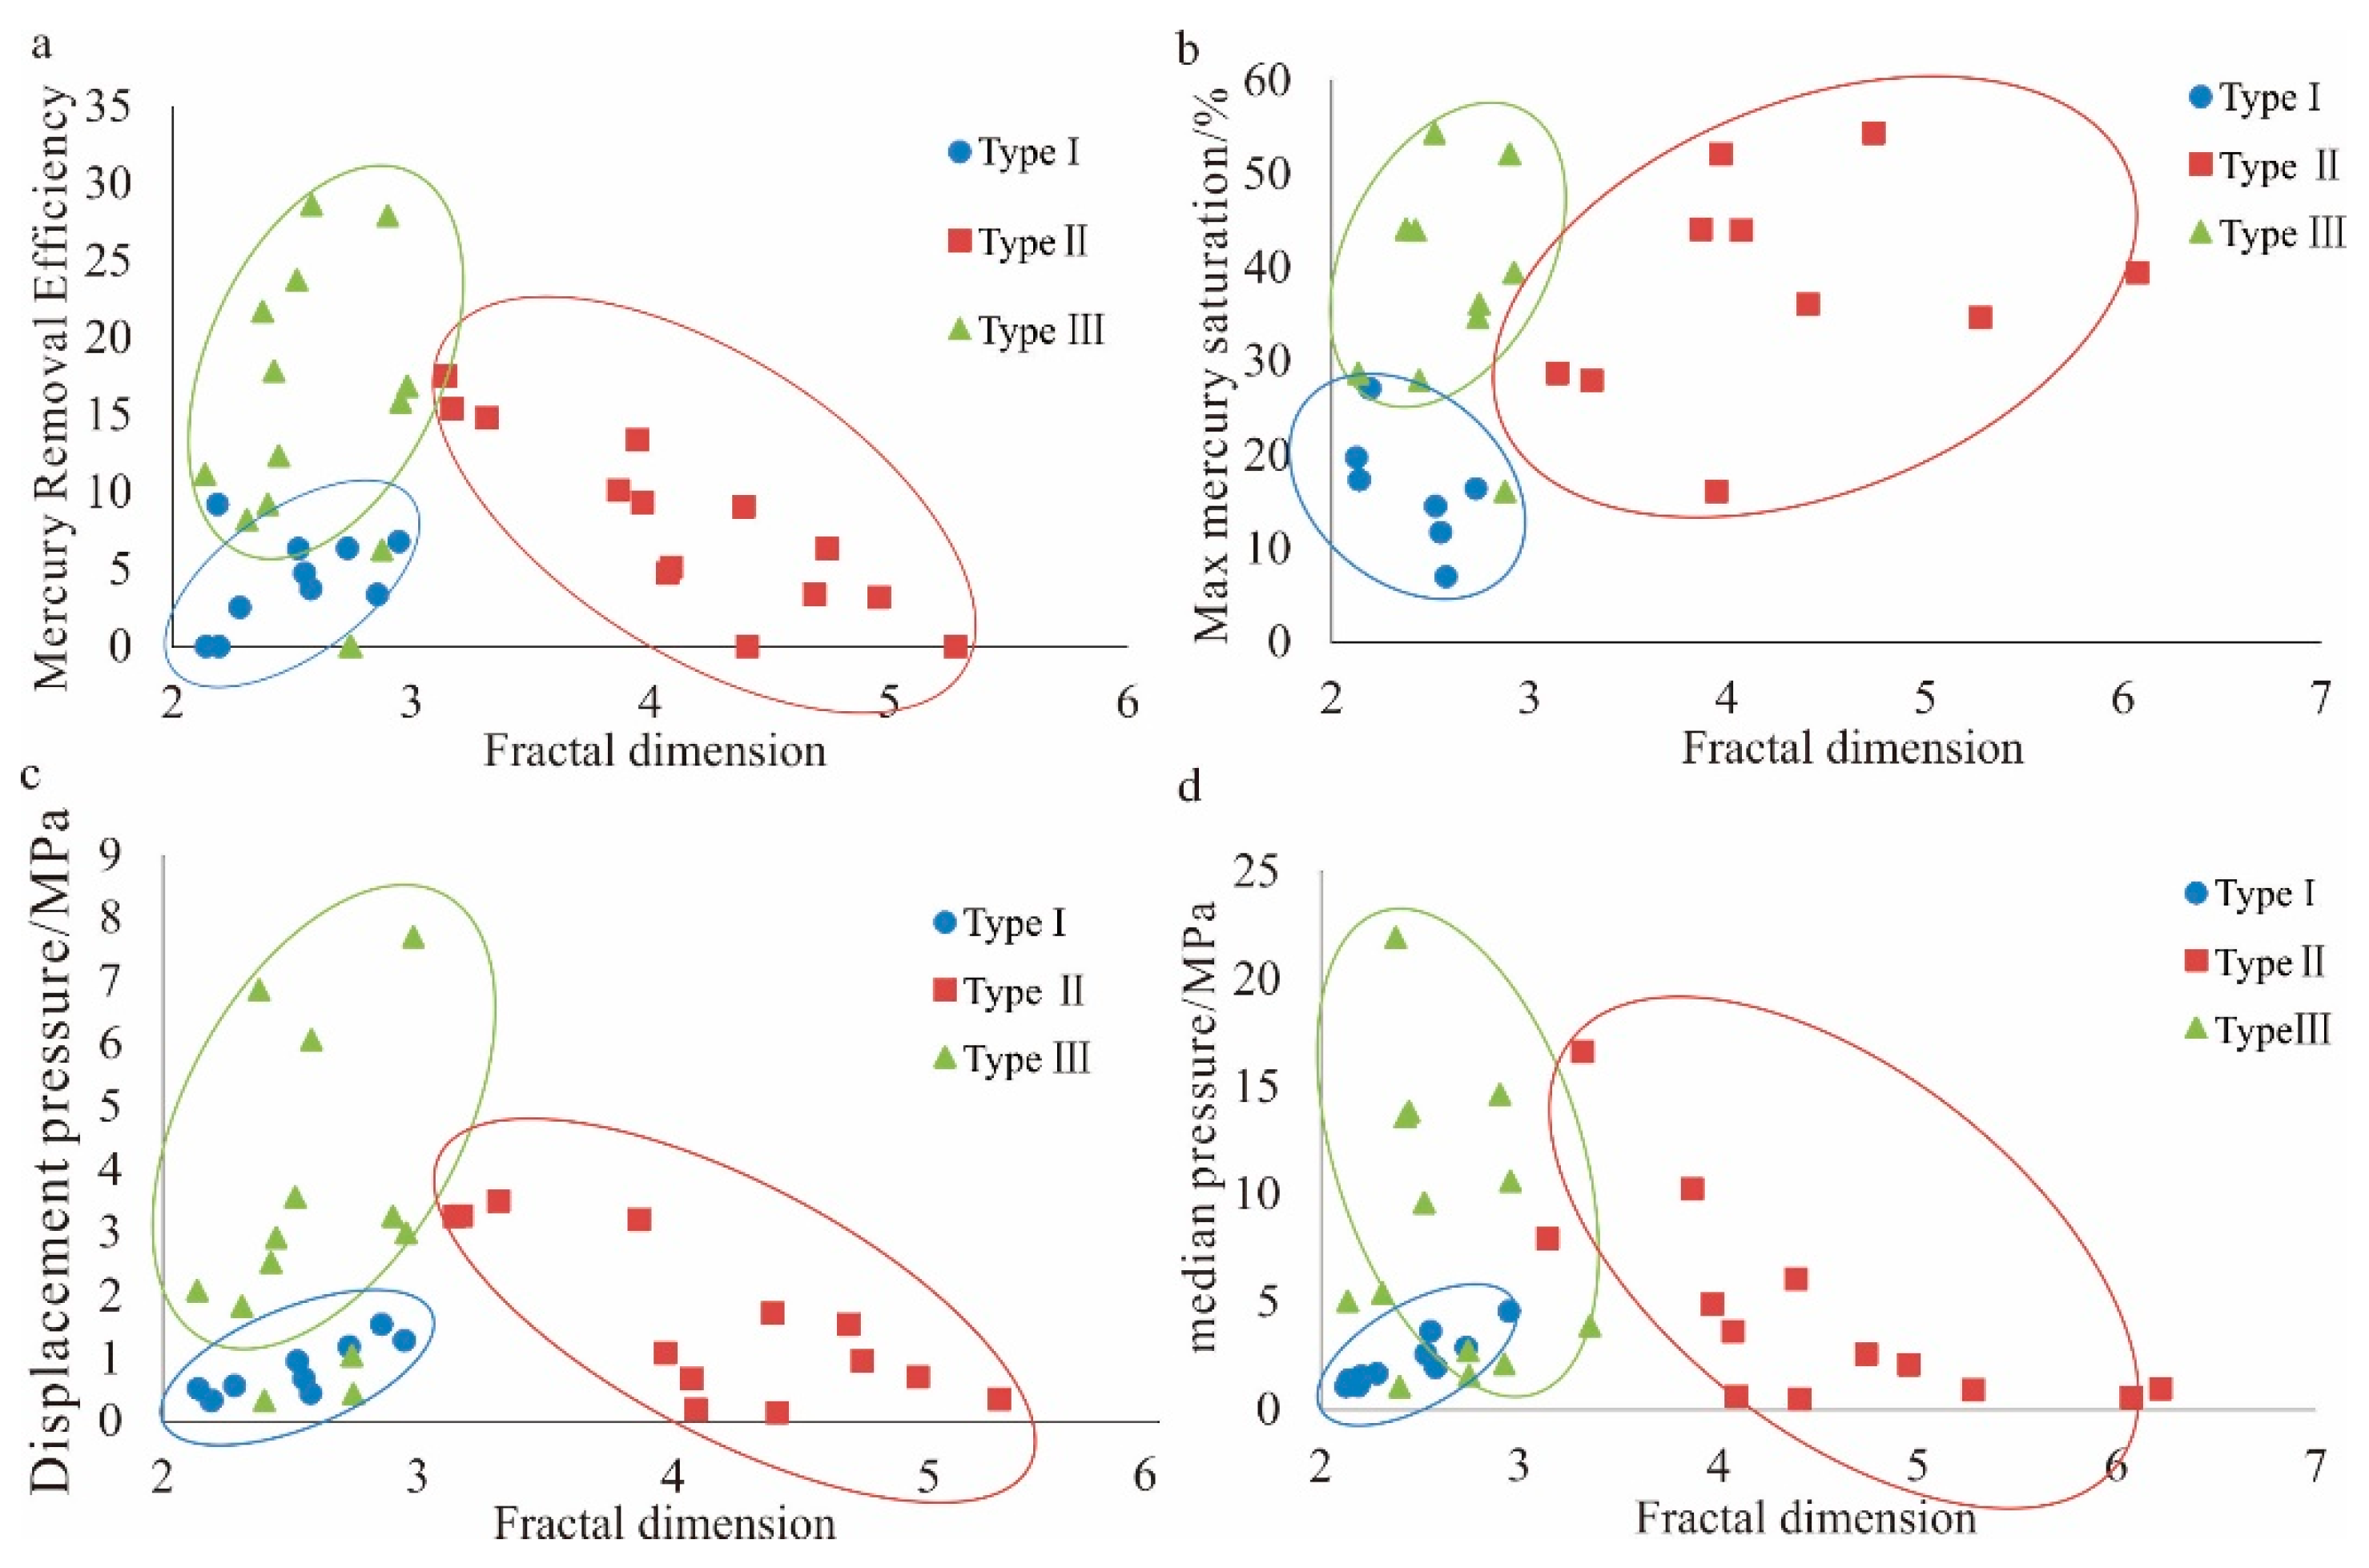
  • Different types of pore-throats have different responses to high-pressure mercury intrusion parameters in the reservoir, mainly due to the differences in the sizes of various types of pores and throats and their combinations. Type III pore-throats are the most favourable for hydrocarbon migration, followed by type I pore-throats, and the migration ability of oil and gas in type II pore-throats is the worst.
  • Diagenesis, rock composition and pore-throat collocation are the reasons for the differences in the fractal dimensions of different types of pore-throats. Diagenesis and rock composition jointly affect the combination of different types of pore-throats, which is reflected in the differences in the characteristics of the high-pressure mercury intrusion parameters between different types of pore-throats.

Author Contributions

Funding acquisition L.L.; Writing-review & editing, L.L.; conceptualization, F.N.; Writing-original-draft, F.N.; Data curation, Y.L.; Methodology, C.W.; Supervision and Validation, Y.Y.; Investigation, Z.C. All authors have read and agreed to the published version of the manuscript.

Funding

This research was funded by the National Science and Technology Major Project, China, “Evaluation Technology of Mesozoic Low Permeability Reservoir Heterogeneity” (Project No. 2016ZX05050006), a subproject of the “Large Low Permeability Lithological Reservoir Development Demonstration Project in Ordos Basin”.

Data Availability Statement

The data presented in this study are available on request from the corresponding author.

Acknowledgments

We thank this project team for providing data support for this paper. We thank the academic editor and four anonymous reviewers for their constructive suggestions, pertinent comments and careful corrections, which greatly improved the quality of this manuscript.

Conflicts of Interest

The authors declare no conflict of interest.

References

  1. Mandelbrot, B.B. On the geometry of homogeneous turbulence, with stress on the fractal dimension of the iso-surfaces of scalars. J. Fluid Mech. 1975, 72, 401–416. [Google Scholar] [CrossRef]
  2. Singh, A.; Pharate, N.; Desai, B.G. Assessing the impact of bioturbation on reservoir quality: Integrated spontaneous imbibition, pressure decay profile permeability and pore-throat characterization study of the Cretaceous Bhuj formation, Kachchh basin, India. Geoenergy Sci. Eng. 2023, 228, 212000. [Google Scholar] [CrossRef]
  3. Siddiqui, M.A.Q.; Ueda, K.; Komatsu, H.; Shimamoto, T.; Roshan, H. Caveats of using fractal analysis for clay rich pore systems. J. Pet. Sci. Eng. 2020, 195, 107622. [Google Scholar] [CrossRef]
  4. Ali, Z.; Rabiei, F.; Hosseini, K. A fractal–fractional-order modified Predator–Prey mathematical model with immigrations. Math. Comput. Simul. 2023, 207, 466–481. [Google Scholar] [CrossRef]
  5. Gómez-Carracedo, A.; Alvarez-Lorenzo, C.; Coca, C.; Martínez-Pacheco, R.; Concheiro, A.; Gómez-Amoza, J.L. Fractal analysis of SEM images and mercury intrusion porosimetry data for the microstructural characterization of microcrystalline cellulose-based pellets. Acta Mater. 2009, 57, 295–303. [Google Scholar] [CrossRef]
  6. Asensi, E.; Alemany, E. A hindered settling velocity model related to the fractal dimension and activated sludge flocs characteristics: Application to a sludge with a previous fragmentation and flocculation process. Sep. Purif. Technol. 2022, 300, 121812. [Google Scholar] [CrossRef]
  7. Verma, M.; Sharma, S. Modeling heterogeneity in an open percolation backbone fractal traffic network. Physica A 2023, 619, 128721. [Google Scholar] [CrossRef]
  8. Sahila, A.; Zekri, N.; Clerc, J.P.; Kaiss, A.; Sahraoui, S. Fractal analysis of wildfire pattern dynamics using a Small World Network model. Physica A 2021, 583, 126300. [Google Scholar] [CrossRef]
  9. Golmankhaneh, A.K.; Tejado, I.; Sevli, H.; Valdés, J.E.N. On initial value problems of fractal delay equations. Appl. Math. Comput. 2023, 449, 127980. [Google Scholar] [CrossRef]
  10. Khurpade, P.D.; Kshirsagar, L.K.; Nandi, S. Characterization of heterogeneous petroleum reservoir of Indian Sub-continent: An integrated approach of hydraulic flow unit—Mercury intrusion capillary pressure—Fractal model. J. Pet. Sci. Eng. 2021, 205, 108788. [Google Scholar] [CrossRef]
  11. Tripathy, A.; Kumar, A.; Srinivasan, V.; Singh, K.H.; Singh, T.N. Fractal analysis and spatial disposition of porosity in major Indian gas shales using low-pressure nitrogen adsorption and advanced image segmentation. J. Nat. Gas. Sci. Eng. 2019, 72, 103009. [Google Scholar] [CrossRef]
  12. Macek, R.; Branco, R.; Podulka, P.; Nejad, R.M.; Costa, J.D.; Ferreira, J.A.M.; Capela, C. The correlation of fractal dimension to fracture surface slope for fatigue crack initiation analysis under bending-torsion loading in high-strength steels. Measurement 2023, 218, 113169. [Google Scholar] [CrossRef]
  13. Lu, J.X.; Zheng, C.S.; Liu, W.C.; Li, H.; Shi, S.L.; Lu, Y.; Ye, Q.; Zheng, Y.N. Evolution of the pore structure and fractal characteristics of coal under microwave-assisted acidification. Fuel 2023, 347, 128500. [Google Scholar] [CrossRef]
  14. Li, Z.B.; Ren, T.R.; Li, X.C.; Qiao, M.; Yang, X.H.; Tan, L.H.; Nie, B.S. Multi-scale pore fractal characteristics of differently ranked coal and its impact on gas adsorption. Int. J. Min. Sci. Technol. 2023, 33, 389–401. [Google Scholar] [CrossRef]
  15. Zhong, X.Y.; Zhu, Y.S.; Jiao, T.; Qi, Z.; Luo, J.H.; Xie, Y.H.; Liu, L.Y. Microscopic pore-throat structures and water flooding in heterogeneous low-permeability sandstone reservoirs: A case study of the Jurassic Yan’an Formation in the Huanjiang area, Ordos Basin, Northern China. J. Asian Earth Sci. 2021, 219, 104903. [Google Scholar] [CrossRef]
  16. Hazra, B.; Wood, D.A.; Kumar, S.; Saha, S.; Dutta, S.; Kumari, P.; Singh, A.K. Fractal disposition, porosity characterization and relationships to thermal maturity for the Lower Permian Raniganj basin shales, India. J. Nat. Gas Sci. Eng. 2018, 59, 452–465. [Google Scholar] [CrossRef]
  17. Hazra, B.; Wood, W.A.; Vishal, V.; Varma, A.K.; Sakha, D.; Singh, A.K. Porosity controls and fractal disposition of organic-rich Permian shales using low-pressure adsorption techniques. Fuel 2018, 220, 837–848. [Google Scholar] [CrossRef]
  18. Lee, B.H.; Lee, S.K. Effects of specific surface area and porosity on cube counting fractal dimension, lacunarity, configurational entropy, and permeability of model porous networks: Random packing simulations and NMR micro-imaging study. J. Hydrol. 2013, 496, 122–141. [Google Scholar] [CrossRef]
  19. Zhang, Q.; Liu, R.H.; Pang, Z.L.; Lin, W.; Bai, W.H.; Wang, H.Y. Characterization of microscopic pore structures in Lower Silurian black shale(S1l), southeastern Chongqing, China. Mar. Pet. Geol. 2016, 71, 250–259. [Google Scholar] [CrossRef]
  20. Liu, J.W.; Lu, D.T.; Li, P.C. Nano-scale dual-pore-shape structure and fractal characteristics of transitional facies shale matrix. J. Nat. Gas Sci. Eng. 2019, 68, 102907. [Google Scholar] [CrossRef]
  21. Ma, B.Y.; Hu, Q.H.; Yang, S.Y.; Zhang, T.; Qiao, H.G.; Meng, M.M.; Zhu, X.C.; Sun, X.H. Pore structure typing and fractal characteristics of lacustrine shale from Kongdian Formation in East China. J. Nat. Gas Sci. Eng. 2021, 85, 103709. [Google Scholar] [CrossRef]
  22. Hong, G.; Oh, S.; Kim, J.; Chin, W.J.; Kim, Y.J.; Choi, S.; Song, C. Surface-fractal-dimension characteristics of cementitious composites with multi-walled carbon nanotubes dispersed by silica fume. Constr. Build Mater. 2022, 329, 127182. [Google Scholar] [CrossRef]
  23. N’Diaye, M.; Degeratu, C.; Bouler, J.M.; Chappard, D. Biomaterial porosity determined by fractal dimensions, succolarity and lacunarity on microcomputed tomographic images. Mater. Sci. Eng. C 2013, 33, 2025–2030. [Google Scholar] [CrossRef]
  24. Zang, Q.B.; Liu, C.L.; Awan, R.S.; Yang, X.Y.; Li, G.X.; Wu, Y.P.; Lu, Z.D.; Feng, D.H. Occurrence characteristics of the movable fluid in heterogeneous sandstone reservoir based on fractal analysis of NMR data: A case study of the Chang 7 Member of Ansai Block, Ordos Basin, China. J. Pet. Sci. Eng. 2022, 214, 110499. [Google Scholar] [CrossRef]
  25. Al-Kharra’a, H.S.; Wolf, K.H.A.A.; AlQuraishi, A.A.; Mahmoud, M.A.; Deshenenkov, I.; AlDuhailan, M.A.; Alarifi, S.A.; AlQahtani, N.B.; Kwak, H.T.; Zitha, P.L.J. Impact of clay mineralogy on the petrophysical properties of tight sandstones. Geoenergy Sci. Eng. 2023, 227, 211883. [Google Scholar] [CrossRef]
  26. Akhtar, S.; Yang, X.Y.; Pirajno, F. Sandstone type uranium deposits in the Ordos Basin, Northwest China: A case study and an overview. J. Asian Earth Sci. 2017, 146, 367–382. [Google Scholar] [CrossRef]
  27. Xu, X.; Liu, L.Y.; Li, X.J.; Yang, W.J.; Cao, Y.G.; Ma, H.; He, A.A.; Wang, R.Y.; Leng, H.B.; Zhu, Y.S.; et al. Sequence stratigraphy, sedimentary characteristics of barrier coastal sedimentary system of the Benxi Formation (Gaoqiao area, Ordos basin) and favorable reservoir distribution. Energy Rep. 2021, 7, 5316–5329. [Google Scholar] [CrossRef]
  28. Jiu, B.; Huang, W.H.; Li, Y. The effect of hydrothermal fluids on Ordovician carbonate rocks, southern Ordos Basin, China. Ore Geol. Rev. 2020, 126, 103803. [Google Scholar] [CrossRef]
  29. Li, Y.; Fan, A.P.; Yang, R.C.; Sun, Y.P.; Lenhardt, N. Sedimentary facies control on sandstone reservoir properties: A case study from the permian Shanxi Formation in the southern Ordos basin, central China. Mar. Pet. Geol. 2021, 129, 105083. [Google Scholar] [CrossRef]
  30. Nan, F.C.; Lin, L.B.; Chen, Z.B.; Yu, Y.; Mu, S.C.; Guo, X.H. Development characteristics of deepwater gravity flows and tight sandstone reservoir characteristics in Chang 6 in the Huaqing area, Ordos Basin, China. Geol. J. 2022, 58, 150–169. [Google Scholar] [CrossRef]
  31. Peng, H.; Wang, J.Q.; Liu, C.Y.; Zhao, H.G.; Huang, L.; Zhao, X.C.; Zhang, S.H.; Liang, C.; Wang, Z.; Cattò, S.; et al. Long-term and multiple stage exhumation of the Ordos Basin, western North China Craton: Insights from seismic reflection, borehole and geochronological data. Earth Sci. Rev. 2023, 238, 104349. [Google Scholar] [CrossRef]
  32. Liu, G.Z.; Hu, G.C.; Shi, X.Z.; Ma, Y.P.; Yin, X.Z.; Li, A.R. Carbonate cementation patterns and diagenetic reservoir facies of the Triassic Yanchang Formation deep-water sandstone in the Huangling area of the Ordos Basin, northwest China. J. Pet. Sci. Eng. 2021, 203, 108608. [Google Scholar] [CrossRef]
  33. Zhao, B.S.; Li, R.X.; Qin, X.L.; Wang, N.; Zhou, W.; Khaled, A.; Zhao, D.; Zhang, Y.N.; Wu, X.L.; Liu, Q. Geochemical characteristics and mechanism of organic matter accumulation of marine-continental transitional shale of the lower permian Shanxi Formation, southeastern Ordos Basin, north China. J. Pet. Sci. Eng. 2021, 205, 108815. [Google Scholar] [CrossRef]
  34. Bozetti, G.; Li, X.B.; Yang, Z.L.; Liu, H.Q.; Huang, J.P.; Li, Z.Y.; Xu, J.P. New insights into deep-lacustrine architectural elements: Examples from the upper Triassic Yanchang Formation, Ordos basin. J. Asian Earth Sci. 2023, 241, 105431. [Google Scholar] [CrossRef]
  35. Zavala, C.; Liu, H.Q.; Li, X.B.; Arcuri, M.; Meglio, M.D.; Zorzano, A.; Otharán, G.; Hao, B.; Wang, Y.T. Lacustrine sequence stratigraphy: New insights from the study of the Yanchang Formation (Middle-Late Triassic), Ordos Basin, China. In The Ordos Basin; Elsevier: Amsterdam, The Netherlands, 2020; Chapter 16; pp. 309–335. [Google Scholar]
  36. You, J.Y.; Liu, Y.Q.; Li, Y.J.; Zhou, D.W.; Zheng, Q.H.; Yang, Y.Y.; Shi, J.; Gao, H.F. Influencing factor of Chang 7 oil shale of Triassic Yanchang Formation in Ordos Basin: Constraint from hydrothermal fluid. J. Pet. Sci. Eng. 2021, 201, 108532. [Google Scholar] [CrossRef]
  37. Sun, N.L.; Zhong, J.H.; Hao, B.; Ge, Y.Z.; Swennen, R. Sedimentological and diagenetic control on the reservoir quality of deep-lacustrine sedimentary gravity flow sand reservoirs of the Upper Triassic Yanchang Formation in Southern Ordos Basin, China. Mar. Pet. Geol. 2020, 112, 104050. [Google Scholar] [CrossRef]
  38. Yang, R.C.; He, Z.L.; Qiu, G.Q.; Jin, Z.J.; Sun, D.S.; Jin, X.H. A Late Triassic gravity flow depositional system in the southern Ordos Basin. Pet. Explor. Dev. 2014, 41, 724–733. [Google Scholar] [CrossRef]
  39. Chu, R.J.; Wu, H.C.; Zhu, R.K.; Fang, Q.; Deng, S.H.; Cui, J.W.; Yang, T.S.; Li, H.Y.; Cao, L.W.; Zhang, S.H. Orbital forcing of Triassic megamonsoon activity documented in lacustrine sediments from Ordos Basin, China. Palaeogeogr. Palaeoclimatol. Palaeoecol. 2020, 541, 109542. [Google Scholar] [CrossRef]
  40. Zhang, Y.; Meng, X.H.; Wang, D.Y. Provenance analysis of the Middle Triassic Ordos Basin: Constraints from zircon U-Pb geochronology. Geochemistry 2020, 80, 125521. [Google Scholar] [CrossRef]
  41. Su, K.M.; Chen, S.J.; Hou, Y.T.; Zhang, H.F.; Zhang, X.L.; Zhang, W.X.; Liu, G.L.; Hu, C.; Han, M.M. Geochemical characteristics, origin of the Chang 8 oil and natural gas in the southwestern Ordos Basin, China. J. Pet. Sci. Eng. 2021, 200, 108406. [Google Scholar] [CrossRef]
  42. Ritts, B.D.; Hanson, A.D.; Darby, B.J.; Nanson, L.; Berry, A. Sedimentary record of Triassic intraplate extension in North China: Evidence from the nonmarine NW Ordos Basin, Helan Shan and Zhuozi Shan. Tectonophysics 2004, 386, 177–202. [Google Scholar] [CrossRef]
  43. Loon, A.J.; Yang, R.C.; Fan, A.P.; Han, Z.Z. Slurry deposits in cores from the Middle-Late Triassic Yanchang Formation (Ordos Basin, China). In The Ordos Basin; Elsevier: Amsterdam, The Netherlands, 2022; Chapter 19; pp. 359–370. [Google Scholar]
  44. Ju, W.; Niu, X.B.; Feng, S.B.; You, Y.; Xu, K.; Wang, G.; Xu, H. Present-day in-situ stress field within the Yanchang Formation tight oil reservoir of Ordos Basin, central China. J. Pet. Sci. Eng. 2020, 187, 106809. [Google Scholar] [CrossRef]
  45. Liu, M.J.; Xiong, C. Diagenesis and reservoir quality of deep-lacustrine sandy-debris-flow tight sandstones in Upper Triassic Yanchang Formation, Ordos Basin, China: Implications for reservoir heterogeneity and hydrocarbon accumulation. J. Pet. Sci. Eng. 2021, 202, 108548. [Google Scholar] [CrossRef]
  46. Chen, Z.B.; Fu, L.; Chen, X.J.; Zhang, T.; Xie, Y.H.; Wang, H.B.; Zhu, Y.S. Quantitative Evaluation Method for Micro Heterogeneity of Tight Sandstone: A case study of Chang-6 reservoir of Yanchang Formation in Huaqing area, Ordos Basin. Acta Sedimentol. Sin. 2021, 39, 1086–1099. [Google Scholar]
  47. Lai, J.; Wang, G.W.; Zheng, Y.Q.; Li, W.L.; Cai, C. Method for calculating the fractal dimension of the pore structure of low permeability reservoirs: A case study on the Xujiahe formation reservoir in the central Sichuan Basin. J. Northeast. Pet. Univ. 2013, 37, 1–8. [Google Scholar]
  48. Cheng, H.; Jin, Z.K.; Yu, W.R.; Li, B.Q.; Zhu, X.E.; Chen, B.; Wu, Z.Z. Reservoir Classification and Evaluation Based on Fractal Theory and Factor Analysis: A Case Study of the Third Member of the Funing Formation, Qintong Sag, Subei Basin. Acta Sedimentol. Sin. 2023, 41, 828–838. [Google Scholar]
  49. Singh, A.; Jha, N.K.; Mandal, P.P.; Esteban, L.; Desai, B.G. Pore-throat characterization of bioturbated heterogeneous sandstone, Bhuj Formation, Kachchh India: An integrated analysis using NMR and HPMI studies. J. Pet. Sci. Eng. 2022, 211, 110221. [Google Scholar] [CrossRef]
  50. Vaisblat, N.; Harris, B.H.; Ayranci, K.; Chalaturnyk, R.; Power, M.; Twemlow, C.; Minion, N. Petrophysical properties of a siltstone reservoir—An example from the Montney Formation, western Canada. Mar. Pet. Geol. 2022, 136, 105431. [Google Scholar] [CrossRef]
  51. Isah, A.; Adebayo, A.R.; Mahmoud, M.; Babalola, L.O.; El-Husseiny, A. Drainage mechanisms in gas reservoirs with bimodal pores—A core and pore scale study. J. Nat. Gas Sci. Eng. 2021, 86, 103652. [Google Scholar] [CrossRef]
  52. Akilu, S.; Padmanabhan, E.; Sun, Z. A review of transport mechanisms and models for unconventional tight shale gas reservoir systems. Int. J. Heat Mass Transf. 2021, 175, 121125. [Google Scholar] [CrossRef]
  53. Hosseini, M.; Tavakoli, V.; Nazemi, M. The effect of heterogeneity on NMR derived capillary pressure curves, case study of Dariyan tight carbonate reservoir in the central Persian Gulf. J. Pet. Sci. Eng. 2018, 171, 1113–1122. [Google Scholar] [CrossRef]
  54. Farahani, M.; Aghaei, H.; Masoumi, H. Effect of pore type on porosity, permeability and pore volume compressibility of geological formations due to in-situ stress change. J. Pet. Sci. Eng. 2022, 218, 110986. [Google Scholar] [CrossRef]
  55. Shabaninejad, M.; Middlelton, J.; Fogden, A. Systematic pore-scale study of low salinity recovery from Berea sandstone analyzed by micro-CT. J. Pet. Sci. Eng. 2018, 163, 283–294. [Google Scholar] [CrossRef]
  56. Abuamarah, B.A.; Nabawy, B.S.; Shehata, A.M.; Kassem, O.M.K.; Ghrefat, H. Integrated geological and petrophysical characterization of oligocene deep marine unconventional poor to tight sandstone gas reservoir. Mar. Pet. Geol. 2019, 109, 868–885. [Google Scholar] [CrossRef]
  57. Khan, M.A.; Khan, T.; Ali, A.; Bello, A.M.; Radwan, A.E. Role of depositional and diagenetic controls on reservoir quality of complex heterogenous tidal sandstone reservoirs: An example from the Lower Goru formation, Middle Indus Basin, Southwest Pakistan. Mar. Pet. Geol. 2023, 154, 106337. [Google Scholar] [CrossRef]
  58. Ortiz-Orduz, A.; Ríos-Reyes, C.A.; Vargas-Escudero, M.A.; García-González, M. Impact of diagenesis on the reservoir rock quality of the Cachiri Group tight sandstones in Cesar sub basin (Colombia): A case of study from ANH-CR-MONTECARLO 1X well. J. Nat. Gas Sci. Eng. 2021, 95, 104138. [Google Scholar] [CrossRef]
  59. Busch, B.; Becker, I.; Koehrer, B.; Adelmann, D.; Hilgers, C. Porosity evolution of two Upper Carboniferous tight-gas-fluvial sandstone reservoirs: Impact of fractures and total cement volumes on reservoir quality. Mar. Pet. Geol. 2019, 100, 376–390. [Google Scholar] [CrossRef]
  60. Oluwadebi, A.G.; Taylor, K.G.; Dowey, P.J. Diagenetic controls on the reservoir quality of the tight gas Collyhurst Sandstone Formation, Lower Permian, East Irish Sea Basin, United Kingdom. Sediment. Geol. 2018, 371, 55–74. [Google Scholar] [CrossRef]
  61. Wang, Y.S.; Gao, Y.; Fang, Z.W. Pore-throat structure and classification of Paleogene tight reservoirs in Jiyang depression, Bohai Bay Basin, China. Pet. Explor. Dev. 2021, 48, 308–322. [Google Scholar] [CrossRef]
  62. Shahab, A.R.; Chen, Z.H.; Hassanat, U.; Waqar, A.; Mubarik, A. Reservoir characteristics and controlling factors of Permian glutenite in Northern Zhongghai uplift, Junggar Basin, China. Ore Energy Resour. Geol. 2023, 15, 100025. [Google Scholar]
  63. Khazaie, E.; Noorian, Y.; Kavianpour, M.; Moussavi-Harami, R.; Mahboubi, A.; Omidpour, A. Sedimentological and diagenetic impacts on porosity systems and reservoir heterogeneities of the Oligo-Miocene mixed siliciclastic and carbonate Asmari reservoir in the Mansuri oilfield, SW Iran. J. Pet. Sci. Eng. 2022, 213, 110435. [Google Scholar] [CrossRef]
  64. Al-Juboury, A.; Howard, J.P.; Vincent, S.J.; Nichols, G. Petrography, diagenesis and geochemistry of the Cambro-Ordovician Khabour sandstones, western Iraq: Implications for reservoir quality and the impact of the Hirnantian glaciation. Mar. Pet. Geol. 2021, 123, 104733. [Google Scholar] [CrossRef]
  65. Lanz, M.D.R.; Azmy, K.; Cesaretti, N.N.; Fortunatti, N.B. Diagenesis of the Vaca Muerta Formation, Neuquén Basin: Evidence from petrography, microthermometry and geochemistry. Mar. Pet. Geol. 2021, 124, 104769. [Google Scholar] [CrossRef]
  66. Moyano-Paz, D.; Gómez-Dacal, A.R.; Varela, A.N.; Comerio, M.; Muñoz-Olivero, T.M.; Bucher, J.; Richiano, S.; Poiré, D.G. Controls on composition and diagenesis of wave- and river-dominated deltas: Impacts on reservoir properties. An example from the La Anita Formation (Argentina). Mar. Pet. Geol. 2022, 138, 105571. [Google Scholar] [CrossRef]
  67. Umar, M.; Friis, H.; Khan, A.S.; Kassi, A.M.; Kasi, A.K. The effects of diagenesis on the reservoir characters in sandstones of the Late Cretaceous Pab Formation, Kirthar Fold Belt, southern Pakistan. J. Asian Earth Sci. 2011, 40, 62. [Google Scholar] [CrossRef]
Figure 1. The location of the study area and the stratigraphic column of the Yanchang Formation. (a) The location of the Ordos Basin; (b) the location of the study area; (c) the key well locations in the study area; (d) the stratigraphic column of the Yanchang Formation in the study area (modified from [34]).
Minerals 13 01137 g001
Figure 2. Rocks and microscopic characteristics of Chang 6 reservoir in Huaqing area. (a) Grey fine sandstone with obvious calcareous cementation, from Well B29, 1644.9 m, core image; (b) dark grey massive dense fine sandstone, from Well L312, 2085.62 m, core image; (c) grey massive fine sandstone, from Well B286, 1990.34 m, core image; (d) intergranular pores, from Well B136, chang63, 2115.62 m, thin sections image; (e) intergranular pores, from Well B143, chang63, 1951.4 m, thin sections image; (f) development of dissolution pores, from Well B217, chang63, 2214.53 m, thin sections image; (g) development of intercrystalline pores and microcracks, from Well B163, chang63, 2141.41 m, SEM image; (h) intercrystalline pores and microcracks, from Well B143, 1926.79 m, SEM image; (i) intercrystalline pores, from Well B458, 1947.8 m, SEM image.
Minerals 13 01137 g002
Figure 3. Petrological characteristics of 6 reservoirs in the study area. (Q: quartz, F: feldspar, R: rock detritus). (a) Triangulation of sandstones in the Long 6 reservoir in the study area; (b) Sector map of rock chip content.
Minerals 13 01137 g003
Figure 4. Capillary curve characteristics and pore-throat radius distribution of Chang 6 reservoirs in the study area. (a) high pressure mercury piezo tube pressure curve; (b) pore-throat radius distribution curve.
Minerals 13 01137 g004
Figure 5. Typical curves of tube-bundle and spherical fractal models. (a,b) Typical curve of tube-bundle fractal model; (c,d) typical curve of spherical fractal model.
Minerals 13 01137 g005
Figure 6. Correlation between inflection point and turning radius of tube-bundle fractal model and pore-throat classification. (a) Correlation of inflection radius corresponding to fractal dimension with pore-throat turning radius; (b) Typical classification curve for pore-throat radius.
Minerals 13 01137 g006
Figure 7. Correlation between fractal dimension and porosity. (a) Correlation between fractal dimension and porosity of pore throats without using types of pores; (b) Fractal dimension and permeability correlation.
Minerals 13 01137 g007
Figure 8. Distribution of various pore-throat volumes in total pore volume.
Minerals 13 01137 g008
Figure 9. Correlation between fractal dimensions of different types of pore-throats and mercury intrusion parameters. (a) Correlation of fractal dimensions and sorting coefficients for different types of pore-throats; (b) Correlation between the fractal dimension of different types of pore-throats and mercury removal efficiency; (c) Correlation between fractal dimensions and maximum mercury saturation for different types of pore-throats; (d) Correlation of fractal dimensions of different types of pore-throats with displacement pressures; (e) Correlation between fractal dimension and median radius for different types of pore-throats; (f) Correlation between fractal dimension and median pressure for different types of pore-throats.
Minerals 13 01137 g009
Figure 10. Sizes and types of pores and throats in Chang 6 reservoirs in the study area. (a) Well B266, 1984.7 m, thin sections image; (b) Well B156, 2066.42 m, thin sections image; (c) Well B156, 1938.32 m, thin sections image; (d) Well B196, 1894.58 m, thin sections image; (e) Well W51, 1951.04 m, thin sections image; (f) Well B212, 2075.87 m, thin sections image; (g) Well B142, 1982.9 m, thin sections image; (h) Well B143, 1927.5 m, thin sections image; (i) Well B304, 2078.5 m, thin sections image; (j) Well B401, 1947.3 m, SEM image; (k) Well B418, 1874.5 m, SEM image; (l) Well B487, 1857.1 m, SEM image; (m) Well B135, 2016.8 m, SEM image; (n) Well B153 2191.75 m, SEM image; (o) Well B163, 2116.44 m, SEM image. Inter P: intergranular pore; Inter CP: intercrystalline pore; FDP: feldspar dissolution pore; TBT: tube-bundle throat; PST: pore-shrinking throat; NCT: neck-contracted throat; SST: slice-shaped throat; CST: curved sheet throat.
Minerals 13 01137 g010
Figure 11. Distribution of different types of pore-throat high-pressure parameters. (a). Distribution of mercury removal efficiency for different types of pore-throats fractal dimensions; (b). Distribution of fractal dimensions and maximum mercury saturation for different types of pore-throats; (c). Distribution of fractal dimensions and displacement pressure of different types of pore-throats; (d). Distribution of fractal dimension and median pressure for different types of pore-throats.
Minerals 13 01137 g011
Figure 12. Relationships between fractal dimensions of various pore-throats and rock composition. (a) Correlation between fractal dimension and quartz content of different types of pore-throats; (b) Correlation between fractal dimension and feldspar content of different types of pore-throats; (c) Correlation between fractal dimension and rock chip content of different types of pore-throats; (d) Correlation between fractal dimension and clay mineral content of different types of pore-throats; (e) Correlation between fractal dimension and chlorite content in different types of pore-throats; (f) Correlation between fractal dimension of different types of pore-throats and carbonate cement content.
Minerals 13 01137 g012
Figure 13. Model diagram of pore-throat combination mode under the influence of diagenesis. PST: pore-shrinking throats; SST: slice-shaped throats; CST: curved sheet throats; TBT: tube-bundle throat; NCT: neck-contracted throats.
Minerals 13 01137 g013
Table 1. Statistical table of formulas of two fractal models.
ModelsFormulas
Spherical fractal model P c = 2 σ c o s θ r   (2)
S H g = S > r = 1 r 3 D r m i n 3 D   (3)
S H g = P m i n P c 3 D   (4)
l g 1 S H g = D 3 L g P c + D 3 L g P m i n   (5)
D = 3 + k   (6)
Tube-bundle fractal model S H g = V H g V p   (7)
S H g P c 2 D f   (8)
Lg S H g = D 2 × L g P c + α   (9)
D = 2 + k   (10)
Table 2. Statistical table of the rock composition of the Chang 6 reservoir in the Huaqing area (n = 545).
Rock CompositionQuartz/%Feldspar/%Debris/%Mica/%Clay Minerals/%Carbonate Cement/%Silica/%
Max555934.728.369736
Min59.2210.20.20.2
Average27.6136.7211.418.019.314.861.59
Table 3. Statistics of pore types in the Chang 6 reservoir in the Huaqing area (n = 128).
Pore TypeInter P/%Inter DP%FDP/%DDP/%Inter CP/%MC/%
Max6.51.5312.31.8
Min0.10.20.10.10.10.1
Average1.320.010.660.130.080.04
Proportion of total
pore space/%
58.93%0.45%29.46%5.80%3.57%1.79%
Inter P: intergranular pores; Inter DP: intergranular dissolved pores; FDP: feldspar-dissolved pores; DDP: debris-dissolved pores; Inter CP: intercrystalline pores; MC: microcracks.
Table 4. Statistics of three types of pore-throat fractal features.
NumberType I Pore-ThroatType II Pore-ThroatType III Pore-Throat
FDR2PorosityFDR2PorosityFDR2Porosity
12.52870.93141.58264.74290.98981.58262.52200.99992.9674
22.85860.99950.42864.68960.98090.42862.98350.99882.1429
3/ /3.86790.99492.22732.37890.97532.3864
42.58010.99050.93643.97060.99332.34092.90310.98997.0227
5///3.31800.92914.41822.44570.96871.8409
6///3.94850.98604.15912.87930.98091.9409
72.55380.99931.77394.07380.99281.77392.42590.90873.3261
82.28270.93911.56364.95920.99971.95452.31200.97822.5409
92.94770.98772.74294.39180.97663.65712.95620.99856.4000
102.73230.93092.69093.14330.72047.40002.13760.82224.7091
11///3.17220.99020.80502.58400.99970.7475
122.20520.95812.66676.22200.98581.66673.35590.99813.3333
132.12890.93232.33446.07550.99491.29692.92560.99564.6688
142.19480.97604.32734.40890.94671.80302.74840.99962.8848
152.14140.93212.31825.28030.98211.54552.74260.69522.3182
162.18960.96545.28264.09010.97072.93482.39930.79632.6413
max2.94770.99955.28266.22200.99977.40003.35590.99997.0227
min2.12890.93090.42863.14330.72040.42862.13760.69520.7475
average2.44530.96192.38734.39720.96462.49962.66880.94413.2419
FD: fractal dimension.
Table 5. Statistical table of the volume of various pore-throats in the total pore-throat volume.
Sample NumberMacroporesMesoporesMicroporesSample NumberMacroporesMesoporesMicropores
16.5%3.7%89.8%90.1%0.1%99.7%
20.4%0.1%99.5%102.5%0.7%96.9%
30.7%0.6%98.6%111.0%1.1%97.9%
41.0%0.3%98.7%120.3%5.5%94.2%
53.9%1.1%95.1%130.5%10.3%89.2%
62.0%0.6%97.4%140.7%24.1%75.2%
70.4%0.5%99.1%150.6%4.8%94.6%
80.7%3.3%96.0%161.6%24.5%73.8%
Average1.4%5.1%93.5%
Table 6. Distribution of pore radius and throat radius.
Type of Pore-ThroatMain Pore TypeMain Throat TypePore Radius Distribution/μmThroat Radius Distribution/μm
Type IInter CP, FDPTBT0.025~20.1~0.5
Type IIInter PNCT3.1~1460.3~3.5
Type IIIInter PSST, CST5.5~2100.2~1.3
Disclaimer/Publisher’s Note: The statements, opinions and data contained in all publications are solely those of the individual author(s) and contributor(s) and not of MDPI and/or the editor(s). MDPI and/or the editor(s) disclaim responsibility for any injury to people or property resulting from any ideas, methods, instructions or products referred to in the content.

