
Microscopic Pore Structure Characteristics and Fluid Mobility in Tight Reservoirs: A Case Study of the Chang 7 Member in the Western Xin’anbian Area of the Ordos Basin, China

Abstract
:1. Introduction
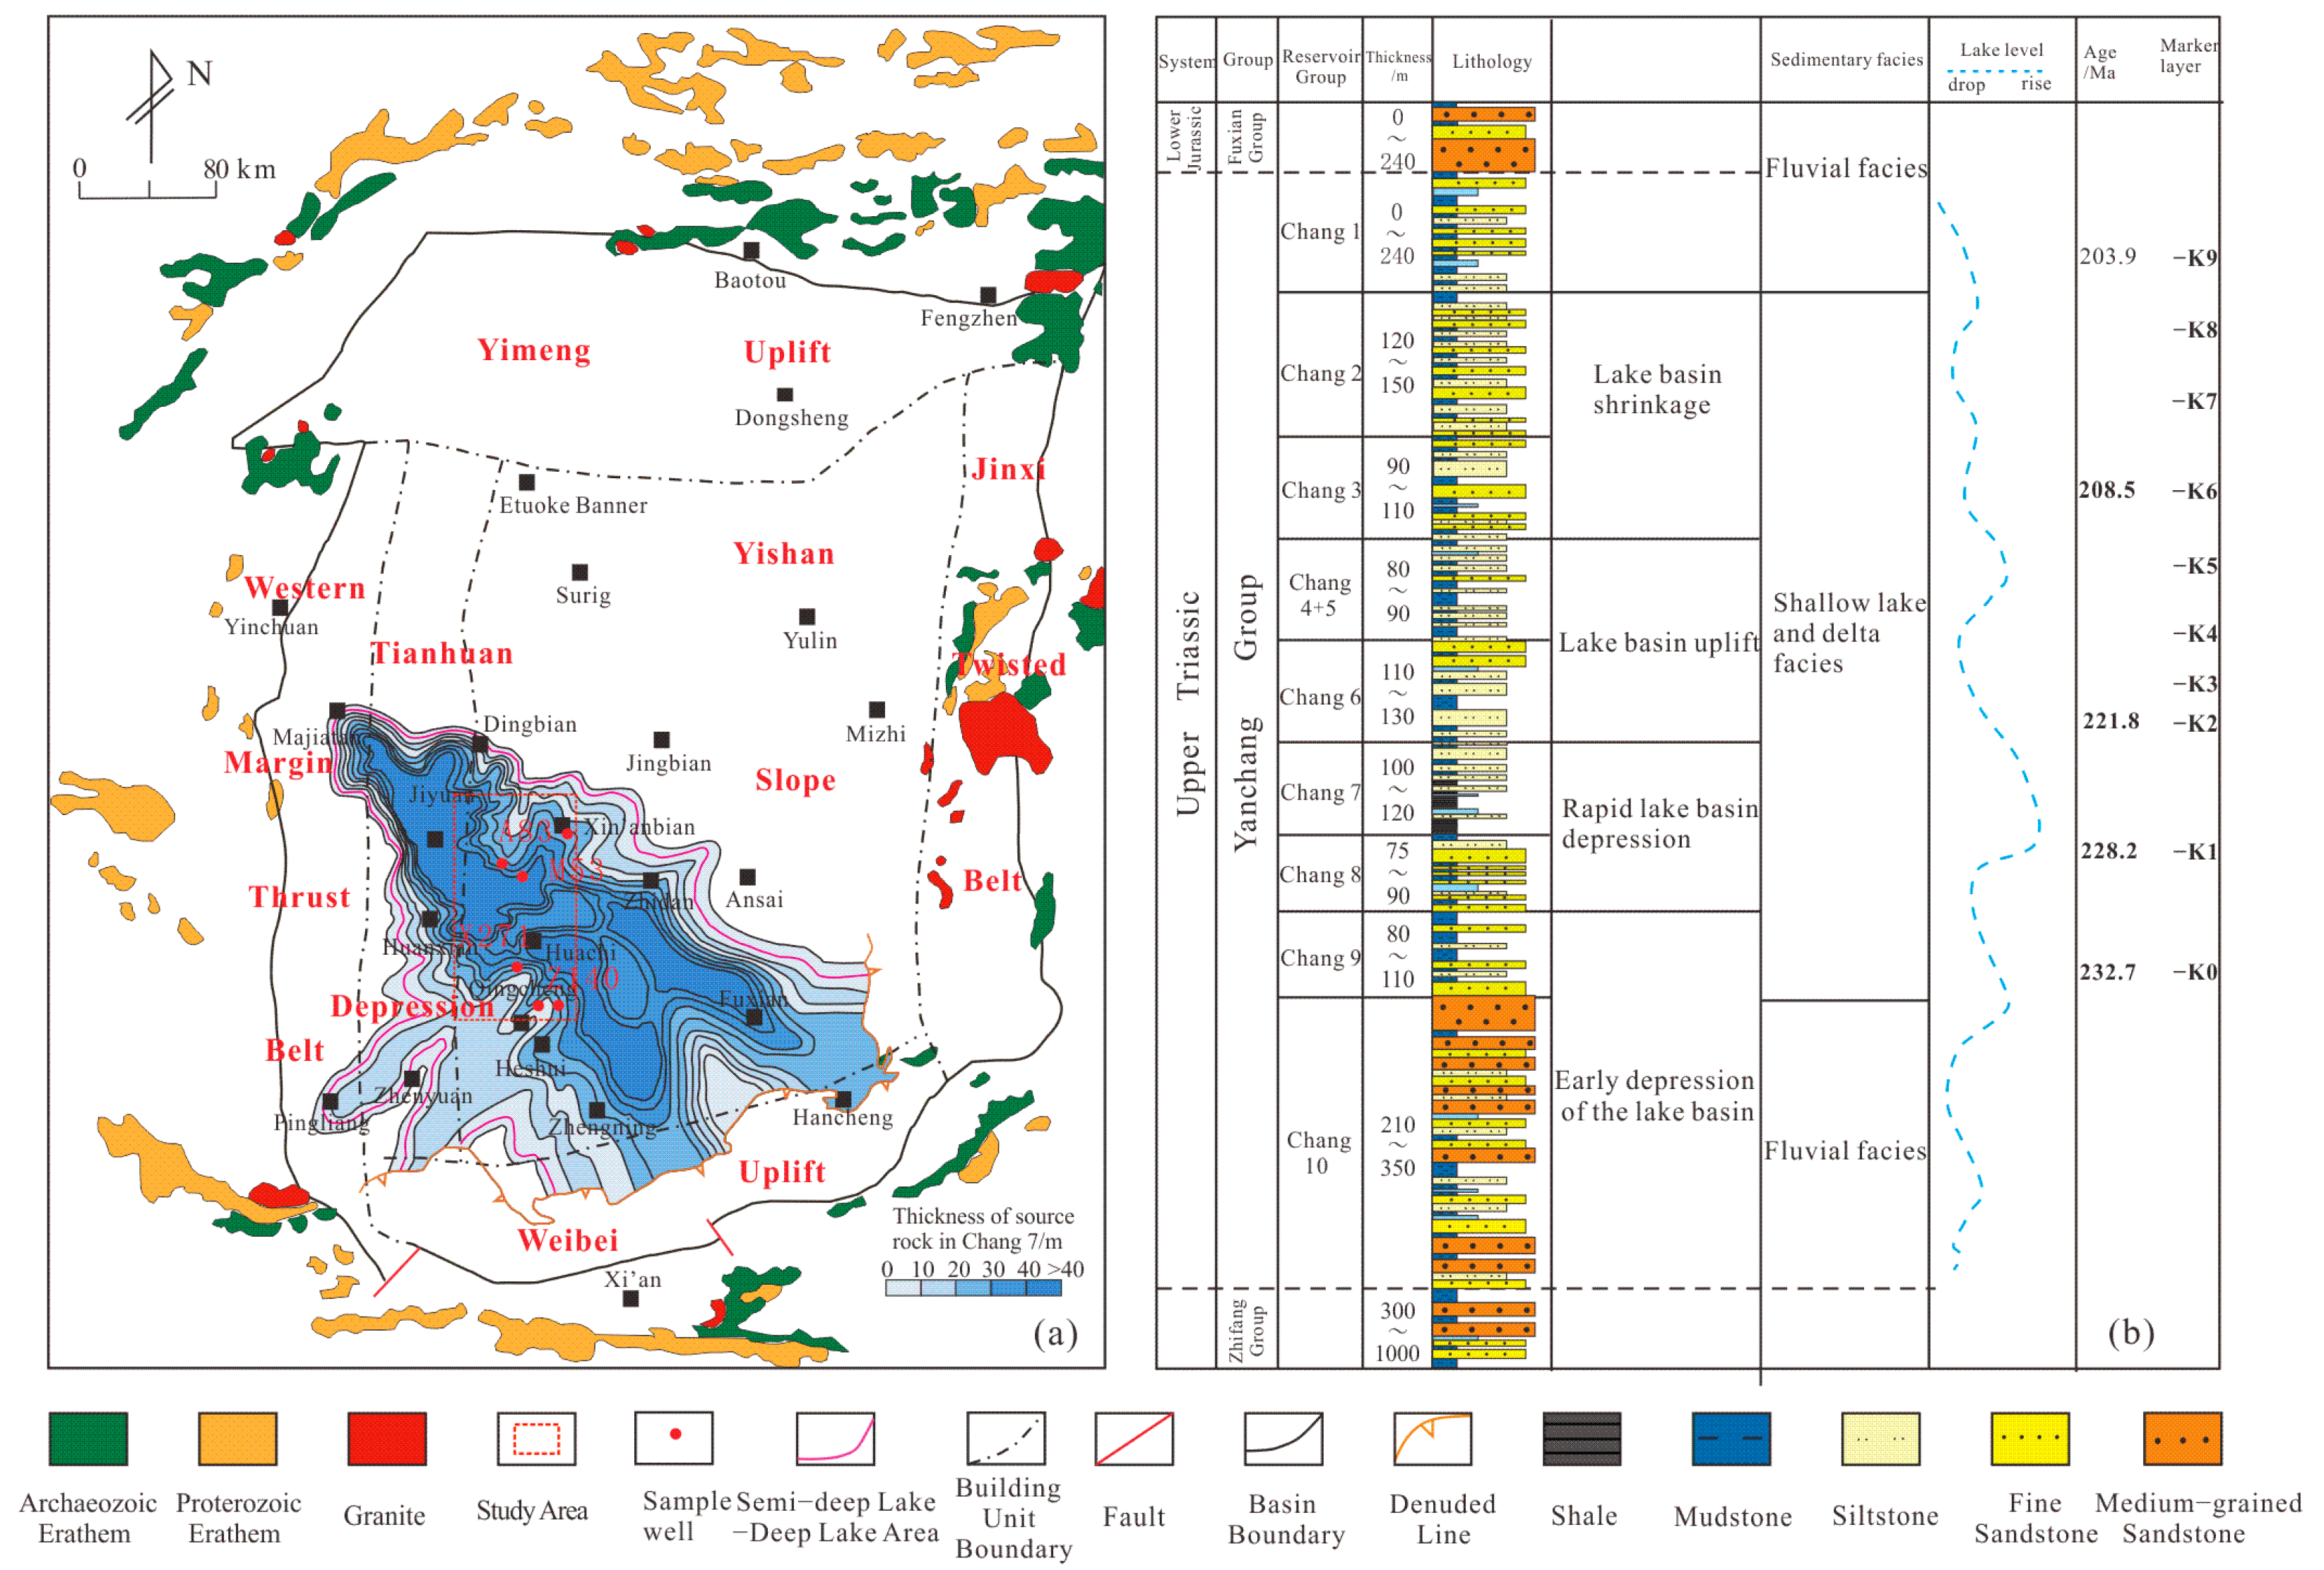
2. Geology Setting
3. Materials and Methods
4. Results
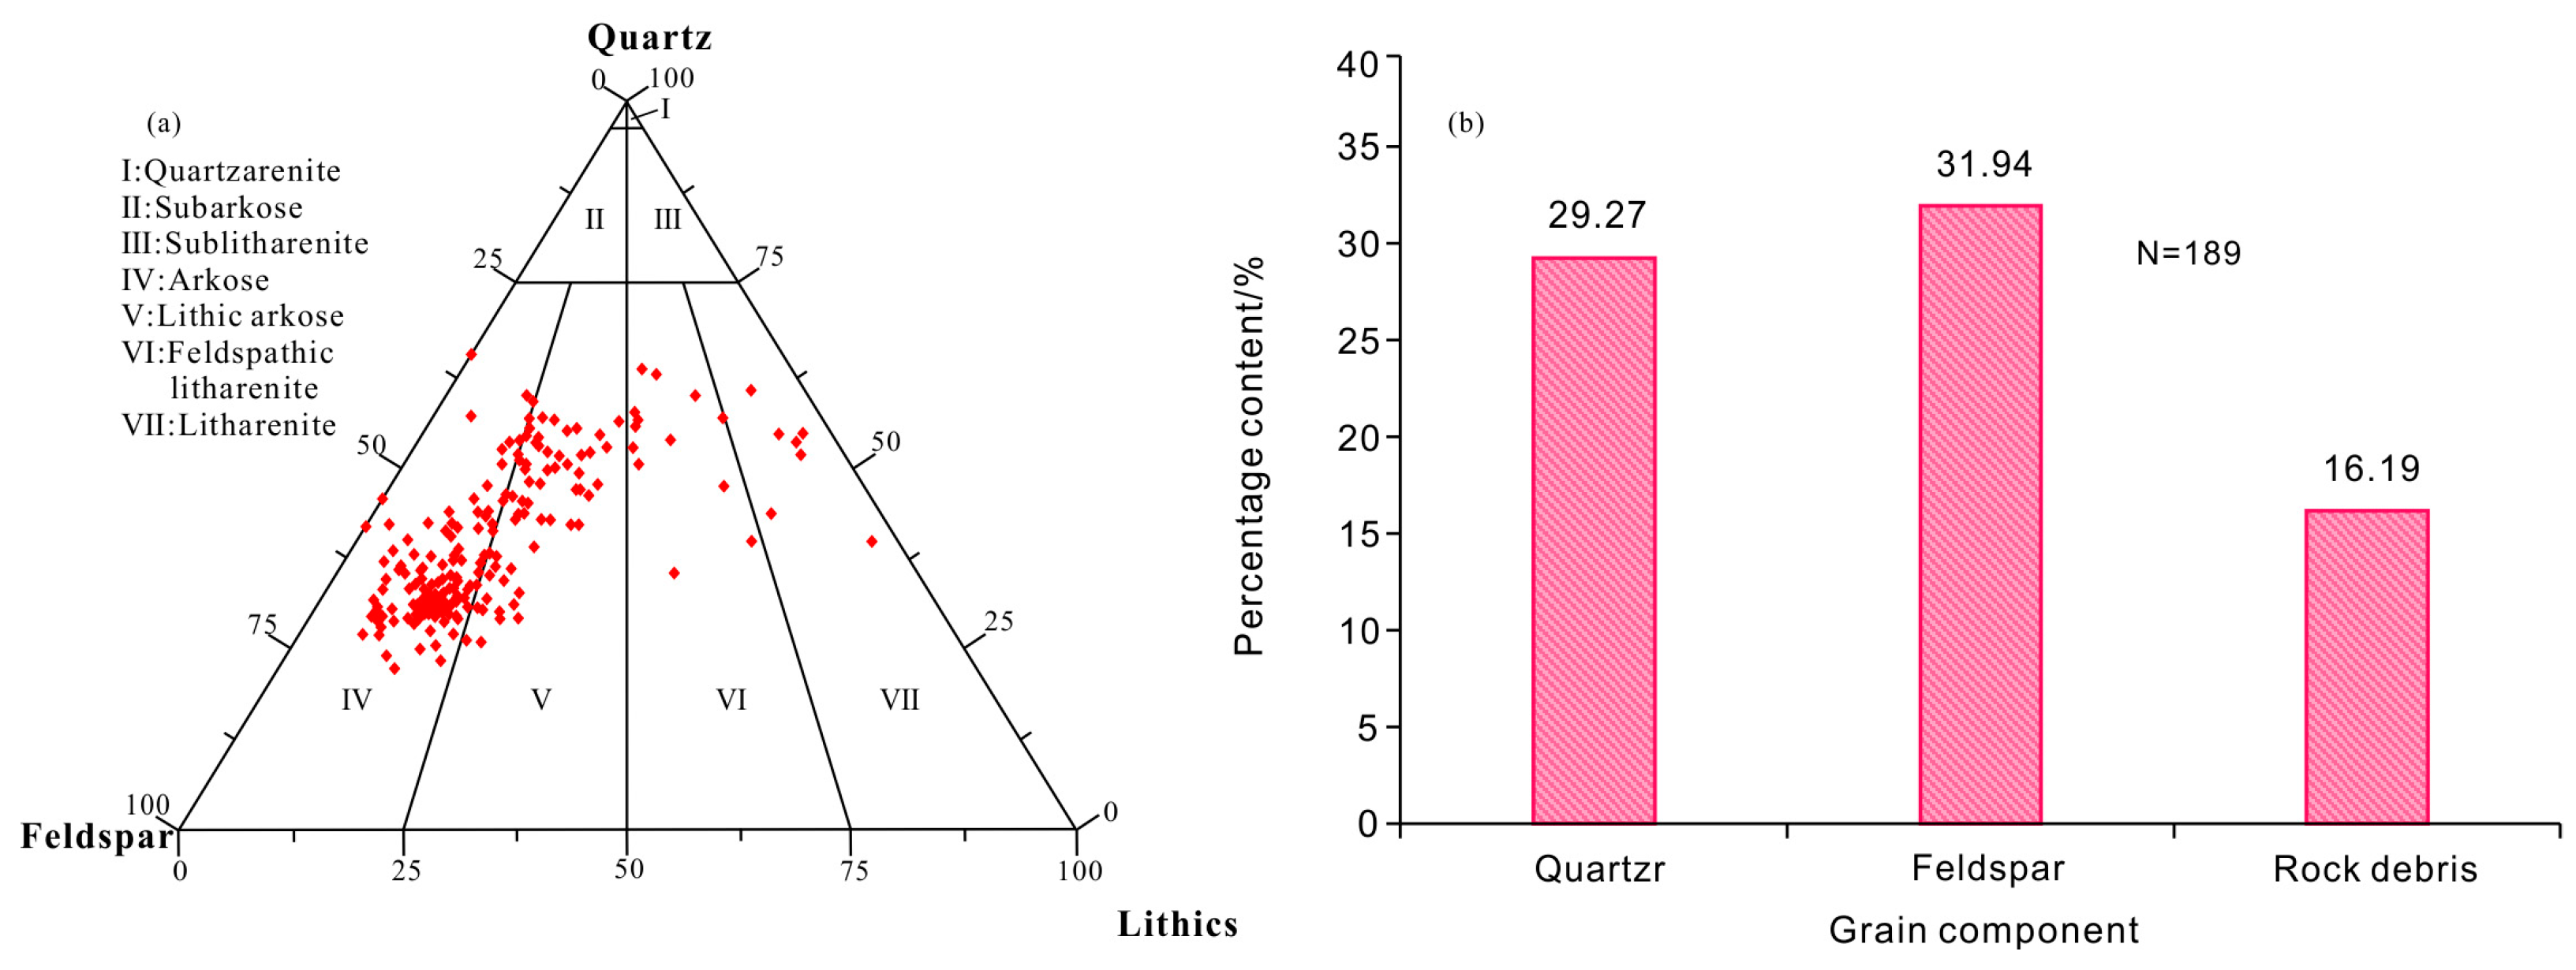
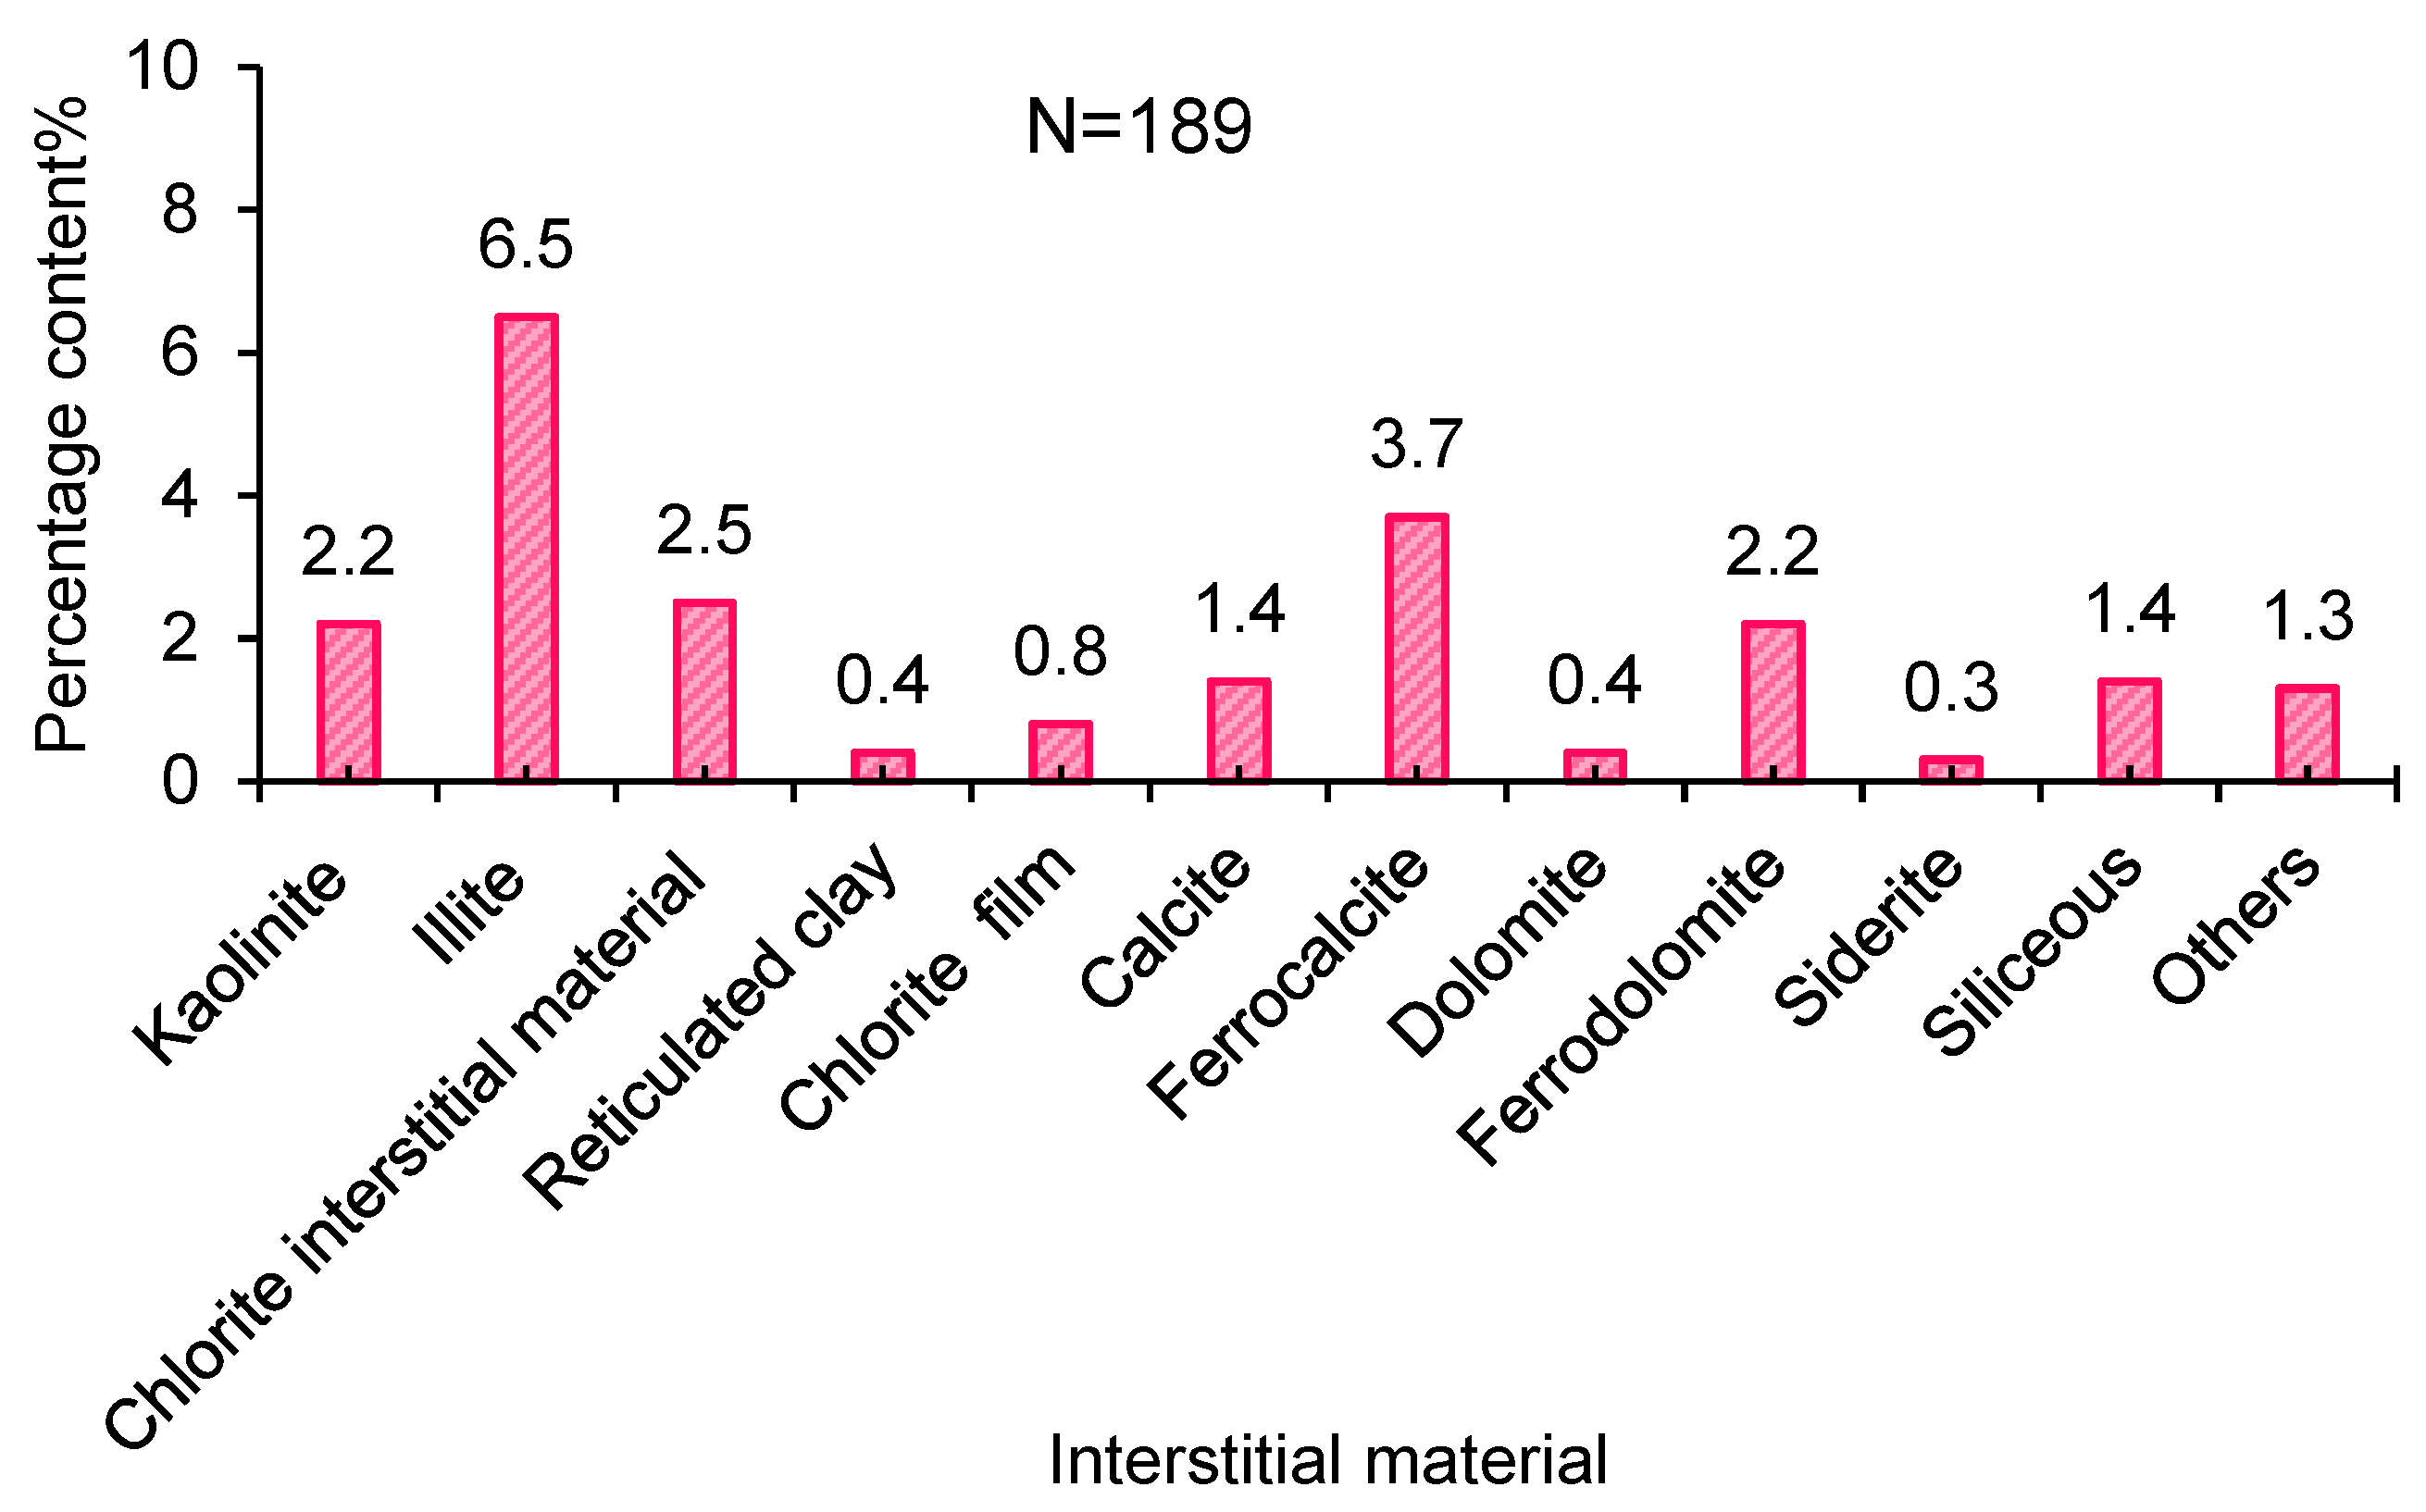
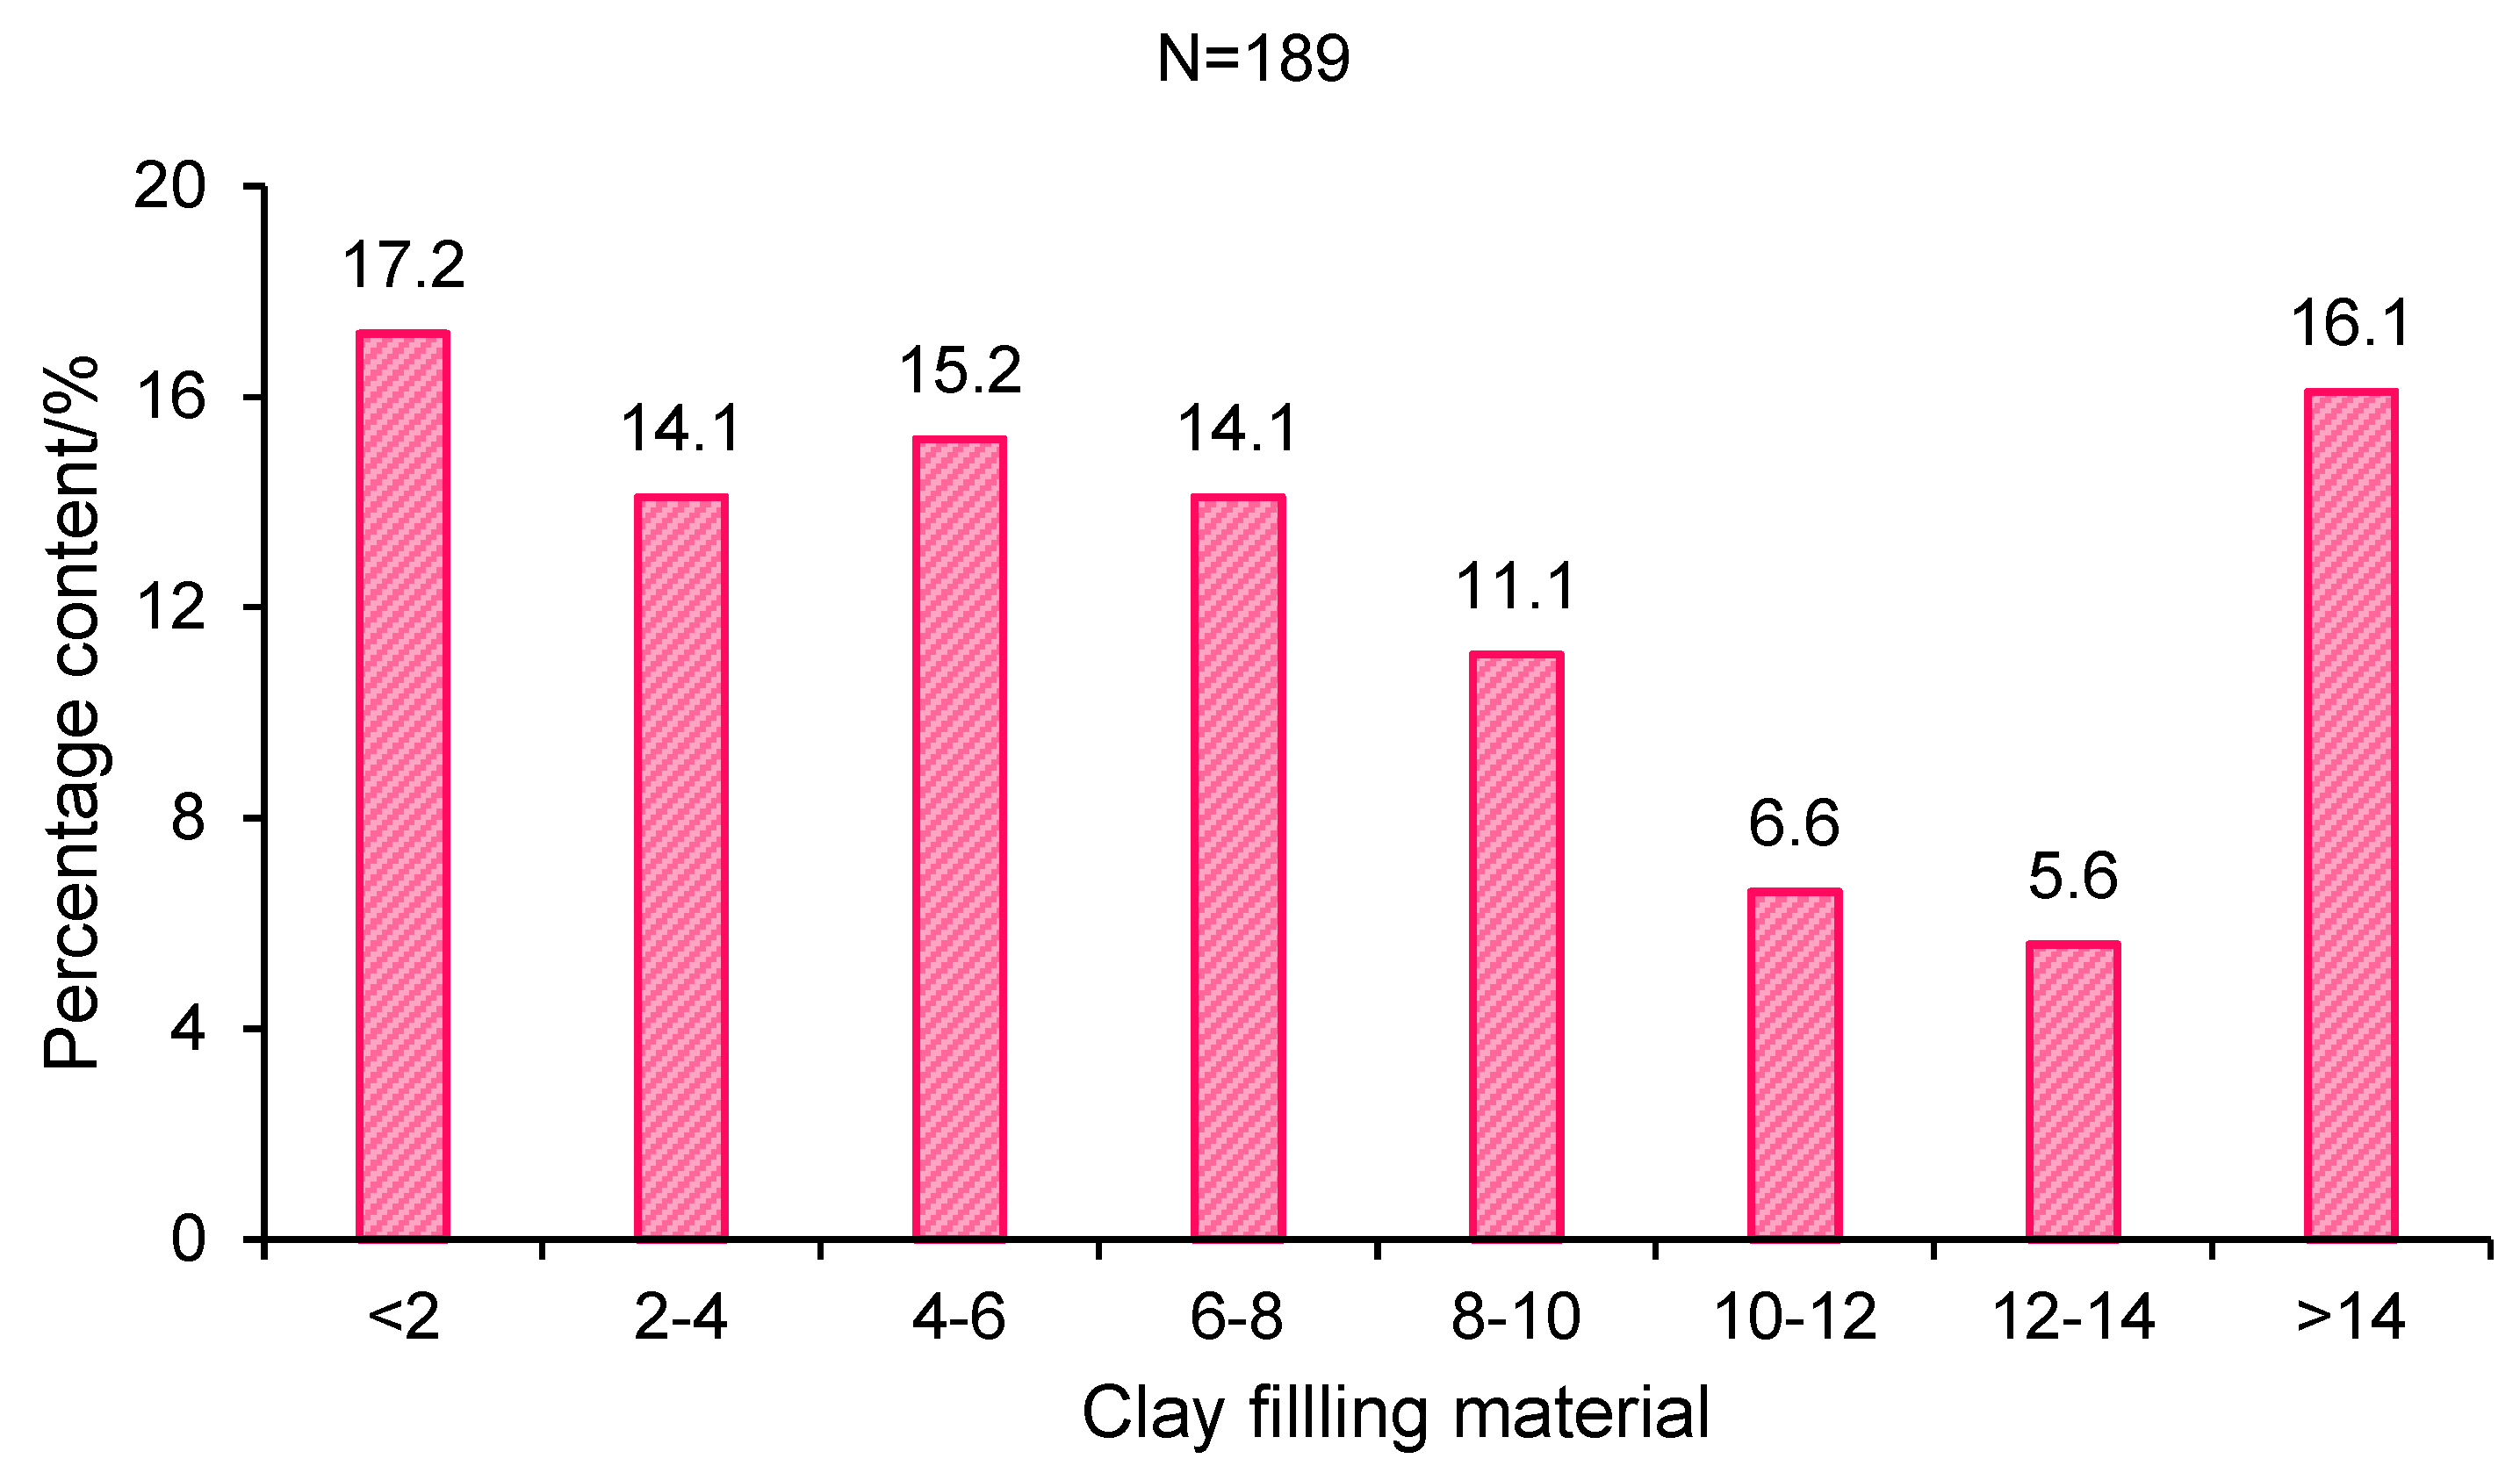
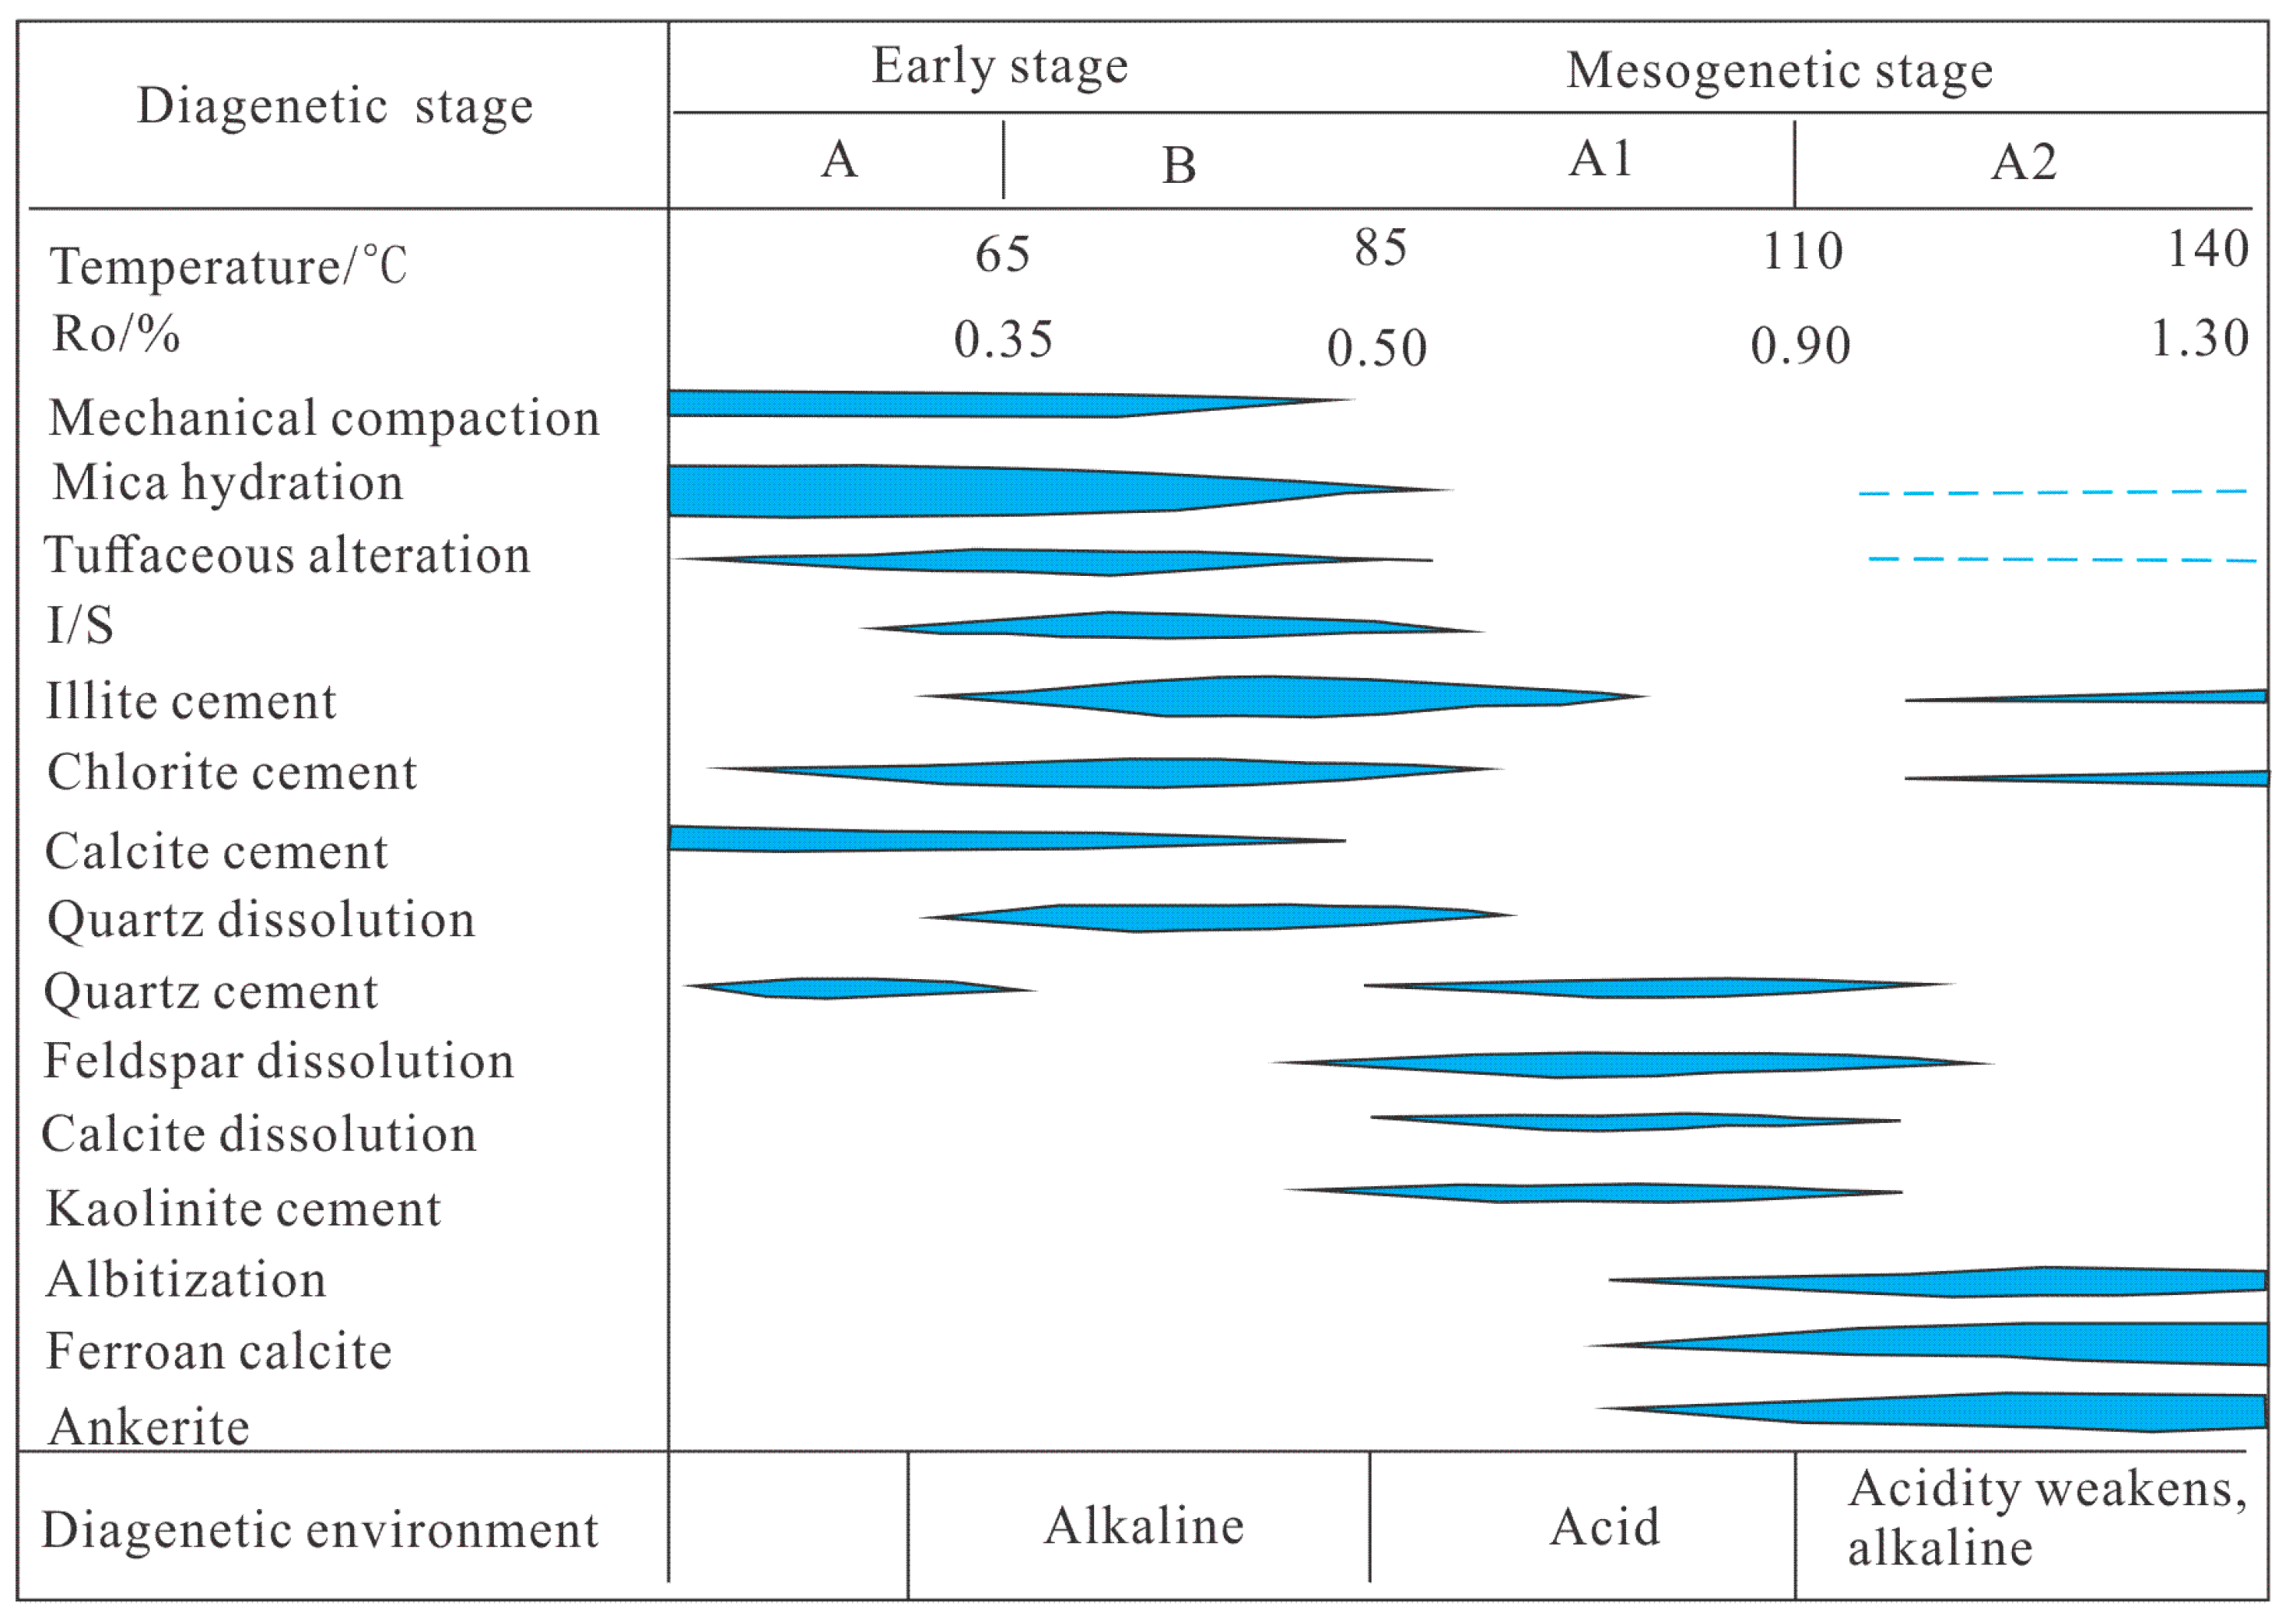
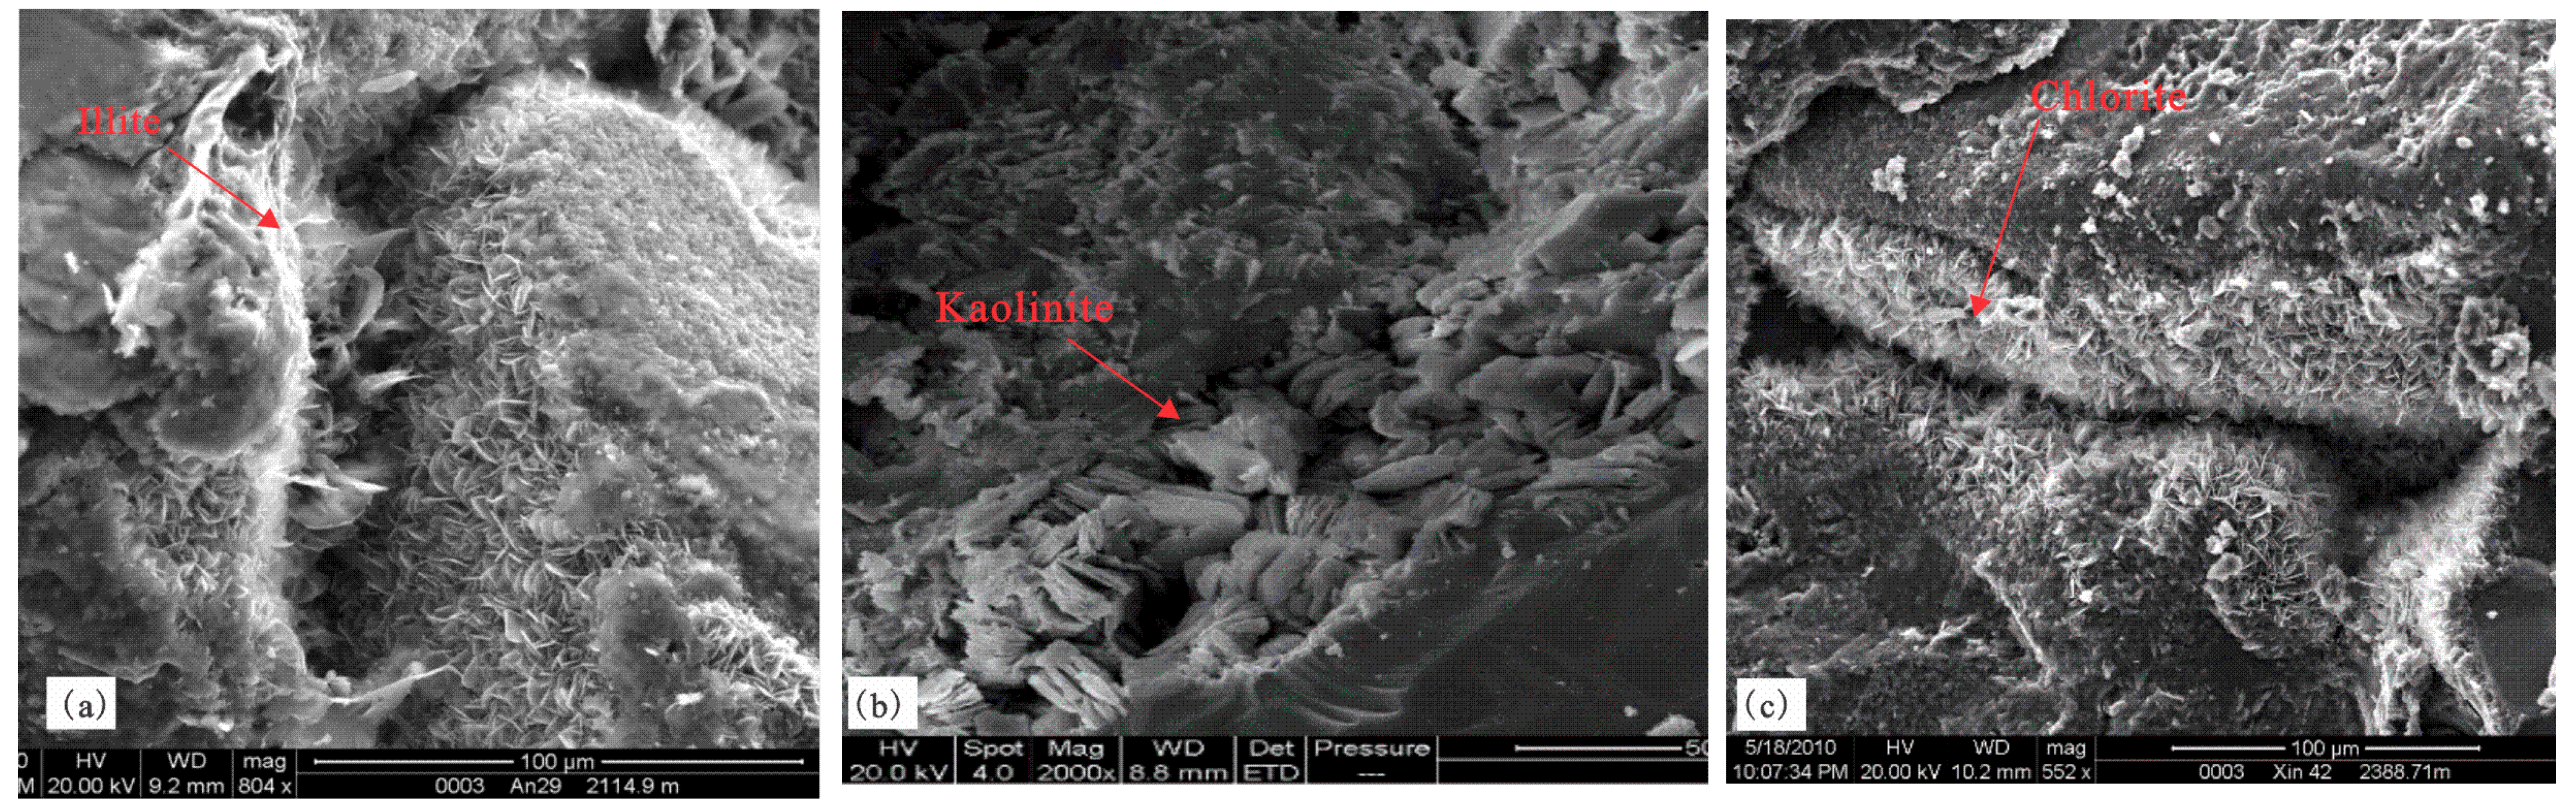
4.1. Reservoir Petrology and Mineralogy Characteristics
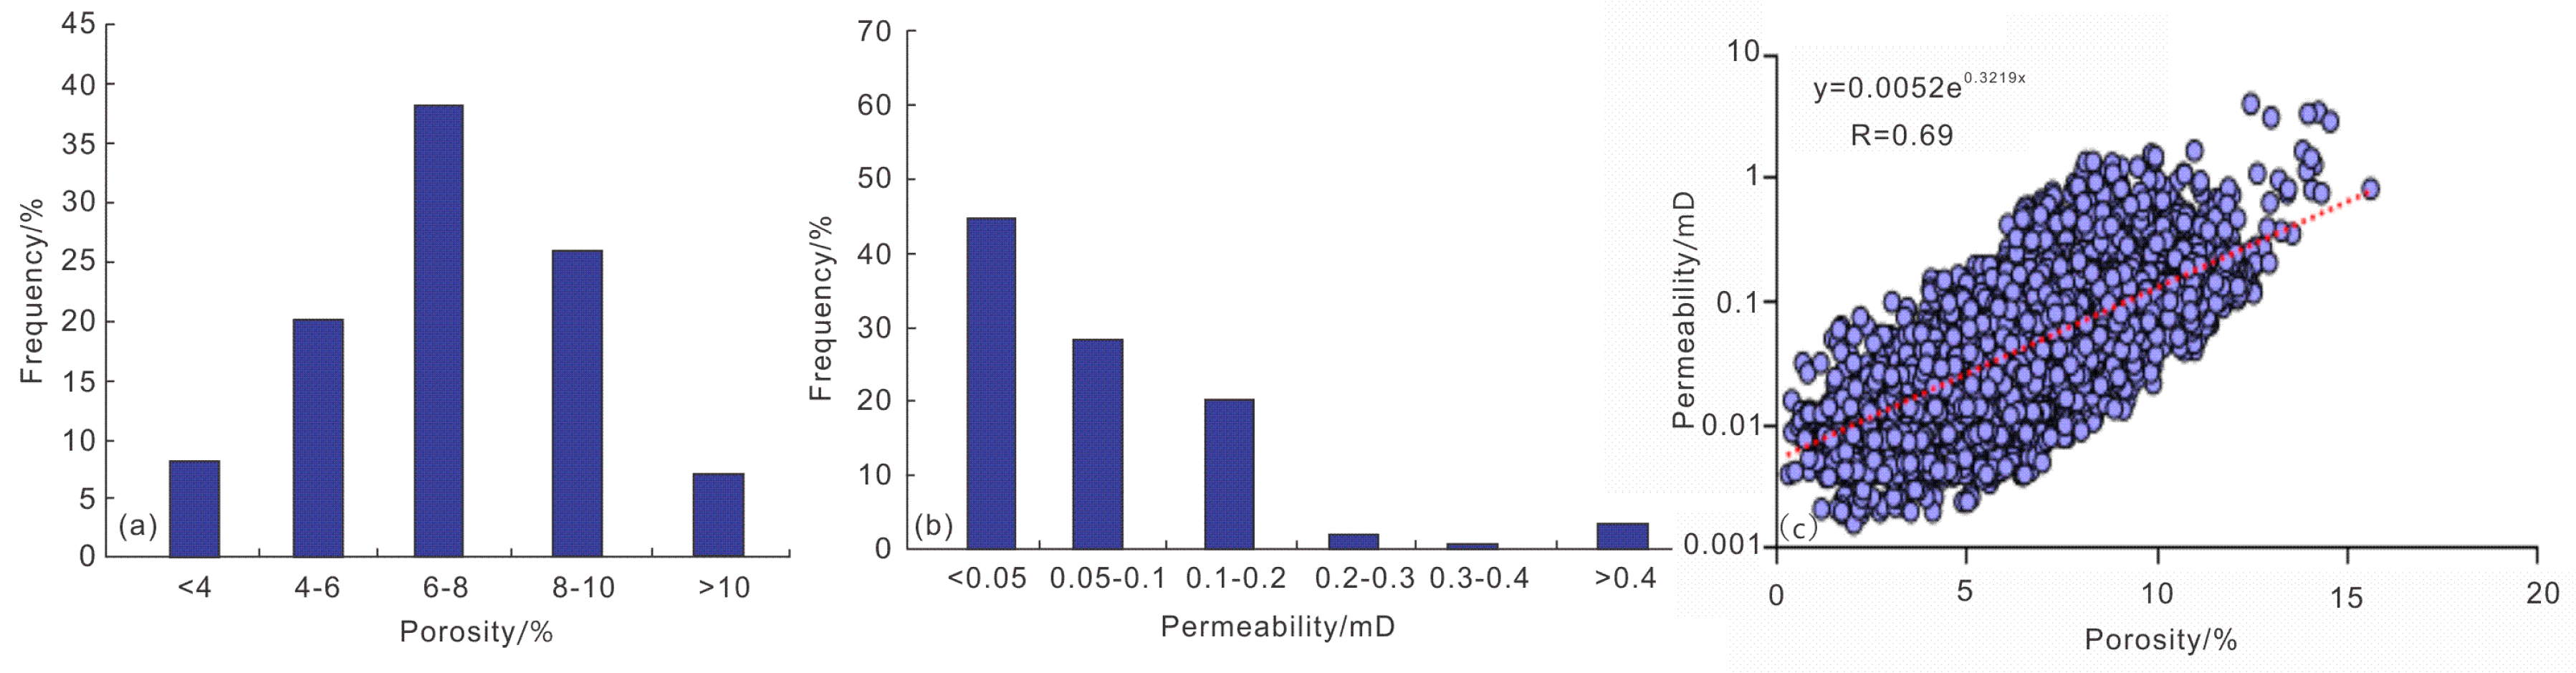
4.2. Reservoir Physical Characteristics
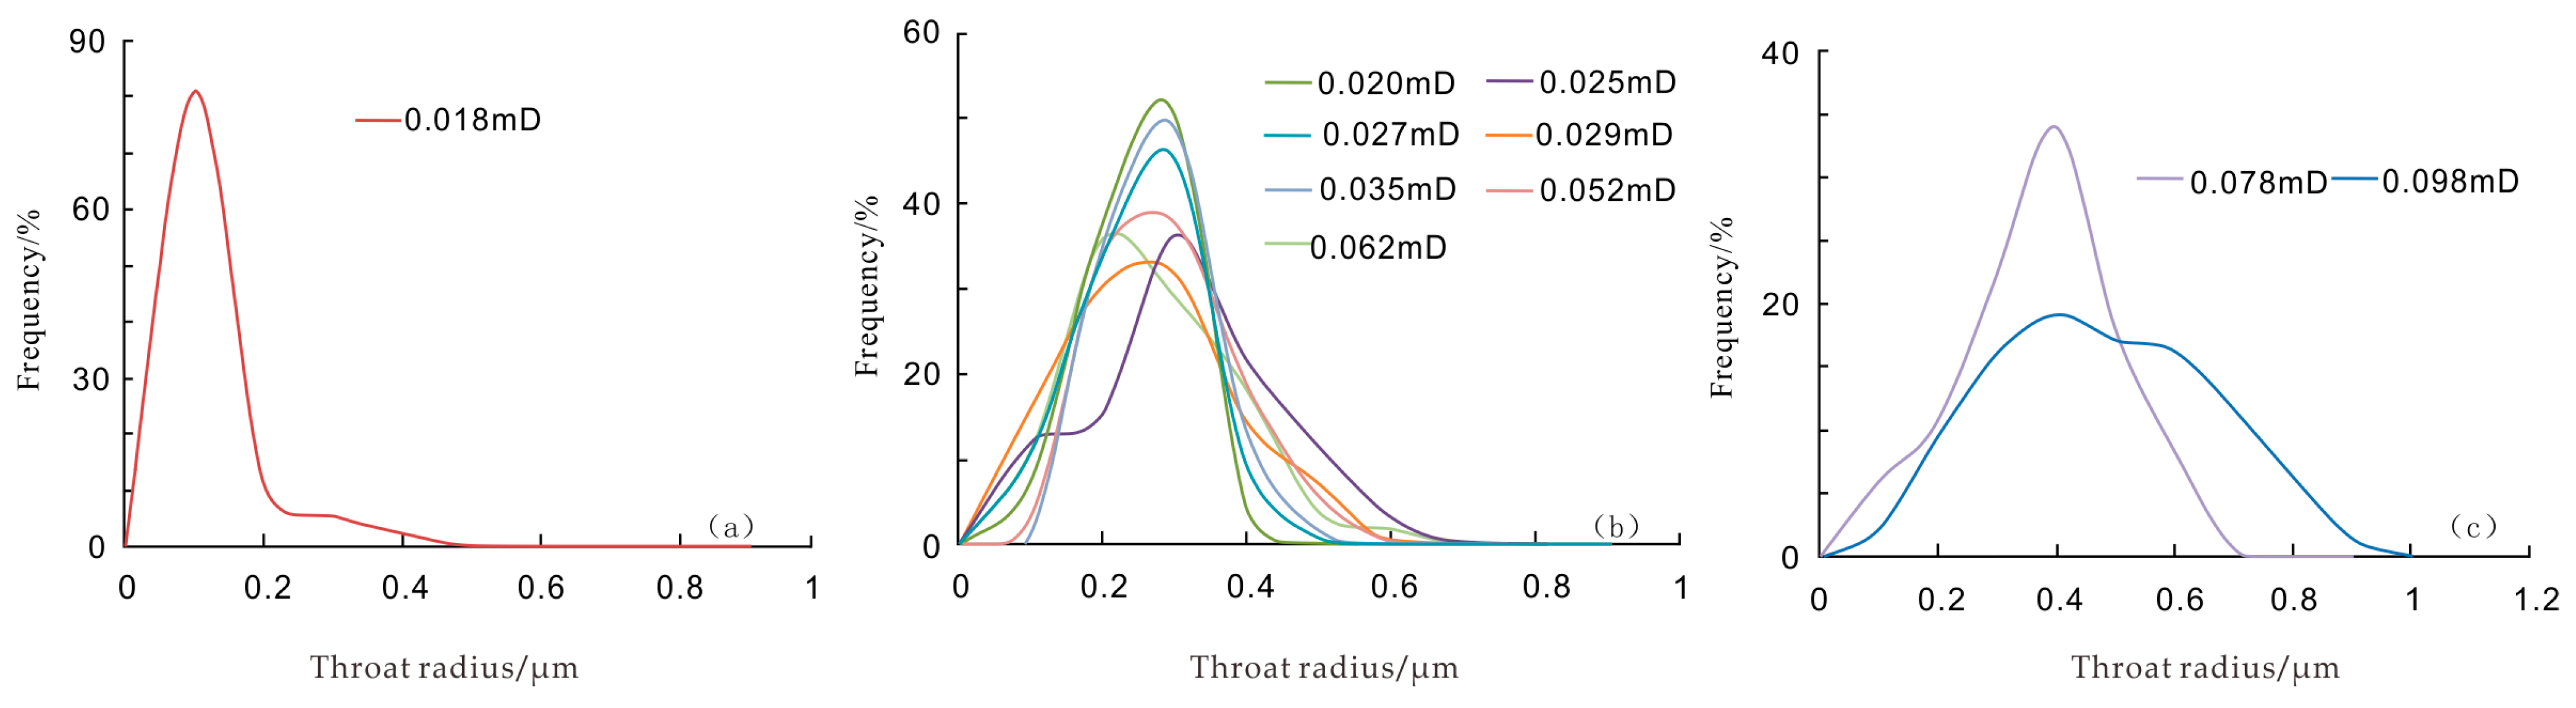
4.3. Microscopic Pore Throat Structure Characteristics of Reservoirs
4.3.1. Investigation of Microscopic Pore Structure Characteristics Using CRMI
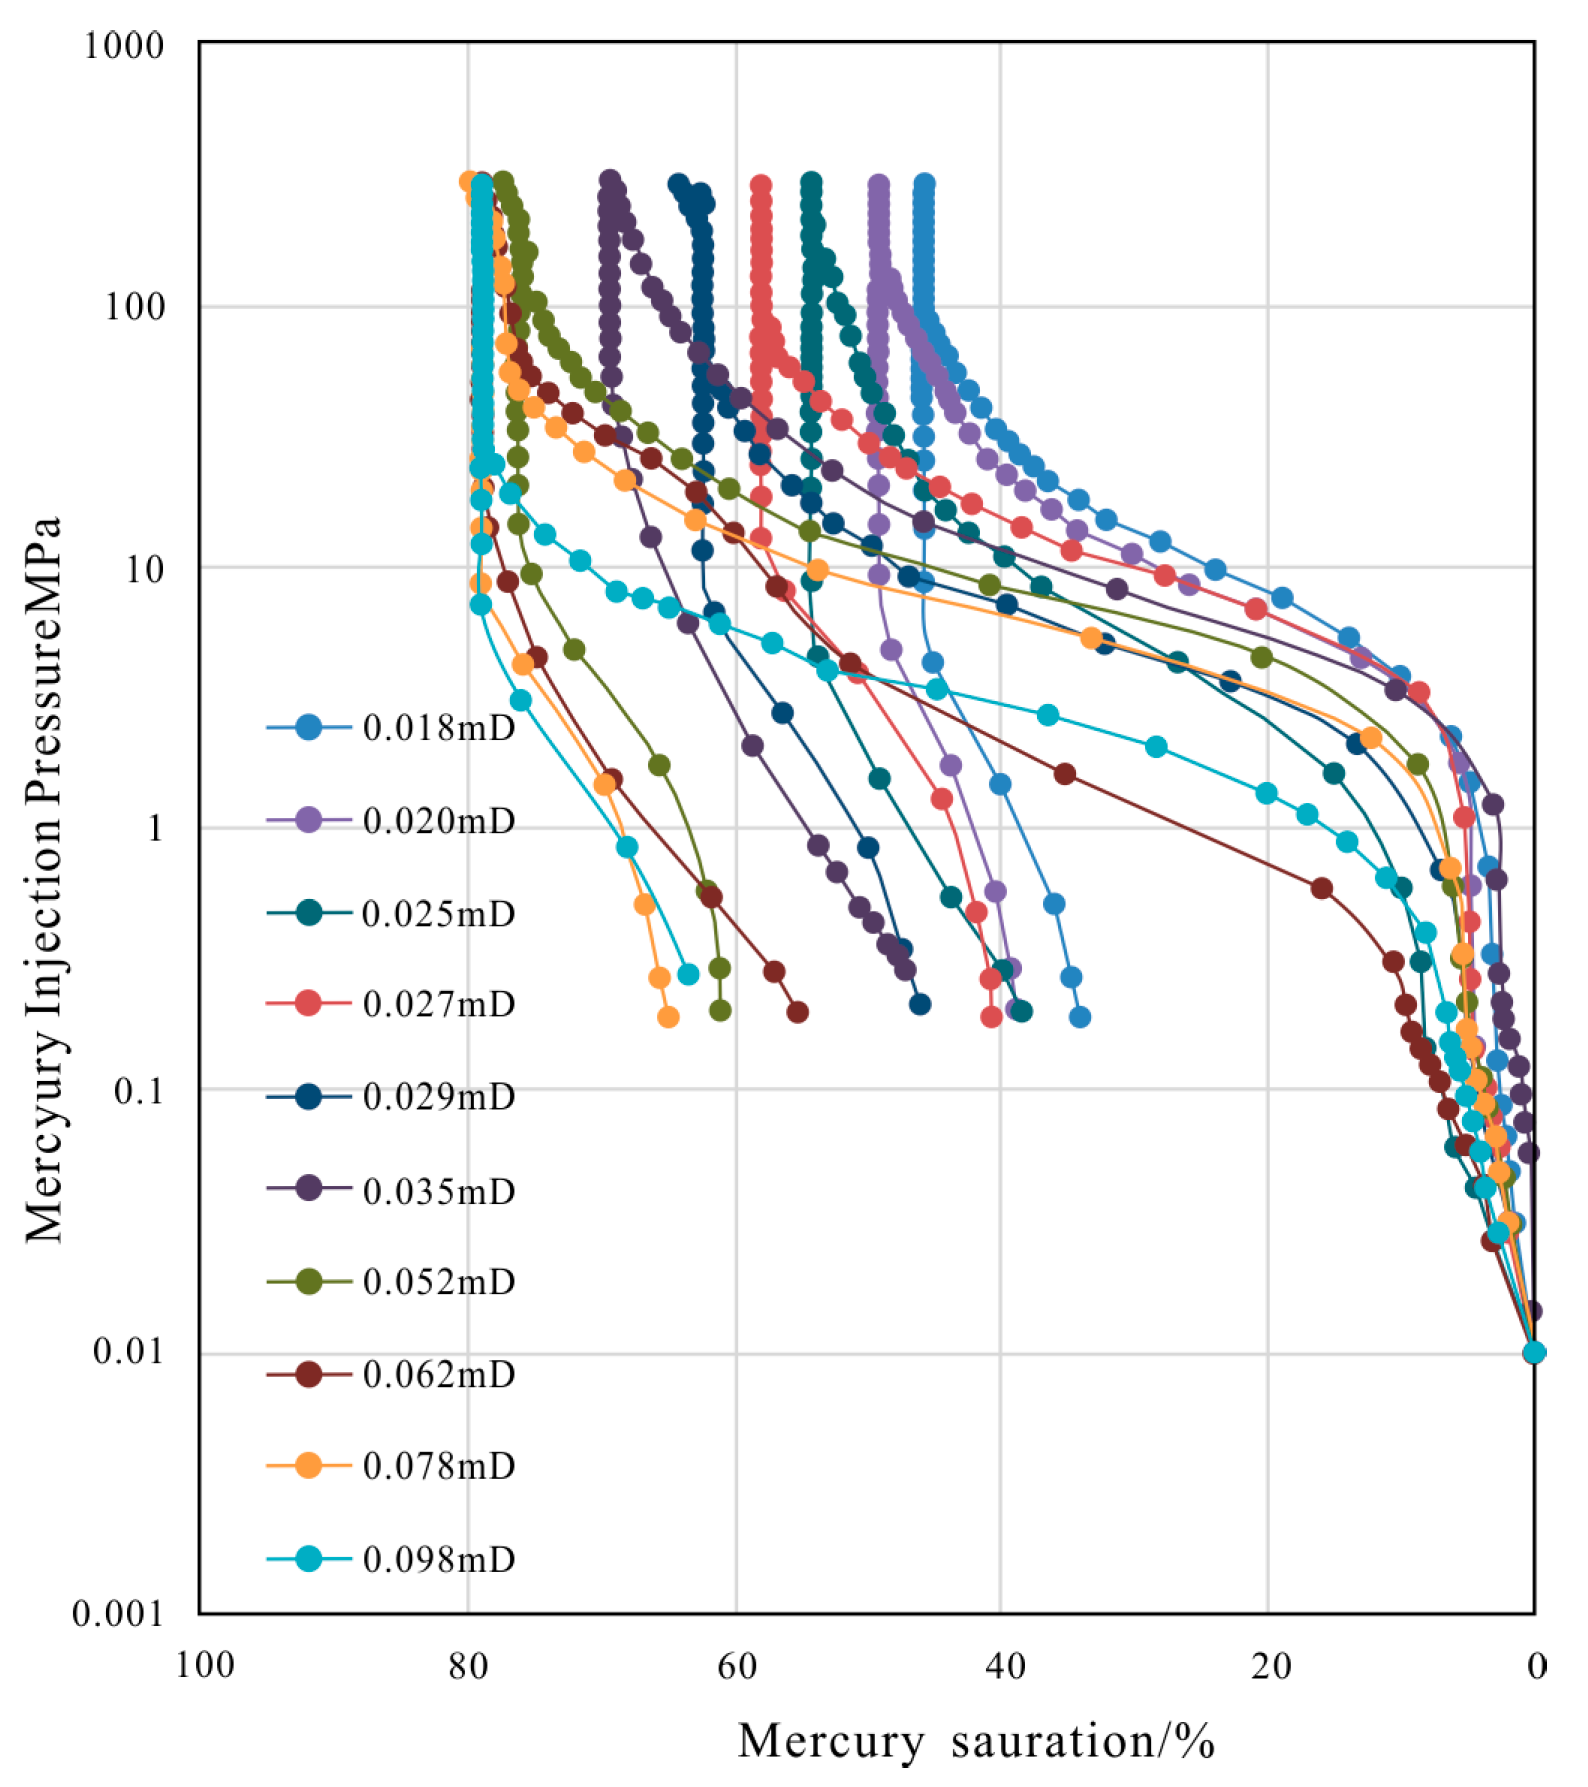
4.3.2. Investigation of Microscopic Pore Structure Characteristics Using MICP
4.4. Investigation of Mobile Fluids
5. Discussion
5.1. Distribution of Mobile Fluid in the Reservoir
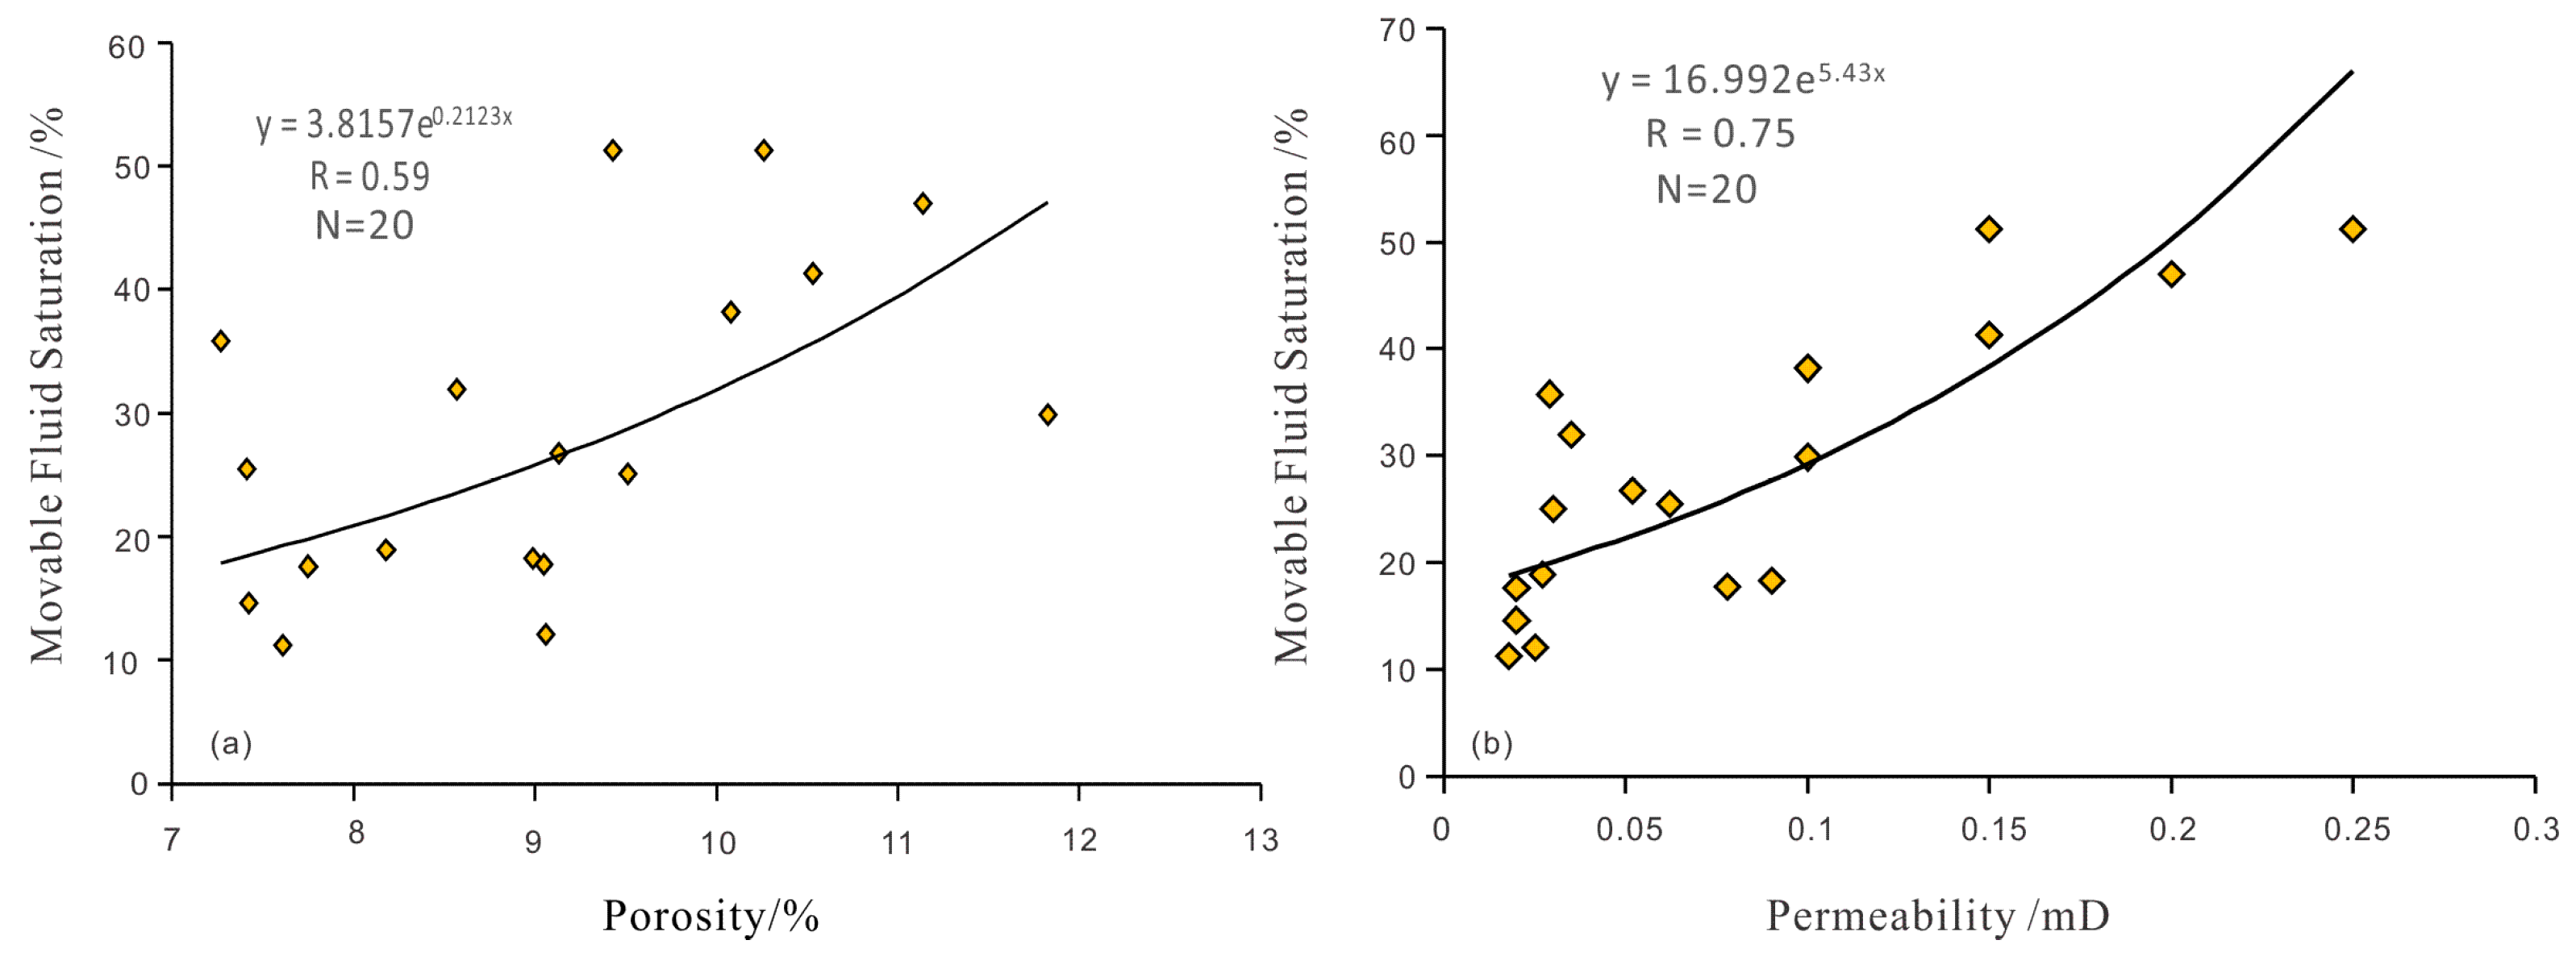
5.2. Impact of Reservoir Physical Properties on Movable Fluid Saturation
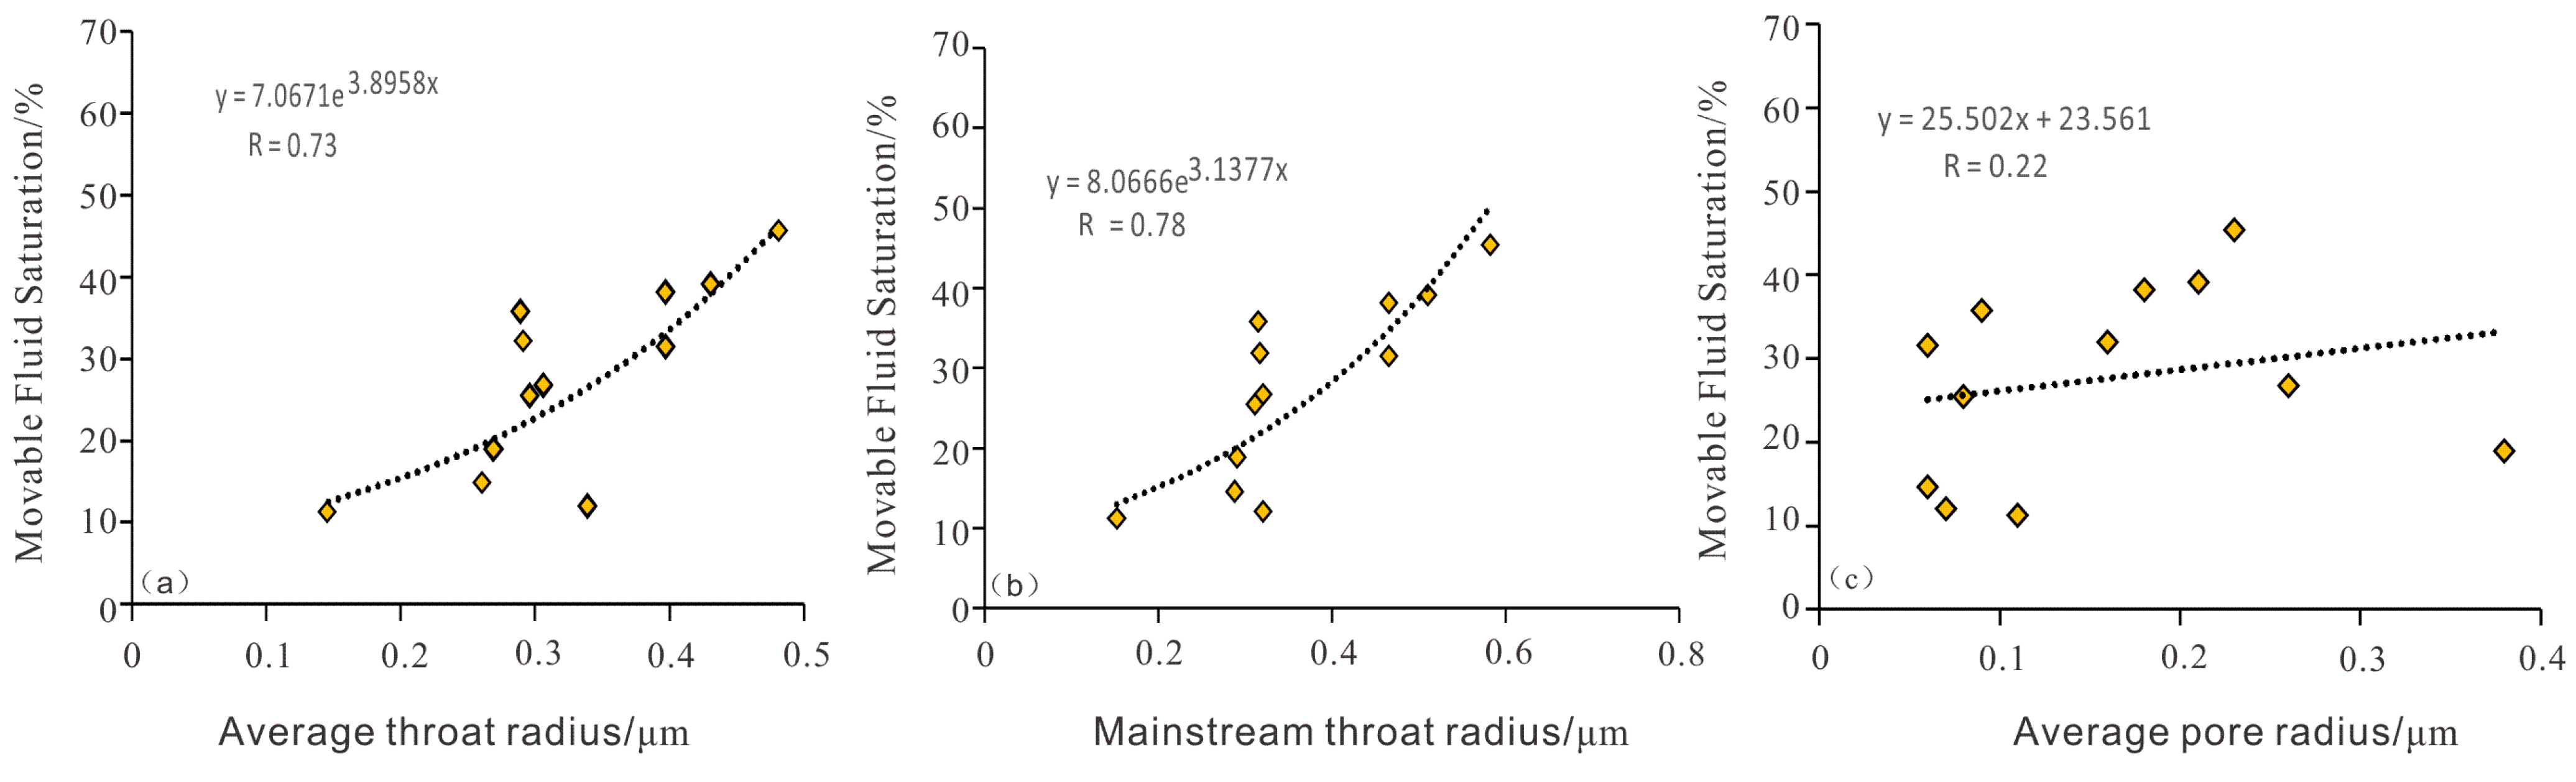
5.3. Impact of Pore Structure on Movable Fluid Saturation
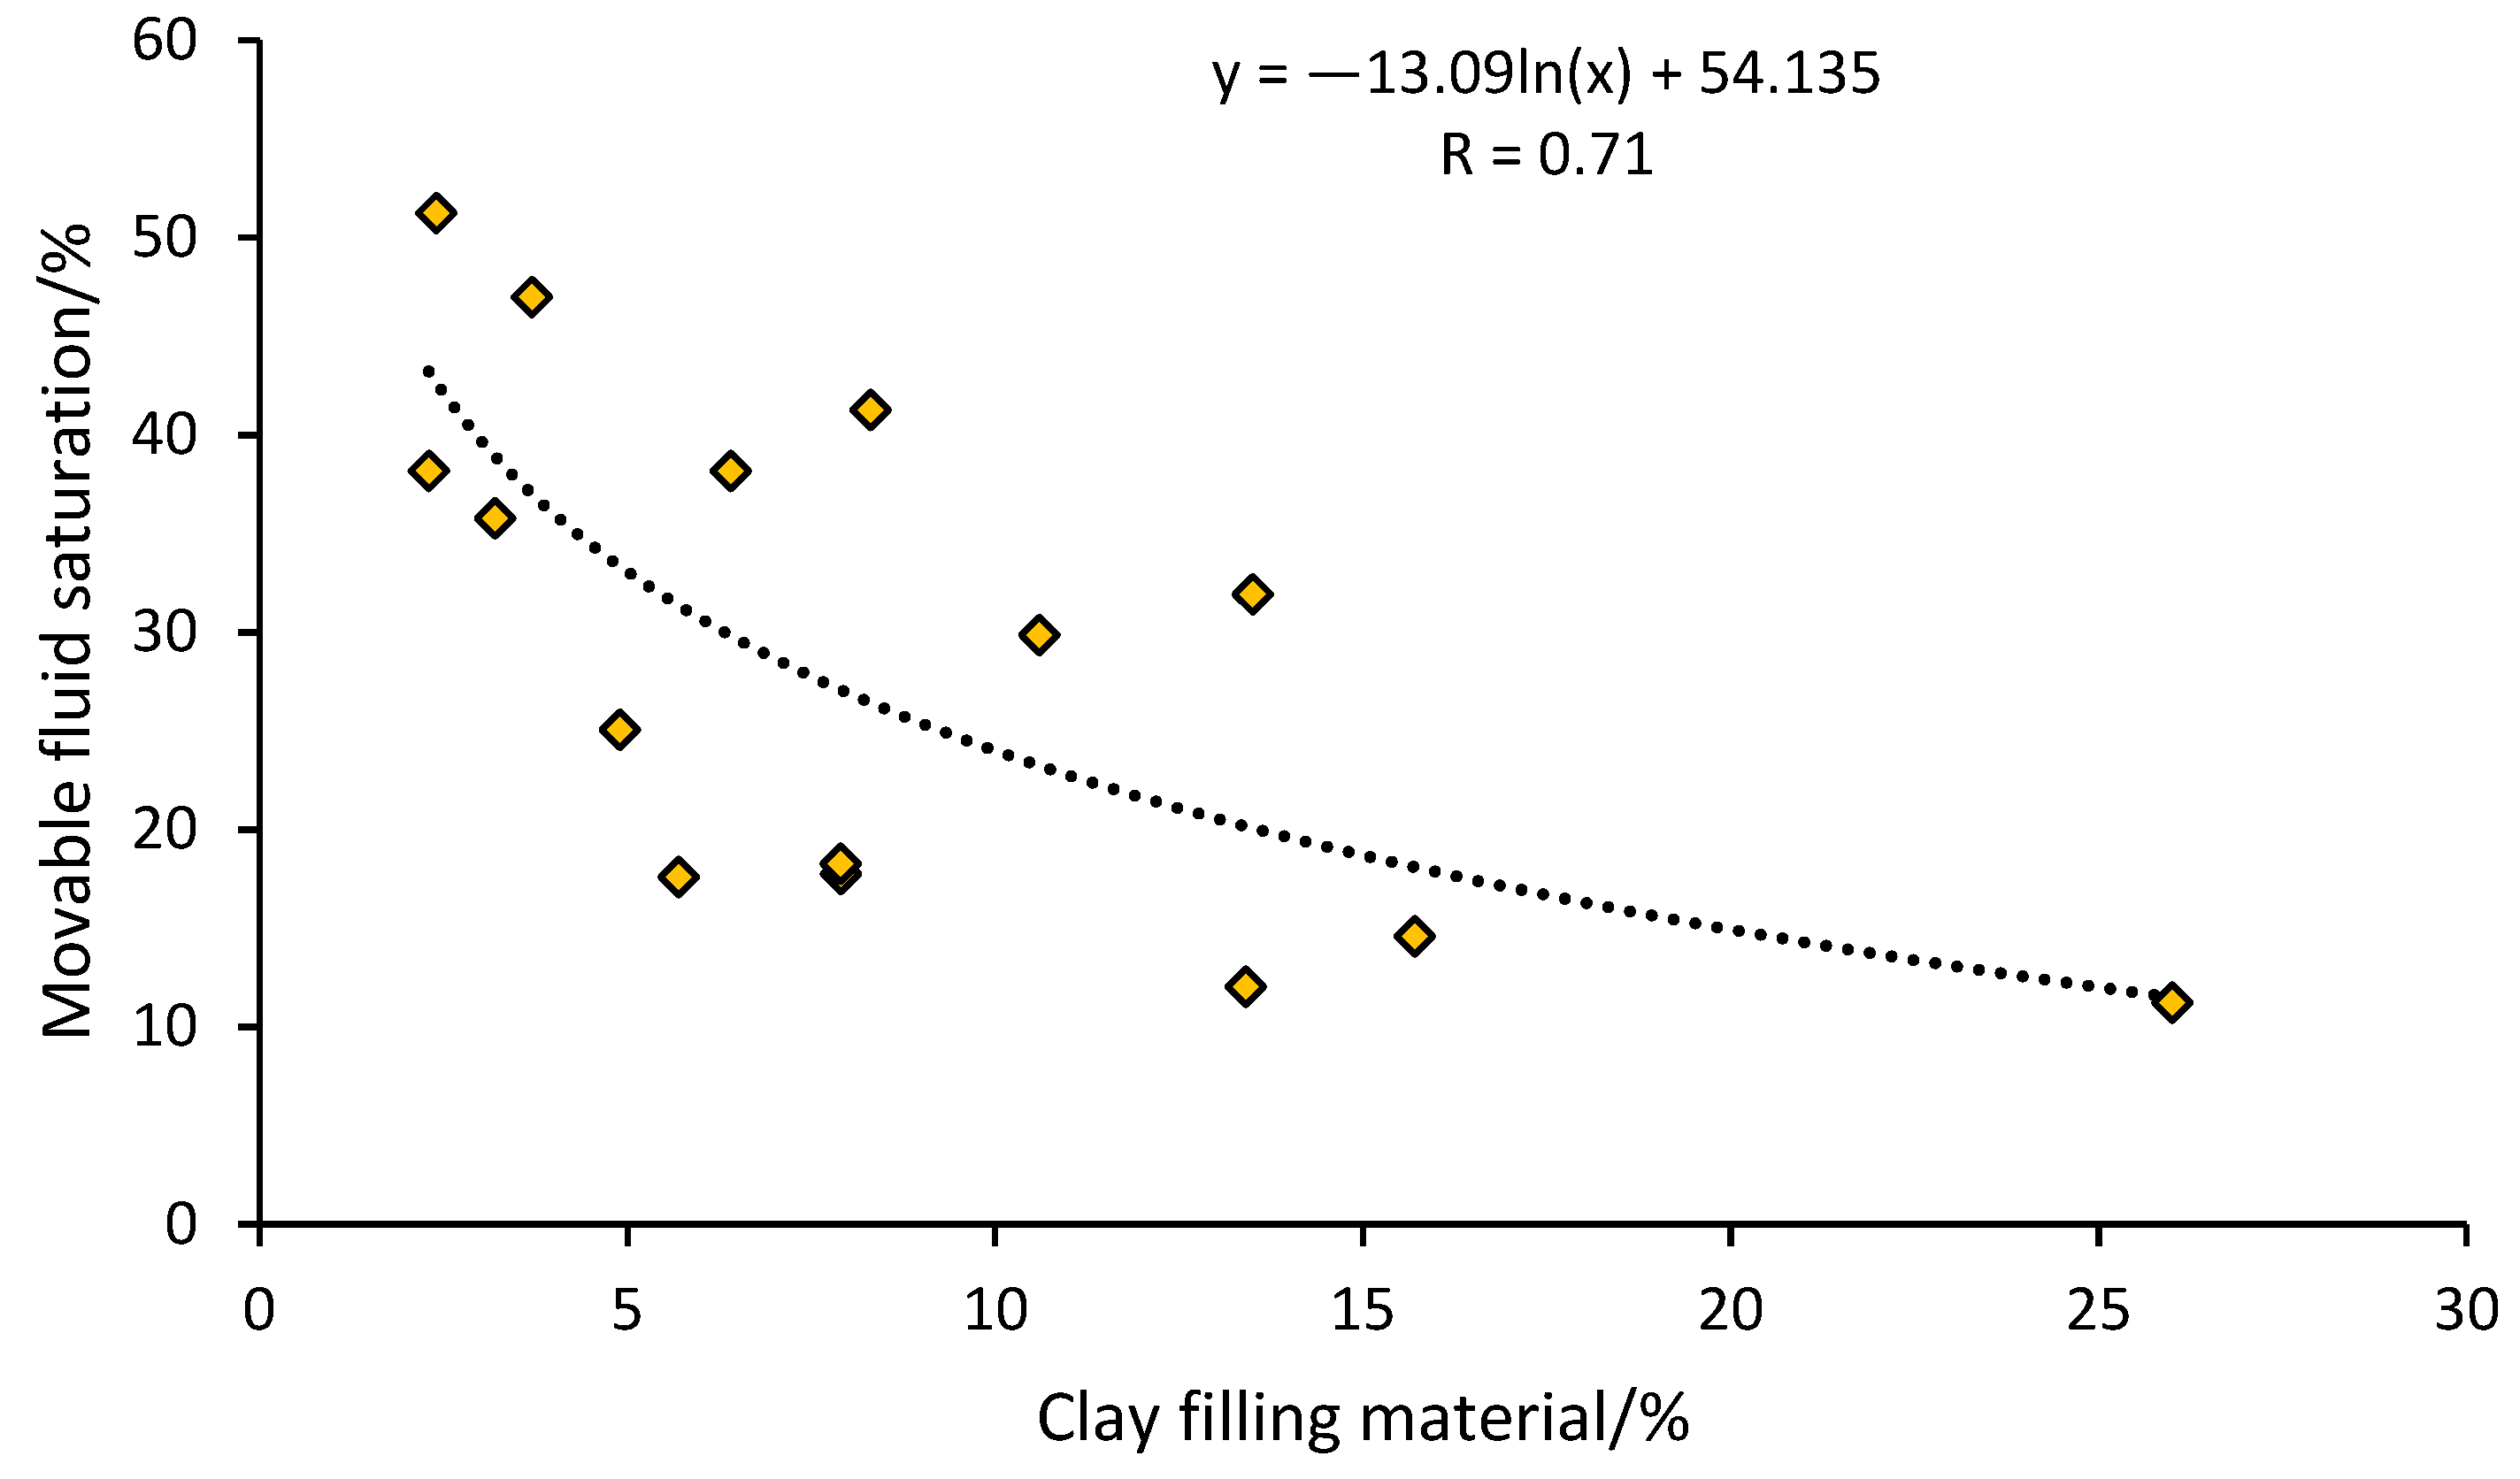
5.4. The Impact of Clay Minerals on Fluid Saturation
6. Conclusions
- (1)
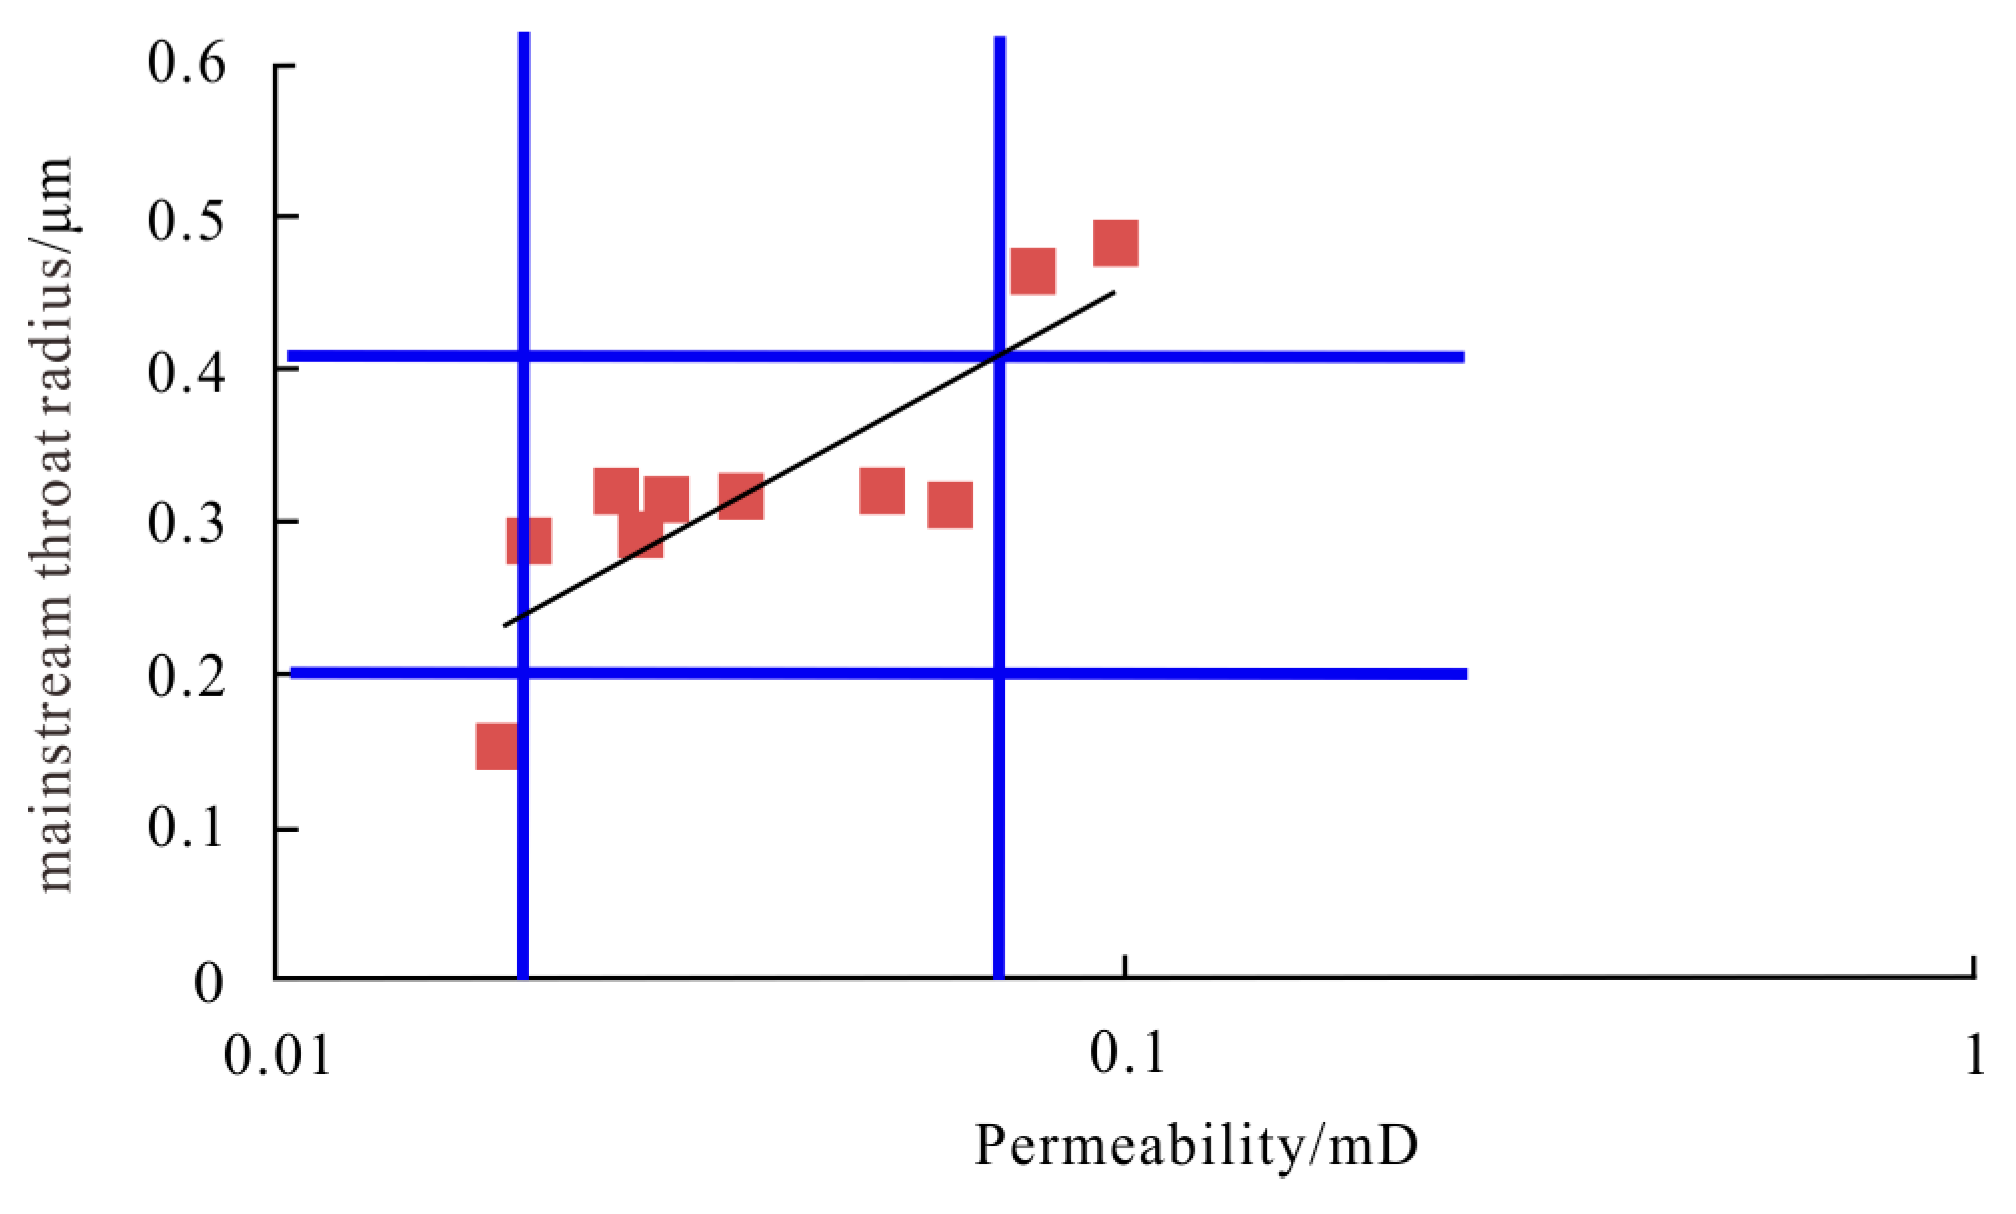
- The mainstream throat radius is a crucial indicator influencing core permeability in tight reservoirs. It directly reflects the seepage capability of the core, and smaller mainstream throat radii pose more significant challenges in extracting fluids from tight reservoirs.
- (2)
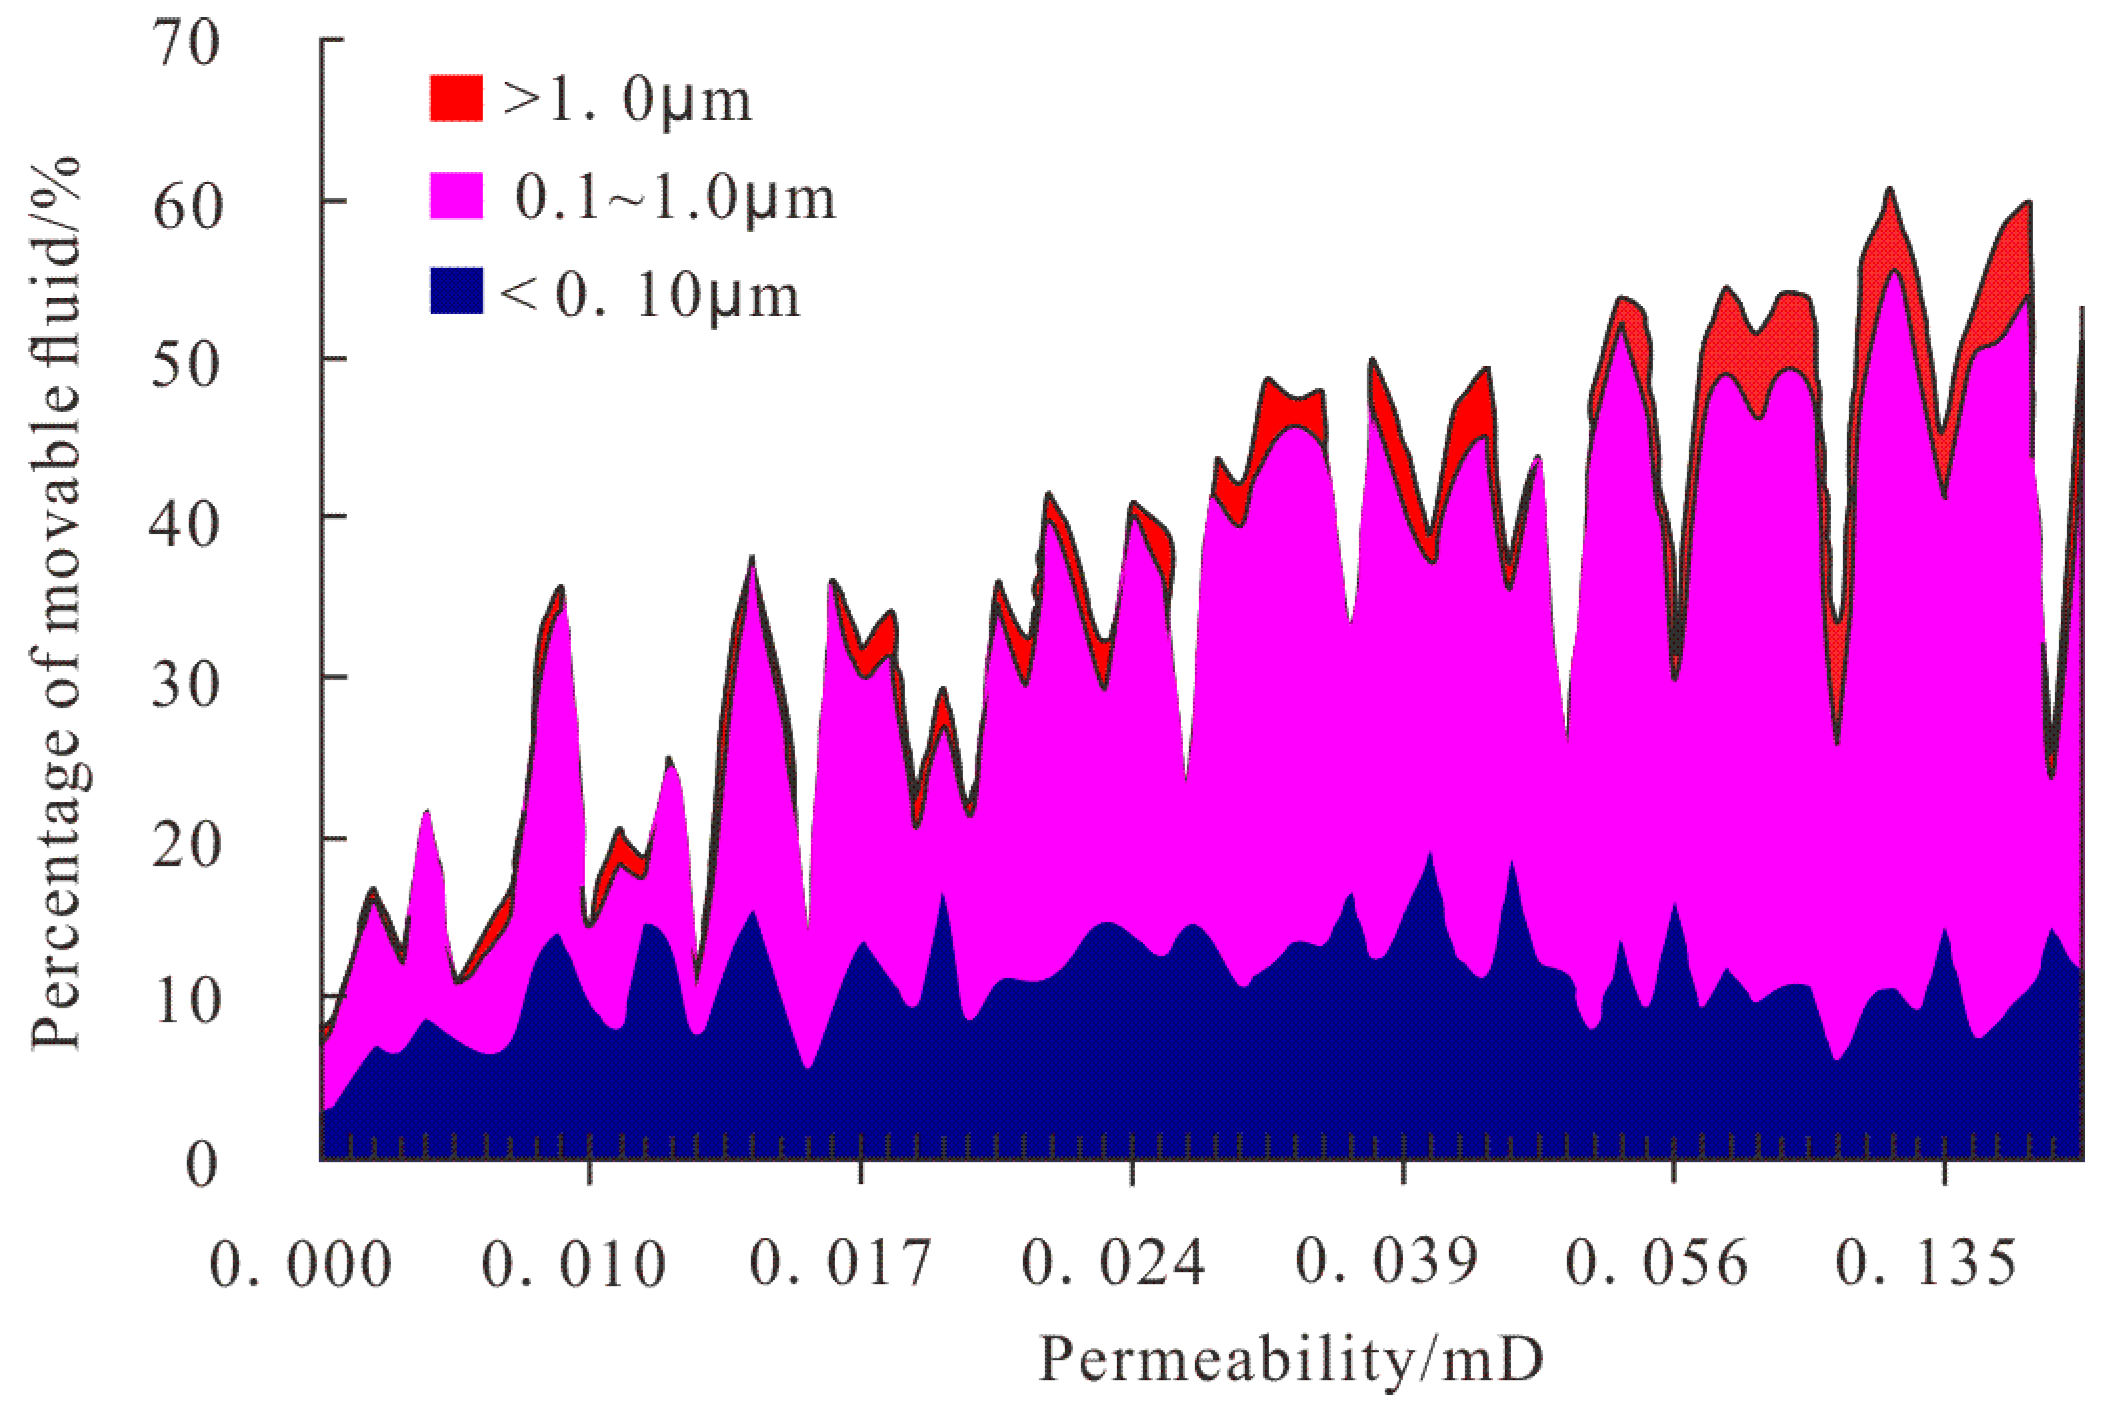
- Studies indicate that in tight reservoirs, the permeability relationship with the saturation of movable fluids is more significant than its association with porosity. With increasing permeability, there is a corresponding increase in the movable fluid saturation. However, the movable fluid saturation relationship with porosity is weak.
- (3)
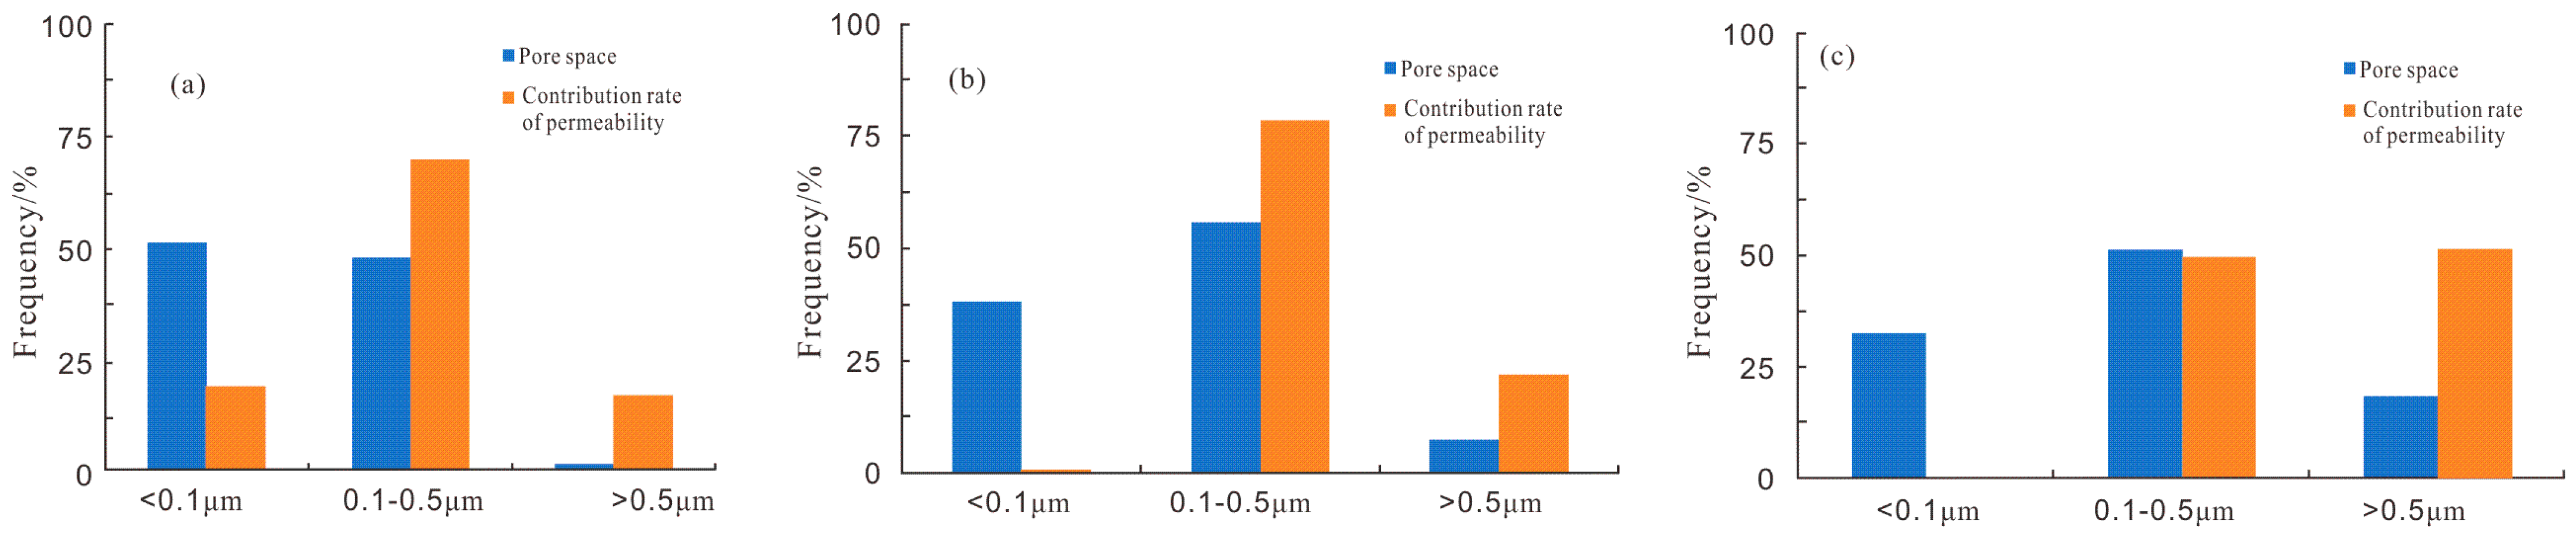
- The parameters associated with throat radius in tight reservoirs significantly impact the behavior of movable fluids. The saturation of movable fluids exhibits stronger correlations with throat-related parameters than pore-related parameters. Notably, the correlation between movable fluid saturation and the mainstream throat radius surpasses that of the average throat radius. The size of the throat radius plays a paramount role in regulating fluid flow within the reservoir, as smaller throat radii impede fluid mobility. The content of clay minerals is also a crucial factor affecting the saturation of mobile fluids in the reservoir.
Author Contributions
Funding
Data Availability Statement
Conflicts of Interest
References
- Wei, Q.; Mei, J.; Tian, J.; Chen, X.; Xiao, L. Pore structure analysis of tight reservoirs in the He-8 Member of Upper Paleozoic in the southwestern Ordos Basin, China. Interpretation 2022, 10, 681–692. [Google Scholar] [CrossRef]
- Xiao, L.; Bi, L.; Yi, T.; Lei, Y.; Wei, Q. Pore Structure Characteristics and Influencing Factors of Tight Reservoirs Controlled by Different Provenance Systems: A Case Study of the Chang 7 Members in Heshui and Xin’anbian of the Ordos Basin. Energies 2023, 16, 3410. [Google Scholar] [CrossRef]
- Wu, L.; Zhang, J.; Jia, D.; Wang, S.; Yan, Y. Performance Evaluation of Multistage Fractured Horizontal Wells in Tight Gas Reservoirs at Block, M., Ordos Basin. Energies 2022, 15, 613. [Google Scholar] [CrossRef]
- Saeed, S.A.; Hakimi, M.H.; Al-Muntaser, A.A.; Khamieva, A.N.; Varfolomeev, M.A.; Morozov, V.P.; Lashin, A.; Abdelaal, M.A.; Suwaid, M.A.; Mustapha, K.A.; et al. Geochemical, mineralogical and petrographical characteristics of the domanik formation from north samara region in the volga-ural basin, Russia: Implication for unconventional tight oil reservoir potential. J. Pet. Sci. Eng. 2023, 220, 111240. [Google Scholar] [CrossRef]
- Durrani, M.Z.A.; Rahman, S.A.; Talib, M.; Subhani, G.; Sarosh, B. Characterization of seismic anisotropy using azimuthal AVO analysis (AVAz)—An application case study in the deep and tight carbonate reservoirs from Potwar Basin onshore Pakistan. J. Appl. Geophys. 2022, 205, 104767. [Google Scholar] [CrossRef]
- Lai, J.; Wang, G.; Wang, Z.; Chen, J.; Pang, X.; Wang, S.; Zhou, Z.; He, Z.; Qin, Z.; Fan, X. A review on pore structure characterization in tight sandstones. Earth-Sci. Rev. 2018, 177, 436–457. [Google Scholar] [CrossRef]
- Sakhaee-Pour, A.; Bryant, S.L. Effect of pore structure on the producibility of tight-gas sandstones. AAPG Bull. 2014, 98, 663–694. [Google Scholar] [CrossRef]
- Temraz, M.G.; Mandur, M.M.; Coffey, B. Reservoir sedimentology and depositional environment studies of Alam El Bueib Formation using microfacies and nannofossils in Betty-1 well, Shoushan Basin, northern Western Desert, Egypt. Environ. Geosci. 2016, 23, 123–139. [Google Scholar] [CrossRef]
- Xiao, L.; Yang, L.; Zhang, X.; Guan, X.; Wei, Q. Densification Mechanisms and Pore Evolution Analysis of a Tight Reservoir: A Case Study of Shan-1 Member of Upper Paleozoic Shanxi Formation in SW Ordos Basin, China. Minerals 2023, 13, 960. [Google Scholar] [CrossRef]
- Daigle, H.; Johnson, A. Combining Mercury Intrusion and Nuclear Magnetic Resonance Measurements Using Percolation Theory. Transp. Porous Media 2015, 111, 669–679. [Google Scholar] [CrossRef]
- Chandra, D.; Vishal, V. A critical review on pore to continuum scale imaging techniques for enhanced shale gas recovery. Earth-Sci. Rev. 2021, 217, 103638. [Google Scholar] [CrossRef]
- Wang, C.; Zeng, J.; Lin, X.; Liu, X.; Wang, F.; Zhang, J.; Jia, K. Utility of GOI, QGF, and QGF-E for interpreting reservoir geohistory and oil remigration in the Hudson oilfield, Tarim basin, northwest China. Mar. Pet. Geol. 2017, 86, 486–498. [Google Scholar] [CrossRef]
- Li, P.; Sun, W.; Wu, B.; Gao, Y.; Du, K. Occurrence characteristics and influential factors of movable fluids in pores with different structures of Chang 63 reservoir, Huaqing Oilfield, Ordos Basin, China. Mar. Pet. Geol. 2018, 97, 480–492. [Google Scholar] [CrossRef]
- Mondal, I.; Singh, K.H. Fluid substitution in NMR T2 distribution and resistivity independent saturation computation using synthetic capillary pressure data. Pet. Res. 2023, 8, 77–78. [Google Scholar] [CrossRef]
- Siavashi, J.; Najafi, A.; Sharifi, M.; Fahimpour, J.; Shabani, M.; Liu, B.; Liu, K.; Yan, J.; Ostadhassan, M. An insight into core flooding experiment via NMR imaging and numerical simulation. Fuel 2022, 318, 123589. [Google Scholar] [CrossRef]
- Qu, Y.; Sun, W.; Tao, R.; Luo, B.; Chen, L.; Ren, D. Pore–throat structure and fractal characteristics of tight sandstones in Yanchang Formation, Ordos Basin. Mar. Pet. Geol. 2020, 120, 104573. [Google Scholar] [CrossRef]
- Guo, Q.; Yao, Y.; Hou, L.; Tang, S.; Pan, S.; Yang, F. Oil migration, retention, and differential accumulation in “sandwiched” lacustrine shale oil systems from the Chang 7 member of the Upper Triassic Yanchang Formation, Ordos Basin, China. Int. J. Coal Geol. 2022, 261, 104077. [Google Scholar] [CrossRef]
- Liu, X.; Li, S.; Guo, Q.; Zhou, X.; Liu, J. Characteristics of rock types and exploration significance of the shale strata in the Chang 73 sub-member of Yanchang Formation, Ordos Basin, China. J. Nat. Gas Geosci. 2021, 6, 363–373. [Google Scholar] [CrossRef]
- Ji, L.-M.; Yan, K.; Meng, F.-W.; Zhao, M. The oleaginous Botryococcus from the Triassic Yanchang Formation in Ordos Basin, Northwestern China: Morphology and its paleoenvironmental significance. J. Asian Earth Sci. 2010, 38, 175–185. [Google Scholar] [CrossRef]
- Zheng, R.; Zeng, W.; Li, Z.; Chen, X.; Man, K.; Zhang, Z.; Wang, G.; Shi, S. Differential enrichment mechanisms of organic matter in the Chang 7 Member mudstone and shale in Ordos Basin, China: Constraints from organic geochemistry and element geochemistry. Palaeogeogr. Palaeoclim. Palaeoecol. 2022, 610, 111126. [Google Scholar] [CrossRef]
- Zhu, H.; Zhong, D.; Yao, J.; Sun, H.; Niu, X.; Liang, X.; You, Y.; Li, X. Alkaline diagenesis and its effects on reservoir porosity: A case study of Upper Triassic Chang 7 Member tight sandstone in Ordos Basin, NW China. Pet. Explor. Dev. 2015, 42, 56–65. [Google Scholar] [CrossRef]
- Mahmud, W.M. Rate-Controlled Mercury Injection Experiments to Characterize Pore Space Geometry of Berea Sandstone. E3S Web Conf. 2023, 366, 01016. [Google Scholar] [CrossRef]
- Wei, X.; Qun, L.; Shusheng, G.; Zhiming, H.; Hui, X. Pseudo threshold pressure gradient to flow for low permeability reservoirs. Pet. Explor. Dev. 2009, 36, 232–236. [Google Scholar] [CrossRef]
- Li, P.; Jia, C.; Jin, Z.; Liu, Q.; Zheng, M.; Huang, Z. The characteristics of movable fluid in the Triassic lacustrine tight oil reservoir: A case study of the Chang 7 member of Xin’anbian Block, Ordos Basin, China. Mar. Pet. Geol. 2019, 102, 126–137. [Google Scholar] [CrossRef]
- Singh, A.; Jha, N.K.; Mandal, P.P.; Esteban, L.; Desai, B.G. Pore throat characterization of bioturbated heterogeneous sandstone, Bhuj Formation, Kachchh India: An integrated analysis using NMR and HPMI studies. J. Pet. Sci. Eng. 2022, 211, 110221. [Google Scholar] [CrossRef]
- Baban, A.; Al-Yaseri, A.; Keshavarz, A.; Amin, R.; Iglauer, S. CO2–brine–sandstone wettability evaluation at reservoir conditions via Nuclear Magnetic Resonance measurements. Int. J. Greenh. Gas Control. 2021, 111, 103435. [Google Scholar] [CrossRef]
- Li, T.; Huang, Z.; Zhao, J.; Xu, X.; Guo, X. Pore structure characteristics and their influencing factors: A case study from the middle jurassic mixed siliciclastic carbonate rocks, Turpan-Hami basin, Northwest China. J. Pet. Sci. Eng. 2021, 203, 108611. [Google Scholar] [CrossRef]
- Mirzaei-Paiaman, A.; Ghanbarian, B. A new method for characterizing dynamic reservoir quality: Implications for quality maps in reservoir simulation and rock type classification. J. Pet. Sci. Eng. 2022, 218, 111049. [Google Scholar] [CrossRef]
- Clarkson, C.; Freeman, M.; He, L.; Agamalian, M.; Melnichenko, Y.; Mastalerz, M.; Bustin, R.; Radliński, A.; Blach, T. Characterization of tight gas reservoir pore structure using USANS/SANS and gas adsorption analysis. Fuel 2012, 95, 371–385. [Google Scholar] [CrossRef]


| Well | Porosity/% | Permeability/mD | Maximum Throat Radius/μm | Everage Throat Radius/μm | Mainstream Throat Radius/μm |
|---|---|---|---|---|---|
| Y76 | 7.61 | 0.018 | 0.4 | 0.146 | 0.152 |
| L17 | 7.72 | 0.020 | 0.4 | 0.261 | 0.288 |
| B89 | 9.06 | 0.025 | 0.6 | 0.339 | 0.321 |
| M53 | 8.17 | 0.027 | 0.5 | 0.269 | 0.291 |
| Z180 | 7.27 | 0.029 | 0.5 | 0.289 | 0.315 |
| X271 | 8.57 | 0.035 | 0.5 | 0.290 | 0.317 |
| J46 | 9.14 | 0.052 | 0.6 | 0.306 | 0.321 |
| N45 | 7.41 | 0.062 | 0.6 | 0.296 | 0.311 |
| X270 | 9.05 | 0.078 | 0.7 | 0.397 | 0.465 |
| J46-2 | 10.08 | 0.098 | 0.9 | 0.511 | 0.485 |
| Well | Porosity/% | Permeability/mD | Average Pore Radius/μm | Sorting Coefficient | Maximum Mercury Saturation/% | Displacement Pressure/MPa | Median Saturation Pressure/MPa |
|---|---|---|---|---|---|---|---|
| Y76 | 7.61 | 0.018 | 0.11 | 5.15 | 45.92 | 0.72 | *** |
| Z140 | 7.41 | 0.020 | 0.06 | 4.08 | 49.23 | 1.76 | *** |
| B89 | 9.06 | 0.025 | 0.07 | 5.40 | 54.36 | 1.12 | 30.12 |
| M53 | 8.17 | 0.027 | 0.38 | 5.83 | 58.01 | 0.20 | 3.83 |
| Z180 | 7.27 | 0.029 | 0.09 | 3.80 | 64.45 | 0.72 | 8.97 |
| X271 | 8.57 | 0.035 | 0.16 | 3.68 | 69.44 | 0.32 | 12.22 |
| J46 | 9.14 | 0.052 | 0.26 | 4.66 | 77.57 | 0.31 | 4.10 |
| N45 | 7.41 | 0.062 | 0.08 | 3.94 | 79.06 | 0.60 | 12.09 |
| X270 | 9.05 | 0.078 | 0.06 | 3.53 | 79.67 | 1.25 | 20.14 |
| J46-2 | 10.08 | 0.098 | 0.18 | 5.53 | 79.88 | 0.31 | 49.48 |
| Type | Well | Porosity/% | Permeability/mD | Maximum Pore Radius/μm | Average Pore Radius/μm | Mainstream Throat Radius/μm | Pore Throat Ratio and Permeability Distribution in Different Pore Throat Intervals | |||||
|---|---|---|---|---|---|---|---|---|---|---|---|---|
| <0.1 μm | 0.1–0.5 μm | >0.5 μm | ||||||||||
| Pore Throat Ratio/% | Contribution Rate of Permeability/% | Pore Throat Ratio/% | Contribution Rate of Permeability/% | Pore Throat Ratio/% | Contribution Rate of Permeability/% | |||||||
| III | Y76 | 7.608 | 0.018 | 0.109 | 0.057 | 0.060 | 99.76 | 99.21 | 0.24 | 0.79 | ||
| Z183 | 7.415 | 0.020 | 0.470 | 0.079 | 0.110 | 71.32 | 19.64 | 28.68 | 80.36 | |||
| II | B89 | 9.064 | 0.025 | 0.502 | 0.117 | 0.108 | 57.61 | 21.42 | 42.15 | 67.40 | 0.24 | 11.18 |
| M53 | 8.175 | 0.027 | 0.563 | 0.118 | 0.175 | 57.44 | 16.83 | 42.47 | 80.66 | 0.08 | 2.50 | |
| Z183 | 7.265 | 0.029 | 0.300 | 0.159 | 0.172 | 26.27 | 1.65 | 73.73 | 98.34 | |||
| X233 | 8.569 | 0.035 | 1.027 | 0.195 | 0.209 | 34.85 | 2.21 | 63.31 | 61.59 | 1.84 | 36.19 | |
| A83 | 9.137 | 0.052 | 0.594 | 0.170 | 0.221 | 33.81 | 2.93 | 65.81 | 93.25 | 0.39 | 3.81 | |
| N89 | 7.412 | 0.062 | 1.255 | 0.274 | 0.401 | 34.54 | 0.66 | 63.47 | 74.42 | 1.99 | 24.91 | |
| I | X233 | 9.046 | 0.078 | 0.866 | 0.161 | 0.421 | 46.65 | 4.71 | 52.29 | 74.40 | 1.05 | 20.89 |
| A83-2 | 10.080 | 0.098 | 1.020 | 0.277 | 0.468 | 41.67 | 0.81 | 51.93 | 66.99 | 6.40 | 32.20 | |
| N89 | 10.53 | 0.147 | 1.240 | 0.285 | 0.486 | 37.76 | 0.44 | 55.43 | 78.06 | 6.81 | 21.50 | |
| X233 | 10.26 | 0.250 | 1.480 | 0.297 | 0.504 | 31.70 | 0.34 | 50.44 | 48.95 | 17.86 | 50.71 | |
| Well | Depth/m | Porosity/% | Permeability/mD | Percentage of Movable Fluid/% |
|---|---|---|---|---|
| Y76 | 2126.00 | 7.61 | 0.018 | 11.23 |
| Z140 | 1814.20 | 7.42 | 0.020 | 14.61 |
| B89 | 2475.00 | 9.06 | 0.025 | 12.04 |
| M53 | 2221.00 | 8.18 | 0.027 | 18.91 |
| Z180 | 1890.00 | 7.27 | 0.029 | 35.78 |
| X271 | 2035.00 | 8.57 | 0.035 | 31.94 |
| A83 | 2277.28 | 9.13 | 0.052 | 26.72 |
| N45 | 1692.00 | 7.41 | 0.062 | 25.46 |
| X270 | 2047.60 | 9.05 | 0.078 | 17.77 |
| J46-2 | 2275.02 | 10.08 | 0.100 | 38.18 |
| X70 | 1635.10 | 10.53 | 0.150 | 41.27 |
| X270-1 | 2042.70 | 10.26 | 0.250 | 51.25 |
| X270-2 | 2043.47 | 9.43 | 0.15 | 51.25 |
| N70 | 1635.10 | 10.53 | 0.15 | 41.27 |
| L399 | 2117.14 | 7.75 | 0.02 | 17.60 |
| YC1 | 1984.66 | 8.99 | 0.09 | 18.27 |
| X270-3 | 2044.90 | 11.83 | 0.10 | 29.87 |
| J46-2 | 2275.02 | 10.08 | 0.10 | 38.18 |
| H283 | 2302.70 | 11.14 | 0.20 | 47.00 |
| X233 | 1932.50 | 9.51 | 0.03 | 25.06 |
Disclaimer/Publisher’s Note: The statements, opinions and data contained in all publications are solely those of the individual author(s) and contributor(s) and not of MDPI and/or the editor(s). MDPI and/or the editor(s) disclaim responsibility for any injury to people or property resulting from any ideas, methods, instructions or products referred to in the content. |
© 2023 by the authors. Licensee MDPI, Basel, Switzerland. This article is an open access article distributed under the terms and conditions of the Creative Commons Attribution (CC BY) license (https://creativecommons.org/licenses/by/4.0/).
Share and Cite
Wei, Q.; Zhang, H.; Han, Y.; Guo, W.; Xiao, L. Microscopic Pore Structure Characteristics and Fluid Mobility in Tight Reservoirs: A Case Study of the Chang 7 Member in the Western Xin’anbian Area of the Ordos Basin, China. Minerals 2023, 13, 1063. https://doi.org/10.3390/min13081063
Wei Q, Zhang H, Han Y, Guo W, Xiao L. Microscopic Pore Structure Characteristics and Fluid Mobility in Tight Reservoirs: A Case Study of the Chang 7 Member in the Western Xin’anbian Area of the Ordos Basin, China. Minerals. 2023; 13(8):1063. https://doi.org/10.3390/min13081063
Chicago/Turabian StyleWei, Qinlian, Huifang Zhang, Yonglin Han, Wenjie Guo, and Ling Xiao. 2023. "Microscopic Pore Structure Characteristics and Fluid Mobility in Tight Reservoirs: A Case Study of the Chang 7 Member in the Western Xin’anbian Area of the Ordos Basin, China" Minerals 13, no. 8: 1063. https://doi.org/10.3390/min13081063