Article

Study on Impact Crushing Characteristics of Minerals Based on Drop Weight Tests

1
Guangxi Higher School Key Laboratory of Minerals Engineering and Materials, College of Resources, Environment and Materials, Guangxi University, Nanning 530004, China
2
College of Chemistry and Chemical Engineering, Guangxi University, Nanning 530004, China
*
Author to whom correspondence should be addressed.
Minerals 2023, 13(5), 632; https://doi.org/10.3390/min13050632
Submission received: 20 April 2023 / Revised: 28 April 2023 / Accepted: 29 April 2023 / Published: 30 April 2023
(This article belongs to the Special Issue Comminution and Comminution Circuits Optimisation, Volume II)

Abstract

:
The degree of difficulty in crushing an ore depends on the composition of the ore itself. Due to different types and compositions of ores, the crushing mechanism of ores during the crushing process is also different. In order to quantitatively analyze the impact crushing characteristics of mineral components in ores, this paper takes pure mineral quartz, pyrrhotite, and pyrite as the research objects and uses the universal drop weight impact crushing test equipment and standard test methods developed by the JK Mineral Research Center of the University of Queensland, Australia, to conduct JK drop weight tests on these three pure mineral samples. The results show that the particle size distribution of impact crushing products is wide, covering all particle sizes from “0” to close to the feed particle size, and the yield distribution of each product particle size is relatively uniform. There are critical values and “energy barrier” effects for the impact-specific crushing energy. The impact-specific crushing energy has a significant impact on the particle size composition and crushing effect of the crushing product, and there is an interactive effect between the impact-specific crushing energy and the feed particle size and mineral type. The impact crushing resistance of the sample can be characterized by using Mohs hardness, impact crushing characteristic parameters, impact crushing resistance level, and the yield limit value t10 of the characteristic crushing particle size. The overall characterization results have good consistency.

1. Introduction

The crushing operation of ores is widely used in solid mineral resource processing fields such as mining, the chemical industry, metallurgy, building materials, thermal power, etc. [1,2,3]. The crushing process of ore plays a very important role in mineral processing production, with its infrastructure costs accounting for about 60% of the construction cost of the concentrator, and production costs accounting for 40% to 50% of the concentrator [4,5]. As one of the most important main pieces of equipment in the concentrator, crushing equipment production and processing capacity directly affect and limit the scale efficiency of the concentrator. More importantly, the crushing operation is the material preparation stage for the subsequent separation of minerals in a concentrator, and the particle size composition of its product significantly affects the quality of the beneficiation product, thereby affecting the technical and economic benefits of the concentrator [6,7,8]. Nowadays, with the continuous development and utilization of mineral resources, ore grade is gradually depleted, and the quality of resources is gradually declining. Many mineral resources of high grade that are easy to mine, easy to grind, and easy to select have been gradually exhausted, replaced by low-grade and complex mineral raw materials [9,10]. These low-grade ores with complex compositions have a large number of constituent minerals and significant differences in their physical and chemical properties, which seriously affects the subsequent separation efficiency of crushed products and the economic and technical indicators of the concentrator [11,12,13,14]. Therefore, optimizing crushing operations, improving crushing efficiency, and reducing crushing costs are of great significance to the mineral resource processing industry in the reduction of production costs and improvements to resource recovery and utilization [15,16,17,18,19].
For metallic mineral resources, ores are usually composed of two or more minerals, and their mineral composition and ore properties are very complex [20,21]. There are significant differences in the physical, chemical, and mechanical properties of different mineral components in the same ore, and subsequent separation operations have different particle size requirements for different mineral components. In addition, the difference in the crushing resistance of different mineral components is essentially a comprehensive manifestation of the difference in impact resistance and grinding resistance [22,23,24,25], and the macroscopic result is the selective crushing of minerals. Although relevant scientific researchers discovered the selective crushing phenomenon a long time ago and have since carried out corresponding theoretical research work [26,27,28], no one has yet studied the selective crushing phenomenon from the perspective of mineral impact crushing.
Therefore, this article selects quartz, pyrrhotite, and pyrite, which are common components in one ore, as a single pure mineral to conduct a drop weight test. By studying the impact crushing characteristics of three pure mineral samples, the particle energy relationship equations for the impact crushing resistance and impact crushing characteristics of the three pure minerals are studied, further revealing the influence of factors such as impact-specific crushing energy on the crushing characteristics of pure minerals and providing the most direct basic data for the subsequent overall equilibrium dynamic simulation of grinding tests.

2. Materials and Methods

2.1. Materials

In order to study the impact crushing characteristics of a single pure mineral, three natural pure minerals, quartz, pyrrhotite, and pyrite, were purchased as test samples. After crushing, screening, and mixing, these three pure minerals are ready for testing. The chemical element analysis results of the three pure minerals are shown in Table 1, Table 2 and Table 3. The crushing equipment included a jaw crusher (XPC-100 × 150), and the screening equipment included a vibrating screen (Analysette 3). The chemical element analysis equipment used included an X-ray fluorescence element analyzer (S8 TIGER).

2.2. Drop Weight Test Equipment and Principle

The drop weight test equipment used in this article included a drop weight test machine developed by the JK Mineral Research Center (JKMRC) of the University of Queensland, Australia (as shown in Figure 1). This piece of equipment has good stability and safety in operation, and the JKMRC has implemented a supporting data processing program. Therefore, this equipment has been widely used internationally. The test principle is to use drop weights of different weight (which can generate different impact energy) to vertically drop impact mineral particles from a set height, collect and screen the impact crushing products, and obtain the impact crushing characteristics of minerals.

2.3. Methods

The drop weight test includes two types: the JK drop weight test and SMC drop weight test, which require different particle size ranges for the tested sample. The particle size range of samples for the JK drop weight test is relatively wide, including five groups of particle sizes within the range of −63 + 13.2 mm. The particle size range of samples for the SMC drop weight test is also relatively wide, including five groups of particle sizes within the range of −22.4 + 19 mm or −31.5 + 26.5 mm. Therefore, before the drop weight test, it is necessary to select an appropriate impact test type based on the particle size of the tested sample. Among the three tested samples selected in this article, quartz and pyrrhotite have relatively coarse particle sizes that can be broken into the different particle sizes required for the JK drop weight test; thus, the JK drop weight test was used to study them. However, pyrite samples are regular cubes with a narrow particle size range, and it is suitable to use the SMC drop weight test to study them.

2.3.1. JK Drop Weight Test

Quartz and pyrrhotite were screened into five particle sizes: −63 + 53 mm, −45 + 37.5 mm, −31.5 + 26.5 mm, −22.4 + 19 mm, and −16 + 13.2 mm. The corresponding number of particles for the five particle sizes was 30, 45, 90, 90, and 90. Each particle size of mineral was divided into 3 equal groups.

2.3.2. SMC Drop Weight Test

The pyrite was screened and 90 pyrite particles of −22.4 + 19 mm were selected and evenly divided into 3 groups. The specific gravity of each group of pyrite particles was measured and their average specific gravity was calculated as the specific gravity of pyrite. Based on this average specific gravity, 100 particles of −22.4 + 19 mm were selected from the pyrite sample and evenly divided into 5 groups for drop weight impact testing.

2.3.3. Impact Crushing Characteristic Parameters

According to the screening analysis of impact crushing products and the calculation method provided by the JKMRC, the impact crushing characteristic parameters A and b of three minerals can be obtained.
Based on the particle size analysis of quartz, pyrrhotite, and pyrite impact crushing products, drawing particle size characteristic curves, and using the origin function to fit regression analysis, a particle size distribution model for mineral impact crushing products, the DoseResp model, can be obtained, as shown in Equation (1) [29]; thus, the cumulative yield under the sieve of any required particle size can be calculated.
y = A 1 + A 2 A 1 1 + 10 ( logx 0 x ) · p
where x is the sieving particle size (mm), y is the corresponding cumulative weight percentage of undersized particles (%), A1 and A2 are the upper and lower asymptotes of the particle size characteristic curve (%), logx0 is the particle size at (A1 + A2)/2 (mm), and p is the absolute value of the maximum slope on the particle size curve (%/mm).
For a single mineral, the cumulative yield under the sieve for any specific mesh size in 15 groups of crushing test products can be calculated based on the above DoseResp particle size distribution model. According to JKMRC recommendations, a particle size in the crushing product that is less than one tenth of the feed particle size is generally used as a characteristic particle size. The cumulative yield under the sieve corresponding to this characteristic particle size reflects the degree of fragmentation of the mineral, represented by the symbol t10. t represents the cumulative mass percentage below the sieve and 10 represents the ratio of the feed particle size to the mesh size of the analysis product’s particle size composition. According to 15 sets of t10 values and Ecs (that is, the impact kinetic energy per unit mass of mineral, expressed in kWh/t), a scatter plot of t10-Ecs can be drawn. Using the functional relationship of t10-Ecs (shown in Equation (2)) for fitting analysis, impact crushing characteristic parameters A and b can then be obtained for the mineral.
t 10 = A ( 1 e b   ×   E cs )
The t10-Ecs relationship was proposed by Leung [30] and verified by Napier Munn et al. [31] on the basis of a certain relationship between particle size distribution and Ecs after mineral crushing. This relationship has good engineering significance. Because the t10-Ecs relationship of various grinding equipment is constant [32], and the values of A and b are only determined by mineral properties, this relationship can be applied to the selection and optimization of various grinding equipment. Equation (2) is also known as the particle energy relationship equation for materials. The value of A × b can be used to measure the impact crushing resistance of ore. Based on the JK database, the test parameters (A × b) and the corresponding relationship with ore properties are shown in Table 4.

3. Results and Discussion

3.1. Impact Resistance Characteristics of Quartz and Particle Size Characteristics of Its Impact Crushing Products

In this study, an impact crushing test of quartz was conducted according to the standard JK drop weight method. Through screening and analysis of impact crushing products, 15 sets of particle size/energy combination results were obtained, and the specific analysis is as follows.

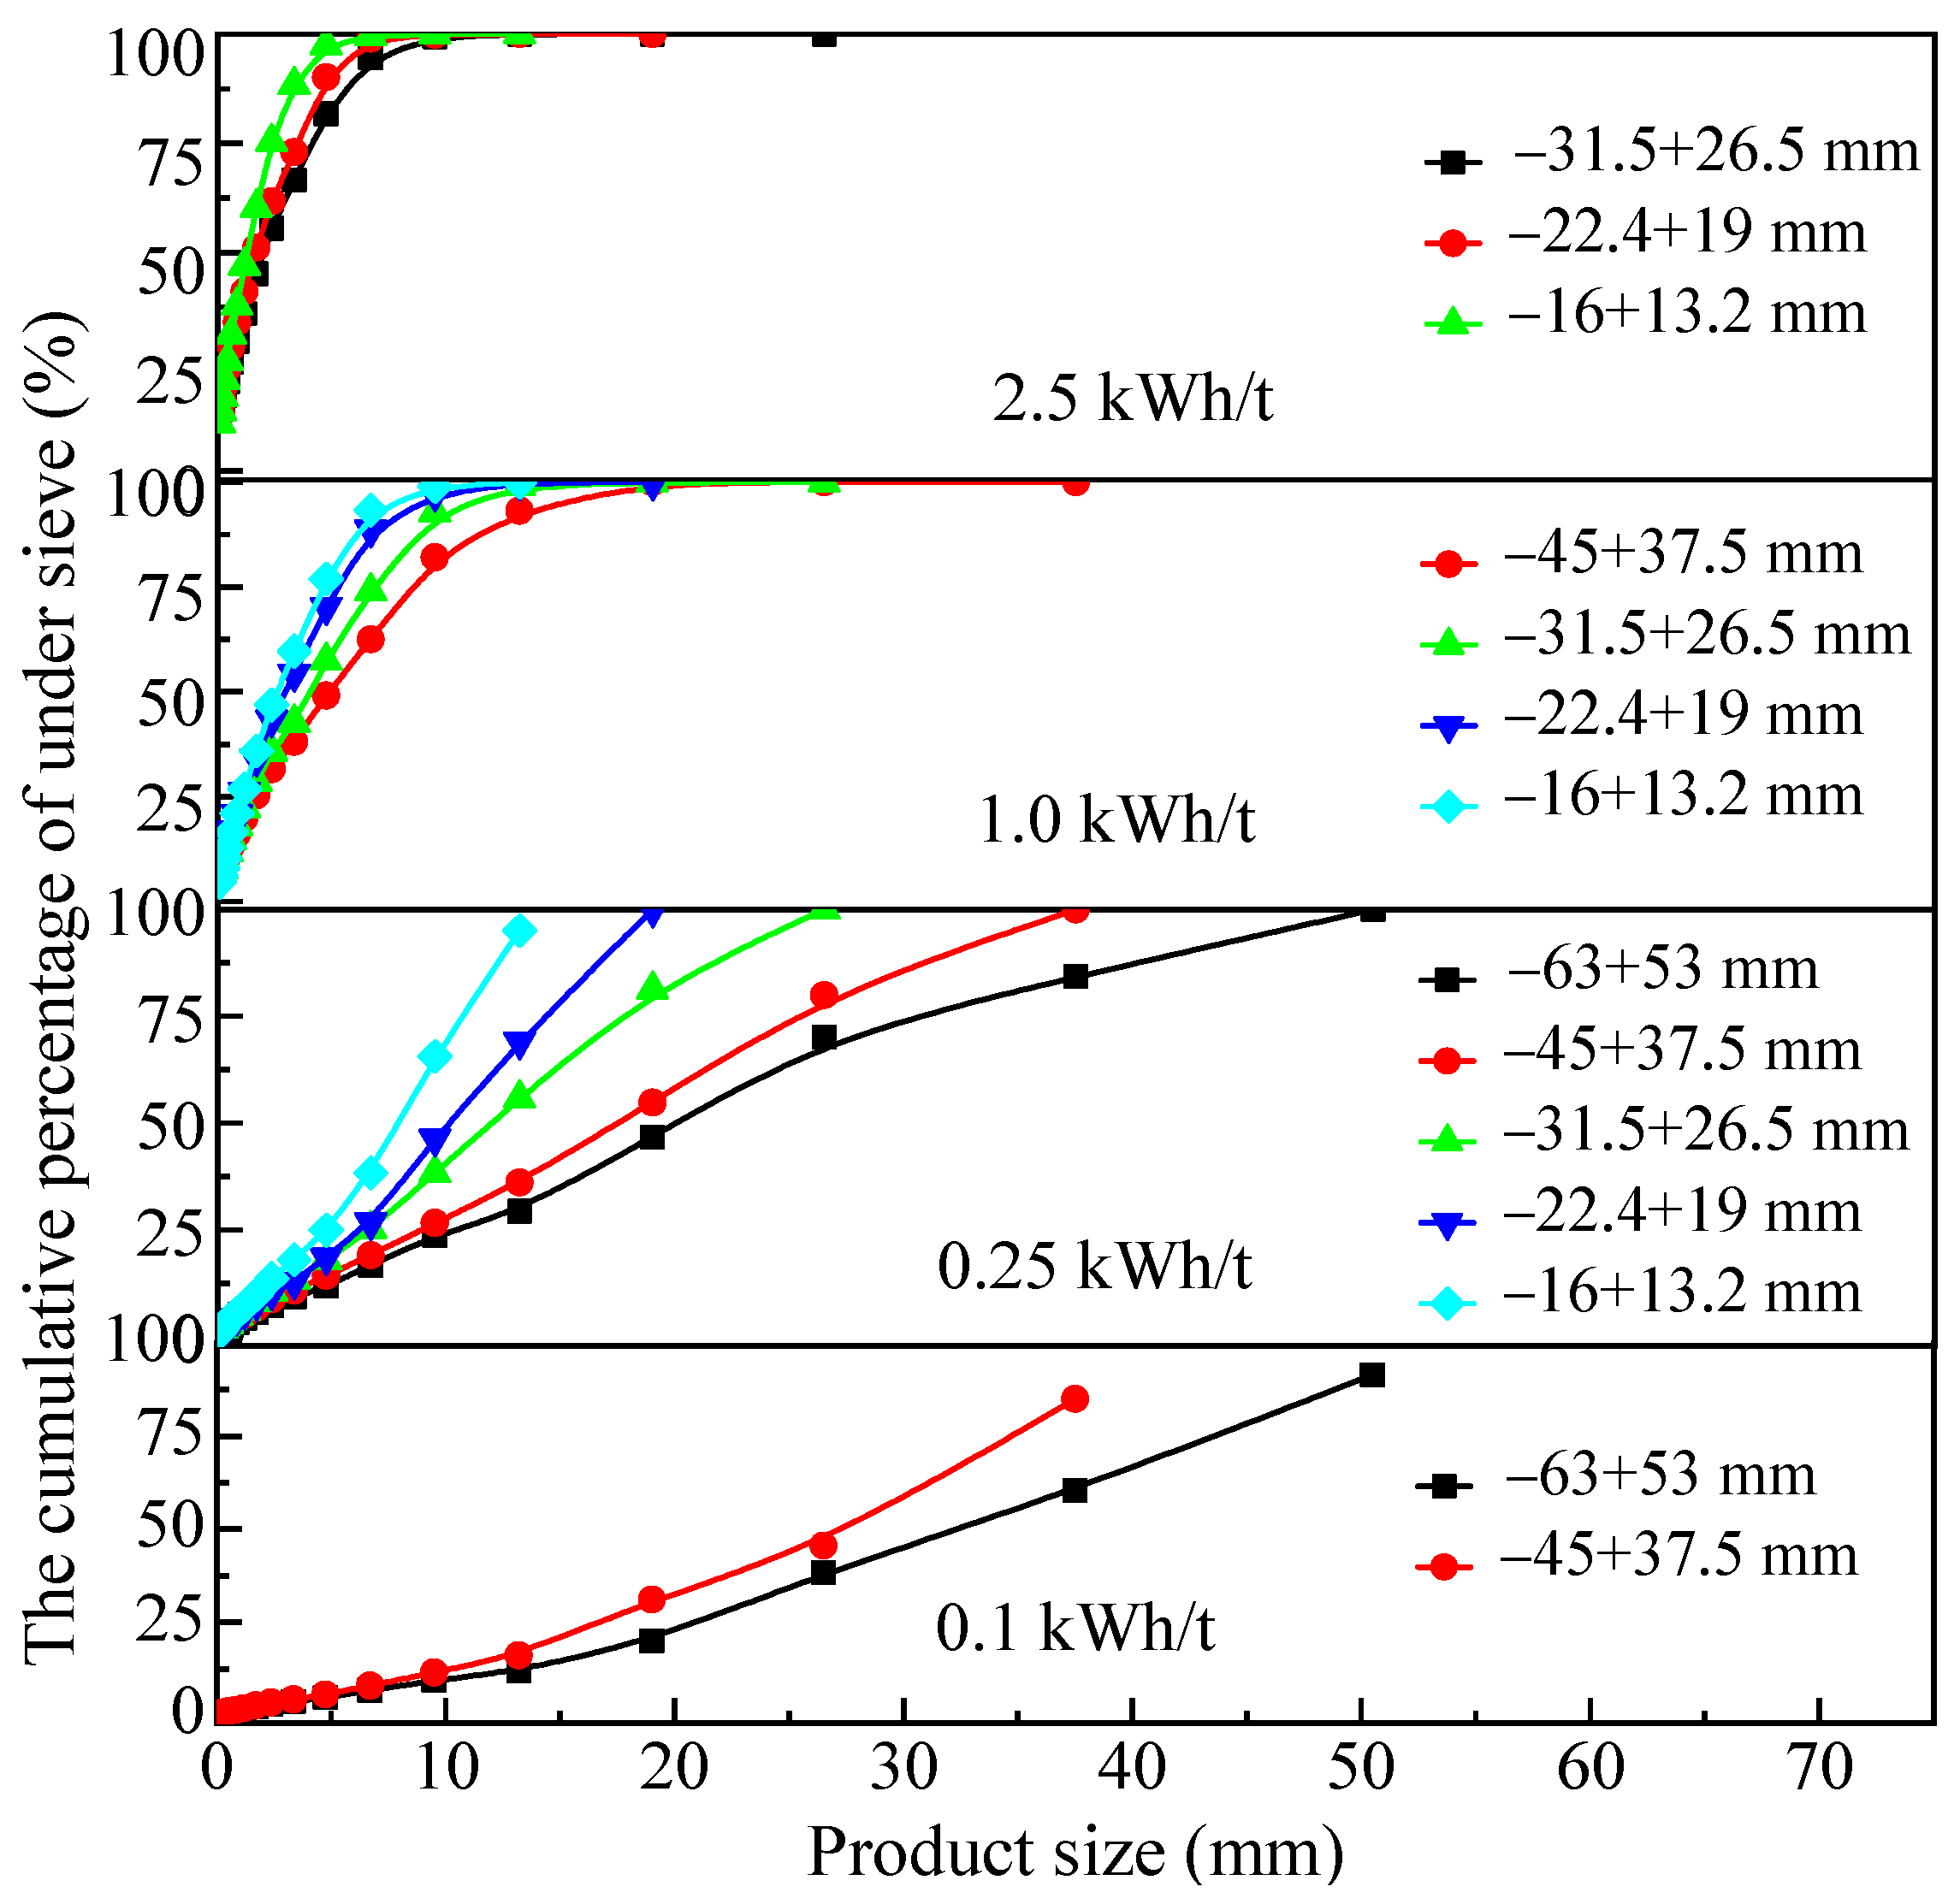
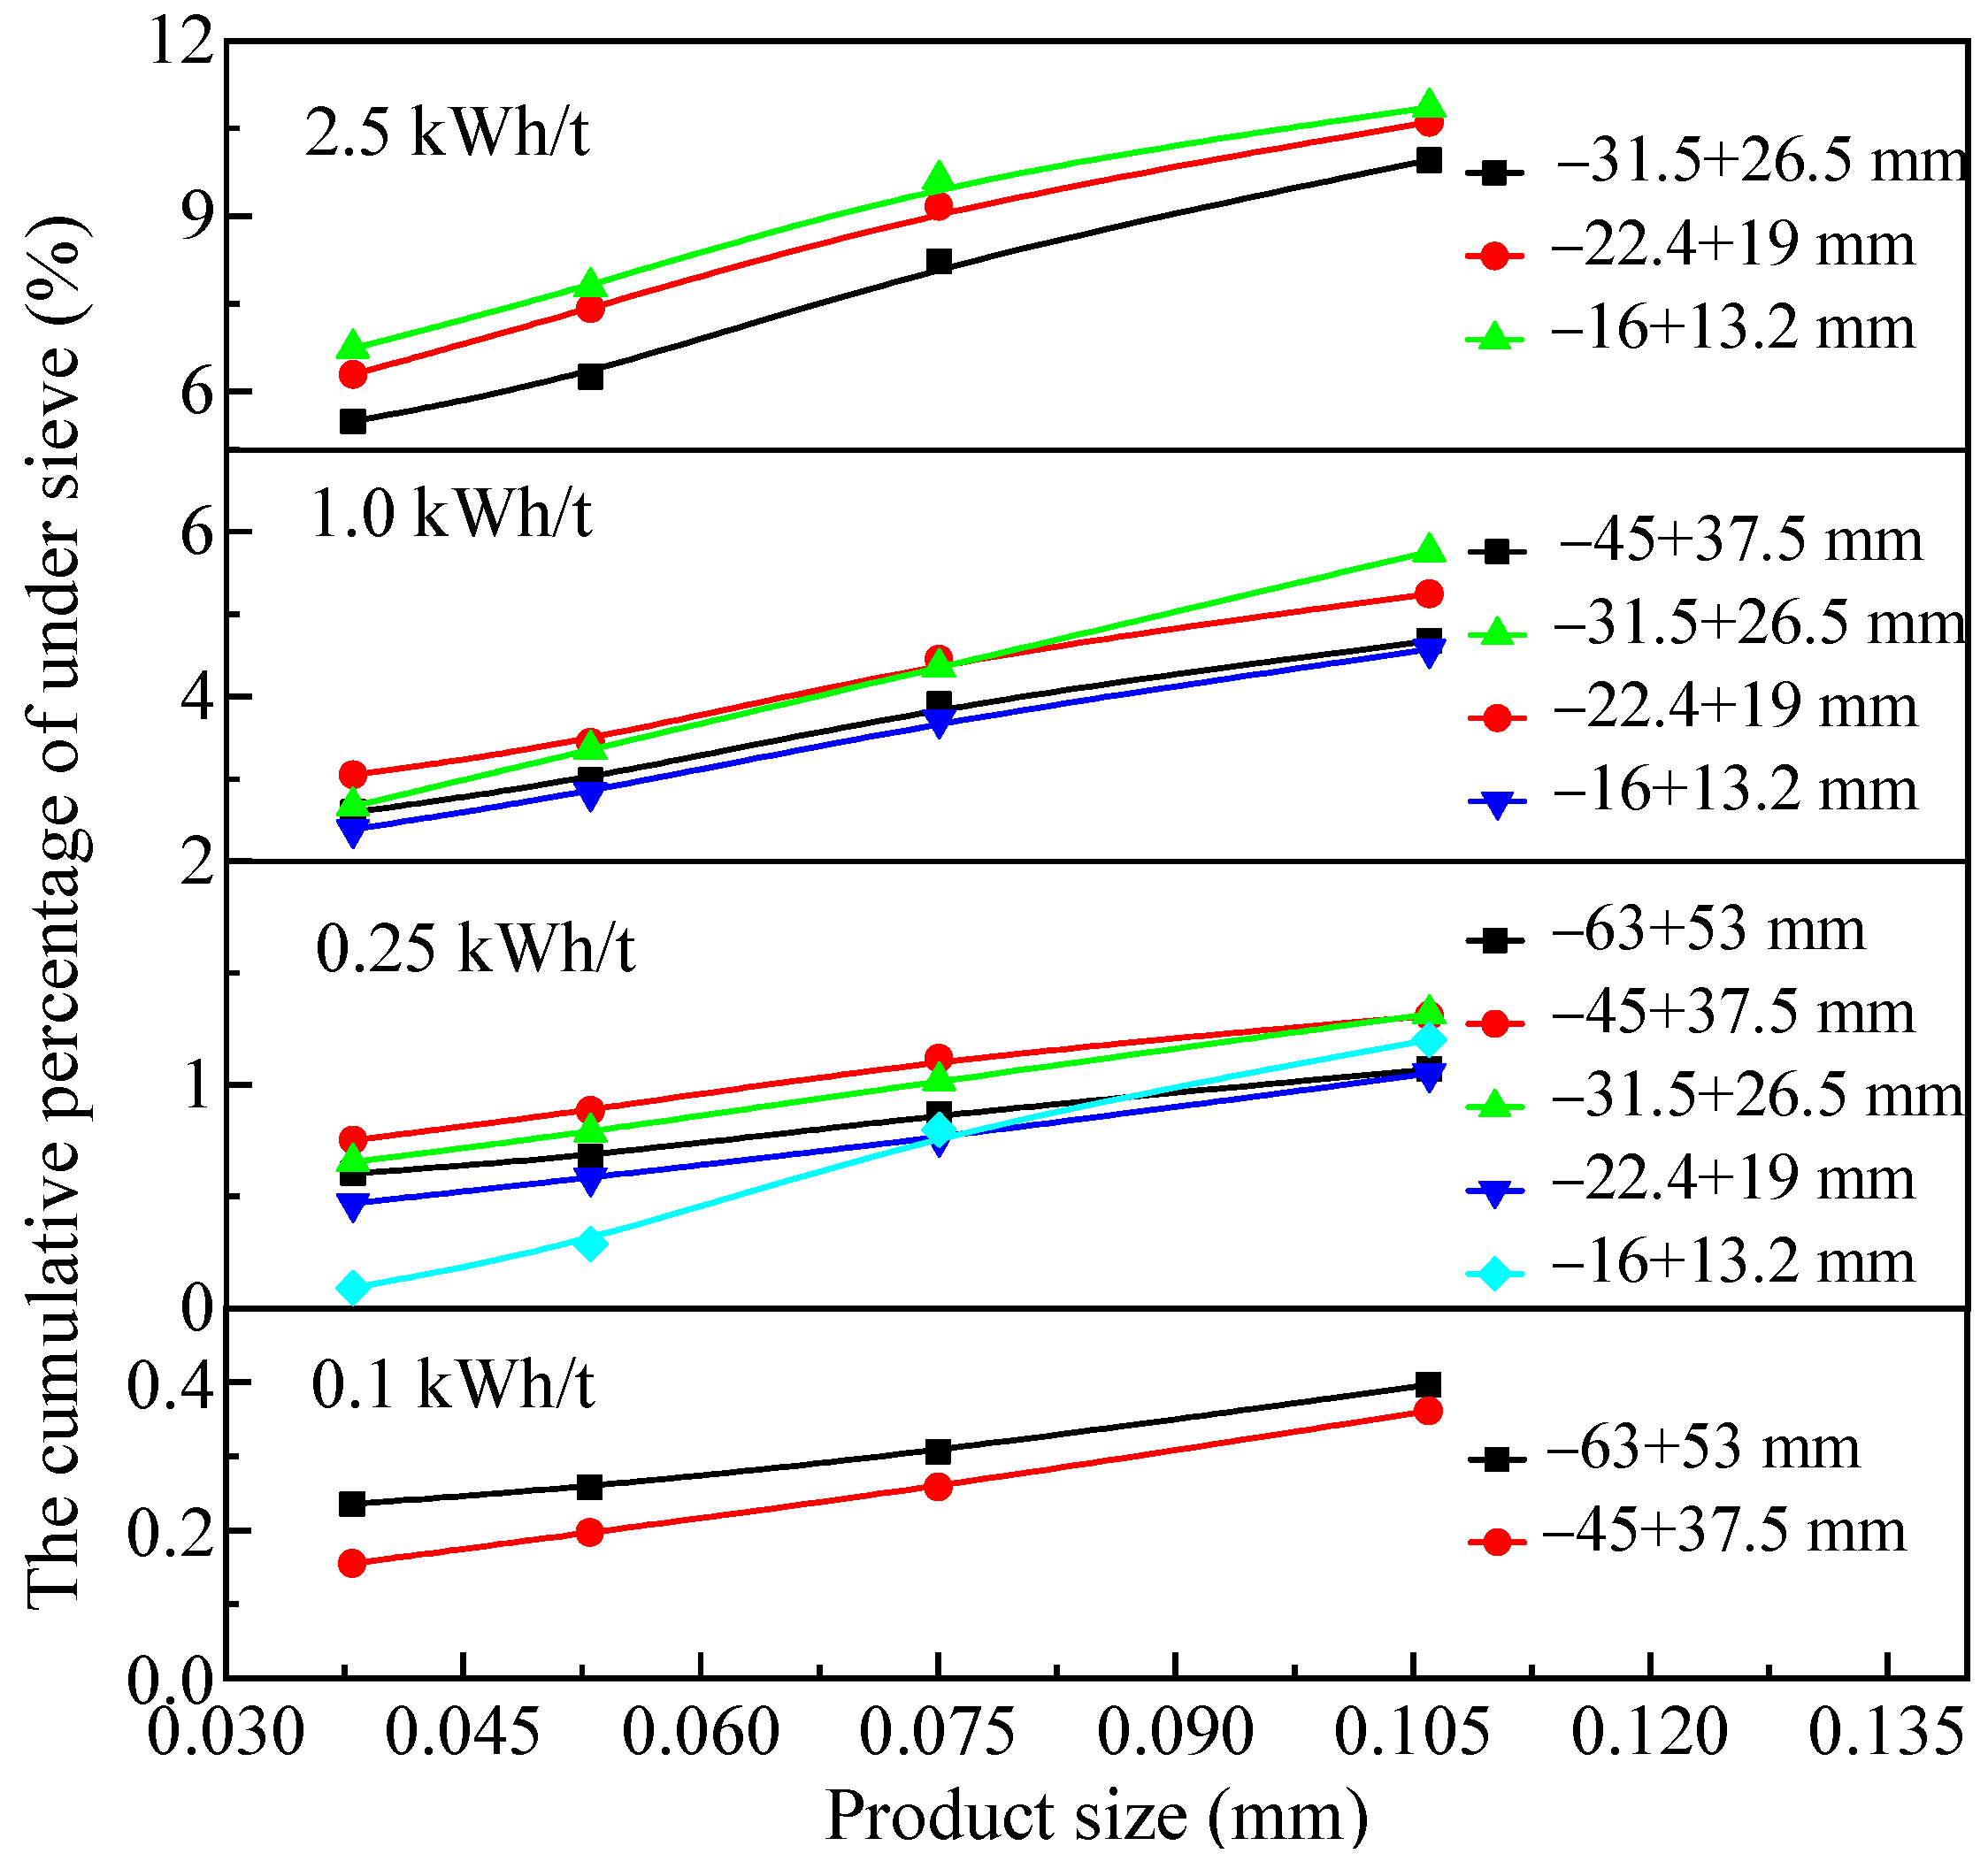
3.1.1. Analysis Results of the Particle Size Composition of Impact Crushing Products Obtained by the JK Drop Weight Test

The cumulative yield under the sieve of quartz impact crushing products was plotted with semi-logarithmic coordinates. The test results of five particle sizes of quartz, namely −63 + 53 mm, −45 + 37.5 mm, −31.5 + 26.5 mm, −22.4 + 19 mm, and −16 + 13.2 mm, are shown in Figure 2.
As can be seen from Figure 2, the shape of the particle size distribution characteristic curve of the crushing products of five particle sizes of quartz under the impact of different Ecs is similar, and the position of the particle size distribution curve of the crushing products is closely related to Ecs and feed particle size. For the same feed particle size, an increase in Ecs shifts the particle size distribution curve to the upper left corner. This means that for crushing products of arbitrary particle size, the higher the Ecs, the greater the cumulative yield under the sieve. It can also be seen from Figure 2 that the three product particle size characteristic curves of quartz are getting closer at both ends and farther away from the middle. This indicates that the yield of fine and coarse particle sizes in the crushing product is relatively small, while the yield of intermediate particle sizes is relatively large.
Looking at the original data of the five particle sizes in Figure 2, it can be seen that the impact action produces significantly more coarse particles than fine particles. For example, among the five particle sizes, the cumulative yield for the −0.106 mm particle size in the crushed product was as high as 10.87% and as low as 0.36%. The maximum yield for the −0.106 + 0.038 mm particle size was 4.47%, and the minimum yield was 0.16%, which means that the yield of each fine particle size was relatively low, indicating that the impact action has a smaller contribution to the formation of fine particle sizes from quartz crushing than it does coarse particle sizes. Therefore, it can be preliminarily predicted that in the grinding process of quartz, the impact action of grinding media has an important contribution to the formation of coarse particle sizes in the product.

3.1.2. Particle Energy Relationship Equation for Impact Crushing of Quartz

As described in Section 2.3.3, t10 (%) refers to the cumulative yield under the sieve of particles in the crushing product whose particle size is less than one tenth of the feed particle size. Considering that the feed is a particle group with a certain particle size range, feed particle size is calculated based on the geometric average of the upper and lower particle sizes of each particle level (hereinafter referred to as the nominal particle size). For example, the nominal particle size of the −63 + 53 mm particle size is 57.8 mm, and one tenth of its particle size is 5.78 mm. Based on the method in Section 2.3.3, the regression analysis results of the particle size distribution characteristic curve of quartz impact crushing products are listed in Table 5. The value of t10 and its corresponding Ecs are fitted and analyzed to obtain the impact crushing characteristic parameters A and b of quartz. The fitting curves are shown in Figure 3, and the fitting results are listed in Table 6.
Combining Table 4 and Table 6, the impact crushing resistance of quartz can be categorized as “medium soft”. It can be seen that quartz is not easily broken under impact. By substituting the values of A and b into Equation (2), the particle energy relationship equation for the impact crushing of quartz can be obtained, as show in Equation (3).
t 10 = 67.335   ×   [ 1 exp ( 0.8334 E cs ) ]

3.1.3. Variation Characteristics and Influencing Factors of the Yield of Coarse and Fine Particle Sizes of Crushed Products

From the crushing data, it can be seen that in the impact crushing products of five feed particle sizes, each particle size has a distribution. In order to better describe the crushing effect and impact crushing characteristics, based on the approximate particle size of coarse and fine grinding classifications in industrial grinding, this article uses the “dichotomy” method to divide the crushing product into coarse and fine particle sizes, that is, using 0.106 mm as the boundary size between coarse and fine particles, defining the +0.106 mm particle size in the crushing product as the coarse particle size, and defining the −0.106 mm particle size in the crushing product as the fine particle size. This is beneficial for studying the yield relationship and influencing factors of these two particle sizes in the crushing product.
Based on the cumulative yield data of each product particle size, the particle size composition distributions of the +0.106 mm coarse particle size and −0.106 mm fine particle size in each crushed product under different impact crushing energies and different feed particle sizes were calculated for quartz, and the results are shown in Figure 4 and Figure 5, respectively. In Figure 4, the ordinate of each particle size is the relative cumulative yield after subtracting −0.106 mm from the original cumulative yield under the sieve for each particle size.
From Figure 4 and Figure 5, it can be seen that the yield of each particle size of +0.106 mm is significantly higher than that of each particle size of −0.106 mm, indicating that the impact action mainly produces particle sizes of +0.106 mm. Moreover, the effects of Ecs and feed particle size on the yield of the coarse and fine particle sizes are different. For the coarse particle size of +0.106 mm, the higher the Ecs and the smaller the feed particle size, the more the distribution curve shifts to the upper left corner and the higher the degree of quartz fragmentation. For the fine particle size of −0.106 mm, the higher the Ecs, the greater the cumulative yield under the sieve, but the effect of feed particle size has no obvious regularity. Specifically, when Ecs is 2.5 kWh/t, the cumulative yield under the sieve of each particle size increases as the feed particle size decreases. When Ecs is 0.1 or 0.25 kWh/t, the cumulative yield under the sieve for each particle size of −0.106 mm is independent of the feed particle size and does not exceed 1.32%. When Ecs is 1.0 kWh/t, the cumulative yield under the sieve of each particle size of −0.106 mm is weakly correlated with the feed particle size, but there is no fixed rule. Therefore, from the perspective of fine particle size generation, when Ecs = 1.0 kWh/t it seems to have a critical effect, equivalent to an “energy barrier” value. That is, when Ecs > 1.0 kWh/t, the cumulative yield under the sieve of each particle size of impact crushing product increases with the increase in Ecs and decreases with the increase in feed particle size. When Ecs < 1.0 kWh/t, the cumulative yield under the sieve of each particle size of impact crushing product increases with the increase in Ecs but is independent of the feed particle size. The concept and numerical value of this critical specific energy may have important guiding significance in industrial applications.

3.1.4. Effect of Ecs on the Particle Size of Crushed Products

According to Equation (3) from Section 3.1.2, it is possible to estimate the crushing degree of quartz under any Ecs condition. According to the principle that a crushing test under the same Ecs condition should have no less than three feed particle sizes, the results in Table 5 are plotted as a scatter plot of feed particle size and t10 values, and the results are shown in Figure 6.
As can be seen from Figure 6, under the same Ecs condition, feed particle size and t10 have a linear correlation.
It can be assumed that the linear relationship between the two is given by the following:
t 10 = a + k   ×   D i
In Equation (4), Di is the feed particle size of quartz, a is the intercept, and k is the slope.
From Figure 6, when Ecs is 2.5 kWh/t, k = 0.58. When Ecs is 1.0 kWh/t, k = 0.49. When Ecs is 0.25 kWh/t, k = 0.14. This indicates that the smaller the Ecs, the lower the slope of the linear relationship between the t10 value reflecting the degree of crushing and feed particle size, and the weaker the impact of feed particle size.

3.2. Impact Resistance Characteristics of Pyrrhotite and Particle Size Characteristics of Its Impact Crushing Products

3.2.1. Analysis Results of the Particle Size Composition of Impact Crushing Products Obtained by the JK Drop Weight Test

The test results of five particle sizes of pyrrhotite, namely −63 + 53 mm, −45 + 37.5 mm, −31.5 + 26.5 mm, −22.4 + 19 mm, and −16 + 13.2 mm, are shown in Figure 7.
As can be seen from Figure 7, the shape, trend, and variation rules of the product particle size distribution characteristic curves obtained from pyrrhotite under the impact of different Ecs are consistent with those of quartz. Looking at the original data in Figure 7, it can be seen that among the crushing products of pyrrhotite with five feed particle sizes, the maximum yield of the −0.106 mm particle size was 17.93% and the minimum was 1.35%. The maximum yield of the −0.038 mm particle size was 12.83%, and the minimum was 0.91%. The maximum yield of the −0.106 + 0.038 mm particle size was 5.34%, and the minimum was 0.44%. The above cumulative yield values are significantly higher than those of quartz, indicating that pyrrhotite is more easily broken than quartz and generates more fine particle sizes.
In summary, the drop weight test of pyrrhotite shows that the higher the Ecs, the finer the particle size of the crushing product. When Ecs is the same, the smaller the feed particle size, the finer the particle size of the crushing product. Therefore, the degree of mineral fragmentation is determined by both Ecs and feed particle size, and the coarse particle size is generated to a significantly greater extent under impact than the fine particle size.

3.2.2. Particle Energy Relationship Equation for Impact Crushing of Pyrrhotite

According to the same method in Section 3.1.2, regression analysis results of the impact crushing particle size distribution characteristic curve of pyrrhotite were obtained and are shown in Table 7. The value of t10 and its corresponding Ecs are fitted and analyzed to obtain the impact crushing characteristic parameters A and b of pyrrhotite. The fitting curves are shown in Figure 8, and the fitting results are listed in Table 8.
Combining Table 4 and Table 8, pyrrhotite can be judged to have “soft” impact crushing ability, indicating that it is easily crushed under impact. Compared to quartz, pyrrhotite has a lower level of impact crushing resistance. By substituting the values of A and b into Equation (2), the particle energy relationship equation for the impact crushing of pyrrhotite can be obtained, as shown in Equation (5).
t 10 = 76.5986   ×   [ 1 exp ( 1.5858 E cs ) ]

3.2.3. Variation Characteristics and Influencing Factors of the Yield of Coarse and Fine Particle Sizes of Crushed Products

Using the same processing method as in Section 3.1.3, the particle size composition distributions of the +0.106 mm coarse particle size and the −0.106 mm fine particle size in each crushed product under different impact crushing energies and different feed particle sizes were calculated for pyrrhotite, and the results are shown in Figure 9 and Figure 10, respectively.
According to the particle size distribution of the impact crushing of pyrrhotite, its impact crushing products are distributed in all particle sizes screened. The yield of each particle size of +0.106 mm is significantly higher than that of each particle size of −0.106 mm, indicating that the impact action mainly produces particle sizes of +0.106 mm. For particle sizes of +0.106 mm, the higher the Ecs and the smaller the feed particle size, the more the distribution curve shifts to the upper left corner and the greater the degree of the fragmentation of pyrrhotite. For particle sizes of −0.106 mm, the higher the Ecs, the greater the cumulative yield under the sieve, though the effect of feed particle size on it has no fixed regularity. As with quartz, 1.0 kWh/t can also be determined as the critical Ecs for the impact crushing of pyrrhotite.
It can also be seen from Figure 9 and Figure 10 that pyrrhotite is more susceptible to impact crushing than quartz. With the same feeding particle size and the same Ecs, the cumulative yield under the sieve of pyrrhotite is greater. This indicates that the particle size distribution of the crushing product is closely related to the impact energy and the properties of the mineral itself.

3.2.4. Effect of Ecs on the Particle Size of Crushed Products

According to Equation (5) from Section 3.2.2, it is possible to estimate the crushing degree of pyrrhotite under any Ecs condition. According to the principle that a crushing test under the same Ecs condition should have no less than three feed particle sizes, the results in Table 7 are plotted as a scatter plot of feed particle size and t10 values, and the results are shown in Figure 11.
As can be seen from Figure 11, under the same Ecs condition, feed particle size and t10 have a linear correlation.
By fitting the results in Figure 11, the functional relationship between the t10 of pyrrhotite and feed particle size is shown in Equation (6) with a specific crushing energy of 2.5 kWh/t.
t 10 = 58.90 + 0.97   ×   D i
When Ecs is 1.0 kWh/t or 0.26 kWh/t, a functional relationship similar to Equation (6) can also be obtained. Comparing Figure 11 with Figure 6, it can be seen that the slope of the straight fitting line for quartz and pyrrhotite varies greatly. The overall slope of quartz is positive, while the slope of pyrrhotite is negative when the Ecs is 0.26 kWh/t. This indicates that the influence of Ecs on pyrrhotite is greater than that of quartz. For this purpose, the t10 ratios of pyrrhotite particle size at different Ecs are calculated, and the results are shown in Figure 12.
According to Figure 12, the linear relationship between the t10 ratio of the crushing product of each feed particle level and feed particle size can be obtained under two Ecs conditions. The functional relationship is shown in Equation (7).
W = 1.45 + 0.04   ×   D i
where W is the ratio of crushing product t10 under different Ecs and Di is the feed particle size of the pyrrhotite in mm.
Using Equation (7), when the t10 value of a given particle size of pyrrhotite is known, the t10 value of this particle size under other Ecs can be obtained to determine its degree of fragmentation.

3.3. Impact Resistance Characteristics of Pyrite and Particle Size Characteristics of Its Impact Crushing Products

3.3.1. Analysis Results of the Particle Size Composition of Impact Crushing Products Obtained by the SMC Drop Weight Test

The principle of the SMC drop weight test for pyrite is the same as for the JK drop weight test, but it requires smaller sample particle sizes and relatively less testing workload. In this test, five groups of −22.4 + 19 mm pyrite were selected and subjected to a single impact crushing test on a drop weight tester. The test results are shown in Table 9.
Table 9 shows that the quality of the five groups of test samples is generally stable, and the total mass of each group of particles is basically close. Under the same particle size of impact crushing feed, different Ecs can be obtained by changing the mass and height of the drop weight. As the Ecs increases, the larger the t10 value becomes and the finer the crushing product.

3.3.2. Particle Energy Relationship Equation for Impact Crushing of Pyrite

Based on the SMC drop weight test results for pyrite, combined with the functional relationship of t10-Ecs, the impact crushing characteristic parameters A and b of pyrite are obtained using the origin function fitting mathematical method. The results are shown in Figure 13 and Table 10, respectively.
As can be seen from Figure 13, the higher the Ecs, the greater the t10 value, indicating that the degree of pyrite fragmentation is closely related to the size of Ecs. With the increase in Ecs, the growth rate of the t10 value changes from fast to slow. When Ecs is low, the t10 value increases faster. As Ecs gradually increases, the growth rate of the t10 value of the crushing product slows down. This indicates that there is a crushing limit for pyrite under impact energy, and the value of t10 tends to be constant. According to Table 4 of JKMRC ore impact crushing capacity, it is known that the impact crushing capacity of pyrite belongs to the “very soft” grade, indicating that impact action has a good crushing effect on pyrite.

3.3.3. Variation Characteristics and Influencing Factors of the Yield of Coarse and Fine Particle Sizes of Crushed Products

As can be seen from Figure 13, the higher the Ecs, the greater the degree of pyrite fragmentation and the greater the t10 value. Comparing Figure 3, Figure 8 and Figure 13, it is found that the concavity and convexity of the particle energy equation curves of the three minerals differ greatly. This indicates that for the three minerals, the impact of Ecs on the t10 value of each mineral is different, with pyrite demonstrating the most significant impact. At a lower stage of Ecs, increasing the same Ecs results in a significant change in the t10 value of pyrite. However, the crushing effect of pyrite is no longer significantly increased by continually increasing Ecs. This also means that there should be a crushing limit if only impact crushing is used.

3.4. Study on the Consistency Relationship of the Crushing Characteristics of Three Minerals Based on Different Indicators

As shown in Section 3.1, Section 3.2 and Section 3.3, the particle size composition characteristics, particle energy relationship equations, and related crushing characteristics of the three minerals were obtained based on the results of the drop weight tests of quartz, pyrrhotite, and pyrite. Due to the differences in the properties of these three minerals, this section attempts to analyze their falling weight test results and crushing characteristics with the hope of obtaining the relationship between their impact crushing characteristics and the physical properties of these three minerals.
Firstly, the results of the drop weight tests and the basic properties of the three mineral samples are summarized in Table 11. The limit value of t10 in the last column in Table 11 can be obtained from the particle energy relationship equation of the three minerals, and its value actually corresponds to the value A, which is t10 corresponding to the asymptotic line of the particle energy relationship equation curve.
As can be seen from Table 11, there are differences in the Mohs hardness and relative density of the three minerals. Their impact crushing parameters (A, b), impact crushing resistance levels, and the limit value for t10 of the characteristic crushing particles are different, but there is a certain correlation between them. Specifically, for quartz, the Mohs hardness of quartz is known to be 7.0, with the highest hardness value among the three minerals. According to the results of the impact crushing test using the drop weight test, its impact crushing resistance parameter value is the smallest, and its impact crushing resistance level belongs to “medium soft”. The associated limit value for t10 is also the smallest. These characterization results are in good agreement with each other, reflecting that quartz is the most difficult mineral to impact break among the three minerals. As for pyrrhotite, it has the lowest Mohs hardness and the highest limit value for t10. From these two indicators, it should be the mineral that is most prone to impact crushing. However, its impact crushing resistance parameter is shown as 121.47, which is very close to the boundary value for “soft” and “very soft”, which is 28 less than the impact resistance parameter value of pyrite. According to the drop weight method, it does not belong to the minerals that are most easily crushed by impact. Therefore, the characterization results for various indicators of pyrrhotite are inconsistent. As for pyrite, its Mohs hardness is only slightly lower than that of quartz, but its impact crushing resistance level is two grades lower than that of quartz. Therefore, the impact crushing ability of the three minerals is characterized by Mohs hardness, impact resistance parameters, impact crushing resistance level, and the limit value of t10, and the results are not entirely consistent. Of course, this may be related to differences in the purity of the three minerals and inconsistency in the drop weight test methods used for the three minerals.
In order to further increase the comparability of the test results, considering that the three minerals had undergone a drop weight test with a feed particle size of −22.4 + 19 mm, their crushing test results under the feed particle size condition were compared, and the results are shown in Figure 14.
As can be seen from Figure 14, when Ecs is 1.0 or 2.5 kWh/t, the order of the t10 values of the three minerals is pyrrhotite > pyrite > quartz. When Ecs is about 0.25 kWh/t, the order of the t10 values of the three minerals is pyrite > pyrrhotite > quartz. When Ecs decreases, the order of pyrite and pyrrhotite changes. This may be related to the low purity of pyrrhotite. When sample purity is low, there are multiple mineral binding interfaces that can reduce the impact crushing resistance ability of an ore sample. Moreover, theoretically, the greater the Ecs, the smaller the impact mineral purity should have on impact crushing resistance ability. Based on the above analysis, it can be considered that the ranking results for t10 at Ecs of 1.0 and 2.5 kWh/t can better reflect the differences in mineral properties. Therefore, the impact crushing resistance ability of the three minerals should be pyrrhotite > pyrite > quartz. This is consistent with ranking results based on Mohs hardness results.

4. Conclusions

The following conclusions were drawn from this research:
(1)
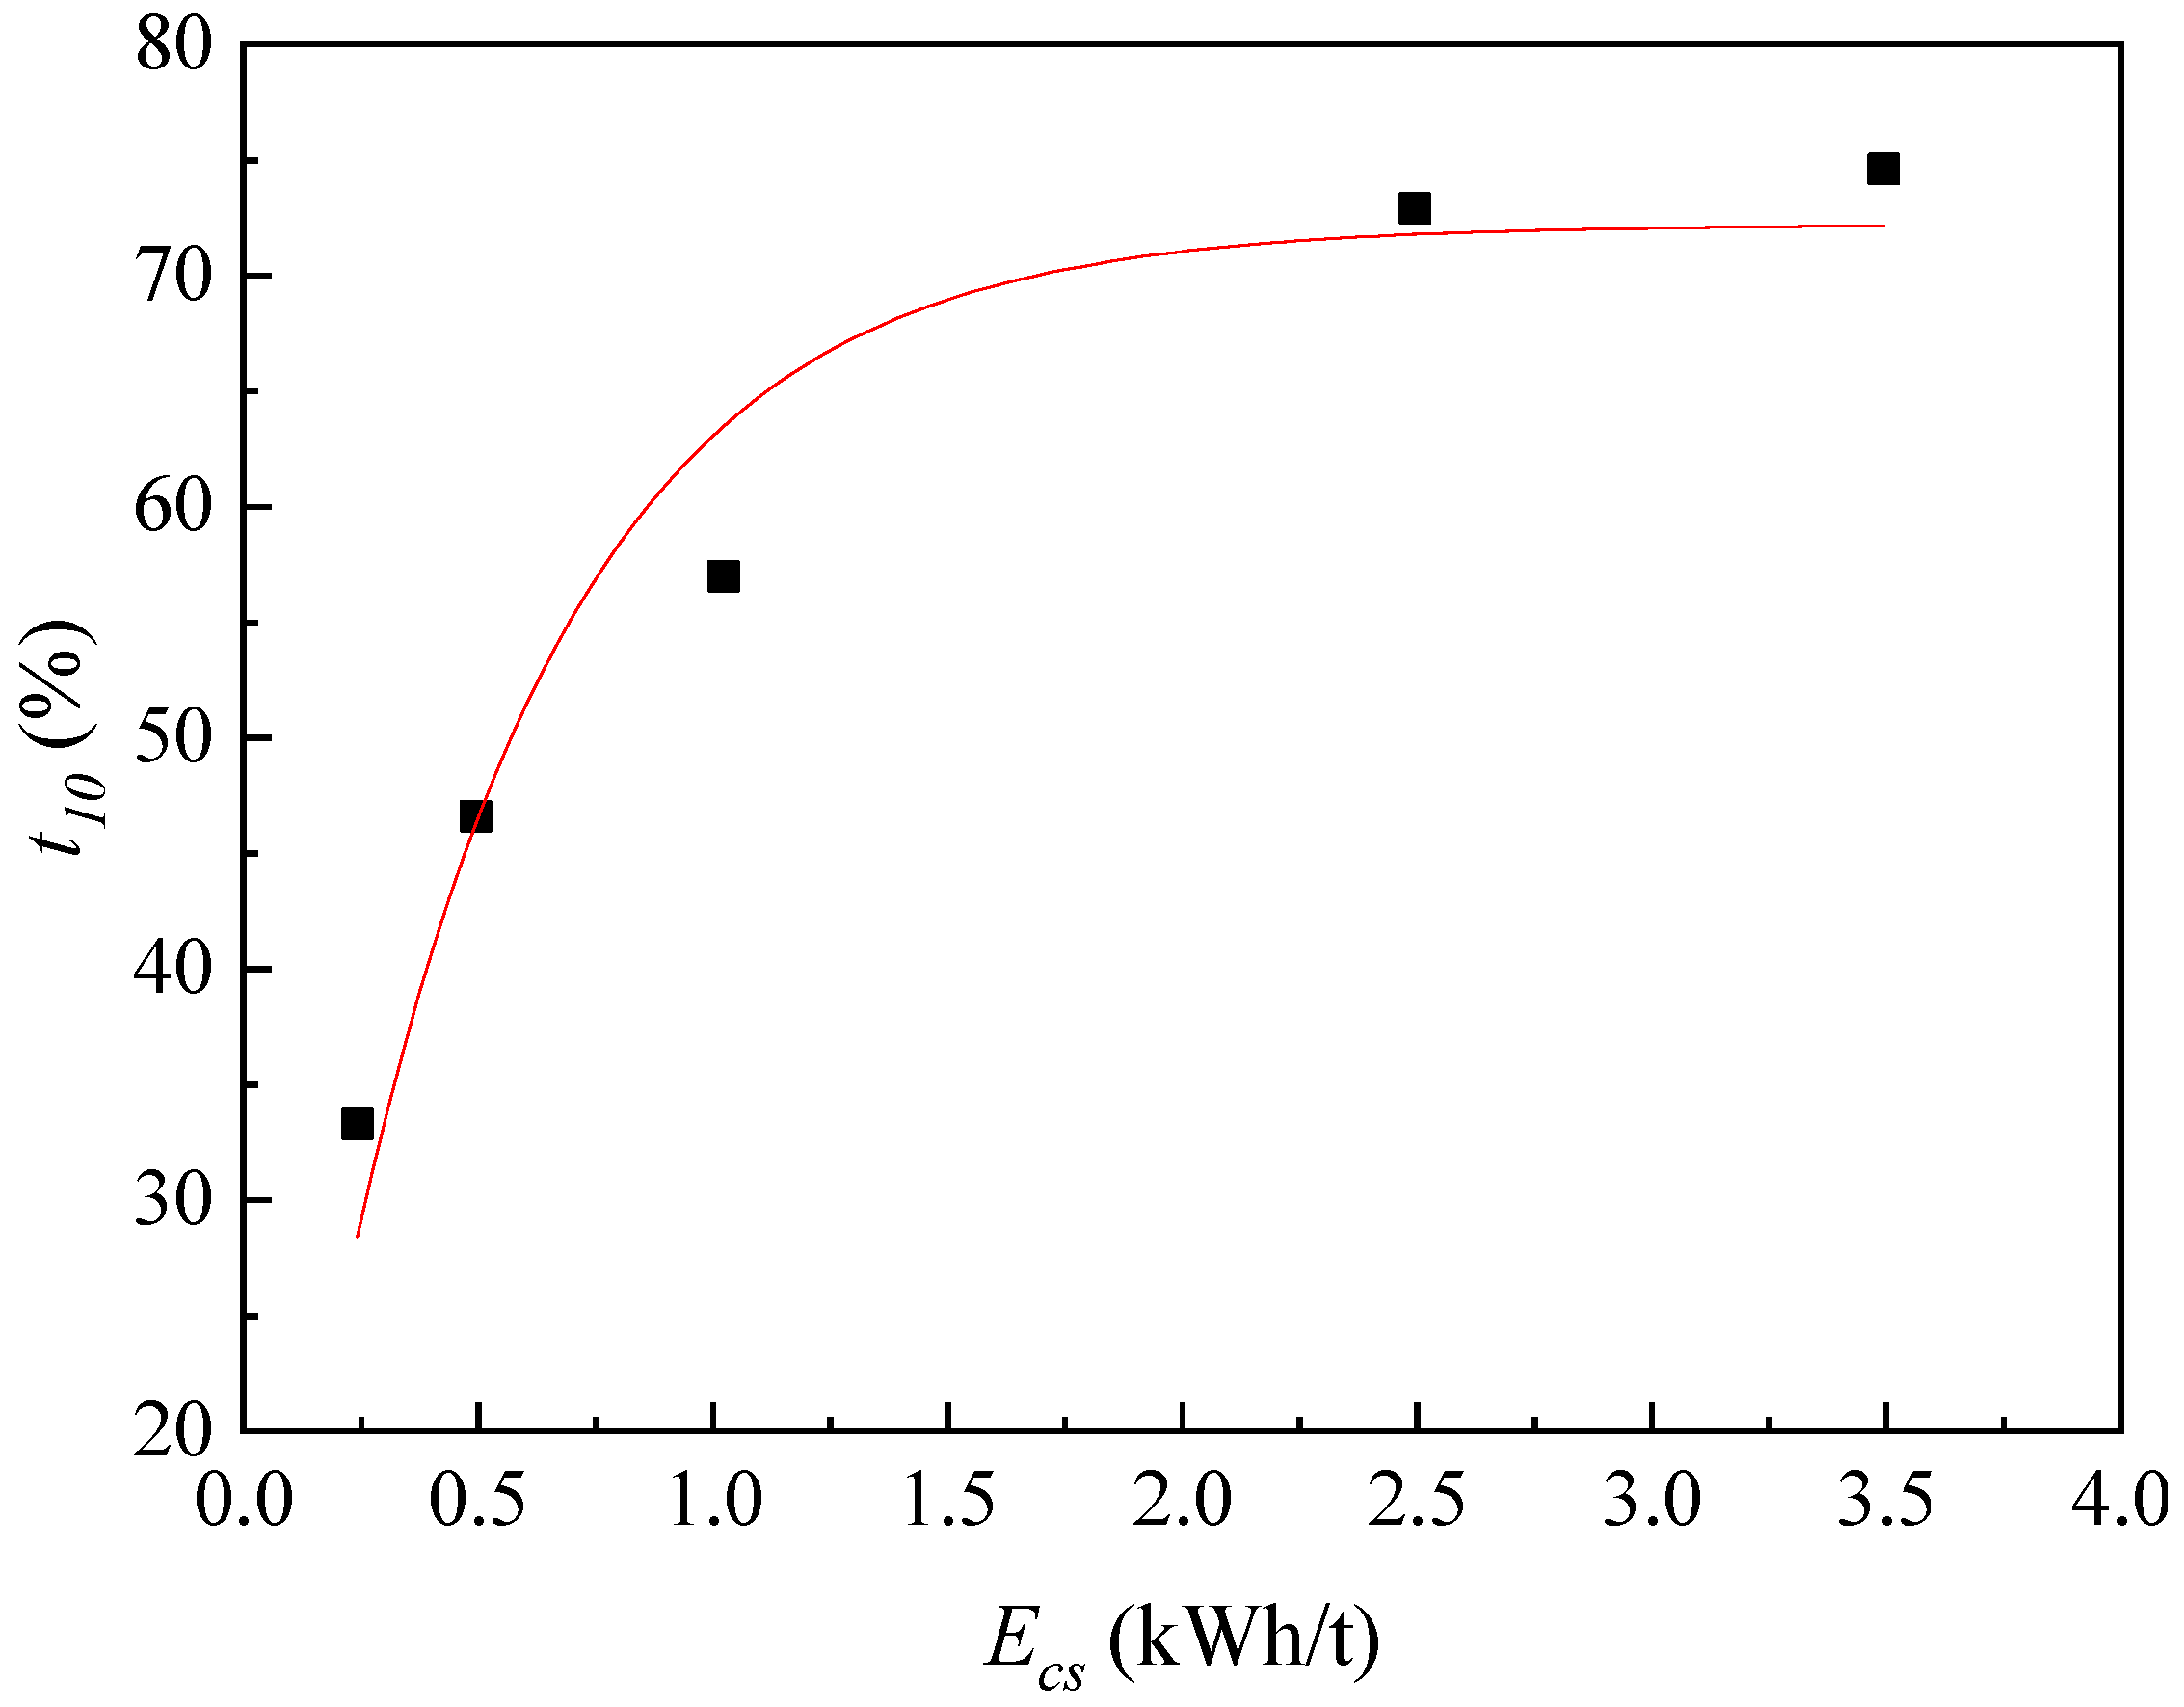
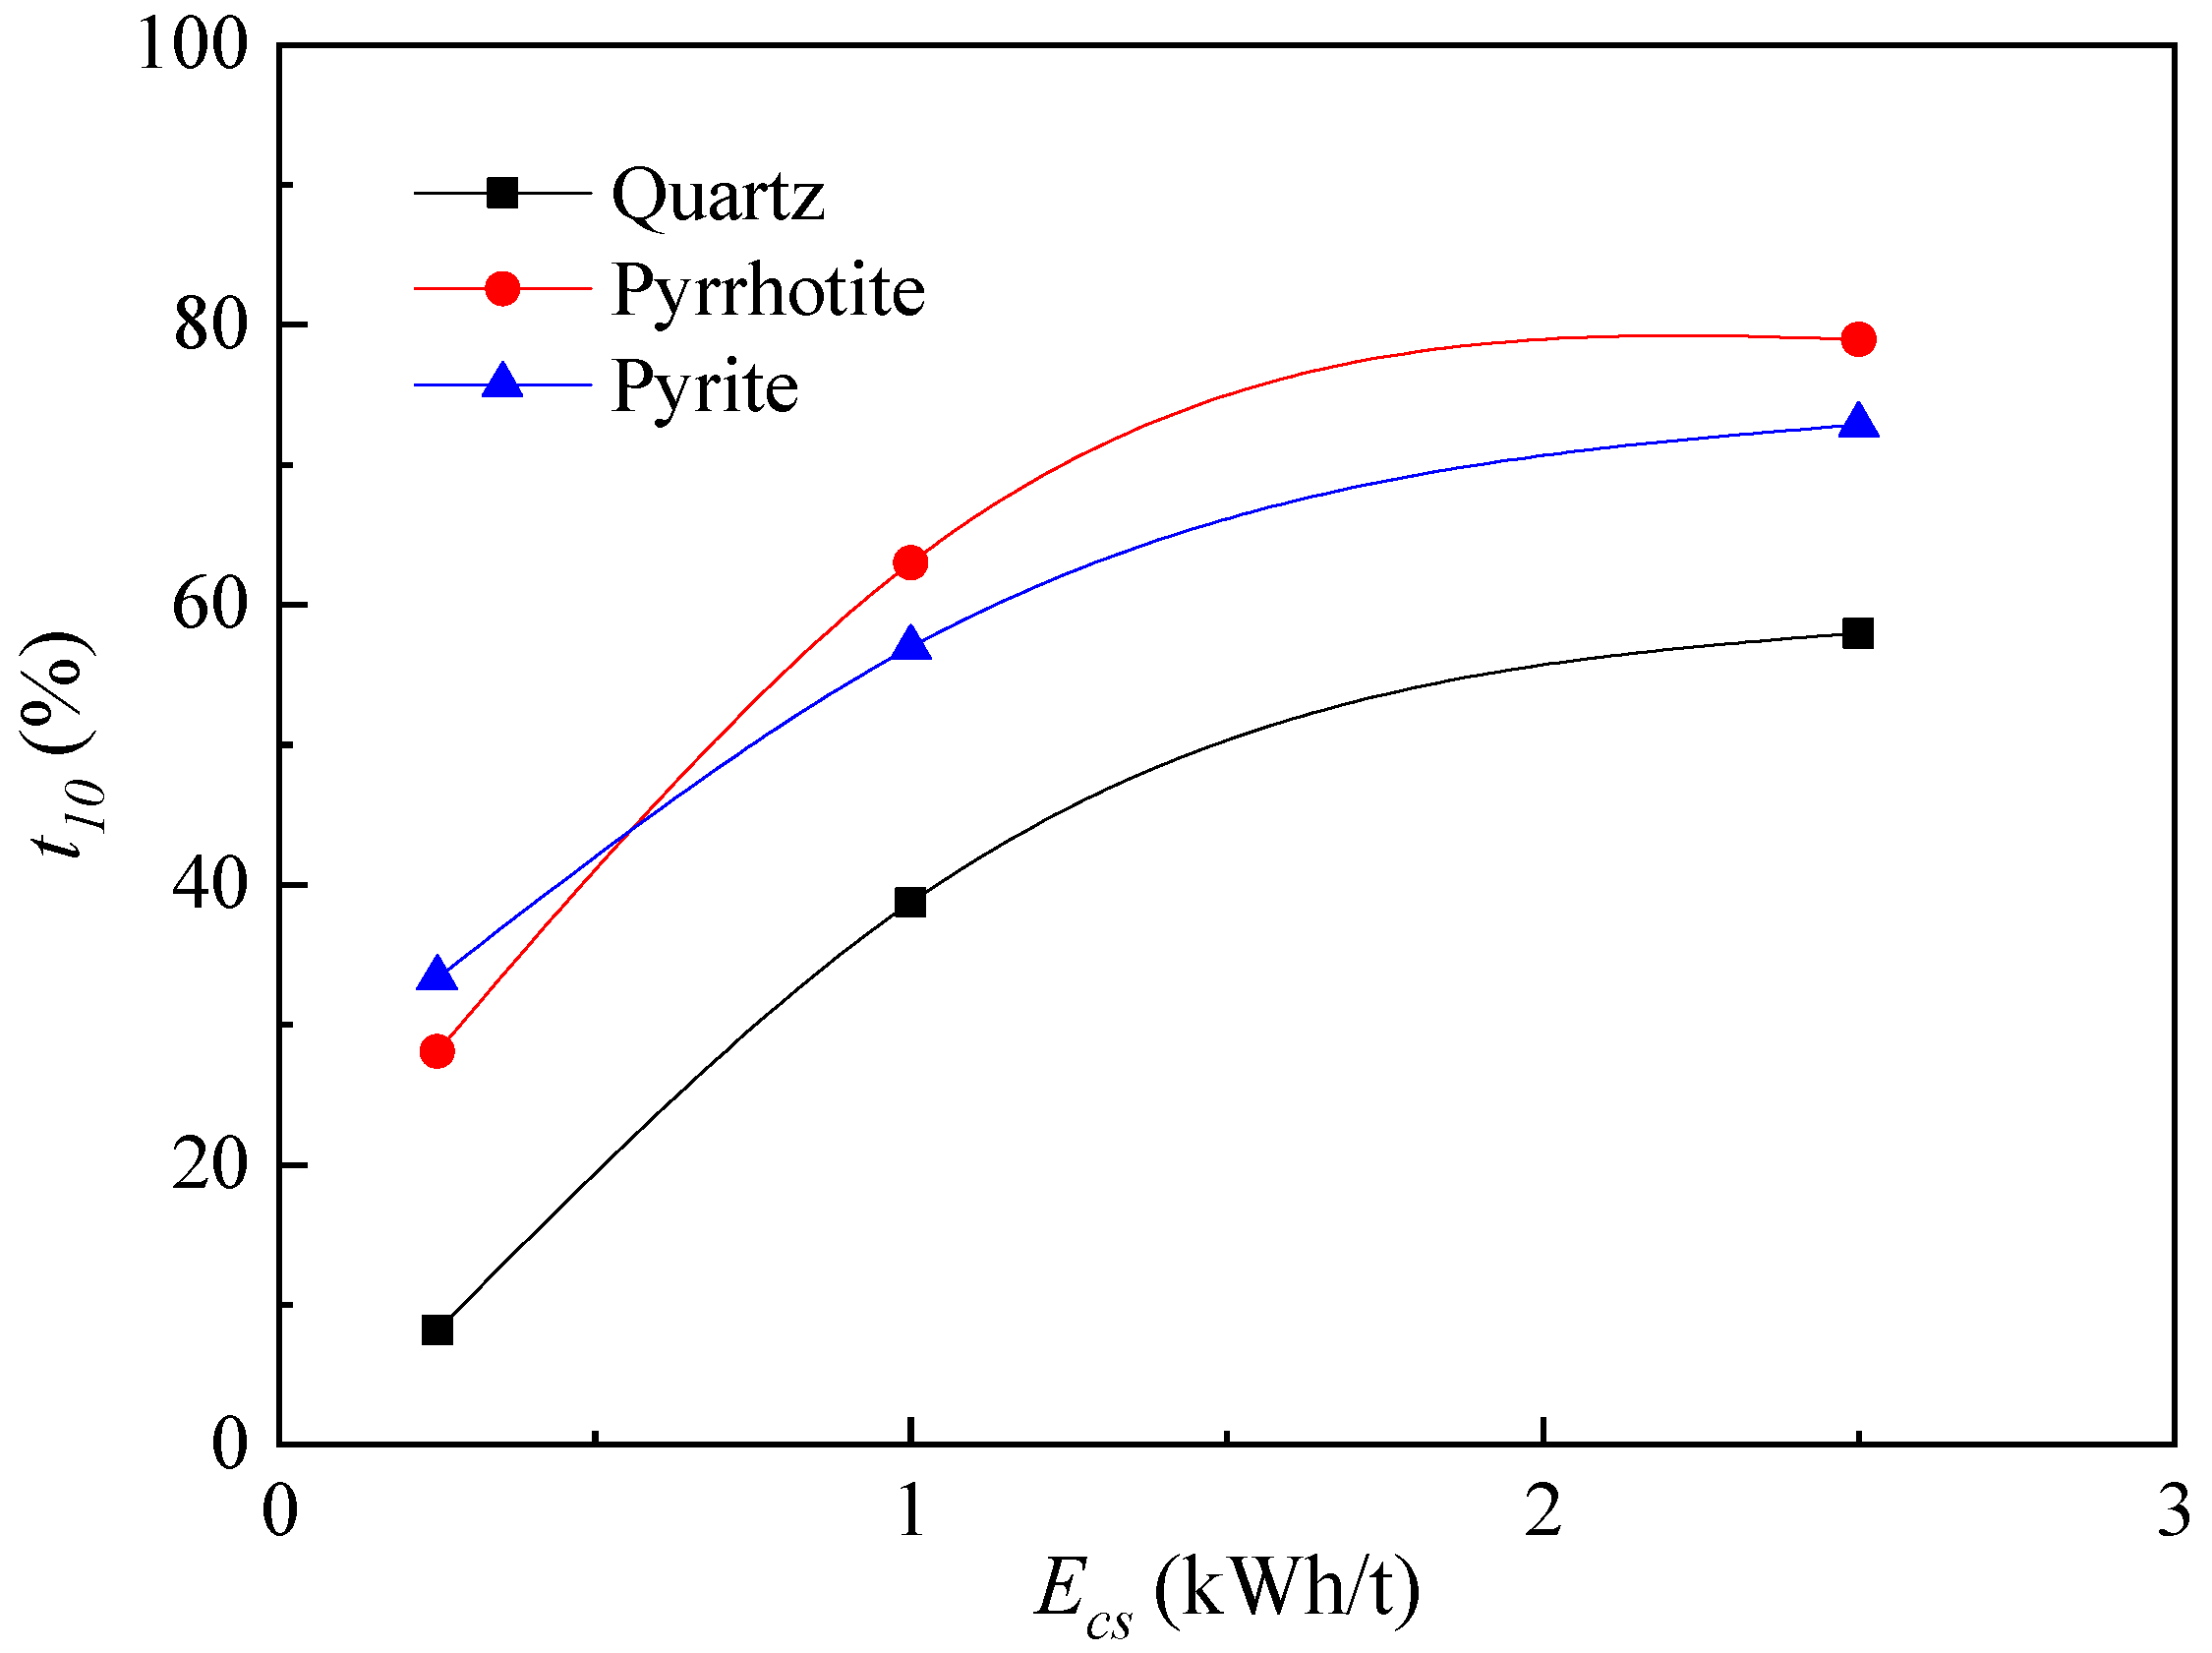
The impact crushing characteristic parameters of quartz, pyrrhotite, and pyrite, as well as the particle energy relationship equation characterizing the crushing process, were obtained through the drop weight test. The particle energy relationship equation for quartz is t10 = 67.335 × [1 − exp(−0.8334 × Ecs)]. The particle energy relationship equation for pyrrhotite is t10 = 76.60 × [1 − exp(−1.59 × Ecs)]. The particle energy relationship equation for pyrite is t10 = 72.19 × [1 − exp(−2.07 × Ecs)]. Based on this research result, the impact crushing degree of three mineral samples under arbitrary Ecs conditions can be calculated.
(2)
The particle size distribution of the impact crushing products of quartz, pyrrhotite, and pyrite samples is very wide, covering all particle sizes from “0” to close to the feed particle size. However, the yield of the +0.106 mm particle size was significantly higher than the yield of the −0.106 mm particle size. This indicates that impact action has a significant contribution to the formation of +0.106 mm particle size products in the crushed products.
(3)
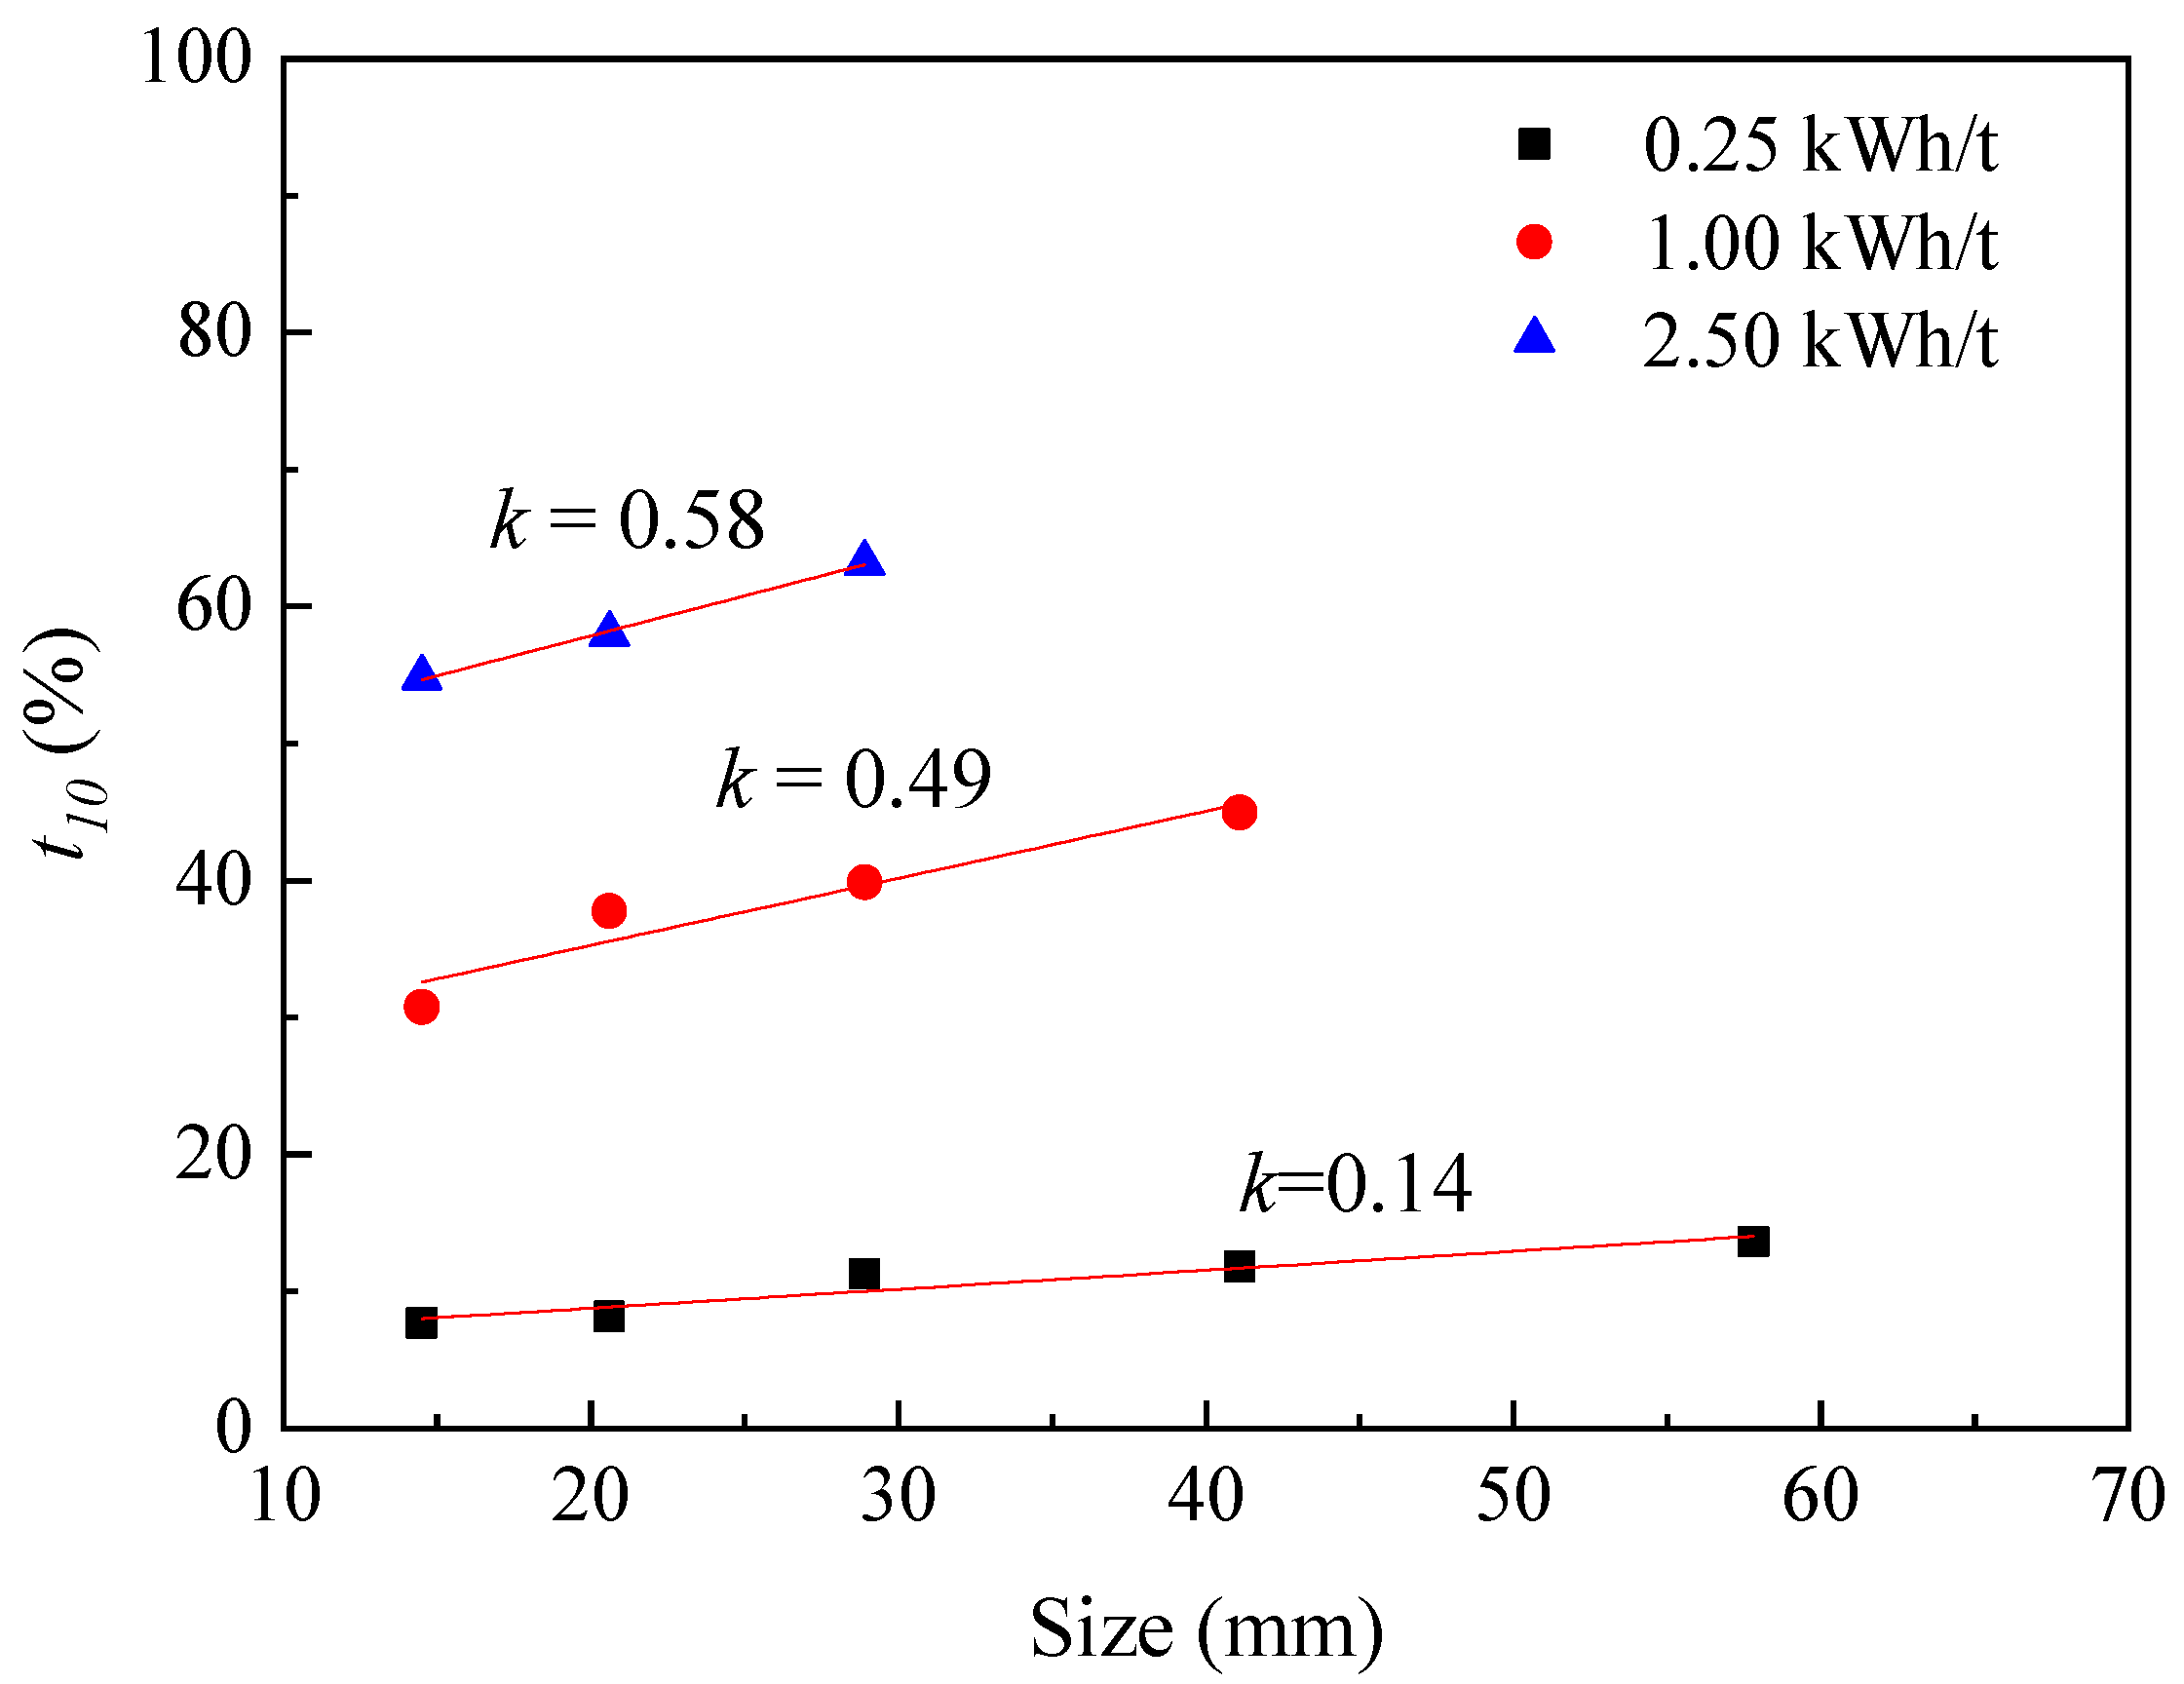
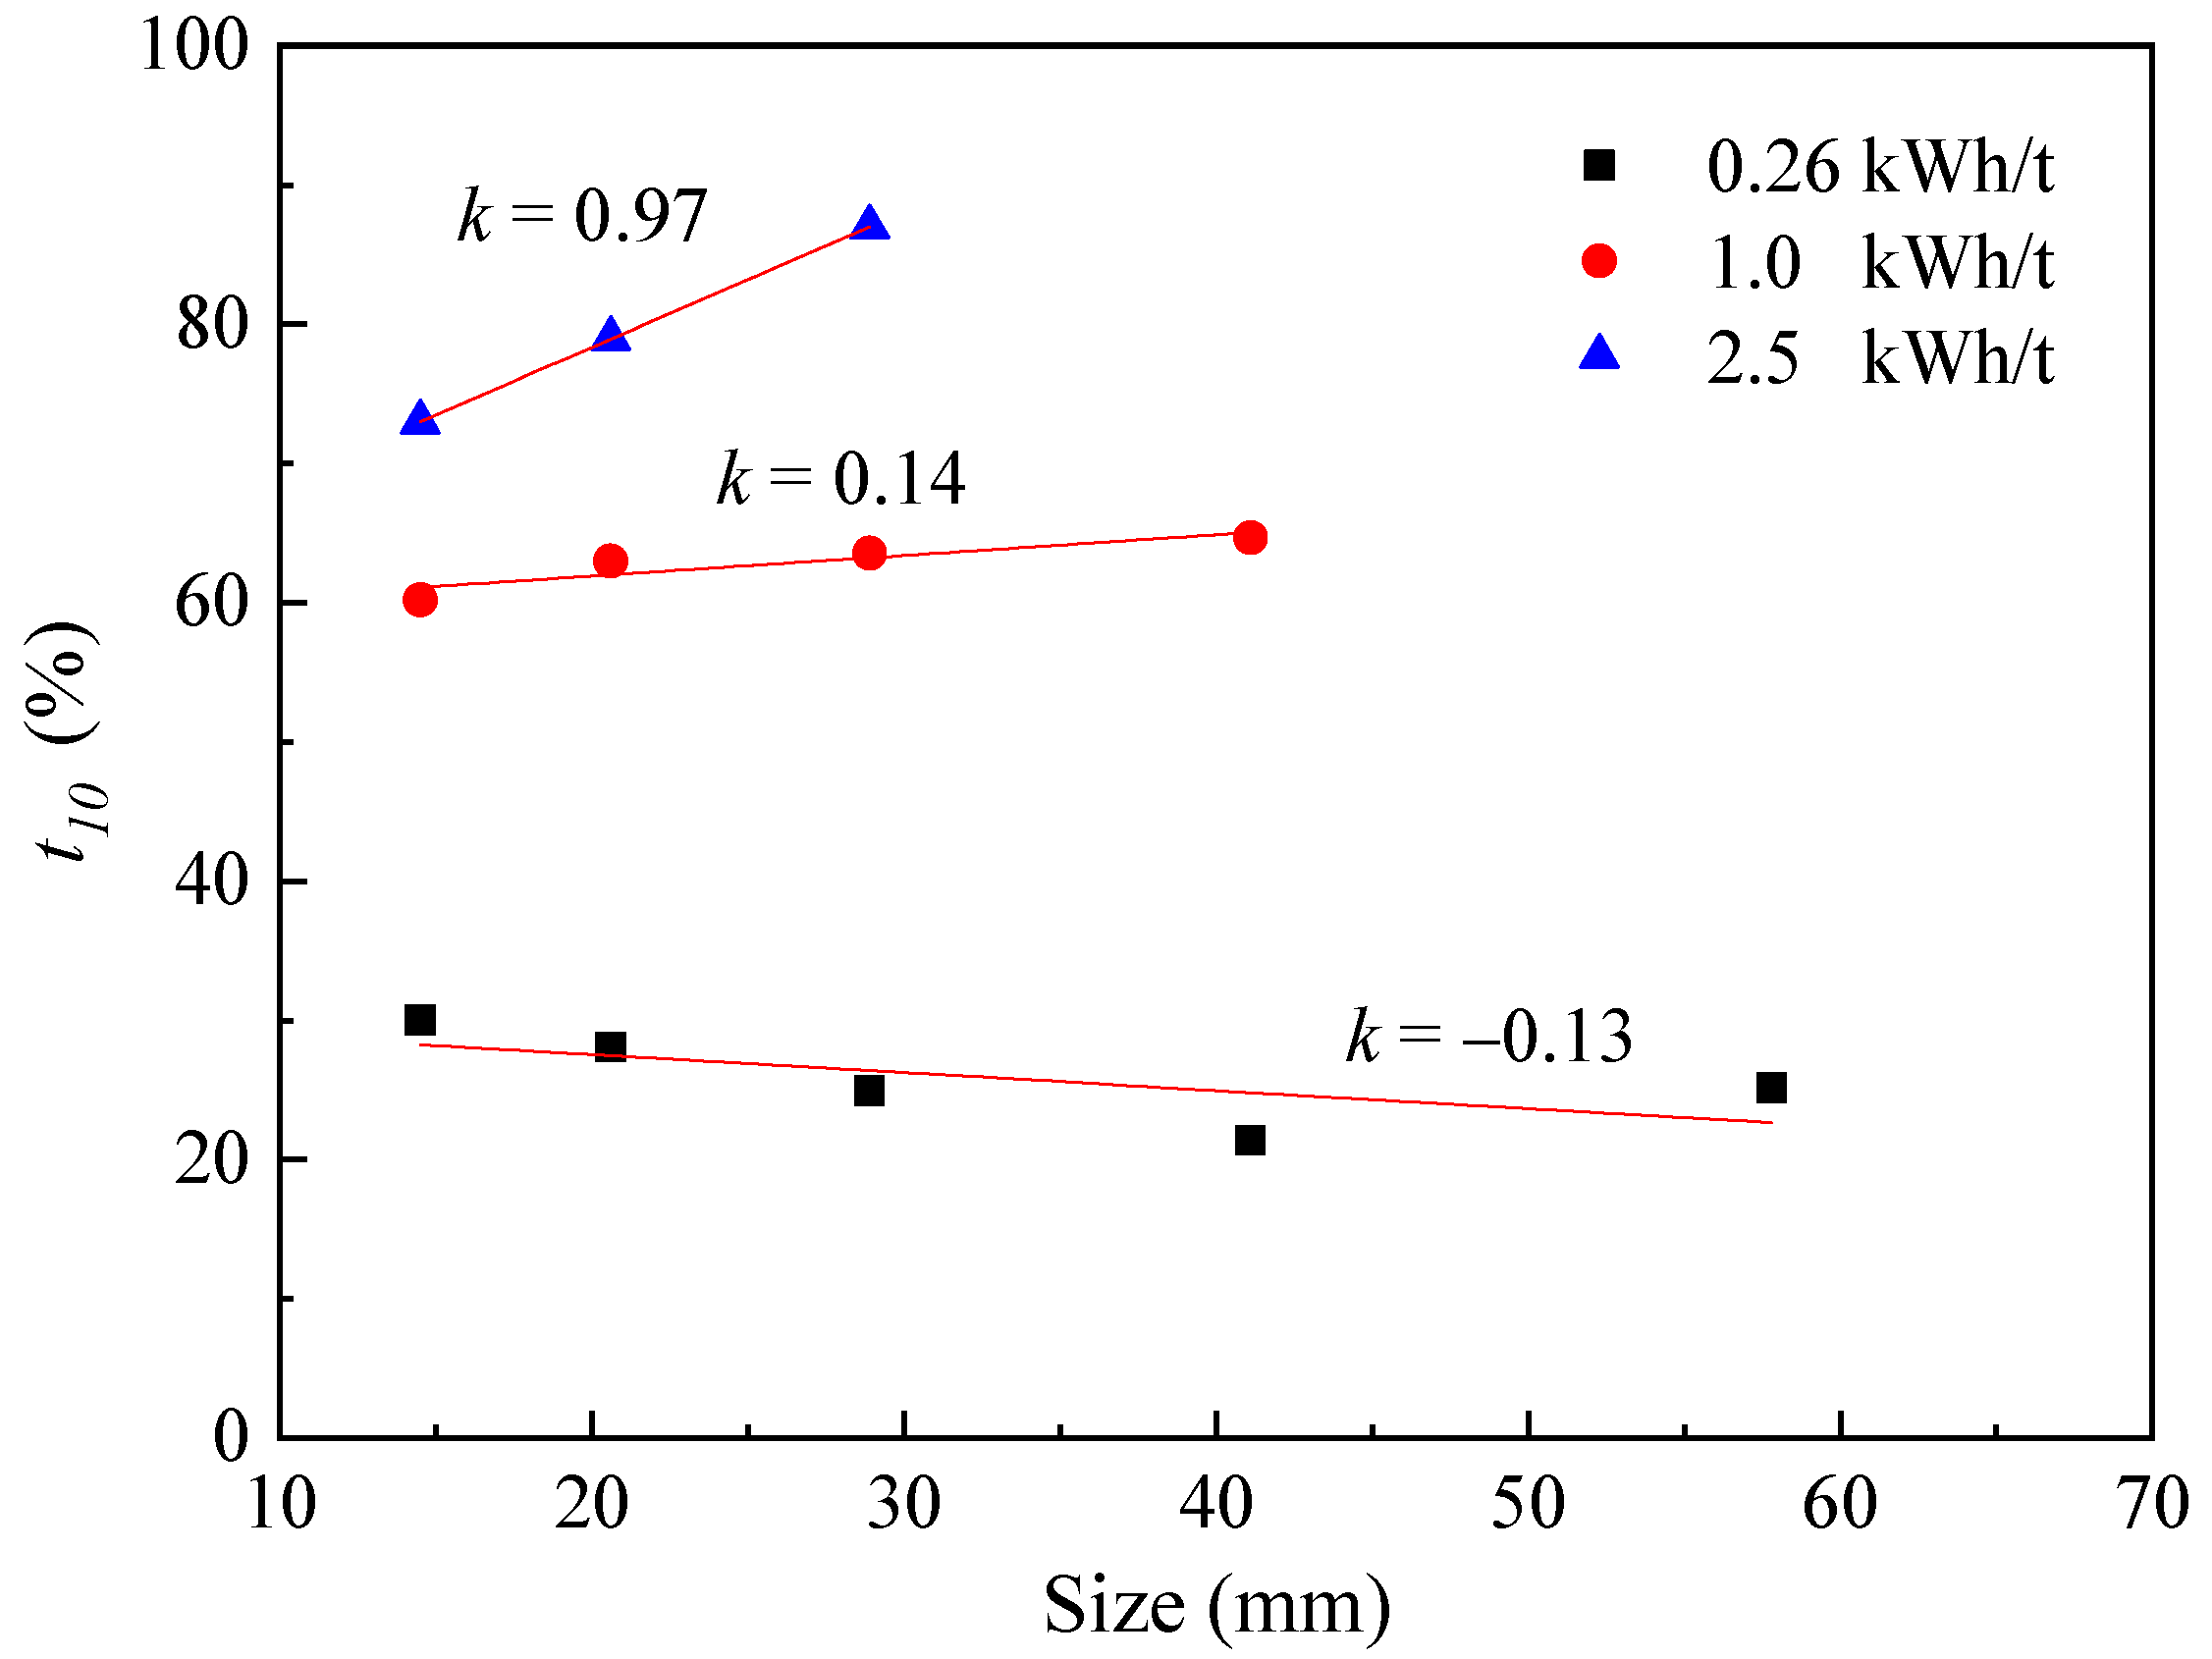
Ecs has a significant impact on the particle size distribution and crushing effect of the crushing product and has an interactive impact on the feed particle size and mineral species. Overall, with increases in Ecs, the crushing effect of mineral samples increases. Moreover, there is a critical Ecs in impact crushing. Under the conditions of this study, the critical Ecs is 1.0 kWh/t. When Ecs > 1.0 kWh/t, t10 increases with the increase in Ecs and decreases with the increase in feed particle size. When Ecs < 1.0 kWh/t, t10 increases with the increase in Ecs, independent of feed particle size.
(4)
Based on the above analysis, it can be seen that for quartz and pyrite samples with high purity, when using Mohs hardness, impact resistance parameters, impact crushing resistance level, and the limit value of t10 to characterize impact crushing resistance ability, the ranking results of the two minerals are completely consistent. Compared with pyrite, pyrrhotite has a variety of mineral binding interfaces due to its low purity. When using Mohs hardness, impact resistance parameters, impact crushing resistance level, and the limit value of t10 to characterize impact crushing resistance ability, the ranking results of the two are not completely consistent. When Ecs is higher, the impact of mineral purity decreases, and the results of various characterization methods tend to be consistent.

Author Contributions

Conceptualization, J.Y. and S.M.; data curation, X.Y. and H.L.; formal analysis, X.D. and W.X.; funding acquisition, S.M.; investigation, H.L. and X.Y.; methodology, J.Y. and S.M.; project administration, J.Y. and S.M.; validation, H.L. and X.Y.; writing—original draft, H.L. and J.Y.; writing—review and editing, J.Y. and S.M. All authors have read and agreed to the published version of the manuscript.

Funding

This research was funded by the National Natural Science Foundation of China (No. 52274258, No. 51874105).

Data Availability Statement

Not applicable.

Conflicts of Interest

The authors declare no conflict of interest.

References

  1. Park, J.; Kim, K. Use of drilling performance to improve rock-breakage efficiencies: A part of mine-to-mill optimization studies in a hard-rock mine. Int. J. Min. Sci. Technol. 2020, 30, 179–188. [Google Scholar] [CrossRef]
  2. Wang, Z.W.; Liu, Q.S. Failure criterion for soft rocks considering intermediate principal stress. Int. J. Min. Sci. Technol. 2021, 31, 565–575. [Google Scholar] [CrossRef]
  3. Camalan, M. Correlating common breakage modes with impact breakage and ball milling of cement clinker and chromite. Int. J. Min. Sci. Technol. 2020, 30, 901–908. [Google Scholar] [CrossRef]
  4. Gao, P.; Zhou, W.T.; Han, Y.X.; Li, Y.J.; Ren, W.L. Enhancing the capacity of large-scale ball mill through process and equipment optimization: An industrial test verification. Adv. Powder Technol. 2020, 31, 2079–2091. [Google Scholar] [CrossRef]
  5. Chen, B.C. Grinding Principle. Met. Ind. Press. 1989, 1, 181–252. (In Chinese) [Google Scholar]
  6. Liu, J.; Long, H.; Corin, K.C.; O’Connor, C.T. A study of the effect of grinding environment on the flotation of two copper sulphide ores. Miner. Eng. 2018, 122, 339–345. [Google Scholar] [CrossRef]
  7. Rabieh, A.; Eksteen, J.; Albijanic, B. Galvanic interaction of grinding media with arsenopyrite and pyrite and its effect on gold cyanide leaching. Miner. Eng. 2018, 116, 46–55. [Google Scholar] [CrossRef]
  8. Xiao, X.; Zhang, G.; Feng, Q.; Xiao, S.; Huang, L.; Zhao, X.; Li, Z. The liberation effect of magnetite fine ground by vertical stirred mill and ball mill. Miner. Eng. 2012, 34, 63–69. [Google Scholar] [CrossRef]
  9. Henckens, M.L.C.M.; van Ierland, E.C.; Driessen, P.P.J.; Worrell, E. Mineral resources: Geological scarcity, market price trends, and future generations. Resour. Policy 2016, 49, 102–111. [Google Scholar] [CrossRef]
  10. Gorman, M.R.; Dzombak, D.A. A Review of sustainable mining and resource nanagement: Transitioning from the life cycle of the mine to the life cycle of the mineral. Resour. Conserv. Recycl. 2018, 137, 281–291. [Google Scholar] [CrossRef]
  11. Chen, Y.M.; Li, H.; Feng, D.X.; Tong, X.; Hu, S.X.; Yang, F.; Wang, G.C. A recipe of surfactant for the flotation of fine cassiterite particles. Miner. Eng. 2021, 160, 106658. [Google Scholar] [CrossRef]
  12. Huang, K.Q.; Xiao, C.H.; Wu, Q.M. Application of accurate ball-load-addition method in grinding production of some tailings. Adv. Mat. Res. 2014, 962, 771–774. [Google Scholar] [CrossRef]
  13. Kotake, N.; Kuboki, M.; Kiya, S.; Kanda, Y. Influence of dry and wet grinding conditions on fineness and shape of particle size distribution of product in a ball mill. Adv. Powder Technol. 2011, 22, 86–924. [Google Scholar] [CrossRef]
  14. Peng, Y.; Grano, S. Effect of iron contamination from grinding media on the flotation of sulphide minerals of different particle size. Int. J. Miner. Process. 2010, 97, 1–6. [Google Scholar] [CrossRef]
  15. Woywadt, C. Grinding process optimization-featuring case studies and operating results of the modular vertical roller mill. In Proceedings of the 2017 IEEE-IAS/PCA Cement Industry Technical Conference, Calgary, AB, Canada, 21–25 May 2017. [Google Scholar]
  16. Hfels, C.; Dambach, R.; Kwade, A. Geometry influence on optimized operation of a dry agitator bead mill. Miner. Eng. 2021, 171, 107050. [Google Scholar] [CrossRef]
  17. Santosh, T.; Soni, R.K.; Eswaraiah, C.; Rao, D.S.; Venugopal, R. Optimization of stirred mill parameters for fine grinding of pge bearing chromite ore. Part. Sci. Technol. 2020, 39, 663–675. [Google Scholar]
  18. Ma, S.J.; Li, H.J.; Shuai, Z.C.; Yang, J.L.; Xu, W.Z.; Deng, X.J. Research on grinding characteristics and comparison of Particle-Size-Composition prediction of rich and poor ores. Minerals 2022, 12, 1354. [Google Scholar] [CrossRef]
  19. Ma, S.J.; Li, H.J.; Shuai, Z.C.; Yang, J.L.; Deng, X.J.; Xu, W.Z. Research on grinding law and grinding parameters optimization of polymetallic complex ores. Minerals 2022, 12, 1283. [Google Scholar] [CrossRef]
  20. Guo, W.; Han, Y.X.; Gao, P.; Li, Y.J.; Tang, Z.D. A study of the grinding of magnetite/limestone mixture in a stirred mill by the attainable region method. Powder Technol. 2021, 389, 40–47. [Google Scholar] [CrossRef]
  21. Aleksandrova, T.; Nadezhda, N.; Anastasia, A.; Artyem, R.; Valentin, K. Selective disintegration justification based on the mineralogical and technological features of the polymetallic ores. Minerals 2021, 11, 851. [Google Scholar] [CrossRef]
  22. Gao, M.W.; Forssberg, E. Prediction of product size distributions for a stirred ball mill. Powder Technol. 1995, 84, 101–106. [Google Scholar] [CrossRef]
  23. Yu, S.; Wu, C.Y.; Adams, M.J.; Reynolds, G.; Gururajan, B.; Gargiuli, J.; Leadbeater, T.; Roberts, R.; Parker, D.J. The use of positron emission particle tracking (PEPT) to study milling of roll-compacted microcrystalline cellulose ribbons. Powder Technol. 2015, 285, 74–79. [Google Scholar] [CrossRef]
  24. Venkataraman, K.S.; Narayanan, K.S. Energetics of collision between grinding media in ball mills and mechanochemical effects. Powder Technol. 1998, 96, 190–201. [Google Scholar] [CrossRef]
  25. Alexander, R.; Stefan, S.; Marco, M. Modeling and measurement of abraded particles. Powder Technol. 2015, 217, 134–140. [Google Scholar]
  26. Zeng, S.Q.; Zhang, X.L.; Cao, S.M. Overview of bauxite selective dissociation in China. Adv. Mater. Res. 2013, 634, 3705–3709. [Google Scholar] [CrossRef]
  27. Petrakis, E.; Karmali, V.; Komnitsas, K. Factors affecting nickel upgrade during selective grinding of low-grade limonitic laterites. Miner. Process. Extr. Metall. 2021, 130, 192–201. [Google Scholar] [CrossRef]
  28. Ni, C.; Zhou, S.Q.; Gao, J.X. Selective comminution and grinding mechanisms of spent carbon anode from aluminum electrolysis using ball and rod mills. Physicochem. Probl. Miner. Process. 2022, 58, 145667. [Google Scholar] [CrossRef]
  29. Sun, R.G.; Gao, Y.; Yang, Y. Leaching of heavy metals from lead-zinc mine tailings and the subsequent migration and transformation characteristics in paddy soil. Chemosphere 2021, 291, 132792. [Google Scholar] [CrossRef]
  30. Leung, K. An Energy Based Ore Specific Modelfor Autogenous and Semi-Autogenous Grinding; University of Queensland (JKMRC): Indooroopilly, Australia, 1987. [Google Scholar]
  31. Napier-Munn, T.J. Mineral Comminution Circuits Their Operation and Optimization; JKMRC and the University of Queensland Publishing: Indooroopilly, Australia, 2005. [Google Scholar]
  32. Zou, Y.R.; Luo, L.F. Application of JKSimMet software in selection of semi-autogenous grinding mill. Nonferrous Metall. Equip. 2015, 1, 20–25. (In Chinese) [Google Scholar]
Figure 1. Drop weight test equipment: (a) main body; (b) plane sketch (1: drop head; 2: guide rail; 3: ore particle; 4: Perspex; 5: lifting system; 6: steel anvil; 7: foundation).
Minerals 13 00632 g001
Figure 2. Particle size distribution of breakage products for fractions of quartz: (a) −63 + 53 mm, (b) −45 + 37.5 mm, (c) −31.5 + 26.5 mm, (d) −22.4 + 19 mm, and (e) −16 + 13.2 mm.
Minerals 13 00632 g002
Figure 3. Fitting curve of the relationship between t10 and Ecs for quartz under impact crushing.
Minerals 13 00632 g003
Figure 4. Distribution figure for each size of +0.106 mm impact crushing product for quartz.
Minerals 13 00632 g004
Figure 5. Distribution figure for each size of −0.106 mm impact crushing product for quartz.
Minerals 13 00632 g005
Figure 6. Trend diagram of the crushing resistance of quartz with particle size.
Minerals 13 00632 g006
Figure 7. Particle size distribution of breakage products for fractions of pyrrhotite: (a) −63 + 53 mm, (b) −45 + 37.5 mm, (c) −31.5 + 26.5 mm, (d) −22.4 + 19 mm, (e) −16 + 13.2 mm.
Minerals 13 00632 g007
Figure 8. Fitting curve of the relationship between t10 and Ecs for pyrrhotite under impact crushing.
Minerals 13 00632 g008
Figure 9. The distribution of each size of +0.106 mm impact crushing product for pyrrhotite.
Minerals 13 00632 g009
Figure 10. The distribution of each size of −0.106 mm impact crushing product for pyrrhotite.
Minerals 13 00632 g010
Figure 11. Trend diagram of the impact crushing resistance of pyrrhotite with particle size.
Minerals 13 00632 g011
Figure 12. t10 ratio diagram for Ecs of 1.0 kWh/t and 0.26 kWh/t for pyrrhotite.
Minerals 13 00632 g012
Figure 13. Fitting curve of the relationship between t10 and Ecs for pyrite under impact crushing.
Minerals 13 00632 g013
Figure 14. Comparison of the impact crushing results of three kinds of minerals for the −22.4 + 19 mm particle size.
Minerals 13 00632 g014
Table 1. Chemical components of quartz.
ComponentSiO2Fe2O3MgOAl2O3SCaO
Content (%)99.150.490.120.0810.0650.062
ComponentMnCrNiCuZnOthers
Content (%)0.00590.00470.00380.00350.00220.0119
Table 2. Chemical components of pyrrhotite.
ComponentSiO2CaOTFeZnSPb
Content (%)29.410.1837.760.9425.940.18
ComponentAl2O3AsK2OPbOthers
Content (%)1.853.340.200.180.02
Table 3. Chemical components of pyrite.
ComponentSiO2CaOTFeSTiMgO
Content (%)1.670.1953.0743.840.200.13
ComponentCoAl2O3MgOAsK2OOthers
Content (%)0.120.480.130.110.070.43
Table 4. The relationship between experimental parameters and ore properties.
ParametersVery HardHardMedium HardMediumMedium SoftSoftVery Soft
A × b<3030~3838~4343~5656~6767~127>127
Table 5. Regression analysis results of the impact crushing particle size distribution curve of quartz.
Particle Size (mm)Nominal Particle Size (mm)Ecs (kWh/t)Fitting Coefficient (R2)t10 (%)
−63 + 5357.80.40.997924.64
0.250.997213.61
0.10.99835.20
−45 + 37.541.11.00.997944.97
0.250.998611.83
0.10.99824.99
−31.5 + 26.528.92.510.998663.16
1.00.996839.87
0.250.999411.27
−22.4 + 1920.62.470.997157.99
1.00.998138.75
0.250.99898.18
−16 + 13.214.52.50.998954.79
1.00.998530.77
0.250.99817.70
Table 6. Fitting results of t10-Ecs for quartz under impact crushing.
AbA × bFitting Coefficient (R2)Impact Crushing Resistance Level
67.33500.833456.120.968Medium Soft
Table 7. Regression analysis results of the impact crushing particle size distribution curve of pyrrhotite.
Particle Size (mm)Nominal Particle Size (mm)Ecs (kWh/t)Fitting Coefficient (R2)t10 (%)
−63 + 5357.80.380.997939.01
0.250.997225.17
0.100.998310.08
−45 + 37.541.11.010.997952.86
0.250.999221.38
0.100.998711.80
−31.5 + 26.528.92.500.998673.34
1.030.997663.54
0.250.996824.93
−22.4 + 1920.62.510.998278.96
1.000.997863.00
0.250.999328.09
−16 + 13.214.52.500.998672.99
1.000.997960.21
0.250.993430.02
Table 8. Fitting results of t10-Ecs for pyrrhotite under impact crushing.
AbA × bFitting Coefficient (R2)Impact Crushing Resistance Level
76.59861.5858121.470.979Soft
Table 9. SMC impact crushing results for pyrite.
Test Group12345
Mass of Ore Sample (g)678.51685.02683.51684.53684.52
Mass of Drop Hammer (kg)14.099014.099049.992549.992549.9925
Height of Drop Weight (cm)222.0447.0261.0630.0882.0
Residual Height (cm)7.754.403.601.201.15
Final Height (cm)214.25442.60257.40628.80880.85
Ecs (kWh/t)0.24210.49511.02322.49603.4939
Sieve Size (mm)2.0
Mass on Sieve (g)452.04365.58294.12185.78173.55
Mass under Sieve (g)226.15319.40389.37498.70510.95
Total Mass (g)678.19684.98683.49684.48684.50
Sieve Loss (%)0.0460.0030.0010.0030.000
t10 (%)33.3346.6356.9772.8674.65
Table 10. Fitting results of t10-Ecs for pyrite under impact crushing.
AbA × bFitting Coefficient (R2)Impact Crushing Resistance Level
72.192.07149.430.93Very Soft
Table 11. Comparison results of impact crushing tests for three kinds of minerals using the drop weight method.
SampleAbA × bImpact Crushing Resistance LevelMohs HardnessRelative DensityThe Limit Value of t10
Quartz67.340.8356.12Medium Soft7.02.6467.34
Pyrrhotite76.601.59121.47Soft4.04.676.6
Pyrite72.192.07149.43Very Soft6.35.272.19
Disclaimer/Publisher’s Note: The statements, opinions and data contained in all publications are solely those of the individual author(s) and contributor(s) and not of MDPI and/or the editor(s). MDPI and/or the editor(s) disclaim responsibility for any injury to people or property resulting from any ideas, methods, instructions or products referred to in the content.

