3.1.1. Particle-Size Distribution and Grinding Behavior Characteristics of Quartz Grinding Products
- (1)
−3.35 + 2.36 mm feed-particle size.
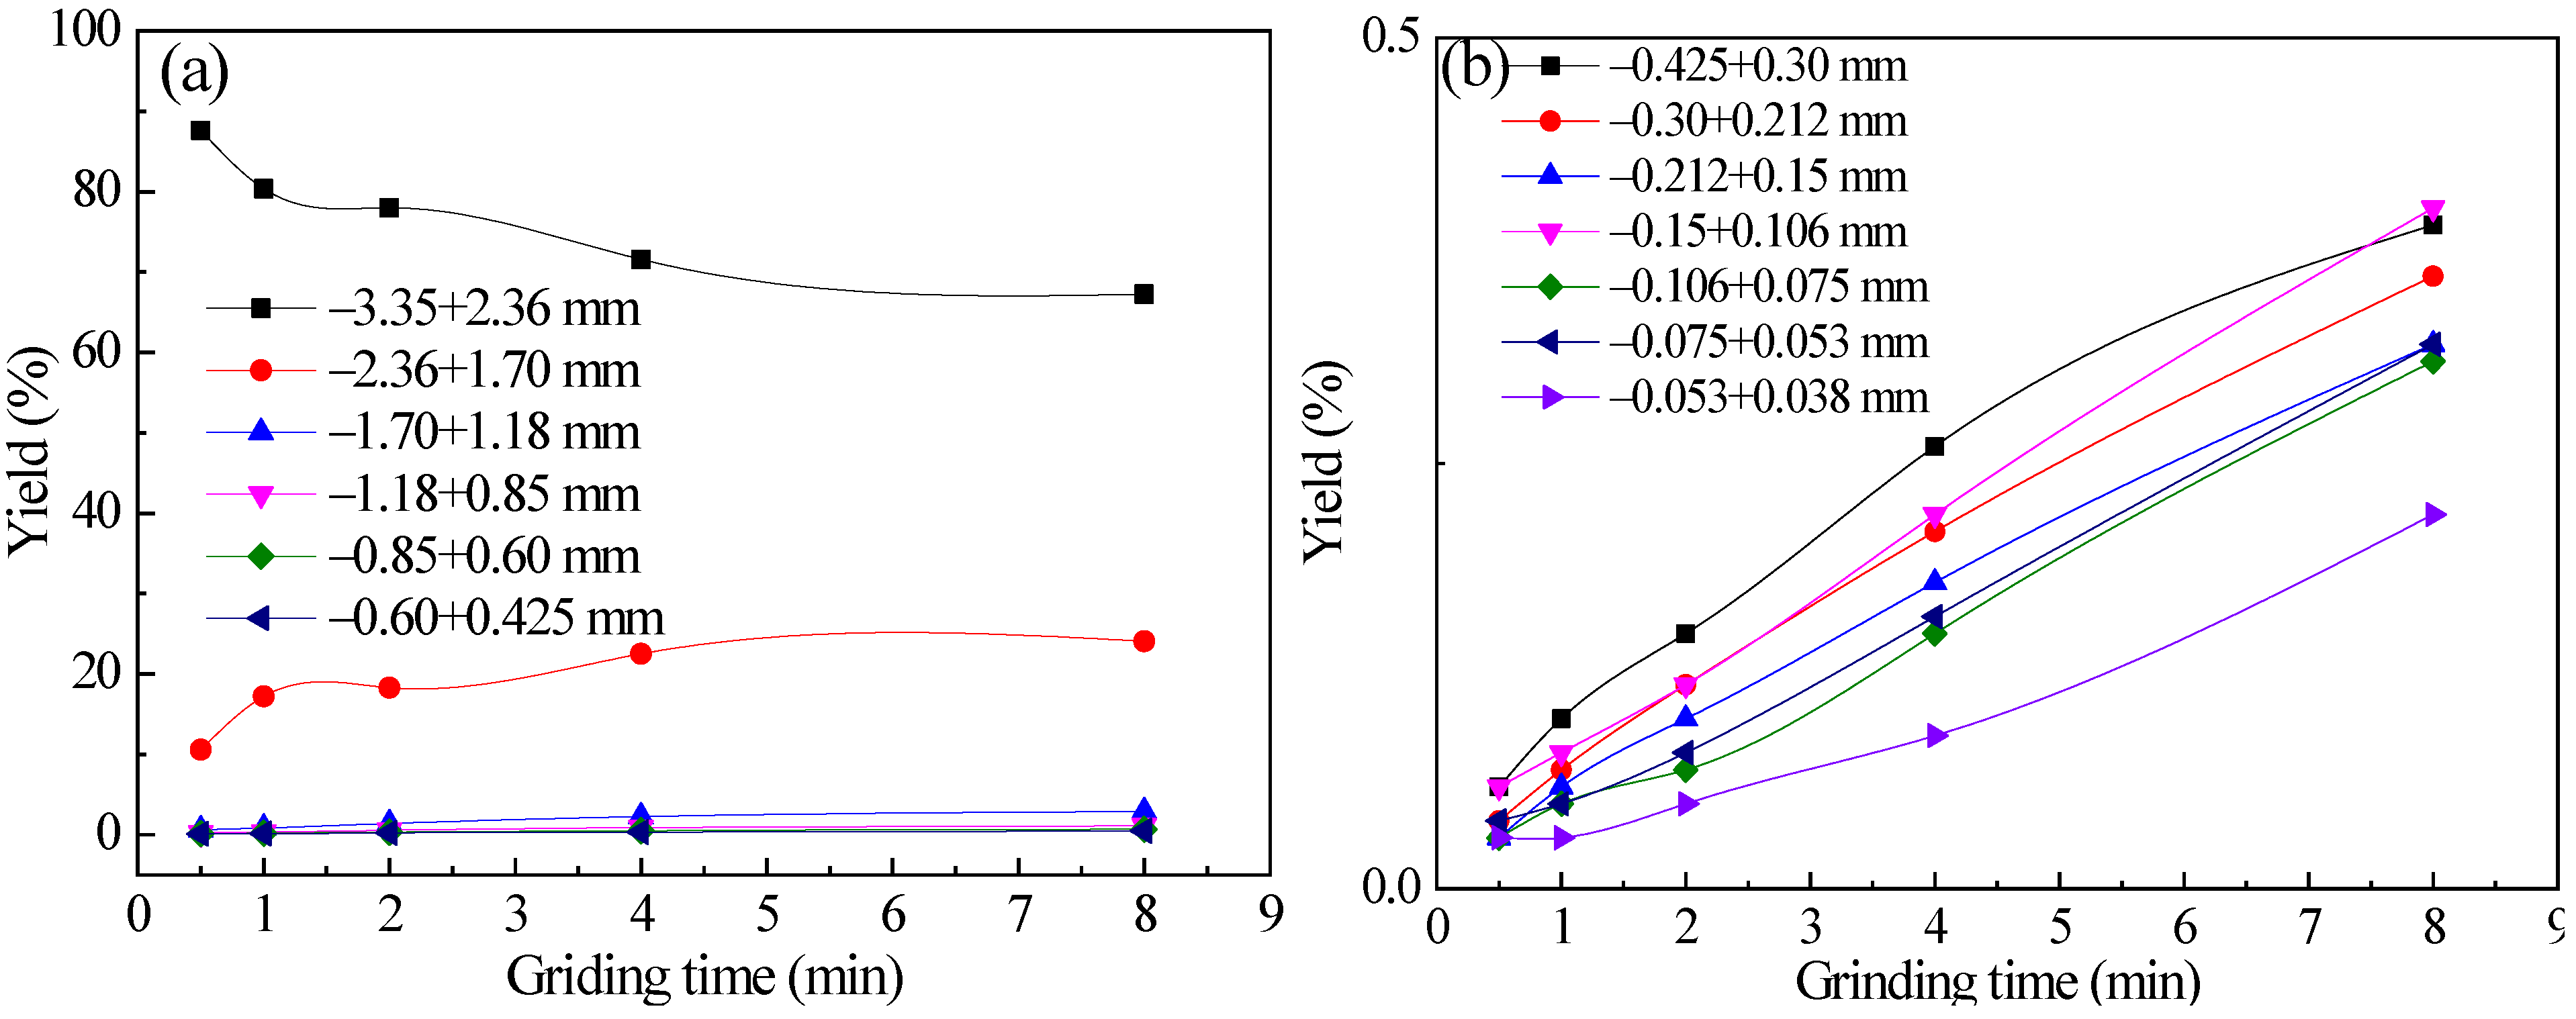
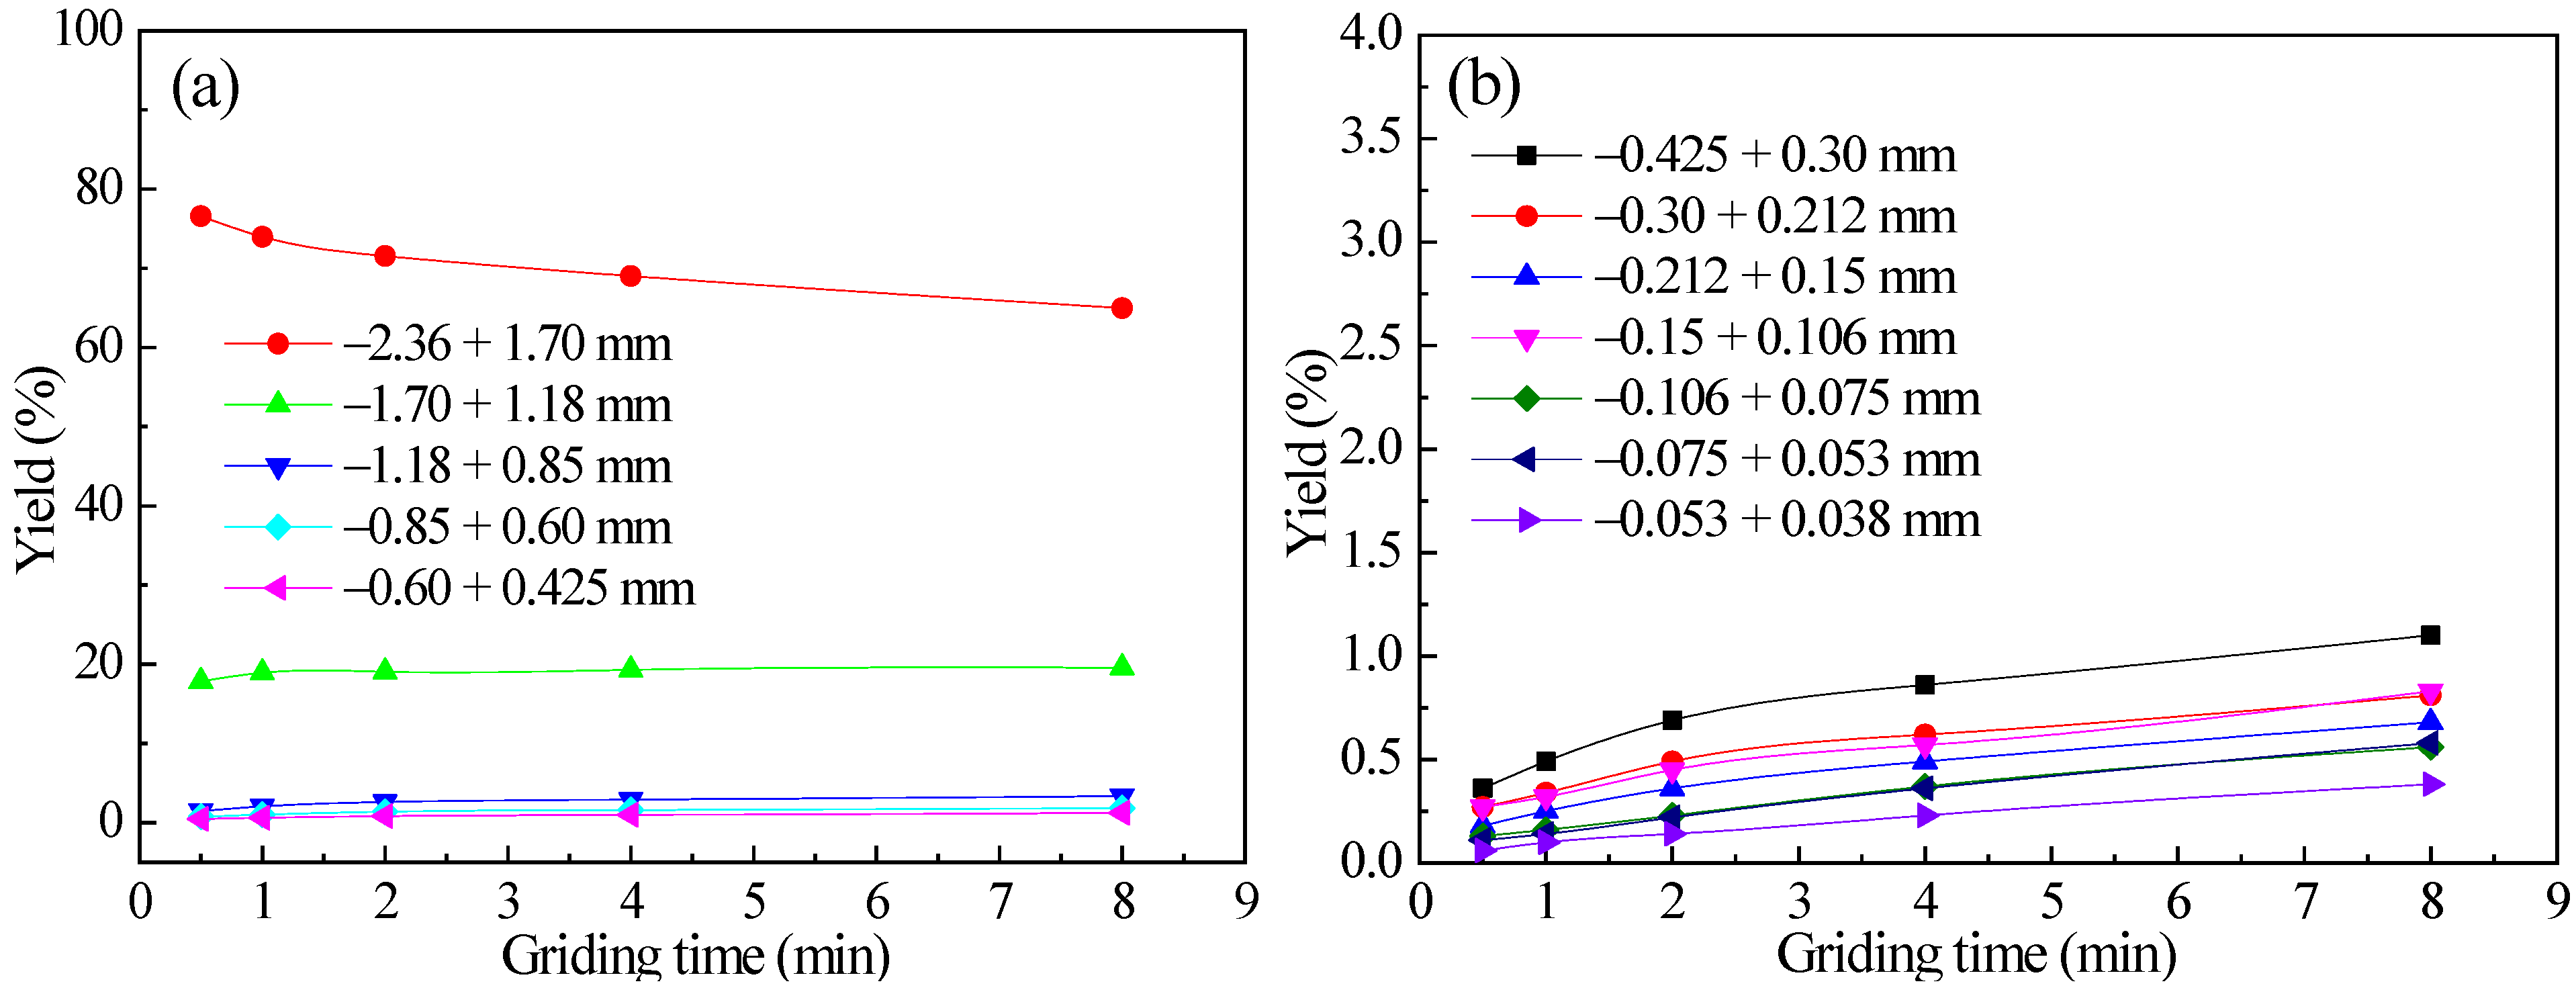
The variation of the product yield of each grinding particle size with grinding time for a −3.35 + 2.36 mm feed-particle size is shown in
Figure 1. Considering the significant differences in the yield of each sieve particle size in the grinding product, the grinding product is divided into +0.425 mm particle sizes and −0.425 mm particle sizes for plotting.
From
Figure 1, it can be seen that the −3.35 + 2.36 mm feed-particle size is crushed in a cascading state of grinding media to produce products of various fine particle sizes. The yield of the feed-particle size itself continuously decreases with the prolongation of grinding time, while the yield of each newly generated fine particle size increases with the prolongation of the grinding time. However,
Figure 1 clearly shows that during grinding for up to 8 min, the main particle sizes of the grinding products are −3.35 + 2.36 mm and −2.36 + 1.7 mm, with a total yield of over 90% for both particle sizes. The maximum yield of the second particle size (−2.36 + 1.7 mm) reached 24.08%, while the yield of the other fine particle sizes was very low, with a maximum of 2.9%. This indicates that during the 8-min grinding process, the −3.35 + 2.36 mm feed-particle size was mainly crushed to produce a second particle size (−2.36 + 1.7 mm).
As can be seen from
Figure 1a, when the ordinate size range is large, the variation curve of the yield of the third particle size (−1.7 + 1.18 mm) with grinding time has tended to be flat. When the ordinate scale is further reduced, as shown in
Figure 1b, the yield of each −0.425 mm particle size at 8-min does not exceed 0.5%, indicating that the generation rate of these particle sizes under grinding is very slow. It can be seen that grinding medium in a cascading state is a low-speed operation and low-energy input process. The abrasion force of the medium is relatively weak and requires repeated grinding to promote the crushing of ores.
It can also be seen from
Figure 1 that, except for the production rates of −3.35 + 2.36 mm and −2.36 + 1.7 mm particle sizes, the changes in production rates of other particle sizes with grinding time exhibit linear characteristics, consistent with the characteristics of the first-order grinding dynamics model. Linear fitting was performed on the changes in the yield of newly generated fine particle products with grinding time, except for the two particle sizes of −3.35 + 2.36 mm and −2.36 + 1.7 mm. The fitting results are shown in
Table 4 where
f(
t) represents the yield of a particle size at time
t and
k represents the generation rate constant of the particle size.
From
Table 4, it can be seen that when the variation of the yield of each particle size with grinding time is fitted using a linear equation, the goodness of fit is greater than 0.9, indicating a high degree of linearity. In particular when the particle size generated is less than 0.6 mm, the goodness of fit is greater, reaching above 0.97. This indicates that under the experimental conditions, the yield of the newly produced fine particle size conforms to the characteristics of linear change with grinding time. In addition, after fitting and regression analysis of the data in
Figure 1,
t10 for the particle size of −3.35 + 2.36 mm at different grinding times was obtained. The result is that when the grinding time is 0.5 min, 1 min, 2 min, 4 min, and 8 min, the
t10 is 0.52%, 1.04%, 1.33%, 2.2%, and 3.61%, respectively. It can be seen that the degree of fragmentation of quartz under the action of grinding is small, resulting in fewer fine particles.
- (2)
−2.36 + 1.7 mm feed-particle size.
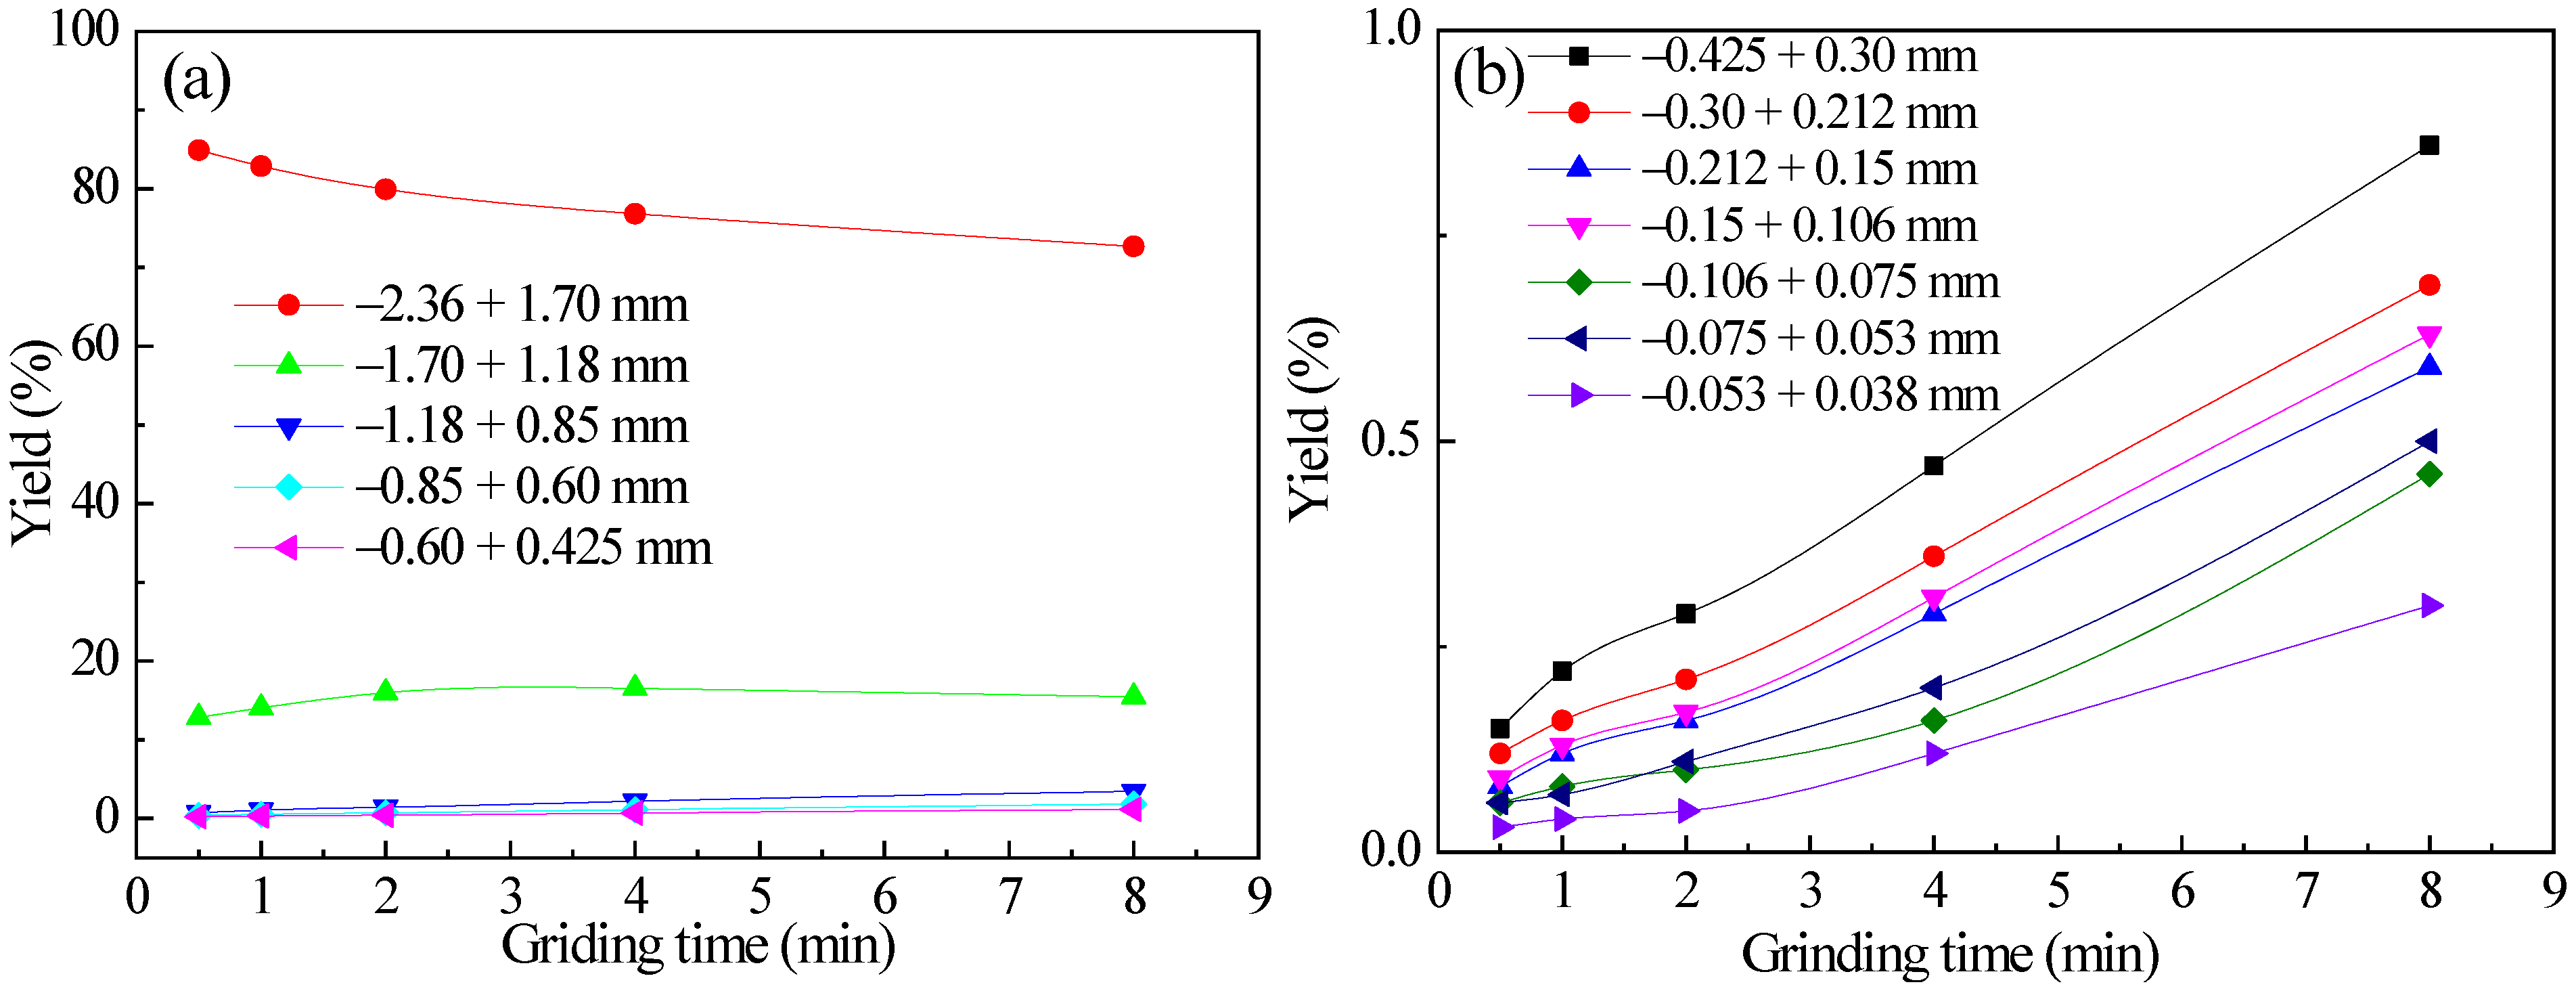
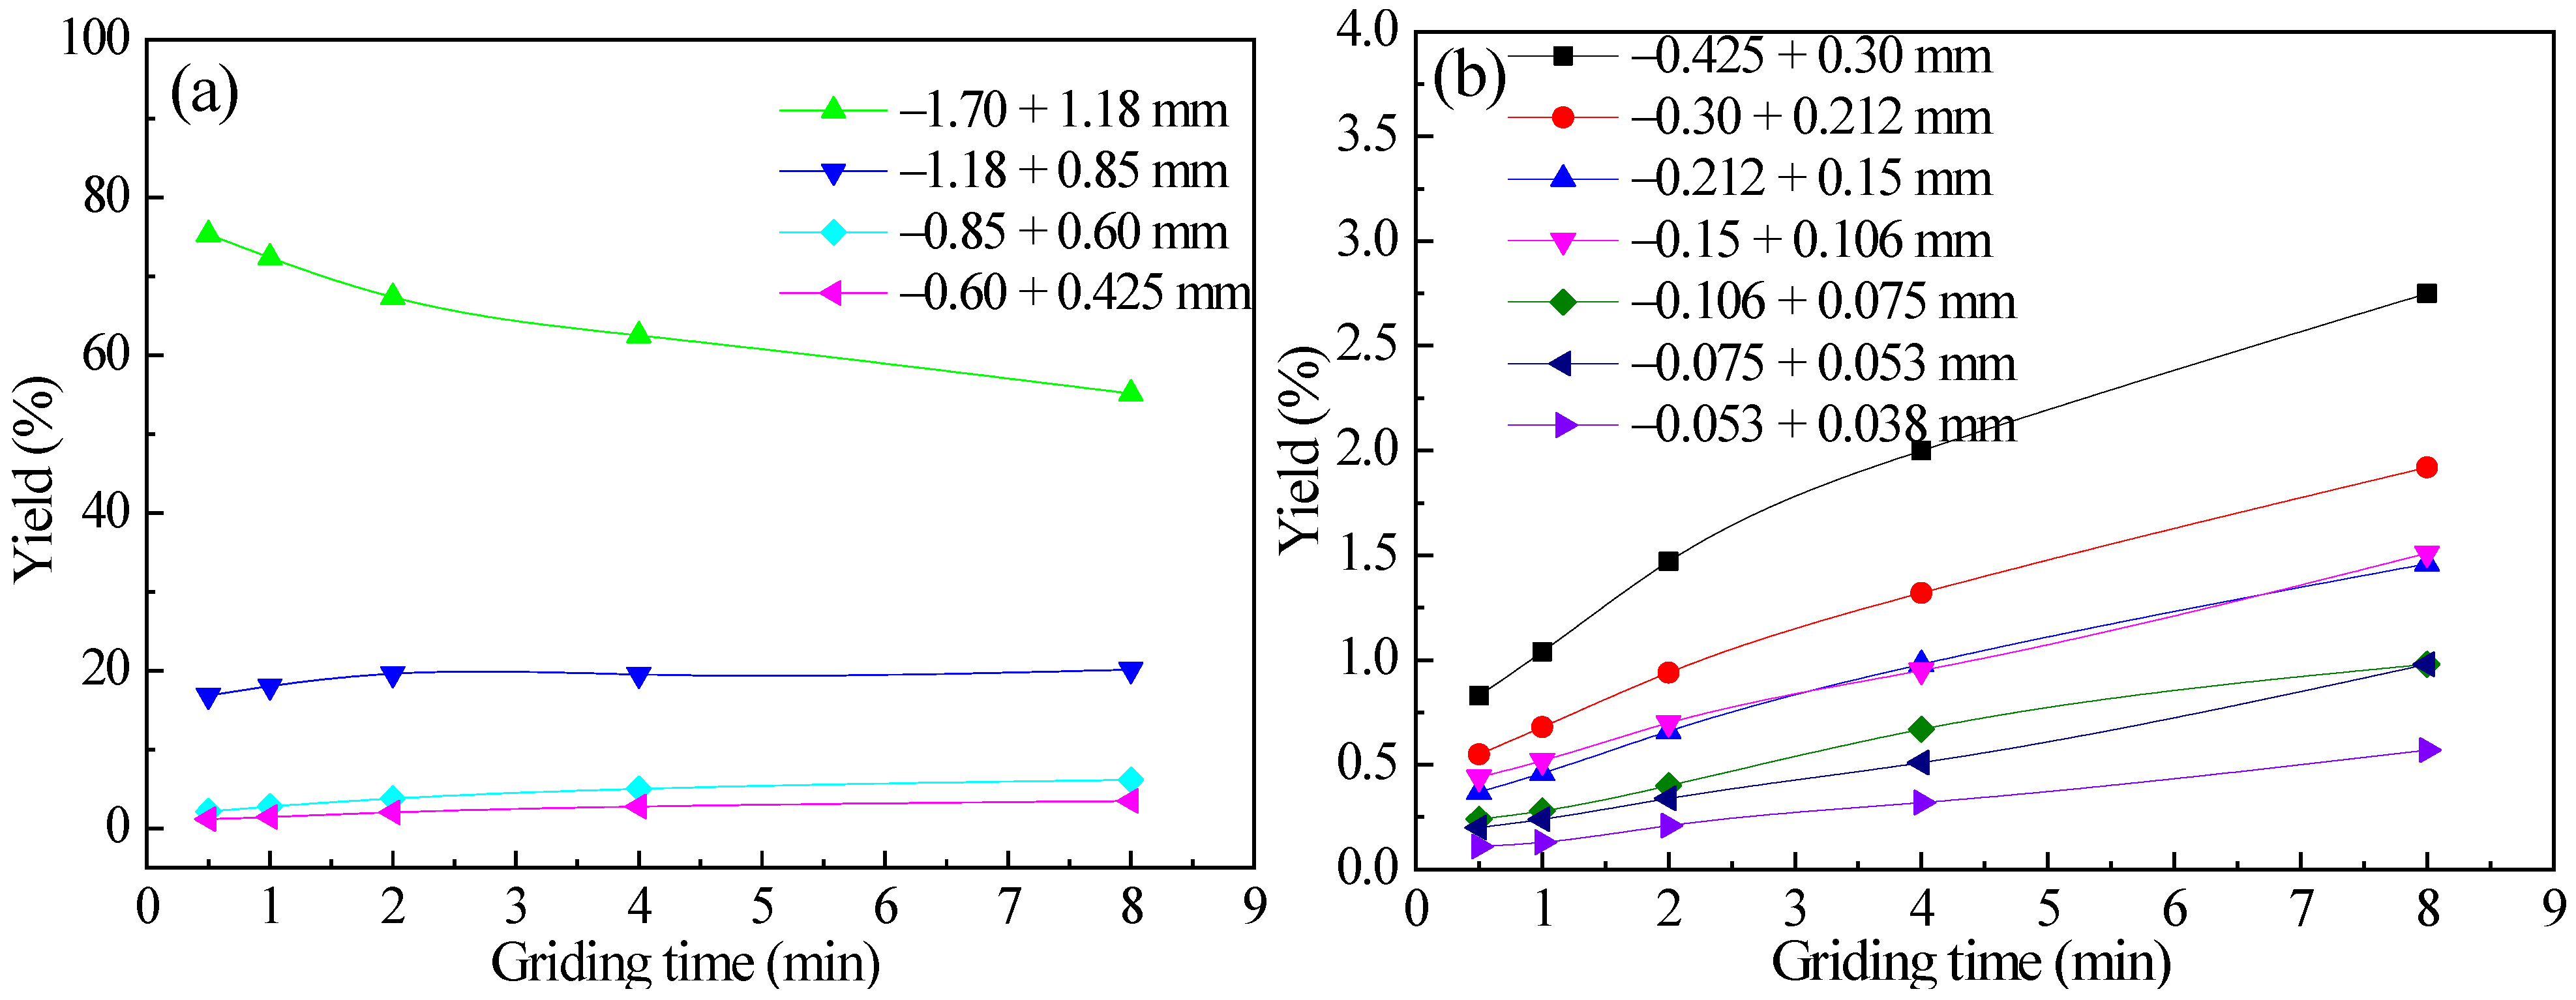
The variation of the product yield of each grinding particle size with grinding time for a −2.36 + 1.7 mm feed-particle size is shown in
Figure 2.
In general, the rule of crushing and generating each particle size of the −2.36 + 1.7 mm feed-particle size reflected in
Figure 2 is basically consistent with that of the −3.35 + 2.36 mm feed-particle size. The yield of the feed-particle size itself continuously decreases with the prolongation of grinding time, while the yield of each newly generated fine particle size increases with the prolongation of grinding time. During the grinding process, the second particle size (−1.7 + 1.18 mm) particles were mainly generated from the −2.36 + 1.7 mm feed-particle size. Within 8 min, the highest yield of the second particle size was 16.53%, and the highest yield of the other particle sizes did not exceed 3.44%. From
Figure 2b, it can be seen that the yield variation range of each fine particle size generated by the −2.36 + 1.7 mm feed is higher than that of the −3.35 + 2.36 mm feed, but the yield of each fine particle size at 8 min is still not more than 1%. This indicates that the grinding medium in a cascading state has a poor crushing effect on quartz.
Figure 2 also shows that, except for the yields of the two particle sizes −2.36 + 1.7 mm and −1.7 + 1.18 mm, the changes in the yields of other particle sizes with grinding time exhibit a linear characteristic, consistent with the characteristics of the first-order grinding dynamics model. Linear fitting was performed on the variation of the yield of newly generated fine particle products with grinding time, except for the two particle sizes −2.36 + 1.7 mm and −1.7 + 1.18 mm. The fitting results are shown in
Table 5.
As can be seen from
Table 5, except for the feed-particle size itself and the second particle size closest to it, when the changes in the yield of the other 11 particle sizes with grinding time are fitted using a linear equation, the linear consistency is high. That is, under the experimental conditions, the yield of the newly produced fine particle sizes varies linearly with grinding time. The results are consistent with the grinding results of −3.35 + 2.36 mm feed listed in
Table 4. In addition, a fitting and regression analysis of the data in
Figure 2 can obtain the
t10 of −2.36 + 1.7 mm quartz particles at different grinding times. The result is that when the grinding time is 0.5 min, 1 min, 2 min, 4 min, and 8 min, the
t10 is 0.69%, 0.90%, 1.19%, 1.98%, and 4.04%, respectively. This indicates that the degree of breakage of quartz with this particle size is small under the action of grinding, and the resulting fine particle size is small.
- (3)
−1.7 + 1.18 mm feed-particle size.
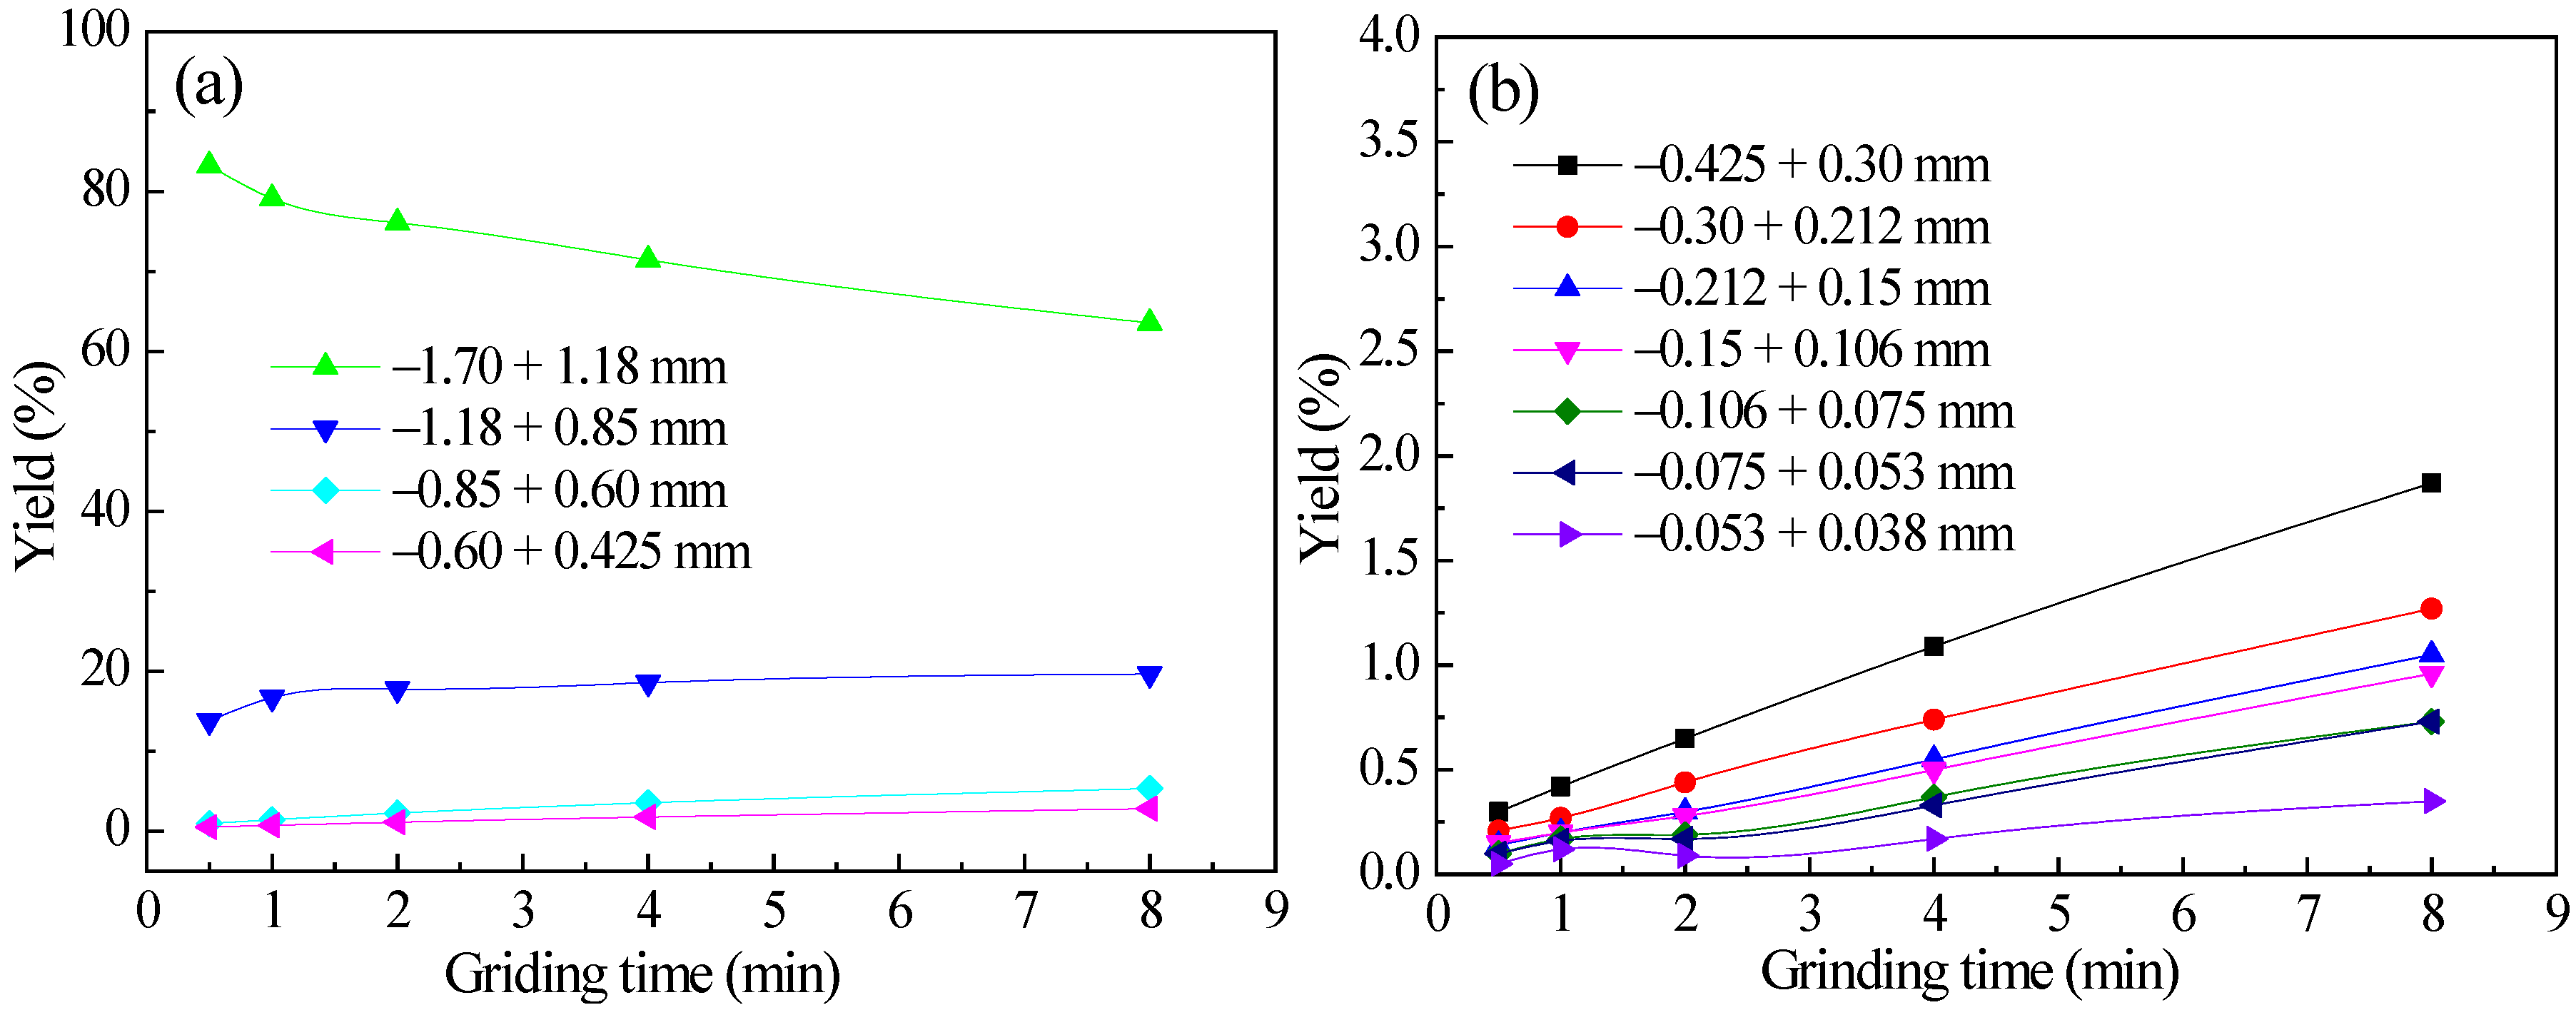
The grinding results are shown in
Figure 3.
The crushing rule of the −1.7 + 1.18 mm feed-particle size in the grinding medium cascading state reflected in
Figure 3 is basically consistent with the coarser feed-particle sizes of −3.35 + 2.36 mm and −2.36 + 1.7 mm. During the grinding process, the −1.7 + 1.18 mm feed-particle size mainly produces a second particle size (−1.18 + 0.85 mm) of particles. In different grinding times, the highest yield of the second particle size was 19.65%, and the highest yield of the other particle sizes was 5.34%. As can be seen from
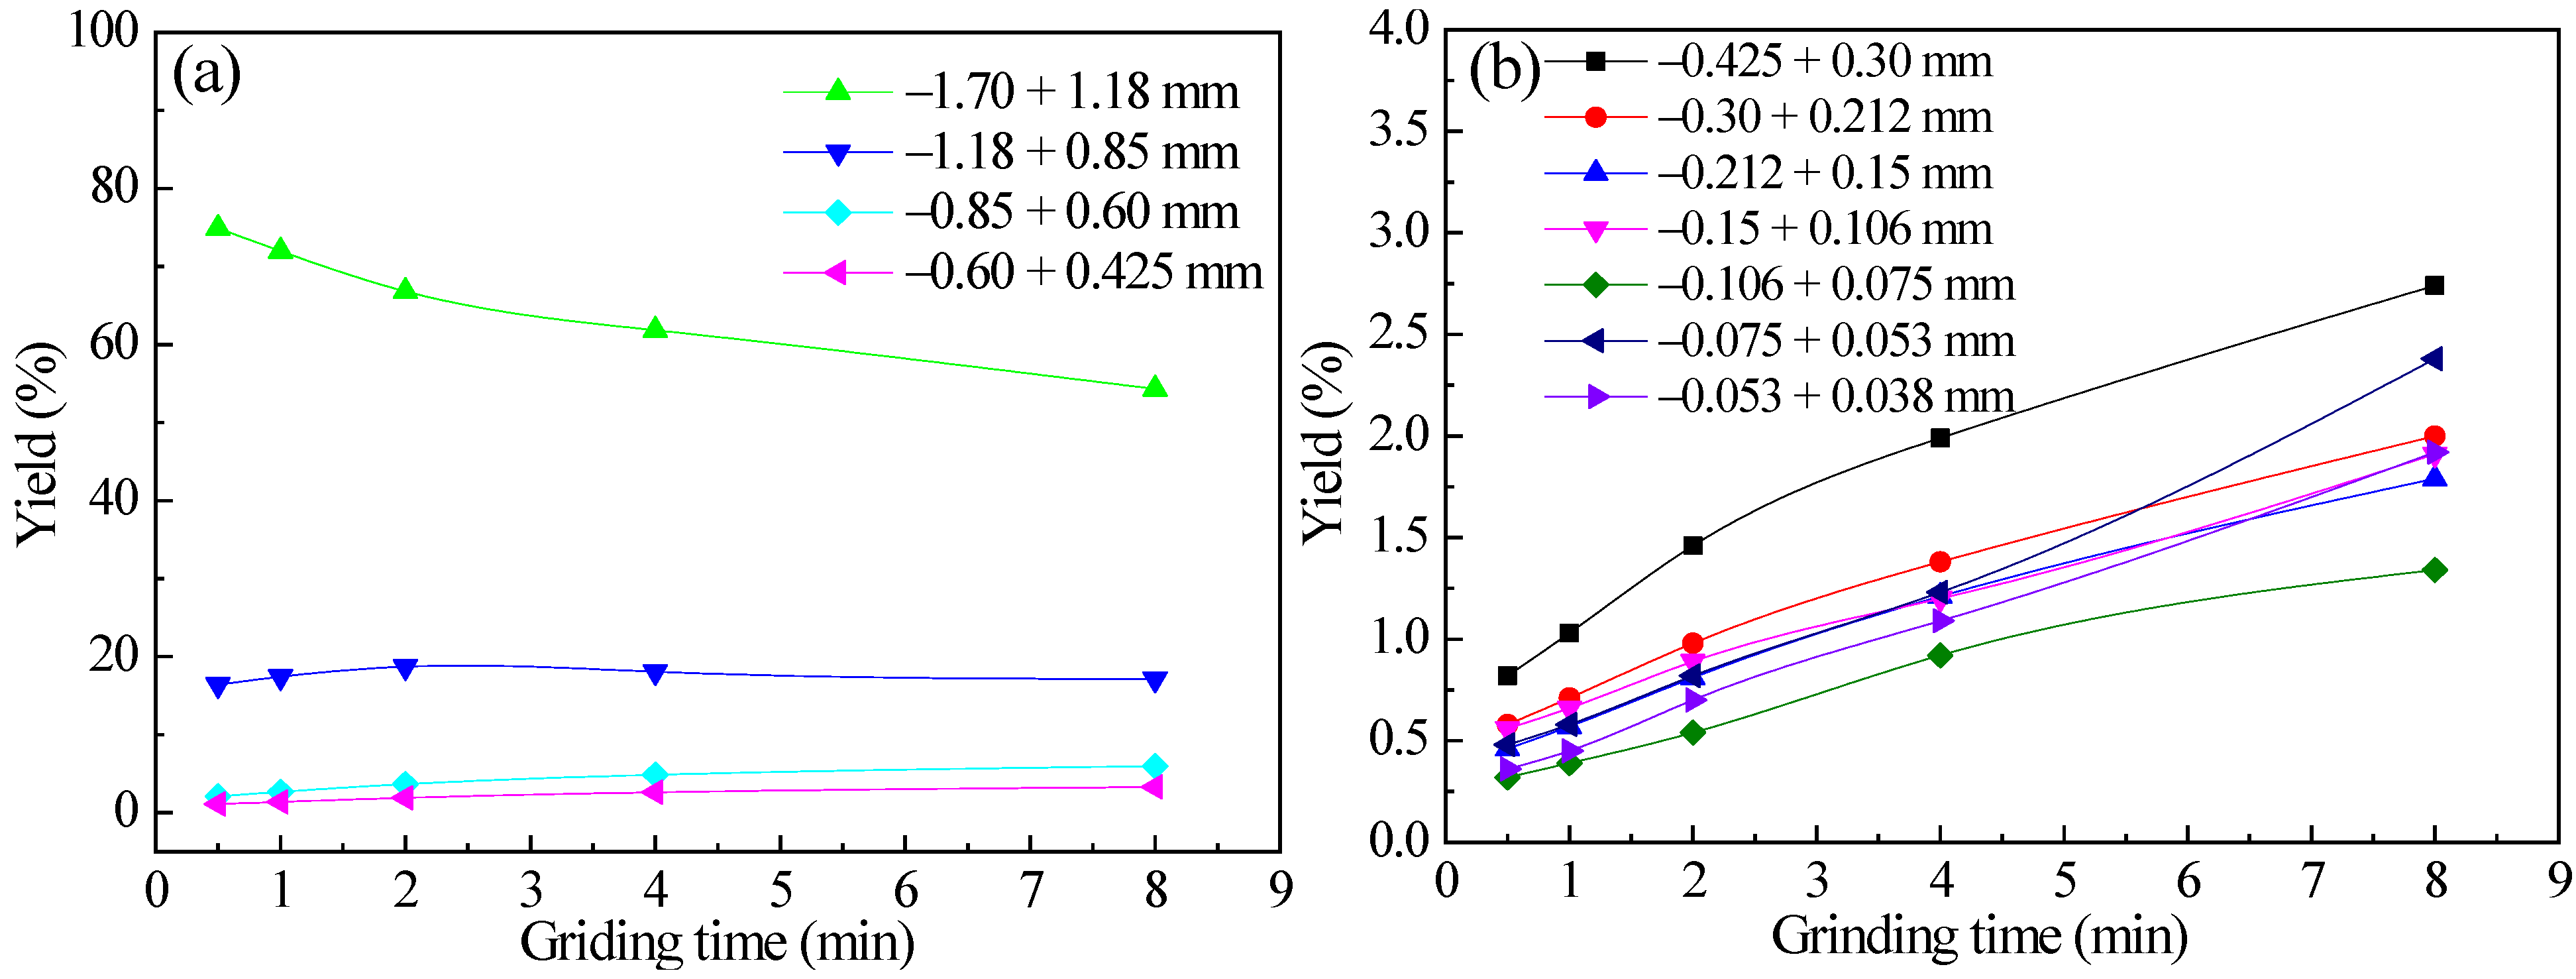
Figure 3b, the yield variation range of each fine particle size generated by the −1.7 + 1.18 mm feed is higher than that of the two coarser particle sizes −3.35 + 2.36 mm and −2.36 + 1.7 mm feed, but the yield of each fine particle size at 8 min does not exceed 1.87%. This indicates that although reducing the feed-particle size can promote the generation of fine particles, the total fine particle size generated is still very small.
As shown in
Figure 1,
Figure 2 and
Figure 3, except for the yields of −1.7 mm + 1.18 and −1.18 + 0.85 mm particle sizes, the changes in the yields of other particle sizes with grinding time exhibit linear characteristics, which also conform to the characteristics of the first-order grinding dynamics model. Linear fitting was performed on the variation of the yield of each newly generated fine particle product with grinding time, except for the two particle sizes −1.7 + 1.18 mm and −1.18 + 0.85 mm. The fitting results are shown in
Table 6.
As can be seen from
Table 6, except for the feed-particle size itself and the second particle size closest to it, when the changes in the yield of other particle sizes with grinding time are fitted using a linear equation, the linear coincidence is high. In addition, fitting regression analysis was performed on the data processing in
Figure 3 to obtain the
t10 of −1.7 + 1.18 mm quartz particles at different grinding times. The result is that when the grinding time is 0.5 min, 1 min, 2 min, 4 min, and 8 min, the
t10 is 0.88%, 1.37%, 1.66%, 2.58%, and 4.79%, which is at a lower level than the past.
According to the grinding tests of the three feed-particle sizes of quartz described above, except for the grinding process of the feed-particle size and the generation process of the second particle size closest to it, which do not conform to linear laws, the generation process of products of all other particle sizes conforms to linear laws. The reason may be that quartz has high purity, high hardness, and uniform and stable properties, resulting in slow grinding and crushing, and fewer fine particle sizes.
3.1.2. Comparative Analysis of Grinding with Different Feed-Particle Sizes
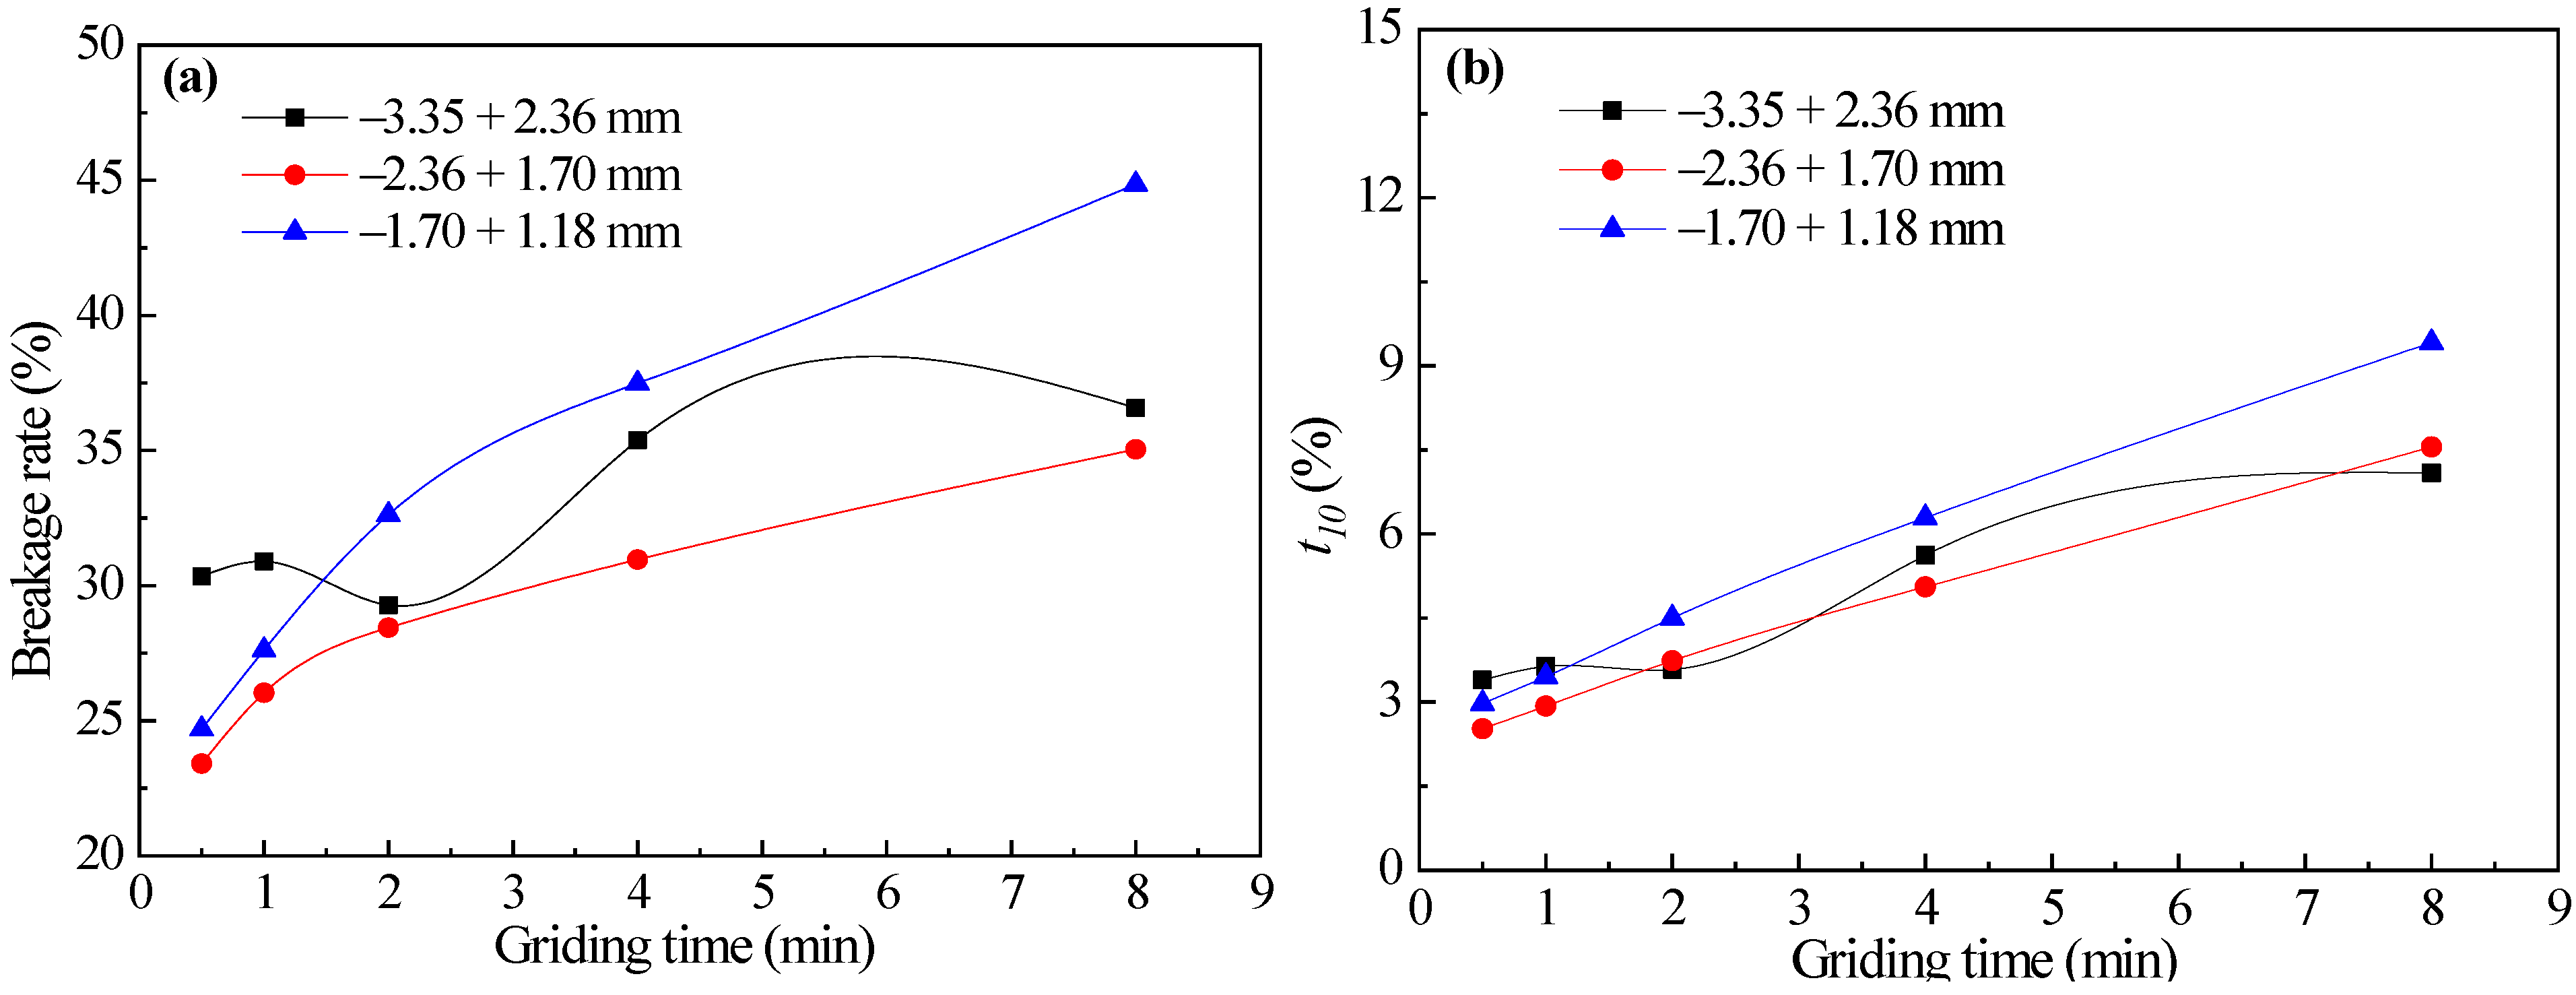
In order to further study the influence of feed-particle sizes, the grinding data of the aforementioned three feed-particle sizes −3.35 + 2.36 mm, −2.36 + 1.7 mm, and −1.7 + 1.18 mm were compared and analyzed. The breakage rates of the three feed-particle sizes of quartz calculated by Equation (4) are shown in
Figure 4a. The variation of
t10 values of grinding products of three feed-particle sizes with grinding time is shown in
Figure 4b.
It can be seen from
Figure 4 that the breakage rates of the three feed-particle sizes of quartz increase with the increase of grinding time, but the increase rate from 2 to 8 min is smaller than that from 0.5 to 2 min. This indicates that with the increase of grinding time, the increase rate of quartz breakage rate slows down and the curve slope decreases. The reason may be related to the surface defects of quartz particles; that is, at the beginning of grinding, due to the irregular shape of broken particles, there are many surface defects. After grinding for a period of time, the particle surface defects basically disappear, so the grinding speed decreases and enters a stable grinding state. At the same time, when the particles are small enough, there is a condensation phenomenon in the fine particle group, and grinding no longer has an effect. For the three feeding-particle sizes of quartz, the breakage rate of the −1.70 + 1.18 mm feed-particle size is the highest, and the increase rate is faster. This indicates that under the same quality, the specific surface area of the smallest feed-particle size is the largest, and the effective contact area of quartz particles with the grinding medium is the largest, so its breakage rate changes faster with grinding time. The breakage rate of the −3.35 + 2.36 mm feed-particle size is in the middle, while the breakage rate and its increase rate of the −2.36 + 1.7 mm feed-particle size are the smallest. It can be seen that when the medium in the mill is in a cascading state, the breakage rate and increase rate of quartz are not completely positively correlated with the size of the feed-particle size, and the reason for this phenomenon needs further research.
However, it is worth noting that during the entire grinding process, the variation trend and absolute value of t10 for the three feed-particle sizes are very close, and the absolute value is not significant. After 8 min of grinding, the maximum value is less than 6%.


