Article

Compaction Response of Mining-Induced Rock Masses to Longwall Overburden Isolated Grouting

1
School of Mines, China University of Mining and Technology, Xuzhou 221116, China
2
State Key Laboratory of Coal Resources and Safe Mining, China University of Mining and Technology, Xuzhou 221116, China
*
Author to whom correspondence should be addressed.
Minerals 2023, 13(5), 633; https://doi.org/10.3390/min13050633
Submission received: 16 March 2023 / Revised: 23 April 2023 / Accepted: 25 April 2023 / Published: 30 April 2023
(This article belongs to the Topic Mining Safety and Sustainability)

Abstract

:
Surface subsidence in coal mine areas can cause serious geological hazards. After a coal seam is mined, the overlying rock layers fracture, collapse, and expand; the fractured and bulking rock masses are then continuously compacted under the action of overburden load, which eventually leads to surface subsidence. Overburden isolated grout filling via surface boreholes, and high-pressure grouting to mining-induced fissures under the hard rock layer, uses the grouting pressure to compact the lower fractured and bulking rock masses in advance, replacing the subsidence void and effectively controlling the surface subsidence. The characteristics of rock mass collapse, bulking, and compaction associated with mining and grouting are the key to the design of grouting parameters and surface subsidence control. In this paper, a theoretical model of the rock masses’ compactness during grouting injection is proposed, which determines the compaction of rock masses under the action of grouting filling. An experimental study was conducted to reproduce the grouting pressure evolution and the rock masses compaction in response to grout filling. The results indicated that the rock mass compaction was small in the no-pressure stage, and that the low-pressure and pressure-boost stages were key to generating the compaction effect of the grout filling. It was found that compaction grouting substantially increased the filled volume by transforming the fractured and bulking space of the rock masses into a filled space. Using engineering measurement data, the rock masses compaction law for grouting is verified. This paper provides a theoretical basis for the design of overburden grouting parameters and the evaluation of subsidence control effectiveness.

1. Introduction

In civil and mining engineering, grouting technology is one of the most important methods to maintain the stability of the ground surface, e.g., reinforcing fractured rock foundation, water-rich and soft strata, karst cave areas, and other fractured rock areas [1,2,3,4]. Underground mining leads to the destabilization of strata, and the surface will have a wide range of collapse [5,6,7]; sometimes mining even cause landslides [8,9,10,11], which will undoubtedly produce great potential danger to public safety [12,13,14,15,16]. An effective method of maintaining the stability of the surface in mining areas is filling the mining-induced space by grouting [17,18,19,20], thereby suppressing the overburden structural instability induced by coal mining [21,22,23].
Previously, researches on the causes of surface subsidence and the overburden injection space were conducted [24,25,26,27]. The general process of surface subsidence caused by longwall mining is as follows. The longwall face is mined to form a hollow area, and the immediate roof (the rock layer located directly above the coal seam) is in a state of tension under the action of gravity and the load of the overlying rock layers [28,29]. As the hollow area increases, the overhanging area continues to increase and generate downward movement and bending. When the tensile deformation exceeds the tensile strength, the rock layer breaks into nonuniform size rock pieces, and then bulking occurs [30,31]. The overlying rock layers cannot maintain the original laminated stable structure and fractures occur, leading to a further increase in the height of the bulking and fractured zone [32,33,34]. Under the action of the overlying rock layers load, the fractured and bulking rock masses are continuously compacted. Similarly, the rock layers at higher levels continue to sink, and the strata movement gradually propagates to the ground surface, eventually causing surface subsidence [35,36,37].
In the above process, the thick and hard rock layers in the overburden (typically referred to as “key strata”) can play a temporary isolation role in blocking strata movement (i.e., sinking and subsidence) [38]. Before the key strata break, the load from the upper rock layers is burdened by the key strata, delaying the compaction process of the lower fractured and bulking rock masses and also reducing the rate of subsidence of overlying rock and surface. Conversely, if the key strata break, strata movement will rapidly develop upward, resulting in accelerated compaction of the fractured and bulking rock masses and accelerated subsidence of the ground surface [39,40].
Overburden isolated grouting during longwall mining is a highly efficient method of reducing surface subsidence via grouting which was developed to take advantage of the role of key strata in controlling surface subsidence [17,20]. In this technology, multiple surface boreholes are constructed above the longwall panel to the key strata. During longwall mining, high-pressure grouting is applied to fill the mining-induced fracture under the key strata through the surface boreholes before the key strata break. The grouting pressure compacts the fractured and bulking rock masses below the key strata in advance, and the injection fill replaces the potential sinking space associated with rock layers, thus controlling surface subsidence [19]. This technology has been successfully applied for the subsidence control during longwall mining under populated areas in more than a dozen coal mine areas in China, and the subsidence reduction rates have been controlled by 90% or more [18].
Both the grouting-induced compaction process and the degree of the fractured and bulking rock are key factors affecting subsidence control and are also an important basis for grouting design. The recompaction process of collapsed rock under the action of grout filling is the focus of research in the field of grout filling and subsidence reduction, because the injected object of grout filling is the rock fracture and the compacted object is the lower fractured and bulking rock masses, which has the characteristic of nonvisibility and changes based on the location [41,42,43]. Currently, surface boreholes are often constructed after grouting to investigate the filled body and assess the compaction of the grout filling to rock masses. For example, the main grouting zone was determined via drilling [18]; theoretical models of filled body distribution and estimation methods of the grout-filling volume were proposed [44]. However, a small number of boreholes cannot determine the complete compaction of the overall overburden [45,46]. Because of the time-consuming and costly nature of drilling and coring, it is impractical to construct high-density exploratory boreholes above the entire grouted area. In addition, studies have been conducted to investigate the distribution of the grouting pressure, as well as the flow and consolidation patterns of the filled slurry, which have contributed to the understanding of the compaction of grout-filled rock masses [47,48]. Nevertheless, research concerning the entire process of the compaction response of fractured and bulking rock masses under the action of grout filling is still limited.
Accordingly, this study uses a combination of theoretical analyses, experiments, and engineering data validation to investigate the above issues. First, a theoretical basis reflecting the compaction of rock masses under grout-filling conditions is established. On this basis, physical modeling experiments are constructed to reproduce the entire process of the rock masses compaction response under the action of grout filling to determine the rock masses compaction, compaction grouting-induced increase in the filled volume, and its generation mechanism. Finally, engineering case data are used to verify the compaction response law of the rock masses under the action of overburden isolation grout filling.

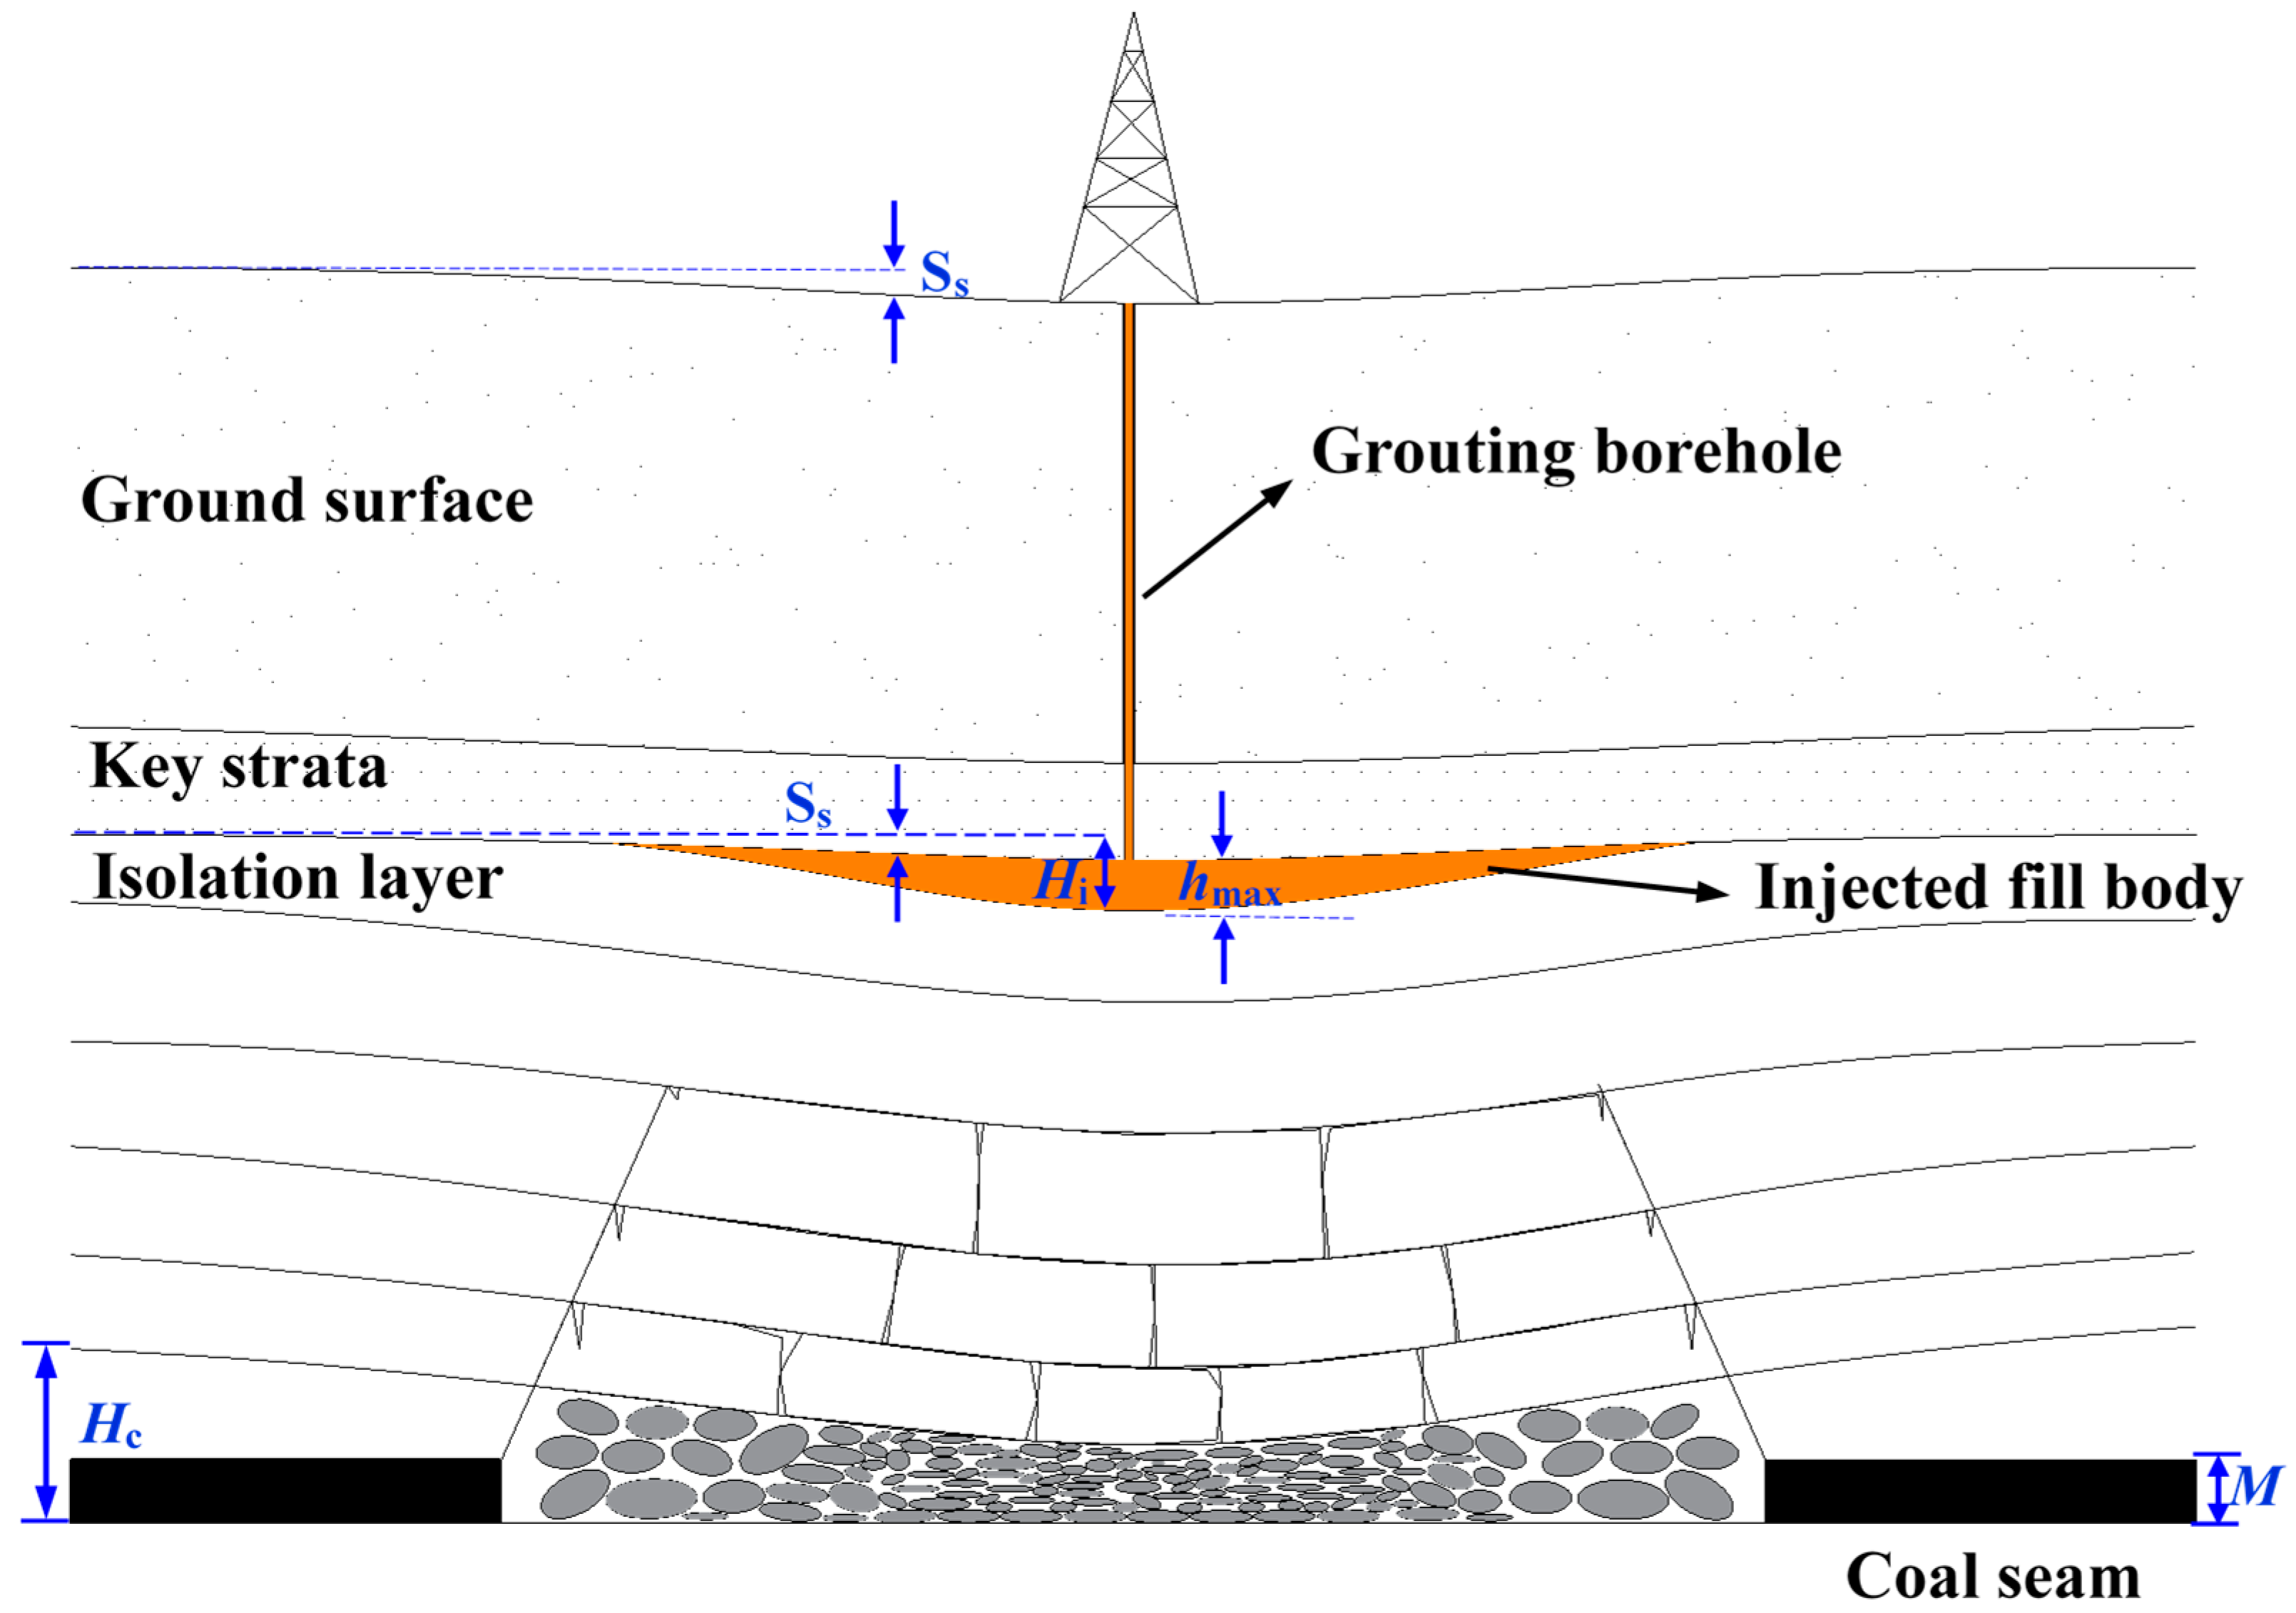
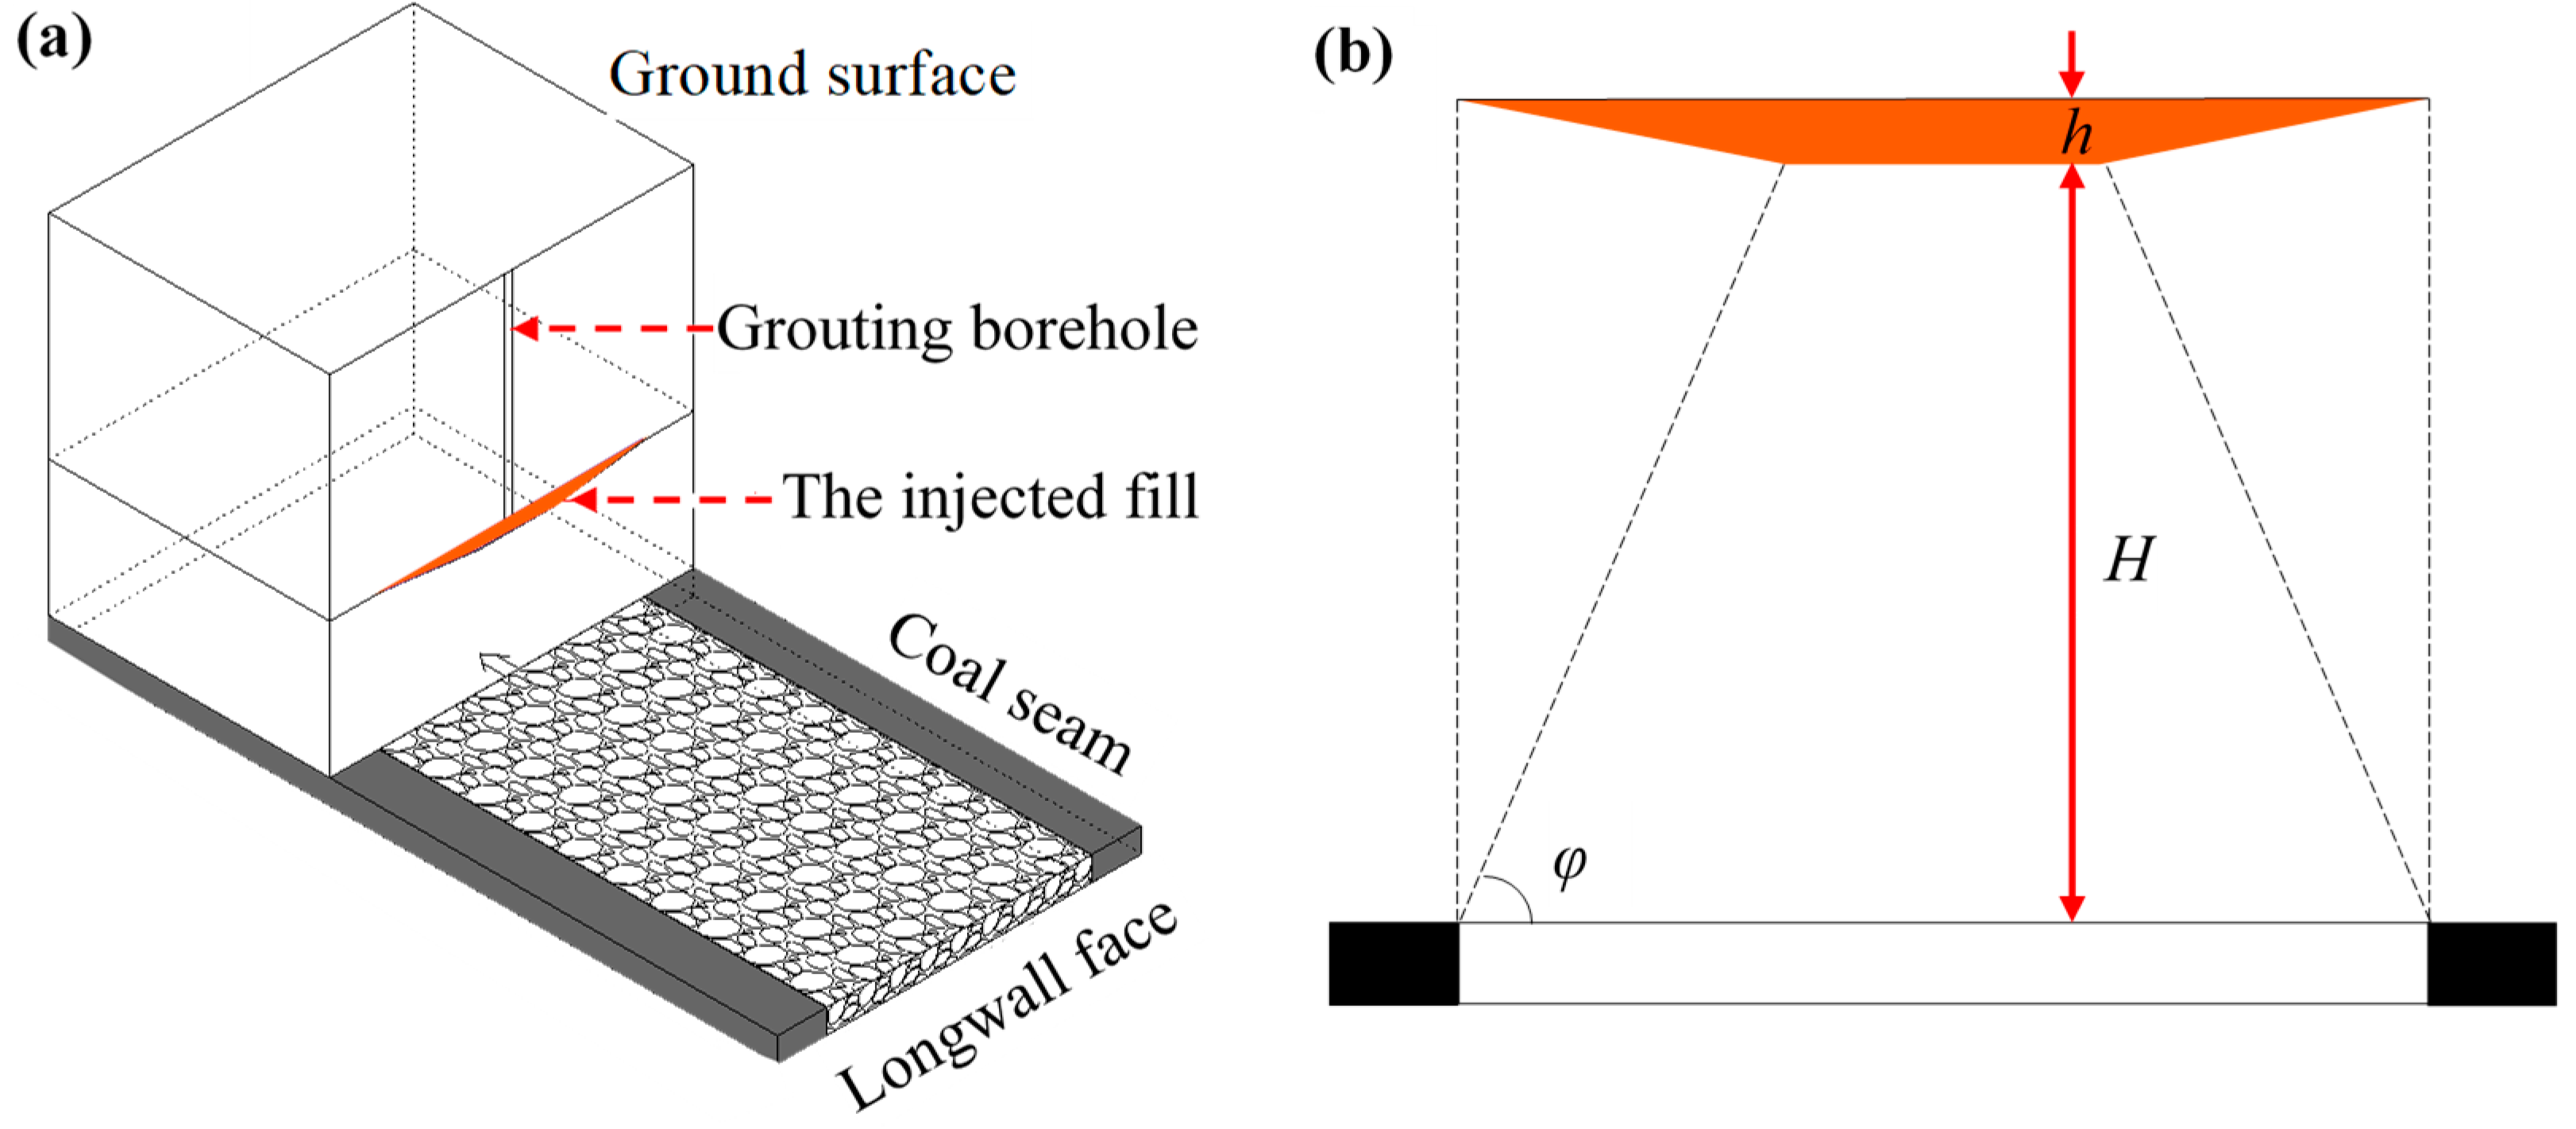
2. Theoretical Basis

In grouting injection into the overburden of isolated panels during longwall mining, the high-pressure filling generates a supporting effect on the overlying key strata and controls the surface subsidence. At the same time, it compresses the rock masses below the isolation layer and the grouting pressure is transmitted to the underlying rock through the isolation layer (the rock layer immediately below the filling zone), which continuously compacts the fractured and bulking rock masses. The amount of rock masses compaction under the action of grout filling is the vertical displacement generated by the isolation layer (Figure 1).
Hence, the spatial relationship between the isolation layer deformation, the mining height, and the residual fractured and bulking of the collapsed rock can be expressed as:
M = H i + H c K p 1
where M is the longwall working face mining height (m); Hc is the height of the caving zone (m), where the height of the caving zone is usually 3–5 times the longwall working face mining height, and is generally determined by field measurements; Kp is the residual bulking coefficient of the collapsed rock masses, generally 1.03–1.16 [49]; and Hi is the amount of isolation layer displacement (m). To measure the degree of compaction of the rock masses, we define the compaction degree of the rock masses λ such that:
λ = H i M H c K p 1
When the surface subsidence coefficient (ratio of maximum surface subsidence to the height of mined space underground under the longwall mining condition) is 1, the mining height, isolated layer displacement, and surface subsidence are equal; the collapsed rock masses is completely compacted without a residual bulking space; and the self-weight compaction degree of the rock layer reaches 100%. The rock masses compaction during injection is the sum of the compaction of the grouting and the self-weight compaction of the rock formation, while the displacement of the isolation layer under the grouting filling action is the sum of the thickness of the filling body h and the movement of the key strata Sk. Assuming that the movement of the key strata Sk is equal to the surface subsidence Ss, the total rock compaction λ during the grout filling can be expressed as:
λ = h + S s M H c K p 1
The surface subsidence Ss during the grouting process can be monitored and obtained, and the filled body thickness h can be solved for using the morphological model of filling established by [50], where the filled body distribution is assumed to satisfy the ladder platform distribution in space (Figure 2). In Figure 2, φ is the angle of full subsidence, and H is the distance between the injection horizon and the roof of the coal seam.

3. Experimental Research

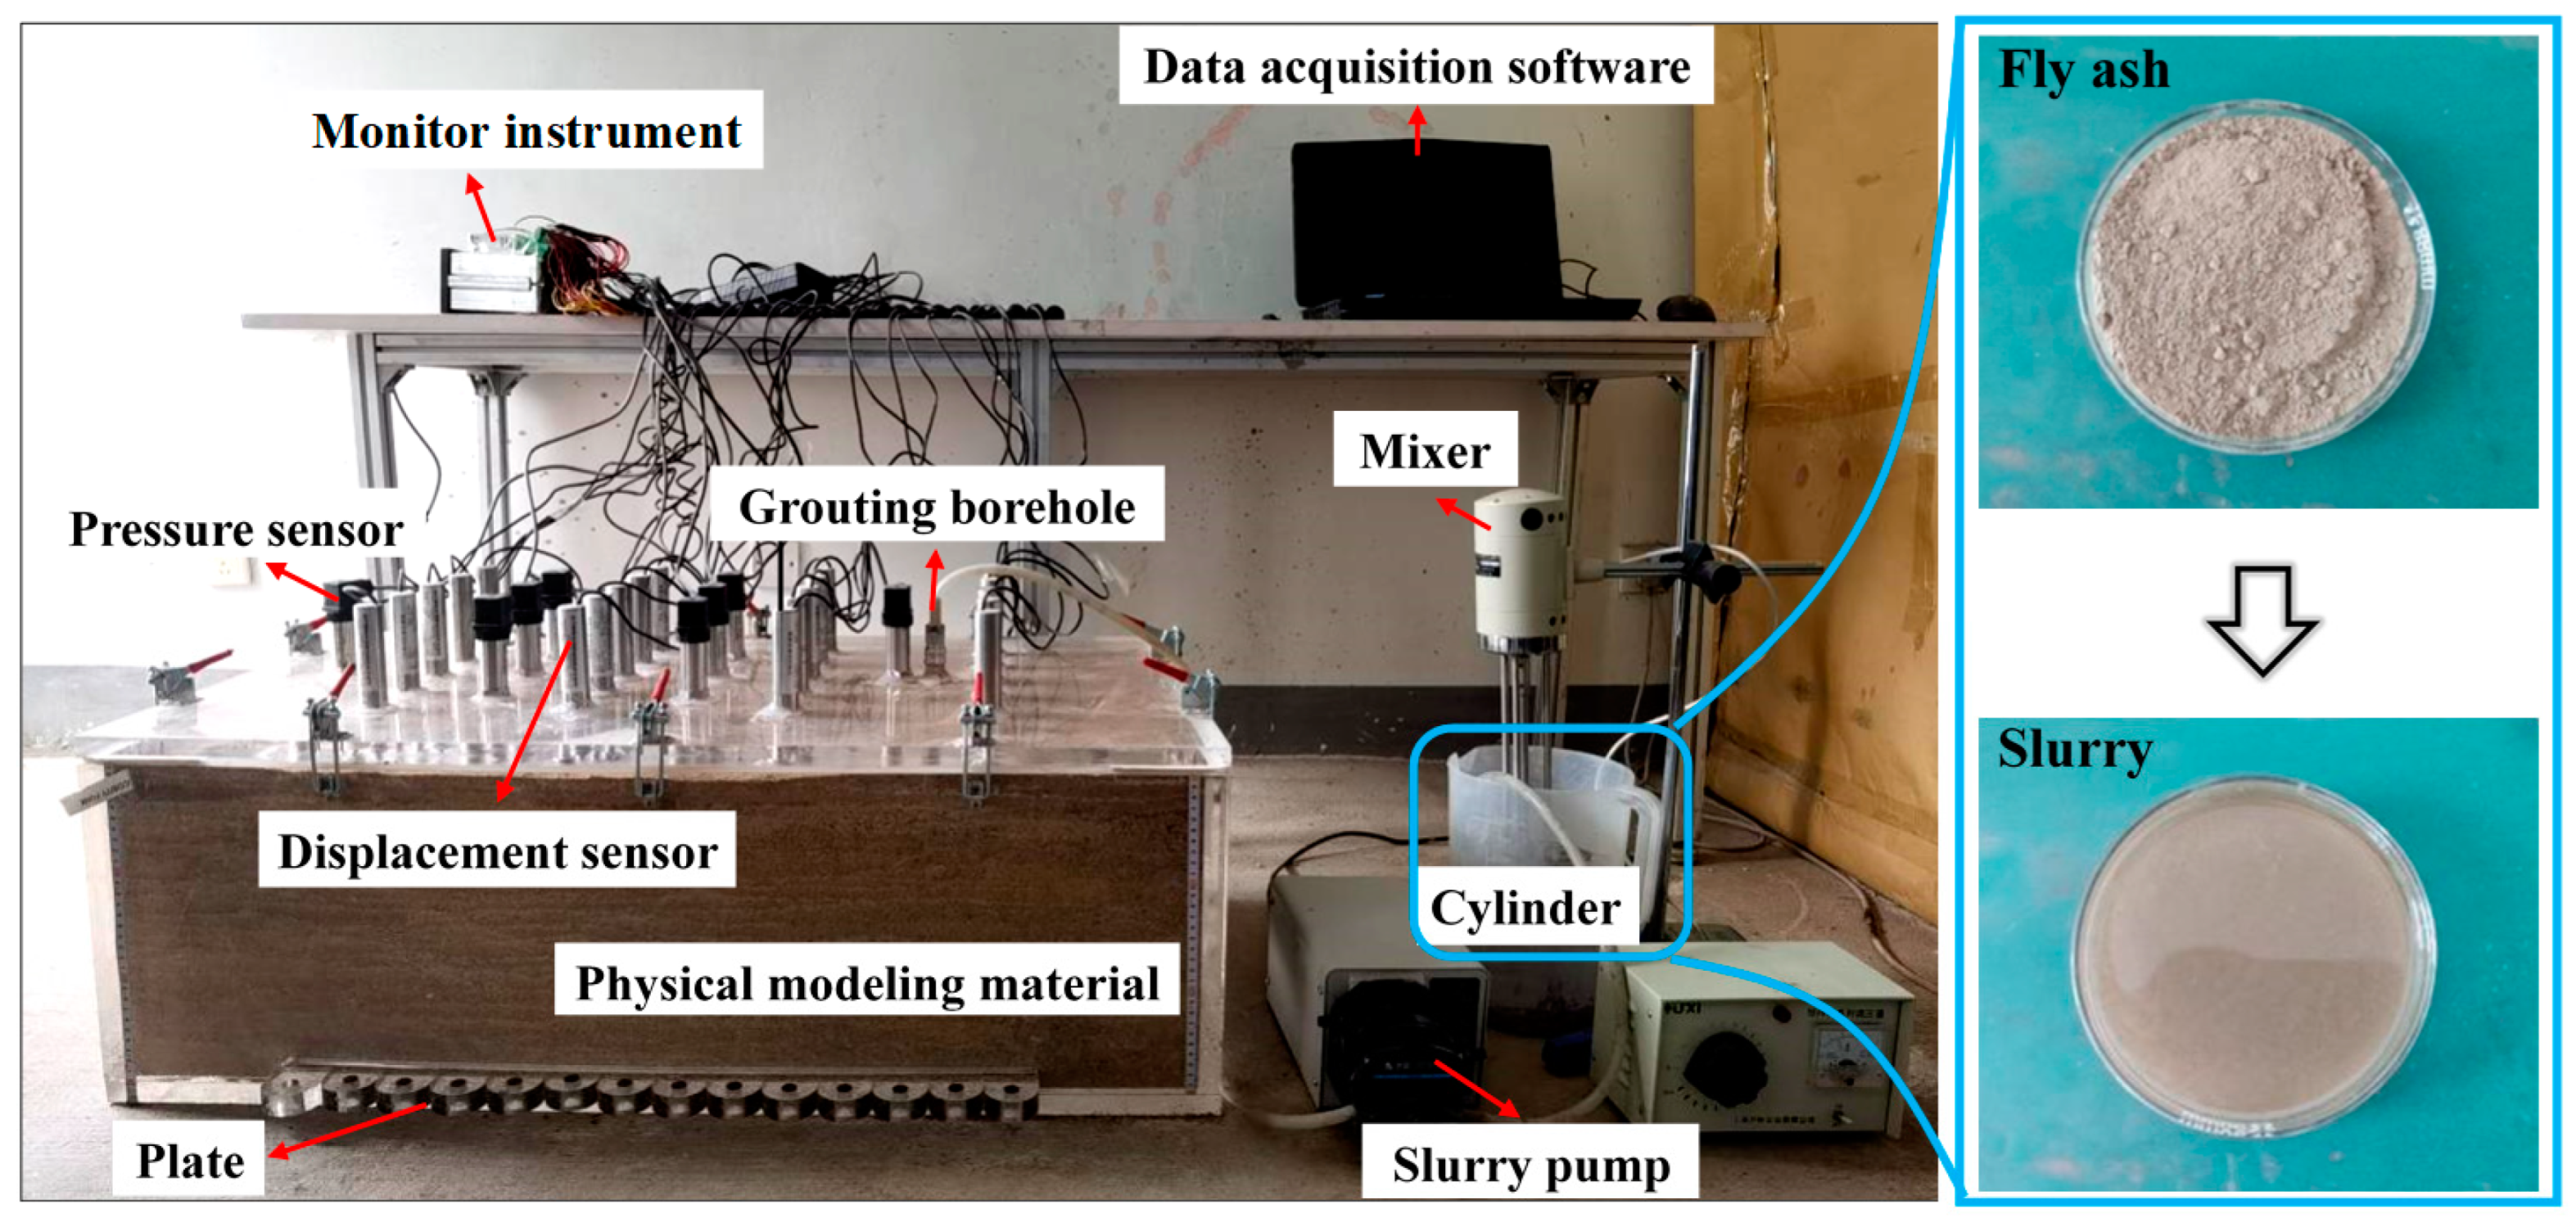
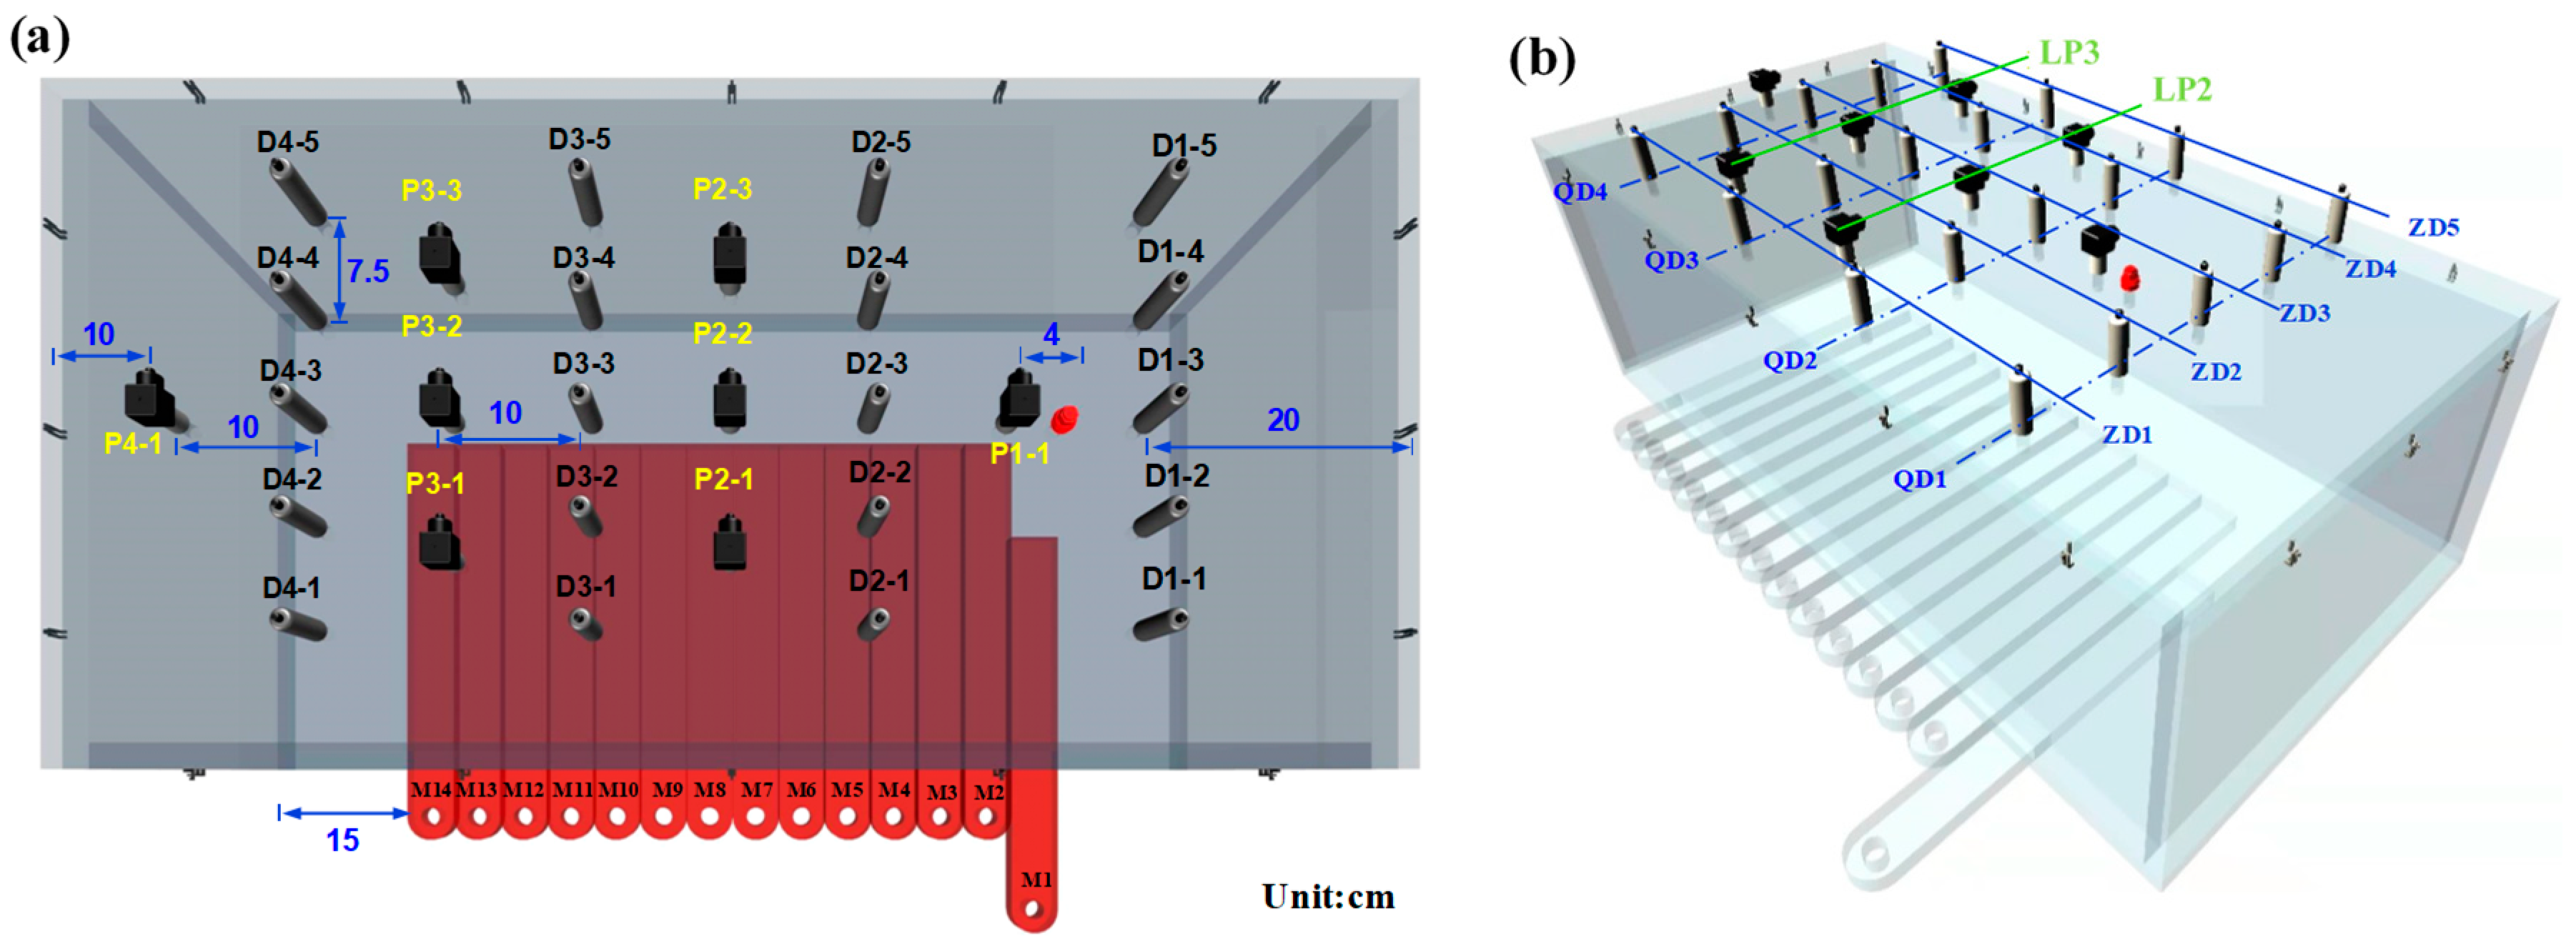
3.1. Experimental System

According to the geometric similarity ratio of 1:400, a three-dimensional experimental system was established. The main body of the experimental device was composed of a frame, bottom plate, and top cover plate, with a Plexiglas plate thickness of 20 mm; the inner length, width, and height of the experimental device were 1000 mm, 500 mm, and 300 mm, respectively. Longwall face mining was simulated via long movable plates (with a length of 350 mm, a width of 50 mm, and a height of 20 mm); 14 pieces were arranged in the mining area, and the simulated mining range was 700 mm (strike) and 350 mm (inclined). The extraction plate serial numbers are M 1–14 in order along the longwall face mining direction, and a space of 150 mm was left between the mining area and the inner boundary of the device to simulate the boundary protecting the coal column. During the experiment, the mining longwall face was simulated by pulling out the strip extraction plate to reproduce the process of mining overburden movement.
The three-dimensional experimental system consisted of a main visualization experimental device, a strip plate that simulated coal seam mining, physical modeling material, a slurry preparation and filling unit, an adjustable speed mixer, a constant rate slurry pump, pressure sensors, displacement sensors, data monitor instruments, and data acquisition software (Figure 3).
To monitor the rock masses’ collapse and compaction at different pressure stages during the grout-filling process, the grouting pressure and the compaction amount of the fractured and bulking rock masses were monitored via pressure and displacement sensors, respectively. Both the pressure and displacement sensors were set on the upper cover of the device, and a total of 8 pressure sensors and 20 displacement sensors were arranged on the cover. The pressure sensors were arranged as follows. Sensor P1-1 was set 40 mm from the grouting borehole to monitor the pressure at the bottom of the grouting hole. At 200 mm and 100 mm along the longwall working face inclination direction, sensors were placed to monitor the pressure −40 mm, 240 mm, 440 mm, and 640 mm from the hole; the pressure sensors were numbered P1-1, P2-1–P2-3, P3-1–P3-3, and P4-1 along this direction. Of these sensors, P2-1–P2-3 formed the pressure measurement line LP2 and P3-1–P3-3 formed the pressure measurement line LP3.
To monitor the compaction amount of the fractured and bulking rock masses at different locations in the filling zone during the grouting process, four rows of displacement sensors were evenly arranged at intervals of 200 mm along the longwall working face mining direction, with a sensor spacing of 75 mm in any given row; that is, there were four compaction measurement lines along the working face, namely QD1, QD2, QD3, and QD4, at distances of −60 mm, 140 mm, 440 mm, and 640 mm, from the grouting borehole. In addition, there were five compaction measurement lines along the working face: ZD1, ZD2, ZD3, ZD4, and ZD5 (Figure 4).

3.2. Experimental Materials

A simulation material made by mixing sand, calcium carbonate, gypsum, and water was used to simulate the multiple layers of rock within the collapse and fracture zones. Because the sinking of the key strata under the injection filling condition is small, an upper cover plate was used instead of key strata such that the slurry movement and the rock mass compaction process could be clearly demonstrated. The difference in the water–ash ratio of the slurry in the experiment has little effect on the final results since the water bleeds from the fill. With reference to the water–ash ratio of the slurry in the grout-filling project, the water-to-ash ratio of the slurry in the experiment is determined to be 1.6:1.
The above-simulated materials are highly susceptible to disintegration when exposed to water, and therefore they cannot simulate isolation layers that are in direct contact with the grouting level. On the basis of the method described in [51], a new simulation material that does not disintegrate when exposed to water was formulated using paraffin, hydraulic oil, talcum powder, river sand, and straw powder to simulate a multilayered isolated rock layer; the simulation material was laid layer by layer in the experimental setup to construct the simulation stratum (Table 1).

3.3. Experimental Process

Prior to the start of the experiment, the airtightness of the filling experimental system was checked and the pressure sensor, displacement sensor, and data acquisition software were debugged. During the experiment, the strip plate was pulled out from the bottom of the experimental device by 35 cm every 12 min. The single mining volume was 350 cm3, which simulated the mining of the workface 14 times in total, that is, the plates were drawn 14 times in a given experiment to extract the total volume. The grouting pump volume was set to 20 mL/min, and the grout filling began as the M3 plate was withdrawn (the total mining distance of the longwall face was 15 cm). At this moment, the longwall face mining past the grouting hole was 4 cm, and when the longwall working face mining was completed, the grouting filling was stopped.

4. Results and Discussion

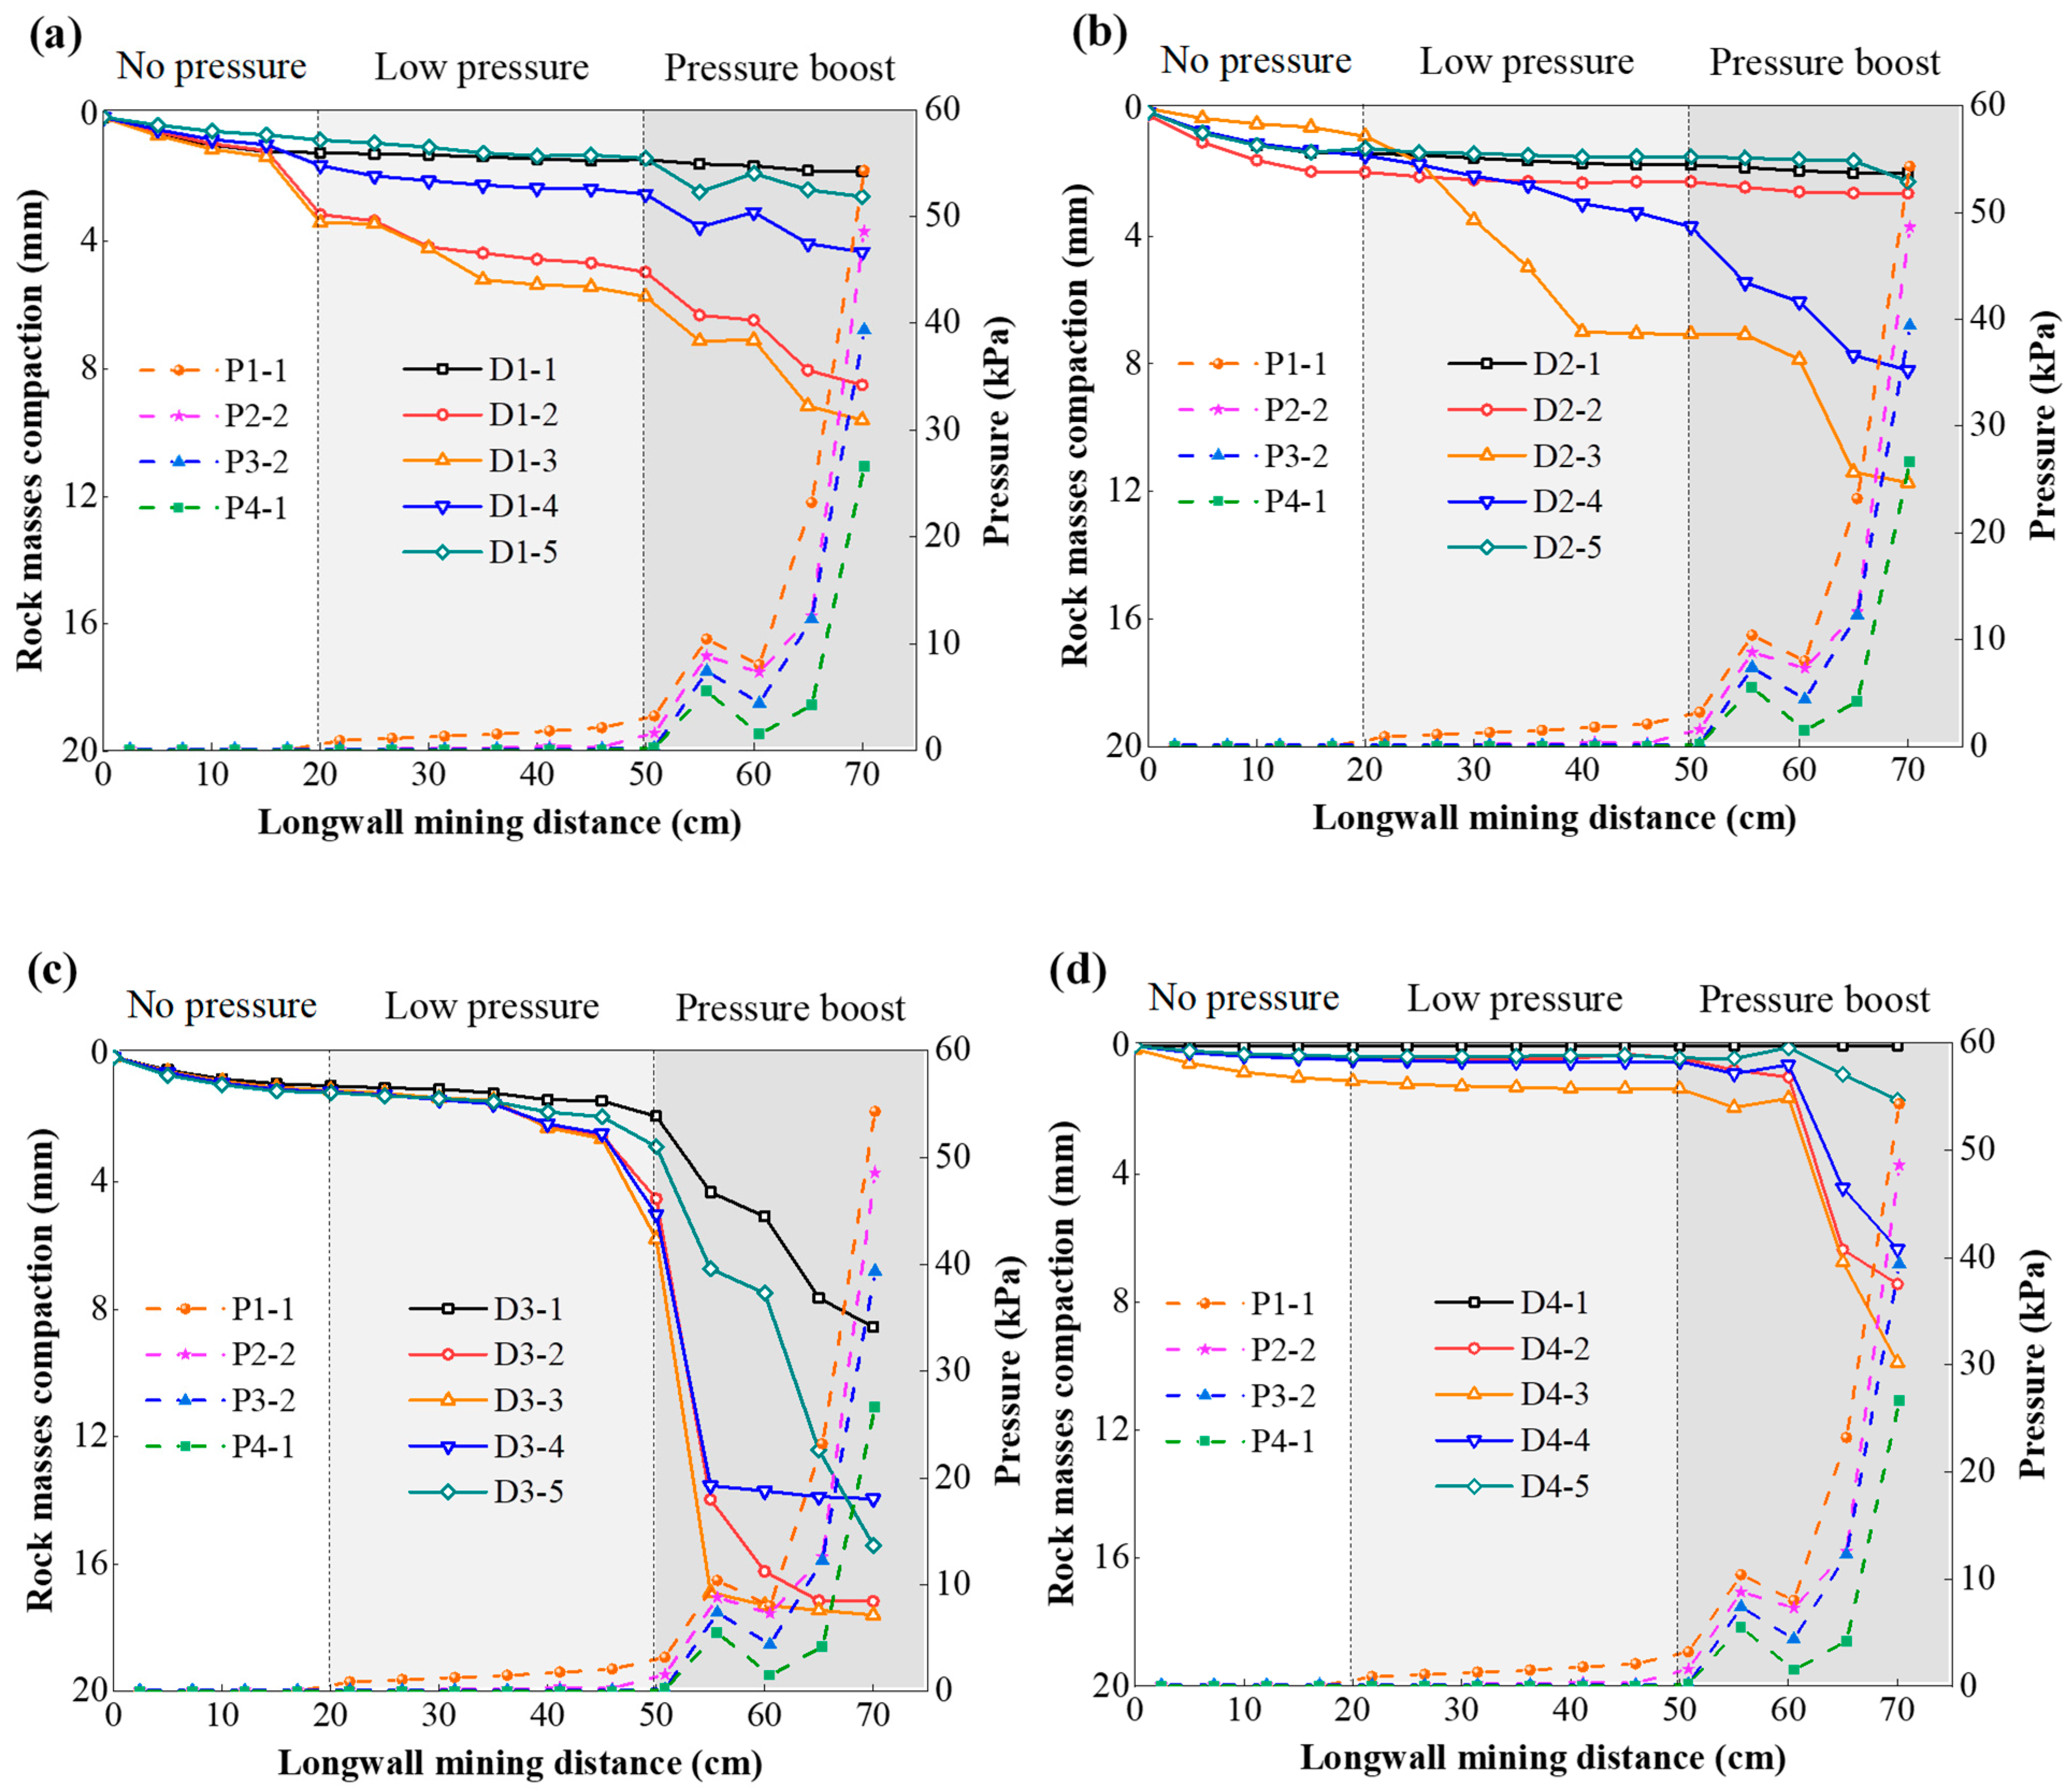
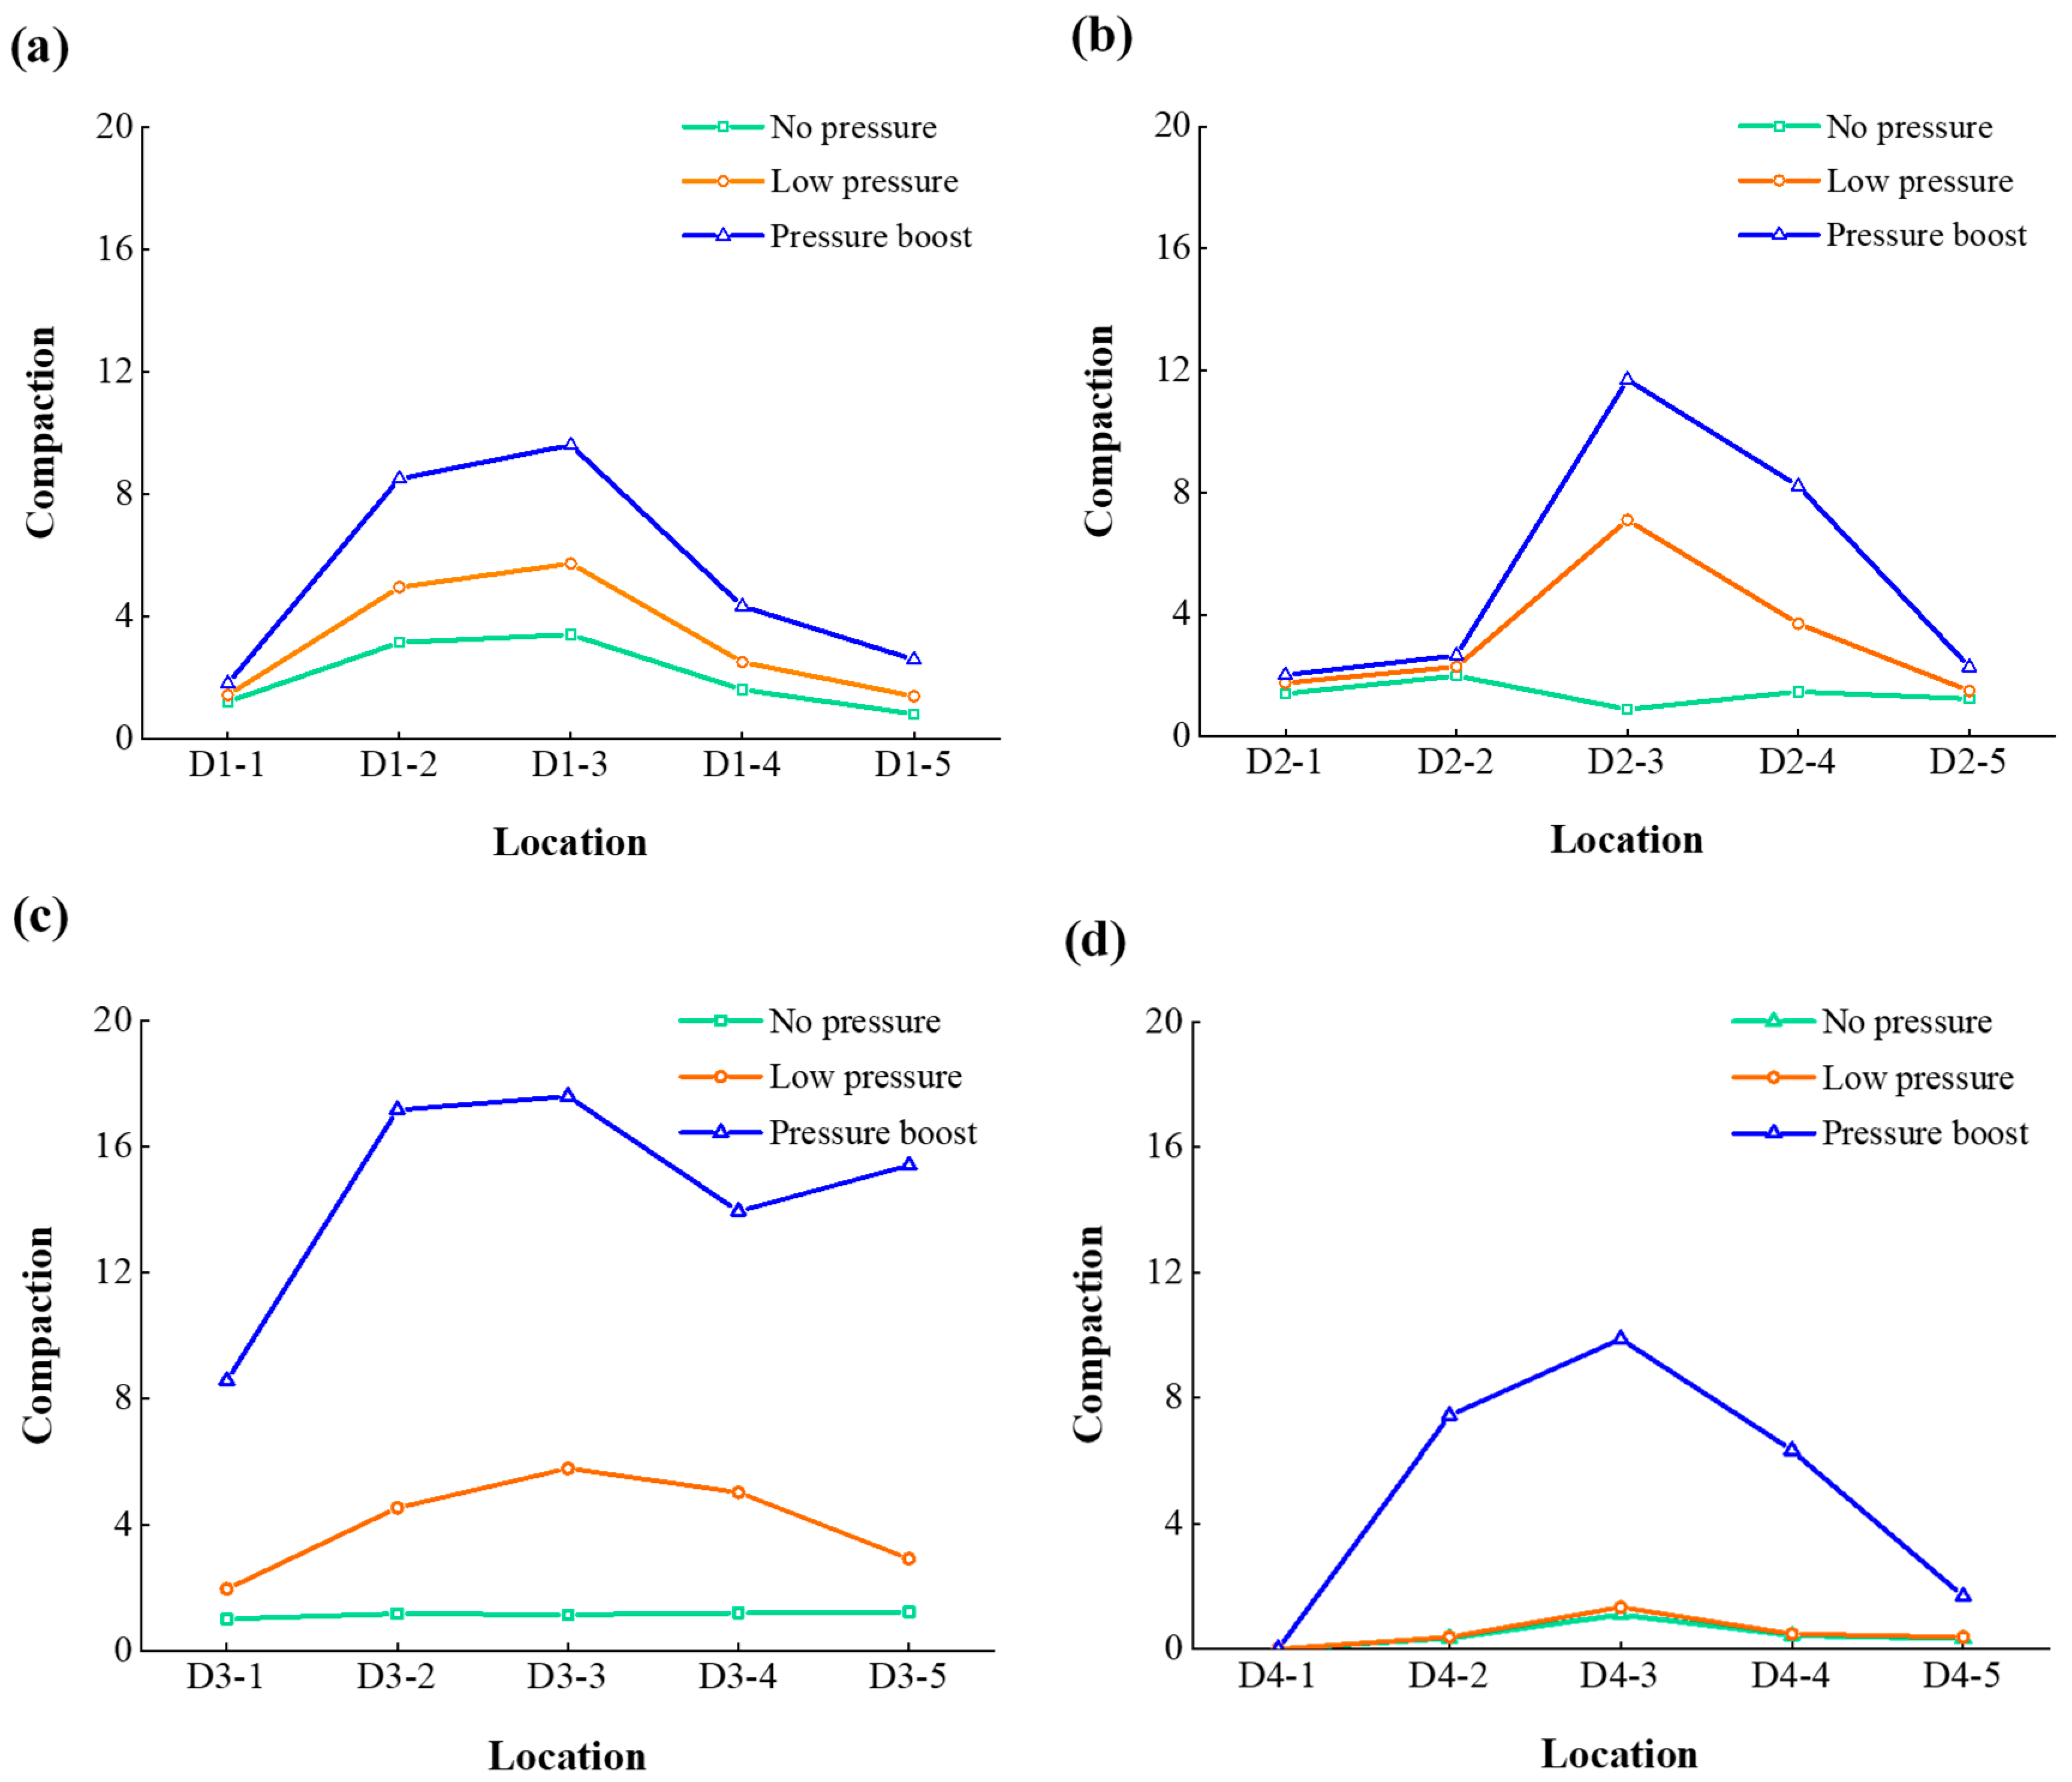
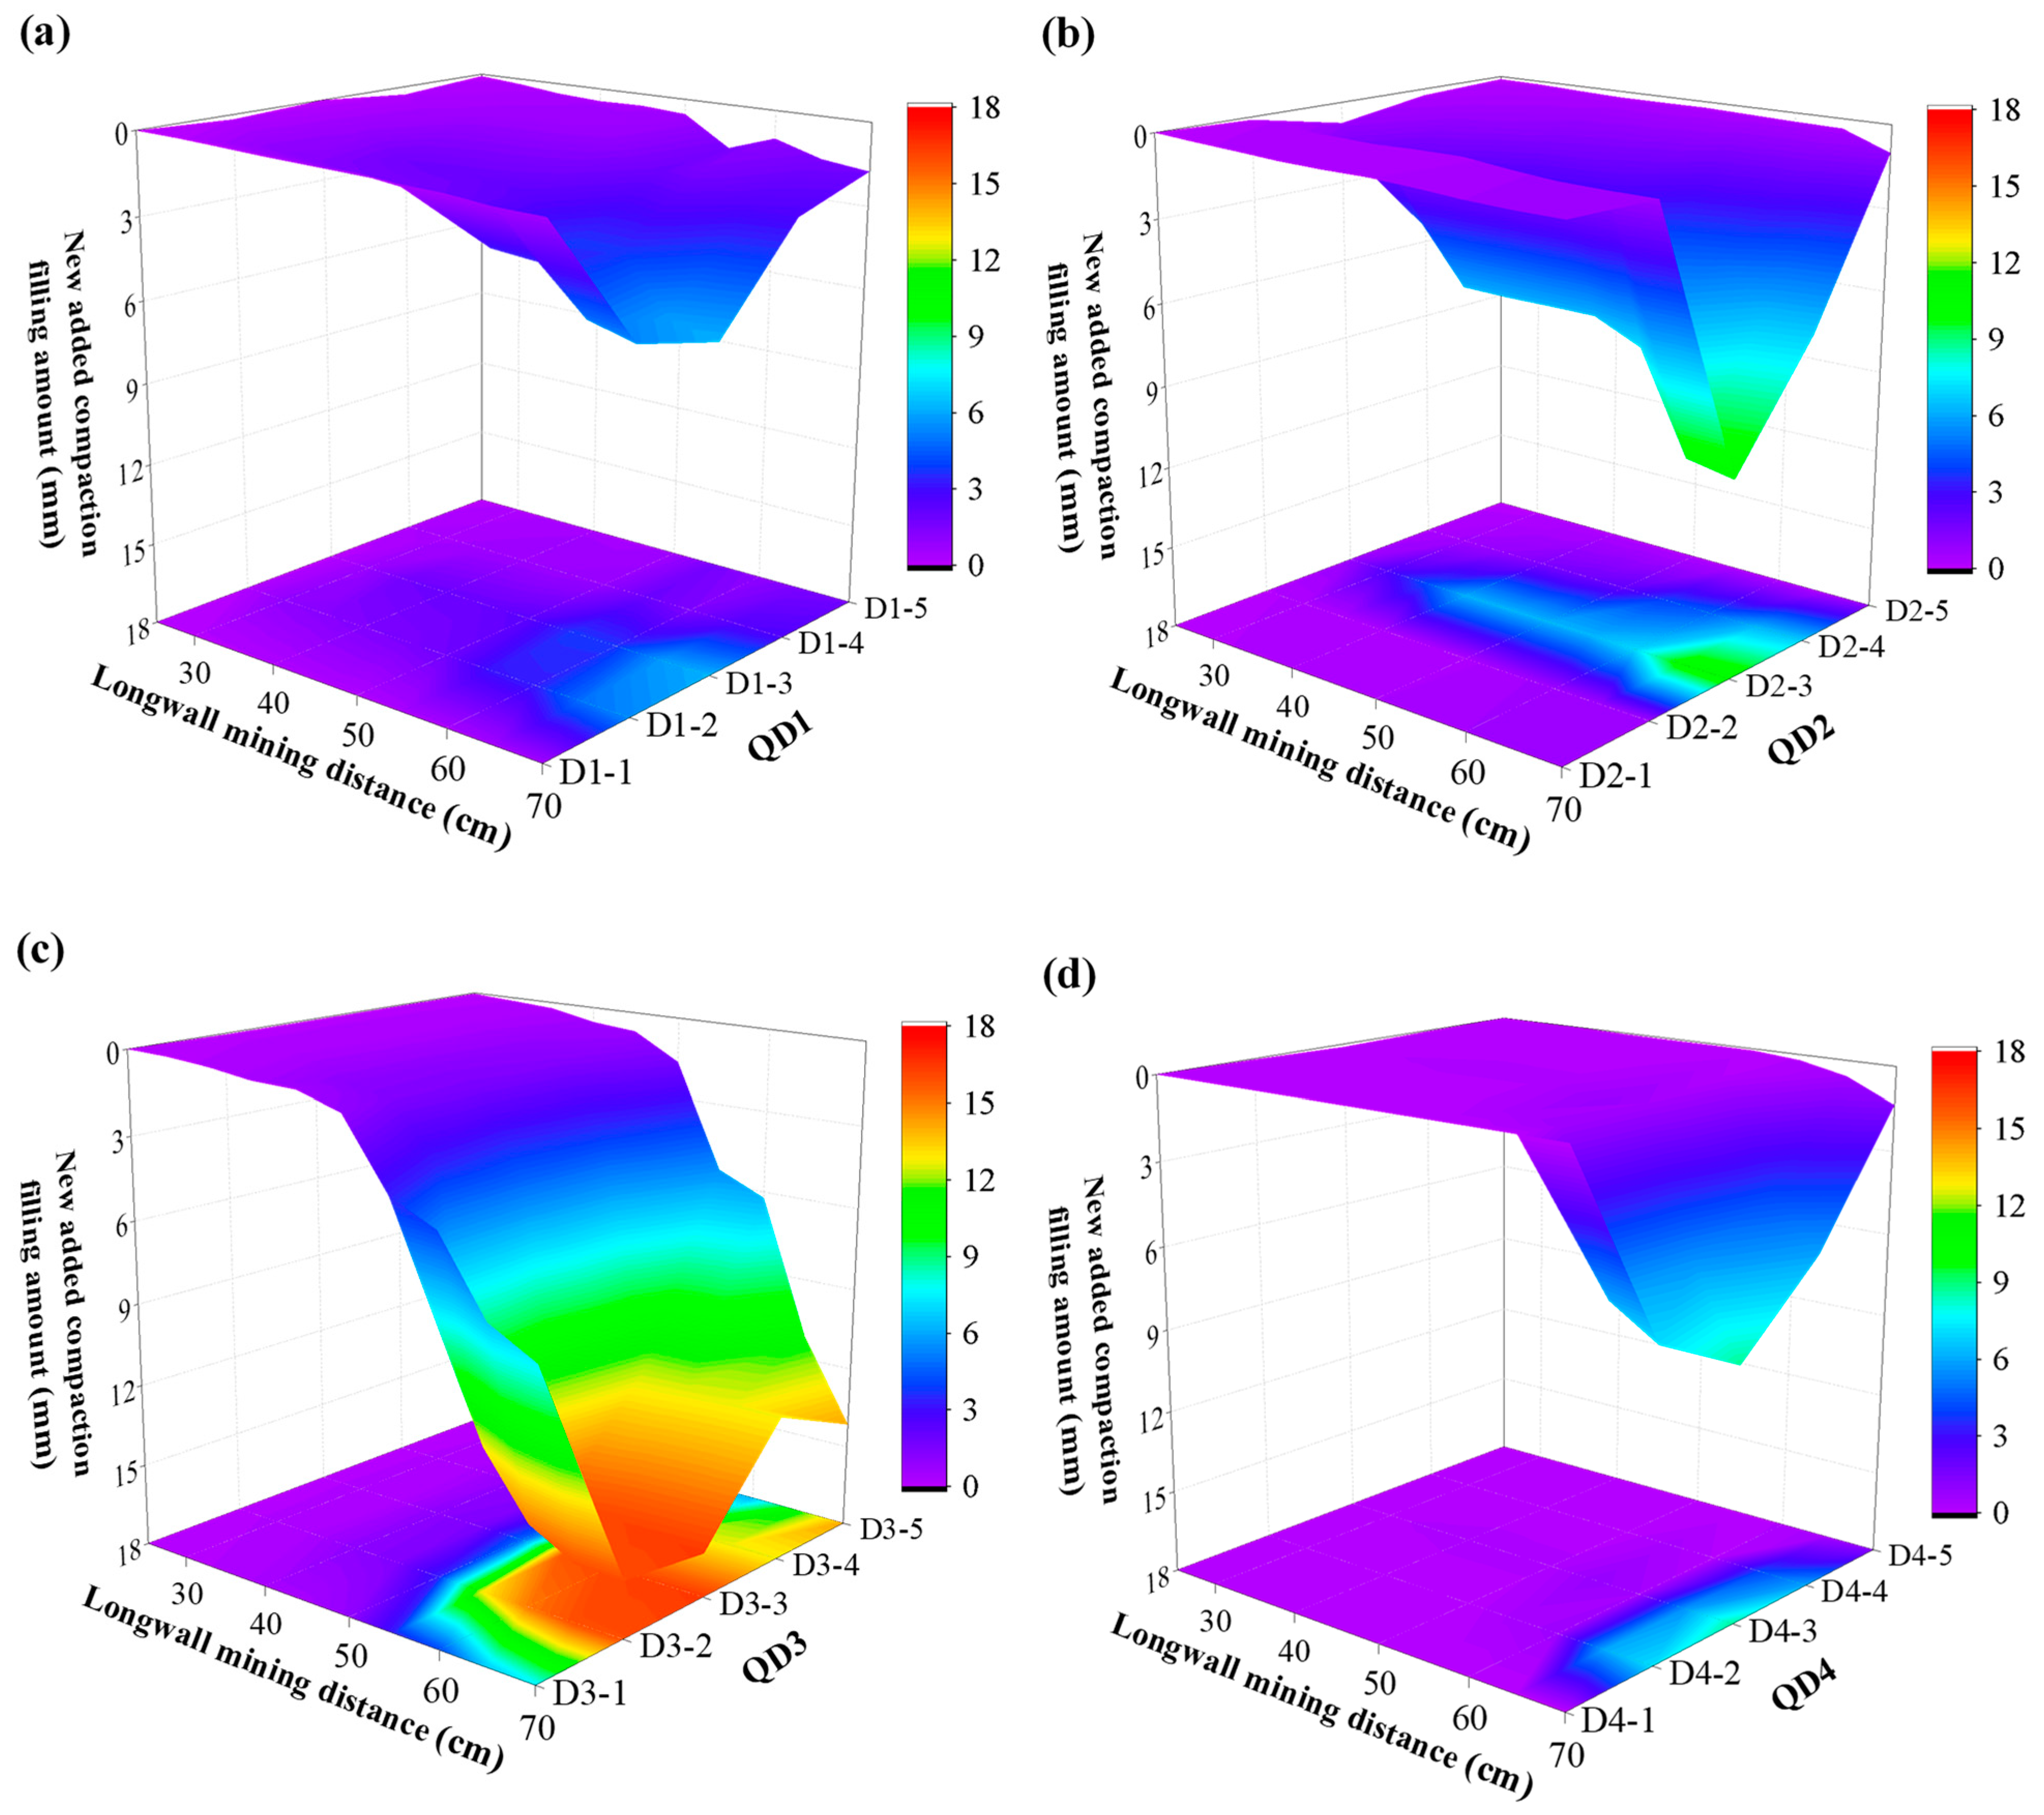
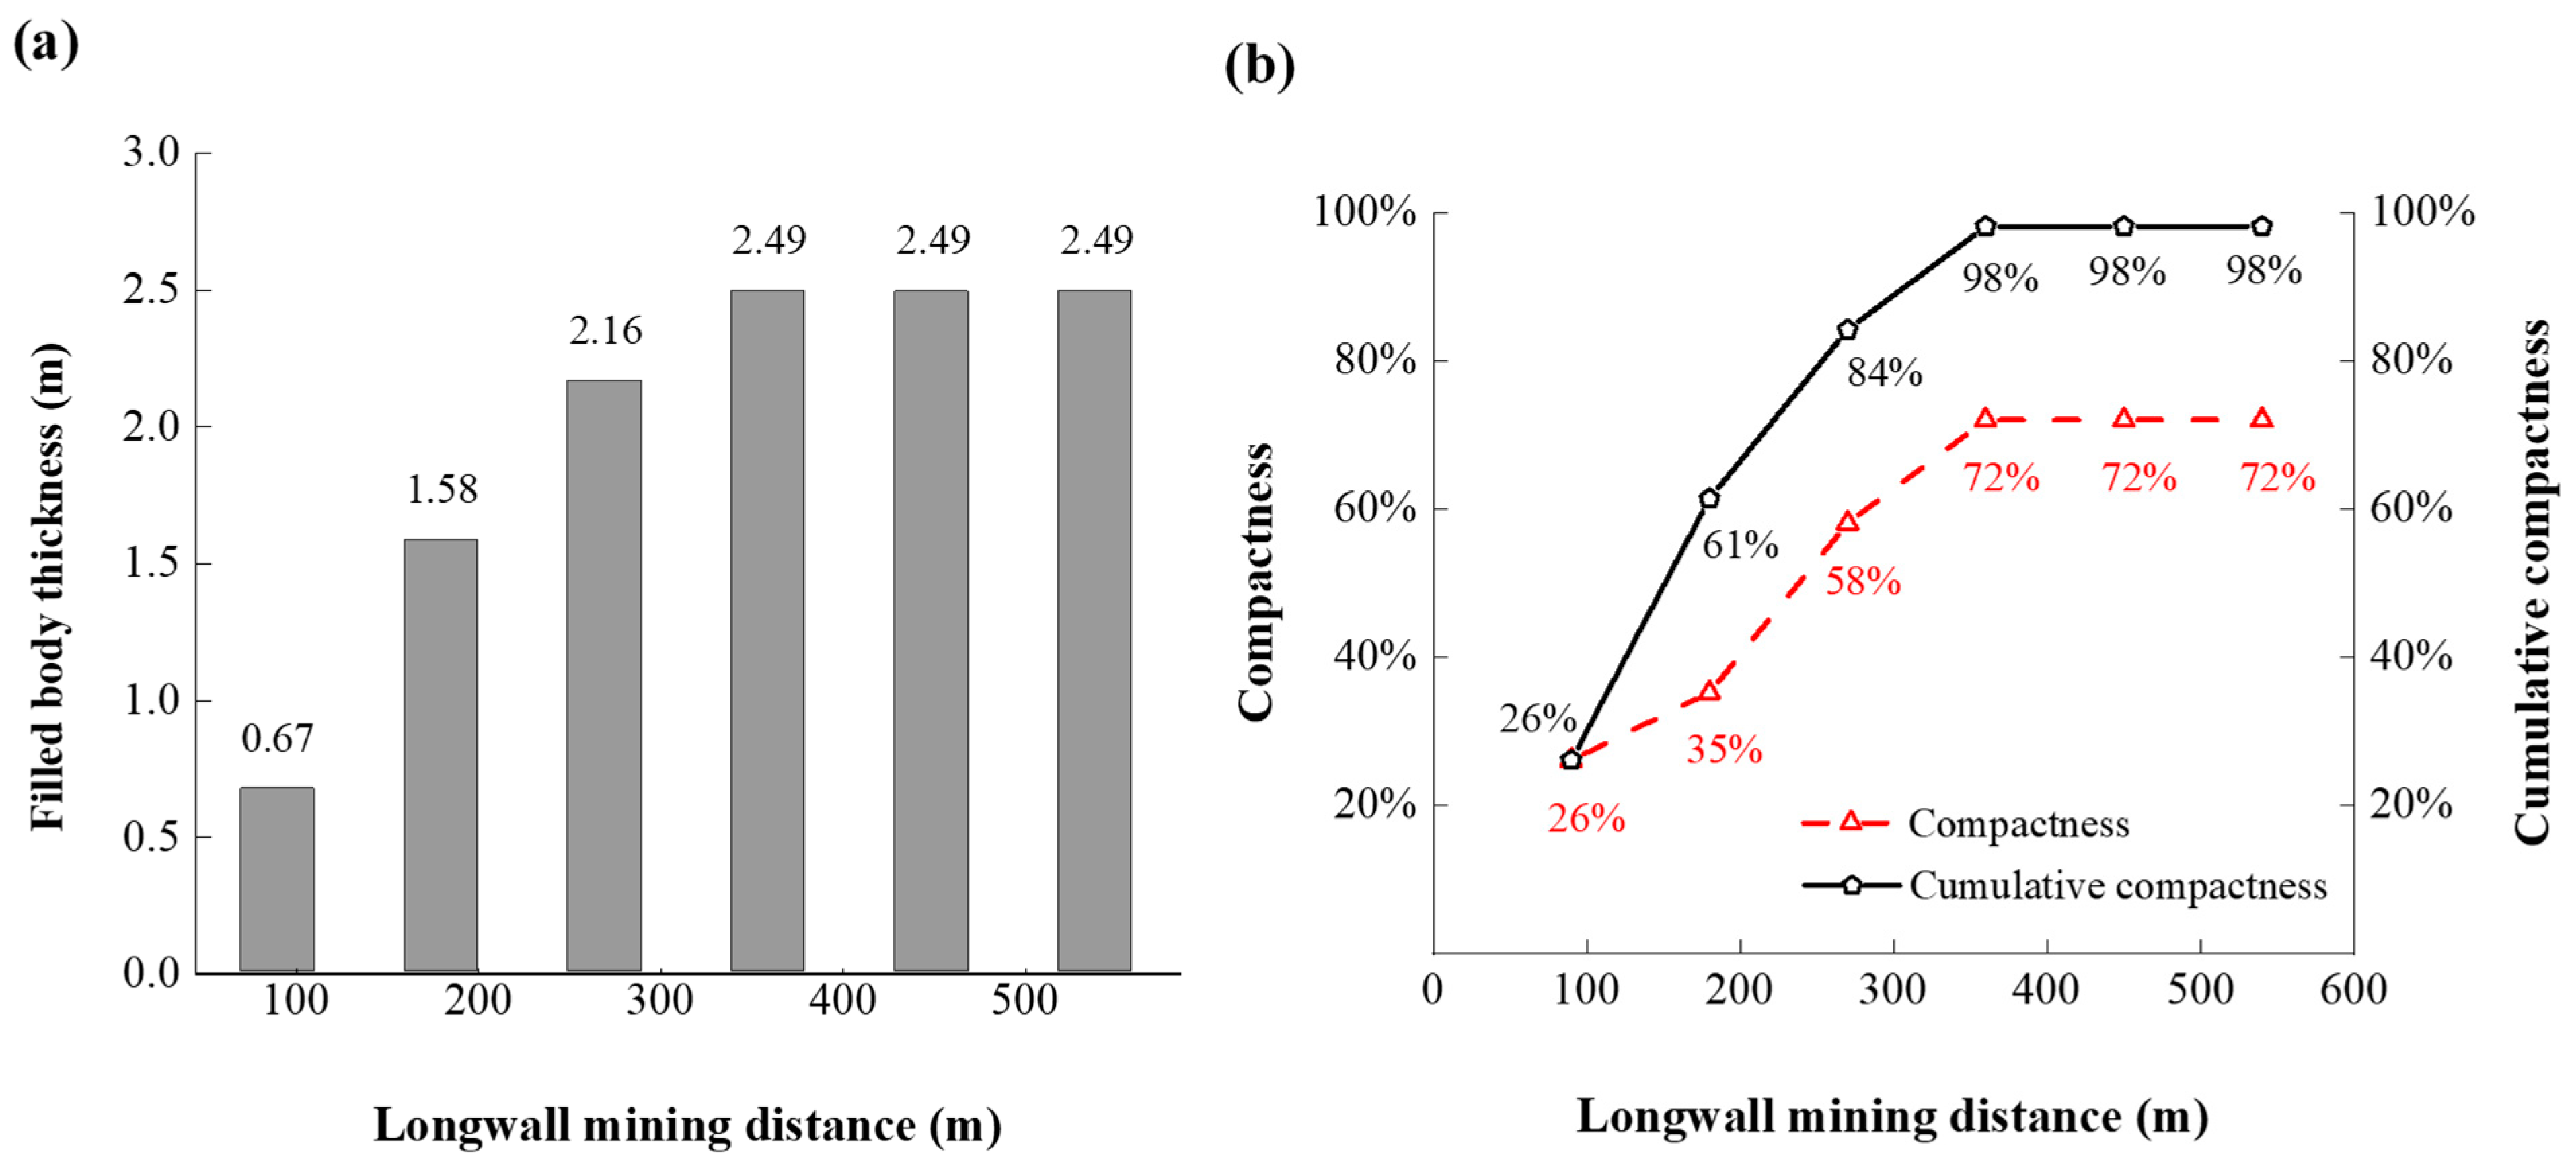
4.1. Rock Masses Compaction Associated with Grouting

Influenced by the distribution law of the grouting pressure, the compaction response characteristics of the fractured and bulking rock masses at different locations during grouting differ, and there are obvious spatial differences in the compaction volume at each location. For example, the compaction volume near the inclination lines −40 mm, 240 mm, 440 mm, and 640 mm from the filling borehole during the different pressure stages satisfies the distribution characteristics of larger in the middle and smaller at the boundary.
To analyze rock masses compaction in response to grouting, the pressure inside the mining-induced fracture zone is divided into three stages: no pressure, low pressure, and pressure boost. During the different pressure stages, the pressure at different locations along the longwall workface strike distance from the borehole shows the same increasing trend as the borehole pressure but the pressure values are not equal. The pressure values at each position of the inclined direction at the same distance from the borehole are nearly equal, indicating that the pressure at any position in the filled area can reflect the pressure in the inclination section (Figure 5). During the no-pressure stage, the pressure is zero in the entire filled zone. During the low-pressure stage, the pressures at 240 mm, 440 mm, and 640 mm from the grouting borehole are 60%, 37%, and 19% of the borehole pressure, respectively. During the boost stage, the pressures at these locations reach 90%, 84%, and 51%, respectively, of the borehole pressure. This indicates that the grouting pressure in the filling zone decreases along the longwall advance direction.
During the no-pressure stage, the ultimate compaction amount of the rock masses at QD1, QD2, QD3, and QD4 is 3.41 mm, 1.99 mm, 1.22 mm, and 1.09 mm, respectively. During the low-pressure stage, the ultimate compaction amount at the above locations is 5.73 mm, 7.06 mm, 5.79 mm, and 1.33 mm, respectively. During the pressure-boost stage, the ultimate compaction amount at the above locations reaches 9.6 mm, 11.7 mm, 17.6 mm, and 9.9 mm, respectively (Figure 5).
According to the monitoring results, the compaction amount of the fractured and bulking rock masses during the no-pressure stage is small and reflects only the self-gravity compaction volume generated by the broken rock layer. During the low-pressure stage, the grout filling starts to compact the underlying fractured and bulking rock masses; however, this compaction effect is small. During the pressure-boost stage, the compaction volume of the fractured and bulking rock masses increases significantly compared with those during the no-pressure and low-pressure stages; the pressure-boost stage is key with respect to the compaction effect of the grout filling on the underlying rock masses, and the largest compaction volume of the rock masses is observed in the middle of the working face.
Furthermore, the compaction degree of rock masses is determined by using the injection fill thickness. The key strata did not deform during grouting, and therefore the thickness of the filled body is equal to the amount of rock masses compaction. The ultimate compaction of the rock masses corresponding to the three pressure stages of no pressure, low pressure, and pressure boost during the grout-filling process can be solved by using Equation (2). The values of the parameters were a mining height M 2 cm, the caving zone height Hc 6 cm, and the residual bulking coefficient of the collapsed rock masses Kp 1.03. According to the experimental monitoring results, the maximum thickness of the filled body in the no-pressure stage was 3.4 mm. During the low-pressure stage, the accumulated maximum thickness of the filled body was 7.1 mm, and the thickness of the newly incremental filling body during this stage was 3.7 mm. The accumulated maximum thickness of the filled body during the pressure-boost stage was 17.6 mm, and the thickness of the newly incremental filled body during this stage was 10.5 mm (Figure 6a).
The self-weight compaction generated by the fractured and bulking rock masses during the no-pressure stage was 19%. After entering the low-pressure stage, the cumulative compaction of the fractured and bulking rock masses under the action of grouting was 39% and the new compaction within this stage was 20%. After entering the pressure-boost stage, the cumulative compaction of the fractured and bulking rock masses under the action of grouting reached 97% and the new compaction during this stage was 58% (Figure 6b). Therefore, the compaction of rock masses under the grouting pressure in the pressurized stage (including the low-pressure and pressure-boost stages) was 78%, indicating that the pressurized stage is key with respect to the compaction of the lower rock masses.

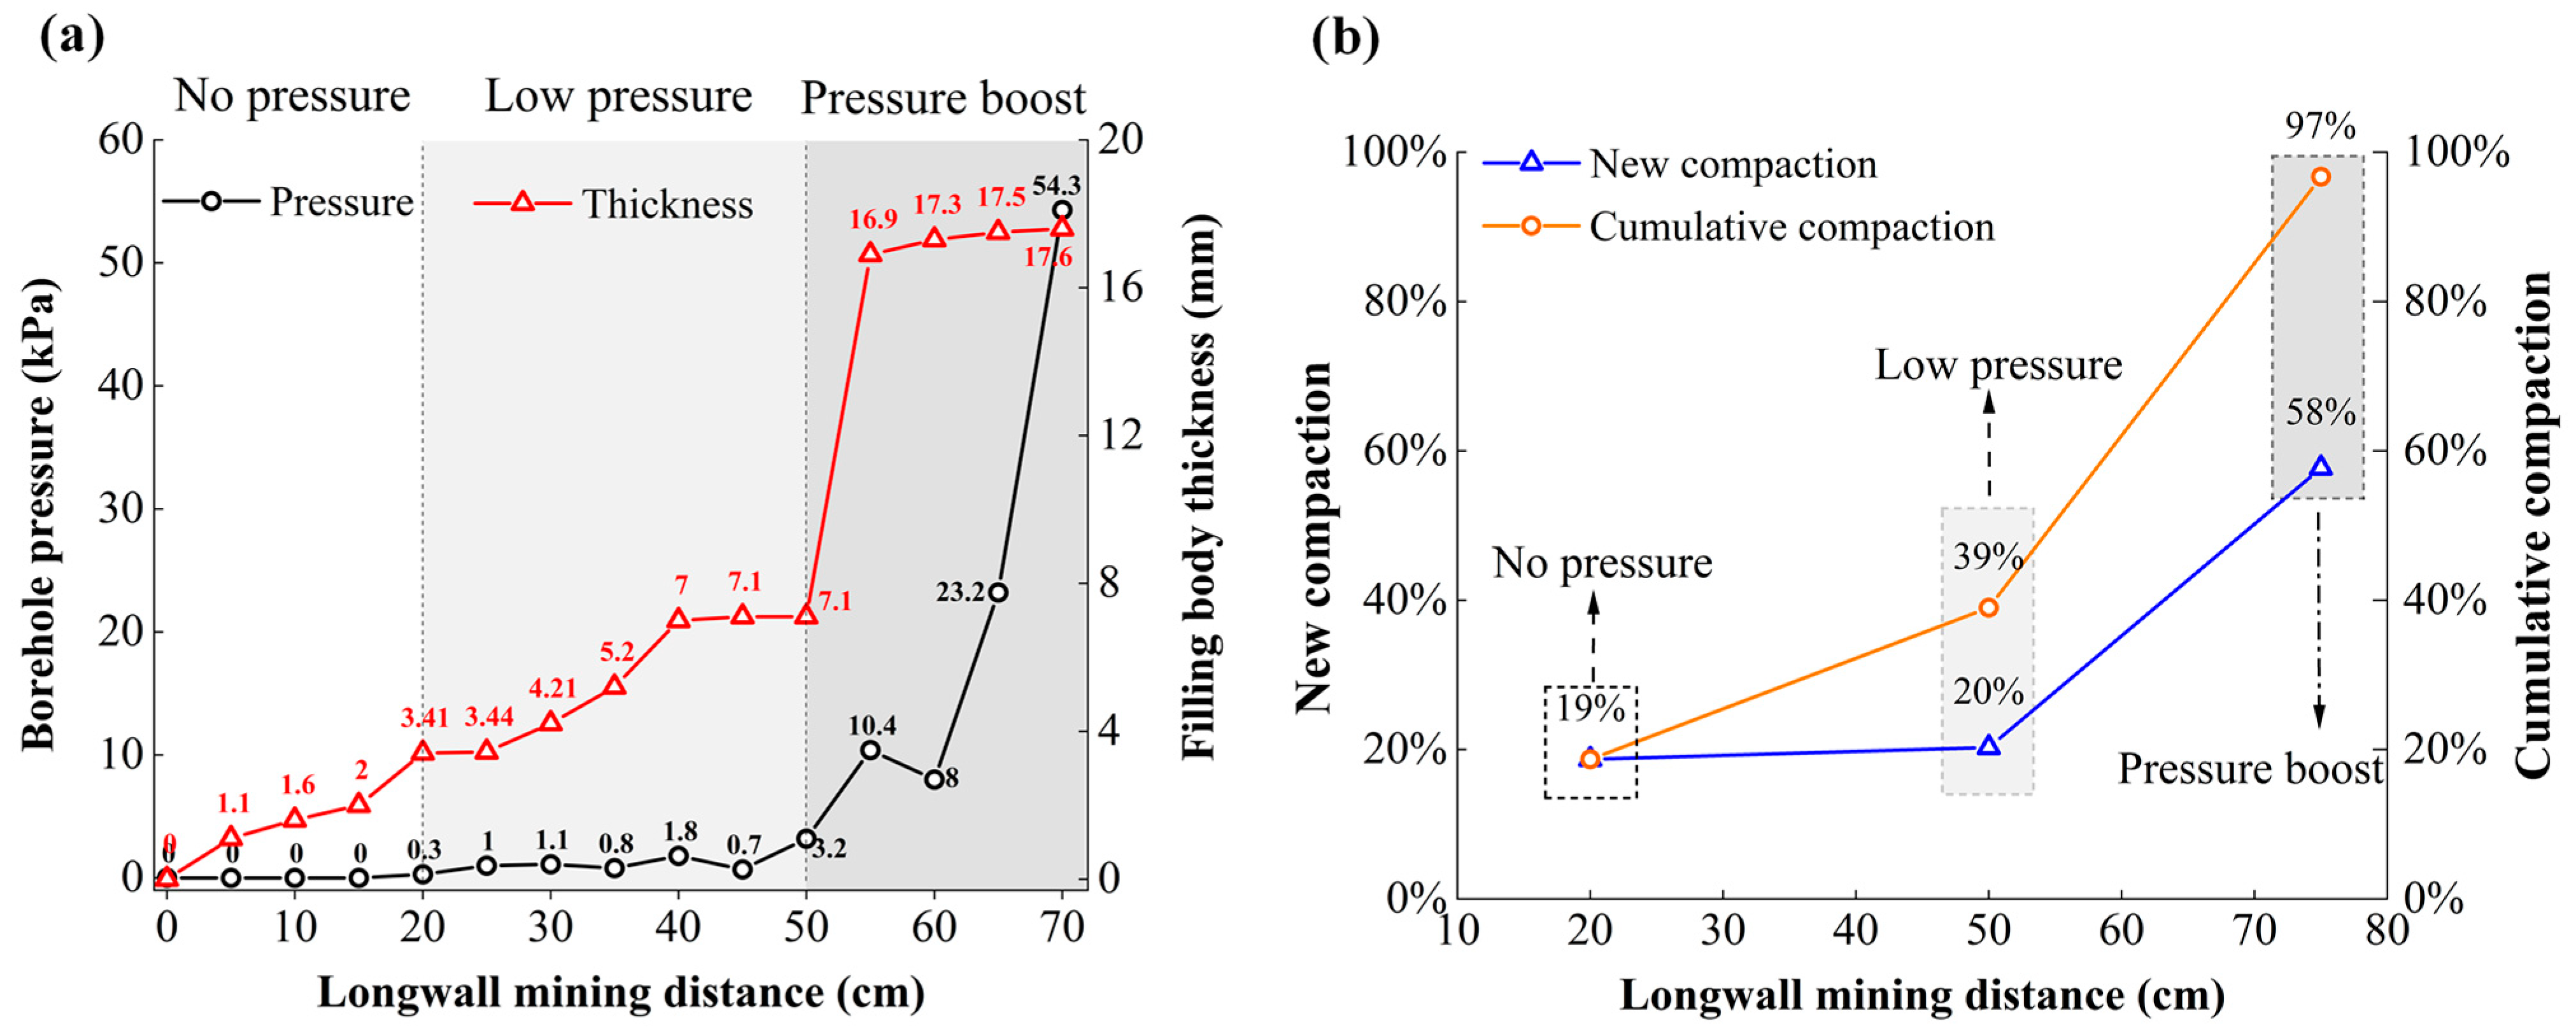
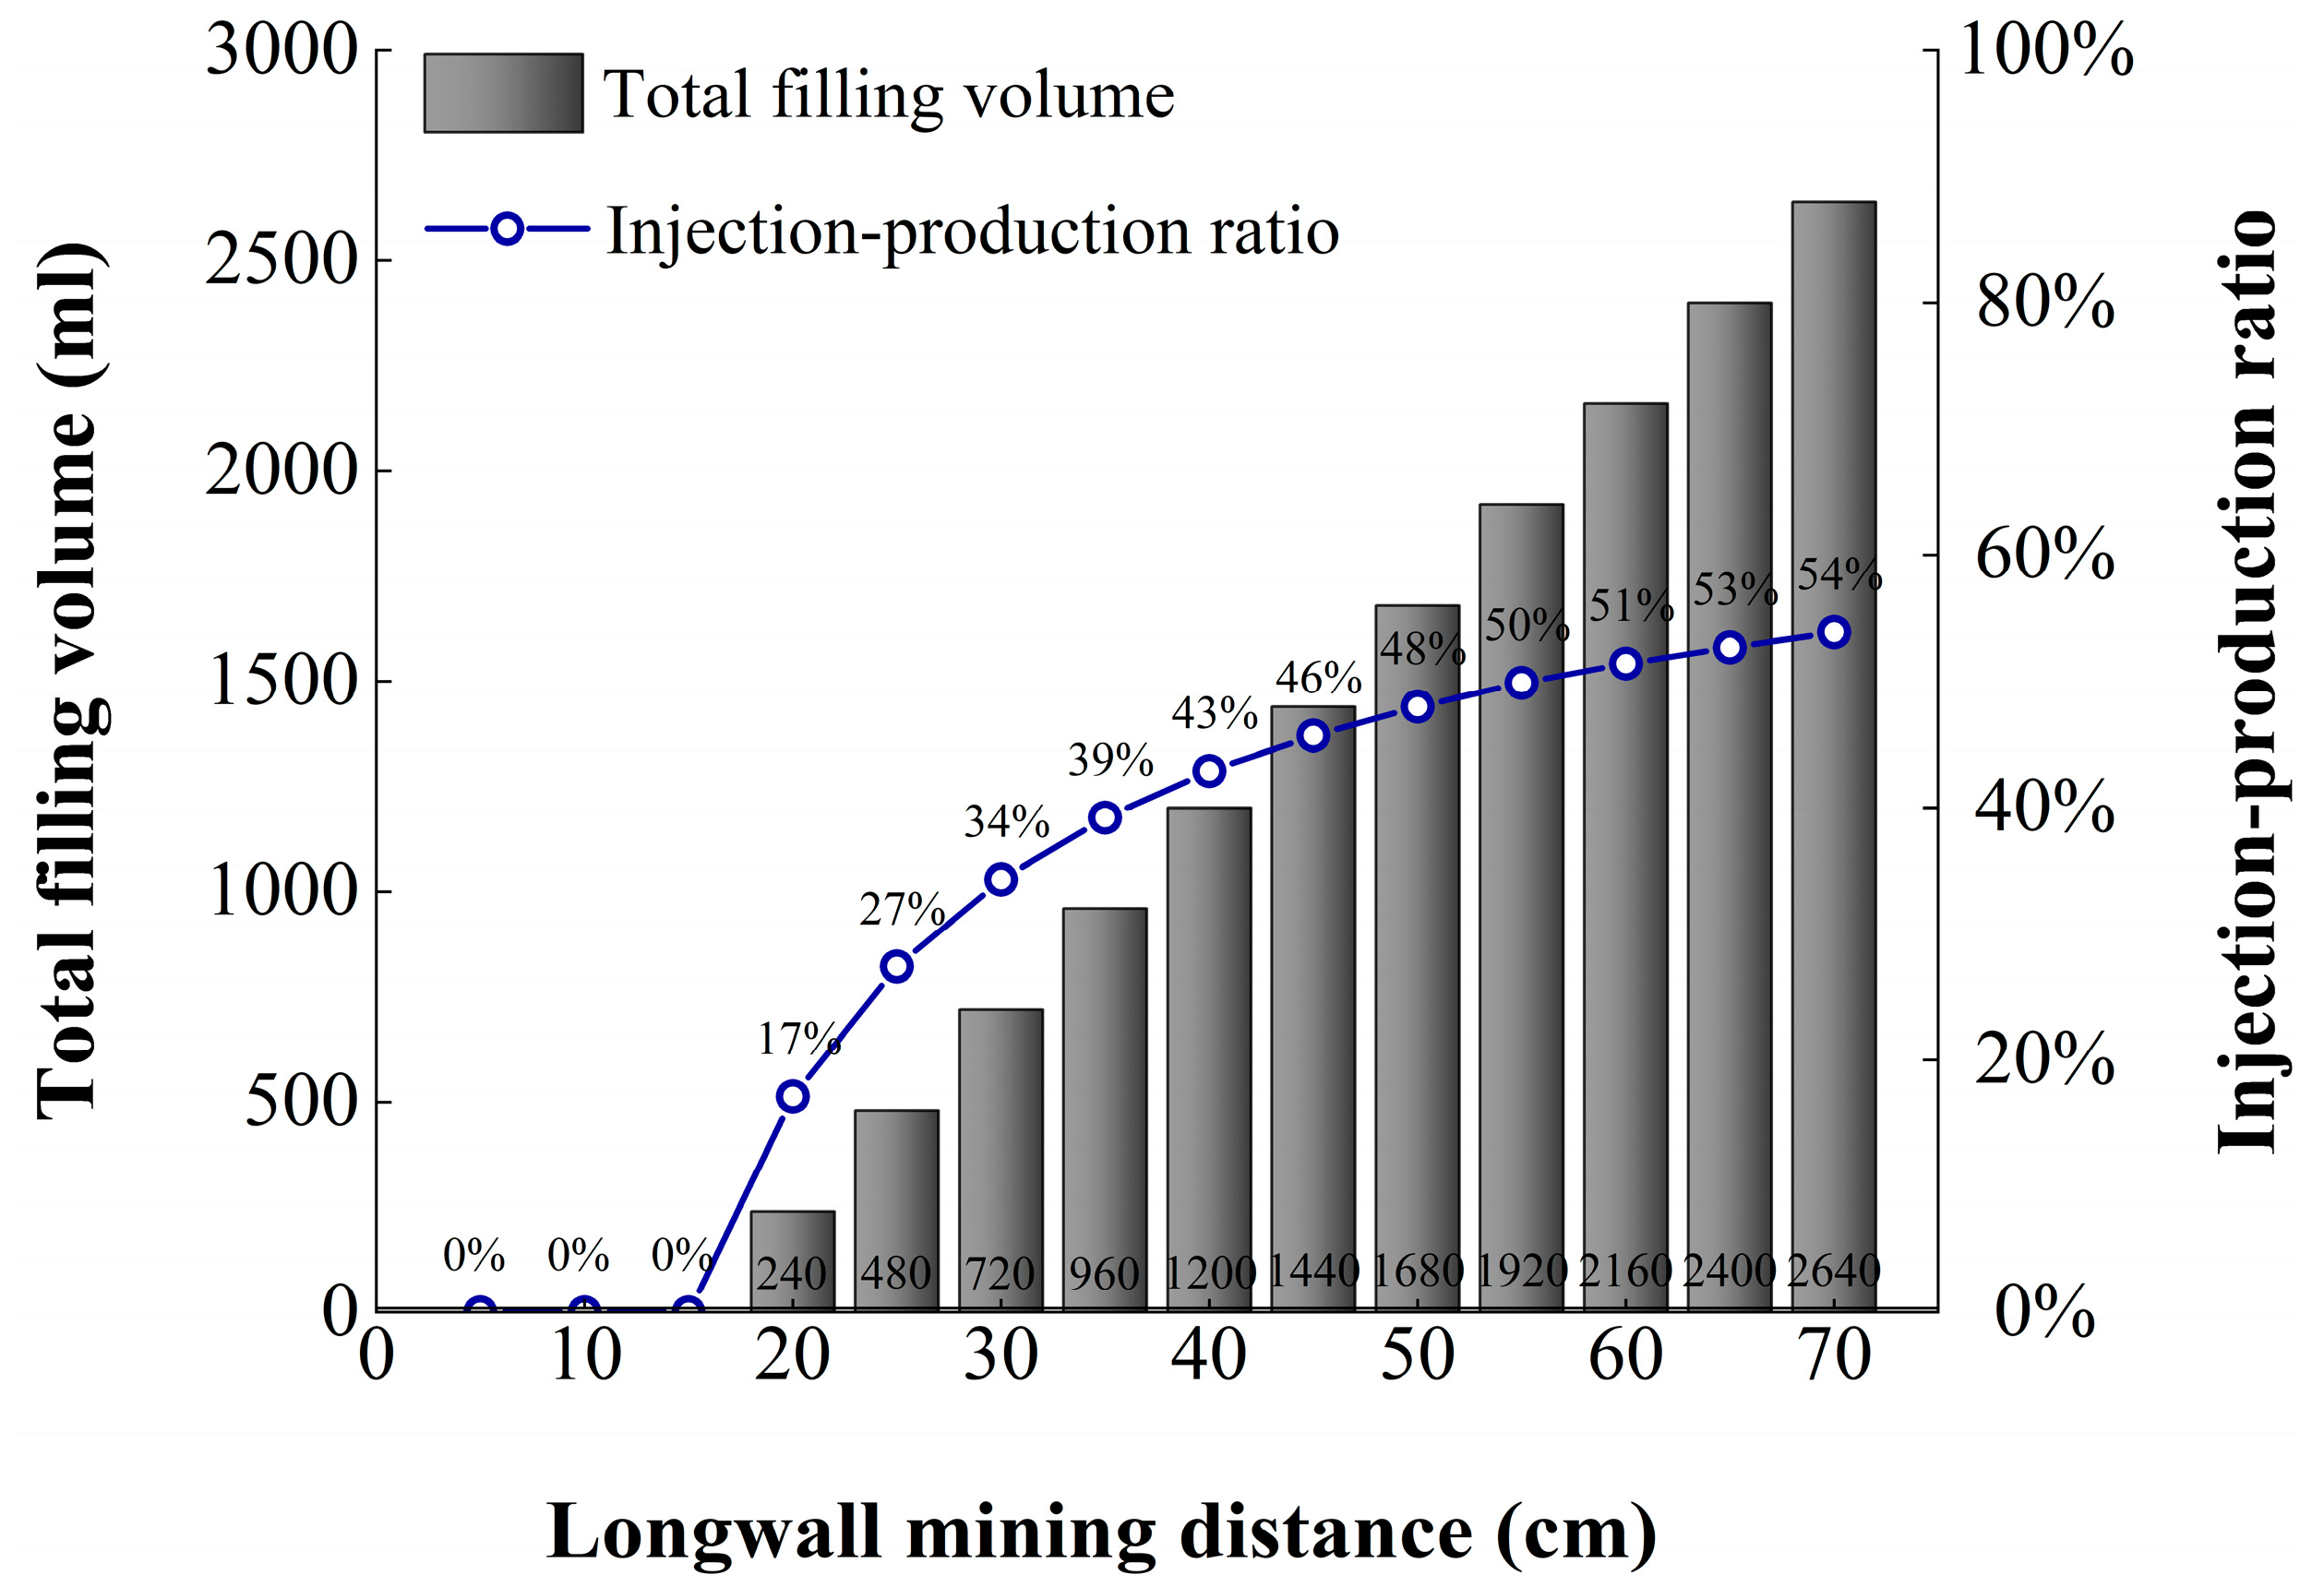
4.2. Mechanism of Filling Volume Increase under Compaction Grouting

As discussed before, the fill volume is primarily attributed to the compaction of the fractured and bulking rock masses under the grouting. In this regard, the injection volume can be referred to as pressure-induced filled volume. The spatial distribution of pressure-induced filled volume is closely related to the compaction degree of the lower rock masses.
From the experimental results, the volume of the filling body during the no-pressure stage is 240 mL, while the total filled volume during the pressurized stage (including the low-pressure and pressure-boost stages) is 2400 mL. Therefore, the pressurized stage is key to the pressure-induced filled volume increase (Figure 7).
Under the conditions of grout filling, the rock masses compaction at different locations from the borehole along the inclined direction is maintained at a low level during the no-pressure stage. Meanwhile, entering the low-pressure and pressure-boost stages, the new compaction volume far exceeds the self-weight compaction of the rock masses generated in the no-pressure stage. Compared with the no-pressure stage, the newly added compaction volumes in the middle of each inclined measurement line during the pressurized stage are 1.68 mm, 2.28 mm, 11.76 mm, and 1.66 mm. The newly added compaction amounts in the middle of the inclined measurement lines are 6.47 mm, 9.74 mm, 14.2 mm, and 8.79 mm, respectively (Figure 8).
According to Equation (2), the newly added compaction of the filling zone inclined measurement lines under the filling pressure is 5%, 8%, 65%, and 9%, and the newly added compaction in the middle of the measurement lines is 36%, 54%, 78%, and 48%. Therefore, the rock masses compaction at different locations in the filling zone is significantly increased under the action of the grouting pressure. The pressure-induced filled volume significantly exceeds that for the no-pressure stage. During the grout-filling process, the newly added compaction in the middle of the filled zone tends to be much larger than at the boundary. The distribution of the grouting newly added compaction filling amount is characterized by a large middle region and a small boundary (Figure 9), which is consistent with the characteristics of the end-state distribution of the filled body. Therefore, the essence of the filling pressure-induced increase in the filled volume is to replace the future compaction space generated by the self-weight of the rock masses in advance and convert it into a filled volume via the compaction effect of the grouting pressure on the fractured and bulking rock masses.

5. Case Study

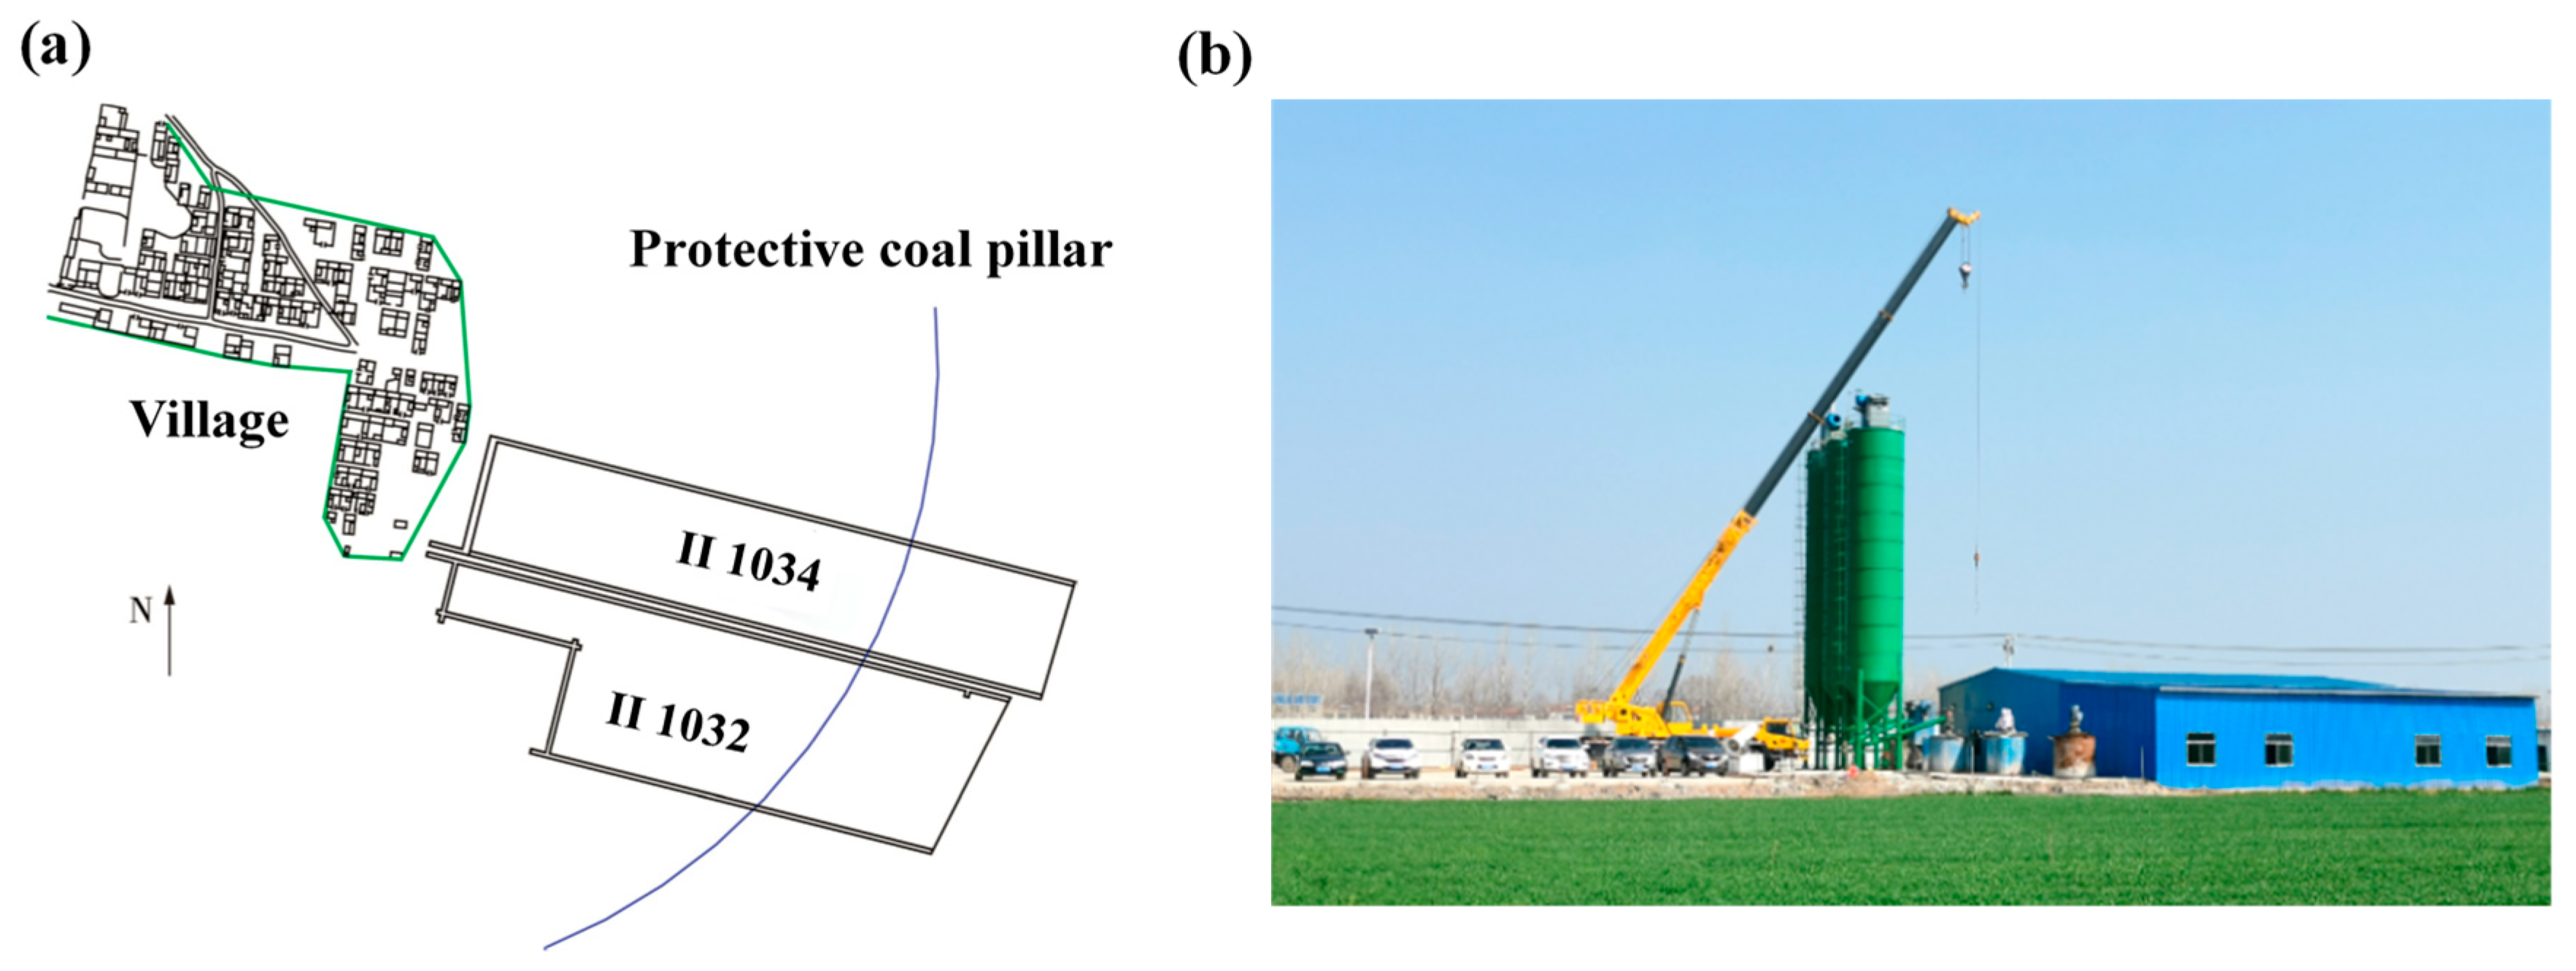
5.1. Compaction of Rock Masses Response to Grouting in Linhuan Coal Mine

The Linhuan coal mine is located in Huaibei, Anhui Province, China, and an overburden isolation grout-filling mining test was performed in the II1034 longwall workface to protect surface buildings (Figure 10). The II1034 working face has a regular rectangular arrangement, with a strike length of 544 m; the mining width is 110 m, and the mining height is 3 m. Grouting was implemented in the adjacent working face II1032. On the basis of the actual measurement data from the working face II1034, the accumulated volume of the injected compacted filling was calculated to be 93,761 m3, of which the total mining distance of the working face during the no-pressure stage was 90 m with 3035 m3 of grouting injection and the total mining distance of the working face during the pressurized stage was 544 m with 90,726 m3 of grouting injection.
According to [19], the filling thickness distribution model indicated that the maximum thickness of the filled body was h = 0.67 m during the no-pressure stage, and during the pressurized stage, the maximum filled body thickness was h = 2.49 m. After grout filling, the cumulative newly added subsidence of the ground surface was 150 mm and the compaction volume of the rock masses during the no-pressure stage was Hi = 0.71 m; meanwhile, the compaction volume of the rock masses under the action of grout filling during the pressurized stage was Hi = 2.6 m. Taking a residual bulking factor of Kp = 1.03 and through field drilling investigation, the height of caving zone Hc = 9 m obtained and substituting these parameters into Equation (3), the total compaction of the fractured and bulking rock masses under the action of grout filling reached 98%, where the compaction generated by the self-weight of the rock masses during the no-pressure stage was 26% and the compaction of the rock masses under the action of grout filling during the pressurized stage was 72% (Figure 11).
The conclusions of the case study are consistent with the results of the experimental study, where the amount of self-gravity compaction that can be generated by a longwall mining rock masses is replaced under the grouting pressure and converted into the filling volume.

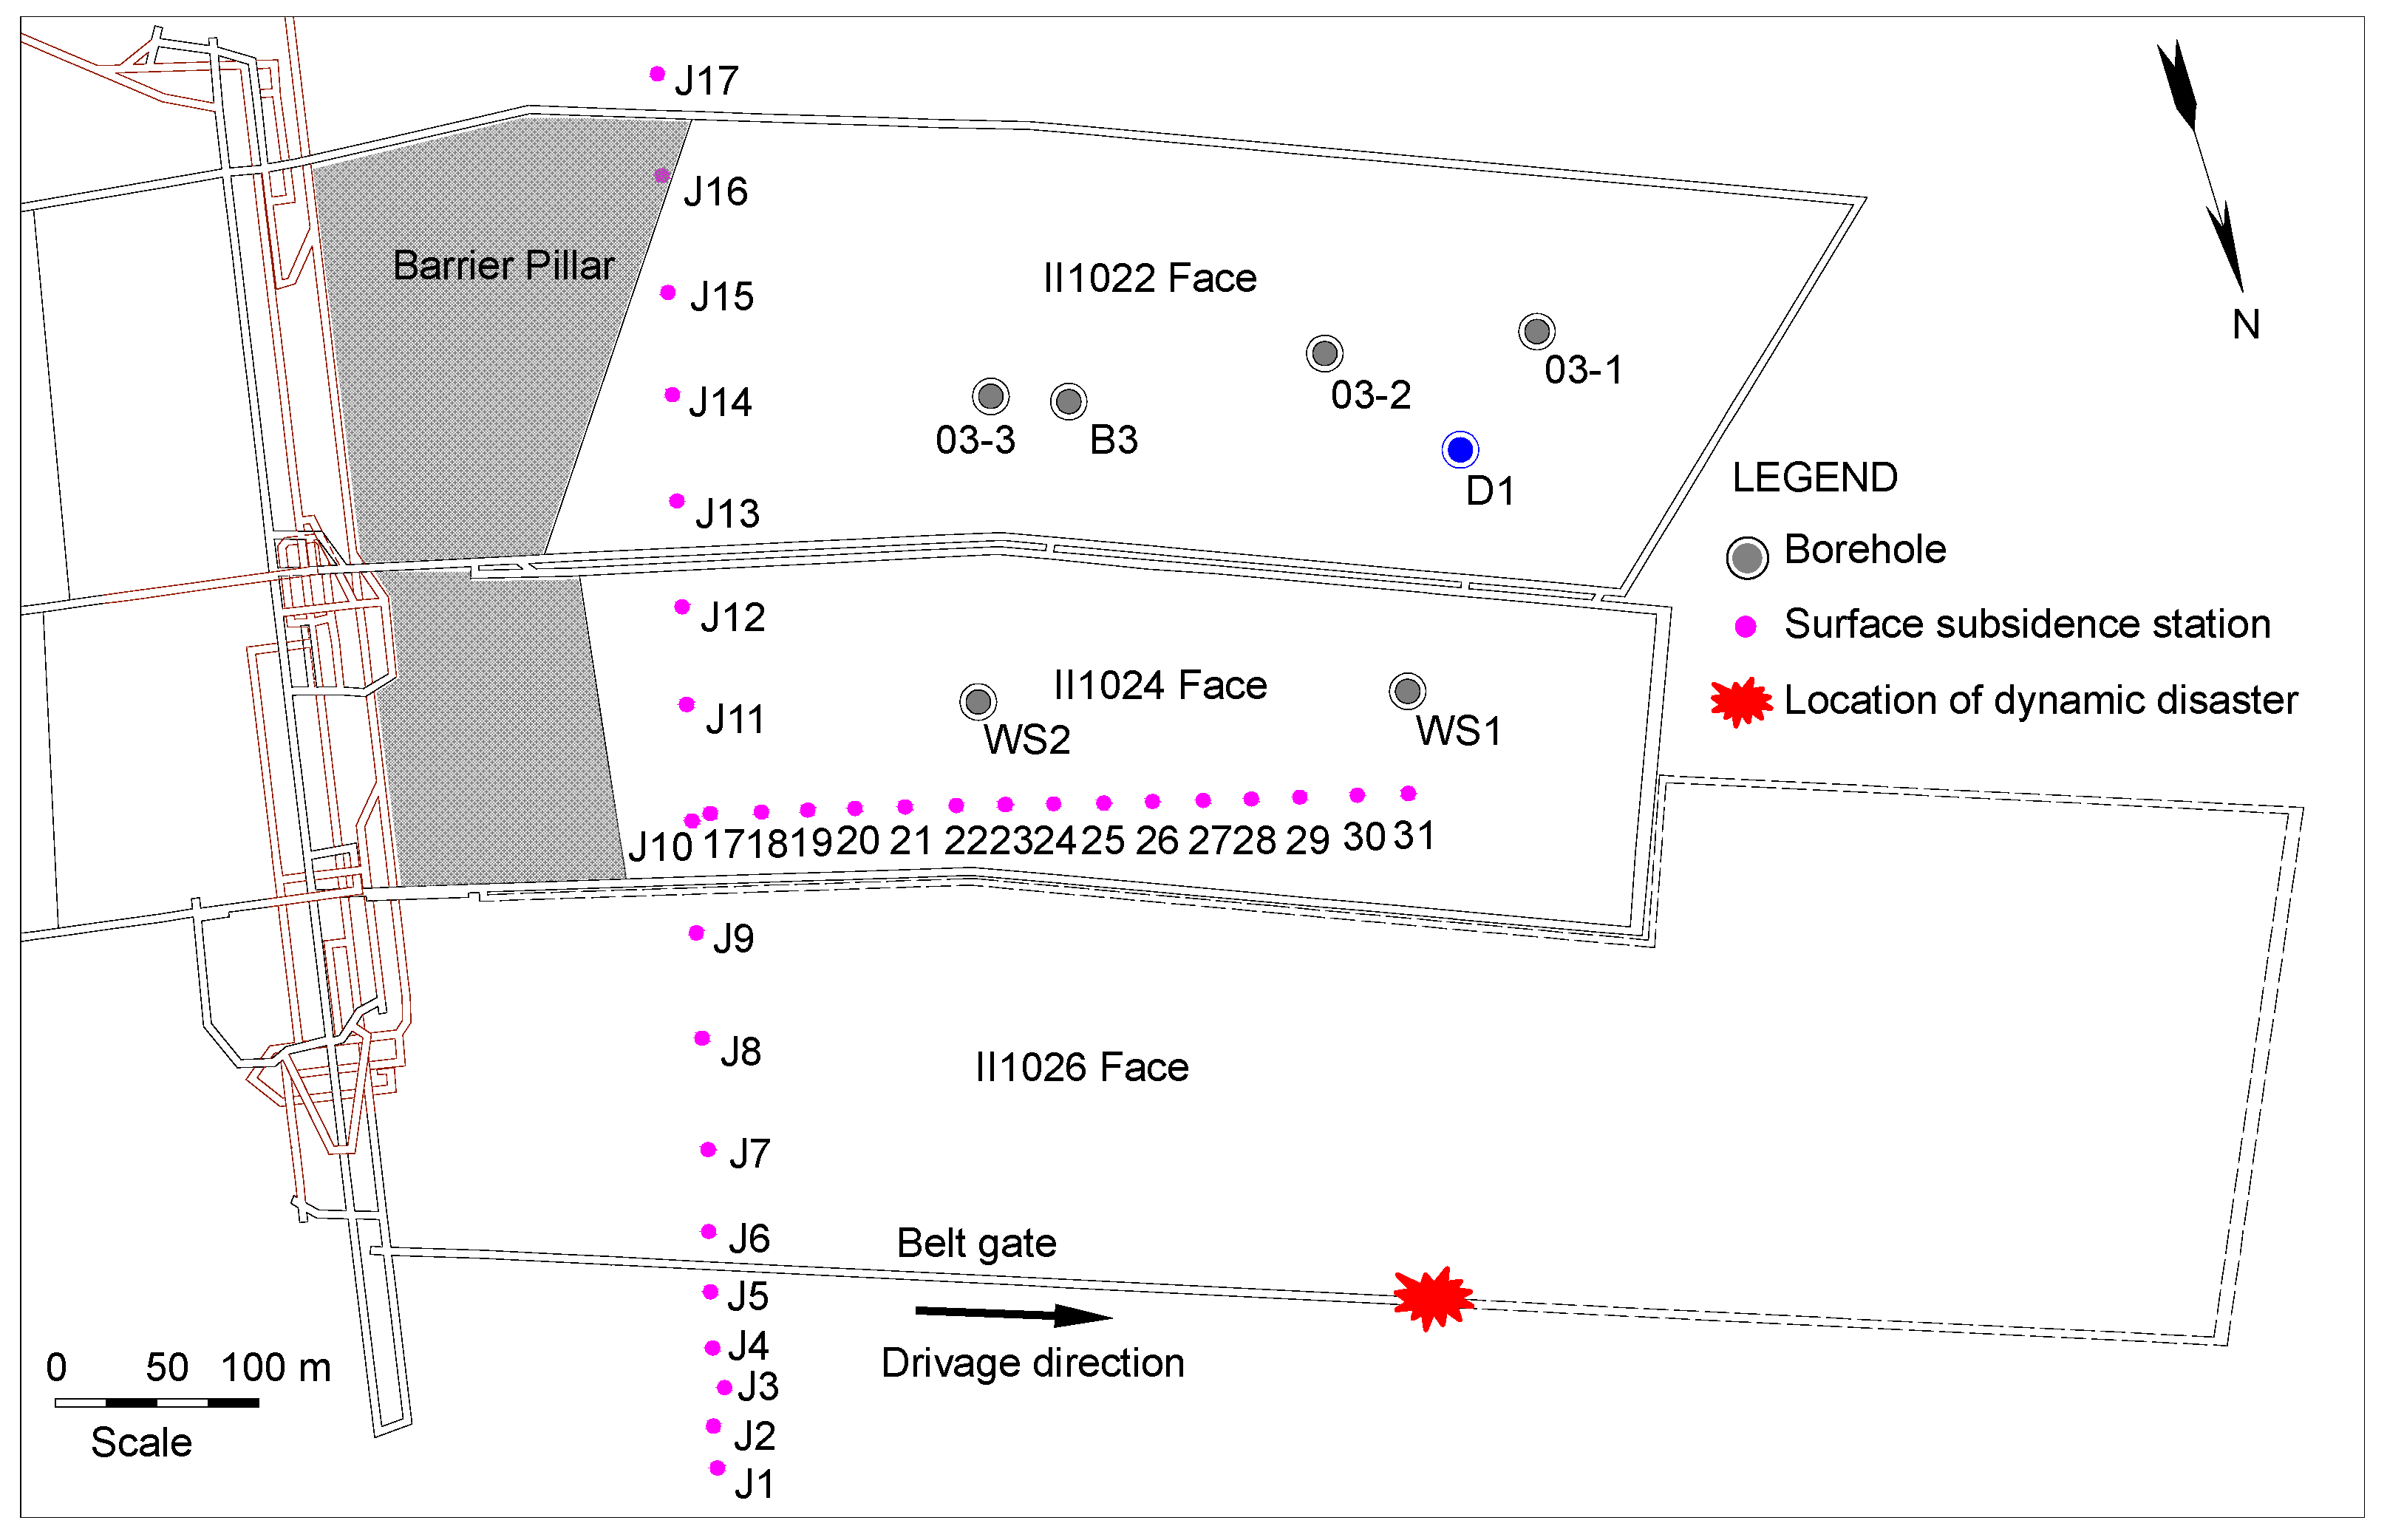
5.2. Compaction of Rock Masses Associated with Grouting in Haizi Coal Mine

The Haizi coal mine is located in Suixi, Anhui Province, China. To ensure safe mining under the hard rock layer, overburden isolation injection filling was implemented on the II1022 and II1024 working faces, with working face strike lengths of 560 m and 520 m, respectively, mining widths of 210 m and 160 m, respectively, and mining heights of 2.5 m (Figure 12).
Two years after the grouting filling project was completed, a surface investigation borehole was constructed above the II1022 working face to detect the fly ash filling in the overburden to test the filled effect. The results of the drilling investigation found that the thickness of the fly ash in the filled section was 1.67 m, the maximum subsidence of the ground surface controlled by the grout-filling process was 0.53 m, and the residual space height of the fractured and bulking rock masses was only 0.1 m. Therefore, the compaction of the fractured and bulking rock masses under the grout-filling condition was Hi = 2.2 m and the compaction of the rock masses under the grout-filling condition was 91.7%, as calculated by Equation (3), verifying the rock masses compaction response law under the action of overburden isolated grout filling.

6. Conclusions

This paper established a model for the compaction of collapsed rock masses during grouting, conducted physical modeling experiments, reproduced the recompaction process of rock masses under the action of grouting, and performed engineering verification based on the results of grouting engineering and filling effect borehole investigations.
A rock compaction model under the action of grout filling was established. The model assumed that the rock masses compaction amount during the grout filling is the same as the displacement of isolated layers Hi and that the displacement of the isolated layers is the sum of the filled body thickness h and the surface subsidence Ss. The model determines the total rock masses compaction under grout-filling conditions as λ = (h + Ss)/[MHc(Kp − 1)], the grout compaction as λ = h/[MHc(Kp − 1)], and the rest as the self-weight compaction of the rock masses formation.
Experimental studies were performed, and the compaction characteristics of grout-filling collapsed rock masses were obtained. To study the compaction response characteristics of rock masses under the action of the grouting pressure, a three-dimensional grout-filling experimental system was established to perform experimental research. The pressure in the grout-filling process was distributed in three stages: no pressure, low pressure, and pressure boost. The self-gravity compaction of the rock masses during the no-pressure stage was small, about 19%, and the low-pressure and pressure-boost stages were key to generating the compaction effect of the grout filling accounting for 20% and 58%, respectively. It was revealed that the distribution of the newly added compaction filling amount is characterized by a large central region and a small boundary and that the essence of the pressure-induced increase in the grouting volume is to replace the future compaction space generated by the self-weight of the rock masses in advance by compacting the fractured and bulking rock masses via grout filling and converting it into a filled volume.
The slurry compaction process was analyzed using grout-filling engineering data from the Linhuan and Haizi coal mines in Huaibei, China. Under the action of grouting filling, the total compaction of the rock masses is more than 90%. The rock masses compaction response law under the action of grouting injection into the overburden of isolated panels during longwall mining was verified, providing a theoretical reference for the design of injection filling parameters and the evaluation of the filling effect.

Author Contributions

Conceptualization, D.X.; methodology, J.L.; validation; formal analysis, J.X.; investigation, J.L.; resources, Z.D.; data curation, C.W.; writing—original draft preparation, J.L.; writing—review and editing, J.L. All authors have read and agreed to the published version of the manuscript.

Funding

This research was supported by Fundamental Research Funds for Central Universities (2020ZDPYMS15).

Data Availability Statement

Not applicable.

Acknowledgments

I wish to thank Dayang Xuan for his advice on data analysis and manuscript writing.

Conflicts of Interest

The authors declare that there are no conflict of interest regarding the publication of this paper.

References

  1. Cooper, A.; Saunders, J.M. Road and bridge construction across gypsum karst in England. Eng. Geol. 2002, 65, 217–223. [Google Scholar] [CrossRef]
  2. Ma, K.; Tang, C.; Liang, Z.; Zhuang, D.; Zhang, Q. Stability analysis and reinforcement evaluation of high-steep rock slope by microseismic monitoring. Eng. Geol. 2017, 218, 22–38. [Google Scholar] [CrossRef]
  3. Park, D.; Oh, J. Permeation grouting for remediation of dam cores. Eng. Geol. 2018, 233, 63–75. [Google Scholar] [CrossRef]
  4. Seiphoori, A.; Zamanian, M. Improving mechanical behaviour of collapsible soils by grouting clay nanoparticles. Eng. Geol. 2022, 298, 106538. [Google Scholar] [CrossRef]
  5. Salmi, E.F.; Sellers, E.J. A Rock Engineering System Based Abandoned Mine Instability Assessment Index with Case Studies for Waihi Gold Mine. Eng. Geol. 2022, 310, 106869. [Google Scholar] [CrossRef]
  6. Kharisova, O.; Kharisov, T. Searching for possible precursors of mining-induced ground collapse using long-term geodetic monitoring data. Eng. Geol. 2021, 289, 106173. [Google Scholar] [CrossRef]
  7. Tichavský, R.; Jiránková, E.; Fabiánová, A. Dating of mining-induced subsidence based on a combination of dendrogeomorphic methods and in situ monitoring. Eng. Geol. 2020, 272, 105650. [Google Scholar] [CrossRef]
  8. Bar, N.; Dixon, R. Unveiling unknowns: Practical application of InSAR for slope performance monitoring and risk management across multiple surface mines. Eng. Geol. 2021, 293, 106326. [Google Scholar] [CrossRef]
  9. Donnelly, L.; De La Cruz, H.; Asmar, I.; Zapata, O.; Perez, J. The monitoring and prediction of mining subsidence in the Amaga, Angelopolis, Venecia and Bolombolo Regions, Antioquia, Colombia. Eng. Geol. 2001, 59, 103–114. [Google Scholar] [CrossRef]
  10. Salmi, E.F.; Nazem, M.; Deng, K.Z.; Karakus, M. Numerical analysis of a large landslide induced by coal mining subsidence. Eng. Geol. 2017, 217, 141–152. [Google Scholar] [CrossRef]
  11. Yang, D.; Qiu, H.; Ma, S.; Liu, Z.; Du, C.; Zhu, Y.; Cao, M. Slow surface subsidence and its impact on shallow loess landslides in a coal mining area. Catena 2021, 209, 105830. [Google Scholar] [CrossRef]
  12. Bosikov, I.I.; Martyushev, N.V.; Klyuev, R.V.; Savchenko, I.A.; Kukartsev, V.V.; Kukartsev, V.A.; Tynchenko, Y.A. Modeling and Complex Analysis of the Topology Parameters of Ventilation Networks When Ensuring Fire Safety While Developing Coal and Gas Deposits. Fire 2023, 6, 95. [Google Scholar] [CrossRef]
  13. Helm, P.R.; Davie, C.T.; Glendinning, S. Numerical modelling of shallow abandoned mine working subsidence affecting transport in-frastructure, Engineering. Geology 2013, 154, 6–19. [Google Scholar]
  14. Malinowska, A.A.; Witkowski, W.; Guzy, A.; Hejmanowski, R. Mapping ground movements caused by mining-induced earthquakes applying satellite radar interferometry. Eng. Geol. 2018, 246, 402–411. [Google Scholar] [CrossRef]
  15. Balovtsev, S.; Skopintseva, O. Assessment of the influence of returned mines on aerological risks at coal mines. Min. Inf. Anal. Bull. 2021, 10, 40–53. [Google Scholar] [CrossRef]
  16. Golik, V.I.; Klyuev, R.V.; Martyushev, N.V.; Brigida, V.; Efremenkov, E.A.; Sorokova, S.N.; Mengxu, Q. Tailings Utilization and Zinc Extraction Based on Mechanochemical Activation. Materials 2023, 16, 726. [Google Scholar] [CrossRef]
  17. Xuan, D.; Xu, J.; Zhu, W. Dynamic disaster control under a massive igneous sill by grouting from surface boreholes. Int. J. Rock Mech. Min. Sci. 2014, 71, 176–187. [Google Scholar] [CrossRef]
  18. Xuan, D.; Xu, J.; Wang, B.; Teng, H. Borehole Investigation of the Effectiveness of Grout Injection Technology on Coal Mine Subsidence Control. Rock Mech. Rock Eng. 2015, 48, 2435–2445. [Google Scholar] [CrossRef]
  19. Xuan, D.; Xu, J.; Wang, B.; Teng, H. Investigation of fill distribution in post-injected longwall overburden with implications for grout take estimation. Eng. Geol. 2016, 206, 71–82. [Google Scholar] [CrossRef]
  20. Xuan, D.; Xu, J. Longwall surface subsidence control by technology of isolated overburden grout injection. Int. J. Min. Sci. Technol. 2017, 27, 813–818. [Google Scholar] [CrossRef]
  21. Kipko, E.; Kipko, A. A new technique for grouting old mine workings. Min. Sci. Technol. 1990, 11, 199–206. [Google Scholar] [CrossRef]
  22. Zhang, J.X.; Deng, X.J.; Zhao, X.; Ju, F.; Li, B.Y. Effective control and performance measurement of solid waste backfill in coal mining. Int. J. Min. Reclam. Environ. 2016, 31, 91–104. [Google Scholar] [CrossRef]
  23. Wanghua, S.; Dingyang, Z.; Cui, Z.C.; Zhaoyang, W.; Qingjie, Z. Environmental implications of mitigating overburden failure and subsidences using paste-like backfill mining; a case study. Int. J. Min. Reclam. Environ. 2015, 29, 521–543. [Google Scholar]
  24. Palchik, V. Experimental investigation of apertures of mining-induced horizontal fractures. Int. J. Rock Mech. Min. Sci. 2010, 47, 502–508. [Google Scholar] [CrossRef]
  25. Yavuz, H. An estimation method for cover pressure re-establishment distance and pressure distribution in the goaf of longwall coal mines. Int. J. Rock Mech. Min. Sci. 2004, 41, 193–205. [Google Scholar] [CrossRef]
  26. Villegas, T.; Nordlund, E. Time-dependent movements of the hangingwall at the Kiirunavaara mine. Int. J. Min. Reclam. Environ. 2012, 26, 119–133. [Google Scholar] [CrossRef]
  27. Guney, A.; Gul, M. Analysis of surface subsidence due to longwall mining under weak geological conditions; Turgut Basin of Yata-gan-Mugla (Turkey) case study. Int. J. Min. Reclam. Environ. 2019, 33, 445–461. [Google Scholar] [CrossRef]
  28. Singh, A.; Singh, R.; Maiti, J.; Kumar, R.; Mandal, P. Assessment of mining induced stress development over coal pillars during depillaring. Int. J. Rock Mech. Min. Sci. 2011, 48, 805–818. [Google Scholar] [CrossRef]
  29. Suchowerska, A.; Merifield, R.; Carter, J. Vertical stress changes in multi-seam mining under supercritical longwall panels. Int. J. Rock Mech. Min. Sci. 2013, 61, 306–320. [Google Scholar] [CrossRef]
  30. Suchowerska, A.M.; Carter, J.P.; Merifield, R.S. Horizontal stress under supercritical longwall panels. Int. J. Rock Mech. Min. Sci. 2014, 70, 240–251. [Google Scholar] [CrossRef]
  31. Xu, J.L.; Qin, W.; Xuan, D.Y.; Zhu, W.B. Accumulative effect of overburden strata expansion induced by stress relief. J. China Coal Soc. 2020, 45, 35–43. [Google Scholar]
  32. Hebblewhite, B. Fracturing, caving propagation and influence of mining on groundwater above longwall panels–a review of predictive models. Int. J. Min. Sci. Technol. 2020, 30, 49–54. [Google Scholar] [CrossRef]
  33. Mondal, D.; Roy, P.; Kumar, M. Monitoring the strata behavior in the Destressed Zone of a shallow Indian longwall panel with hard sandstone cover using Mine-Microseismicity and Borehole Televiewer data. Eng. Geol. 2020, 271, 105593. [Google Scholar] [CrossRef]
  34. Palchik, V. Analysis of main factors influencing the apertures of mining-induced horizontal fractures at longwall coal mining. Géoméch. Geophys. Geo-Energy Geo-Resour. 2020, 6, 37. [Google Scholar] [CrossRef]
  35. Qu, Q.; Xu, J.; Wu, R.; Qin, W.; Hu, G. Three-zone characterisation of coupled strata and gas behaviour in multi-seam mining. Int. J. Rock Mech. Min. Sci. 2015, 78, 91–98. [Google Scholar] [CrossRef]
  36. Qu, Q.; Guo, H.; Khanal, M. Monitoring and analysis of ground movement from multi-seam mining. Int. J. Rock Mech. Min. Sci. 2021, 148, 104949. [Google Scholar] [CrossRef]
  37. Wilkins, A.; Qu, Q. A formalism to compute permeability changes in anisotropic fractured rocks due to arbitrary deformations. Int. J. Rock Mech. Min. Sci. 2019, 125, 104159. [Google Scholar] [CrossRef]
  38. Ju, J.; Xu, J. Surface stepped subsidence related to top-coal caving longwall mining of extremely thick coal seam under shallow cover. Int. J. Rock Mech. Min. Sci. 2015, 78, 27–35. [Google Scholar] [CrossRef]
  39. Ghabraie, B.; Ren, G.; Smith, J.; Holden, L. Application of 3D laser scanner, optical transducers and digital image processing tech-niques in physical modelling of mining-related strata movement. Int. J. Rock Mech. Min. Sci. 2015, 80, 219–230. [Google Scholar] [CrossRef]
  40. Singh, R.; Mandal, P.; Singh, A.; Kumar, R.; Maiti, J.; Ghosh, A. Upshot of strata movement during underground mining of a thick coal seam below hilly terrain. Int. J. Rock Mech. Min. Sci. 2008, 45, 29–46. [Google Scholar] [CrossRef]
  41. Yilmaz, E. Stope depth effect on field behaviour and performance of cemented paste backfills. Int. J. Min. Reclam. Environ. 2017, 32, 273–296. [Google Scholar] [CrossRef]
  42. Cho, J.; Kim, H.; Jeon, S.; Min, K. Deformation and strength anisotropy of Asan gneiss, Boryeong shale, and Yeoncheon schist. Int. J. Rock Mech. Min. Sci. 2012, 50, 158–169. [Google Scholar] [CrossRef]
  43. Shimada, H.; Hamanaka, A.; Sasaoka, T.; Matsui, K. Behaviour of grouting material used for floor reinforcement in underground mines. Int. J. Min. Reclam. Environ. 2013, 28, 133–148. [Google Scholar] [CrossRef]
  44. Hughes, P.B.; Pakalnis, R.; Hitch, M.; Corey, G. Composite paste barricade performance at Goldcorp Inc. Red Lake Mine, Ontario, Canada. Int. J. Min. Reclam. Environ. 2010, 24, 138–150. [Google Scholar] [CrossRef]
  45. Shi, J.; Shen, B. Approximations for fluid pressure and flux of hydraulic flow in three-dimensional fractures. J. Pet. Sci. Eng. 2019, 178, 439–448. [Google Scholar] [CrossRef]
  46. Zelanko, J.C.; Karfakis, M.G.; Kim, K. Development of a polyester-based pumpable grout. Int. J. Rock Mech. Min. Sci. Geomech. Abstr. 1997, 34, 357–369. [Google Scholar] [CrossRef]
  47. Alehossein, H. Viscous, cohesive, non-Newtonian, depositing, radial slurry flow. Int. J. Miner. Process. 2009, 93, 11–19. [Google Scholar] [CrossRef]
  48. Alehossein, H.; Shen, B.; Qin, Z.; Huddlestone-Holmes, C. Flow Analysis, Transportation, and Deposition of Frictional Viscoplastic Slurries and Pastes in Civil and Mining Engineering. J. Mater. Civ. Eng. 2012, 24, 644–657. [Google Scholar] [CrossRef]
  49. Palchik, V. Influence of physical characteristics of weak rock mass on height of caved zone over abandoned subsurface coal mines. Environ. Geol. 2002, 42, 92–101. [Google Scholar] [CrossRef]
  50. Wang, B.; Xu, J.; Xuan, D. Time function model of dynamic surface subsidence assessment of grout-injected overburden of a coal mine. Int. J. Rock Mech. Min. Sci. 2018, 104, 1–8. [Google Scholar] [CrossRef]
  51. Xuan, D.; Li, J.; Zheng, K.; Xu, J. Experimental Study of Slurry Flow in Mining-Induced Fractures during Longwall Overburden Grout Injection. Geofluids 2020, 2020, 8877616. [Google Scholar] [CrossRef]
Figure 1. Schematic cross-section of the isolated overburden grout injection technique.
Minerals 13 00633 g001
Figure 2. Diagram of the inclination profile and spatial distribution of the filled body: (a) filling body space distribution and (b) filling body inclination profile [50].
Minerals 13 00633 g002
Figure 3. Mining and overburden isolation injection filling physical modeling system.
Minerals 13 00633 g003
Figure 4. Sensor number and measuring line arrangement: (a) pressure and displacement measurement point arrangement scheme and (b) measuring line serial numbers.
Minerals 13 00633 g004
Figure 5. Rock masses compaction at different distances from the borehole during grouting: (a) QD1 measurement line, (b) QD2 measurement line, (c) QD3 measurement line, and (d) QD4 measurement line.
Minerals 13 00633 g005
Figure 6. Relationship between the borehole pressure and rock masses compaction during grouting: (a) relationship between the ultimate rock masses compaction, the borehole pressure, and the working face mining distance and (b) rock masses compaction in no-pressure, low-pressure, and pressure-boost stages.
Minerals 13 00633 g006
Figure 7. Relationship between the longwall workface mining distance, the total grouting volume, and the injection ratio.
Minerals 13 00633 g007
Figure 8. Rock masses compaction at different distances from the borehole at different pressure stages. (a) Inclined measurement line QD1 compaction, −40 mm from the borehole. (b) Inclined measurement line QD2 compaction, 240 mm from the borehole. (c) Inclined measurement line QD3 compaction, 440 mm from the borehole. (d) Inclined measurement line QD4 compaction, 640 mm from the borehole.
Minerals 13 00633 g008
Figure 9. Spatial distribution of newly added compaction filling amount during grout filling. (a) Distribution of the newly added compaction filling amount at the inclined measurement line QD1, −40 mm from the borehole. (b) Distribution of the newly added compaction filling amount at the inclined measurement line QD2, 240 mm from the borehole. (c) Distribution of the newly added compaction filling amount at the inclined measurement line QD3, 440 mm from the borehole. (d) Distribution of the newly added compaction filling amount at the inclined measurement line QD4, 640 mm from the borehole.
Minerals 13 00633 g009
Figure 10. A general configuration of (a) the working face and (b) the grout-filling system.
Minerals 13 00633 g010
Figure 11. Relationship for the Linhuan II1034 working face between the mining distance, the maximum filled body thickness, and the compactness: (a) relationship between the working face mining distance and the maximum filled body thickness and (b) relationship between the working face mining distance and the compactness of rock masses.
Minerals 13 00633 g011
Figure 12. Plan view of II1022 [17].
Minerals 13 00633 g012
Table 1. Model laying parameters.
LithologyThickness (cm)MaterialMaterial RatioLayersStrength (kPa)
Isolation layers4Paraffin: hydraulic oil: talcum powder: river sand: straw powder1:2:5.7:34.2:1495
Soft rock layers6Sand: calcium carbonate: gypsum: water3.5:3.5:1.5:1670
Key strata4Sand: calcium carbonate: gypsum: water3:3.5:1.5:1478
Immediate roof4Sand: calcium carbonate: gypsum: water3.5:3.5:1.5:1470
Disclaimer/Publisher’s Note: The statements, opinions and data contained in all publications are solely those of the individual author(s) and contributor(s) and not of MDPI and/or the editor(s). MDPI and/or the editor(s) disclaim responsibility for any injury to people or property resulting from any ideas, methods, instructions or products referred to in the content.

