
Effect of Magnesium Sulfate Solution on Pore Structure of Ionic Rare Earth Ore during Leaching Process
Abstract
:1. Introduction
2. Materials and Methods
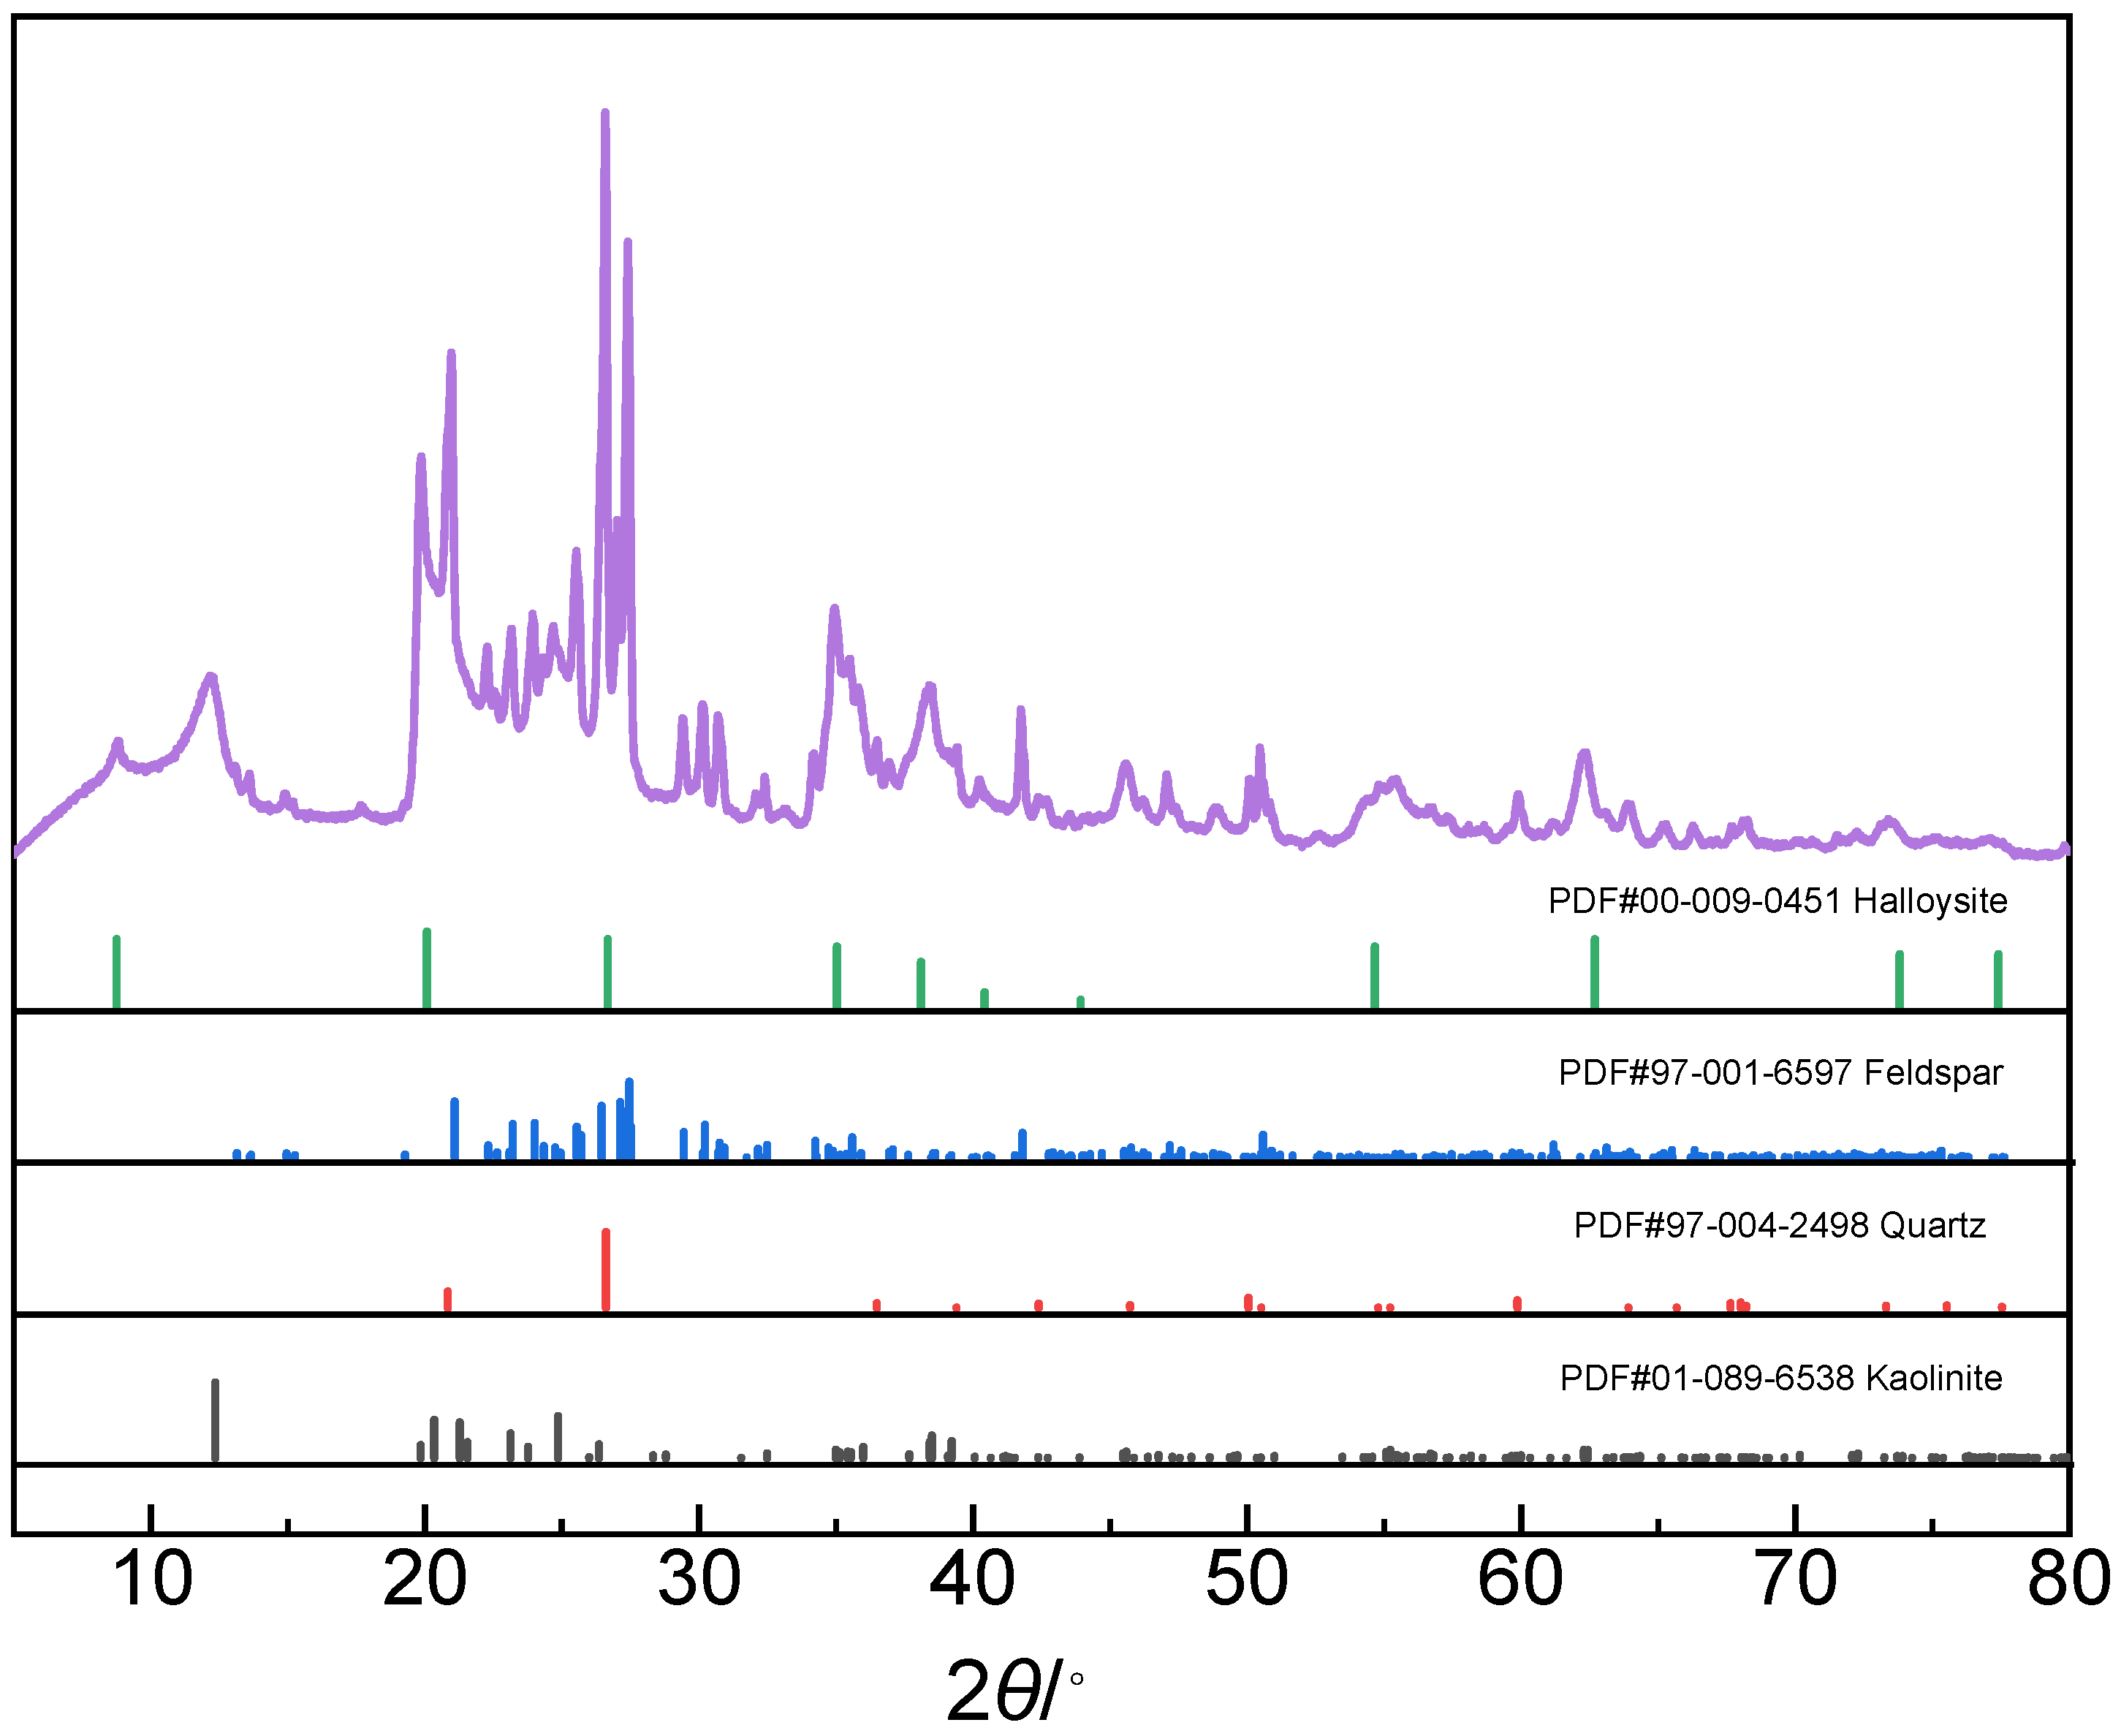
2.1. Materials
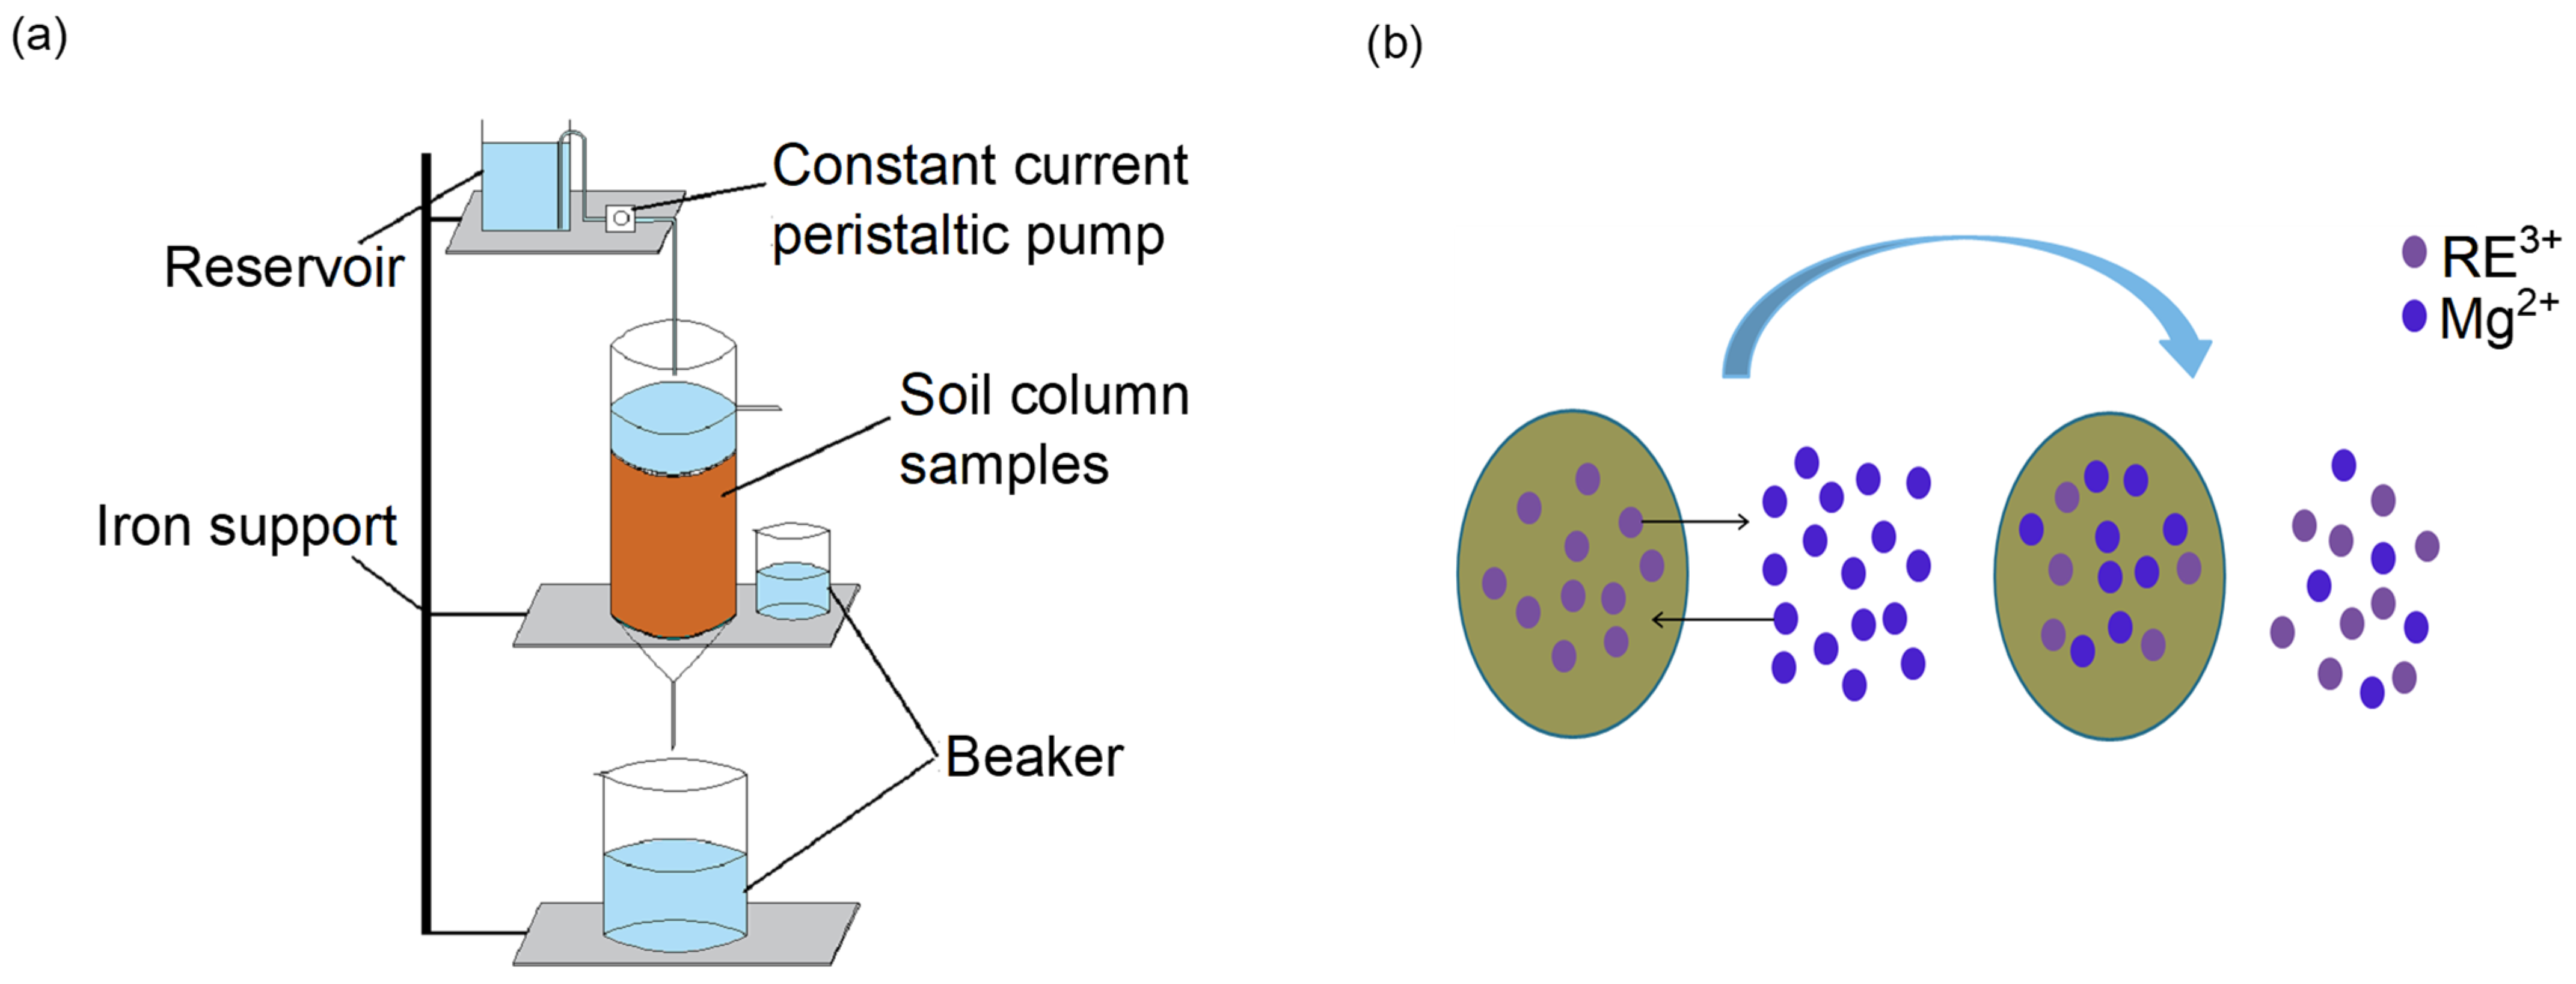
2.2. Experimental Method and Process
3. Results and Discussion
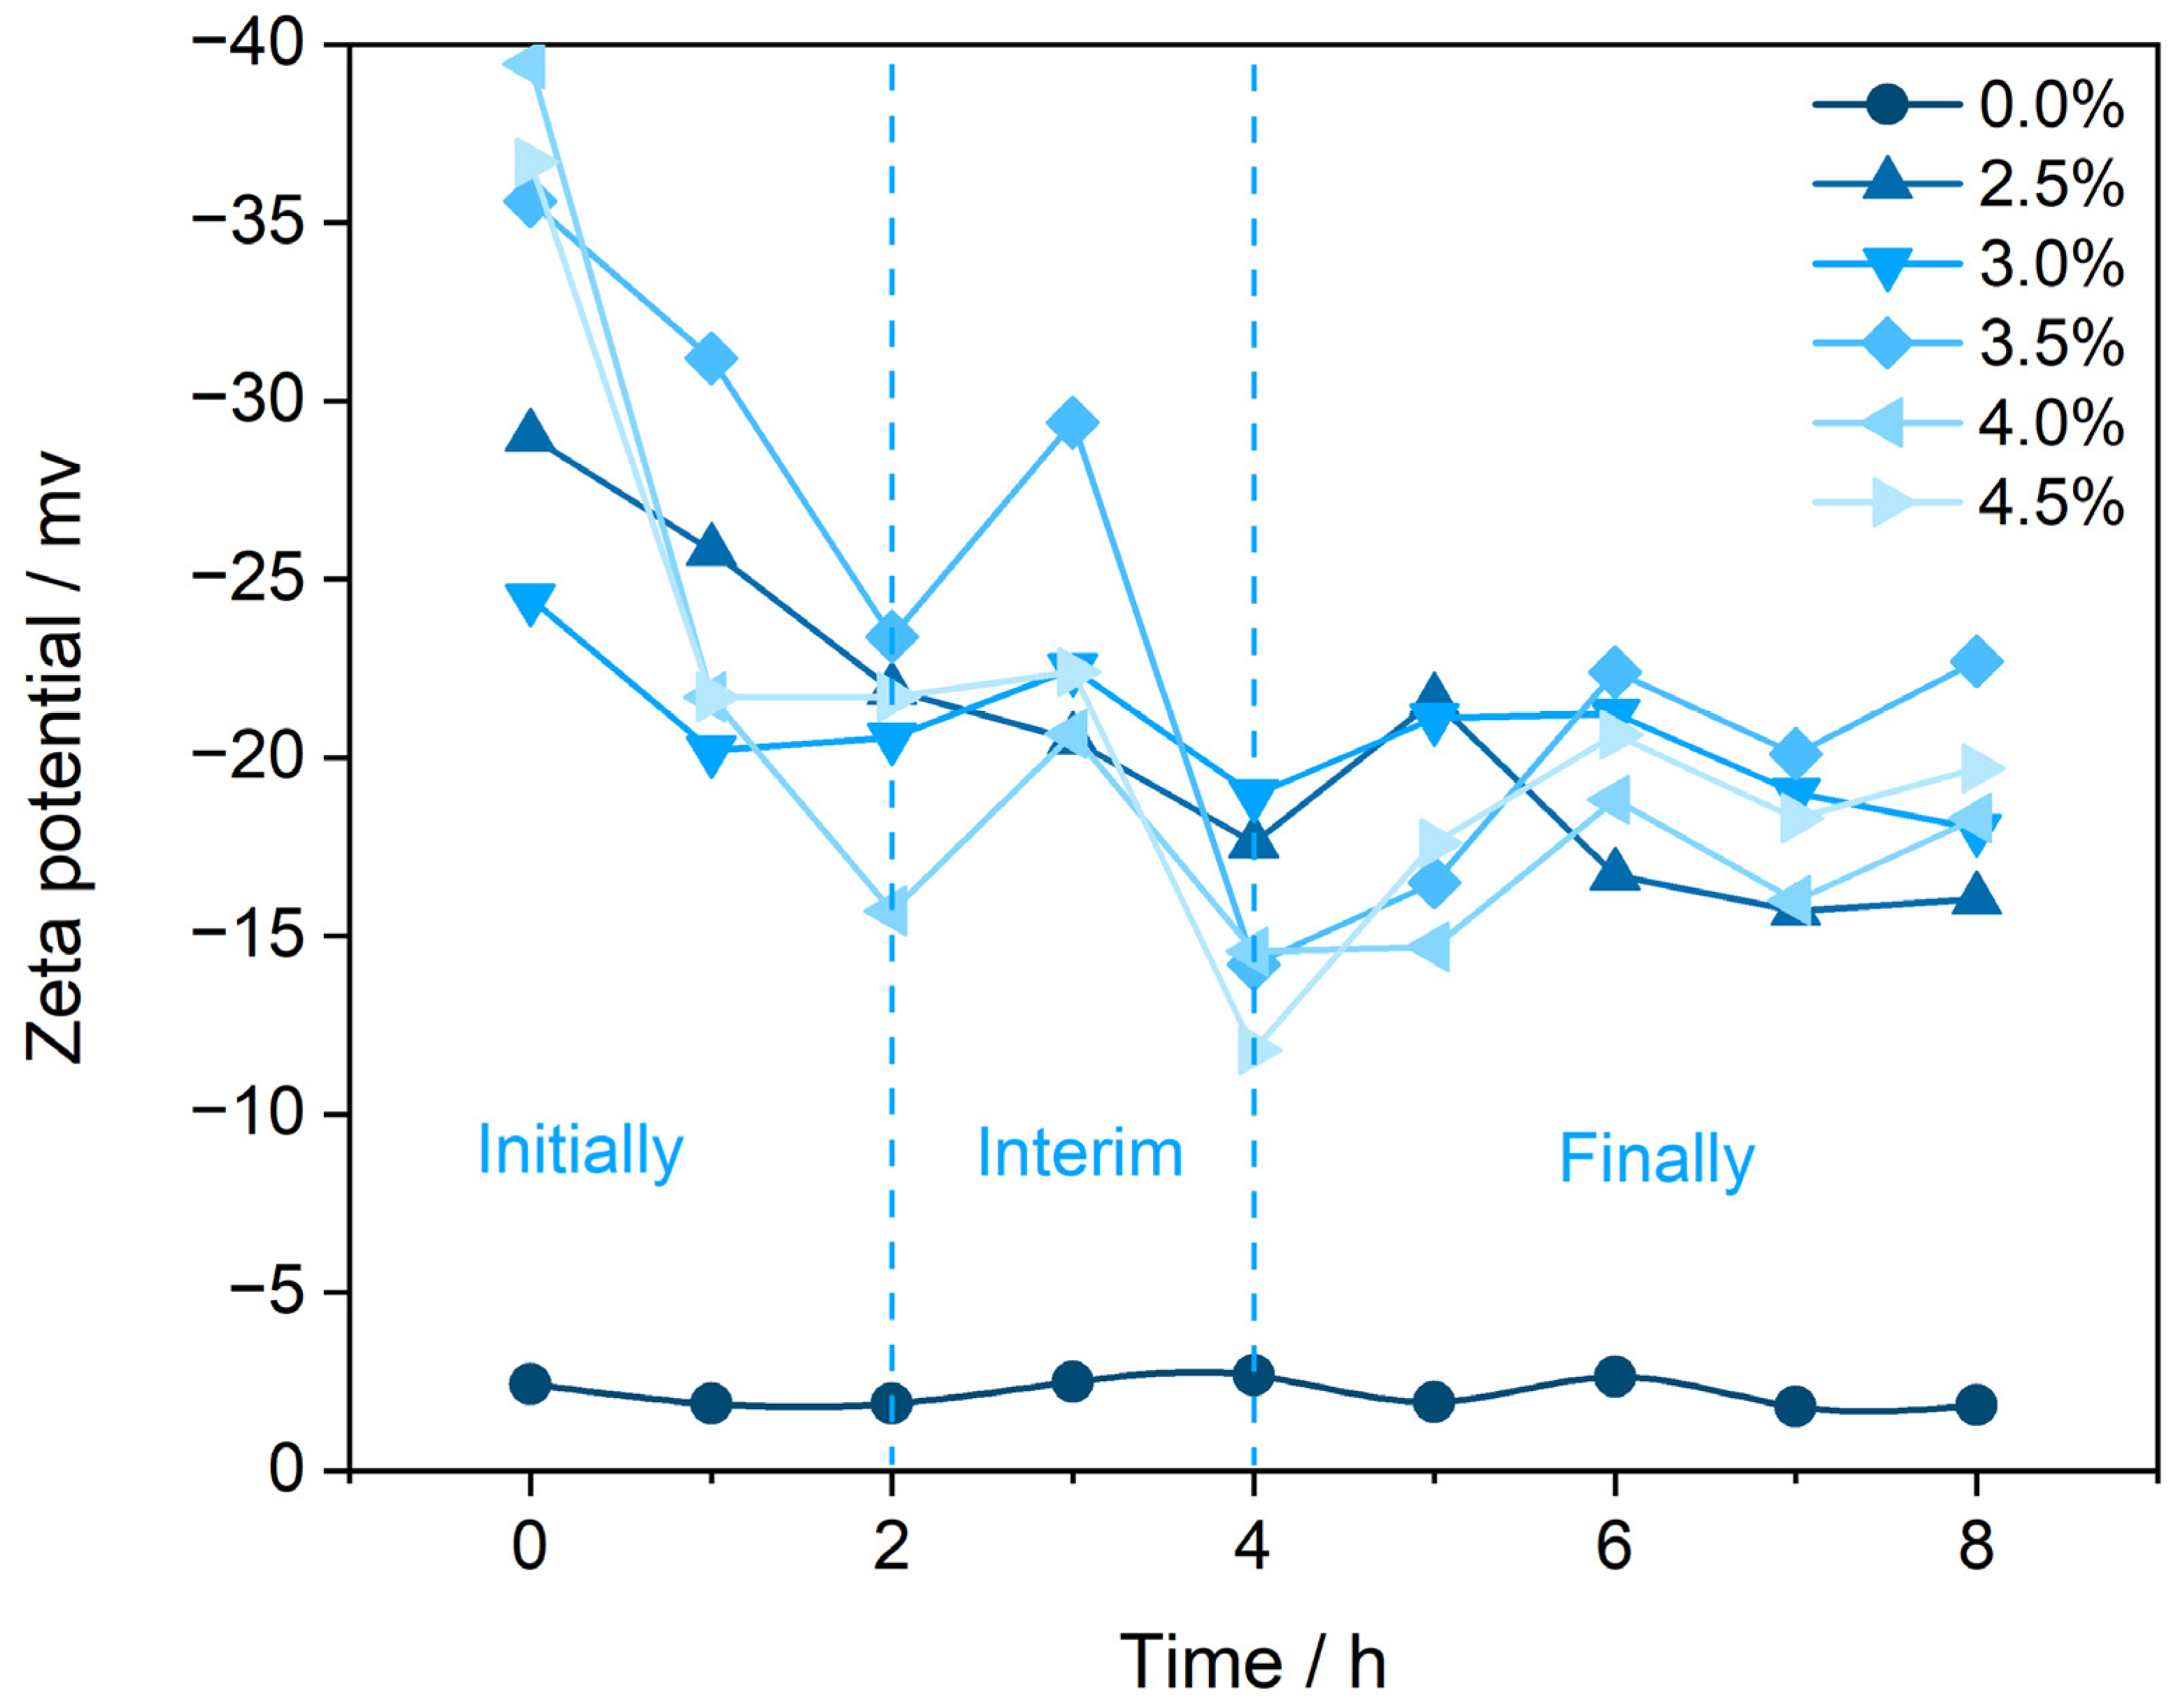
3.1. Effect of Concentration and pH of Leaching Agent on Zeta Potential of Rare Earth Ore Particles in Leaching Process
3.2. Effect of Leaching Agent Concentration on Pore Structure of Orebody
3.3. Effect of pH of Leaching Agent on Pore Structure of Orebody
4. Conclusions
- In the leaching process of rare earth samples with pure H2O, the curve of the change of Zeta potential on the surface of rare earth ore particles is nearly a straight line. The particles inside the sample cause local pore fluctuation under the effect of seepage. The porosity changes slightly within 0.80%, which has little impact on the pore structure of the orebody;
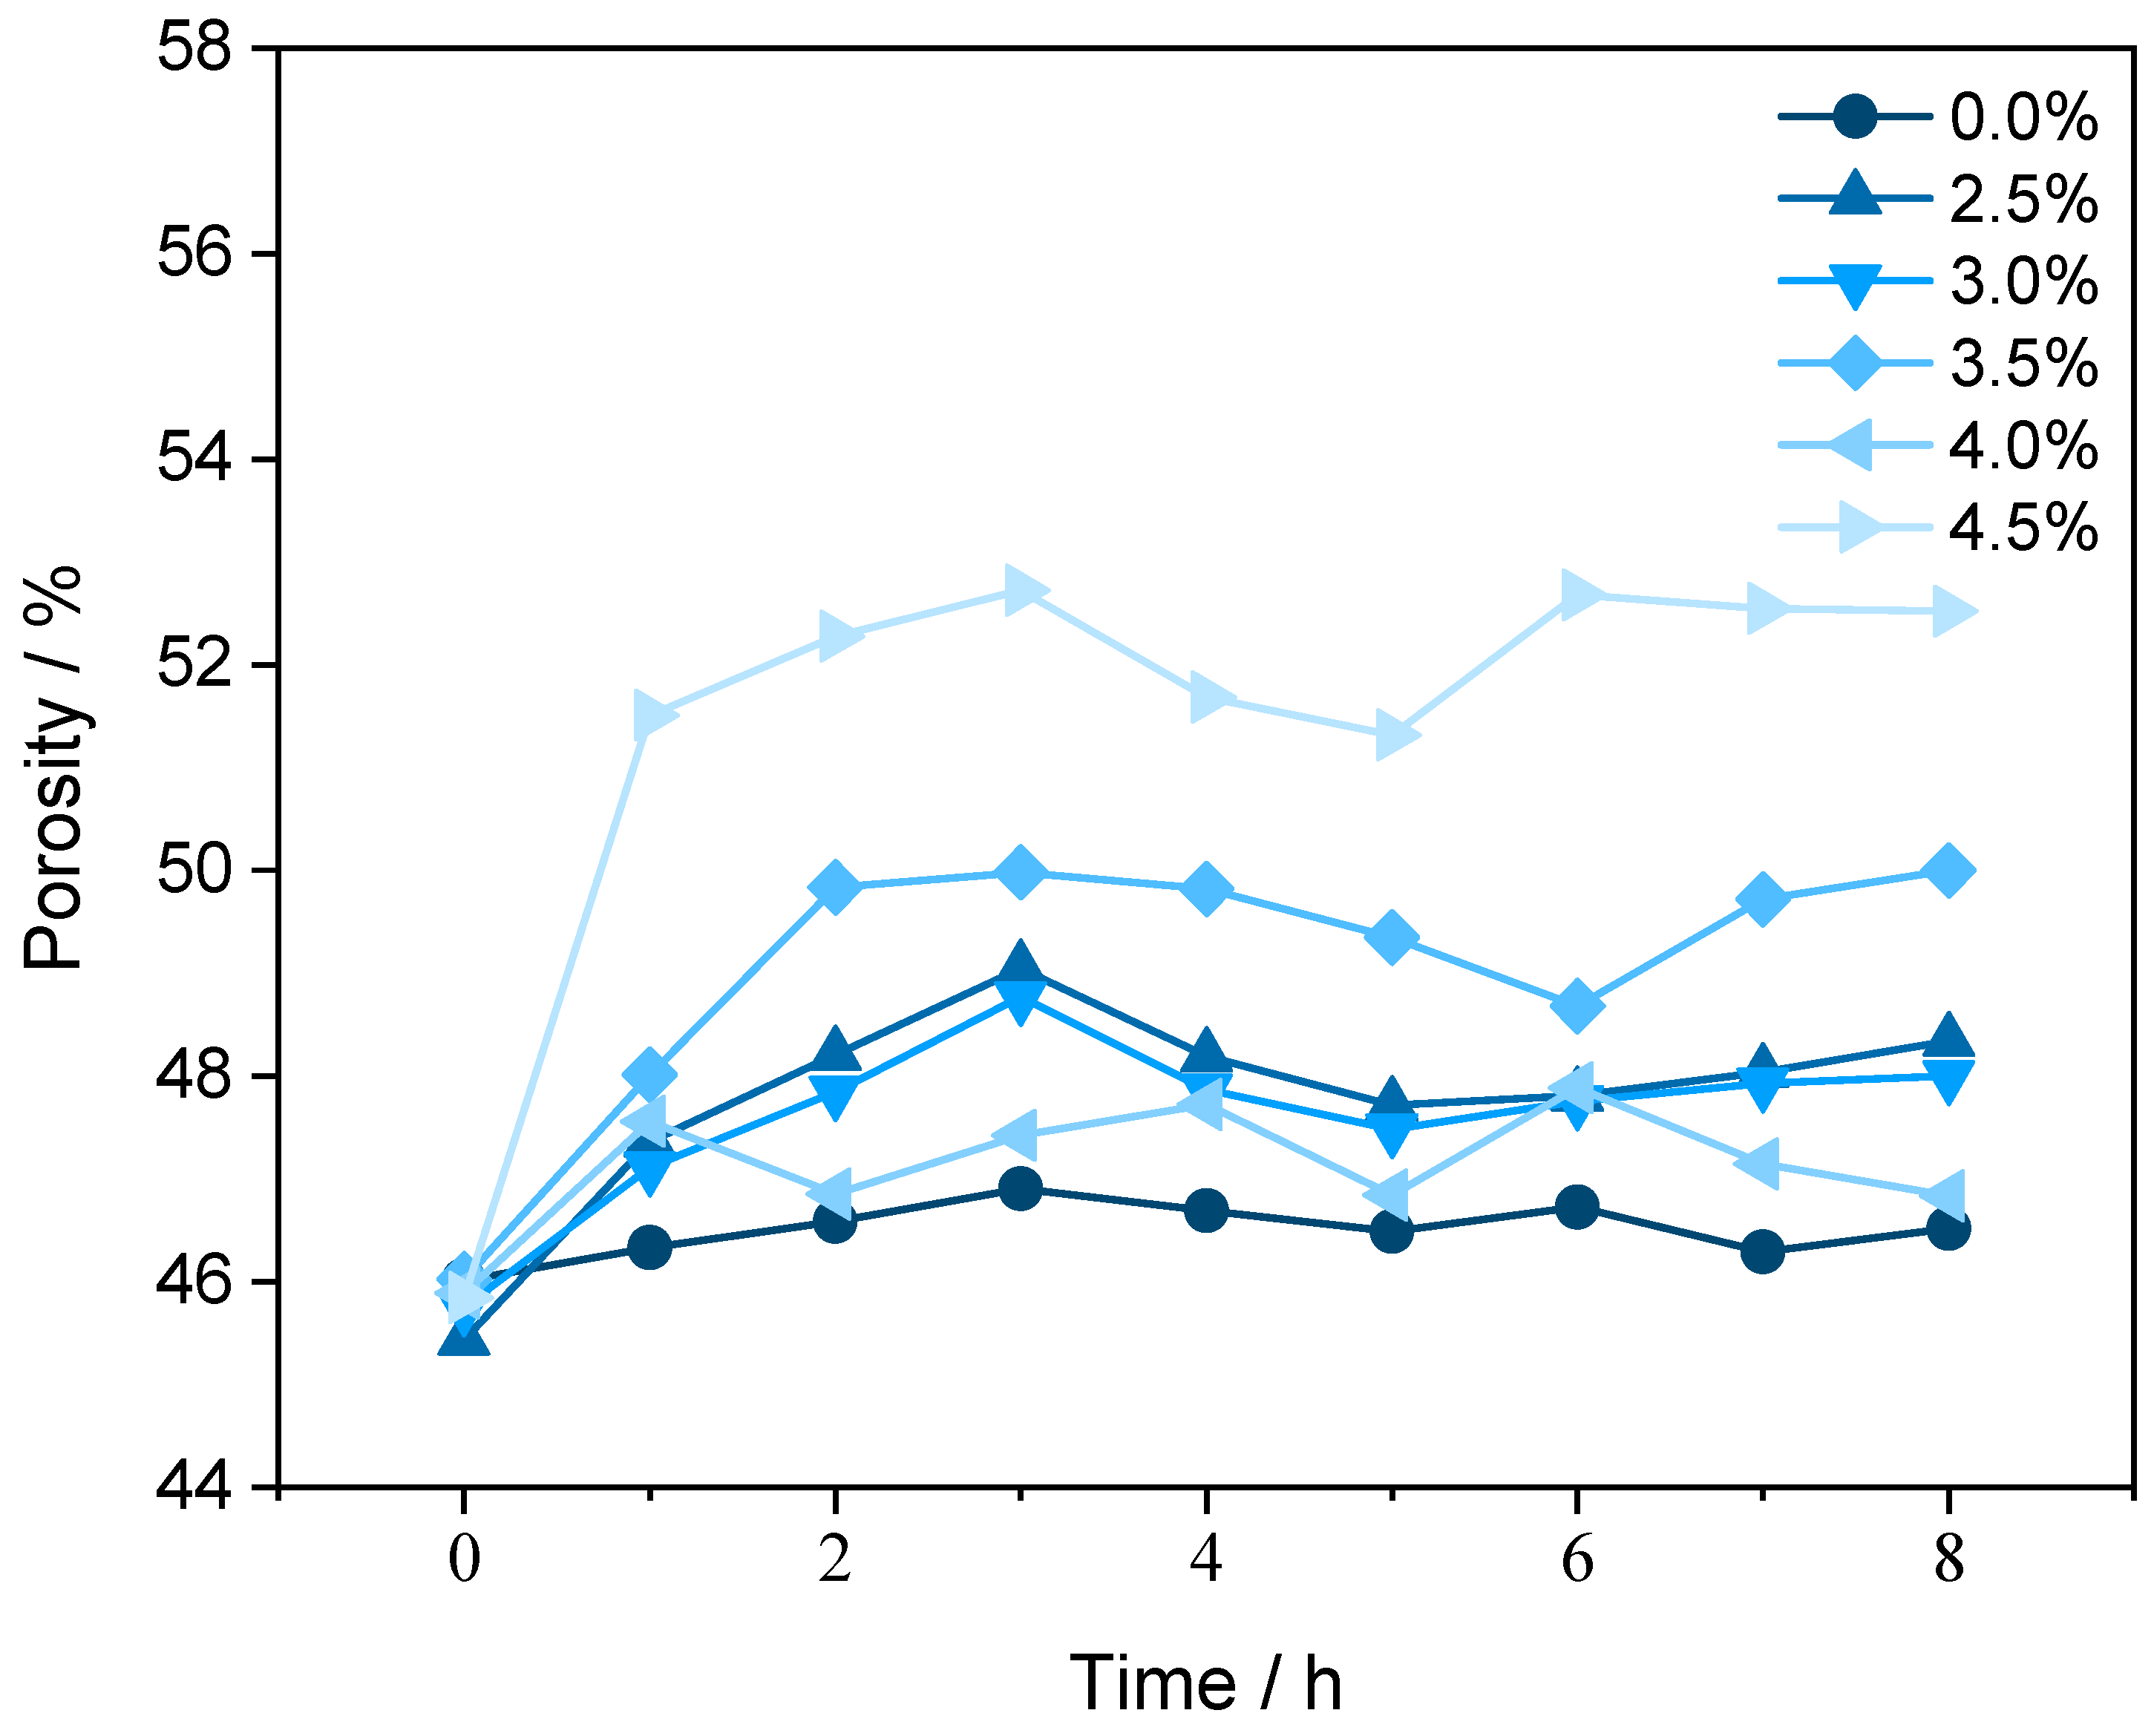
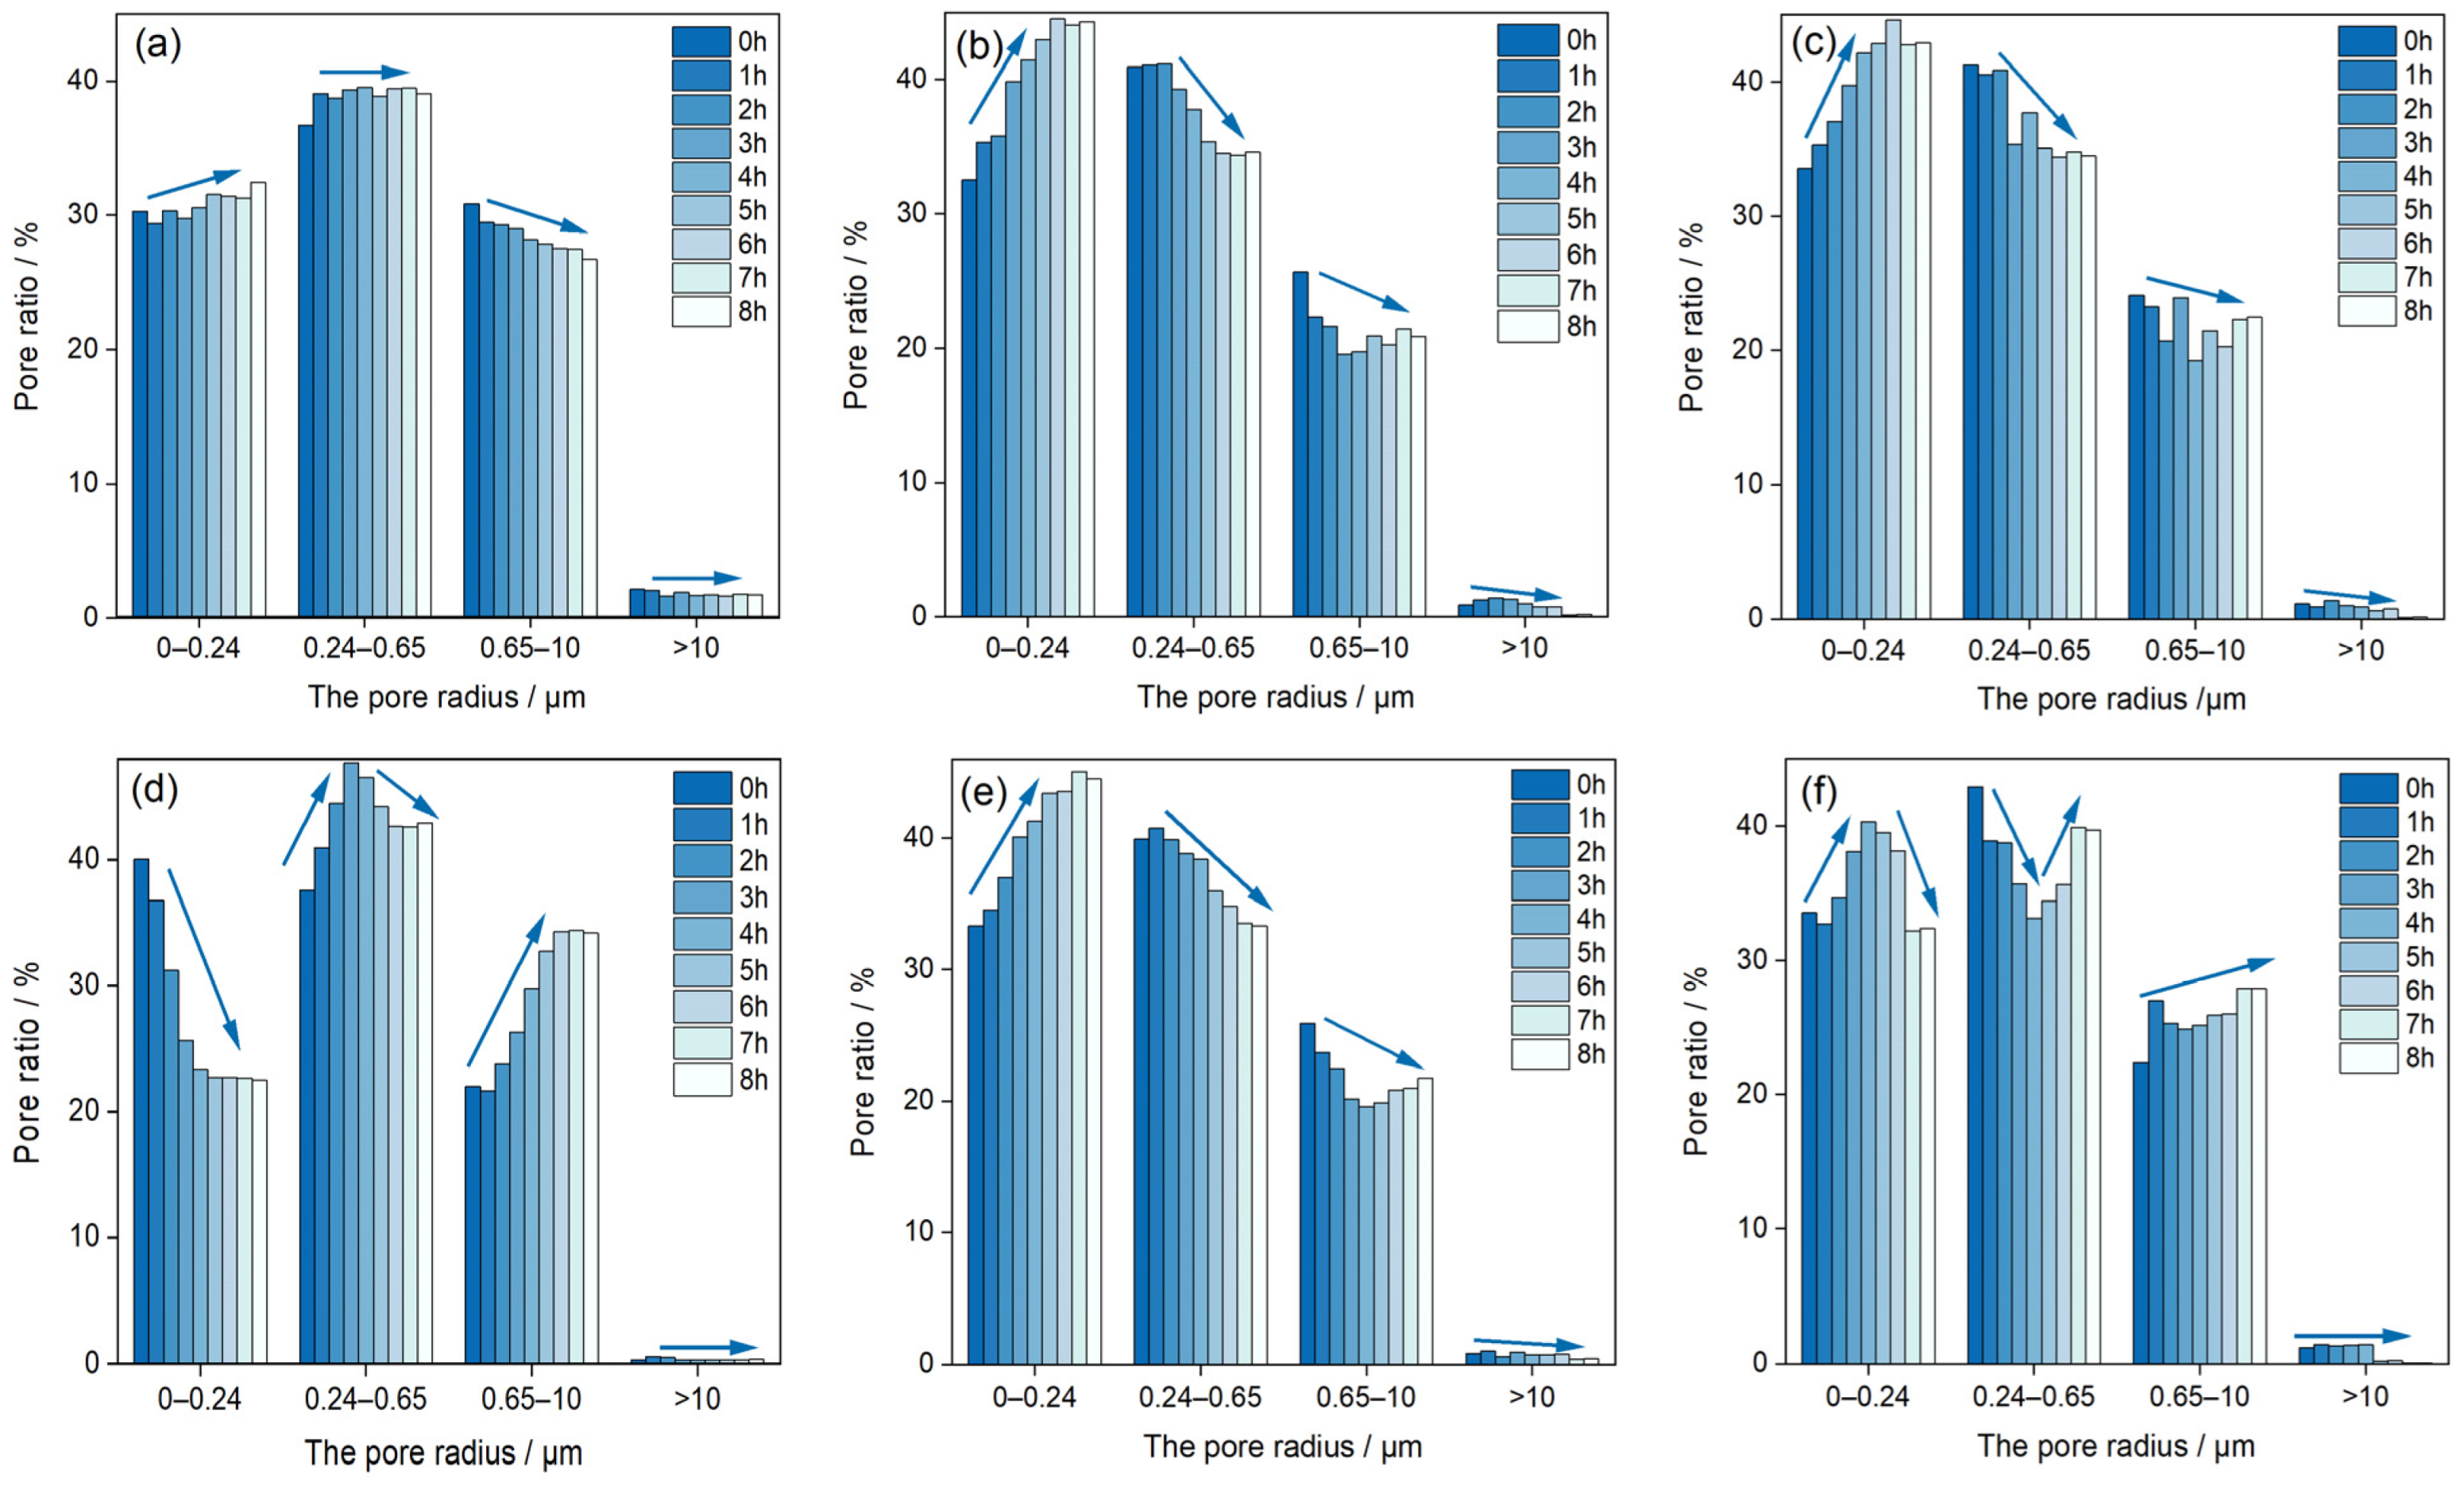
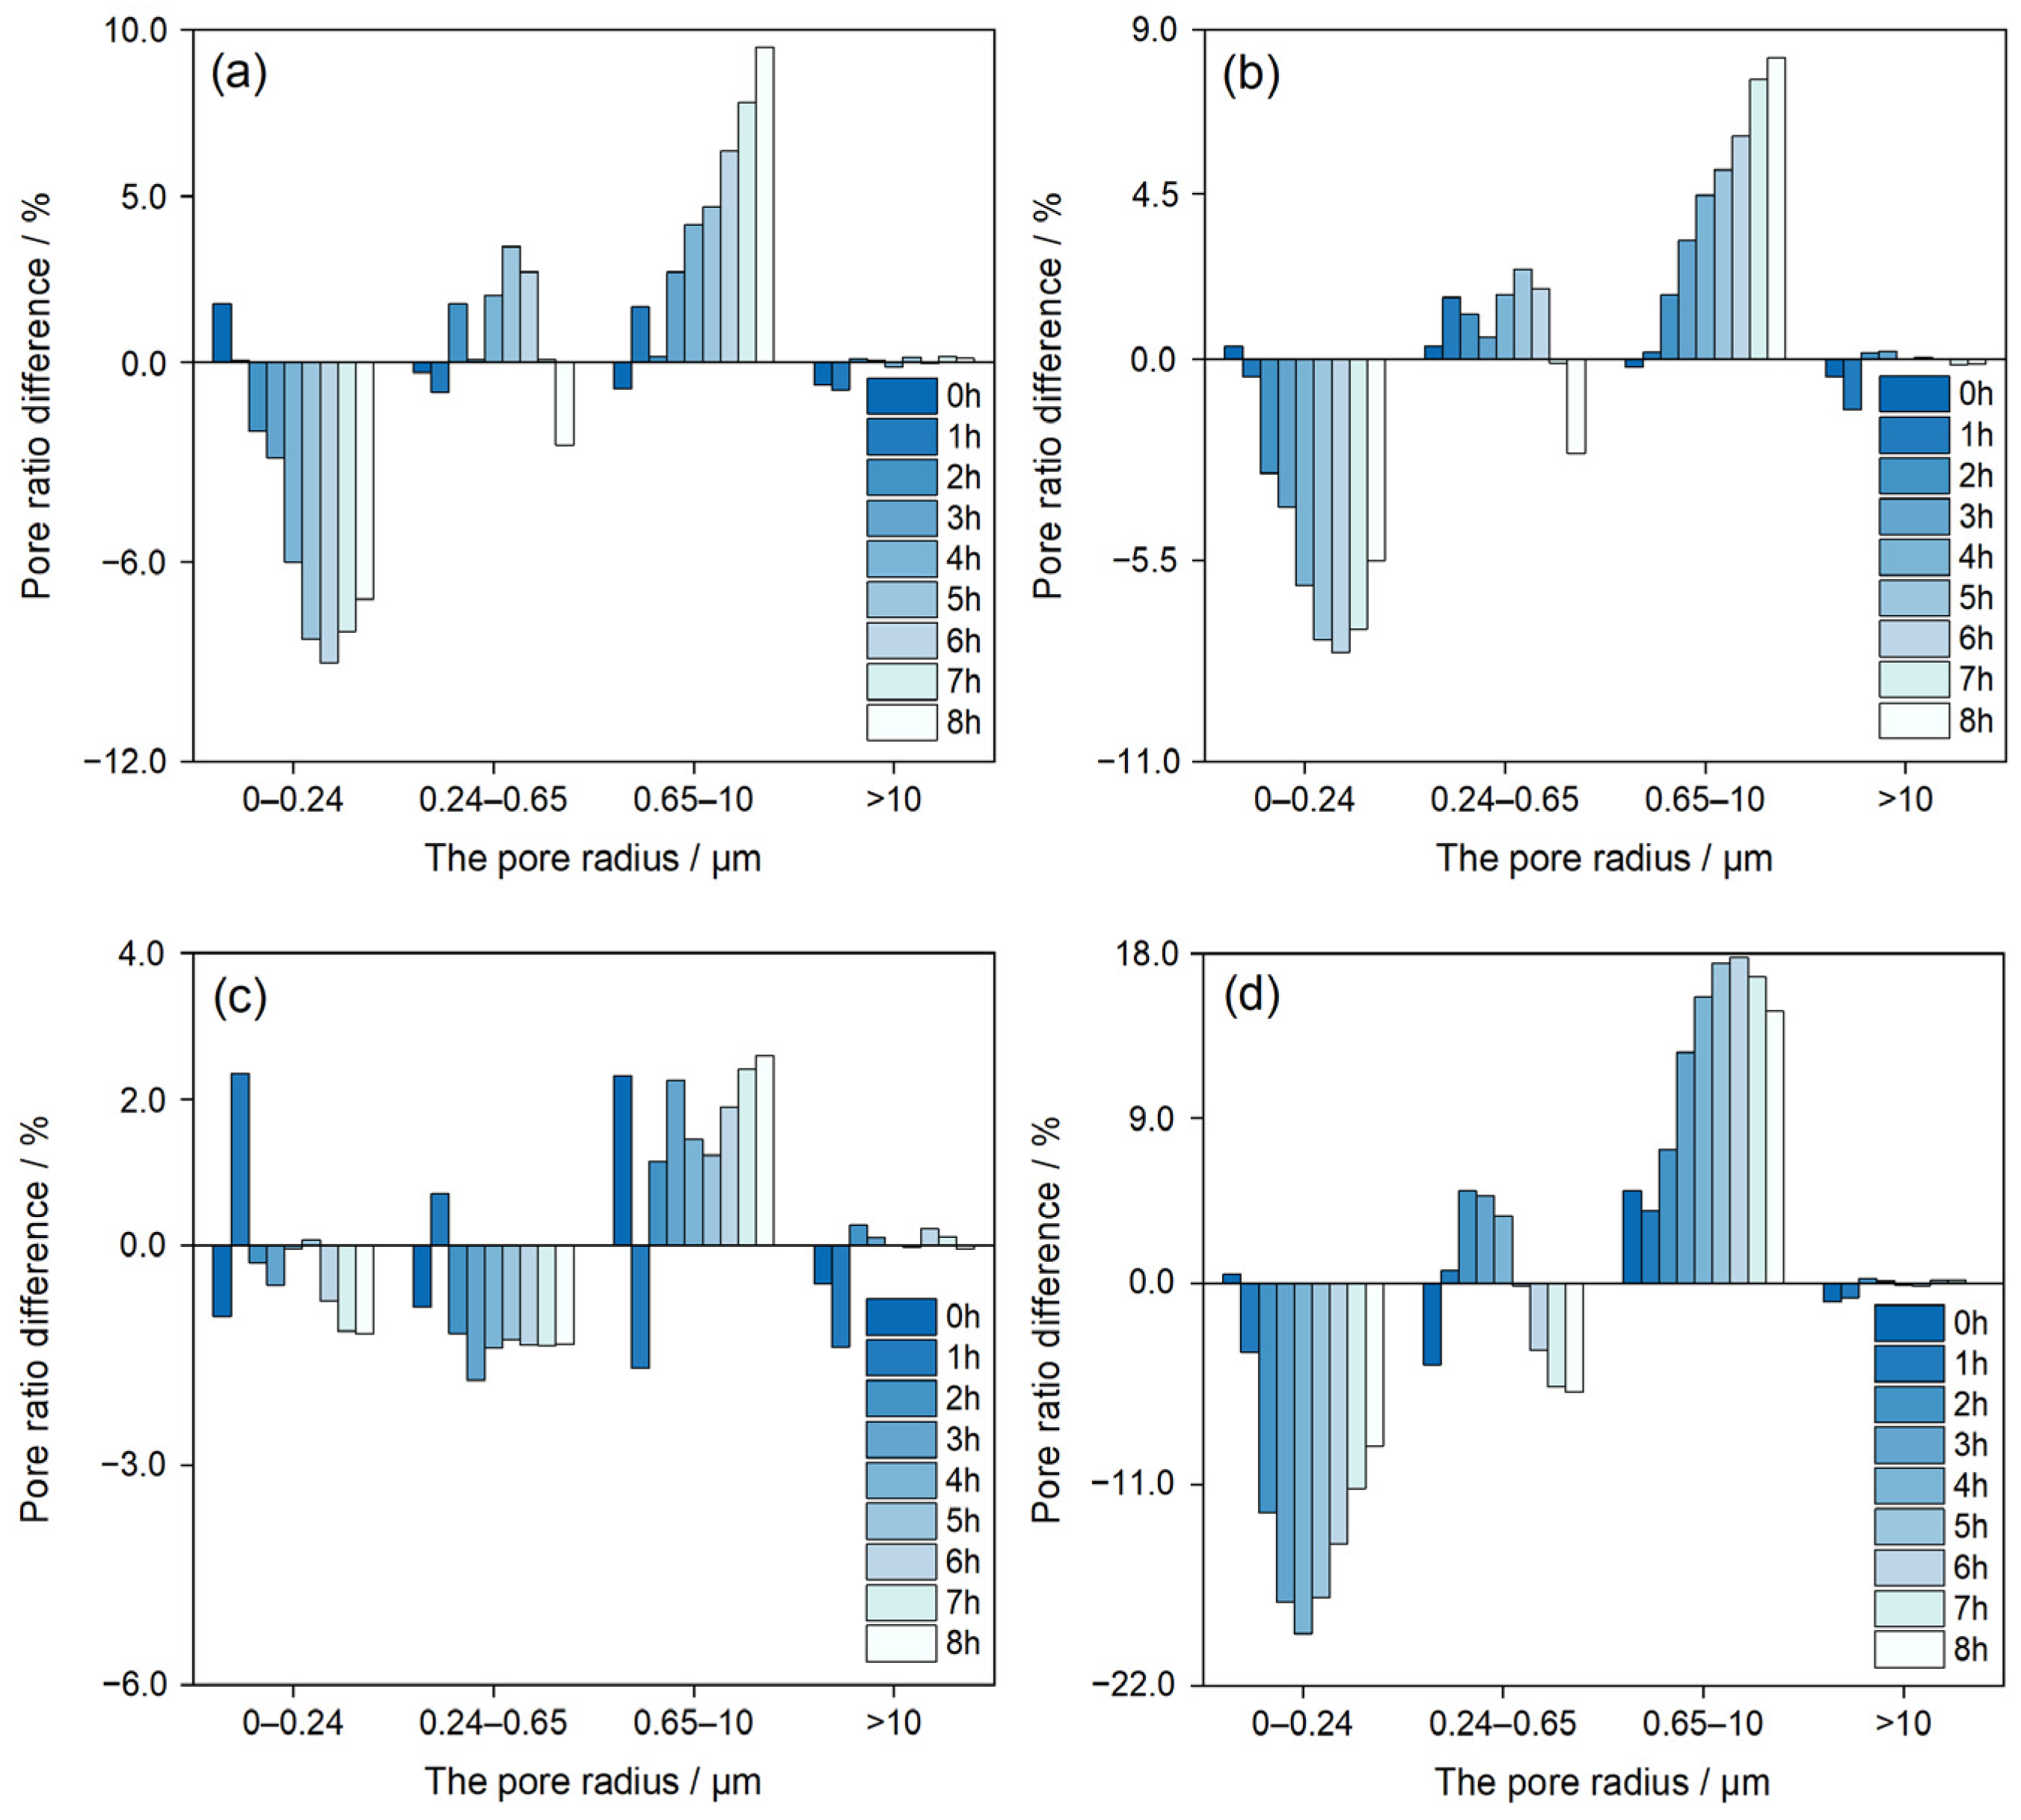
- In the leaching process of magnesium sulfate solution with different mass percent concentrations, the absolute value of Zeta potential on the surface of rare earth ore particles decreases with the leaching time going on. When the solution with a concentration of 4.0% is used as a leaching agent, the change of the Zeta potential reaches the maximum, reducing by 53.60%. The curve of the Zeta potential change of samples leached with high concentrations of magnesium sulfate solutions fluctuates greatly, while that of low-concentration solutions is relatively gentle. The porosity increases first, then decreases, and finally slowly increases during the leaching time. The internal pores are mainly small and medium. During the leaching time, the number of small and large pores increases in the samples with 3.5% and 4.5% solutions. In the samples with the other concentrations, the number of small pores increases rapidly while the number of large and extra-large pores is small and decreases;
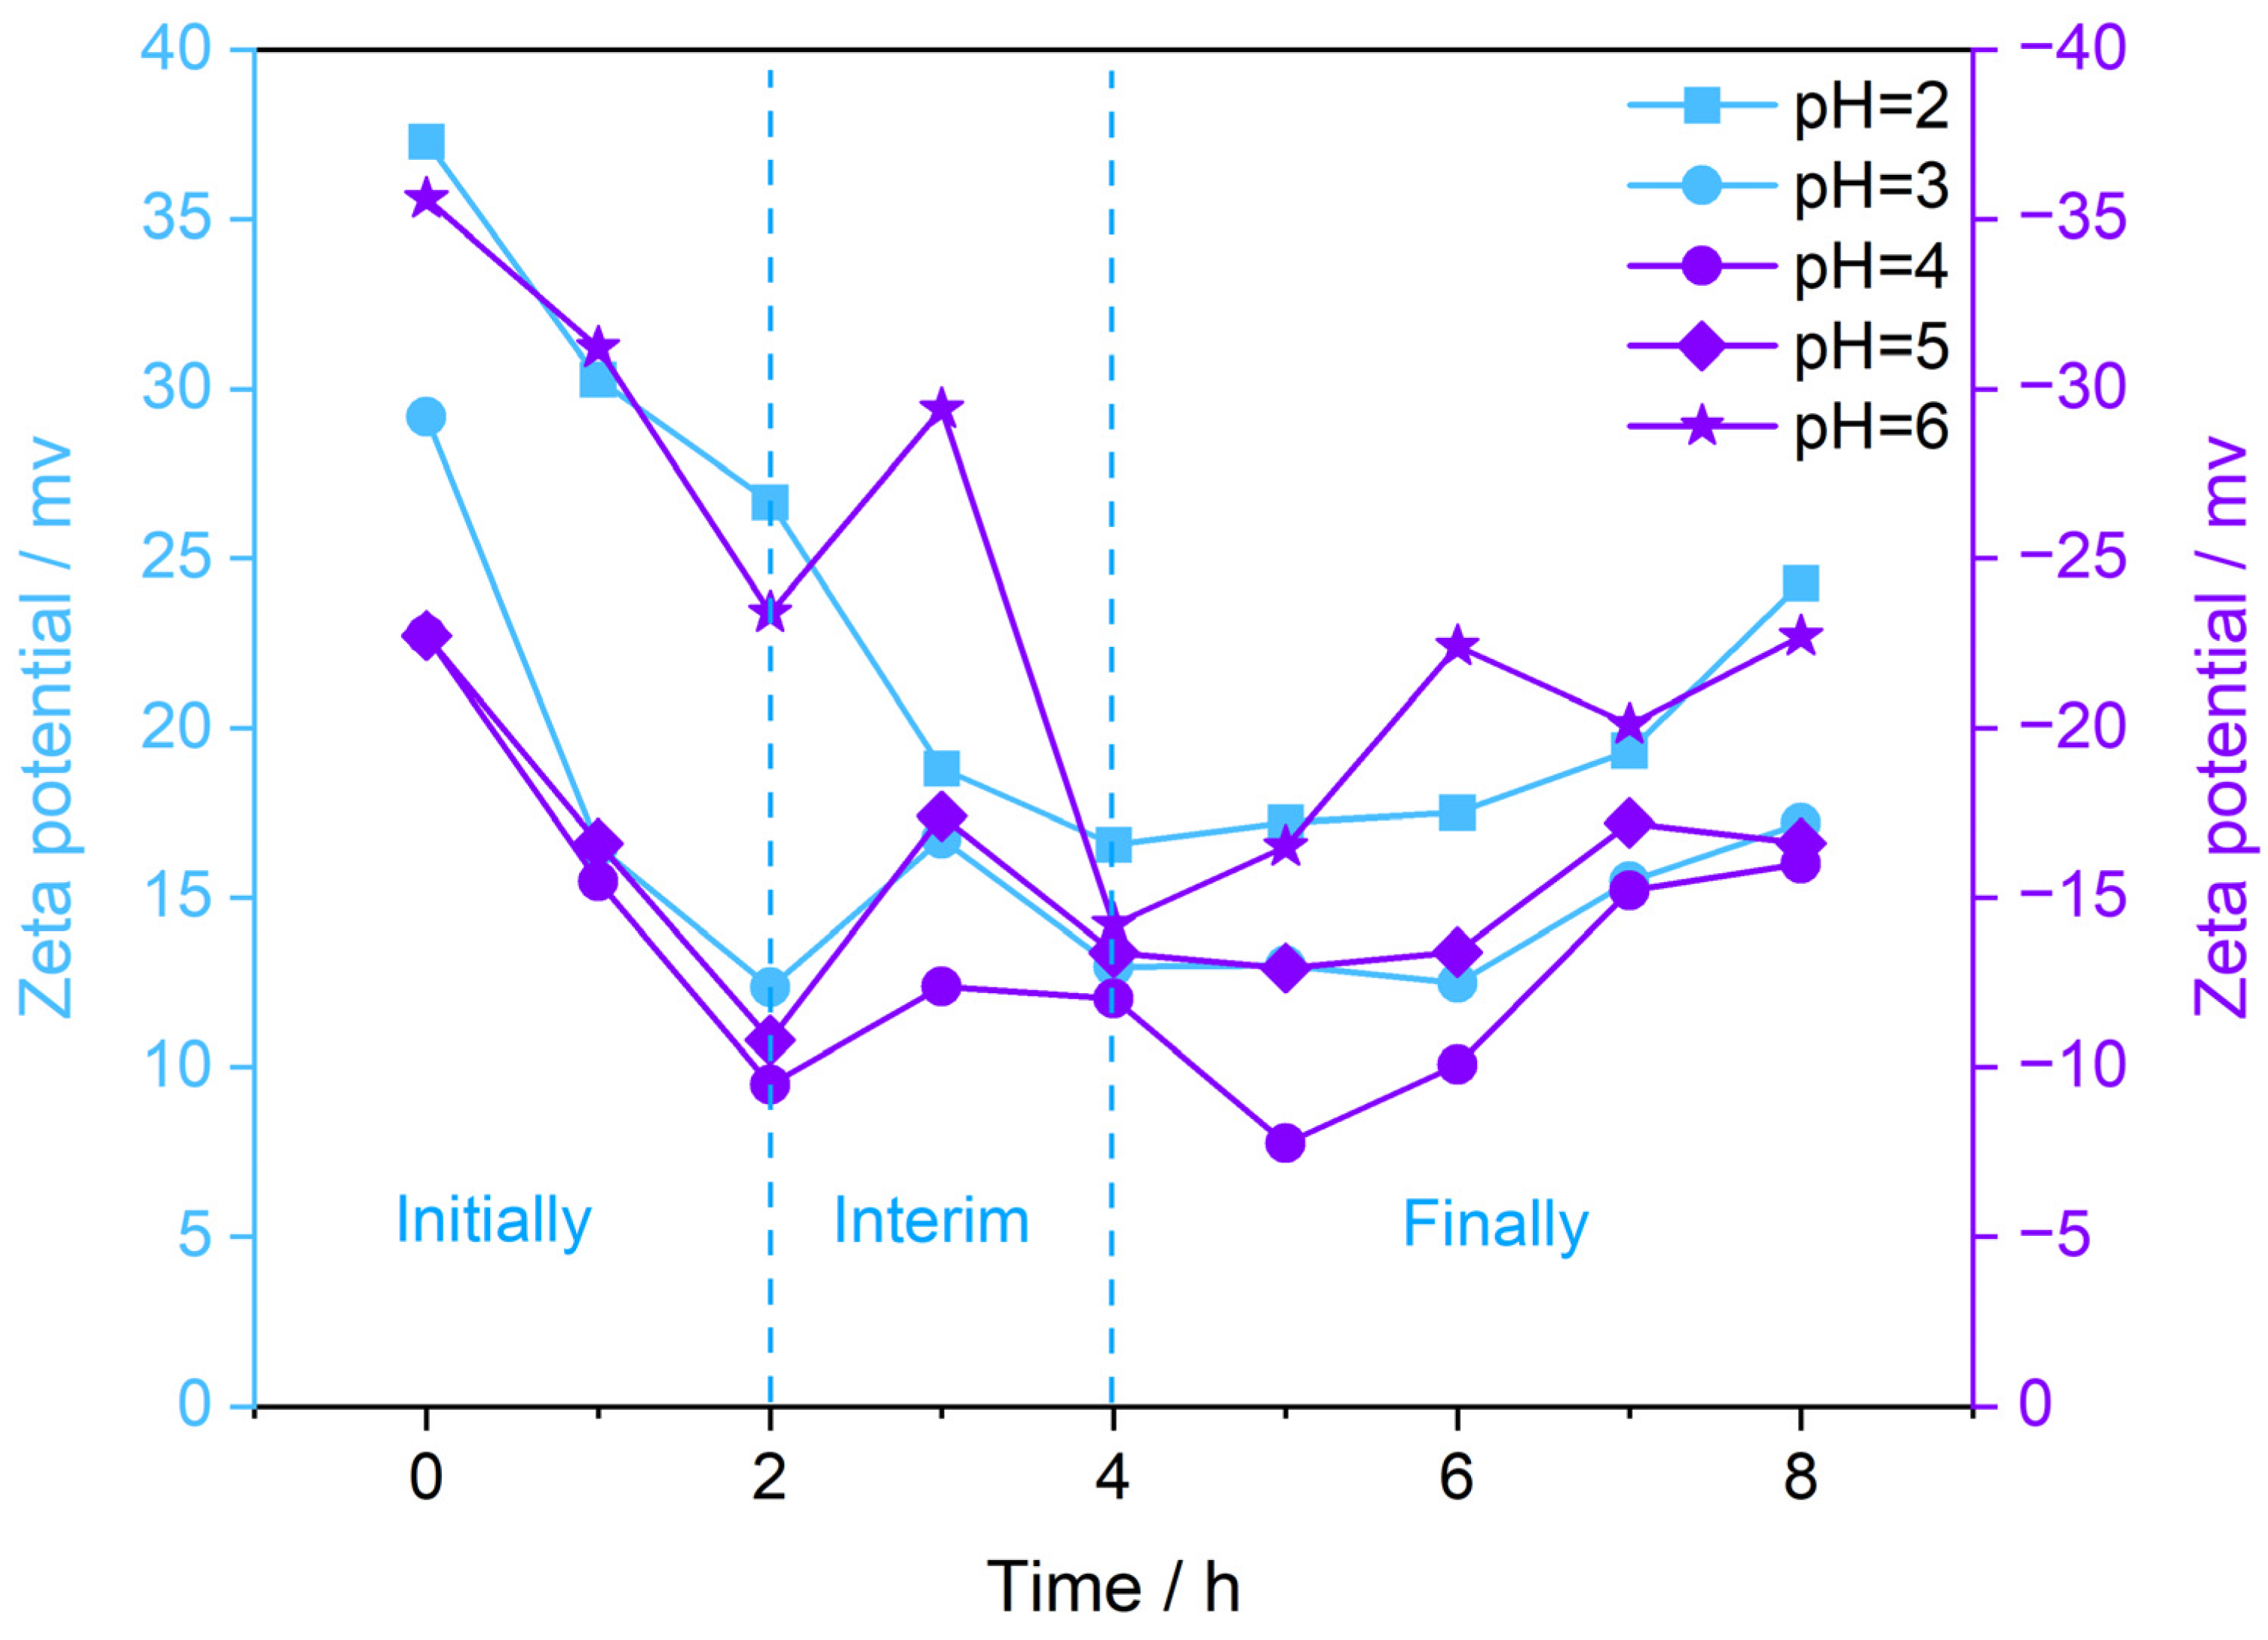
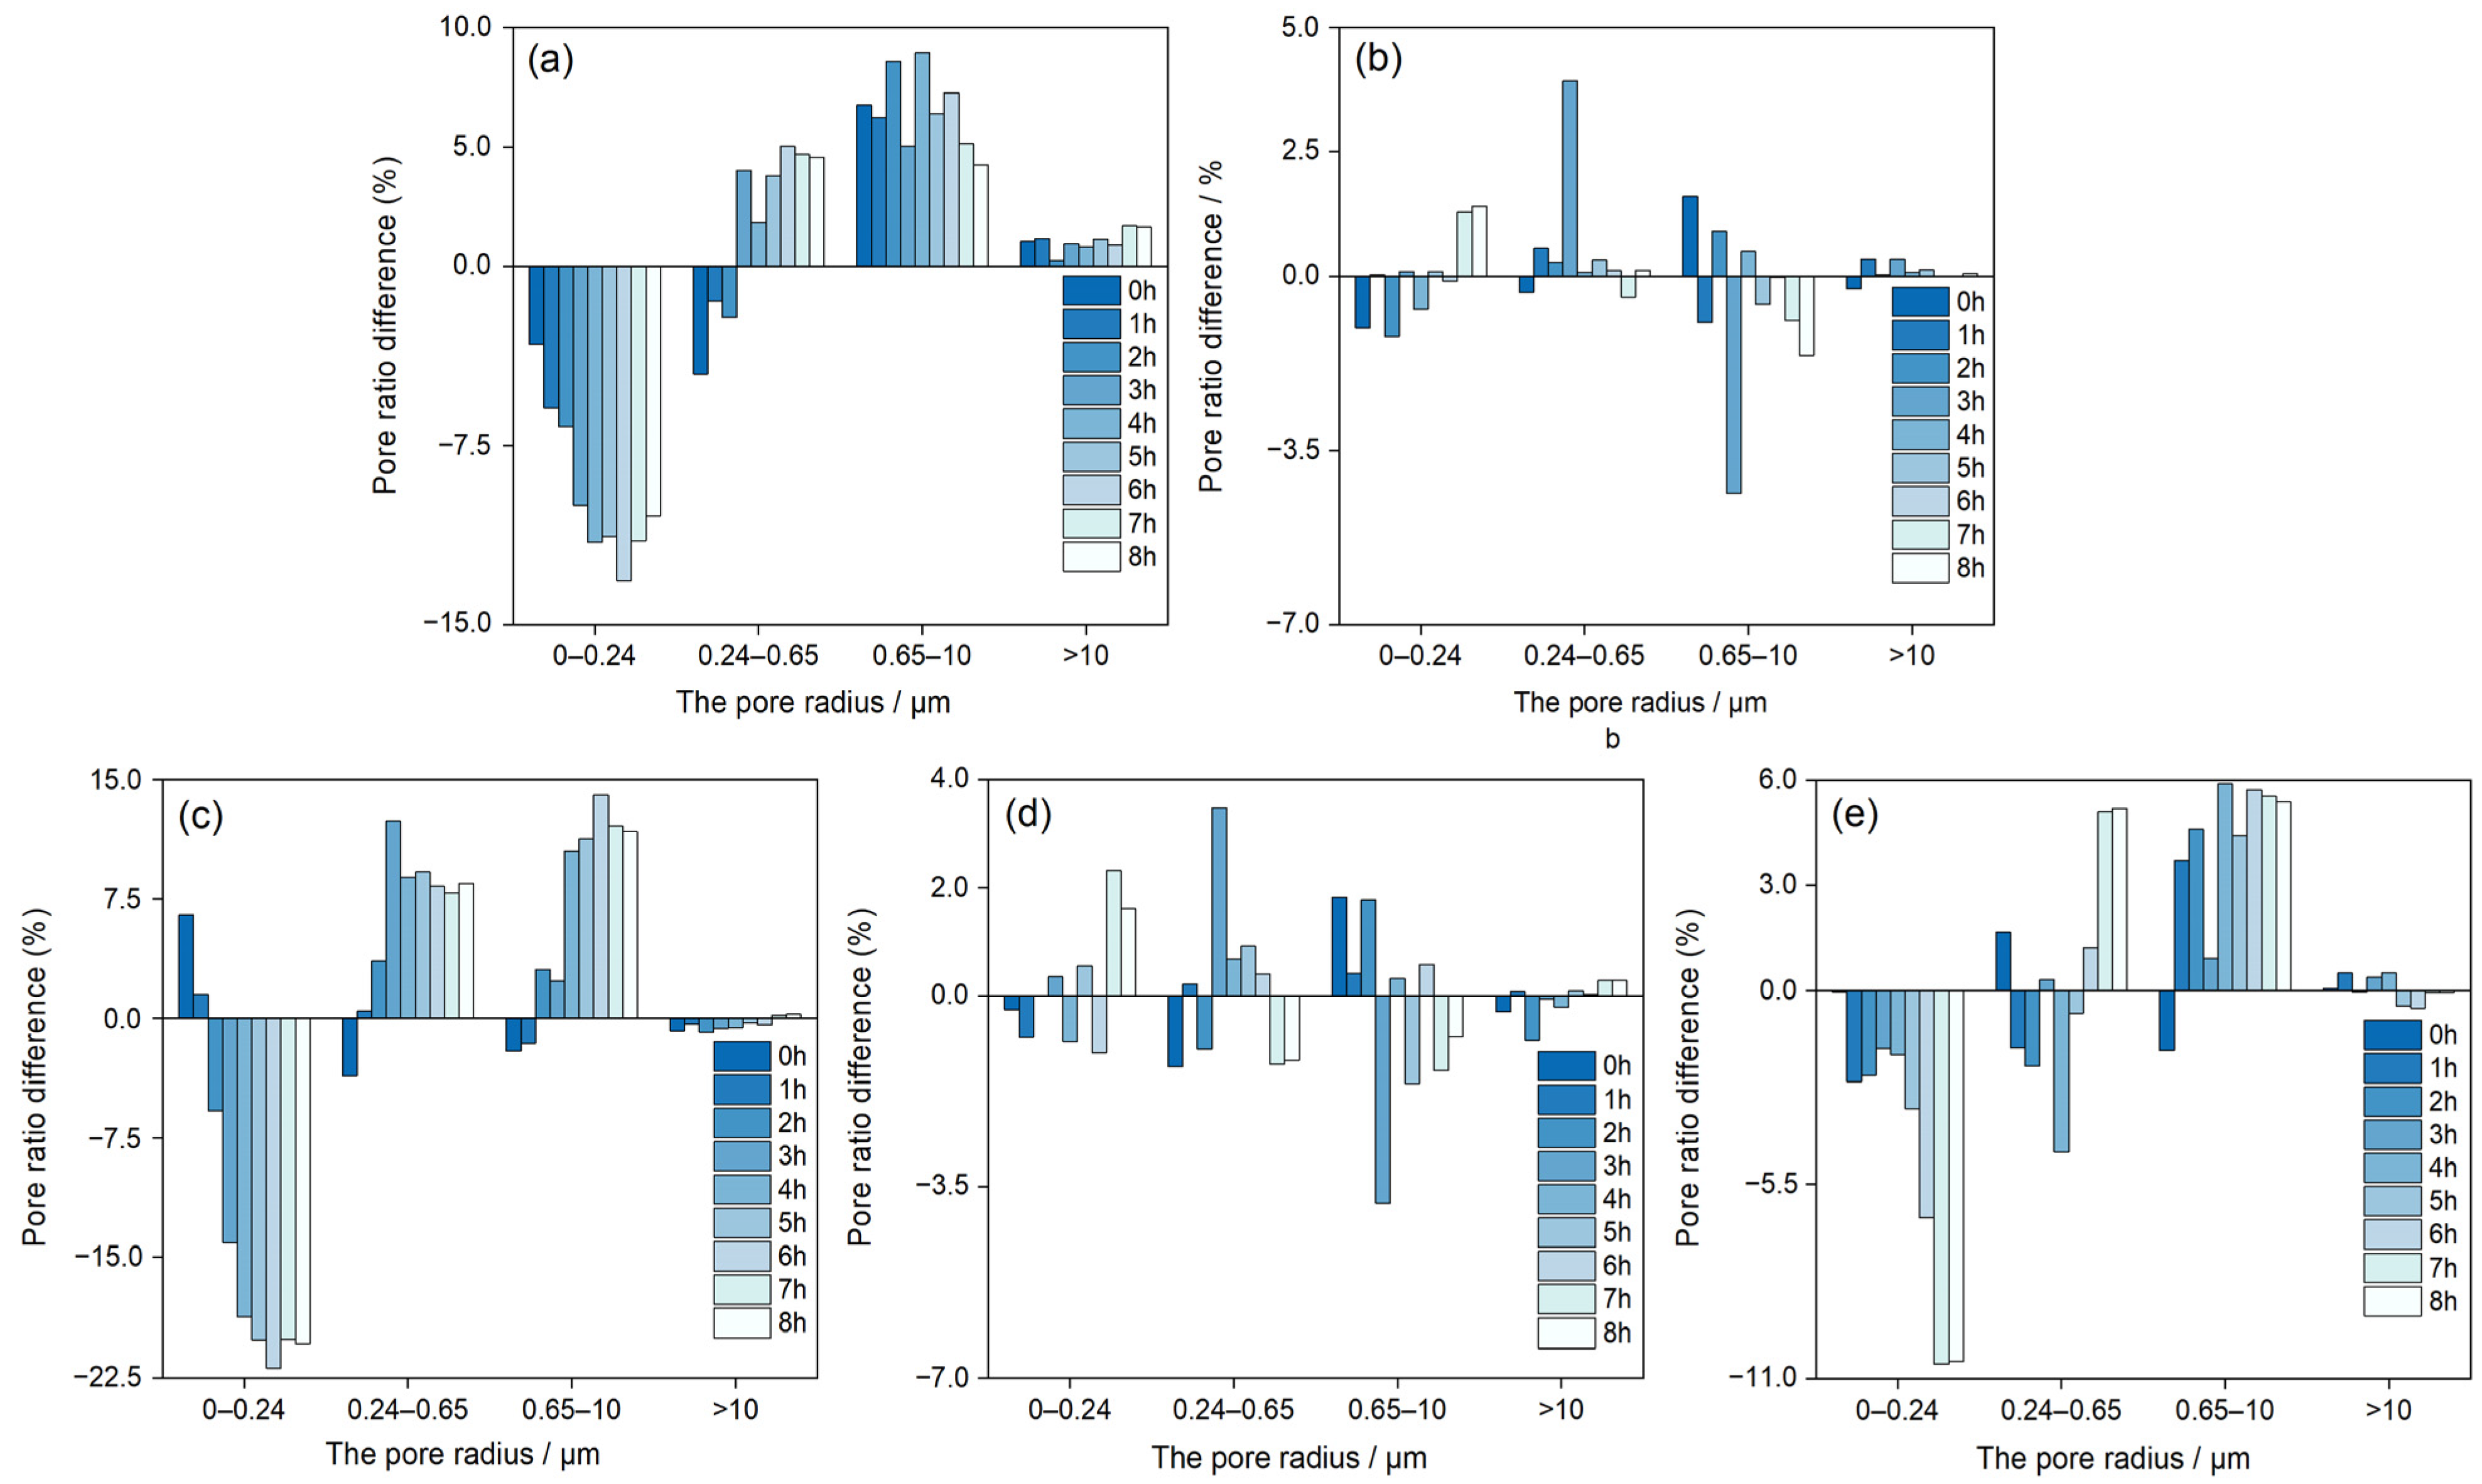
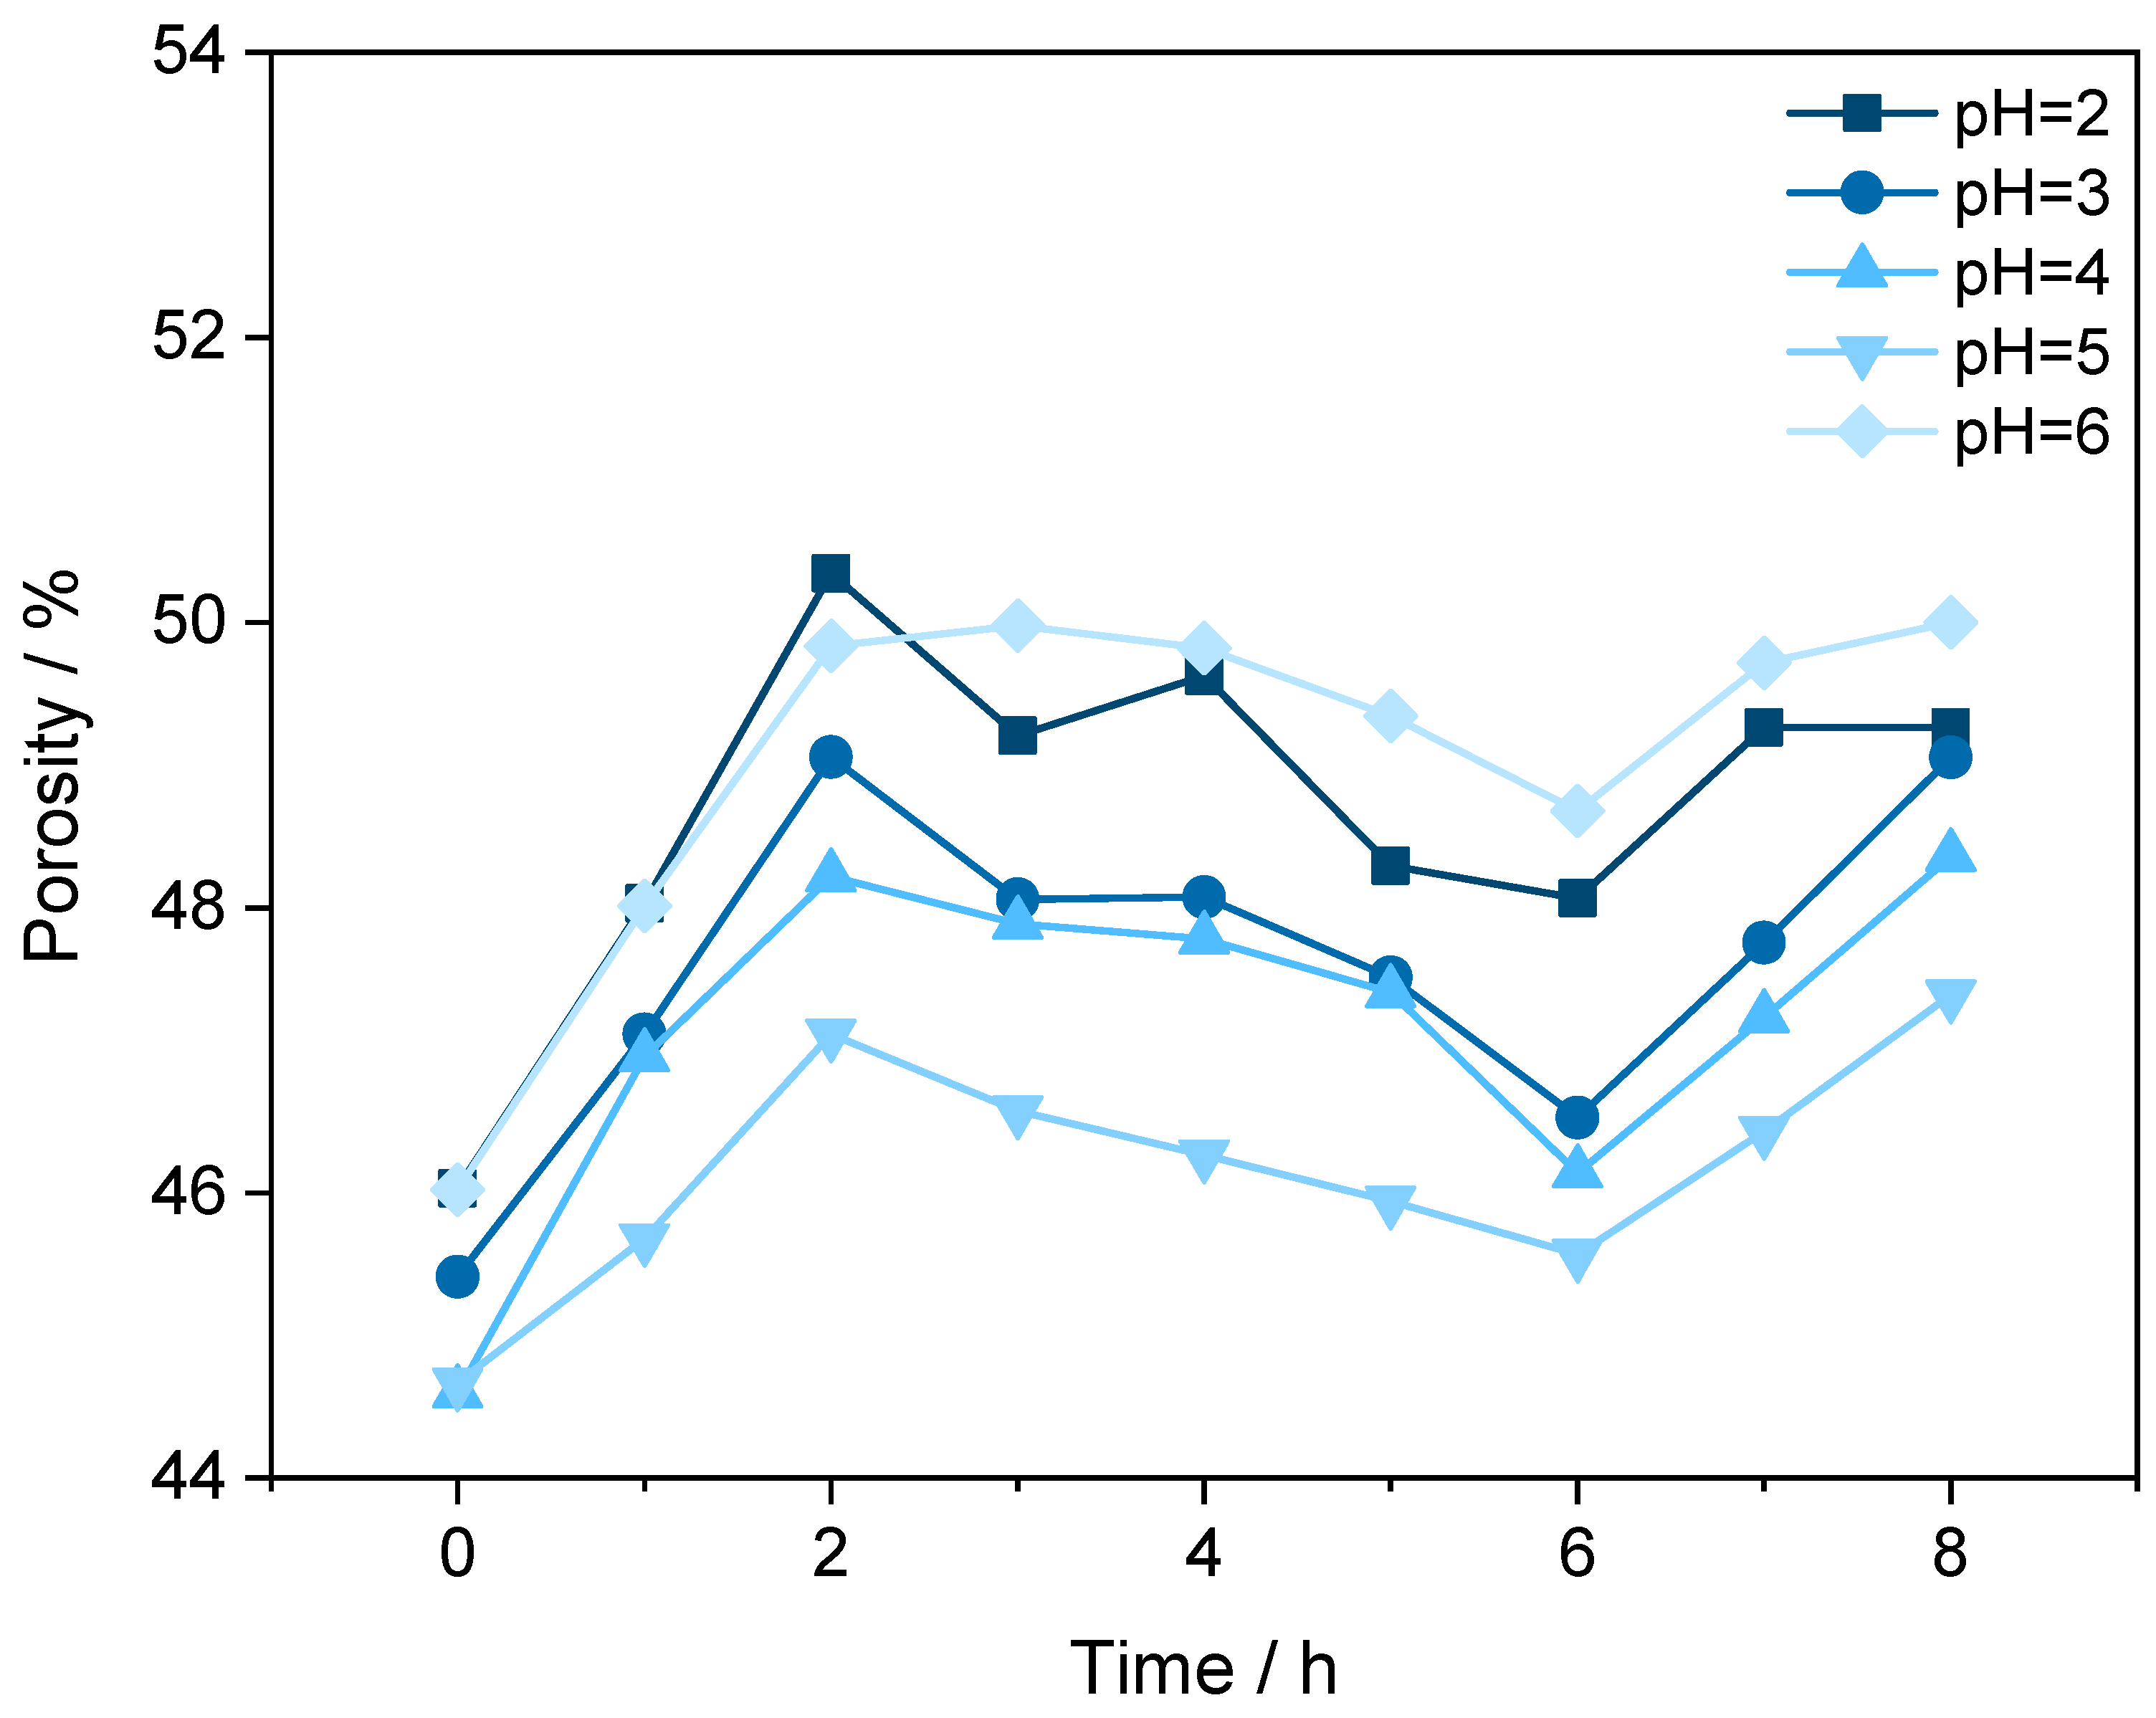
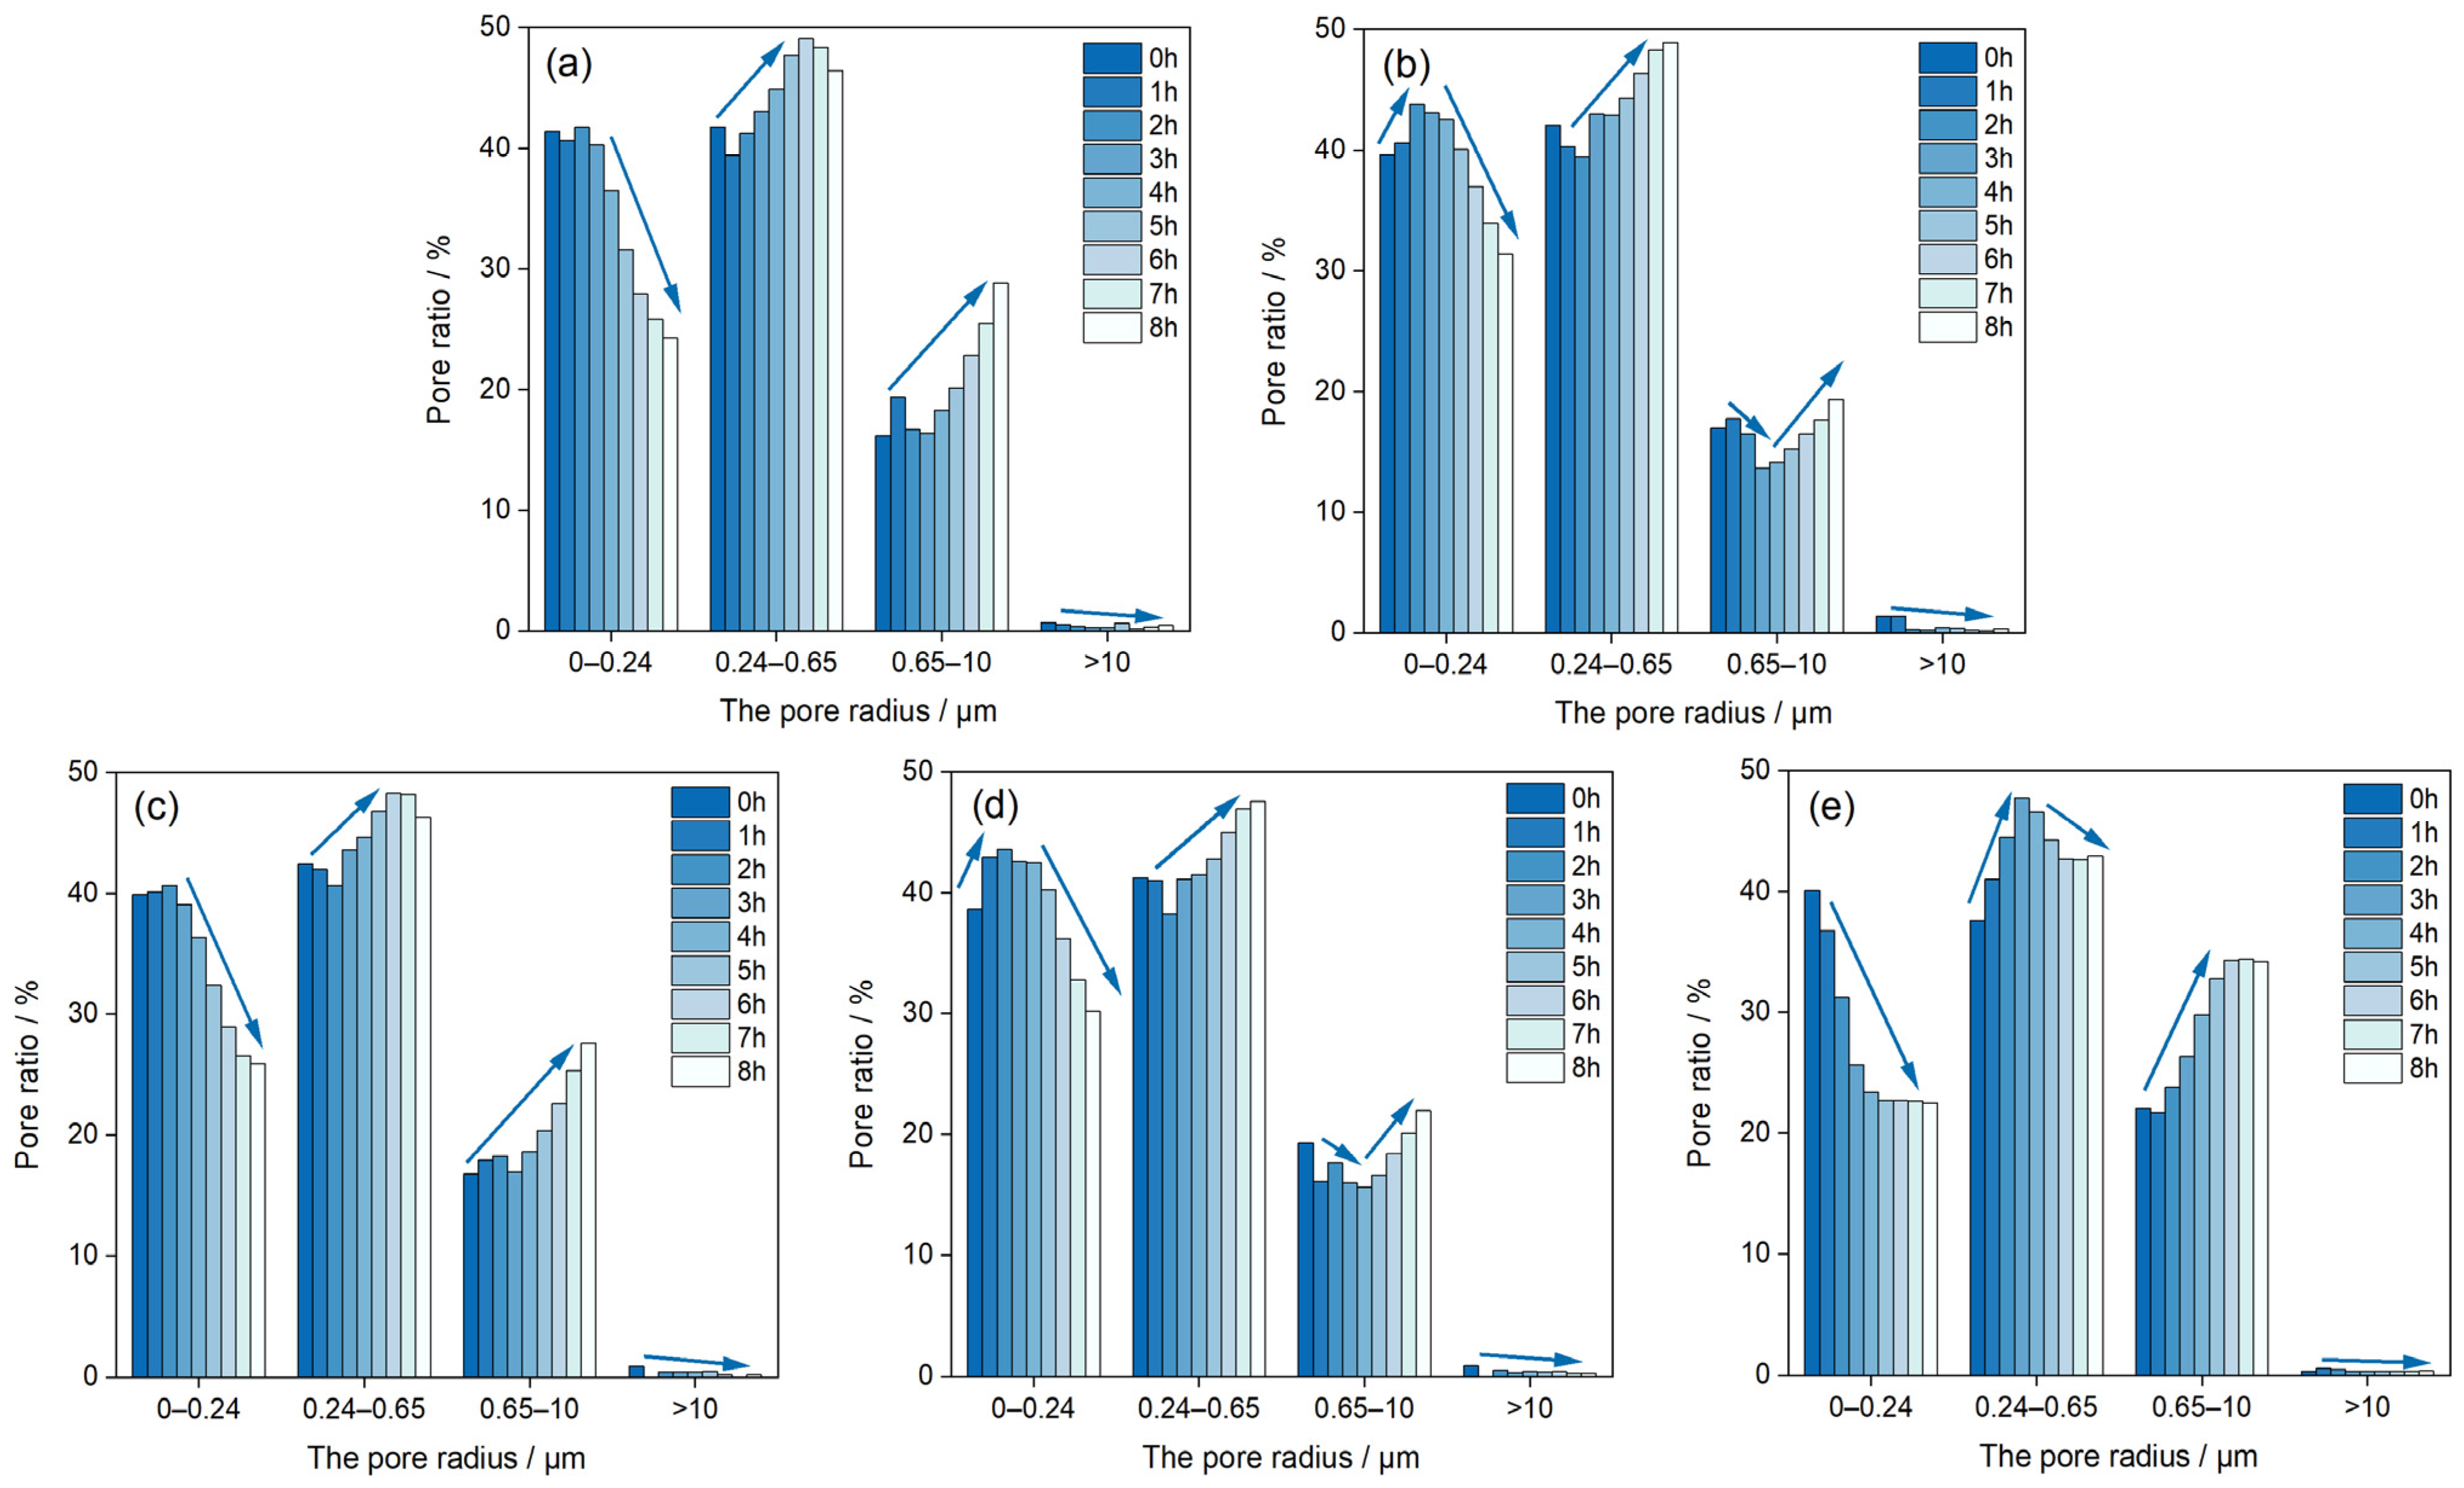
- In the leaching process of magnesium sulfate solutions with different pH, the absolute value of Zeta potential on the surface of rare earth ore particles decreases during the leaching time. In the later stage of the process, the value shows a slightly increasing trend. When the magnesium sulfate solution with pH = 3 is used as a leaching agent, the change of Zeta potential reaches the maximum, reducing by 41.04%. The porosity increases first and then decreases, and finally slowly increases with time. The internal pore structure of the samples generally shows that the number of small and extra-large pores decreases while the number of medium and large pores increases;
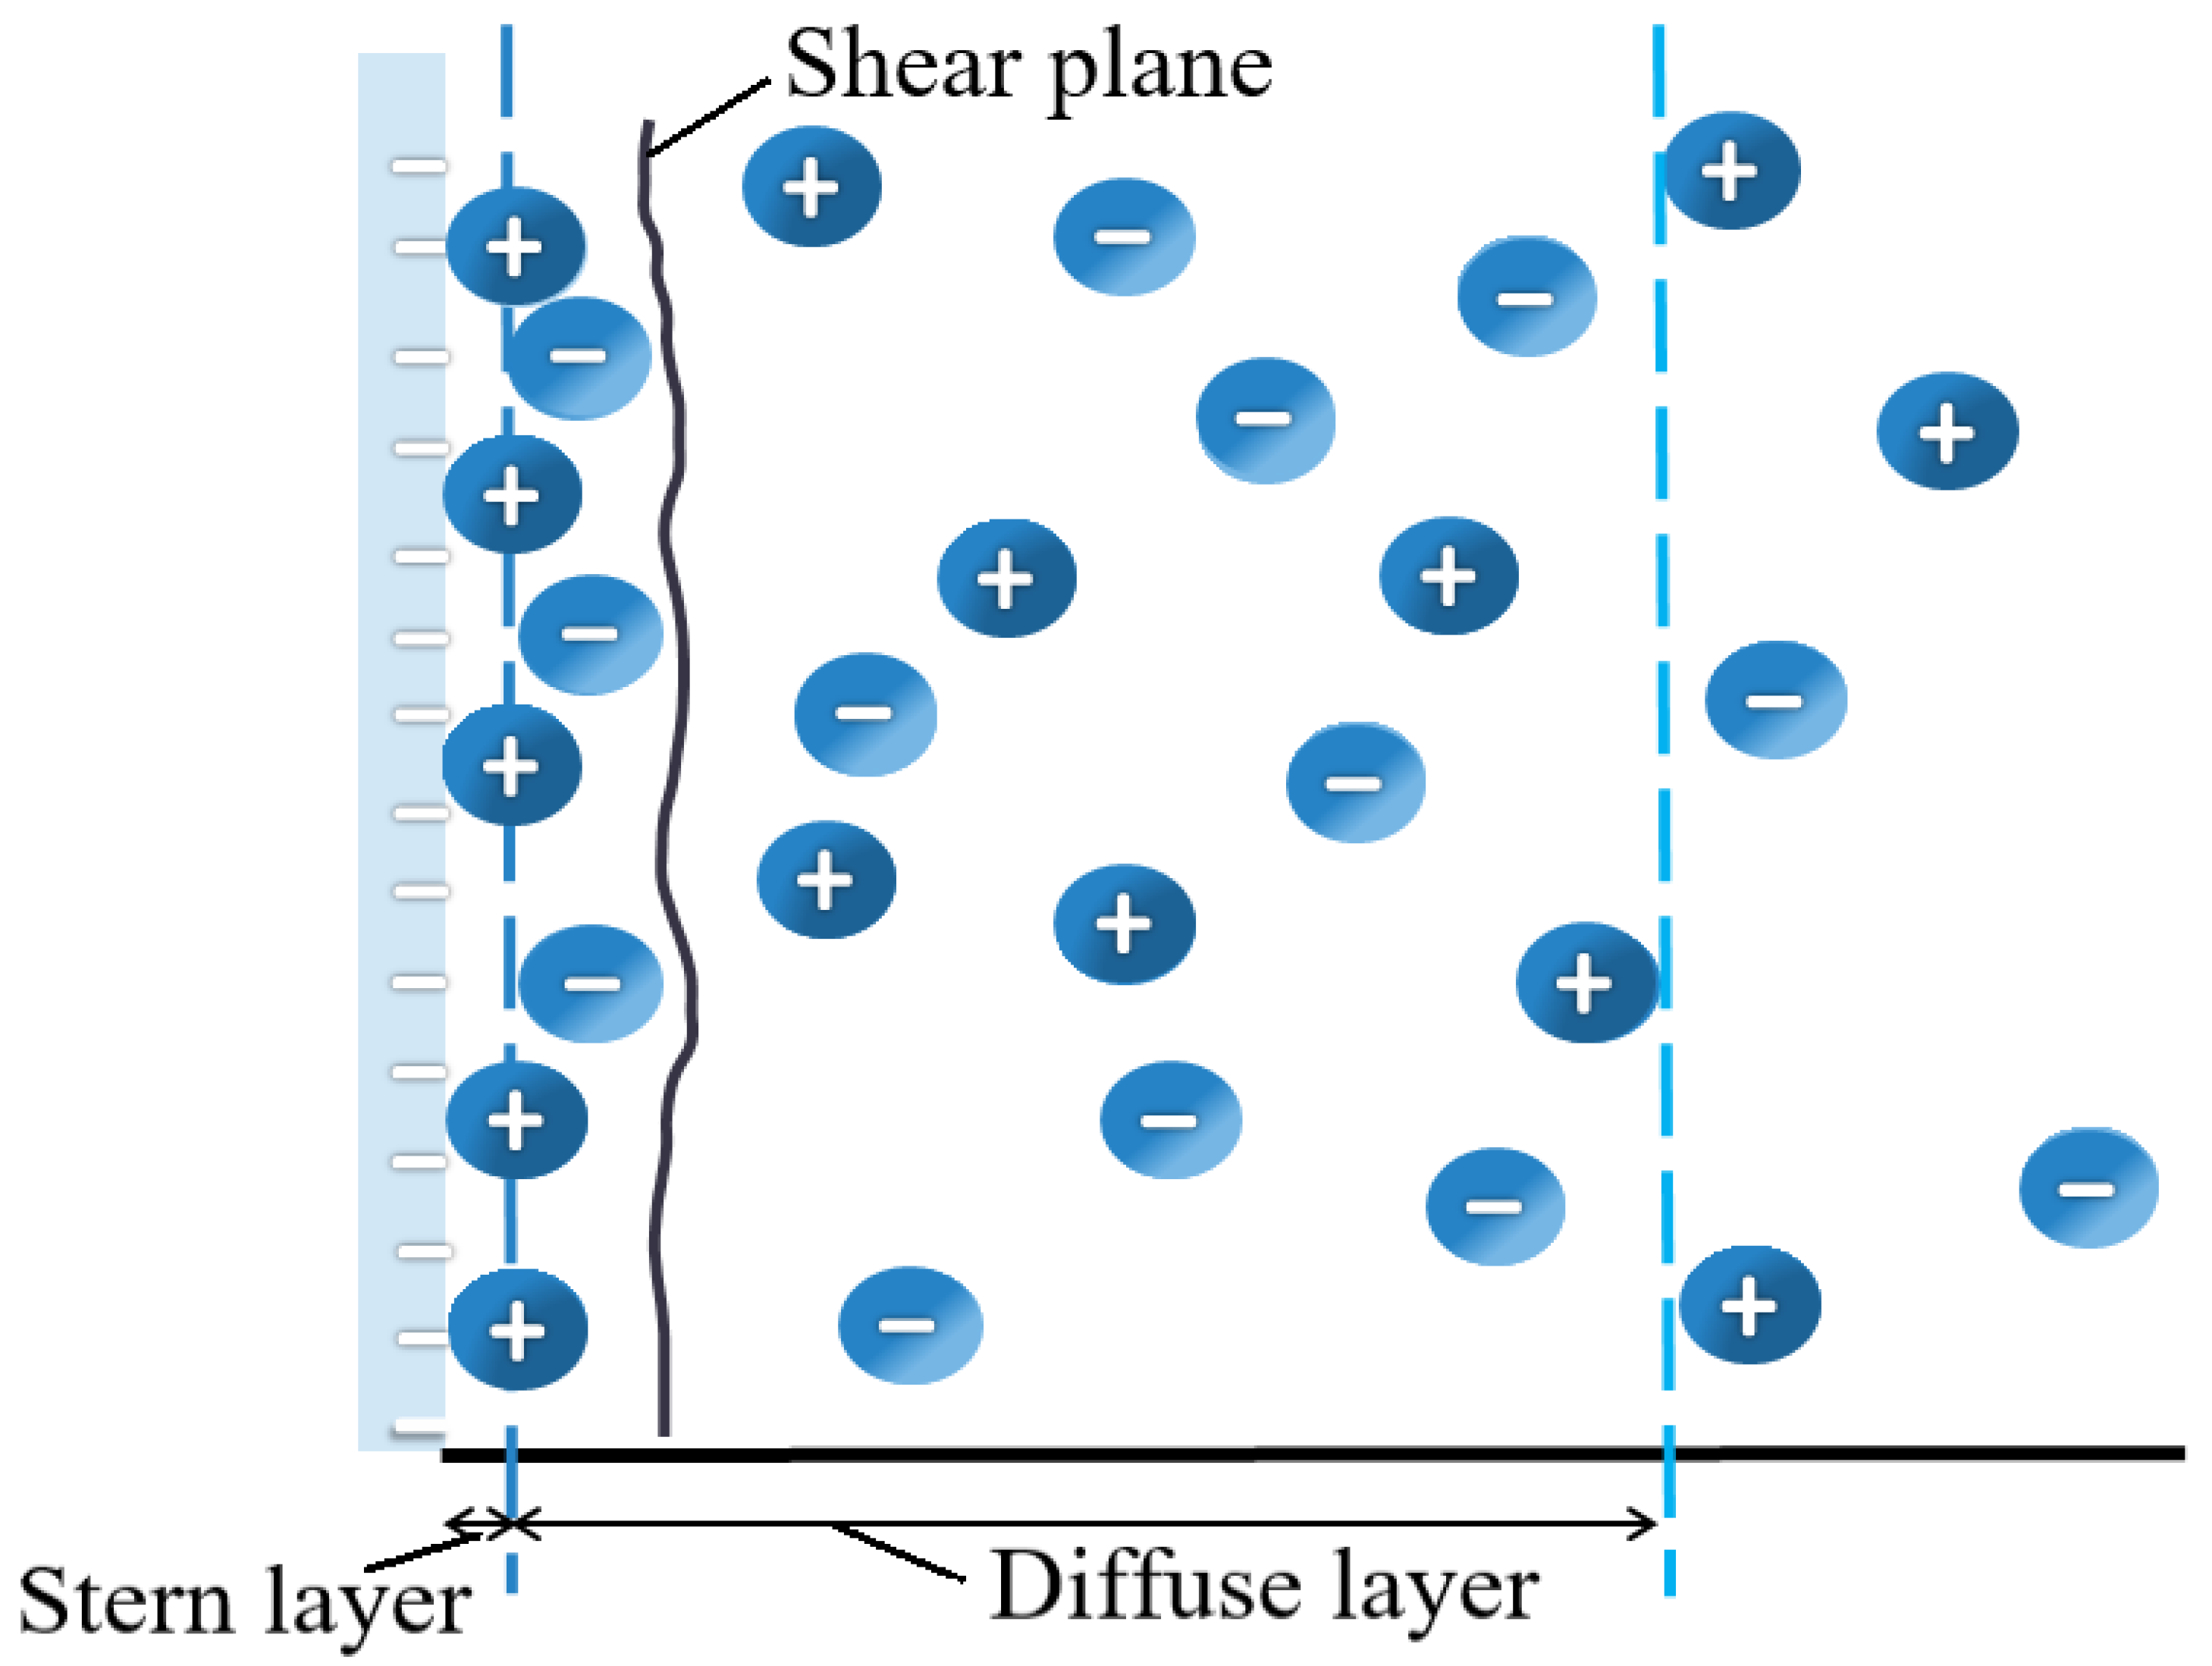
- When magnesium sulfate solutions with different concentrations and pH are used for leaching, a chemical replacement reaction occurs between Mg2+ and RE3+, resulting in a change in the thickness of the electric double layer and the breaking of the balance between the van der Waals force and electric double layer repulsion of fine particles and soil surface. The reaction also causes the agglomeration, dispersion, and dynamic desorption transformation of fine particles, leading to the evolution of the microscopic pore structure of the orebody during the leaching process.
Author Contributions
Funding
Data Availability Statement
Acknowledgments
Conflicts of Interest
References
- Zhou, L.B.; Wang, X.J.; Huang, C.G.; Wang, H.; Ye, H.C.; Hu, K.J.; Zhong, W. Development of pore structure characteristics of a weathered crust elution-deposited rare earth ore during leaching with different valence cations. Hydrometallurgy 2021, 201, 105579. [Google Scholar] [CrossRef]
- Nie, W.R.; Zhang, R.; He, Z.Y.; Zhou, J.; Wu, M.; Xu, Z.G.; Chi, R.A. Research progress on leaching technology and theory of weathered crust elution-deposited rare earth ore. Hydrometallurgy 2020, 193, 105295. [Google Scholar] [CrossRef]
- Moldoveanu, G.A.; Papangelakis, V.G. An overview of rare-earth recovery by ion-exchange leaching from ion-adsorption clays of various origins. Miner. Mag. 2016, 80, 63–76. [Google Scholar] [CrossRef] [Green Version]
- Huang, X.W.; Long, Z.Q.; Li, H.W.; Ying, W.J.; Zhang, G.C.; Xue, X.X. Development of rare earth hydrometallurgy technology in China. J. Rare Earths 2005, 23, 1–4. [Google Scholar] [CrossRef]
- Moldoveanu, G.A.; Papangelakis, V.G. Recovery of rare earth elements adsorbed on clay minerals: I. Desorption mechanism. Hydrometallurgy 2012, 117, 71–78. [Google Scholar] [CrossRef]
- Yan, H.S.; Liang, T.M.; Liu, Q.S.; Qiu, T.S.; Ai, G.H. Compound leaching behavior and regularity of ionic rare earth ore. Powder Technol. 2018, 333, 106–114. [Google Scholar] [CrossRef]
- Hu, J.; Shen, Y.; Wang, X. The effect of ionic strength and pH conditions on the release, deposition and dispersibility behaviors of natural soil colloid. Ecol. Environ. Sci. 2009, 18, 629–637. [Google Scholar]
- Tian, J.; Tang, X.K.; Yin, J.Q.; Chen, J.; Luo, X.P.; Rao, G.H. Enhanced leachability of a lean weathered crust elution-deposited rare-earth ore: Effects of Sesbania gum filter-aid reagent. Metall. Mater Trans. B 2013, 44, 1070–1077. [Google Scholar] [CrossRef]
- Zhang, Z.Y.; Xu, Z.G.; Wu, M.; Zhang, T.T.; Li, Q.; Chi, R.A. Study on leaching of rare earth from weathered crust elution-deposited rare earth ore with complex ammonium agents. Nonferrous Metals (Extr. Metall.) 2013, 4, 32–35. [Google Scholar]
- Kyle, J.R.; Ketcham, R.A. Application of high resolution X-ray computed tomography to mineral deposit origin, evaluation, and processing. Ore. Geol. Rev. 2015, 65, 821–839. [Google Scholar] [CrossRef]
- Munkholm, L.J.; Heck, R.J.; Deen, B. Soil pore characteristics assessed from X-ray micro-CT derived images and correlations to soil friability. Geoderma 2012, 181, 22–29. [Google Scholar] [CrossRef]
- Luo, X.P.; Zhang, Y.B.; Zhou, H.P.; He, K.Z.; Zhang, B.Y.; Zhang, D.M.; Xiao, W.J. Pore structure characterization and seepage analysis of ionic rare earth orebodies based on computed tomography images. Int. J. Min. Sci. Technol. 2022, 32, 411–421. [Google Scholar] [CrossRef]
- Kodali, P.; Dhawan, N.; Depci, T.; Lin, C.L.; Miller, J.D. Particle damage and exposure analysis in HPGR crushing of selected copper ores for column leaching. Miner. Eng. 2011, 24, 1478–1487. [Google Scholar] [CrossRef]
- Bezaatpour, J.; Fatehifar, E.; Rasoulzadeh, A. Coarse-grained geological porous media structure modeling using heuristic algorithm and evaluation of porosity, hydraulic conductivity, and pressure drop with experimental results. Environ. Earth Sci. 2021, 80, 1–14. [Google Scholar] [CrossRef]
- Wang, X.J.; Zhuo, Y.L.; Zhao, K.; Zhong, W. Experimental measurements of the permeability characteristics of rare earth ore under the hydro-chemical coupling effect. RSC Adv. 2018, 8, 11652–11660. [Google Scholar] [CrossRef] [PubMed] [Green Version]
- Wang, X.J.; Zhuo, Y.L.; Deng, S.Q.; Li, Y.X.; Zhong, W.; Zhao, K. Experimental research on the impact of ion exchange and infiltration on the microstructure of rare earth orebody. Adv. Mater Sci. Eng. 2017, 2017, 1–8. [Google Scholar] [CrossRef] [Green Version]
- Zhao, K.; Zhuo, Y.L.; Wang, X.J.; Zhong, W. Aggregate evolution mechanism during ion-adsorption rare earth ore leaching. Adv. Mater Sci. Eng. 2018, 2018, 1–10. [Google Scholar] [CrossRef] [Green Version]
- Caron, J.; Espindola, C.R.; Angers, D.A. Soil structural stability during rapid wetting: Influence of land use on some aggregate properties. Soil Sci. Soc. Am. J. 1996, 60, 901–908. [Google Scholar] [CrossRef]
- Curtin, D.; Steppuhn, H.; Selles, F. Effects of magnesium on cation selectivity and structural stability of sodic soils. Soil Sci. Soc. Am. J. 1994, 58, 730–737. [Google Scholar] [CrossRef]
- Baumann, T.; Toops, L.; Niessner, R. Colloid dispersion on the pore scale. Water Res. 2010, 44, 1246–1254. [Google Scholar] [CrossRef]
- Olphen, V.H. An introduction to clay colloid chemistry. Soil Sci. 1964, 97, 290. [Google Scholar] [CrossRef]
- Helmholtz, H. Über einige Gesetze der Vertheilung elektrischer Ströme in Körperlichen Leitern, mit Anwendung auf die thierischelektrischen Versuche. Ann. Phys. 1853, 165, 211. [Google Scholar] [CrossRef] [Green Version]
- Gouy, M. Sur la constitution de la charge électrique à la surface d'un électrolyte. J. Phys. Theor. Appl. 1910, 9, 457–468. [Google Scholar] [CrossRef] [Green Version]
- Zheng, W.B.; Hu, X.L.; Tannant, D.D.; Zhou, B. Quantifying the influence of grain morphology on sand hydraulic conductivity: A detailed pore-scale study. Comput. Geotech. 2021, 135, 104147. [Google Scholar] [CrossRef]
- Shi, L.; Rao, Y.Z.; Wang, D.; Zhang, M.D.; Huang, T. A Capillary Model for Predicting Saturated Hydraulic Conductivity of Ion-Adsorption Rare Earth Ore Based on Improved Kozeny–Carman Equation. Geofluids 2022, 2022, 1–10. [Google Scholar] [CrossRef]
- Liu, Y.; Li, Z.; Guo, L.; Kang, W.; Zhou, Y. Pore characteristics of soft soil under triaxial shearing measured with NMR. Chin. J. Rock Mech. Eng. 2018, 37, 1924–1932. [Google Scholar]
- Bissonnais, Y.L. Aggregate stability and assessment of soil crustability and erodibility: I. Theory and methodology. Eur. J. Soil Sci. 1996, 47, 425–437. [Google Scholar] [CrossRef]
- Hu, F.N.; Xu, C.Y.; Li, H.; Li, S.; Yu, Z.H.; Li, Y.; He, X.H. Particles interaction forces and their effects on soil aggregates breakdown. Soil Tillage Res. 2015, 147, 1–9. [Google Scholar] [CrossRef]
- Hu, Y. Surface zeta potential and surface absorption—A theoretical explanation of the rule of coagulation. Chin. J. Struct. Chem. 1992, 11, 447–452. [Google Scholar]


| Particle Diameter (mm) | >5 | 2.5–5 | 1–2.5 | 0.5–1 | 0.075–0.5 | <0.075 |
|---|---|---|---|---|---|---|
| Percentage of interval (%) | 12.8 | 28.9 | 7.3 | 8.4 | 28.7 | 13.9 |
| percentage (%) | 12.8 | 41.7 | 49.0 | 57.4 | 86.1 | 100 |
Disclaimer/Publisher’s Note: The statements, opinions and data contained in all publications are solely those of the individual author(s) and contributor(s) and not of MDPI and/or the editor(s). MDPI and/or the editor(s) disclaim responsibility for any injury to people or property resulting from any ideas, methods, instructions or products referred to in the content. |
© 2023 by the authors. Licensee MDPI, Basel, Switzerland. This article is an open access article distributed under the terms and conditions of the Creative Commons Attribution (CC BY) license (https://creativecommons.org/licenses/by/4.0/).
Share and Cite
Gao, Z.; Rao, Y.; Shi, L.; Xiang, R.; Yang, Z. Effect of Magnesium Sulfate Solution on Pore Structure of Ionic Rare Earth Ore during Leaching Process. Minerals 2023, 13, 294. https://doi.org/10.3390/min13020294
Gao Z, Rao Y, Shi L, Xiang R, Yang Z. Effect of Magnesium Sulfate Solution on Pore Structure of Ionic Rare Earth Ore during Leaching Process. Minerals. 2023; 13(2):294. https://doi.org/10.3390/min13020294
Chicago/Turabian StyleGao, Zhongquan, Yunzhang Rao, Liang Shi, Run Xiang, and Zhihua Yang. 2023. "Effect of Magnesium Sulfate Solution on Pore Structure of Ionic Rare Earth Ore during Leaching Process" Minerals 13, no. 2: 294. https://doi.org/10.3390/min13020294