Article

An Early Warning System for Landslide Risks in Ion-Adsorption Rare Earth Mines: Based on Real-Time Monitoring of Water Level Changes in Slopes

1
School of Resources and Environmental Engineering, Jiangxi University of Science and Technology, Ganzhou 341000, China
2
School of Civil and Surveying & Mapping Engineering, Jiangxi University of Science and Technology, Ganzhou 341000, China
*
Author to whom correspondence should be addressed.
Minerals 2023, 13(2), 265; https://doi.org/10.3390/min13020265
Submission received: 15 December 2022 / Revised: 28 January 2023 / Accepted: 7 February 2023 / Published: 14 February 2023
(This article belongs to the Special Issue Recent Developments on the Leaching Process of Rare Earth Ore)

Abstract

:
During the in situ leaching process of ion-adsorption rare earths, leaching solution needs to be constantly injected to the mine slopes. As a consequence, landslides are highly likely to occur due to the increasing water level of soil mass. To solve this problem, we conducted a mechanical analysis on the rising water level after solution injection, which shed light on the mechanical principle of slope instability brought about by rising water level. With water level variation as the major factor, we established an early warning system for landslide risks on the basis of the real-time monitoring of water level. Within the system, a self-designed landslide early warning model is embedded. In addition to monitoring the water level variation in slopes, this system can be employed for real-time data processing. With the integration of early warning model algorithm, the real-time graded early warning of slope landslide risks is achieved within the mining process of ion-adsorption rare earths. By discussing the real-time monitoring method, framework of landslide early warning system, FIFC landslide early warning model, optimization method of water level, and selection of landslide-inducing factors, this research provides an effective solution to the landslide early warning within the mining process of ion-adsorption rare earth minerals. Thus, it can be employed as a favorable reference for other types of early warning systems.

1. Introduction

Landslides are one of the costliest and deadliest natural phenomena in the in situ leaching of ion-adsorption rare earths. One of the solutions is to establish a landslide early warning system for safety production. However, the design and implementation of an effective landslide early warning system is rather complicated due to the heterogeneous soil mass and diverse landslide triggering factors.
Currently, the most commonly used approach in this regard is the integration of early warning and real-time monitoring. According to the previous research [1,2,3], deformation parameters, for instance, field displacement, are applied as early warning indication for slope landslides. Nonetheless, there exists an inherent defect in this approach, i.e., it is too late to sound an alarm in case of a displacement change. Regarding rainfall to be the main factor inducing landslides, many researchers [4,5,6,7] tried to associate rainfall amount and type with landslide early warning. Wang and Luo [8] pointed out that the deformation of ion-adsorption rare earth slope lagged behind solution injection. This is actually the case: leaching solution is injected into the slope for the end of extracting ion-adsorption rare earths in the process of in situ leaching; in the meantime, the accumulation of solution in the ore body gradually changes the mechanical properties of soil mass, which ultimately leads to landslides [9]. This paper establishes a landslide early warning system, which shows the variation in water level by real-time monitoring. Together with the early warning model on water level, this system is capable of sounding an alarm in case of landslides.

2. Effects of Water on Slope Stability

In recent years, many studies on landslide seepage fields, deformation mechanisms, and stability coefficients have been performed [10,11,12,13]. The various factors affecting slope stability include water, slope height and angle, as well as the properties of soil mass. Among these factors, the effect of water, being the largest variable for slope landslide, is the most obvious [14]. In fact, “water” referred to in this paper is actually the leaching solution. In comparison with the landslides of non-RE slopes, highway slopes, and natural slope, the landslide of RE slope has its own features. That is, a large amount of solution gradually accumulates in the slope with the progress of solution injection. It is therefore of great importance to analyze the resulting impacts.

2.1. Basic Hypothesis

During the in situ leaching process, the slope below water level is assumed to be in a saturated state, and the slope above water level to be in the initial state, then the variation in water level during the in situ leaching of rare earth ore can be described with the following model (Figure 1).
Figure 1a indicates the circumstance before solution injection (the height of the infiltration line is 0). Figure 1b shows the situation in the wake of a slowly rising water level (H2).
γ is the natural density of rare earths, γ s a t is the bulk density of saturated soil below the saturation line, H1 is the thickness of soil layer above infiltration line, H2 is the thickness of soil layer below infiltration line.

2.2. Mechanical Analysis of Rising Water Level in the Wake of Solution Injection

The ion-adsorption rare earths in southern Jiangxi are predominantly sandy soils, which contain approximately 20% clay [15]. A long-term engineering practice and tremendous amount of testing results reveal that the principle of effective stress is applicable and effective to both the saturated sand and clay [16]. Thus, the principle [17] can be used for mechanical analysis of rare earth slopes before and after solution injection.
First, we deduced the following equation in accordance with the bulk densities of soil layer and leaching solution:
γ s a t = γ + e γ w
e is the natural porosity of rare earths.
The effective stress of the bottom soil layer is equal to the sum of total stress of soil and pore water pressure (a negative figure):
σ s = σ u
The effective stress at the bottom layer before solution injection is equal to the total stress:
σ = σ = γ H 1 + γ H 2
The total stress at the bottom after solution injection is:
σ = γ H 1 + γ s a t H 2
The water pressure of bottom pore after solution injection is:
u = γ W H 2
On the basis of Equations (1)–(5), we worked out the effective stress of bottom soil layer in the wake of rising infiltration line:
σ s = γ ( H 1 + H 2 ) + ( e 1 ) γ w H 2
According to the above formula, we know that σ s σ . That said, during the in situ leaching process of rare earth ore, the water level inside the slope rises with the injection of leaching solution. As a result, the effective stress of soil gradually decreases. In accordance with the Terzaghi effective stress principle, effective stress mainly refers to the pressure between soil particles. The reducing pressure brings about a smaller friction between soil particles, which in turn causes a decrease in shear strength of soil mass. In addition, the softening of soil after soaking in leaching solution also reduces the shear strength of soil mass, which is demonstrated in changes in cohesion and internal friction angles.

3. Establishment Approaches for Landslide Early Warning System

3.1. Design of Landslide Early Warning System

The design, implementation, and operation of a feasible real-time landslide early warning is a complex systems engineering [18]. First, an operative landslide early warning model is the key to the effectiveness of landslide early warning system. Second, real-time data of rare earth slopes is to be transmitted to the database through certain technical means. Third, we need to calculate and analyze the collected data in real time before feeding it back to the database. Fourth, the processed data are read and re-calculated with the landslide early warning model. Fifth, the early warning information is delivered. In addition to the above-mentioned five steps, some groundwork needs to be laid. These include: on-the-spot investigation, which aims to determine the layout of on-site monitoring points; determination of landslide-inducing factors, for the purpose of simplifying early warning model; numerical simulation, which provides basic data for the establishment of landslide early warning model. Figure 2 shows the operation flow chart of landslide warning system on the basis of the real-time monitoring of water level.

3.2. FIFC Landslide Early Warning Model

What follows is a brief introduction of failure index fragility curve. On the basis of the fragility curve theory, it is an improved version of the fragility curve. First proposed by the United Nations ISDR, the concept of vulnerability [19] attributes disaster losses to hazard factors, exposure, and vulnerability. With the first application to the assessment of flood disasters, the vulnerability curve was then introduced to the evaluation of geological hazards, for example, earthquakes, typhoons, mud-rock flow, and landslides, among others [20,21,22]. As a measurement to the extent of damage to the hazard-affected body, vulnerability, as the key to disaster damage estimation and risk assessment, functions as a link between disaster-causing factors and hazard. Expressed with the relationship curve or equation between disaster (h) and damage (d), i.e., V = f (h, d), it is alternatively known as vulnerability curve or damage/loss curve. It is employed to measure the correlation between the intensity of different disasters and their corresponding losses (rates) [23].
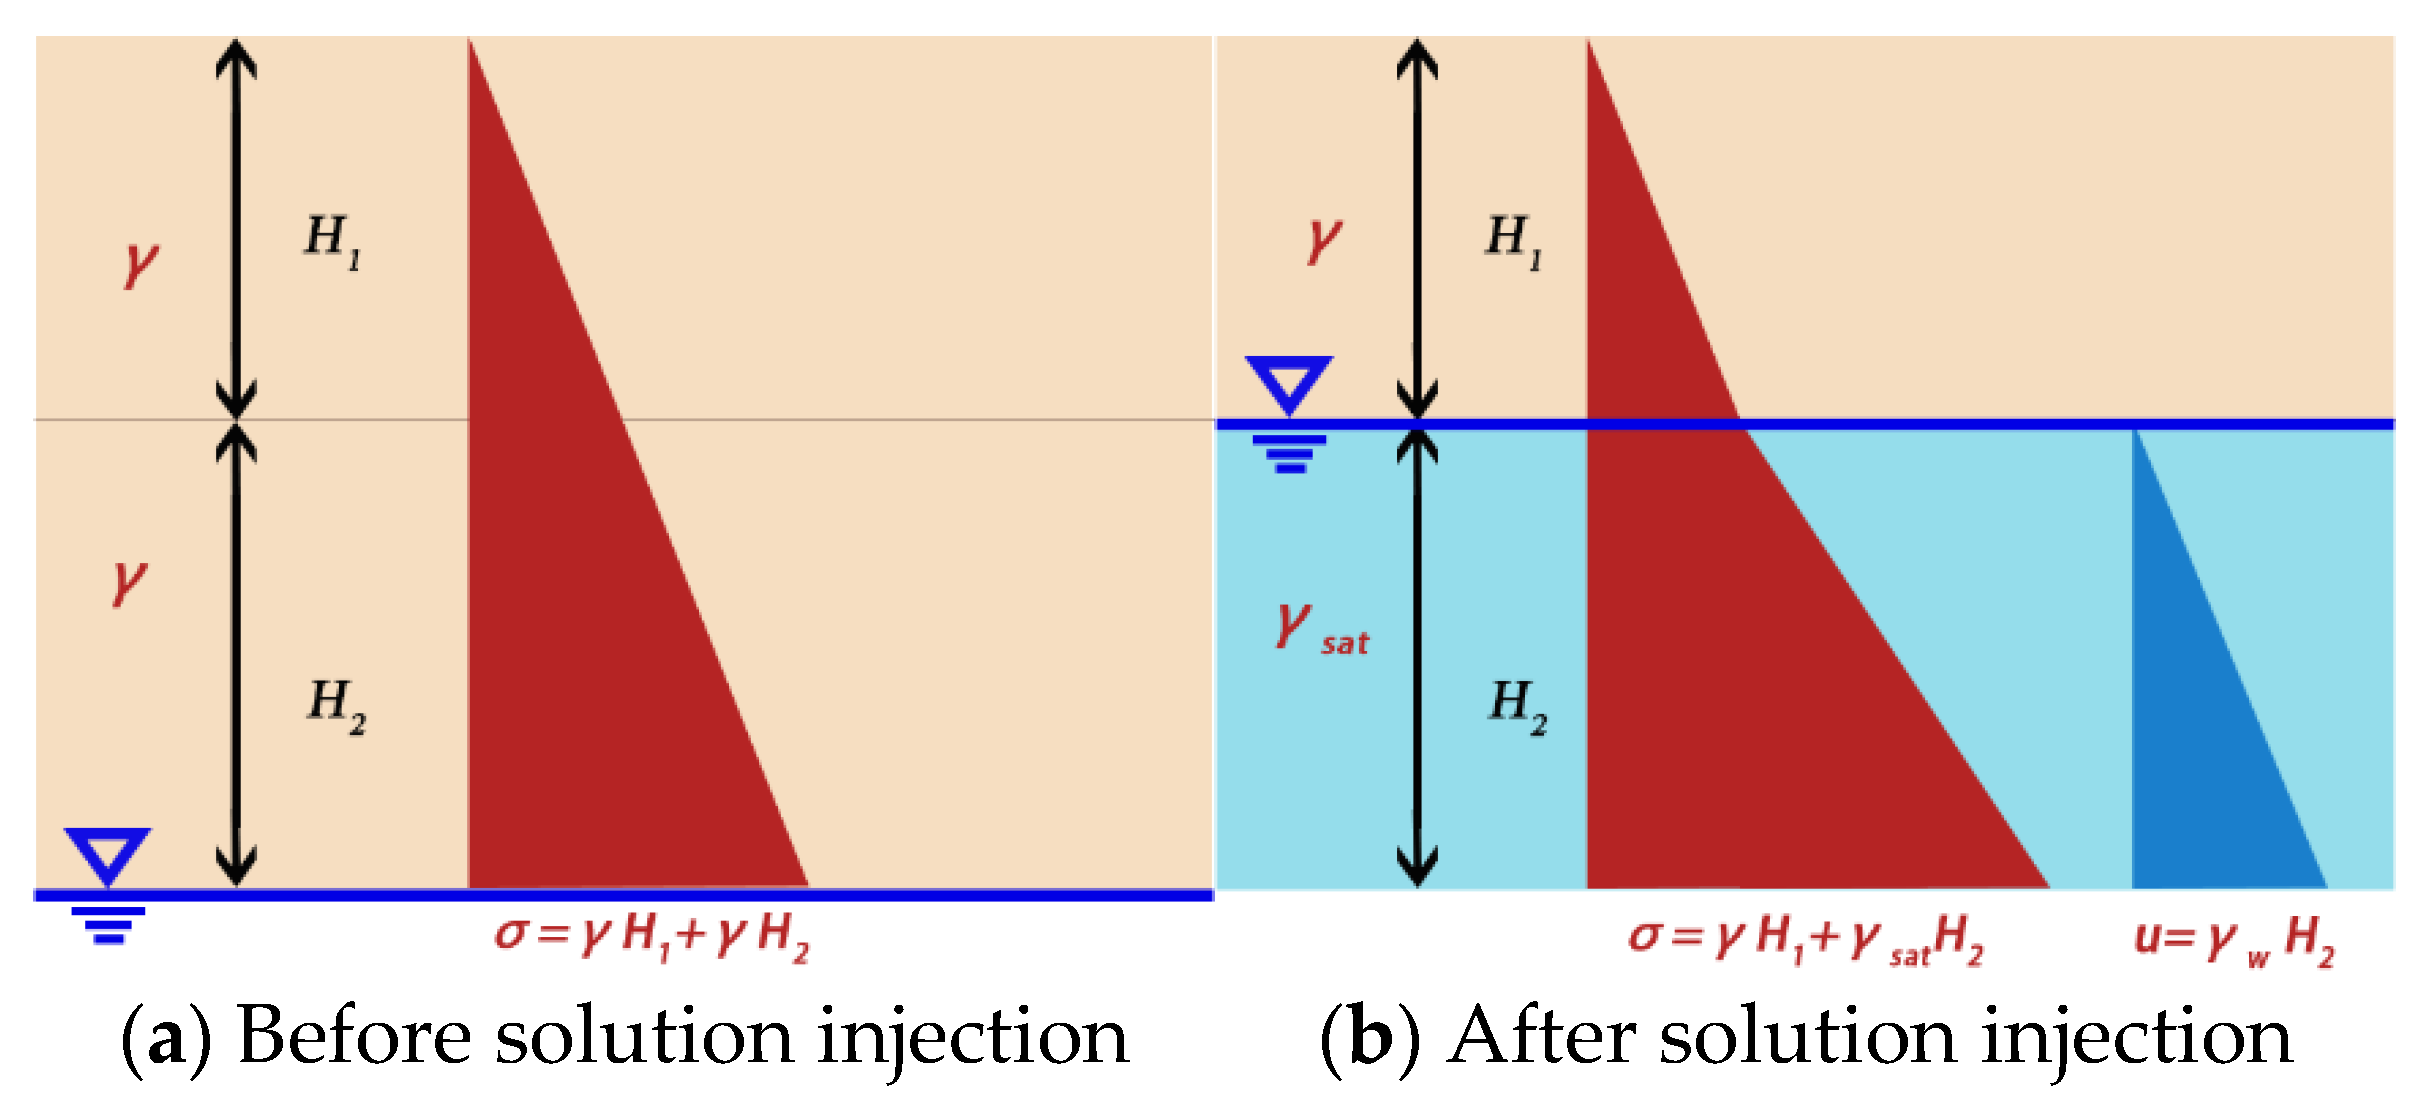
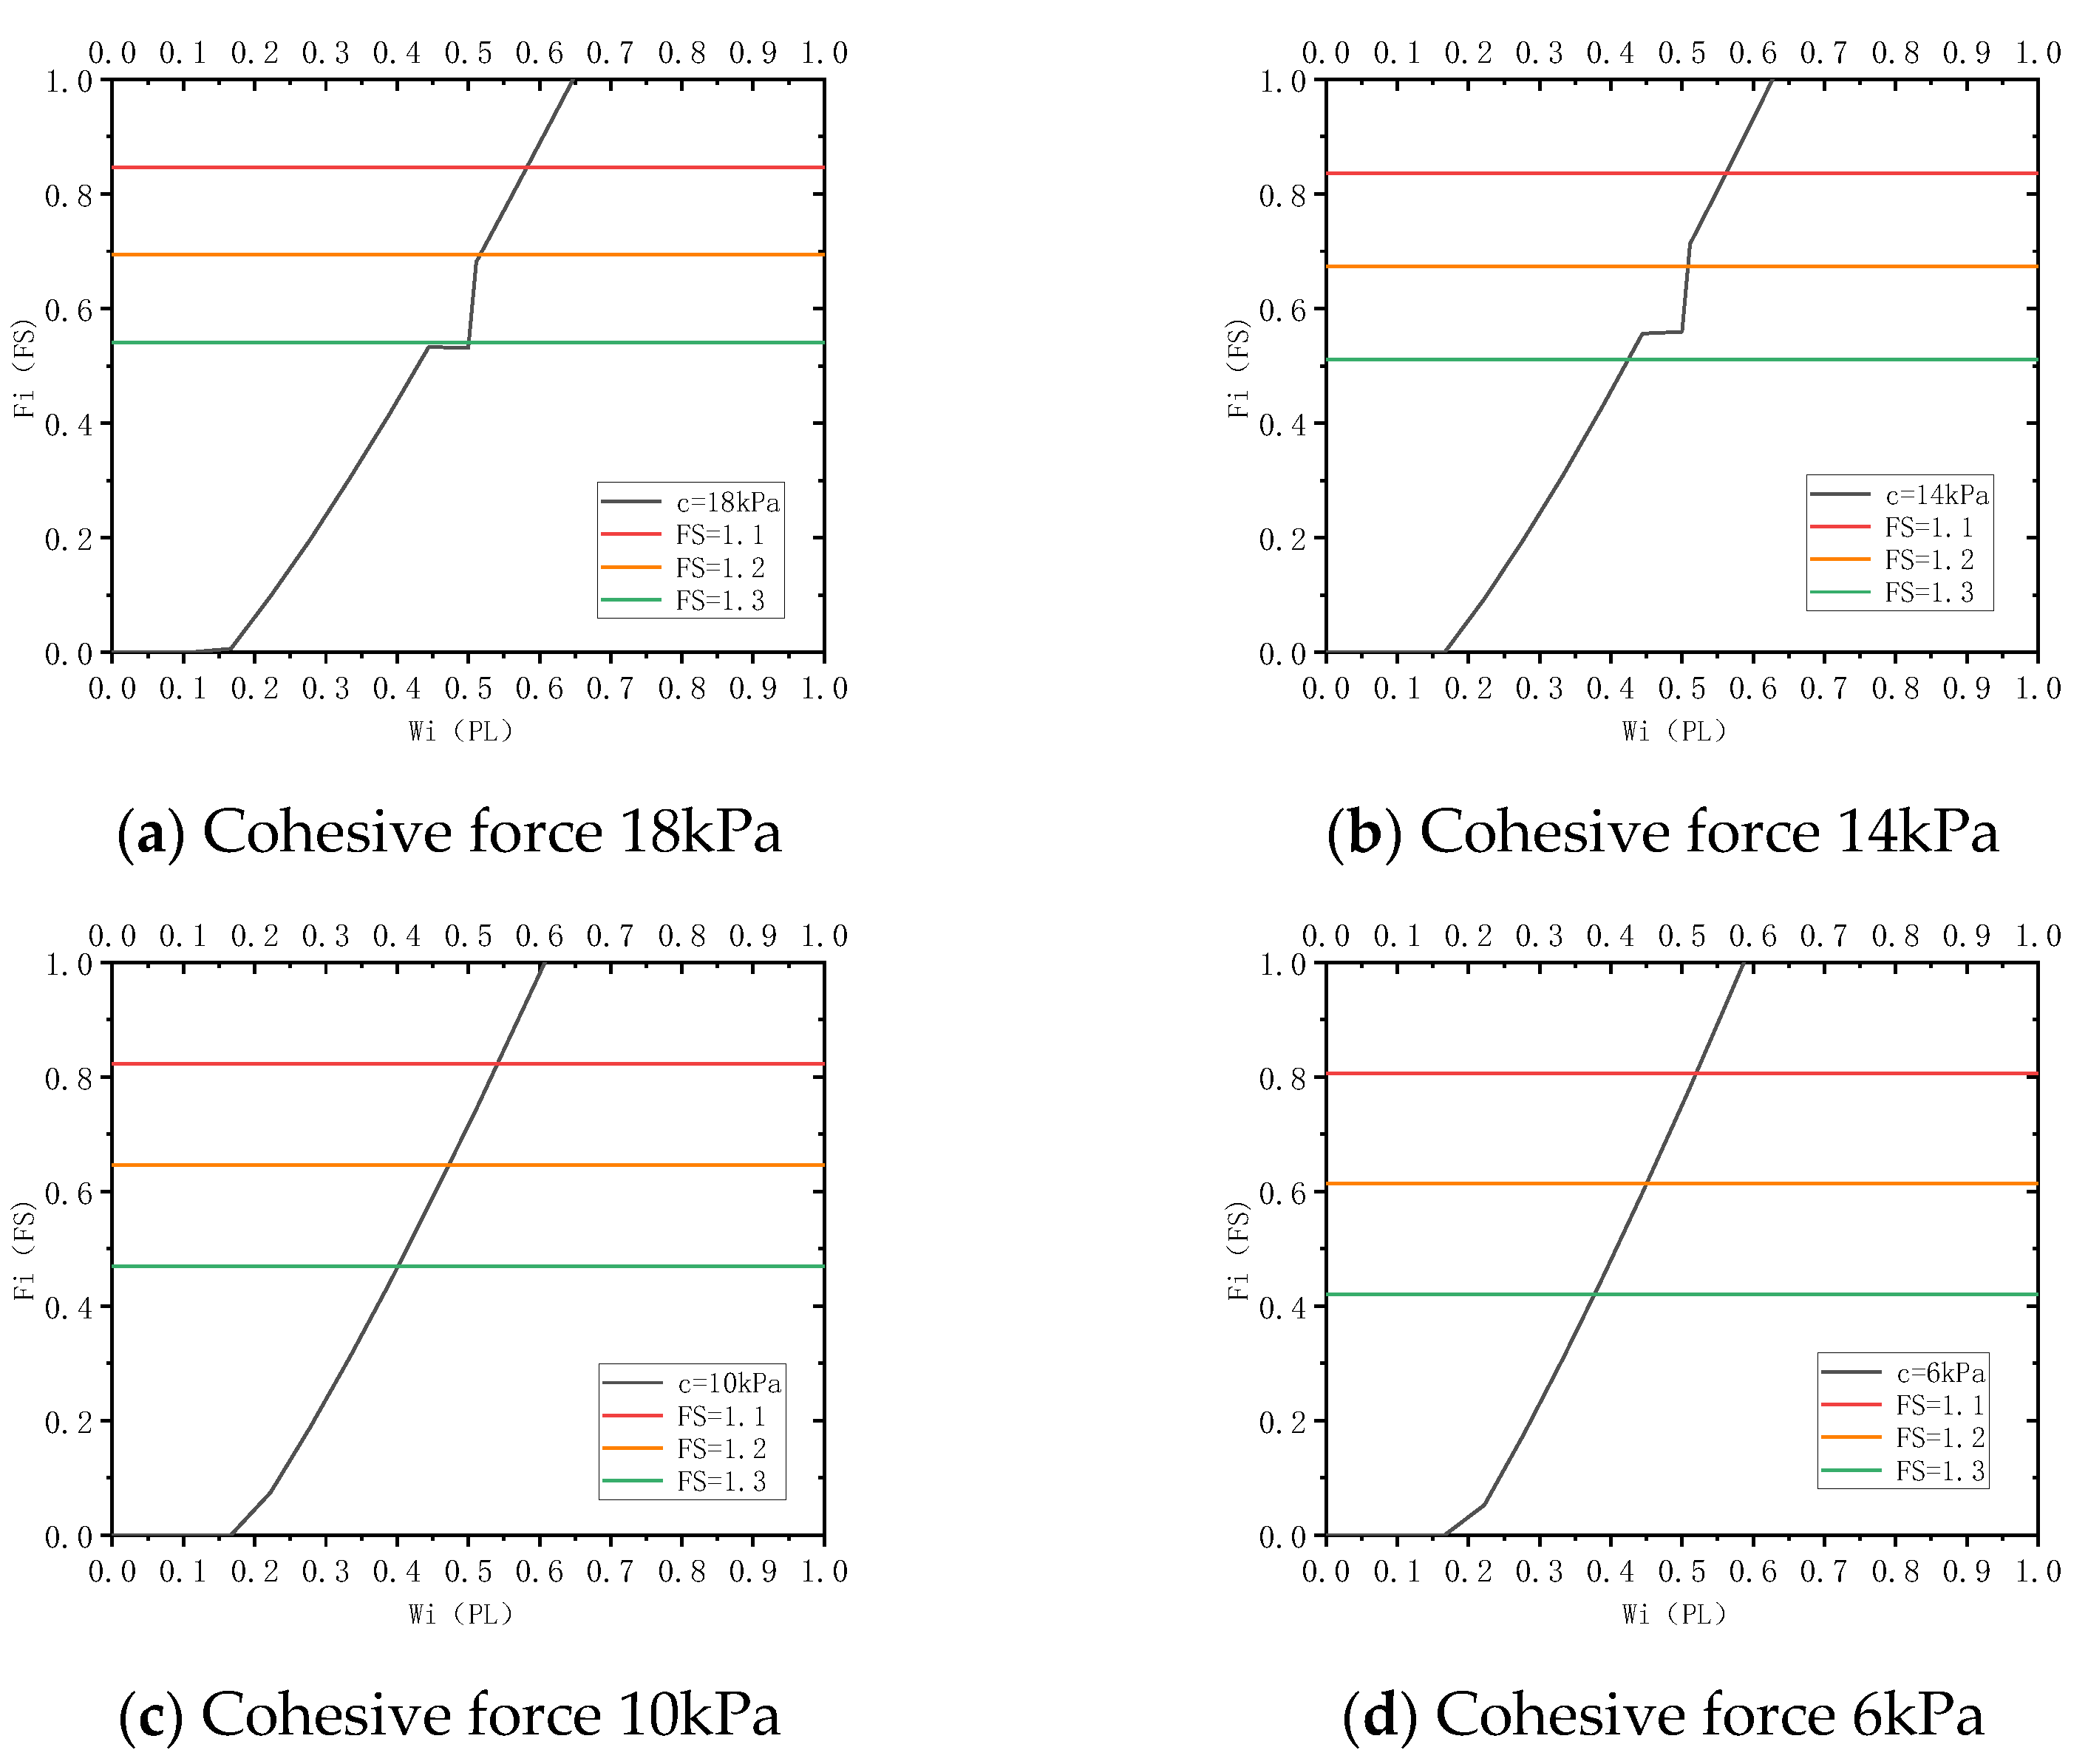
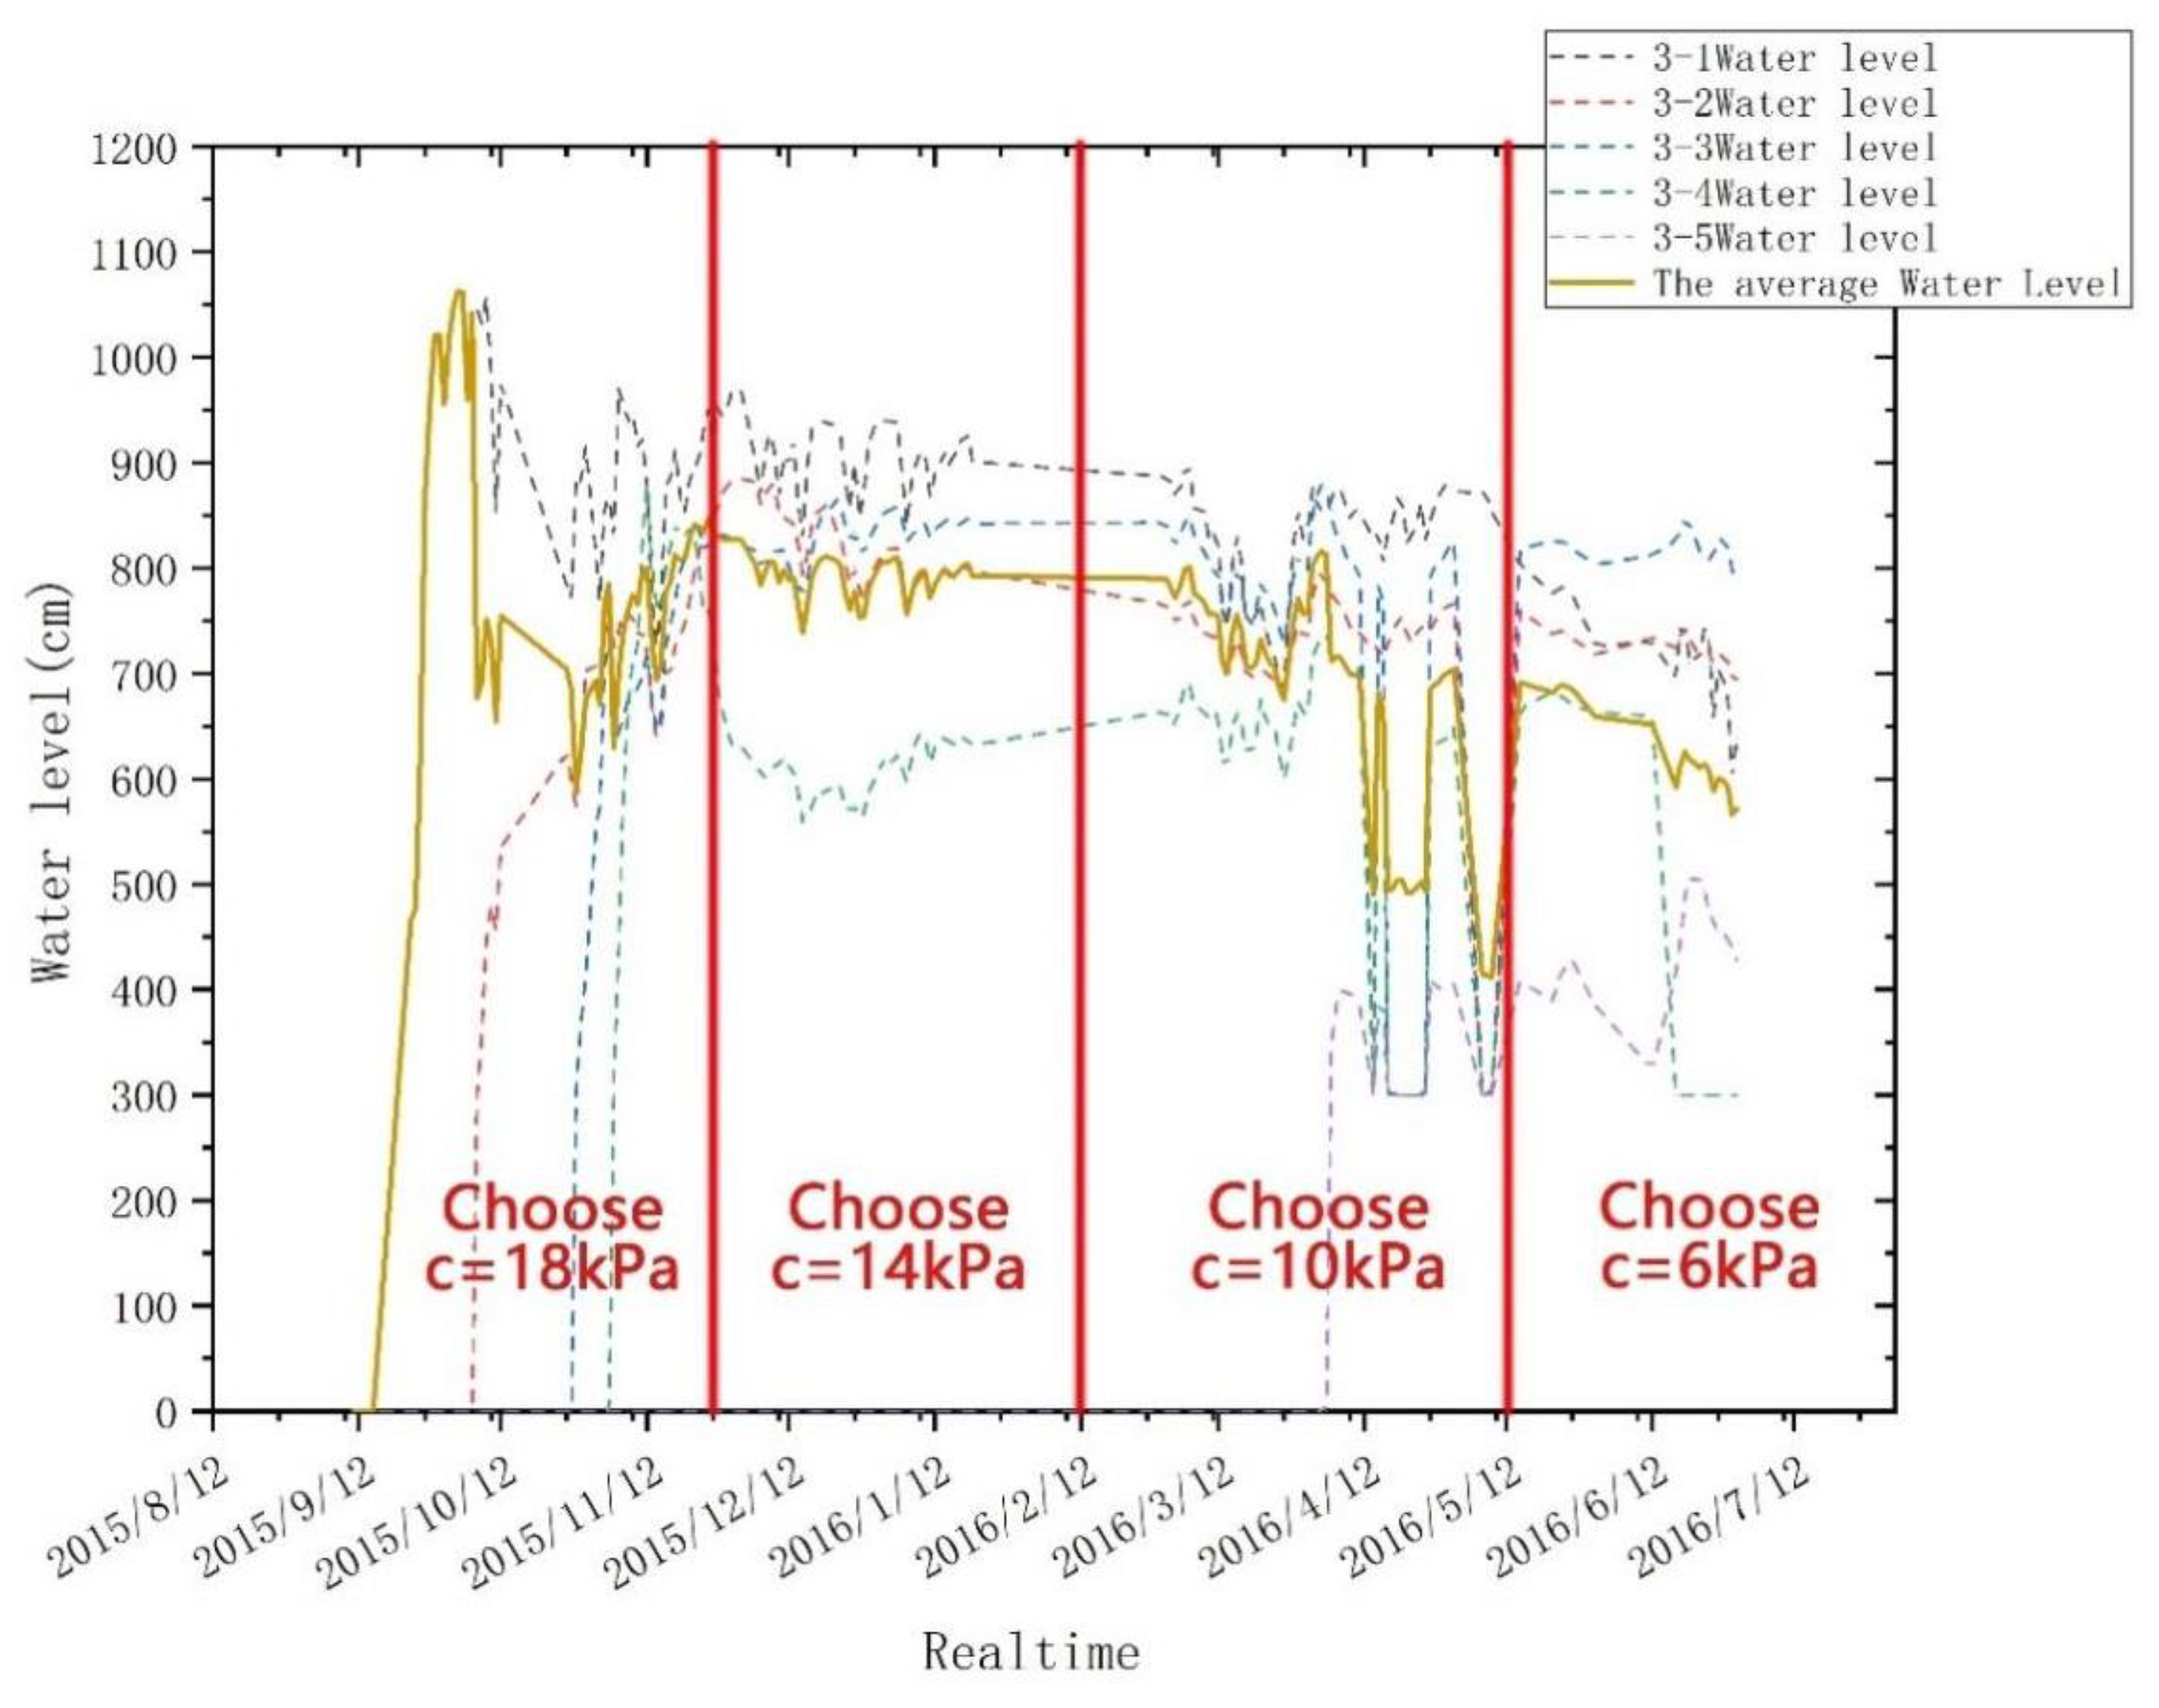
In the landslide early warning model for ion-adsorption rare earth slopes, the safety factor value represents the degree of potential disasters; the water level height is employed to represent the main disaster-causing factors. Some other elements, for instance, slope height, slope angle, cohesion, and internal friction angle, should also be taken into consideration. The correlation among these factors can be described with Equation (7). Before drawing the failure index vulnerability curve, we need to standardize the values of safety factors and water level heights (0–1). W i and F i stand for water level index and safety factor index after standardization. Equations (8) and (9) show the conversion process. The changing water levels under different working conditions, including slope height, toe of side slope, cohesion, and internal friction angle, lead to the variation in slope safety factor. The scenario of these variations is numerically simulated. The failure index vulnerability curve is drawn on the basis of the collected data. 
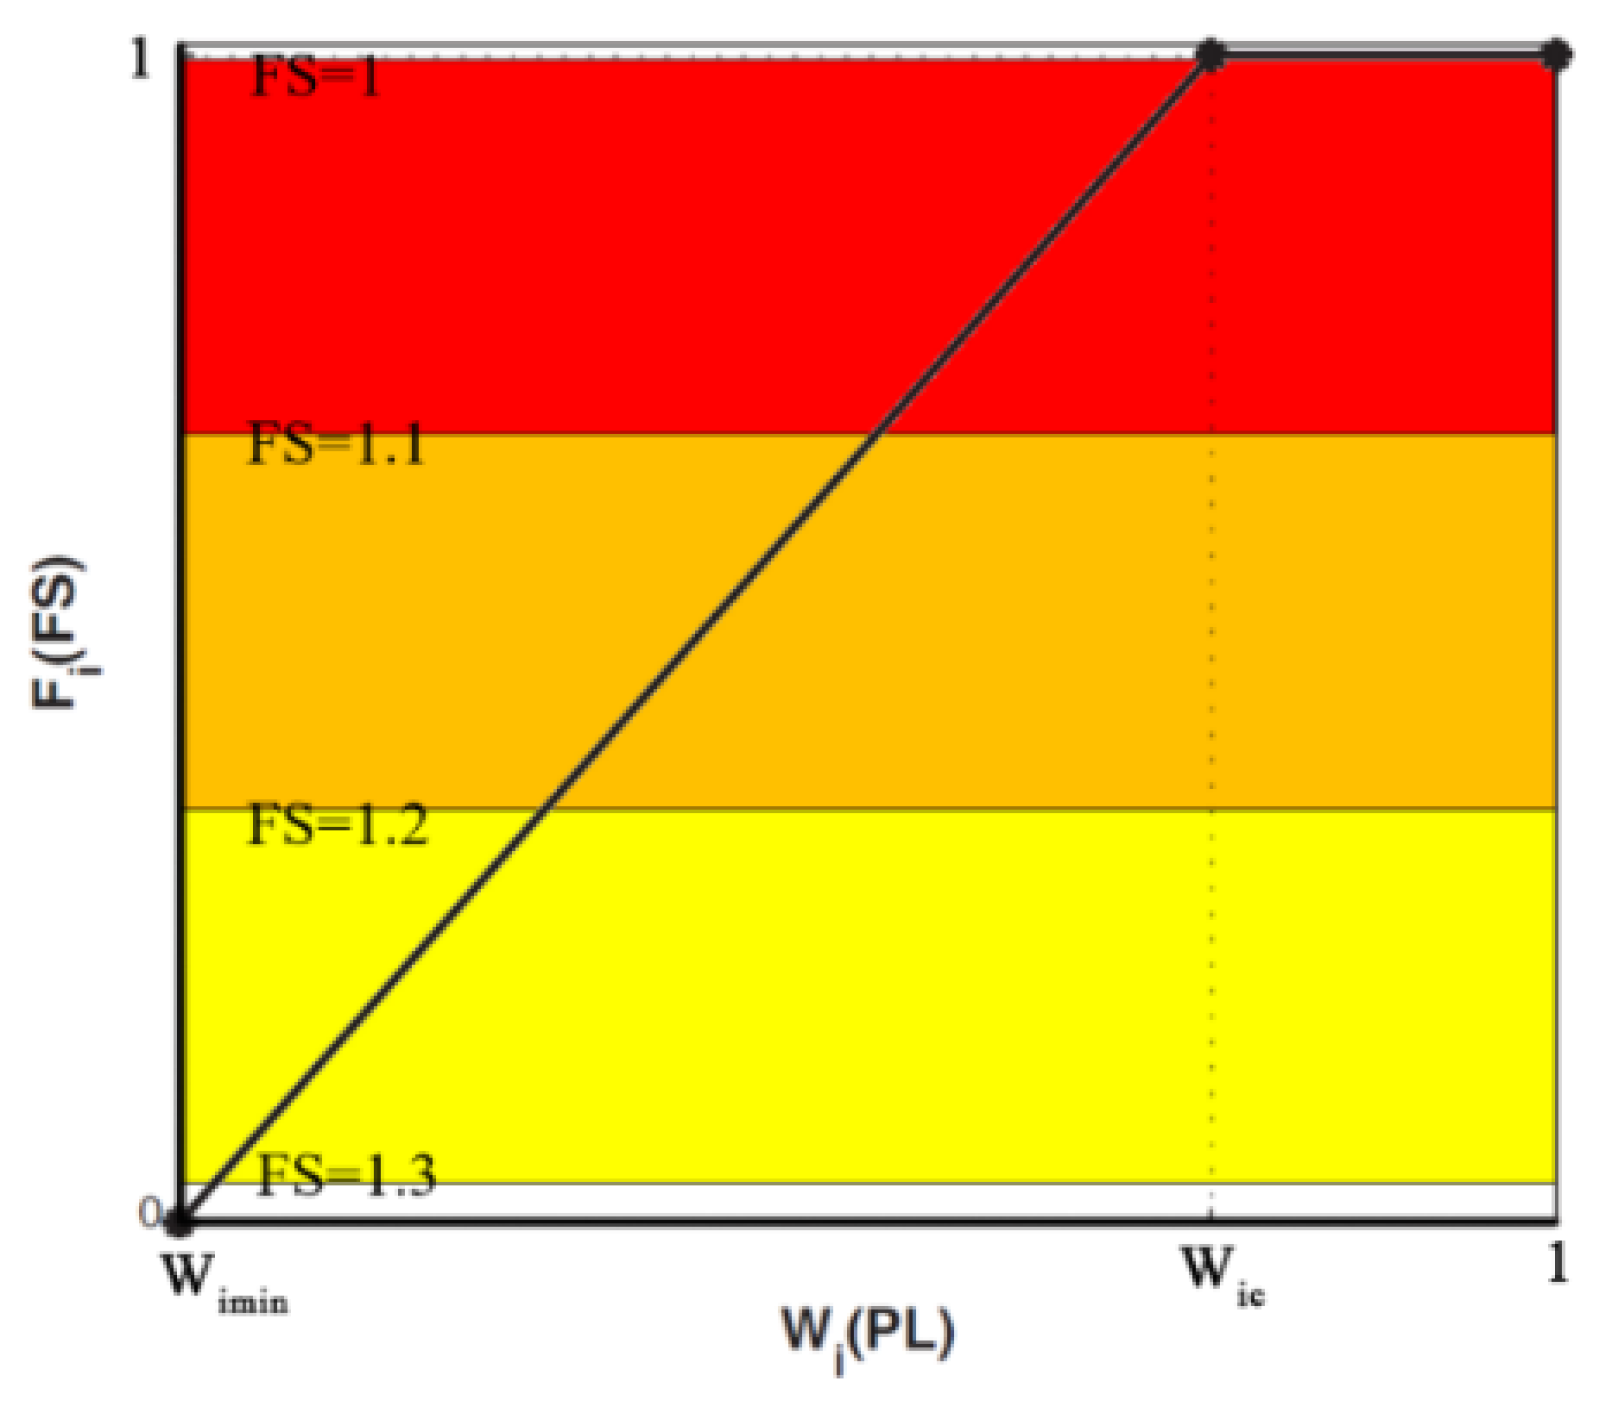
Figure 3 is a schematic diagram of the vulnerability curve under a particular working condition:
V = f ( W i , F i )
W i = { 0 P L max < P L P L / P L max   for   P L F S = 1 P L P L max 1 P L < P L F S = 1
F i = { 0 W i < W i min 1 ( F S 1 ) / ( F S d r y 1 ) for   W i min W i W i c 1 W i c < W i
P L max is the maximum water level line before solution injection ( F S = F S d r y ). P L F S = 1 is the corresponding P L when the slope safety factor F S = 1 . W i c is the critical water level index (the corresponding W i when F S = 1 ). Wimin is the minimum water level index (the corresponding water level index when P L = P L max and F S = F S d r y ).
Figure 3 is the schematic diagram of vulnerability curve under a specific working condition. In accordance with the actual circumstances of rare earth mines, similar vulnerability curves can be established in this way. In practical applications, we can calculate the corresponding water level index ( W i ) with the set formula by reading the slope water level. The matching safety factor index ( F i ) defines the corresponding early warning risk. These operations are achieved by the embedded programs in the landslide early warning system.

3.3. Optimization of Water Level Line

The in situ leaching technology realizes the leaching of ion-adsorption rare earths by continuously injecting solution into the slope. The research of Guo and Zhao [24] shows that the failure of slope often coincides with intense solution injection. Thus, monitoring the change of water level during the in situ leaching process is a feasible method for the early warning of landslide risks.
Figure 4 is the water level data previously collected in a rare earth mine in southern Jiangxi. In the in situ leaching of rare earth ore, the water levels measured at different points on the same line (the bedrock of 0 m) increases at first, then decreases, before stabilizing at a certain point. The reason for the increasing water level in the first stage of solution injection is: some solution accumulates in a certain area of the ore body without stable seepage in the ore body in that the whole rare earth ore body is still in an unsaturated state (the water level sensor is installed in this area). Upon the formation of a stable seepage inside the ore body, the water level at the monitoring point inside the ore body decreases to a relatively constant value and fluctuates within a small range (under the condition of constant solution injection intensity).
In addition, the water level of each monitoring point demonstrates a similar variation tendency. The height of water level after stabilization is not entirely consistent, which is ascribed to the following reasons: The slight differences in permeability coefficients for the soil mass near each monitoring point; different depths of bedrock at the site. Averaging the water level of each monitoring point on the same survey line at a certain moment, we then get an average water level height. Using this water level height as the PL proxy value, landslide early warning is realized. Figure 5 shows the schematic diagram of waterline optimization.

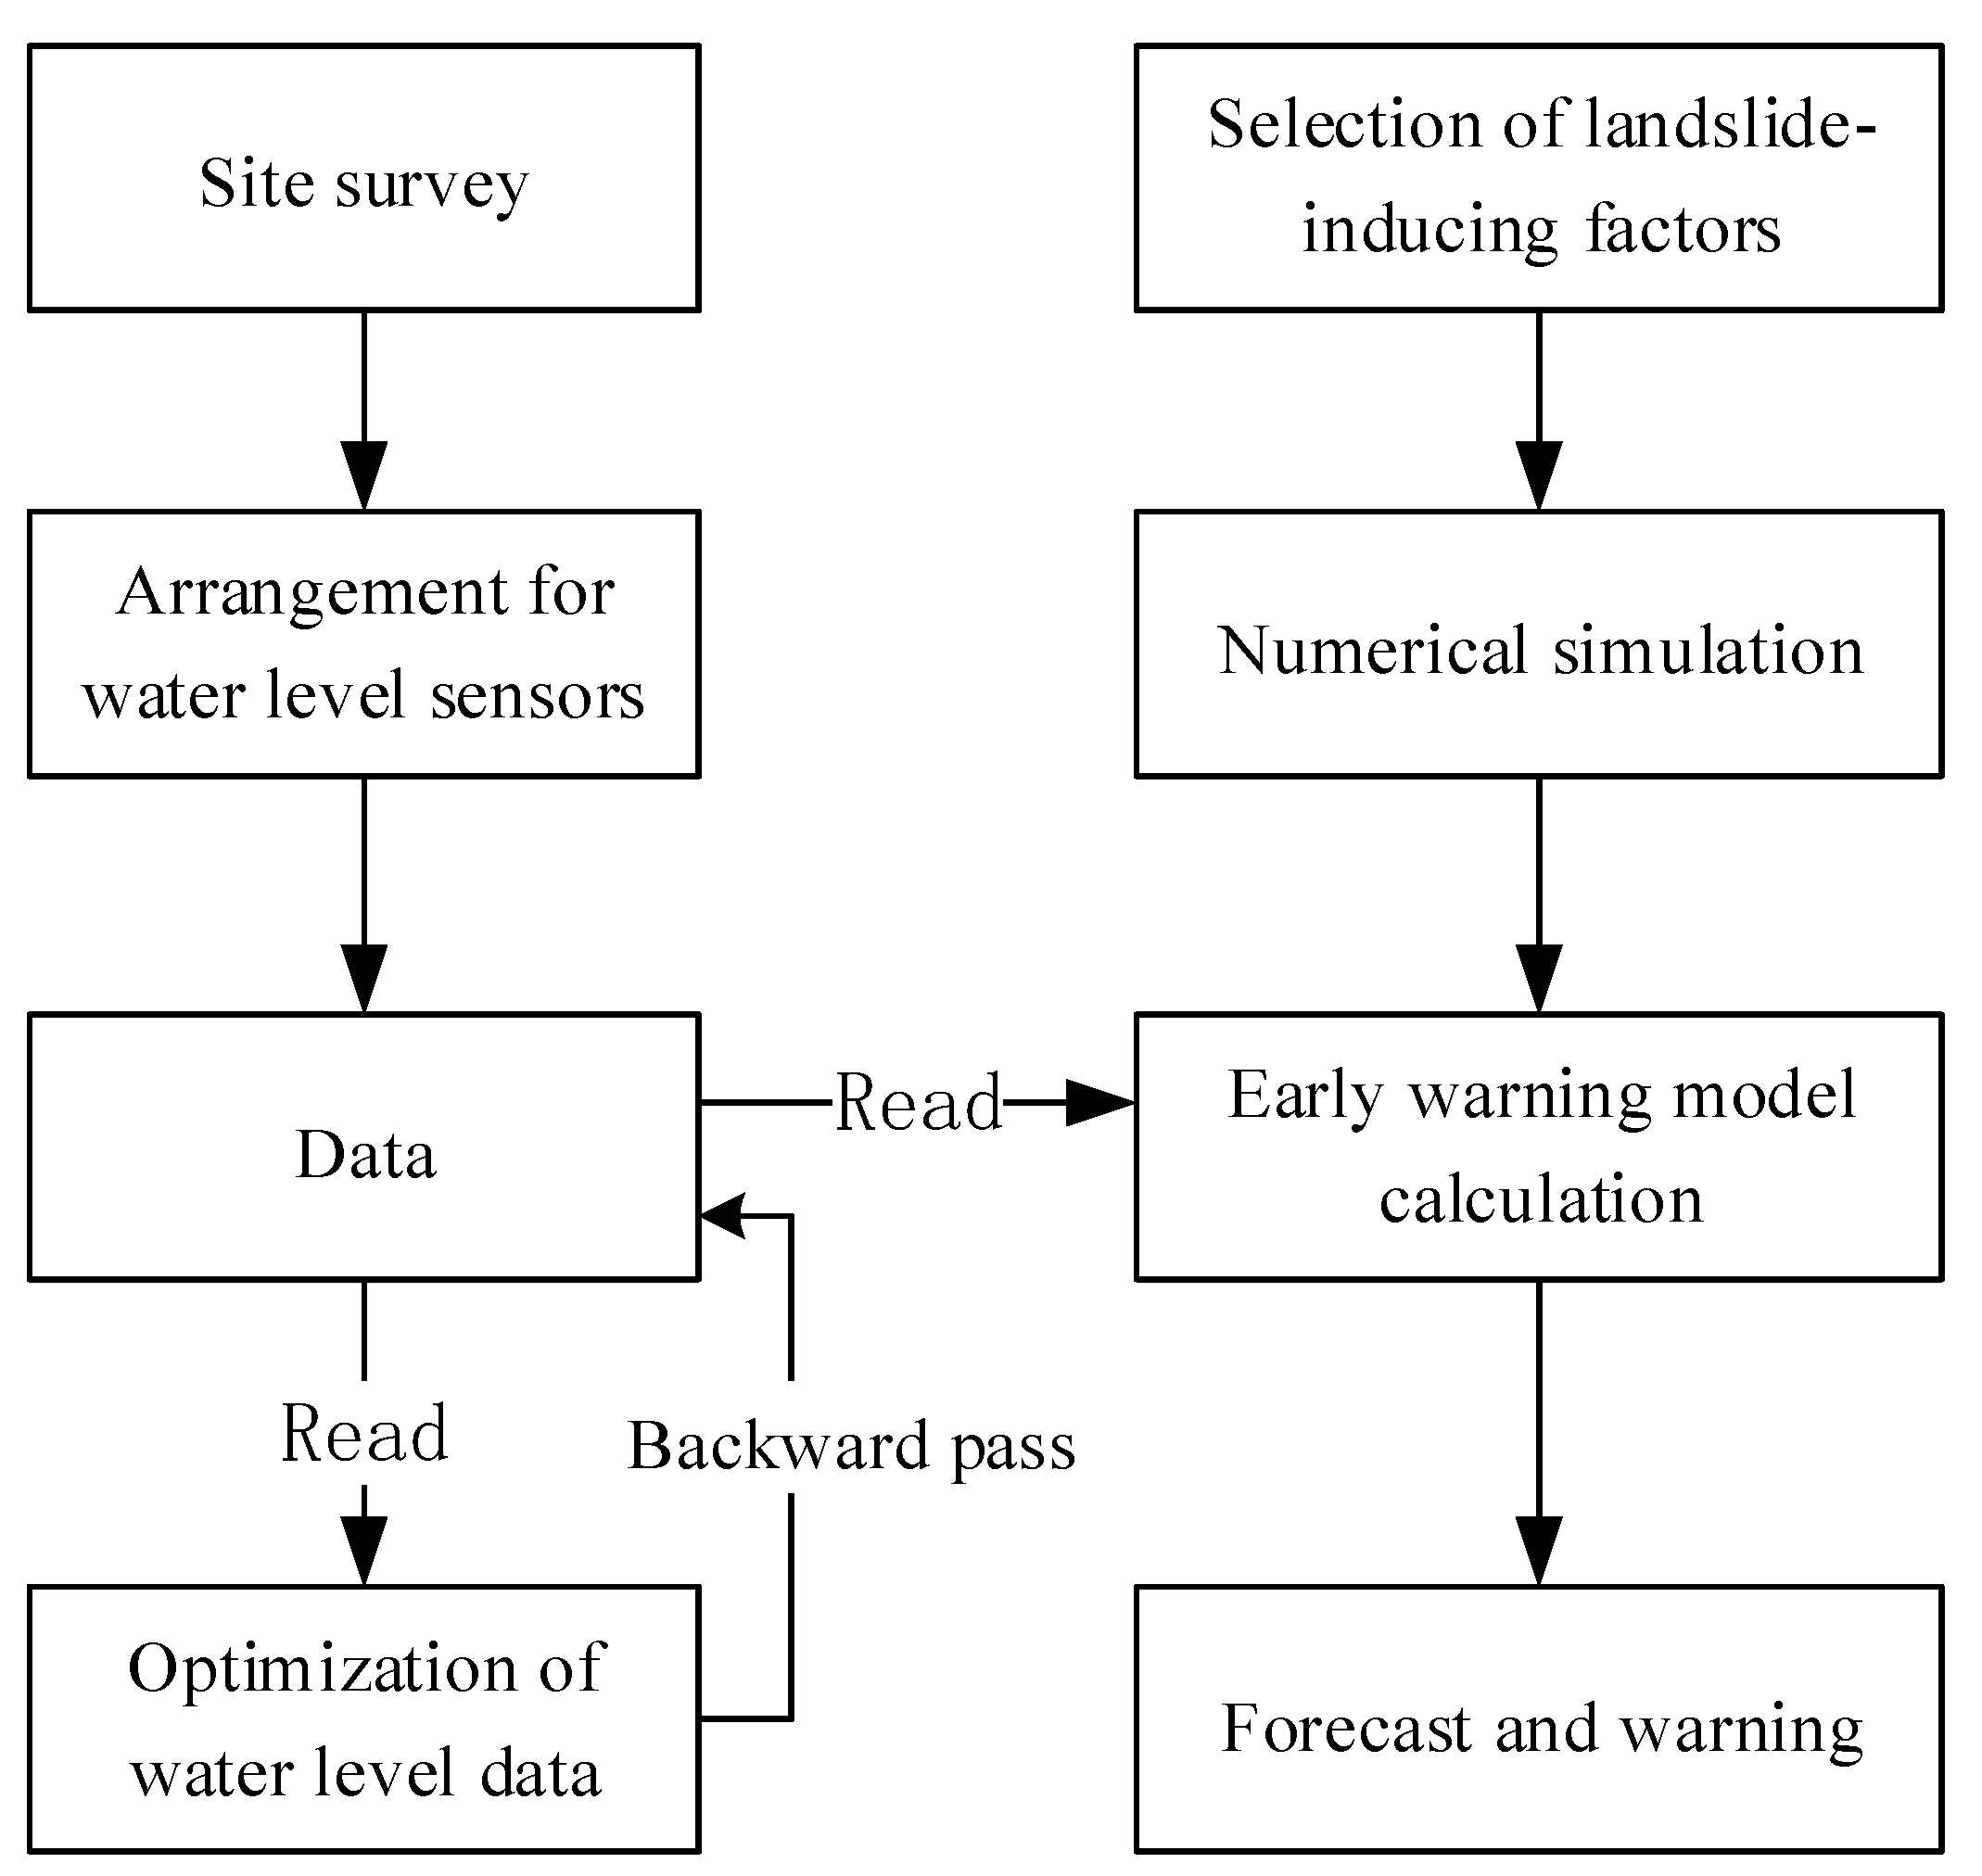
3.4. Selection of Landslide-Induced Factors

As previously mentioned, we take diverse elements into consideration when developing early warning system for landslide risks. These elements include water level, slope height, slope angle, cohesion, and internal friction angle. The altitudes for most ion-adsorption rare earth slopes in South China are lower than 500 m above sea level, with a slope height of 20–50 m and slope angle of 30~50°. The research of Wu Changfu [25] shows that slope height has little effect on slope stability. Therefore, the effect of slope height on its stability can be excluded. In the following, we are going to discuss the effects of slope angle, cohesion, and internal friction angle on the slope stability.
The value ranges for the three factors (slope angle, cohesion, and internal friction angle) were determined on the basis of the actual circumstances of ion-adsorption rare earth slopes in southern China (Table 1). We then conducted comparative tests with these parameters, including: slope angles of 35°, 40°, and 45°; cohesive forces of 4 kPa, 11 kPa, and 18 kPa; internal friction angles of 27°, 29°, and 31°.
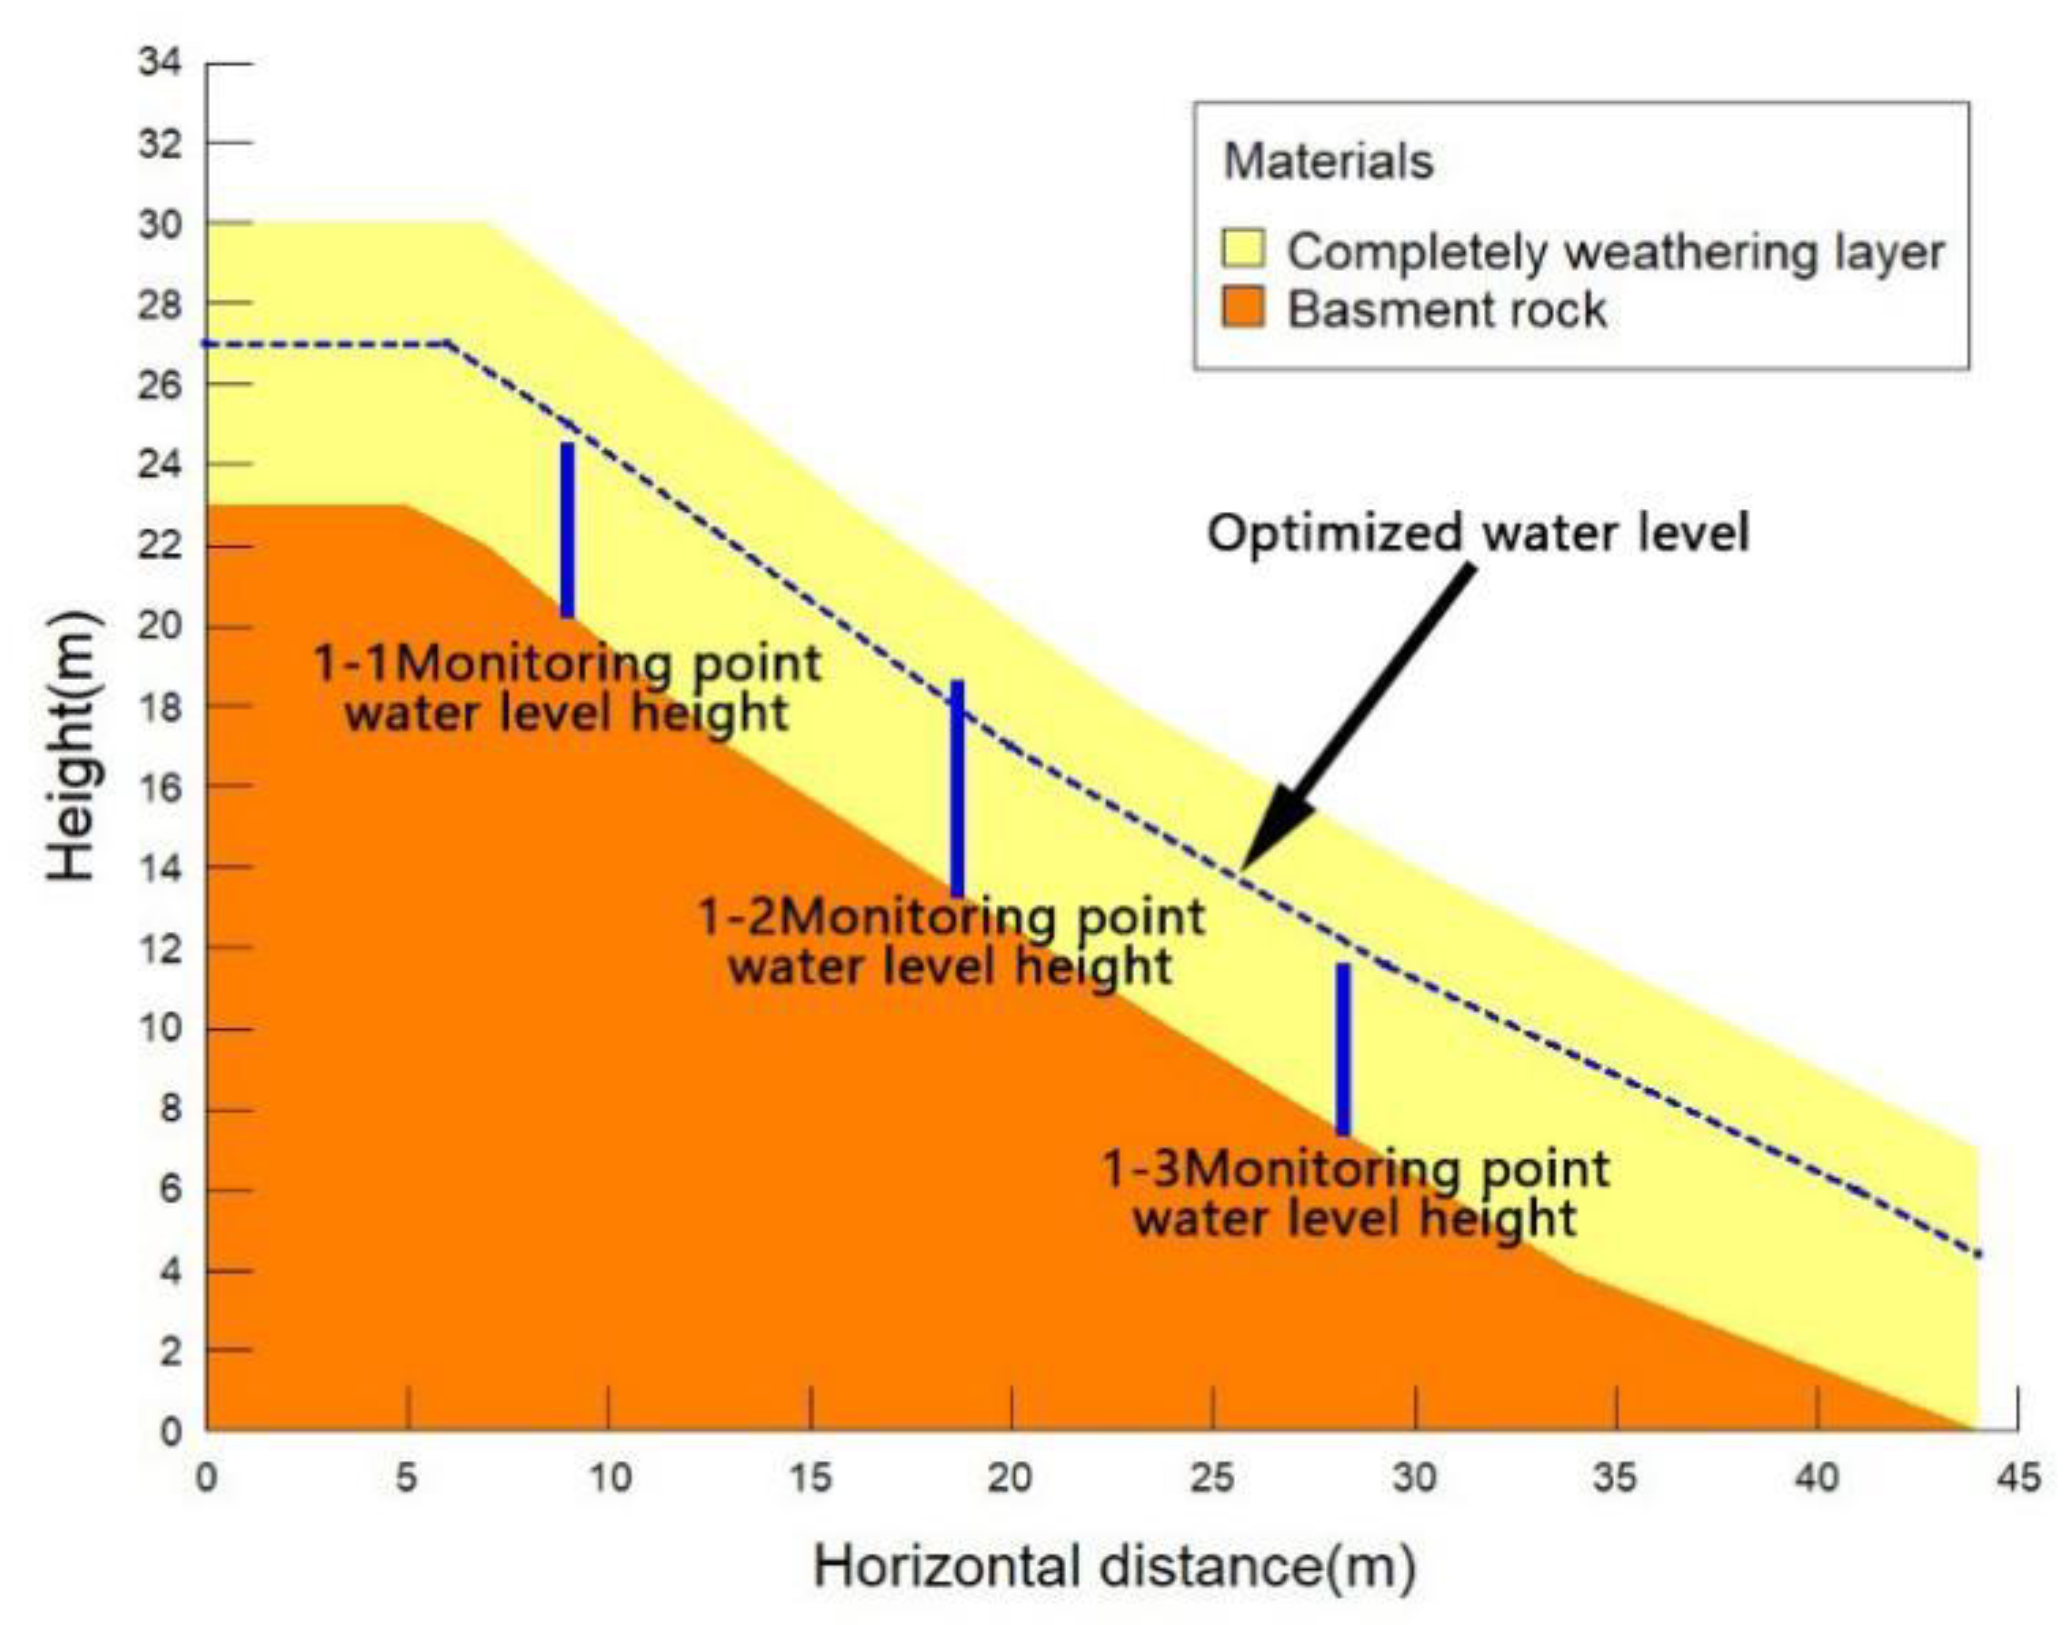
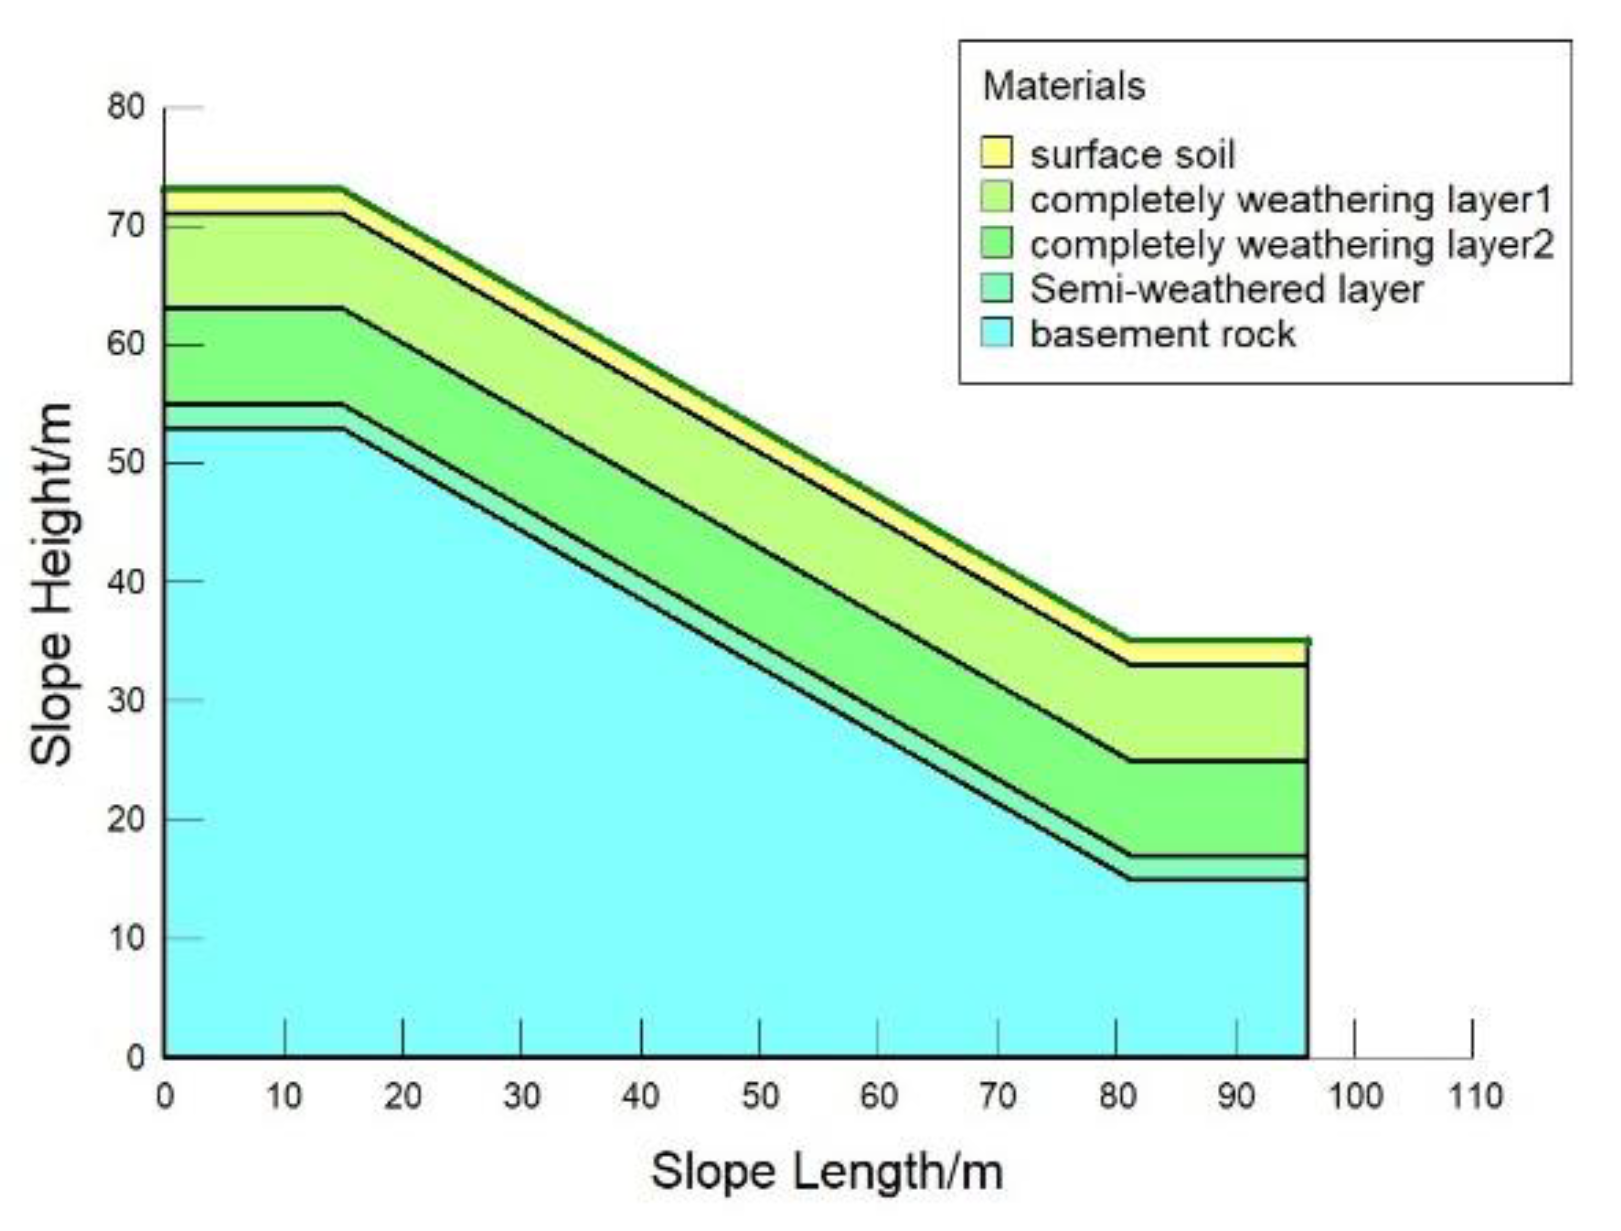
While establishing the geometric model for sensitivity analysis, we shall as far as possible, exclude the interference of irrelevant factors. These include the thickness of each layer of rare earth ore, including topsoil layer, complete- weathering layer 1, complete-weathering layer 2, semi-weathered layer, and bedrock. The thickness of each layer in this modeling was designated as follows: the thickness ratio of topsoil, complete-weathering layer 1, complete-weathering layer 2, semi-weathered layer, and bedrock was 2:8:8:6:11; the slope height was set to be 35 m. The cohesion density, cohesion force, and internal friction angle of topsoil layer were designated to be 13.6 kN/m3, 5 kPa, and 30°, respectively; the density of complete-weathered layer was 11.8 kN/m3; the cohesion force and internal friction angle of complete-weathered layer 1 were set to be 18 kPa and 31°, respectively; the density, cohesion, and internal friction angle of semi-weathered layer were set to be 10 kN/m3, 3 kPa, and 35°, respectively; the bedrock density, cohesion, and internal friction angle were set to be 24 kN/m3, 2 kPa, and 65°, respectively. It should be noted that the parameters in Table 1 only affect those of complete-weathering layer 2, i.e., the part of the complete-weathering layer below the phreatic line. The specific comparison test groups are shown in Table 2.
On the basis of the experimental groups in 
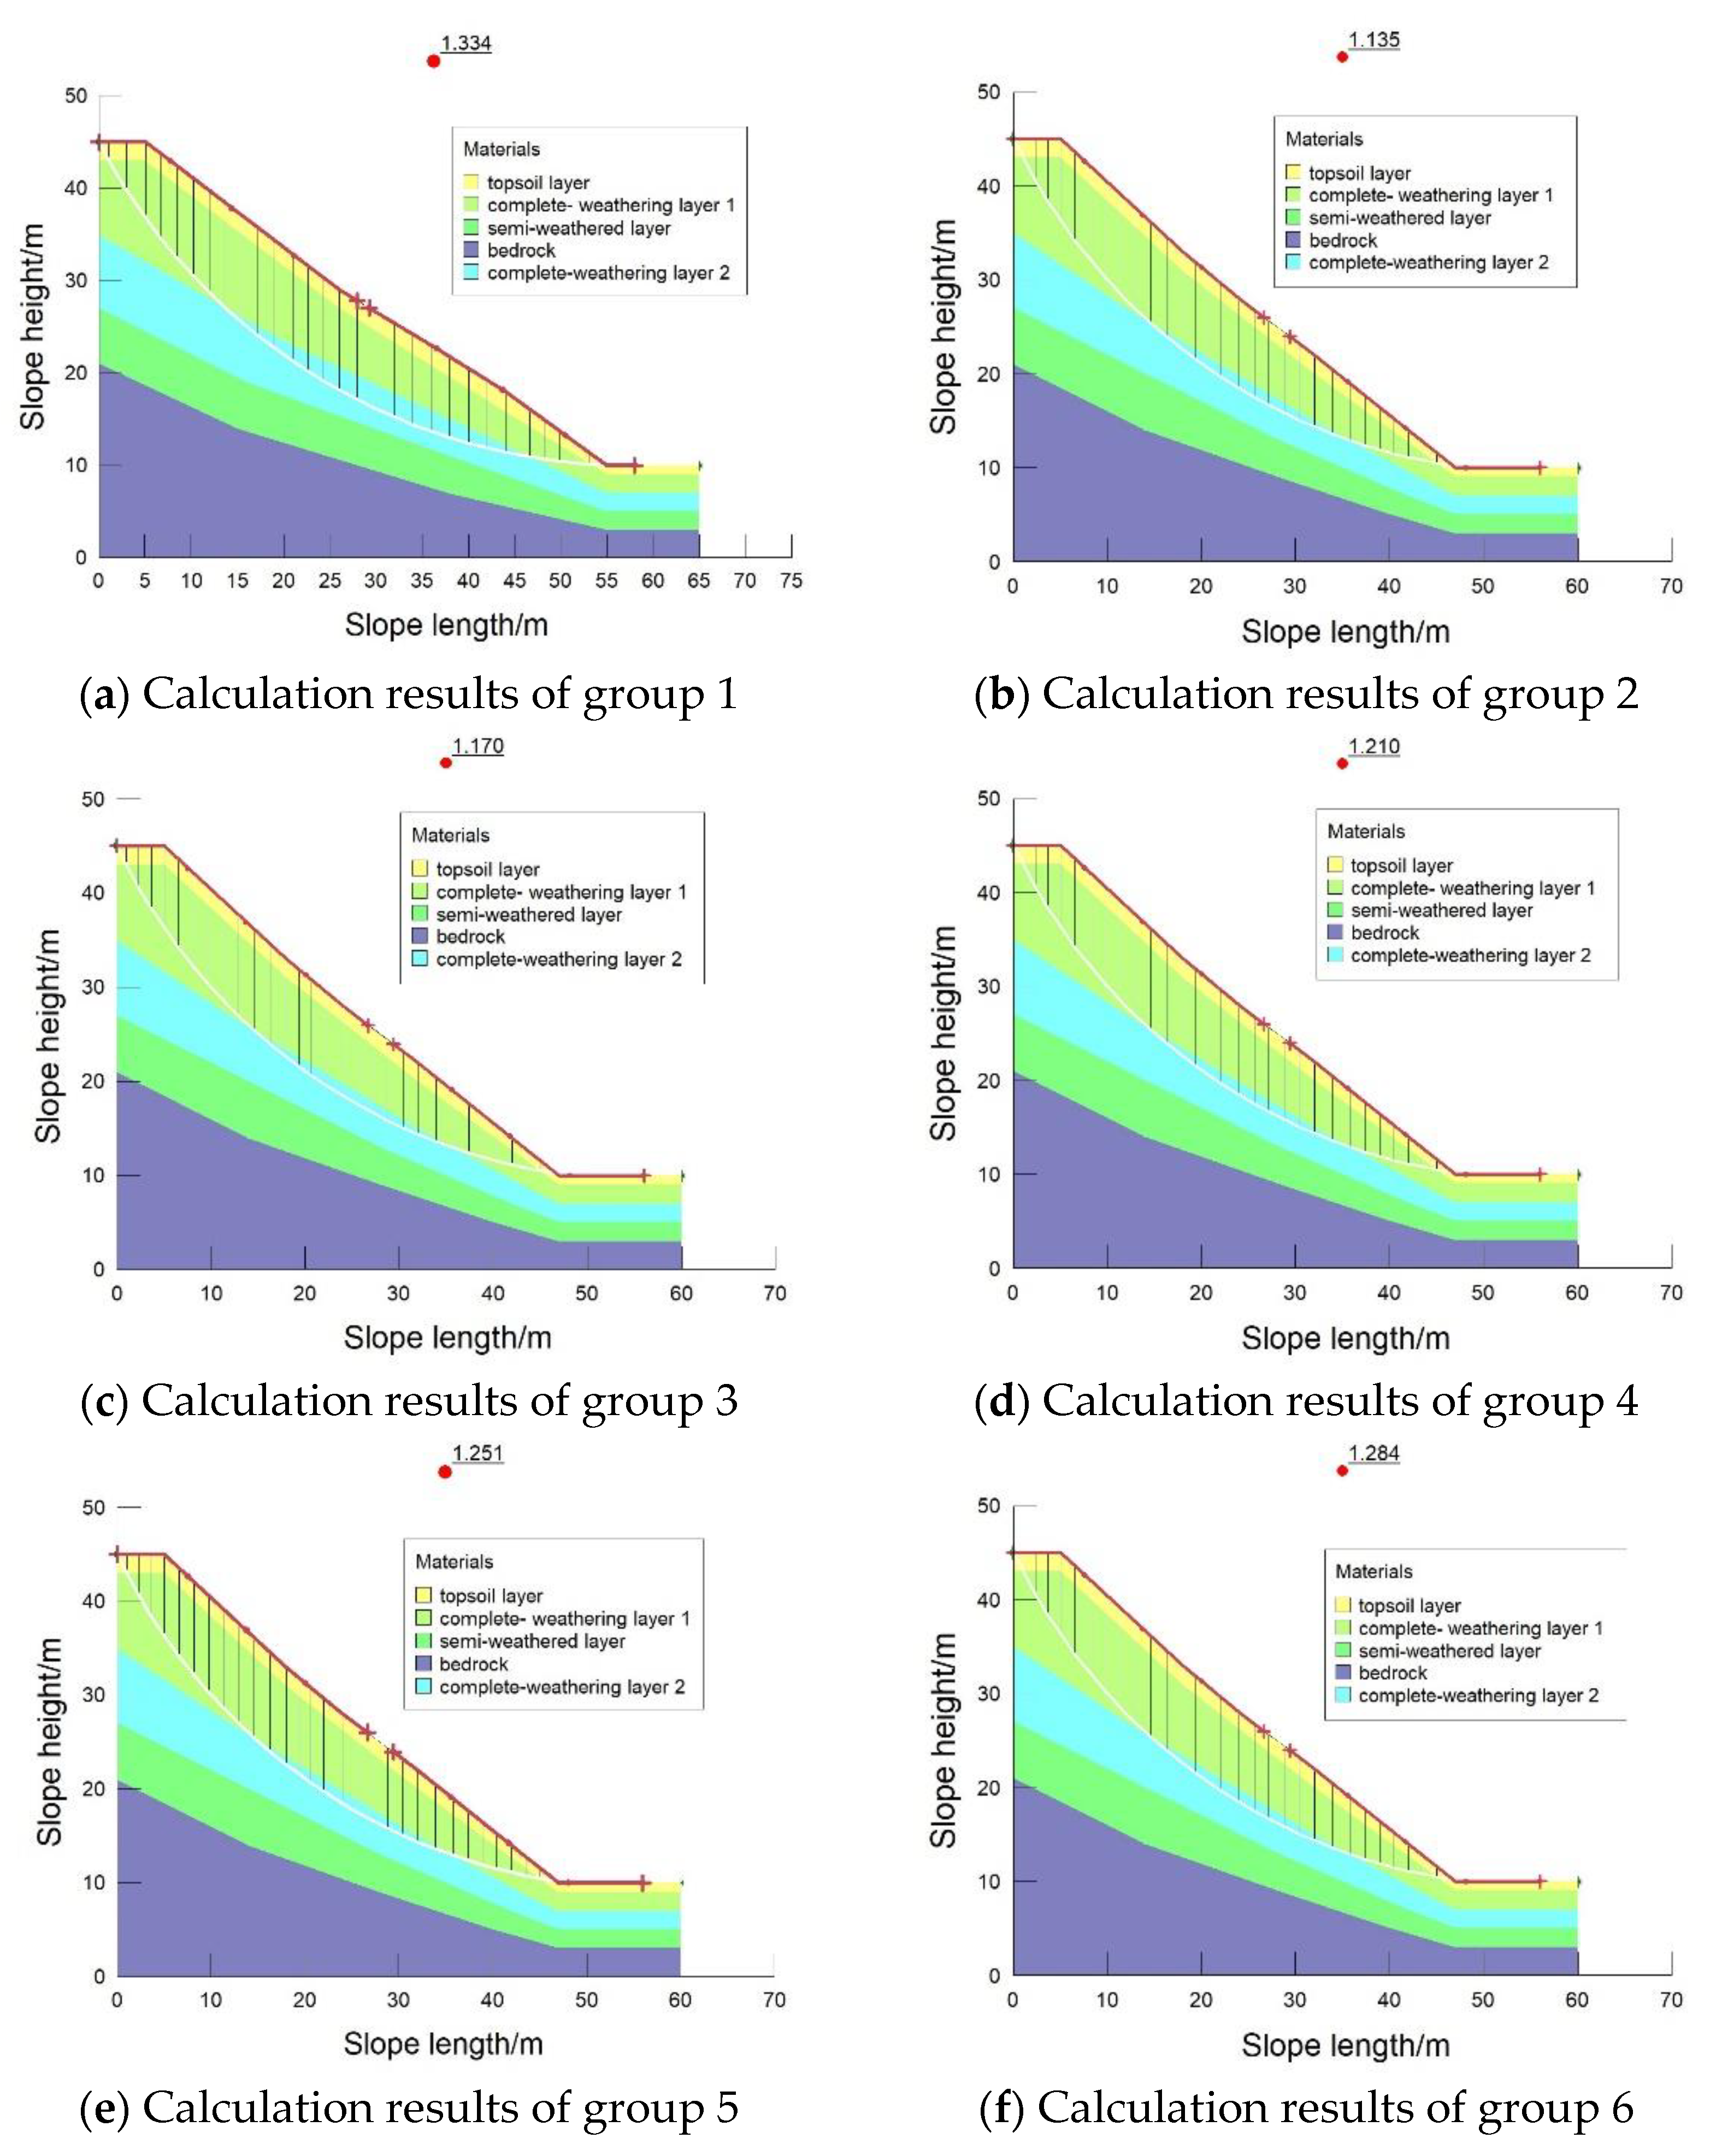
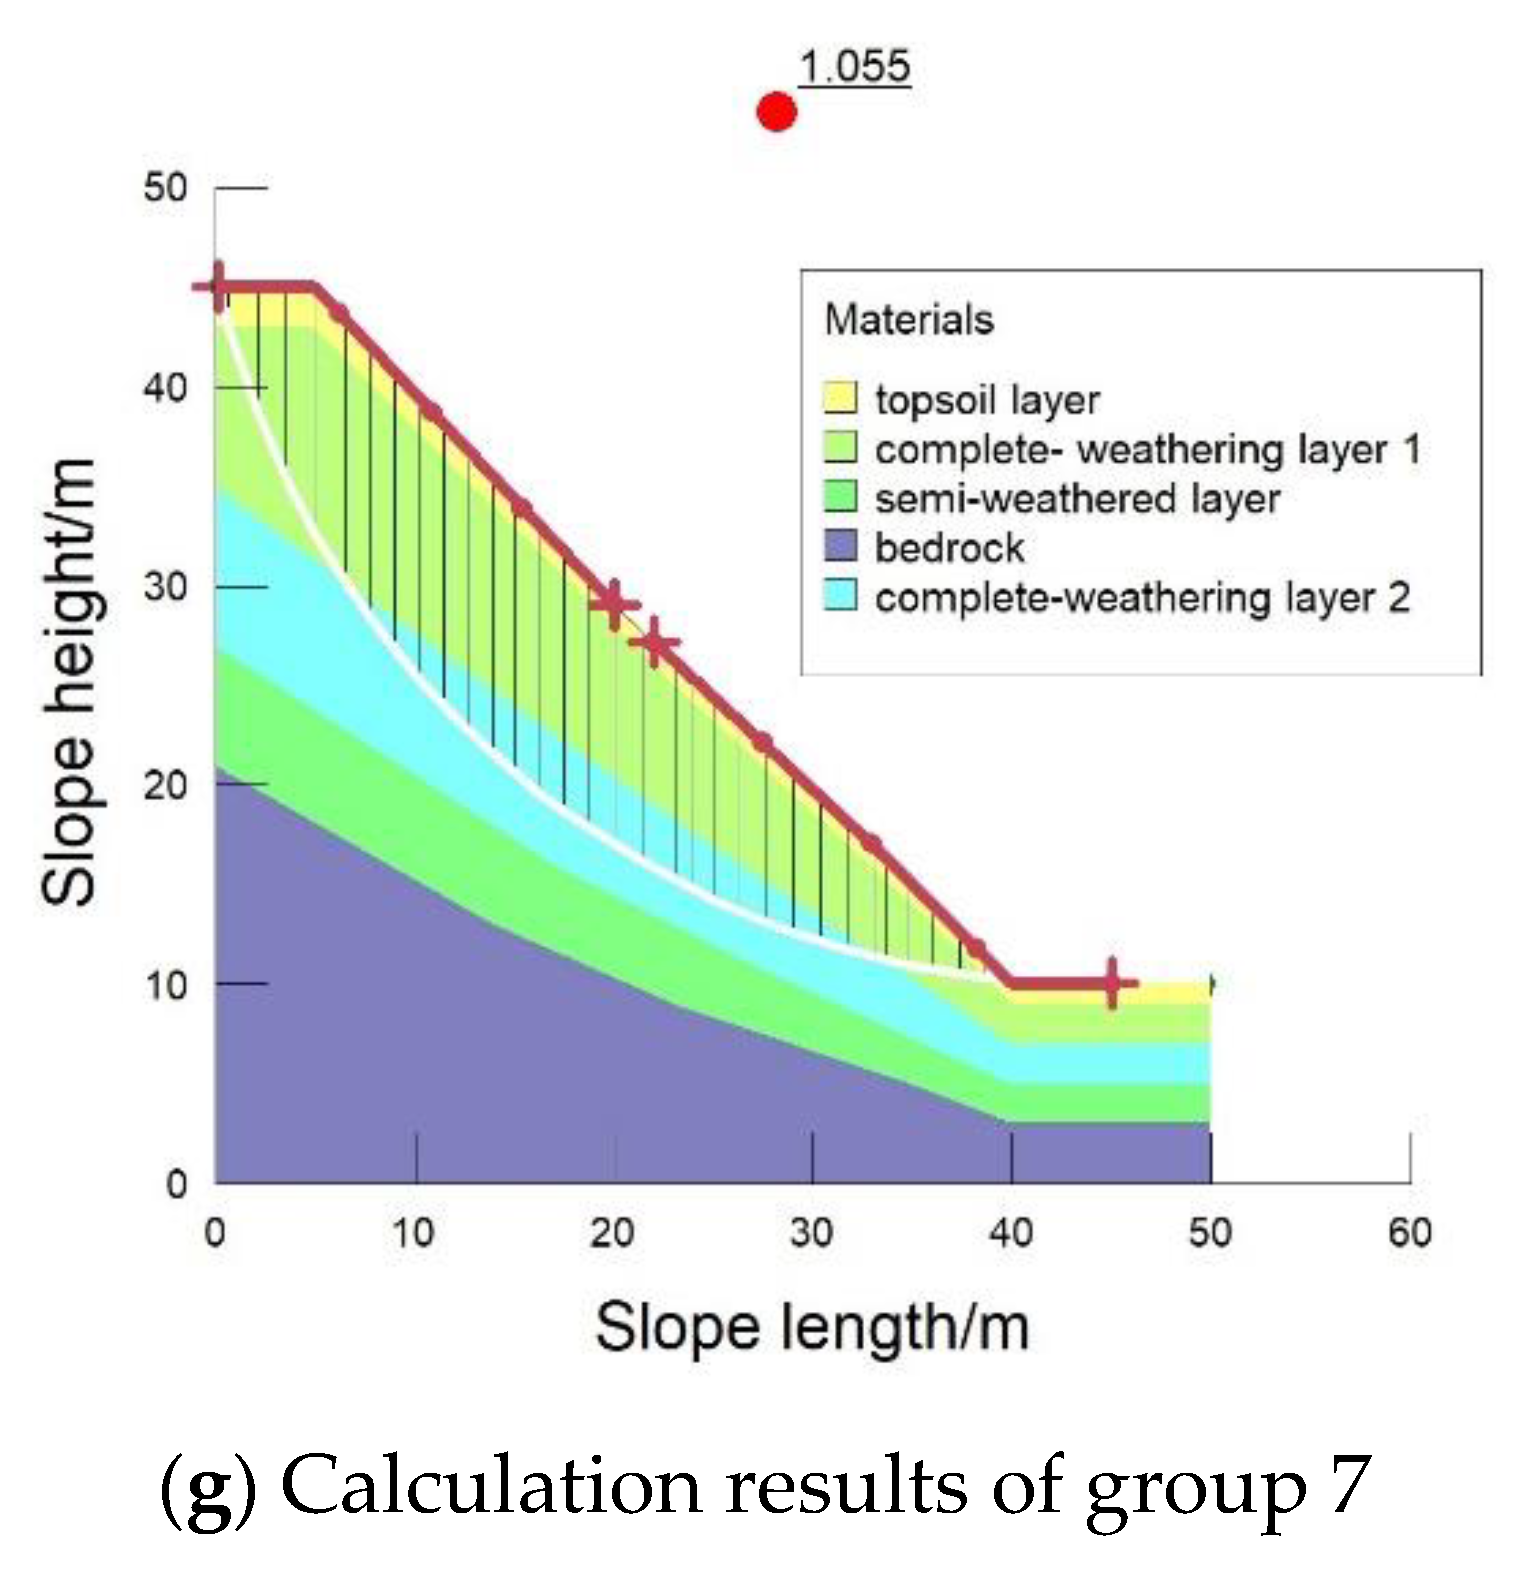
Table 2, we established the corresponding numerical model for GeoStudio 2012 sensitivity analysis. The safety factors with the most dangerous landslide surface were calculated for each group. At first, the safety factors for three internal friction angle values were worked out with a slope angle of 40°, and a cohesion of 11 kPa. Then, the safety factors for three cohesion values were calculated with a slope angle of 40°, and an internal friction angle of 11 kPa. In the same way, the safety factors at different slope angles were calculated. The results are shown in Figure 6 and Table 3. Figure 6a–g respectively correspond to the calculation results of groups 1–7.
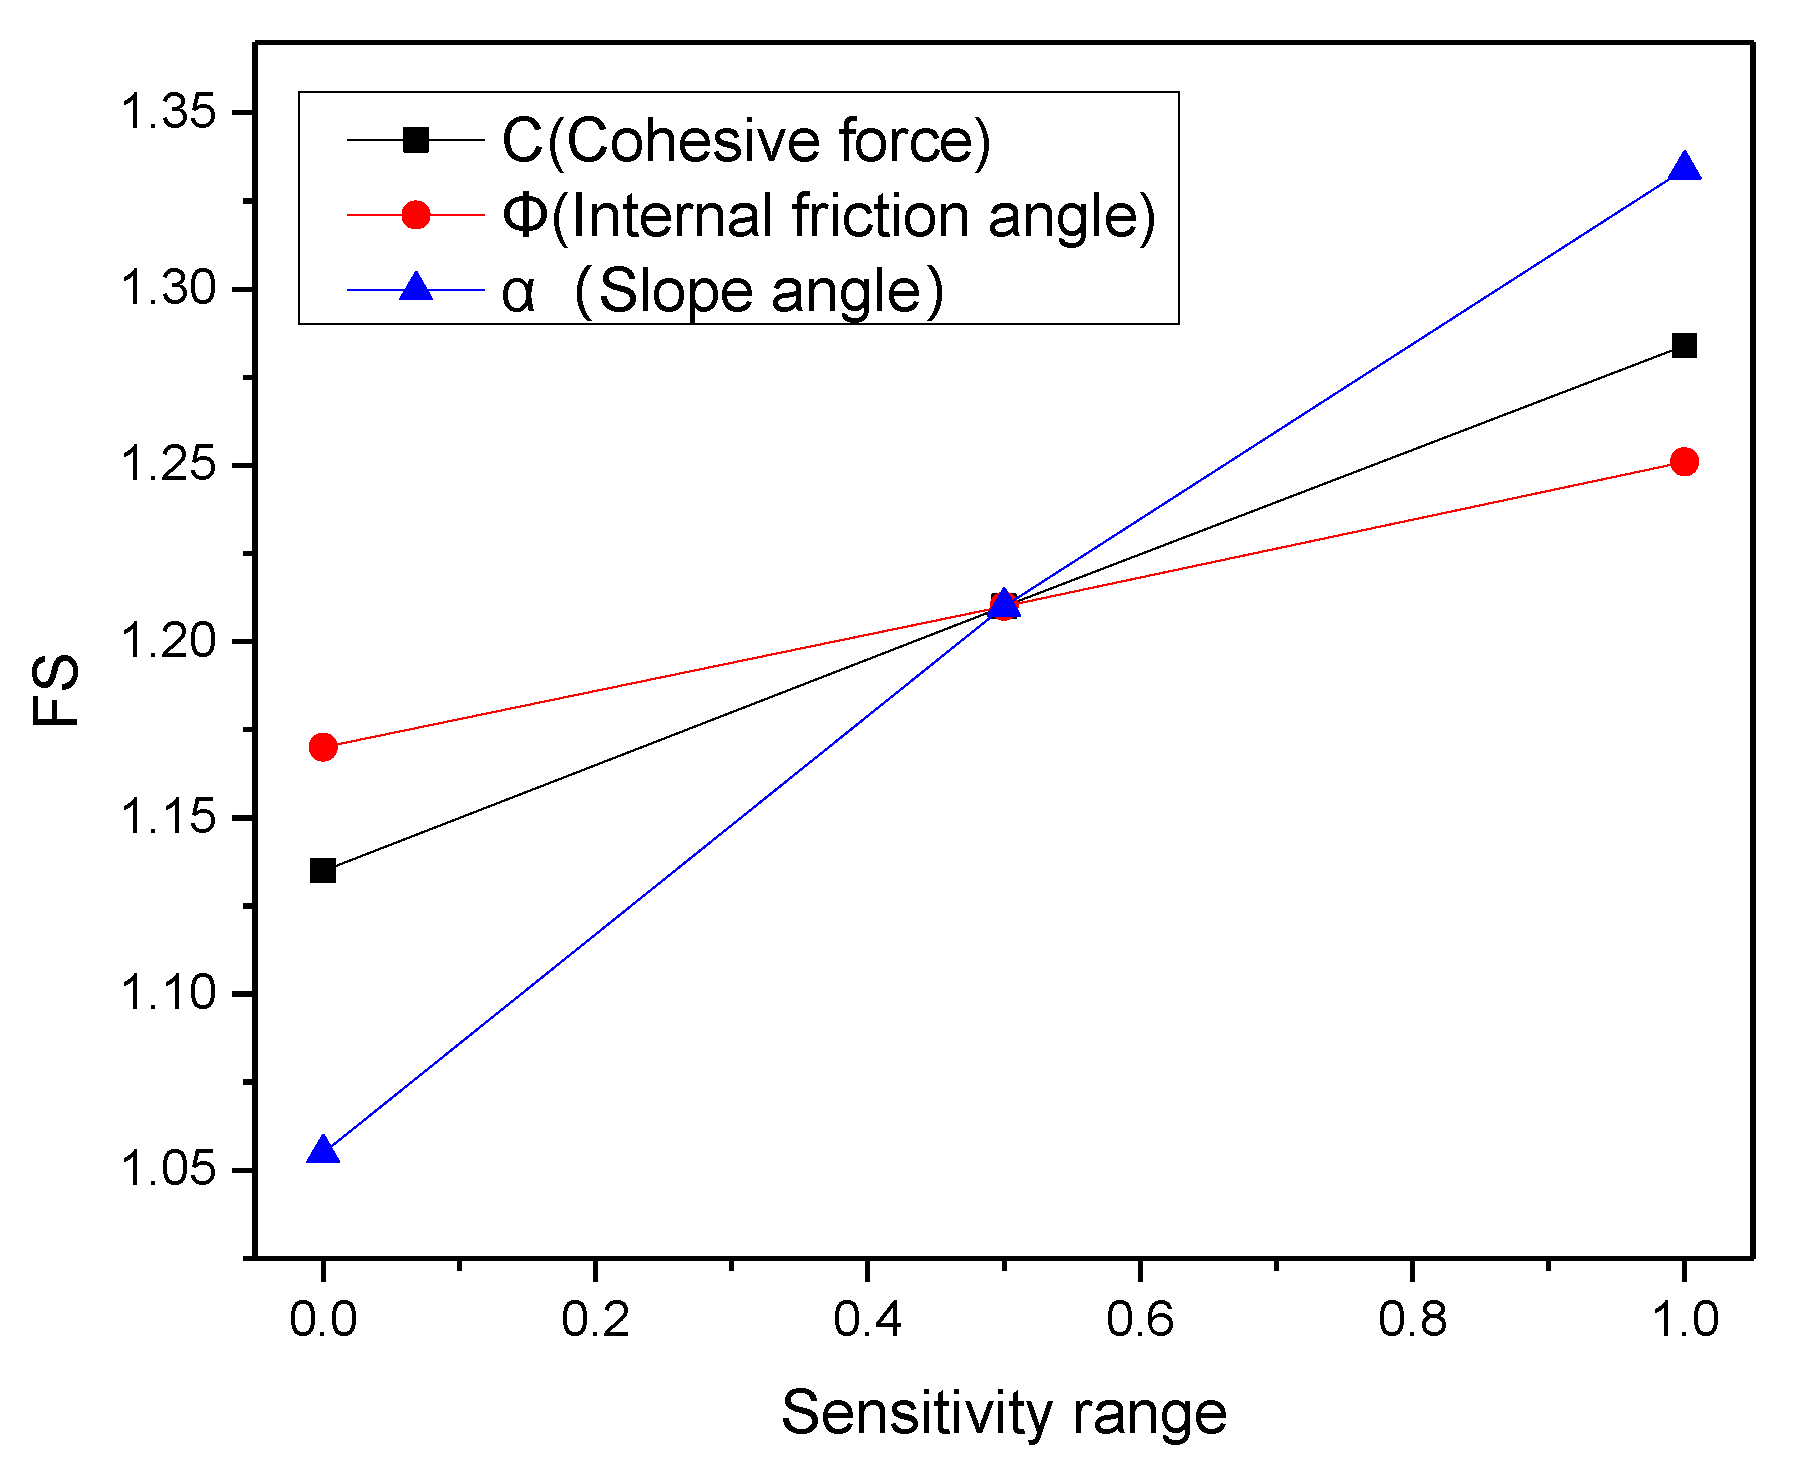
Then, we draw the sensitivity analysis curves upon normalizing all parameters to be within 0~1. For example, “0” demonstrates that c is 0 kPa, and “1” shows that c is 18 kPa. On the basis of the numerical simulation results, the sensitivity curves under different slope angles ( α ), cohesion forces (c), and internal friction angles ( φ ) are drawn in a graph (Figure 7).
The hierarchical effects of slope angle, cohesion, and internal friction angle on the sensitivity of slope stability are described as: slope angle > cohesion > internal friction angle. That said, the influence of slope angle is the most significant, followed by cohesion. In comparison with slope angle and cohesion, internal friction angle has little effect on the slope stability. The reason for this can be accounted in the following: the ion-adsorption rare earth ore is a mixture of sand soil and 20% fine-grained clay soil. The internal friction angle is mainly controlled by the gradation of soil. Mainly demonstrated on the rare earth fine particles, the erosion effect of leaching solution on the large particles is extremely small. In general, in situ leaching has slight effect on the overall gradation. In the final analysis, the influences of internal friction angle variations on soil mass strength and slope stability are smaller than those of the other two factors during the leaching process of rare earth ore.
In accordance with the above analysis, we consider the effects of slope stability caused by the variation in internal friction angles as a secondary factor when establishing a landslide early warning model. In this research, the effect of internal friction angle changes on the slope stability is excluded.

4. Verification of Landslide Early Warning System

4.1. Overview of Testing Site

The testing site is the slope of an ion-adsorption rare earth mine, which is located in Anyuan County, Ganzhou City, Jiangxi Province. Surrounded with east-west low hills, the site is characterized by flat terrain and abundant surface water. The western part is slightly higher than the eastern one. Exposed below an elevation of 340 m, with a slope height of 38 m, and a slope angle of 30°, the weathering crust in the form of streak-like migmatites is well developed. With sparse vegetation, the hillsides have been reclaimed to terraced fields for planting navel oranges. The sampling statistics show that the maximum depth of the complete-weathering layer is 24.5 m. The thickness of surface soil layer ranges 0.4–2.0 m, with a maximum thickness of 4.0 m. The thickness of the complete-weathering layer is 2.0 to 24.5 mm, while that of the semi-weathered layer is 2.2 m. Figure 8 is the layout of the water level monitoring points.

4.2. Establishment of Landslide Early Warning Model

On the basis of the slope parameters of the testing area, we established corresponding numerical simulation model (Figure 9). With a slope of 30° and slope height of 38 m, the layer thickness ratio of surface soil layer, complete-weathering layer 1, complete-weathering layer 2, and semi-weathered layer is set to be 2:8:8:2. The density, cohesion, and internal friction angle of the surface soil layer were designated to be 13.6 kN/m3, 5 kPa, and 30°, respectively; the density of complete-weathering layer is 11.8 kN/m3; the cohesion and internal friction angle of complete-weathering layer 1 are set to be 18 kPa and 31°; the density, cohesion, and internal friction angle of the semi-weathered layer are set to be 10 kN/m3, 3 kPa, and 35°; the bedrock density, cohesion, and internal friction angle are set to be 24 kN/m3, 2 kPa, and 65°.
In accordance with the previously mentioned landslide-inducing factors analysis, the model material parameters only influence the cohesion of the complete-weathering layer 2. The research of Yu Biao [26] shows that the cohesion of rare earth ore gradually decreases from 17 kPa to 3 kPa with the increasing leaching time. Considering the fact that the soil mass is in the state of confined pressure, we designated the four values of cohesion to be 6~18 kPa (with a step size of 4 kPa). The specific comparison test groups are shown in Table 4.
We then worked out the corresponding factor of safety (FS) by changing the heights of water level line on the basis of different cohesive forces. Until the water level line (FS) of 1 is calculated, the calculation of the geometric model of the cohesion is stopped. Applying different FIFC landslide early warning models to distinctive leaching stages, we determine the corresponding landslide warning alert. Table 5 shows the calculation results. Figure 10 is the early warning model.
The setting of early warning threshold is important in landslide early warning. In this research, we adopted the widely established safety factor threshold model (Table 6).

4.3. Operation and Display of Landslide Early Warning System

The landslide early warning model was embedded into the self-developed online monitoring system. In accordance with the particular stage of in situ leaching process, the system is capable of deciding corresponding early warning modes, which can be displayed on the early warning platform. These provide decision-making basis for safe production. Upon experimenting the intensity attenuation law for rare earth ore at different leaching time, Chen Xun et al. [27] established a correlation model between leaching time and cohesion (c). During the leaching process, the cohesion decreases linearly with the adding leaching time. Thus, the in situ leaching process of rare earth ore can be divided into four stages, which match the four early warning models under different cohesion conditions (Figure 11). Depending on the amount of early warning models, the number of stages should be adjusted accordingly. With the water level dynamic data measured on No. 3 line of the experimental area, we divided the whole leaching process of rare earth ore into four stages. In practice, the system cannot distinguish these four stages by time, for the non-existence of complete time-water level sequence curve prior to the end of rare earth mining. Therefore, the ratio of mother solution to rare earth ore reserves is applied as an indicator to distinguish the four models in this system. On the basis of the daily collection volume of mother solution and rare earth reserve index, we determine the stage of leaching. Thus, the corresponding early warning model can be decided.
Figure 12 is the interface of the online landslide early warning system. The main interface displays the real-time dynamic data of the slope water level during the in situ leaching process, as well as the graded early warning level. This system applies SQL + C++ programing, which is efficient in data processing. On-site testing and comparison shows that water level monitoring delay does not exceed 15 s. The system calculates the real-time monitoring data every minute and automatically refreshes it once on the early warning platform.

5. Conclusions and Outlook

The frequent occurrences of landslides have haunted the in situ leaching of ionic rare earths. The solutions to landslide lie in the following steps: analyzing the causes behind landslides, identifying potential landslide areas, and then establishing real-time monitoring and landslide early warning systems. The major findings can be summarized as follows:
(1)
Water is the most relevant factor of landslides in the process of in situ leaching of ionic rare earths. As water level in the slope rises, the effective stress on the slope soil mass below the water level decreases. The reduced friction between soil particles results in a decrease in soil strength. Due to the soaking of leaching solution, the softening of soil mass reduces the shear strength of soil, which increases the probability of landslides.
(2)
By monitoring the water level in the rare earth slopes, we understood the real-time variation in water level. Then, we developed an adaptive data acquisition technology. The automatic data processing method can effectively optimize the water level data on the same survey line and transform it into an early warning trigger condition when necessary.
(3)
A real-time early warning system against landslides was developed on the basis of the real-time monitoring of water level changes in slopes. Distinctive models were established according to different slope heights and angles in accordance with various working conditions. The underlying logic of this early warning model is factor of safety. The early warning parameters, for instance, slope height, slope angle and stage of leaching (ratio of mother liquor collection of rare earth ore to reserves of rare earth ore), are automatically calculated with algorithms. The early warning information is real-time displayed and timely issued on the C++ based platform.
(4)
By applying the landslide early warning system to a rare earth slope (with a slope height of 38 m, and a slope gradient of 30 degrees) in southern Jiangxi, we realized the early warning of landslide in the process of in situ leaching of rare earths. According to the leaching stages of the slope, the system, upon its automatic selecting different cohesion models, achieved landslide early warning on the basis of the real-time monitoring of water level.
(5)
This study provides an effective solution to early warning against landslides during the mining process of ion-adsorption rare earth deposits in Southern Jiangxi. Moreover, the system can be applied to establish early warning systems against other kinds of landslides, for instance, landslides caused by rainfall. Admittedly, there is still room for technology improvement in this landslide early warning system. For example, the water level line can be further optimized. In this system, the average value of water level is applied to optimize the water level line. It needs to be improved. In the future study, we can establish a water level monitoring model to replace the average water level model. Furthermore, the variation in cohesion of rare earth minerals in different ionic rare earth mines with the passage of time should be taken into consideration for a higher early warning accuracy of landslides.

Author Contributions

Conceptualization, M.H., Y.R. and W.N.; methodology, M.H. and D.W.; software, M.H., F.W. and W.N.; validation, F.W.; data curation, L.S.; writing—original draft preparation, M.H. and D.W.; writing—review and editing, M.H. and Y.R.; visualization, M.H. and F.W.; supervision, Y.R.; project administration, Y.R.; funding acquisition, Y.R. and L.S. All authors have read and agreed to the published version of the manuscript.

Funding

This research was funded by the National Natural Science Foundation of China (Grant No. 51964014) and the Education Department of Jiangxi Province (Grant No. GJJ209414).

Data Availability Statement

The data that support the findings of this study are available from the corresponding author (VS) upon reasonable request.

Conflicts of Interest

The authors declare no conflict of interest.

References

  1. Sasahara, K. Development of the surface displacement during repeated rainfalls in sandy model slopes: Condition for the increase of the displacement to failure. Landslides 2022, 19, 2791–2800. [Google Scholar] [CrossRef]
  2. Barla, M.; Antolini, F. An integrated methodology for landslides’ early warning systems. Landslides 2016, 13, 215–228. [Google Scholar] [CrossRef]
  3. Xu, Q.; Peng, D.L.; Zhang, S.; Zhu, X.; He, C.Y.; Qi, X.; Zhao, K.Y.; Xiu, D.H.; Ju, N.P. Successful implementations of a real-time and intelligent early warning system for loess landslides on the Heifangtai terrace, China. Eng. Geol. 2020, 278, 105817. [Google Scholar] [CrossRef]
  4. Deng, L.Z.; Smith, A.; Neil, D.X.; Yuan, H.Y. Machine learning prediction of landslide deformation behaviour using acoustic emission and rainfall measurements. Eng. Geol. 2021, 293, 106315. [Google Scholar] [CrossRef]
  5. Park, J.Y.; Lee, S.R.; Lee, D.H.; Kim, Y.T.; Lee, J.S. A regional-scale landslide early warning methodology applying statistical and physically based approaches in sequence. Eng. Geol. 2019, 260, 105193. [Google Scholar] [CrossRef]
  6. Zhao, L.; Liu, M.; Song, Z.; Wang, S.; Zhao, Z.; Zuo, S. Regional-scale modeling of rainfall-induced landslides under random rainfall patterns. Environ. Model. Softw. 2022, 155, 105454. [Google Scholar] [CrossRef]
  7. Zhao, B.R.; Dai, Q.; Han, D.W.; Dai, H.; Mao, J.; Zhuo, L. Probabilistic thresholds for landslides warning by integrating soil moisture conditions with rainfall thresholds. J. Hydrol. 2019, 574, 276–287. [Google Scholar] [CrossRef]
  8. Wang, G.S.; Luo, S.H.; Hu, S.L.; Hong, B.G.; Deng, X. Seepage Process and Slope Deformation of Barefoot Type Rare Earth Mine In-situ Leaching. Chin. Rare Earth 2017, 38, 35–46. [Google Scholar] [CrossRef]
  9. Tang, X.Z.; Li, M.N.; Yang, D. Stope Slide in In-situ Leaching of Ionic Type Rare Earth Ore and Its Countermeasures. Met. Mine 2000, 289, 6–8. [Google Scholar]
  10. Chi, R.A.; Zhang, Z.Y.; Yu, J.X.; Xiao, C.Q.; Zhang, Y.F.; Zhou, F.; Liu, D.F.; Wu, X.Y. Research Process of Weathered Crust elution-Deposited Rare Earth Ore. J. China Univ. Min. Technol. 2022, 51, 1178–1192. Available online: https://kns.cnki.net/kcms2/article/abstract?v=DbNU1Fi_fRWl3-OhRWidnTmFQkmztkadr7ffhIg-vqQpkzv7xE3kRRrGBNTrbmDB_Ppa-VsNYZYHkw4rK0FPvBCBT2W9BAAxAg8AmkPhR3aJA95p8njAxg==&uniplatform=NZKPT&language=CHS (accessed on 28 January 2023).
  11. Wang, X.J.; Wang, H.; Sui, C.; Zhou, L.B.; Feng, X.; Huang, C.G.; Zhao, K.; Zhong, W.; Hu, K.J. Permeability and Adsorption–Desorption Behavior of Rare Earth in Laboratory Leaching Tests. Minerals 2020, 10, 889. [Google Scholar] [CrossRef]
  12. Guo, Z.Q.; Zhou, J.R.; Xu, H.; Zhou, K.F.; Jin, J.F. Reviews of Ionic Type Rare Earth Orebody Strength Weakening and Landslide under Ore Leaching. Chin. Rare Earths 2022, 43, 9–22. [Google Scholar] [CrossRef]
  13. Liu, Q.S.; Xiao, H.; Tan, C.L.; Yu, X.Y.; Wang, D.L.; Qiu, T.S. Simulation Research on Multi-field Coupling in Leaching Process of Ionic Rare Earth Ore Based on COMSOL. J. Chin. Soc. Rare Earths 2022, 40, 880–892. [Google Scholar]
  14. Jiang, S.; Lu, R.L.; Wei, W.; Wang, G.S. Slope deformation mechanisms and stability of ion-adsorption rare-earth mines by in-situ leaching. Eng. J. Wuhan Univ. 2022, 1–9. Available online: http://kns.cnki.net/kcms/detail/42.1675.T.20220223.2027.002.html (accessed on 19 January 2023).
  15. Han, M. Study on the Early Warning Model for Landslide during Ion-Adsorbed Rare Earth Ore In-Situ Leaching. Master’s Thesis, Jiangxi University of Science and Technology, Ganzhou, China, 2018. Available online: http://cdmd.cnki.com.cn/Article/CDMD-10407-1018065201.htm (accessed on 1 January 2023).
  16. Li, G.X. Some Problems about Principle of Effective Stress. Chin. J. Geotech. Eng. 2011, 33, 315–320. [Google Scholar]
  17. Li, J.P.; Liang, F.Y.; Zhao, C.F. Soil Mechanics; Higher Education Press: Beijing, China, 2008. [Google Scholar]
  18. Guzzetti, F.; Gariano, S.L.; Peruccacci, S.; Brunetti, M.T.; Marchesini, I.; Rossi, M.; Melillo, M. Geographical landslide early warning systems. Earth-Sci. Rev. 2020, 200, 102973. [Google Scholar] [CrossRef]
  19. Shi, X.W.; Guo, Z.X.; Zhang, Y.; Fang, J.Y.; Hu, K.J.; Liu, Q.Z. A Review of Research on the Vulnerability of Storm Surges. Prog. Geogr. 2016, 7, 889–897. Available online: http://www.cnki.com.cn/Article/CJFDTotal-DLKJ201607010.htm (accessed on 28 January 2023).
  20. Smith, D.I. Flood damage estimation—A review of urban stage-damage curves and loss functions. Water SA 1994, 20, 231–238. [Google Scholar]
  21. Kestner, F.J.T. Review of The Benefits of Flood Alleviation: A Manual of Assessment Techniques, by E. C. Penning-Rowsell & J. B. Chatterton. Geogr. J. 1979, 145, 472–473. [Google Scholar] [CrossRef]
  22. Lee, J.; Lee, Y.J.; Kim, H.; Sim, S.H.; Kim, J.M. A new methodology development for flood fragility curve derivation considering structural deterioration for bridges. Smart Struct. Syst. 2016, 17, 149–165. [Google Scholar] [CrossRef]
  23. Shi, P.J. Revisiting the Theory and Practice of Disaster Study. J. Nat. Disasters 1996, 11, 6–17. [Google Scholar]
  24. Guo, Z.Q.; Zhao, K.; Jin, J.F.; Yuan, W.; Liang, C. Problems for the Exploitation of Ion-Adsorption Rare Earth and Research Progresses on Its Green Extraction. Chem. Ind. Eng. Prog. 2019, 38, 3425–3433. [Google Scholar] [CrossRef]
  25. Wu, C.F.; Yao, G.J.; Chen, L.; Huang, L.; Tu, Z.G. Geo-Studio-based Slope stability analysis for an ion-adsorption rare earth mine. Chin. J. Geol. Hazard Control 2016, 27, 72–77. [Google Scholar] [CrossRef]
  26. Yu, B. Research of Landslide Early Warning Technology for Ion-Absorbed Rare-Earth Mineral. Master’s Thesis, Jiangxi University of Science and Technology, Ganzhou, China, 2016. Available online: https://kns.cnki.net/KCMS/detail/detail.aspx?dbname=CMFD201701&filename=1016244391.nh (accessed on 28 January 2023).
  27. Chen, X.; Qi, Y.; Yin, S.H.; Li, X.X.; Xie, F.F.; Liu, J.W.; Yan, R.F. Attenunation Law of Mechanical Properties for Rare Earth Ore under the Leaching Condition. J. Cent. South Univ. 2019, 4, 939–945. [Google Scholar]
Figure 1. Slope models before and after solution injection.
Minerals 13 00265 g001
Figure 2. Operation flow chart of landslide warning system on the basis of the online monitoring of water level.
Minerals 13 00265 g002
Figure 3. Schematic diagram of vulnerability curve.
Minerals 13 00265 g003
Figure 4. Variation in water level at different points on the same line of a rare earth slope with time.
Minerals 13 00265 g004
Figure 5. Schematic diagram of water level optimization.
Minerals 13 00265 g005
Figure 6. Calculation results for testing group 1–7.
Minerals 13 00265 g006aMinerals 13 00265 g006b
Figure 7. Sensitivity analysis curve.
Minerals 13 00265 g007
Figure 8. Layout of monitoring points in the testing site.
Minerals 13 00265 g008aMinerals 13 00265 g008b
Figure 9. Slope model (with a slope height of 38 m and a slope angle of 30°).
Minerals 13 00265 g009
Figure 10. Landslide early warning model for ion-adsorption rare earth with a slope of α 30°.
Minerals 13 00265 g010
Figure 11. Principles of landslide early warning model at different leaching stages (c refers to cohesion in the figure).
Minerals 13 00265 g011
Figure 12. Self-developed landslide early warning system.
Minerals 13 00265 g012
Table 1. Values for sensitivity analysis parameters.
Serial Number Slope   Angle   α Cohesive   Force   c /kPa Internal   Friction   Angle   φ
135427
2401129
3451831
Table 2. Sensitivity analysis test group of complete-weathering layer 2.
Serial Number Slope   Angle   α Cohesive   Force   c /kPa Internal   Friction   Angle   φ
1351129
240429
3401127
4401129
5401131
6401829
7451129
Table 3. Calculation results for sensitivity analysis.
Serial NumberSlope Angle/°Cohesive Force/kPaInternal Friction Angle/°Factor of Safety
13511291.334
2404291.135
34011271.17
44011291.21
54011311.251
64018291.284
74511291.055
Table 4. List of parameters of the model.
Slope Angle/°Cohesive Force/kPaWater Level/m
30181~ W i c
30141~ W i c
30101~ W i c
3061~ W i c
Table 5. FS for different cohesion/water line.
Slope Angle/°30303030
Cohesive Force/kPa1814106
FS (PL = 0)1.6531.6131.5651.517
FS (PL = 1)1.6531.6131.5651.517
FS (PL = 2)1.6531.6131.5651.517
FS (PL = 3)1.6491.6131.5651.517
FS (PL = 4)1.5891.5561.5231.490
FS (PL = 5)1.5251.4921.4591.426
FS (PL = 6)1.4551.4231.3901.357
FS (PL = 7)1.3821.3491.3171.284
FS (PL = 8)1.3051.2721.2401.208
FS (PL = 9)1.3061.2701.1611.129
FS (PL = 9.2)1.2081.1761.1451.113
FS (PL = 10)1.1411.1101.0781.047
FS (PL = 11)1.0561.0250.9950.964
FS (PL = 11.5)1.0130.982
FS (PL = 11.7)0.995
Table 6. Early warning hierarchy of landslide risks.
Safety FactorEarly Warning RisksMeasures to Be Taken
>1.3Green signal (Safety)No measures required
1.2~1.3Yellow warning (remains to be monitored)Keeping close observation
1.1~1.2Orange alert (Alerting)Formulating treatment measures
<1.1Red alert (Dangerous)Taking emergency measures (Pre-landslide state)
Disclaimer/Publisher’s Note: The statements, opinions and data contained in all publications are solely those of the individual author(s) and contributor(s) and not of MDPI and/or the editor(s). MDPI and/or the editor(s) disclaim responsibility for any injury to people or property resulting from any ideas, methods, instructions or products referred to in the content.

