Article

Simulation of an Ionic Rare Earth Leaching Process Based on the Darcy Law-Chemical Reaction Engineering-Transfer of Dilute Substance Coupling

1
School of Resources and Environmental Engineering, Jiangxi University of Science and Technology, Ganzhou 341000, China
2
School of Civil and Surveying & Mapping Engineering, Jiangxi University of Science and Technology, Ganzhou 341000, China
3
The Seventh Geological Brigade of Jiangxi Bureau of Geology, Ganzhou 341000, China
*
Author to whom correspondence should be addressed.
Minerals 2022, 12(12), 1500; https://doi.org/10.3390/min12121500
Submission received: 1 November 2022 / Revised: 18 November 2022 / Accepted: 21 November 2022 / Published: 24 November 2022
(This article belongs to the Special Issue Recent Developments on the Leaching Process of Rare Earth Ore)

Abstract

:
The basic principle of in situ leaching is chemical mining. The process of in situ leaching is to inject leaching solution into the ore body, and the leaching solution is spread in the pores of the mountain. The process is completed by the coupling action of the liquid seepage field and ion exchange reactions. In the production process, only one injection of liquid can be carried out in a certain stope, so it is impossible to improve the injection process and leaching effect through field practice. By simulating the in situ leaching process of rare earth ions, this paper builds the test stope true three-dimensional numerical model and simulates the leaching process of rare earth ore under the coupling of seepage control, ion exchange, and dilute material transfer in porous media. The migration rule of RE3+ and Mg2+ in stopes was analyzed to evaluate the leaching effect. It is of great significance to increase the recovery rate of rare earth ore.

1. Introduction

Ionic rare earth minerals in South China mainly occur in the clay minerals of the weathered granite layer in the form of water-bound cations or hydroxy water-bound cations. Rare earth element distribution detection shows that the content of heavy rare earth elements is relatively high, which has great potential for development and utilization and has high mining and application value [1]. At present, the in situ leaching process is widely used in the extraction of ionic rare earth ore. Compared with mining technologies such as pool leaching and heap leaching, in situ leaching has the advantages of higher efficiency, lower cost, and relatively small environmental damage [2]. In this paper, magnesium sulfate is used as the leaching agent for the in situ leaching of ionic rare earth ore. During this leaching process, the MgSO4 solution enters into the pores of the ore body through the injection hole and chemically displaces the rare earth ions on the ore surface. Realizing the replacement of the rare earth ions, it percolates out of the ore soil with the solution after reaction. The leaching rate of rare earth ions is not only related to the seepage of the leaching agent and the migration of ions, but it is also closely related to the ion exchange reaction on the surface of the ore particles [3,4,5,6]. Therefore, the leaching process of rare earth ions can be regarded as the coupling process of seepage, the exchange reaction, and ion migration. The specific process of ionic rare earth leaching is as follows: The MgSO4 solution reaches the outer surface of the particle liquid film through seepage, and Mg2+ passes through the liquid film layer to the outer surface of the particle (external diffusion); the Mg2+ in the MgSO4 solution contacts the clay particle surface of the rare earth ore body through diffusion (inner diffusion). Then, the chemical replacement reaction occurs with the rare earth cation adsorbed on the surface of the clay particles in the ore body, and Mg2+ replaces the rare earth cation adsorbed on the ore particles. After the chemical replacement reaction between the rare earth cation and Mg2+, the rare earth cation is resolved from the surface of the ore particle (internal diffusion), while Mg2+ is adsorbed to the surface of the ore particle. The exchanged rare earth cations enter the mother liquor of ore leaching (external diffusion) through diffusion and exude the ore body with the mother liquor. In this way, the leaching process of ionic rare earth ions can be completed by repeating the above five steps [7,8,9]. The replacement, diffusion, and migration of rare earth ions by magnesium ions are shown in Figure 1. The dark green part in the center of the model represents the core of the particle, the light green part in the secondary outer ring represents the solid film layer, and the brown part in the outermost ring represents the liquid film layer; the movement of these three kinds of ions in the rare earth leaching process is along the direction indicated by the arrows in Figure 1. During the subsequent exchange reaction, magnesium ions reach the adsorption surface of the rare earth ions only through diffusion through the magnesium ion adsorption solid film layer and exchange with rare earth ions.
Many scholars have studied the ore body leaching process and have analyzed the leaching process and mechanism by using numerical simulation methods. Wu et al. [10] proposed a fully coupled flow-reaction-deformation-mass transfer model. The variation law of porosity, the saturation of the heap-leached body, the distribution of the leaching agent concentration, and the leaching ion concentration were studied under the condition of one-dimensional constant head. According to the mass conservation of the liquid and solute and the influence of consolidation on soil, Liu et al. [11] established a coupled mathematical model of seepage, reactivity, and stress and analyzed the distribution and time evolution of the seepage field, stress field, and concentration field under different conditions of injection hydraulic pressure, axial pressure, and confining pressure. Hu et al. [12] studied the solid-phase exchange of rare earth ions using the Kerr model, the Vanselow model, and the Gapon model and compared the simulation results and experimental data under the three different modes and found that the Kerr model could better represent the rule of rare earth ion exchange. Long et al. [13] used the convection–diffusion equation to describe solute migration in the one-dimensional ionic rare earth column leaching experiment and analyzed the influence of different concentrations of leaching agents on the leaching rate of rare earth ions.
Zhang et al. [14] studied the distribution and migration law of the N element in the surface water of Linqing City and used Visual MODFLOW, a visual groundwater numerical simulation software, to conduct a dynamic simulation of the groundwater of Linqing city. Combined with the actual situation of Linqing city, Chen et al. [15] studied the control effect of groundwater permeability on groundwater pollution control by simulating the barrier effect of different pollution control and prevention methods on COD pollution in different rock strata. Xi et al. [16] used GMS to analyze the spatial structure of groundwater in the Haikou area. By analyzing the comprehensive exploration and drilling data of sea sand mining in the north of the South China Sea, a three-dimensional geological model of the sea sand ore body was constructed and compared with the ore body resources calculated by the geological block method; the reserves of sea sand could be estimated more accurately, thus providing a basis for the development and management of sea sand resources.
The basic principle of in situ leaching is chemical mining, and the process of this leaching method is to inject leaching agents into the ore body, and the leaching agents are scattered in the pores of the mountain. This leaching process is completed under the coupling effect of the liquid seepage field and ion exchange reactions. In previous simulation studies, only one-dimensional or two-dimensional models or simple local three-dimensional models were constructed, and too many simplifications were made to the models, and even some major factors were simplified. For example, the one-dimensional model cannot evaluate the solute transport effect caused by the multidirectional flow of liquid. In addition, the two-dimensional model assumes that the diameter of the mineral soil particles is the same and the distribution is homogeneous, so the simulation results are far from the actual field, which cannot guide the practice well. In this paper, a true three-dimensional numerical model of the test stope is constructed using the topographic survey map and geological data of the test stope, the in situ leaching process is simulated under saturated conditions based on the coupling of the seepage field and reaction particle bed, and the leaching effect is evaluated, which is of great significance to control the soil and groundwater pollution from rare earth mines and to improve the rare earth leaching rate.

2. Theory and Mathematical Model

Porous Media Seepage Control Equation
The mass conservation equation of the saturated seepage leaching fluid is expressed below [17]:
φ ρ l t = d i v ( ρ l × q l ) + f e x t
where ρ l is the density of the leaching solution, kg/m3; φ is the porosity of the ore body; q l is the seepage velocity of the leaching solution, m/s; and fext is the source and sink term, kg/m3s.
In the saturated state, the pores generated by leaching are filled again with the continuous inflow of the leaching solution during the in situ leaching of ionic rare earth minerals. Thus, fext can be expressed as follows:
f e x t = d i v [ ( φ φ l 1 ) × q l ] × ρ l
According to Darcy’s law, the leaching fluid flow can be expressed as:
q l = k μ ( P x i ρ l g h x i )
where k is the permeability of the ore body, m2/s; μ is the viscosity of the leaching solution, pas; P is the head pressure, Pa; xi is the hydraulic gradient; g is the acceleration of gravity, m/s2; and h is the elevation, m.
Combined with the Carman-Kozeny equation:
k = 36 φ 3 ( 1 φ 2 ) × r 0 2 × τ
where r0 is the effective particle size, m, and τ is the tortuosity.
The migration process of the leaching agent and rare earth ions in the ore body is mainly affected by leaching solution seepage, ion exchange reactions, ion diffusion, and dispersion. The mass balance equation of reactive ion migration can be expressed as:
φ C 1 t + d i v ( q l × C 1 ) = d i v ( J d i f + J d i s ) + q 1 + R 1
[ φ C 2 + ( 1 φ ) ρ s G ρ l ] t + d i v ( q l × C 2 ) = d i v ( J d i f + J d i s ) + q 2 + R 2
Diffusion is a process in which ions and molecular species dissolved in water migrate from regions with a high concentration (i.e., high chemical activity) to regions with a low concentration. According to Fick’s law, the diffusion flux of solute in water can be described as follows.
J d i f = φ τ D 0 C
where τ is the tortuosity; D0 is the liquid diffusion coefficient, m2/s; and C is the concentration of the leaching agent or leaching mineral ion, mol/m3.
The effect of the diffusion process is to dilute the solute and reduce its concentration. The dispersion of solutes in porous media can also be described by Fick’s law:
J d i s = [ ( α L | q l | + ( α L α T ) q l × q l t | q l | ) ]
where αL and αT are the longitudinal and transverse dispersion, m, and q l t is the transverse Darcy flow, m3/s.
The leaching agent injection rate q1 and the mineral ion exudation rate q2 can be expressed as:
q 1 = d i v ( C 0 × v 1 )
q 2 = d i v ( C 3 × v 2 )
where C0 and C3 are the initial concentration of the leaching agent and the leaching rare earth ion concentration, mol/m3, respectively, V1 and V2 are the normal leaching agent rate and the normal leaching rate of rare earth ions, m/s.
According to the above conclusion for the leaching kinetics of MgSO4, the leaching of natural rare earth particles is a process controlled by external diffusion and mixing. Research shows that the depth of the “surface region” (liquid film layer) is not more than 5 nm, which is mainly affected by the diffusion rate of Mg2+ and rare earth ions in the leaching solution.
Combined with the kinetic equation of rare earth ions mentioned above, leaching agent consumption and the leaching rate of mineral ion formation can be expressed as:
R 1 = d i v [ D × C 1 r 0 ( 1 α ) 1 3 r 0 ( 1 α ) 2 3 ]
R 2 = d i v [ 2 D × C 1 3 r 0 ( 1 α ) 1 3 r 0 ( 1 α ) 2 3 ]

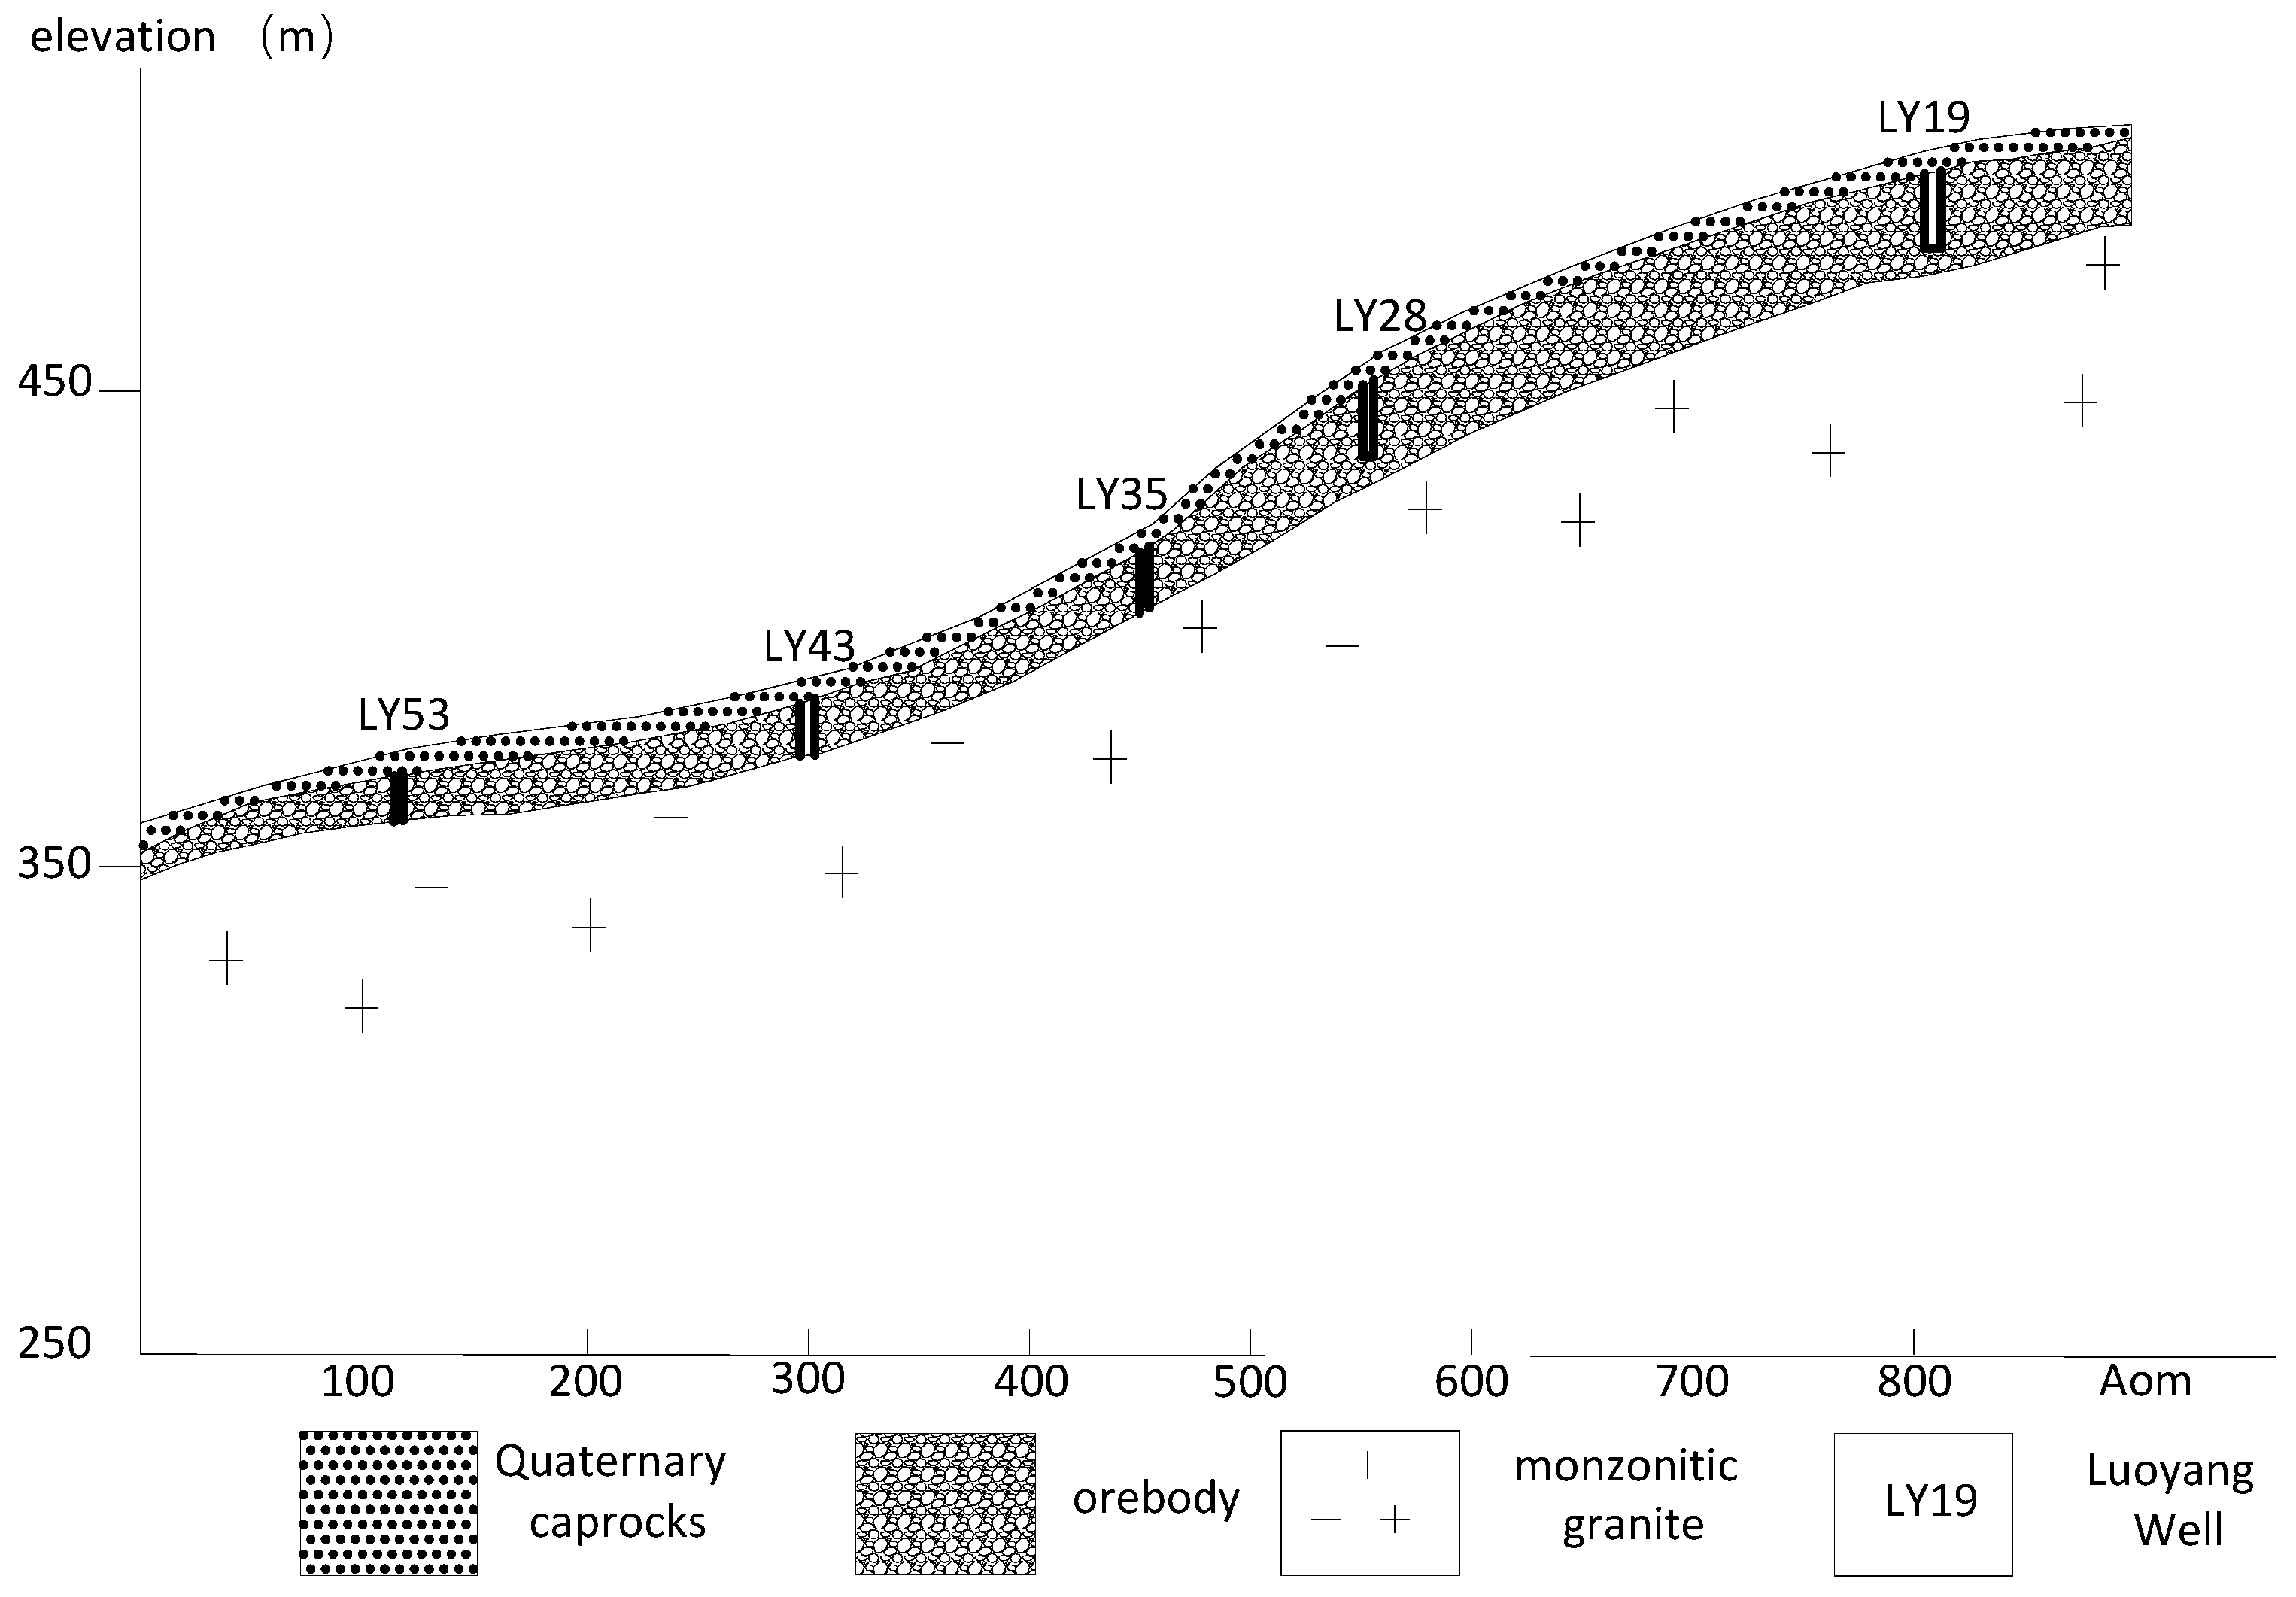
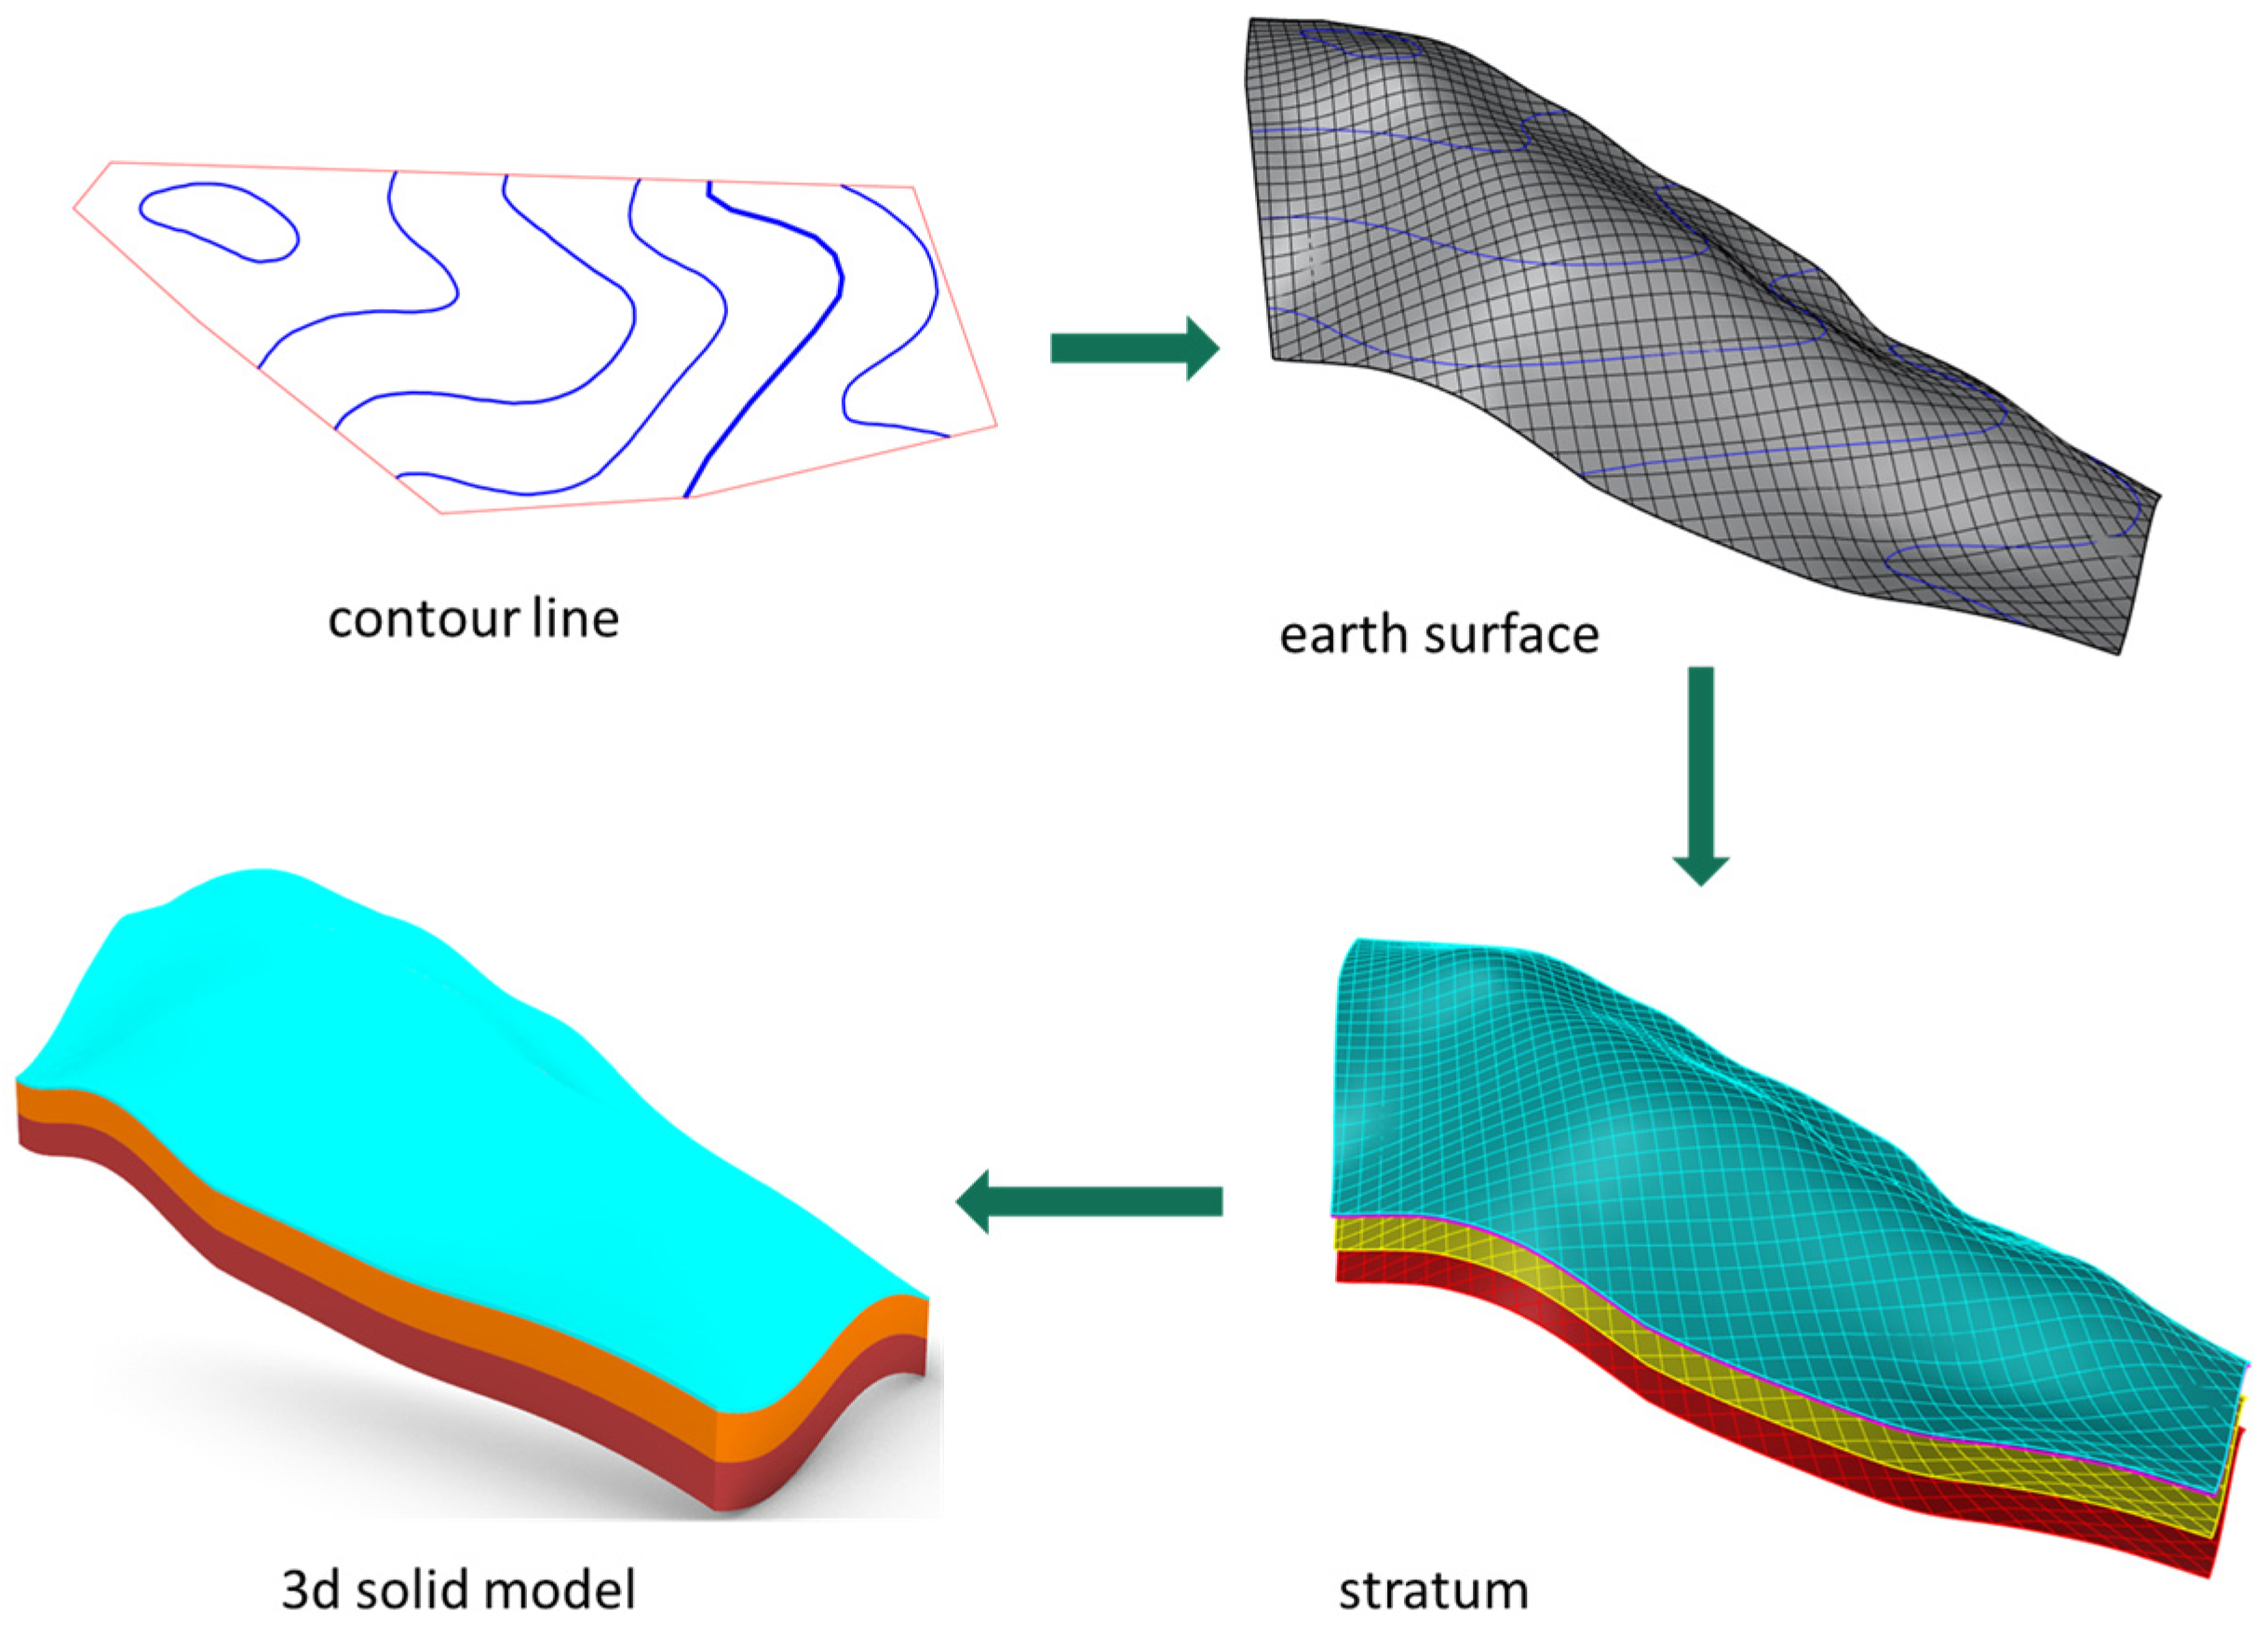
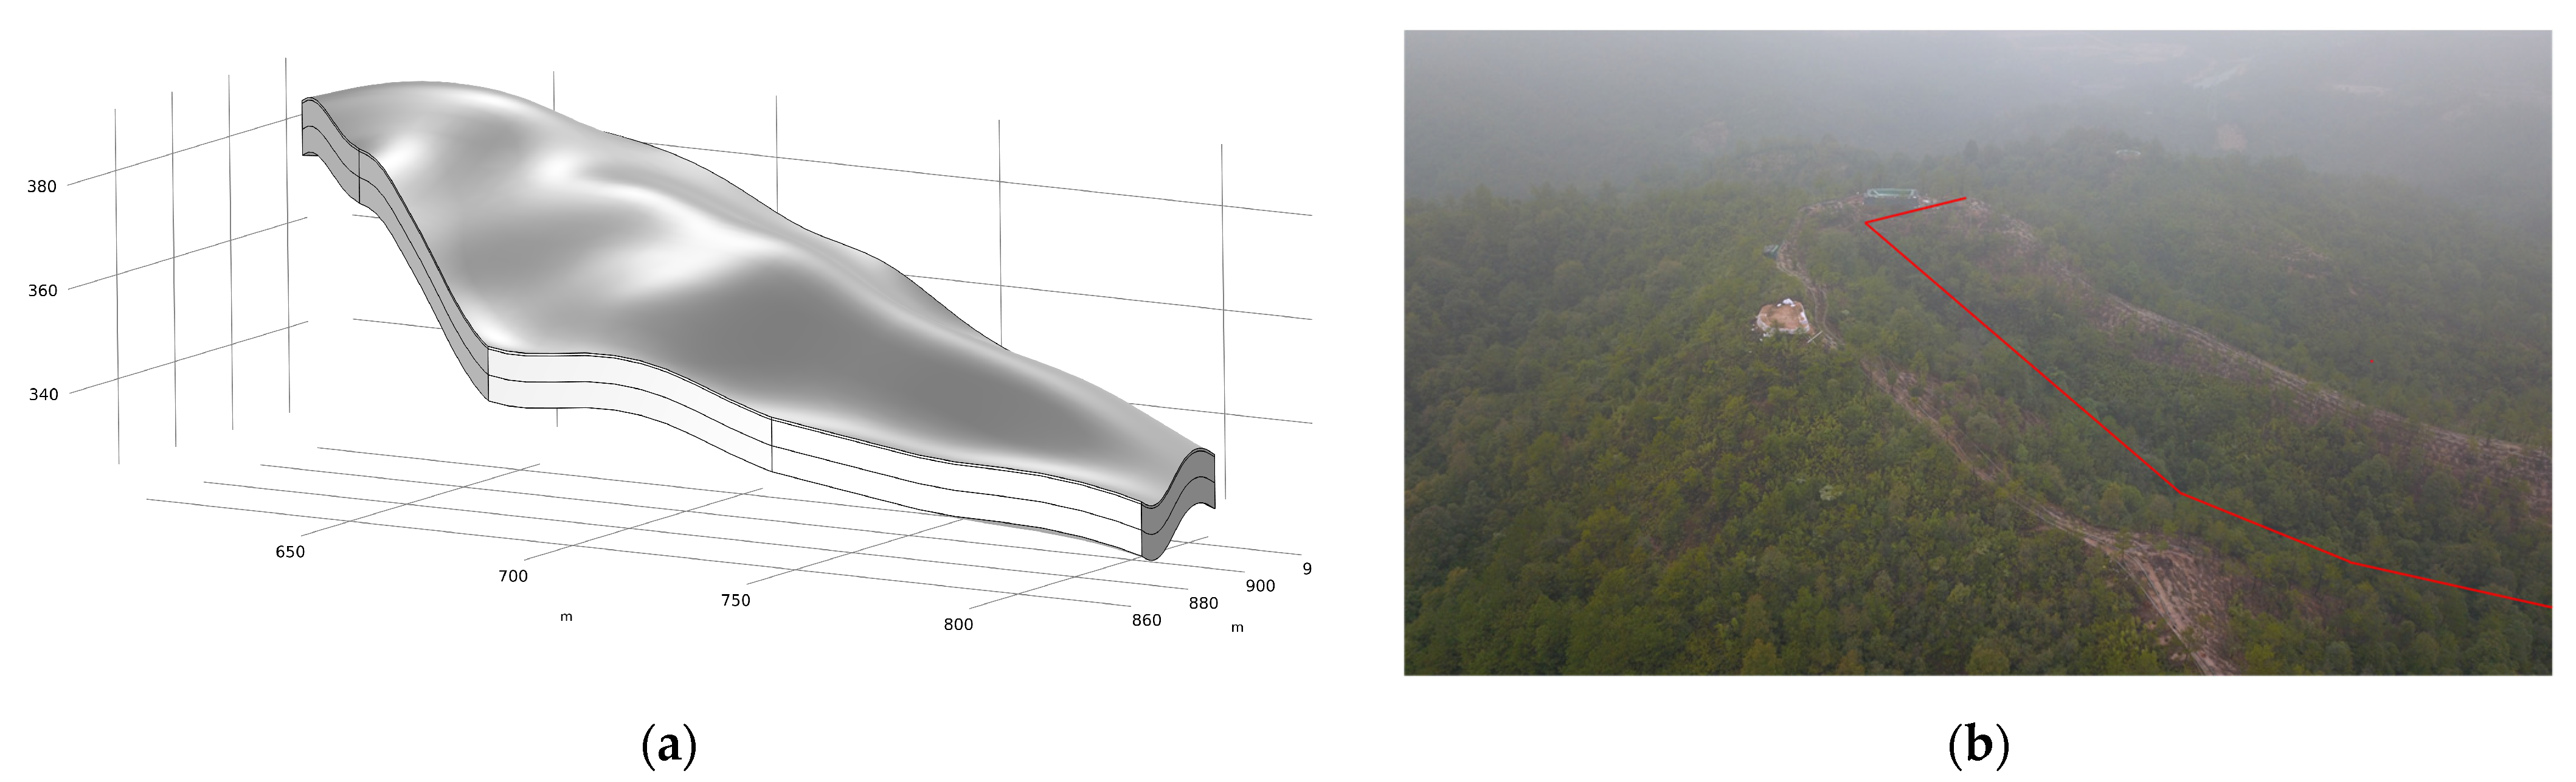
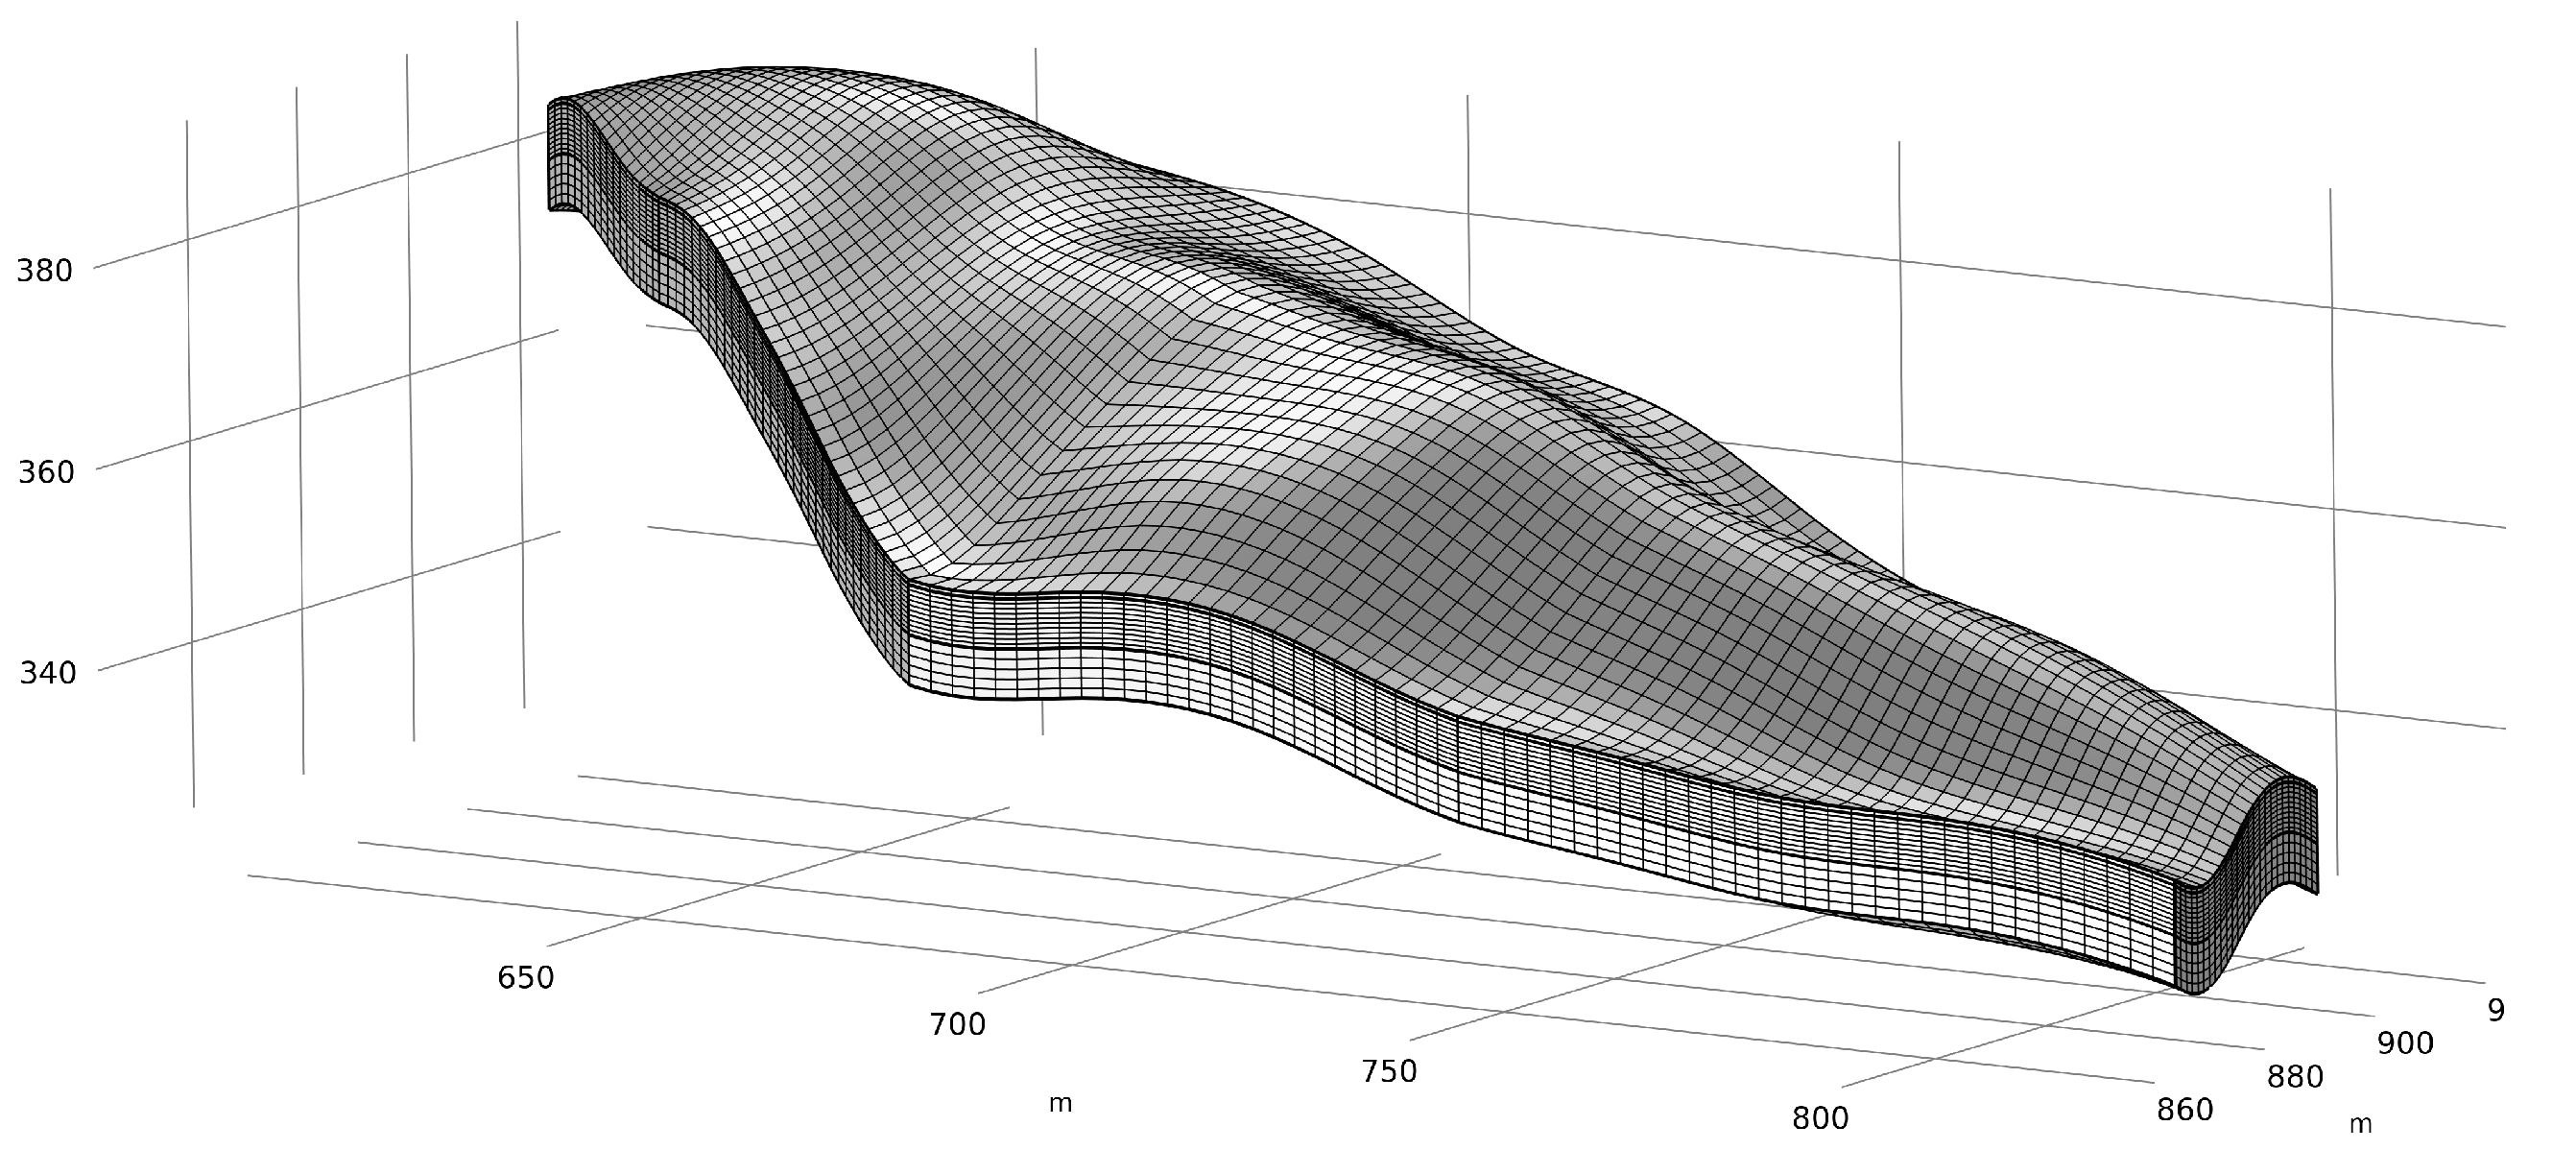
3. Test Stope Strata Overview

The Zudong test stope is a broad-leaved mountain with a gentle terrain; the main ridge is north-south, the weathering crust is developed, and the bedrock is exposed [18]. The overall shape of the ore body is relatively simple, as shown in Figure 2. Each section of the ore body is cap shaped, the ore body is inclined from the middle to the surroundings, and the slope of the ore body along the ridge is generally between 5° and 10°. The ore body on the slope has a great inclination, most of which is between 20° and 30°, and some of the slope angles of the ore body even reach 40°. The completely weathered layer of granite in the mining area is all or part of the ore body, which indicates that the distribution of the ore body is consistent with that of the completely weathered layer of the completely weathered granite, and the distribution is planar.
Due to the difference in the weathering intensity and the impact of landforms, the weathered crust soil layer in the mining area is specifically presented on the vertical section, which is divided into the topsoil layer, the ore-bearing layer, and the semi-weathered layer from top to bottom. Although the structure and material composition of each layer of rock are different, they are not obvious. The layered profile is shown in Figure 3. There is no obvious boundary between all levels, and the transformation is gradual.
(1)
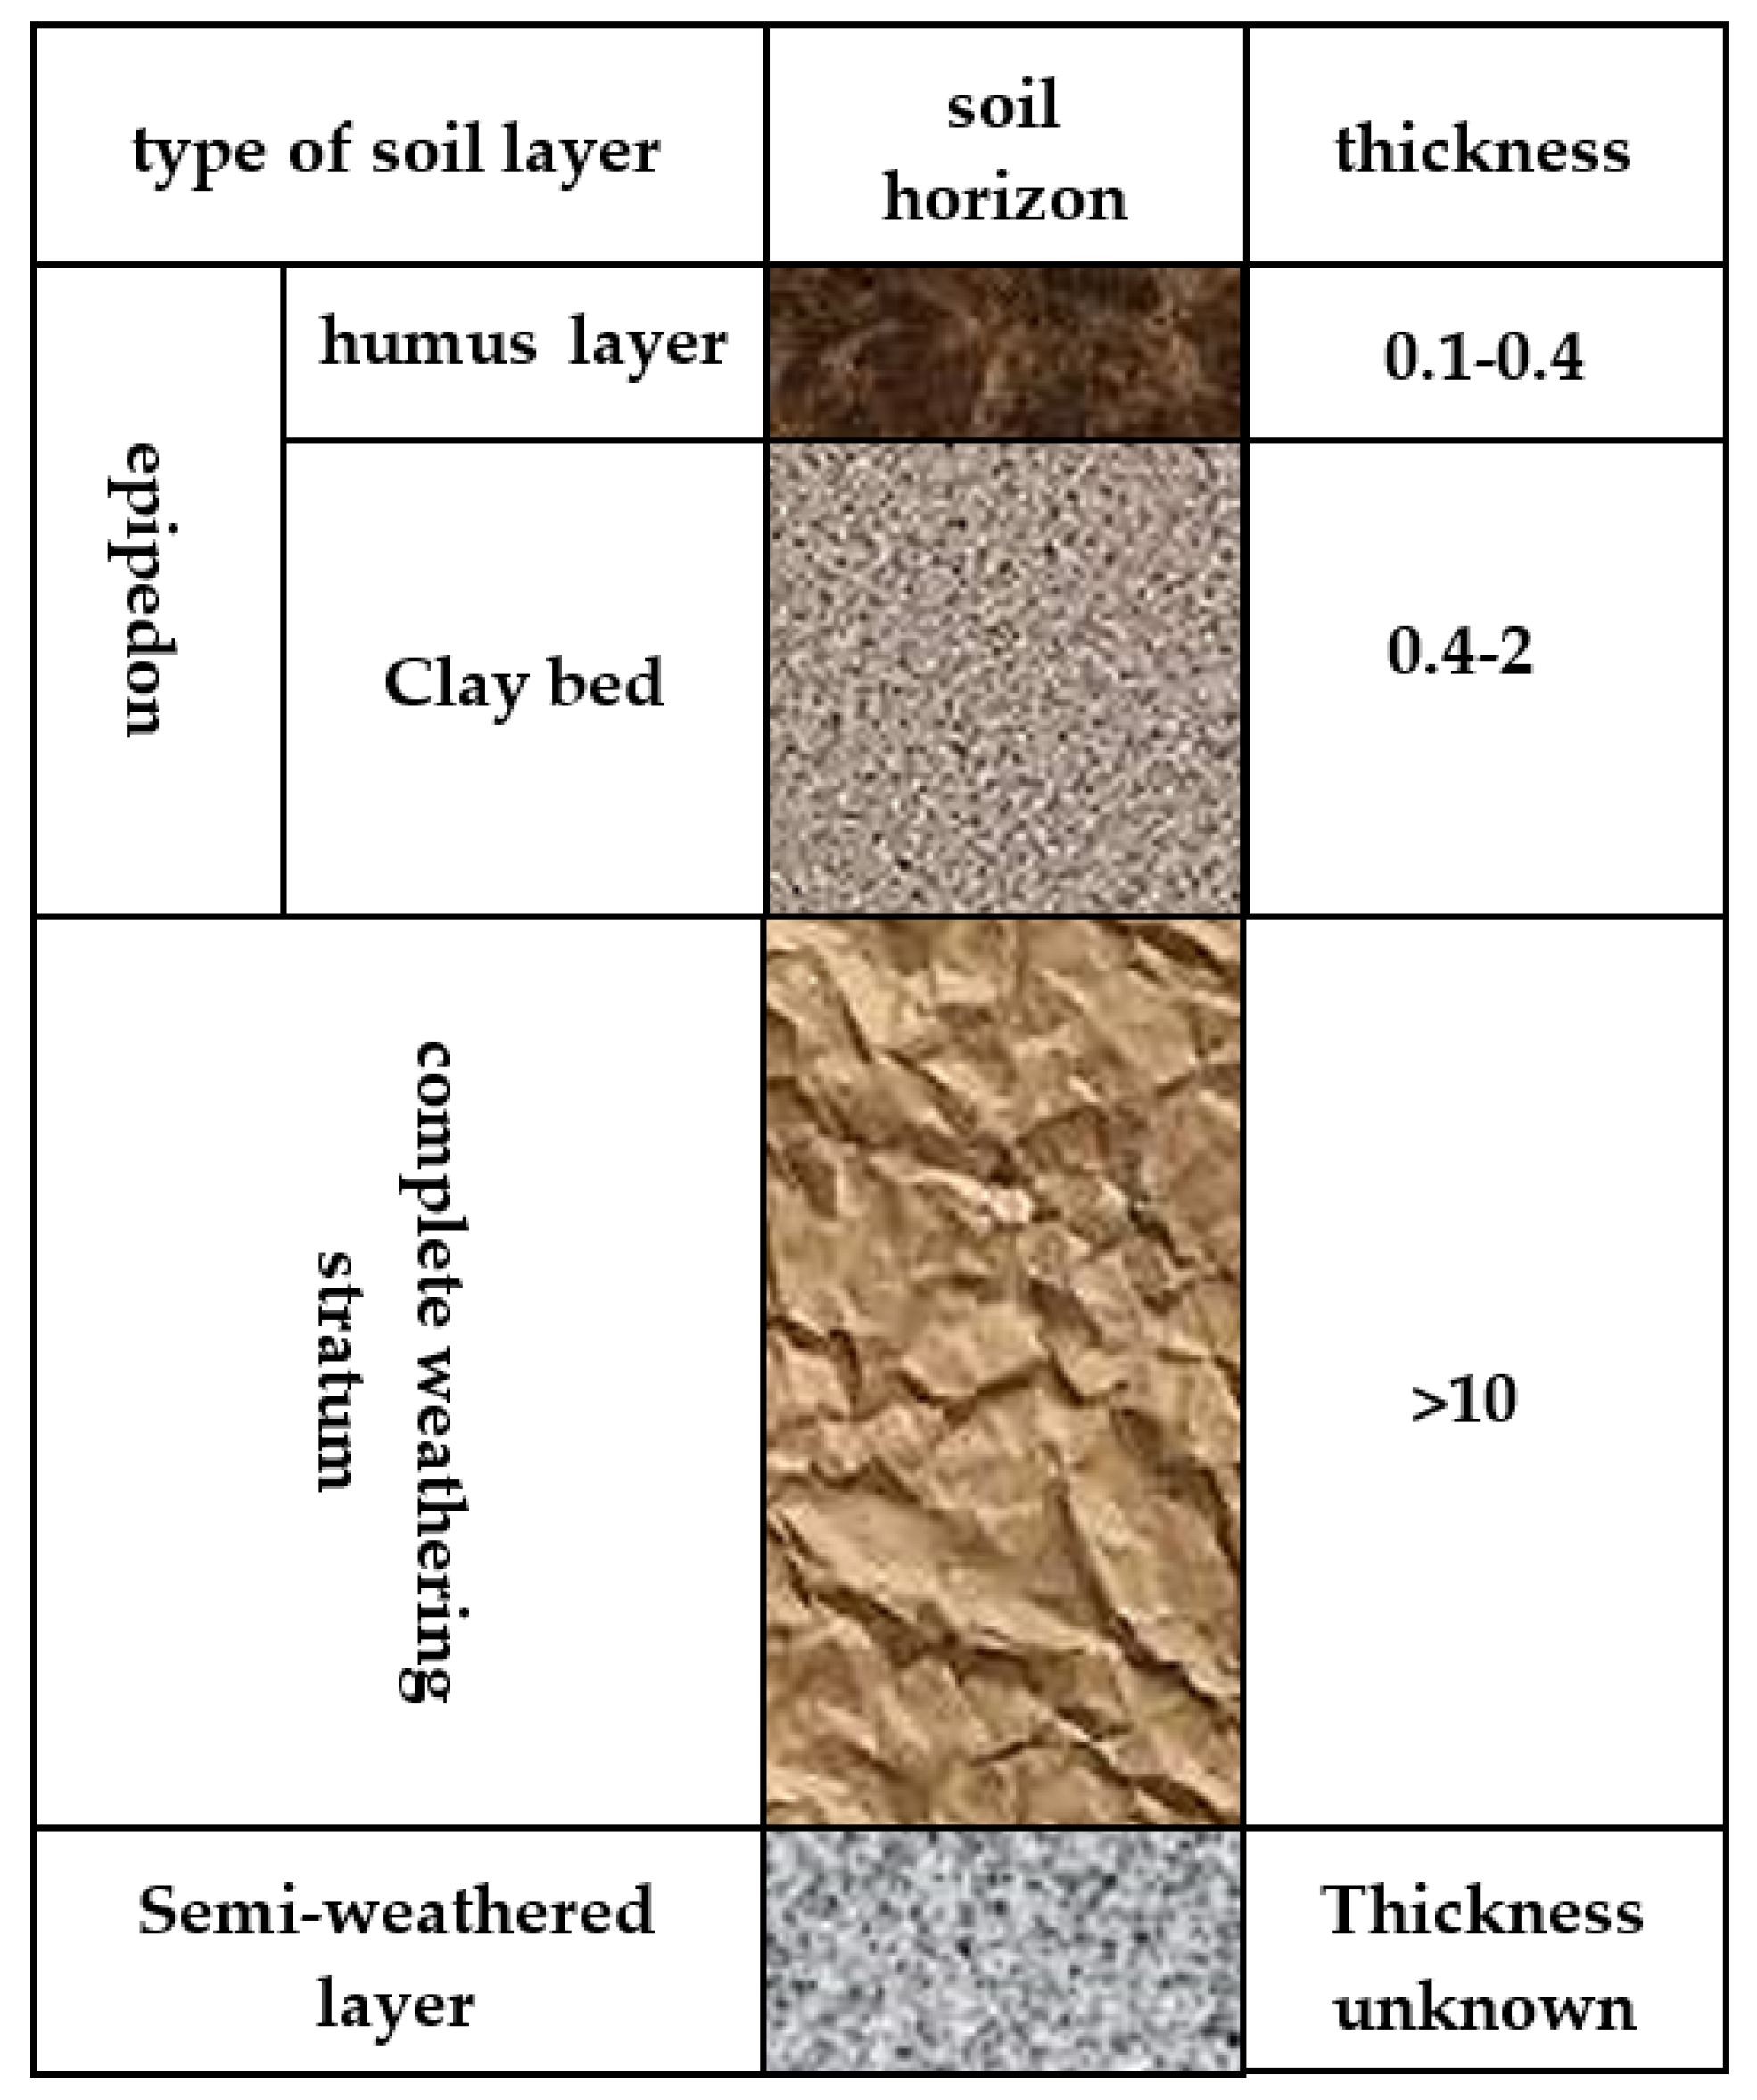
Topsoil layer: humus soil is gray black or gray green with a loose structure; sub-clay soil, sub-sandy soil, and humus soil can be seen with a soil thickness of 0.1–0.4 mm. Beneath the humus is a red clay layer with some granite, quartz, and other debris, about 0.4–2.0 m thick. On the whole, the thickness of the topsoil is thinner on the ridge and side of the mountain. The thickness of the topsoil on the slope body is 0.1–0.6 m and that on the foot of the mountain is 1–2 m.
(2)
Completely weathered layer: the thickness of the completely weathered layer is more than 10 m, which is brick red, yellowish brown, earth yellow, and a small amount of the mineral soil is grayish white with a uniform texture and a loose structure, leading to the decomposition of rock minerals. The quartz particle size is generally 2–6 mm, and some is 1–1.5 mm, which is gray white. Most of the biotite has iron precipitation, and some had been converted to muscovite by rock alteration. Microfractures are well developed and often filled with clay minerals. The thickness of the upper and lower parts of the mountain is larger, and the thickness of the soil layer at the foot of the mountain is thinner. The ion phase grade of rare earth ions is in the range of 0.007%–0.103%, mainly distributed under the middle, upper, and surface soil, and the thickness is about 5 m. The thickness of the completely weathered layer is relatively large, the distribution is relatively loose, the weathered layer has many cracks, and the rock is broken. When site leaching is carried out, once the groundwater and surface water accumulate on the slope, slope instability may occur, resulting in collapses and landslides.
(3)
Granite layer: the thickness of the granite layer is not clear; its color, texture, and structural characteristics are similar to those of the original rock. It is relatively soft, slightly massive, and it is difficult to turn it into powder by hand kneading. The feldspar is mainly of broken grain structure, and some of it has also developed into kaolin. The width of the crack is about 1 mm with iron as the main fissure filling. The number of pieces of the original rock not weathered has increased.

4. Model Establishment and Boundary Conditions

Since the boundaries between the rock layers of the ore body are not obvious, it is impossible to accurately obtain the geological layering contour of each layer. If the tested sample is taken as the boundaries between the layers during each hole exploration, there will be singular values of the stratum thickness, and interpolation cannot be achieved. Even if the interpolation is successful, the complex geological geometry will be constructed, which will lead to errors in the finite element grid division and is not conducive to the grid division and calculations. In this paper, in order to make the numerical model capable of calculations and to reduce the number of calculations, the model was simplified within a reasonable range. According to the size of the ore block, Test Stope 2 was selected as the simulation object. The range coordinates of Test Stope 2 and the 1:5000 topographic and geological maps of the mining area are shown in Figure 4. The red line range is the test stope, the pink line range is the location of the water smelting workshop, and the blue line range is the service range of the water smelting workshop.
As in the actual liquid injection process, the bottom of the valley will not be injected. Therefore, in Figure 4, based on the inflection point of Stope 2, the valley bottom was cut off in combination with the terrain when establishing the numerical model to obtain the effective liquid injection range. An elevation was attached to the contour line according to the actual elevation to build the surface entity of Stope 2. A 3D modeling software was used to build the interface of each rock stratum according to the average thickness of each rock stratum, with the thickness of the topsoil layer 0.5 m, the ore-bearing layer 5 m, and the fully weathered layer 10 m (including the expanded ore-bearing layer of 5 m). Each rock stratum was connected to form three layers of rock stratum. The modeling process of the test stope is shown in Figure 5.
Figure 6a shows the assembly formed by importing the 3D geometric model of the constructed Test Stope 2 into the COMSOL Multiphysics software (V 5.6, COMSOL Inc., Stockholm, Sweden). An aerial photo of the test stope is shown in Figure 6b. It is obvious that the test stope is very consistent with the established three-dimensional numerical model. The ion exchange reaction and leaching fluid seepage field were coupled to simulate the in situ leaching process of ionic rare earth ions, and the migration and leaching rules of rare earth ions in the ore deposits under the action of the leaching agent were analyzed. As the simulation is of the leaching process at the saturation stage, the seepage field has a steady distribution. In order to save computing resources, the leaching process of 150 days was simulated. The test stope adopted diversion holes, liquid collection ditches, liquid collection wells, and other liquid collection projects to prevent the mother liquor from seeping into the ground and achieved the purpose of intercepting and collecting the liquid. Dense guide holes along the vertical sidewall were arranged above the liquid collecting ditch along the ore body, with hole spacings of 1 m, a hole diameter of 6–10 cm, and a dip angle of 3–5°. The depth of the hole is subject to the ore body width to form a micro negative pressure liquid collection system so that the mother liquid can quickly flow to the liquid collecting ditch through the guide hole. Therefore, the surroundings of the model were set as a flow-free unit, and the lower outlet was set as a pressure boundary condition of 0 Pa.
Therefore, the injection boundary was taken as the upper surface of the model, the liquid injection speed was set as 0.0417 m/d, and the MgSO4 concentration was determined as the optimal concentration of 3% according to the previous study. Through the pumping test and water pressure test in the mining area, the permeability coefficient of the strongly weathered layer was determined to be 0.013–0.19 m/d with an average of 0.16 m/d, indicating that the permeability of the aquifer is poor. Since rare earth mineral soil is a porous medium, the interface of the reaction particle bed in the COMSOL Multiphysics software can be used to simulate the ore-bearing bed. The hexahedral element type was used to grid the model, as shown in Figure 7.
In this simulation, random particles with a particle size of 4 mm were used for filling. The internal sketch of the reaction particle bed is shown in Figure 8, where the yellow balls represent the rare earth particles, and the other three colored balls represent three different ions. Combined with the rare earth grade in the exploration report, the calculated concentration of rare earth ions on the particle surface is 2.136 mmol/m2. Through the “reaction particle bed” program interface, the “surface reaction” module in the COMSOL software was used to simulate and calculate the surface material reaction. This module can be called at the rare material transfer interface and the porous medium rare material transfer interface [19,20,21,22]. In the rare earth leaching simulation, based on the previously established “shrinking core model”, it was assumed that the surface material rare earth ions were adsorbed on the surface of the mineral soil particles. By modeling the surface material reaction of ion exchange of the Mg2+ leaching and coupling the saturated seepage field of the leaching solution, the leaching process of rare earth mines was simulated [23,24,25].

5. Results and Discussion

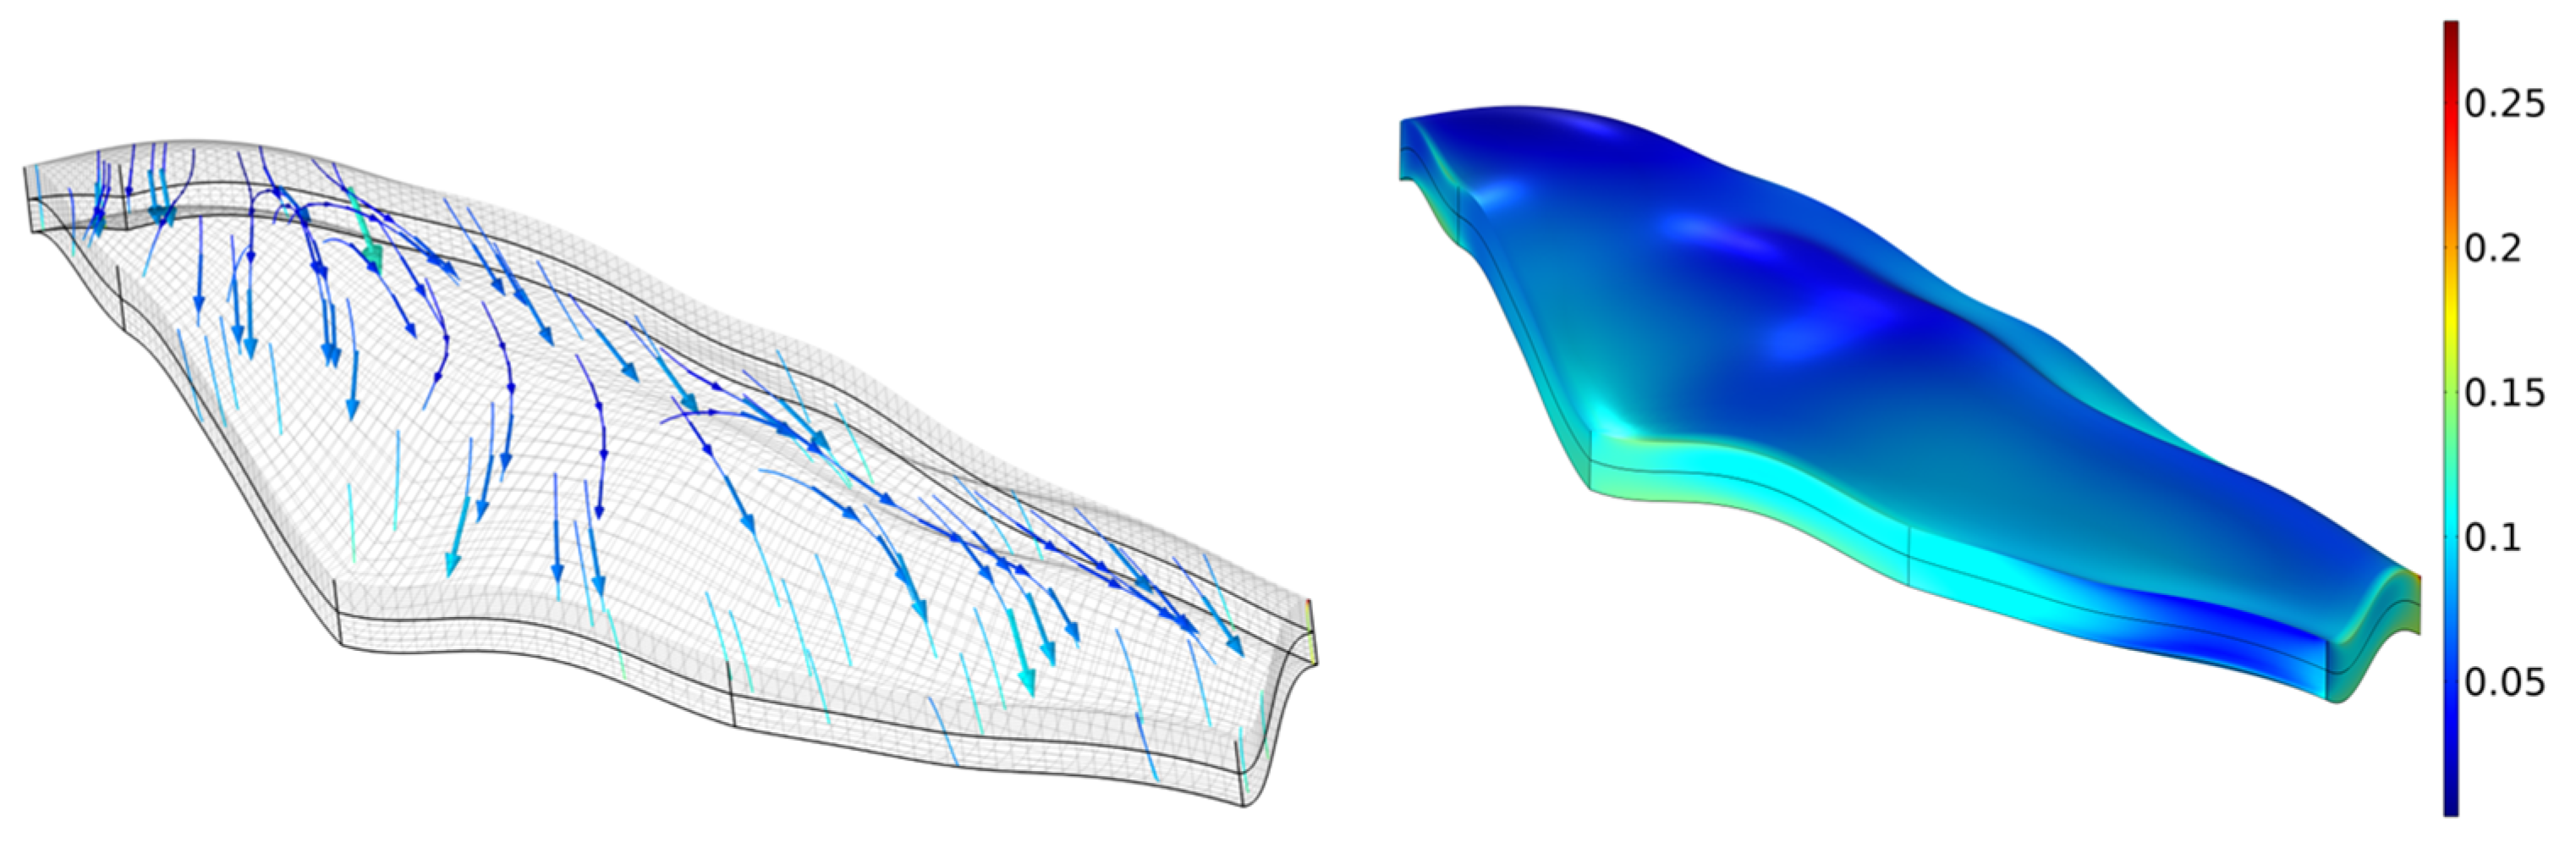
5.1. Analysis of Saturated Flow Field of Ionic Rare Earth Ore

The arrows in Figure 9, Figure 10 and Figure 11 represent the velocity vectors of the saturated steady-state flow field, and the cloud image represents the velocity distribution of the saturated steady-state flow field. The flow of the leaching fluid is greatly affected by topography. With the liquid injection in the test stope, the whole stope tends to be a steady-state flow field, as shown in Figure 9. As this slope is gentle and has only one profile, there is no middle depression valley terrain. Therefore, the steady flow field is relatively regular, mainly under the effect of gravity, and flows to the location with a lower elevation. The flow field of each layer is scattered from the ridge to both sides, which leads to the nonuniformity of ore leaching. Some locations will react faster because there is more ore leaching liquid passing through. As a result, the ion exchange and the leaching process are completed earlier in this local area.
The maximum velocity of this steady-state flow field is located at the topsoil concavity, with a value of 1.6 m/d, and the injection intensity is only set to 0.0417 m/d. According to the flow field diagram, the injected liquid converging at the concavity through the topsoil under the action of gravity increases the water head at this position and increases its infiltration velocity. As the seepage coefficient of the topsoil is 3.43 m/d, the obstruction of the solution flow in the topsoil is very small, so the above phenomenon is formed. The steady-state flow field of the ore-bearing layer is shown in Figure 10. The maximum flow velocity of the ore-bearing layer is 0.28 m/d, which is also greater than the set liquid injection intensity indicating that due to the influence of topography, liquid agglomeration is formed in some part of the topsoil, which increases the water head at this position. The steady-state flow field of the non-ore-bearing layer is shown in Figure 11. The maximum velocity of the non-ore-bearing layer is 0.16 m/d, and the maximum velocity appears at the edge of the low concave. This is because this is the fluid boundary. Even if the water flow gathers here, it is located at the lower part of the ore-bearing bed, and its water head will inevitably produce a large loss, so its maximum flow velocity is smaller than that of the ore-bearing layer.
The velocity distribution of the saturated stable flow field in different directions on the vertical section of the ore body is shown in Figure 12. It is clear that the flow rate at the top of the mountain in the red circle is low, which will make it difficult for the ore body at the top of the mountain to realize complete leaching. Therefore, in order to ensure that this part of rare earth can be recovered and improve the recovery rate of rare earth, the top of the mountain should be injected first to increase the injection time, or the liquid injection hole at the top of the mountain should be densified to increase the liquid injection volume per unit area.

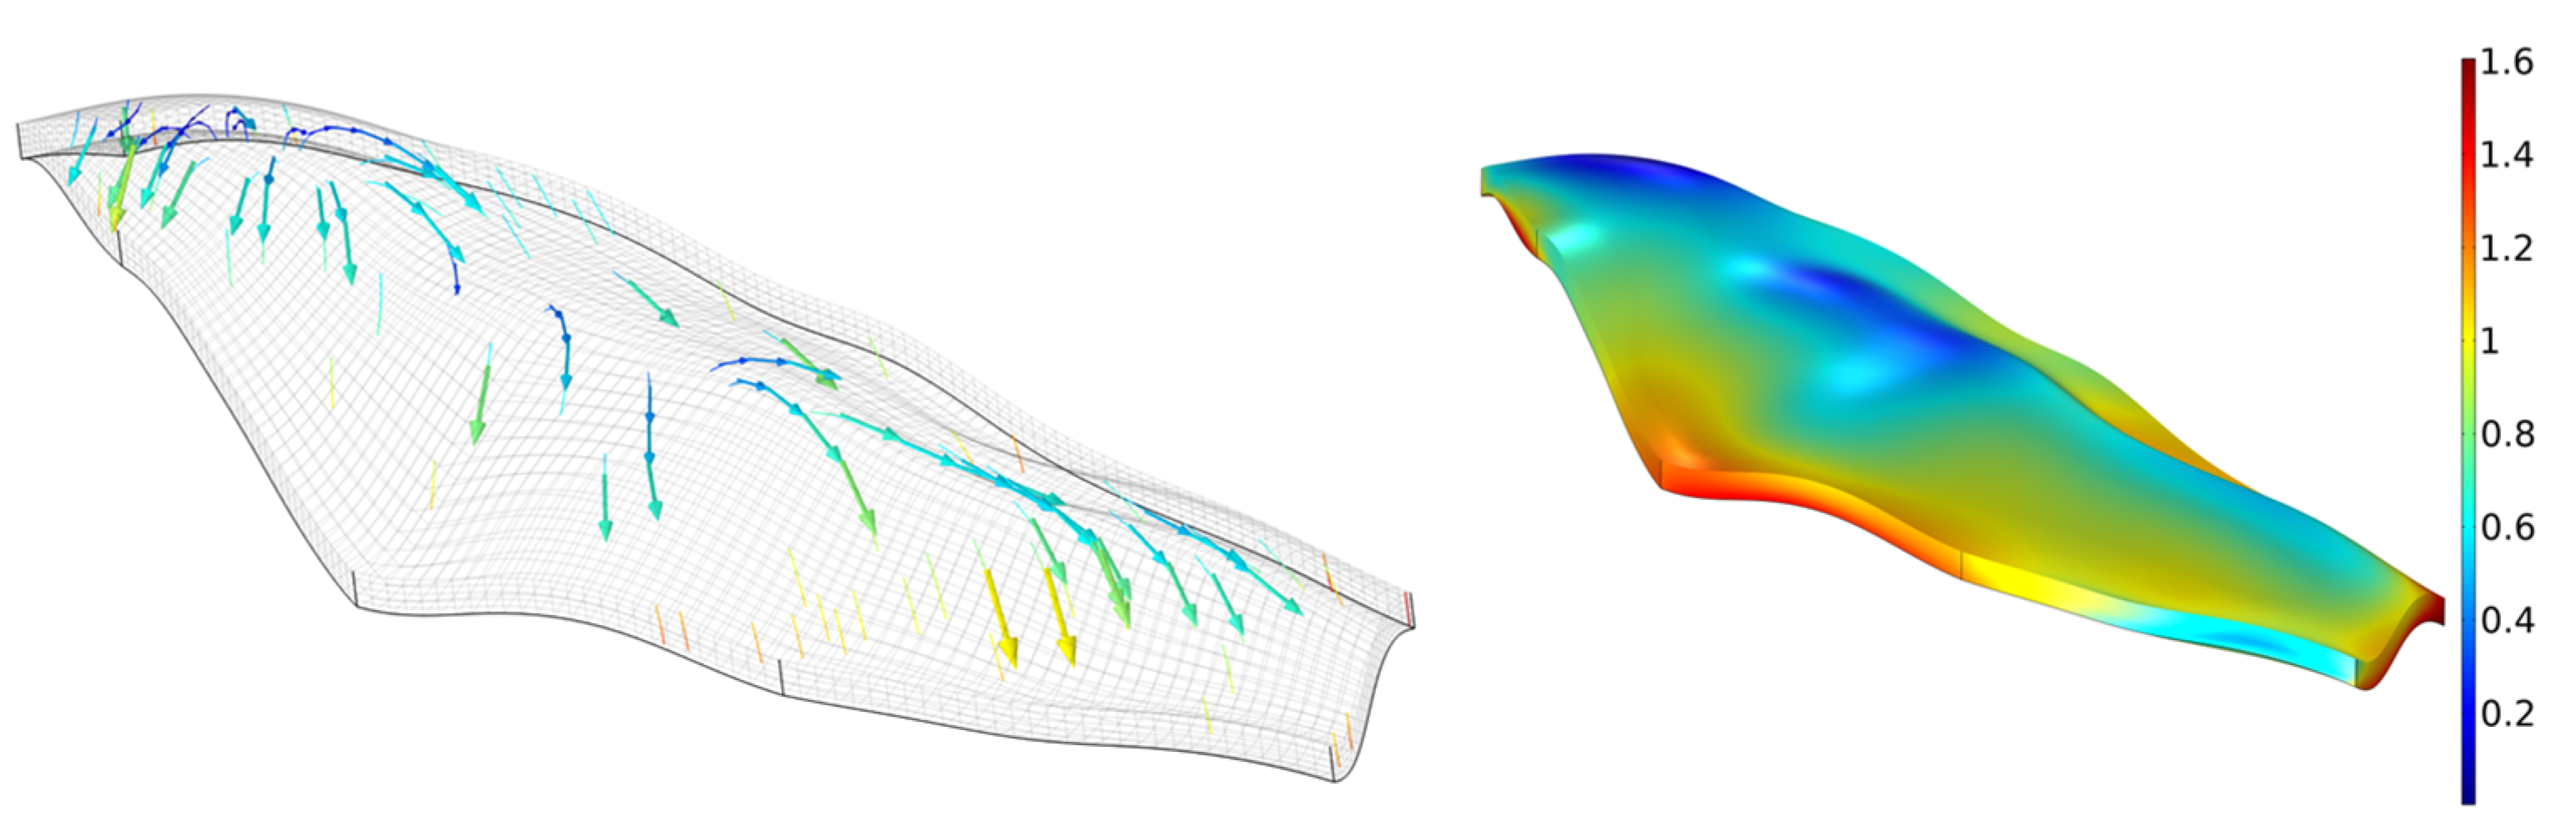
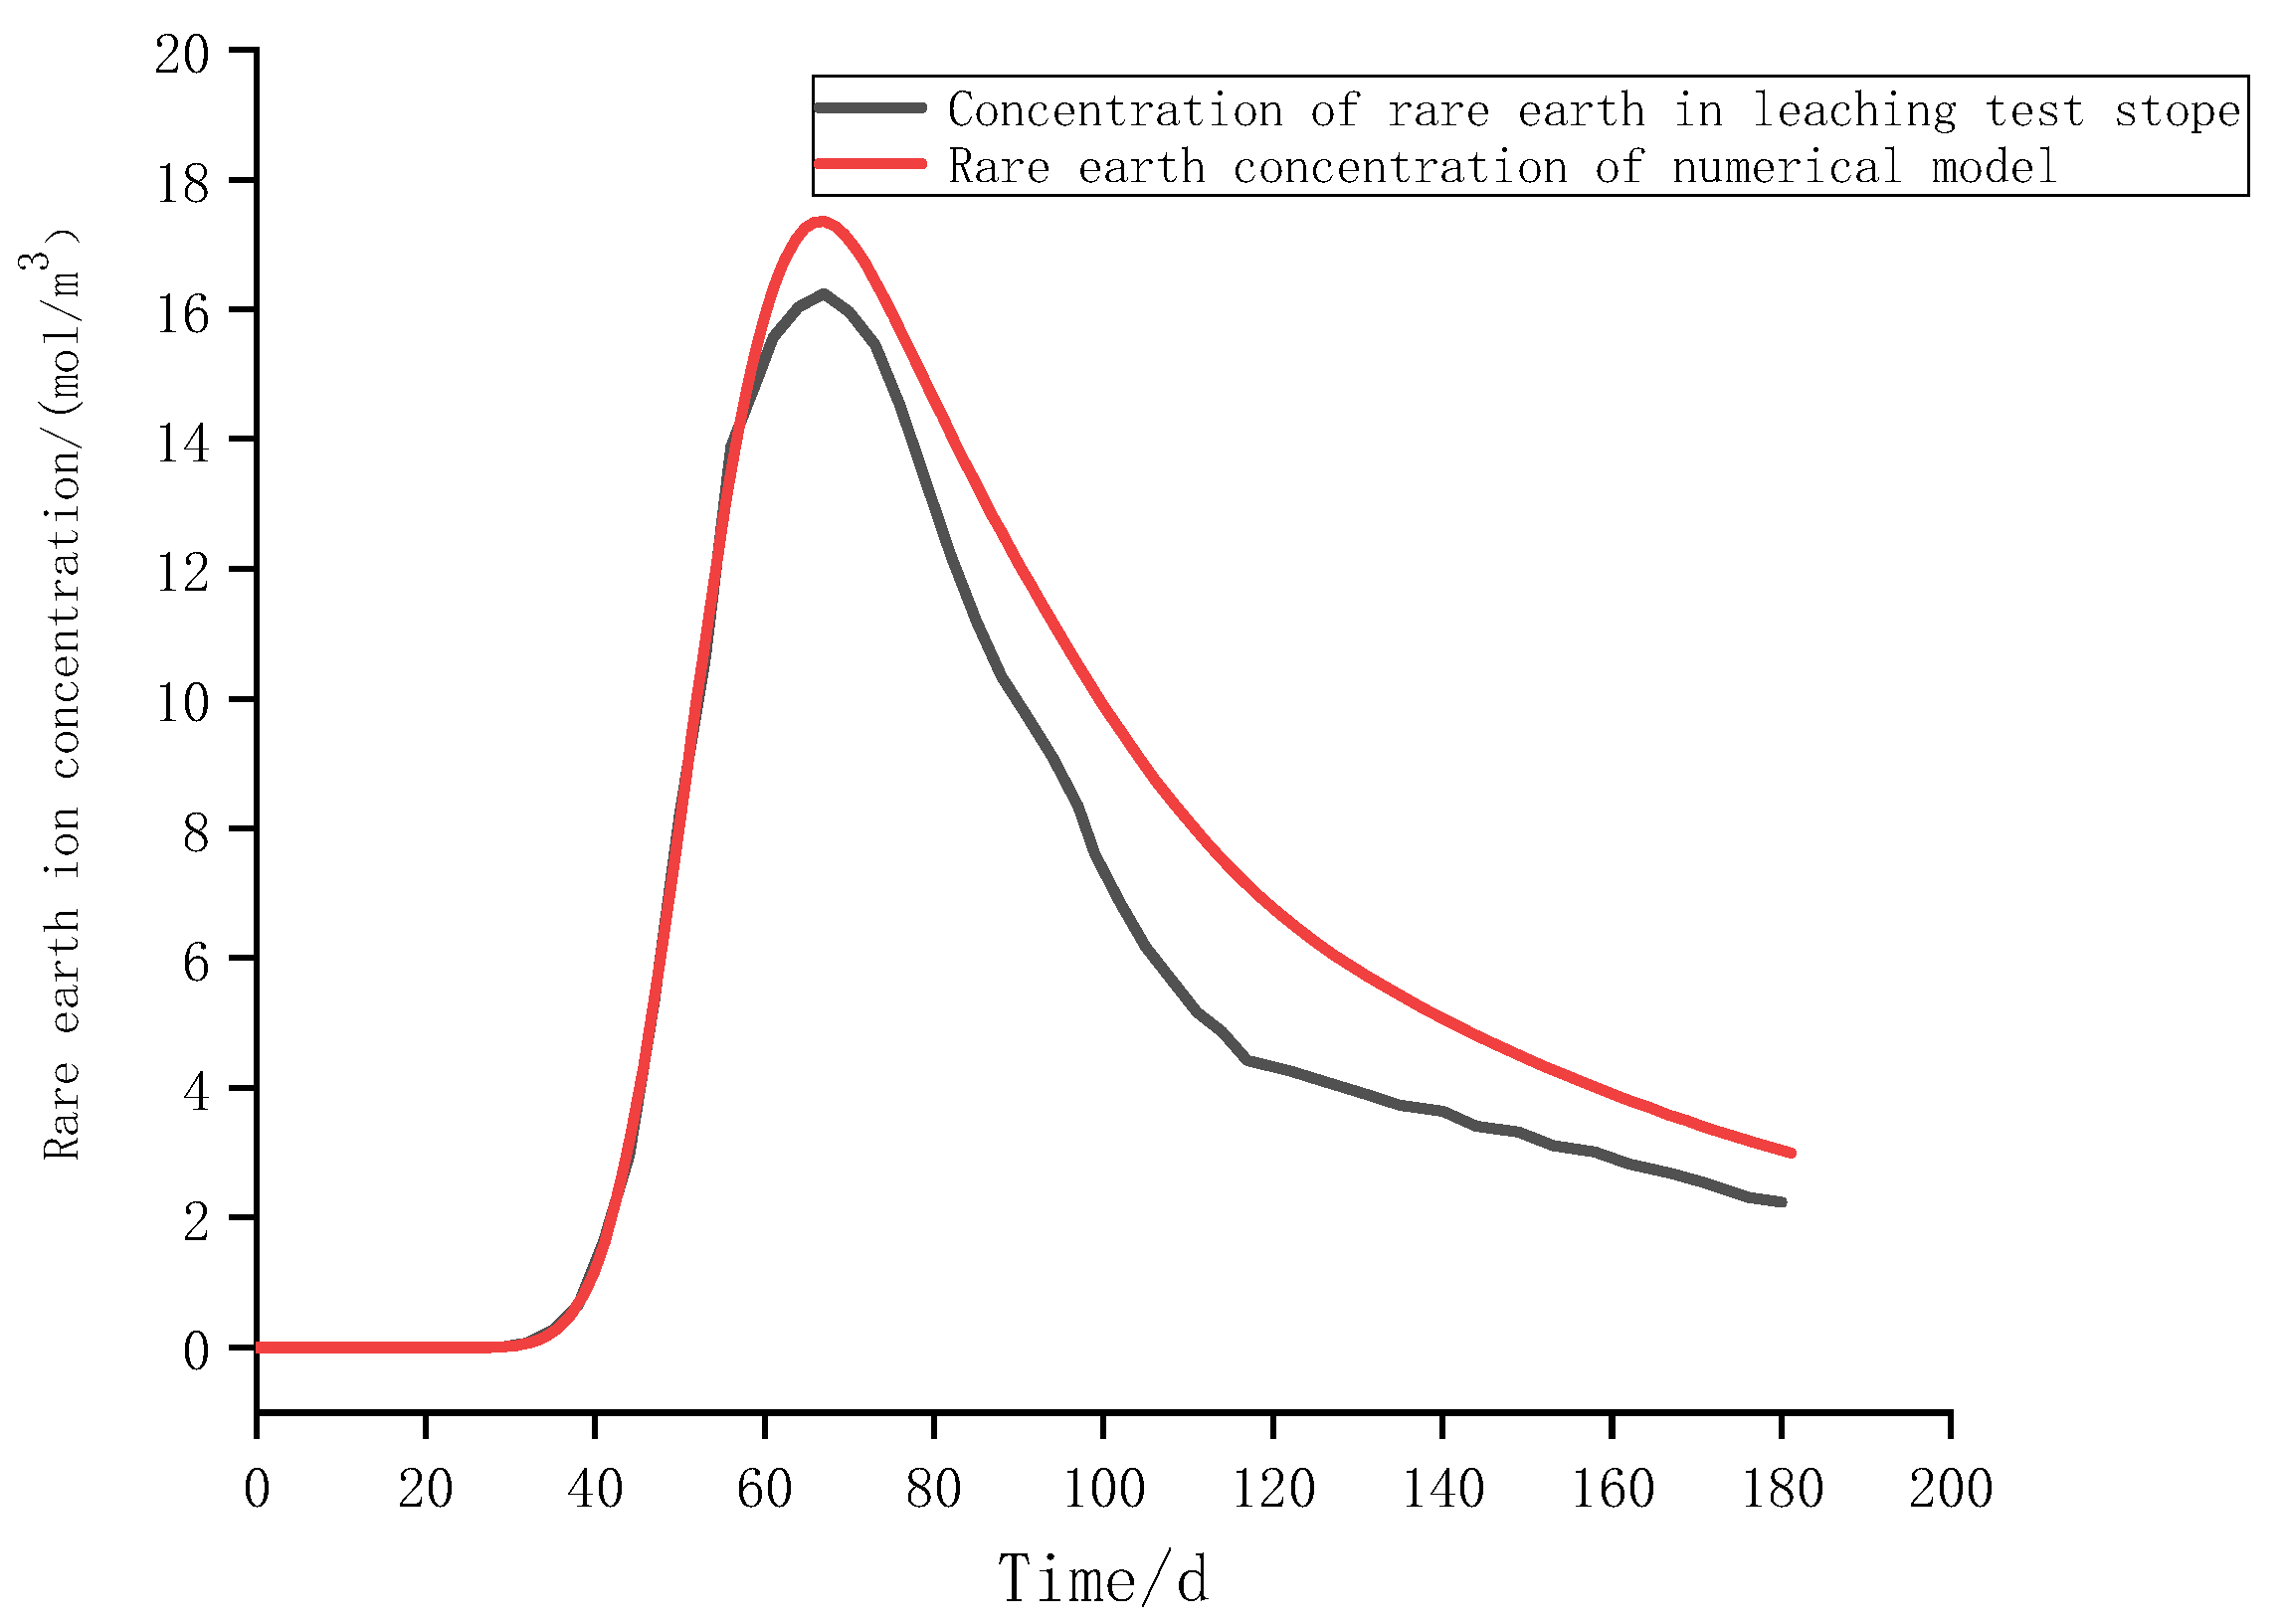
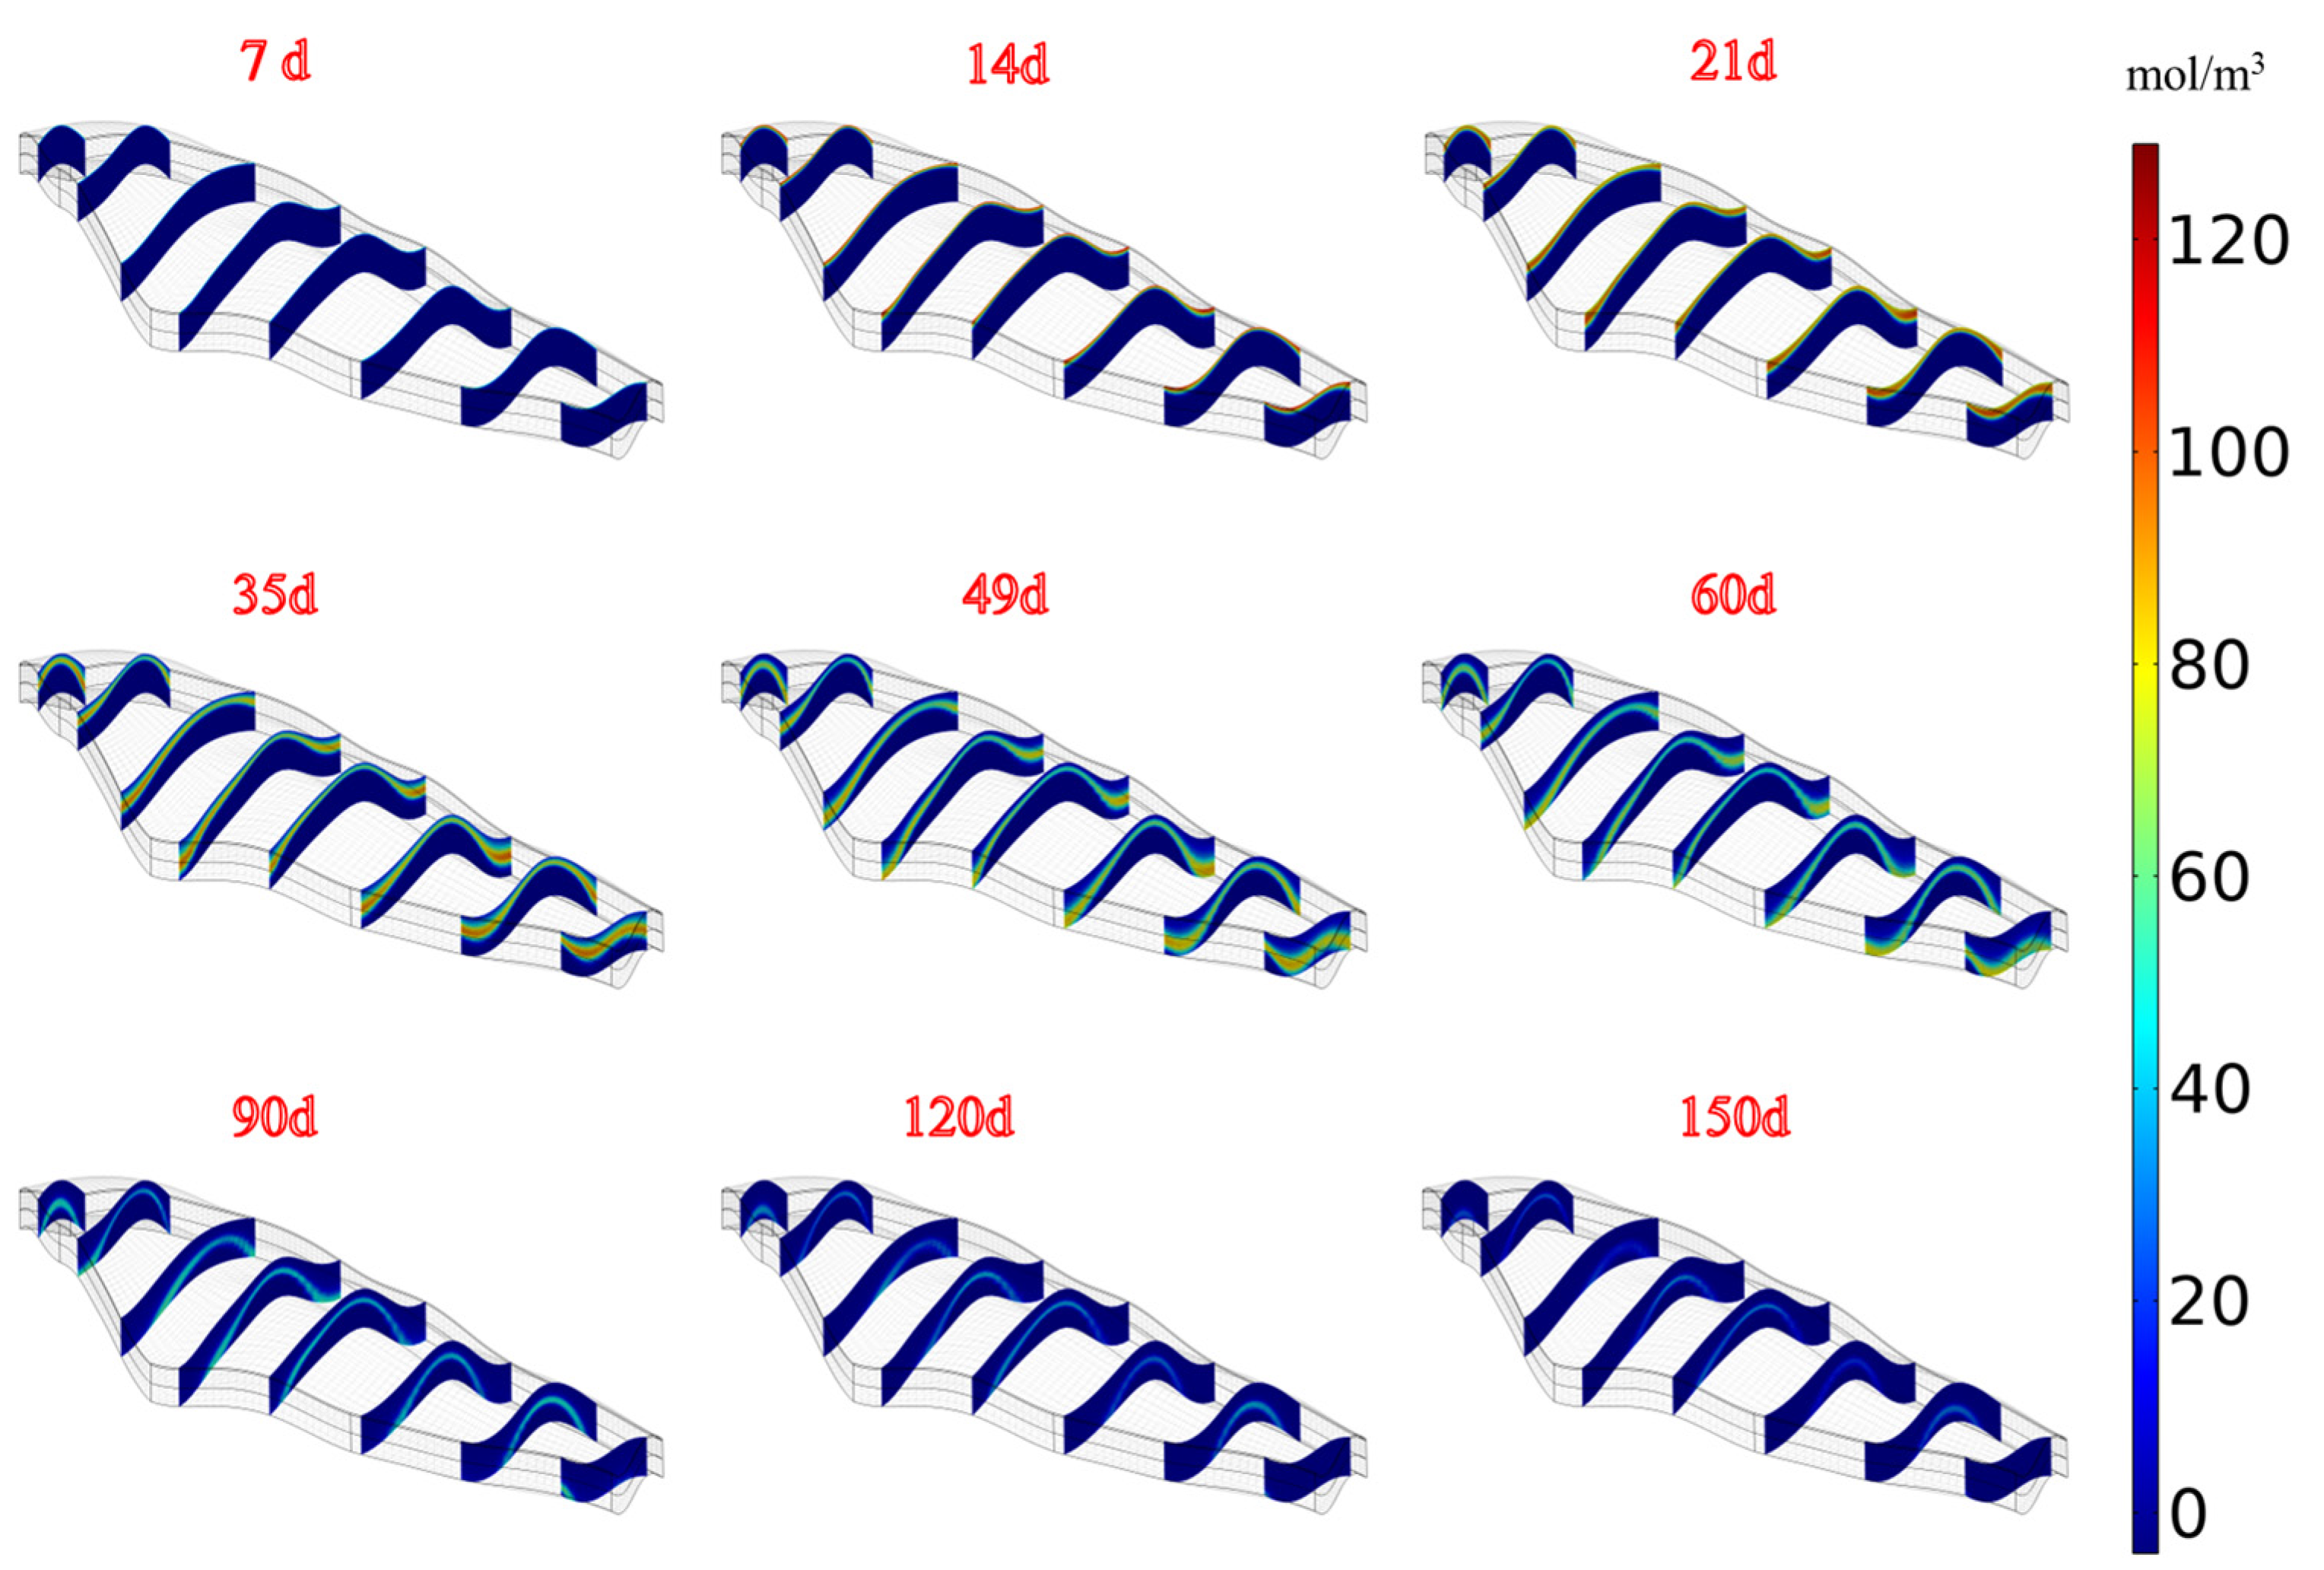
5.2. Analysis of Rare Earth Ion Leaching under Multi-Field Coupling

According to the sample analysis of the mother liquor at different leaching stages in the test stope, the rare earth content was determined, and the rare earth concentration time curve was drawn accordingly, which was translated along the time axis for 16 days. At the same time, the relationship between the concentration of rare earth ions at the lower boundary of the numerical model and time was also drawn, as shown in Figure 13. It can be seen that the similarity between the two curves is high, indicating that the calculation results of the numerical model are in good agreement with the results of the test stope. It is clear that the lower boundary starts to have rare earth ions leaching in about 28 d, but this model is constructed with a 5 m non-ore-bearing bed, which increases the time for rare earth ions to pass through the soil layer. In the actual site, we generally construct the liquid collection project at the bottom of the ore-bearing bed, and the rare earth ions can be recovered only by passing through the 5 m ore-bearing bed. From the analysis of the cloud diagram of rare earth ion migration in the stope, it was concluded that the actual time for leaching rare earth ions is about 14 d.
We will construct the liquid collection project at the bottom of the ore-bearing bed, and the rare earth ions can be recovered only after passing through the 5 m ore-bearing bed. From the analysis of the cloud diagram of rare earth ion migration in the stope, it was concluded that the actual time for leaching rare earth ions is about 14 d. In this numerical calculation, in order to ensure the similarity of boundary conditions and increase the convergence of the model, a non-ore-bearing layer was constructed under the ore-bearing layer. As the non-ore-bearing layer in the numerical model does not contain rare earth ions, the non-ore-bearing layer only postpones the leaching stope time of rare earth ions. So, it is only necessary to subtract the time of rare earth ions passing through this layer. In the calculation, the permeability coefficient of this layer was taken as twice that of the ore-bearing layer, which is 0.32 m/d, and the time for ions to pass through this layer was calculated as 16 days. According to the time–history curve of the rare earth ion concentration, it can be seen that the peak concentration of rare earth is 17.35 mol/m3, which appears at 67 d, and the actual peak concentration appears at 51 d.
The cloud diagram of the rare earth ion migration profile at different times is shown in Figure 14. Different colors in the profile image represent different concentrations of rare earth ions, and the concentration of rare earth ions increases as the color of the image changes from blue to red. With the leaching process, Mg2+ reaches the reaction particle bed of the model through leaching flow and reacts with the rare earth ions on the particles, and the exchanged rare earth ions migrate downward with the seepage field. The rare earth at the foot of the mountain is leached and migrated by comprehensive injection. With the passage of time, the migration belt moves down and finally completes the leaching of the whole stope. As it is difficult for the leaching solution to reach the ore body below the mountain top, if the liquid collection project is not carried out at the ore body below the mountain top, it is easy to form a liquid injection blind area in this area. It is obvious that the liquid injection sequence is very important, which also proves that the experience of liquid injection from the top to the bottom of the mountain is scientific.

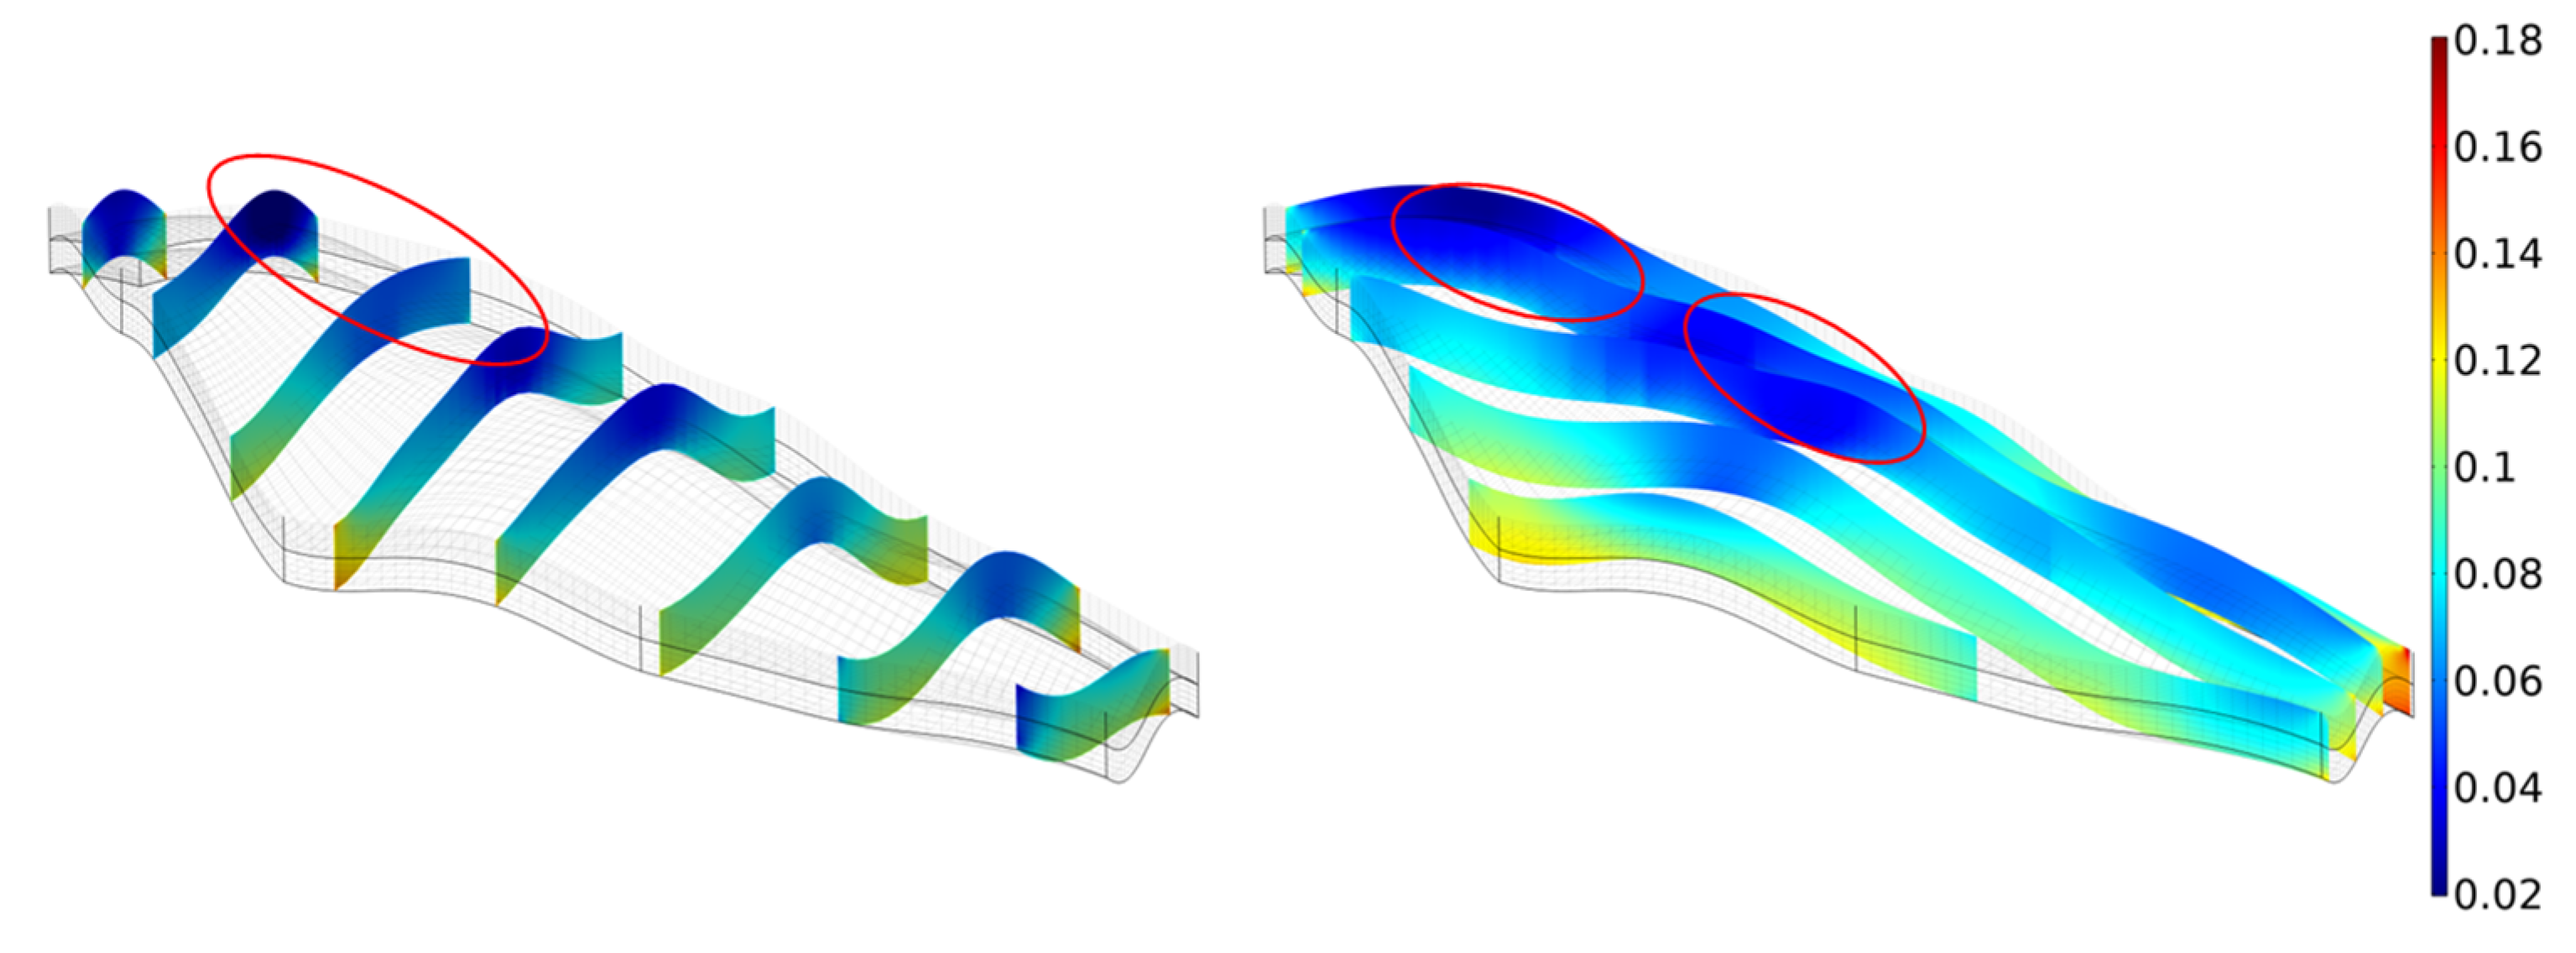
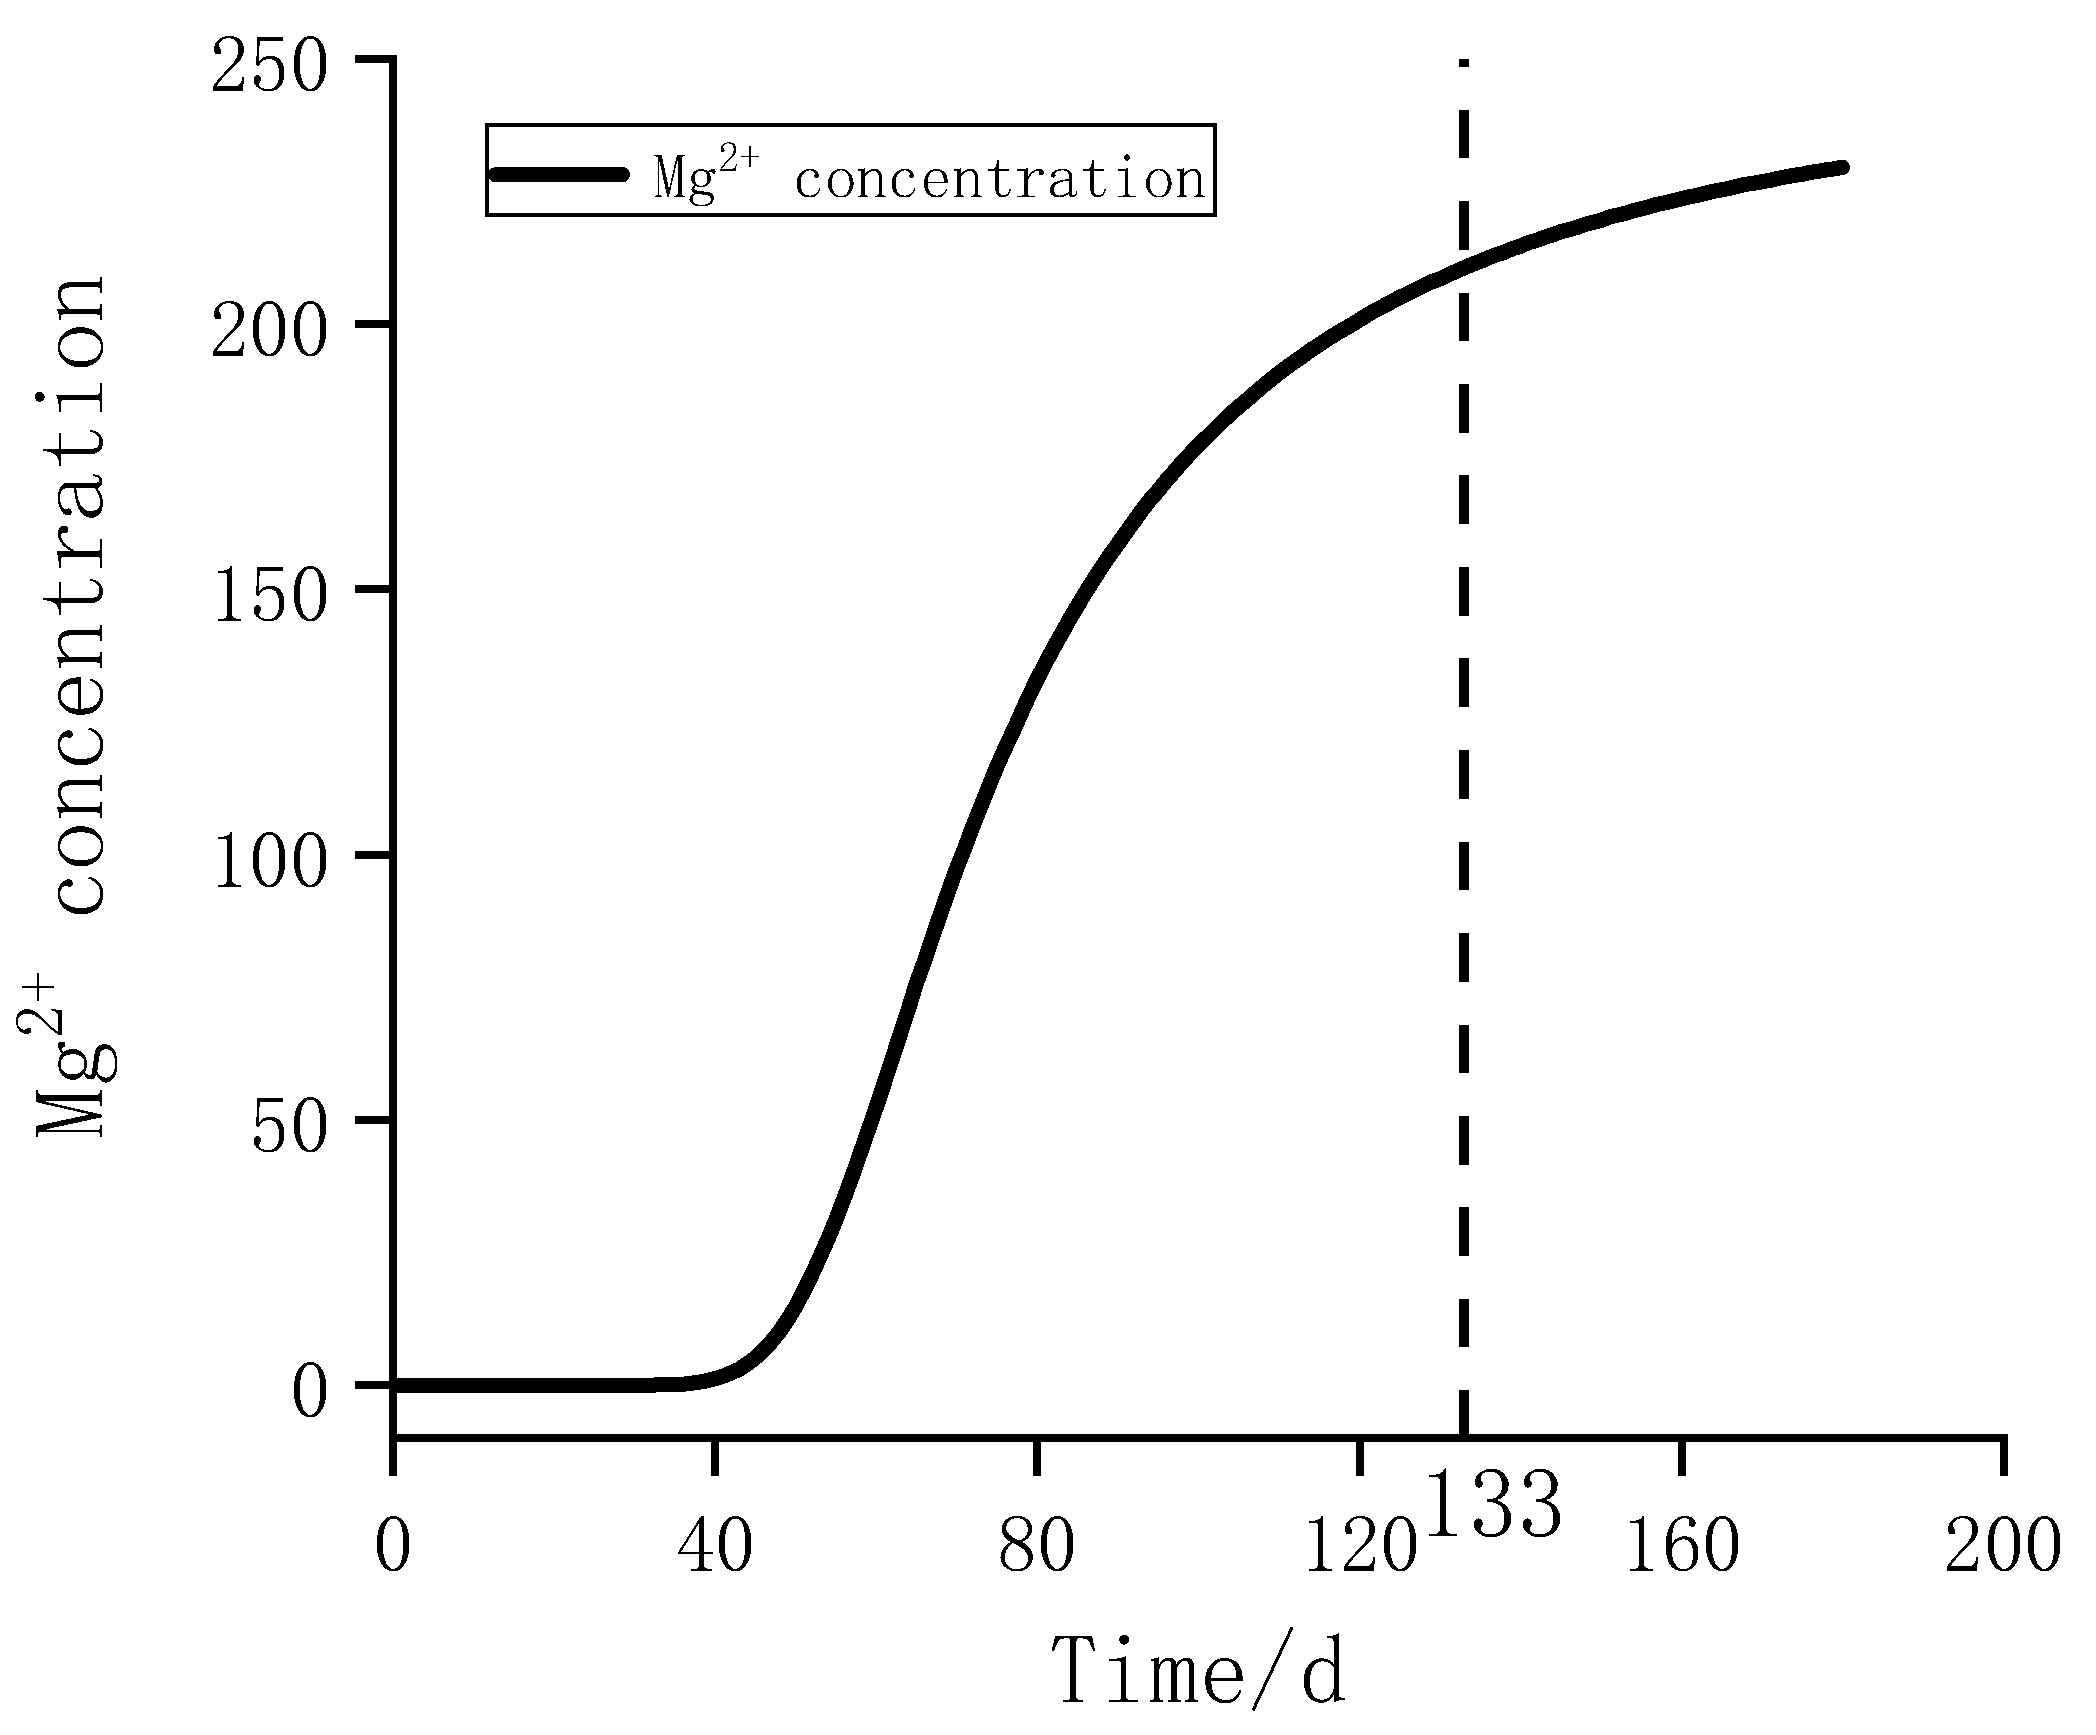
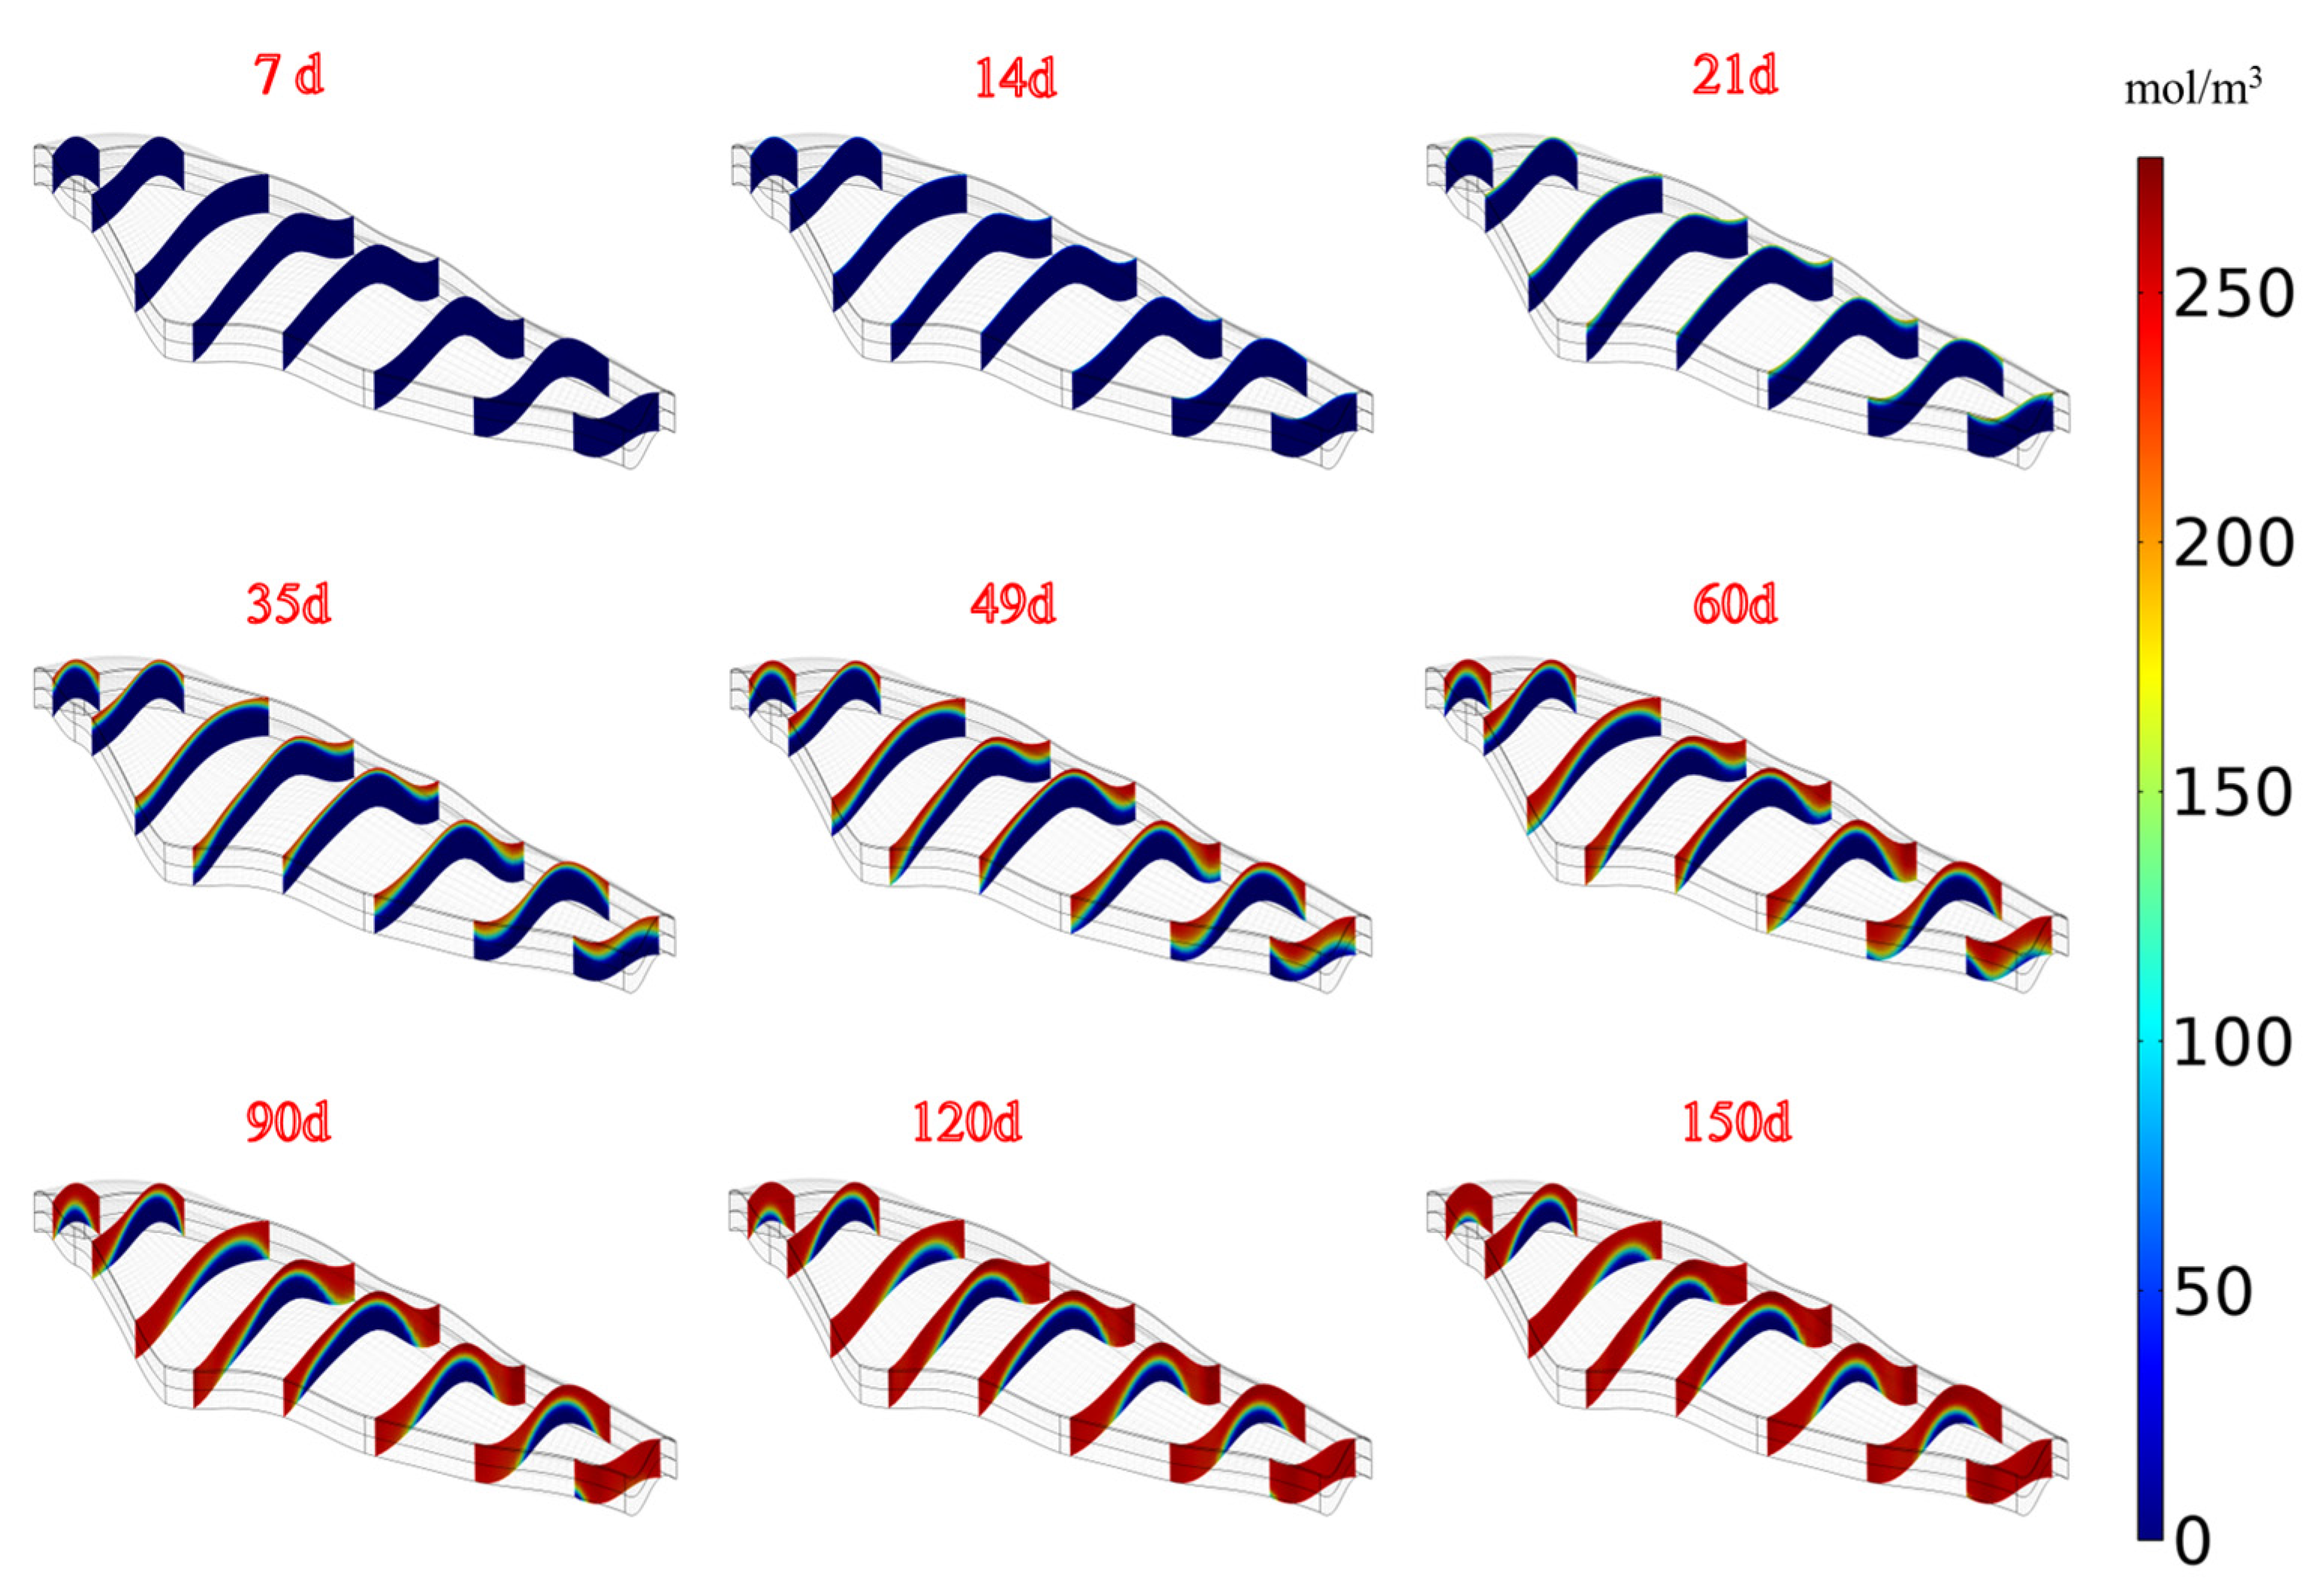
5.3. Analysis of Magnesium Ion Migration under Multi-Field Coupling

According to the time–history curve of the magnesium ion concentration at the lower boundary of the model shown in Figure 15, it is obvious that the time–history curve of Mg2+ first rises and finally tends to be flat. The change in trend of Mg2+ represents the process of the exchange of rare earth ions. It can be seen from the curve that the end is at 133 d (actual 117 d). Since the concentration of Mg2+ will hardly change thereafter, it means that the ore body will not consume Mg2+, indicating that the exchange of rare earth ions in the stope is completed, and the mining of the stope is completed within 4 months.
According to the cloud diagram of the Mg2+ migration profile in the stope, as shown in Figure 16, different colors in the cloud image represent different concentrations of magnesium ions, and the concentration of magnesium ions increases as the cloud color changes from blue to red. With the mining of the test stope, limited by the strength of the injection liquid, magnesium ions cross the topsoil layer and reach the ore-bearing layer on the 7th day, and begin exchange reactions with spherical particles in the reaction particle bed in the model, replacing rare earth ions, and Mg2+ is adsorbed back on the particle surface. With the passage of time, the concentration of Mg2+ in the ore-bearing layer increases slowly, replacing the rare earth ions and adsorbing on the surface of the particle reaction bed. The adsorption line of Mg2+ migrates downward with the expansion of the flow field. It can be seen from the profile that the injected Mg2+ gathers at the foot of the mountain, and this part of the soil reaches its highest concentration the fastest, which accelerates the leaching process of rare earth. The rare earth elements at the foot of the mountain leach out the earliest and fastest. The content of Mg2+ in the soil increases significantly. After leaching is completed, it is necessary to inject clean water into the stope to clean the original mountain otherwise Mg2+ will flow into the river and infiltrate the ground with the arrival of the rainy season and will pollute the surface water and groundwater, resulting in the hardness index of the water body exceeding the standard and posing a threat to people’s health.

6. Conclusions

In this paper, a real three-dimensional numerical model of the test stope was constructed using the topographic survey map and geological data of the test stope. Based on the multi-field coupling of the seepage field and reaction particle bed, the in situ leaching process of the comprehensive liquid injection mode was simulated.
(1)
The leaching numerical model of the rare earth stope was constructed, and the leaching process of rare earth was simulated according to the designed injection strength by adopting the above-optimum MgSO4 concentration. By analyzing the steady-state saturated seepage field, the importance of the liquid injection sequence was verified, and the scientific experience of liquid injection from the top to the bottom of the mountain was demonstrated.
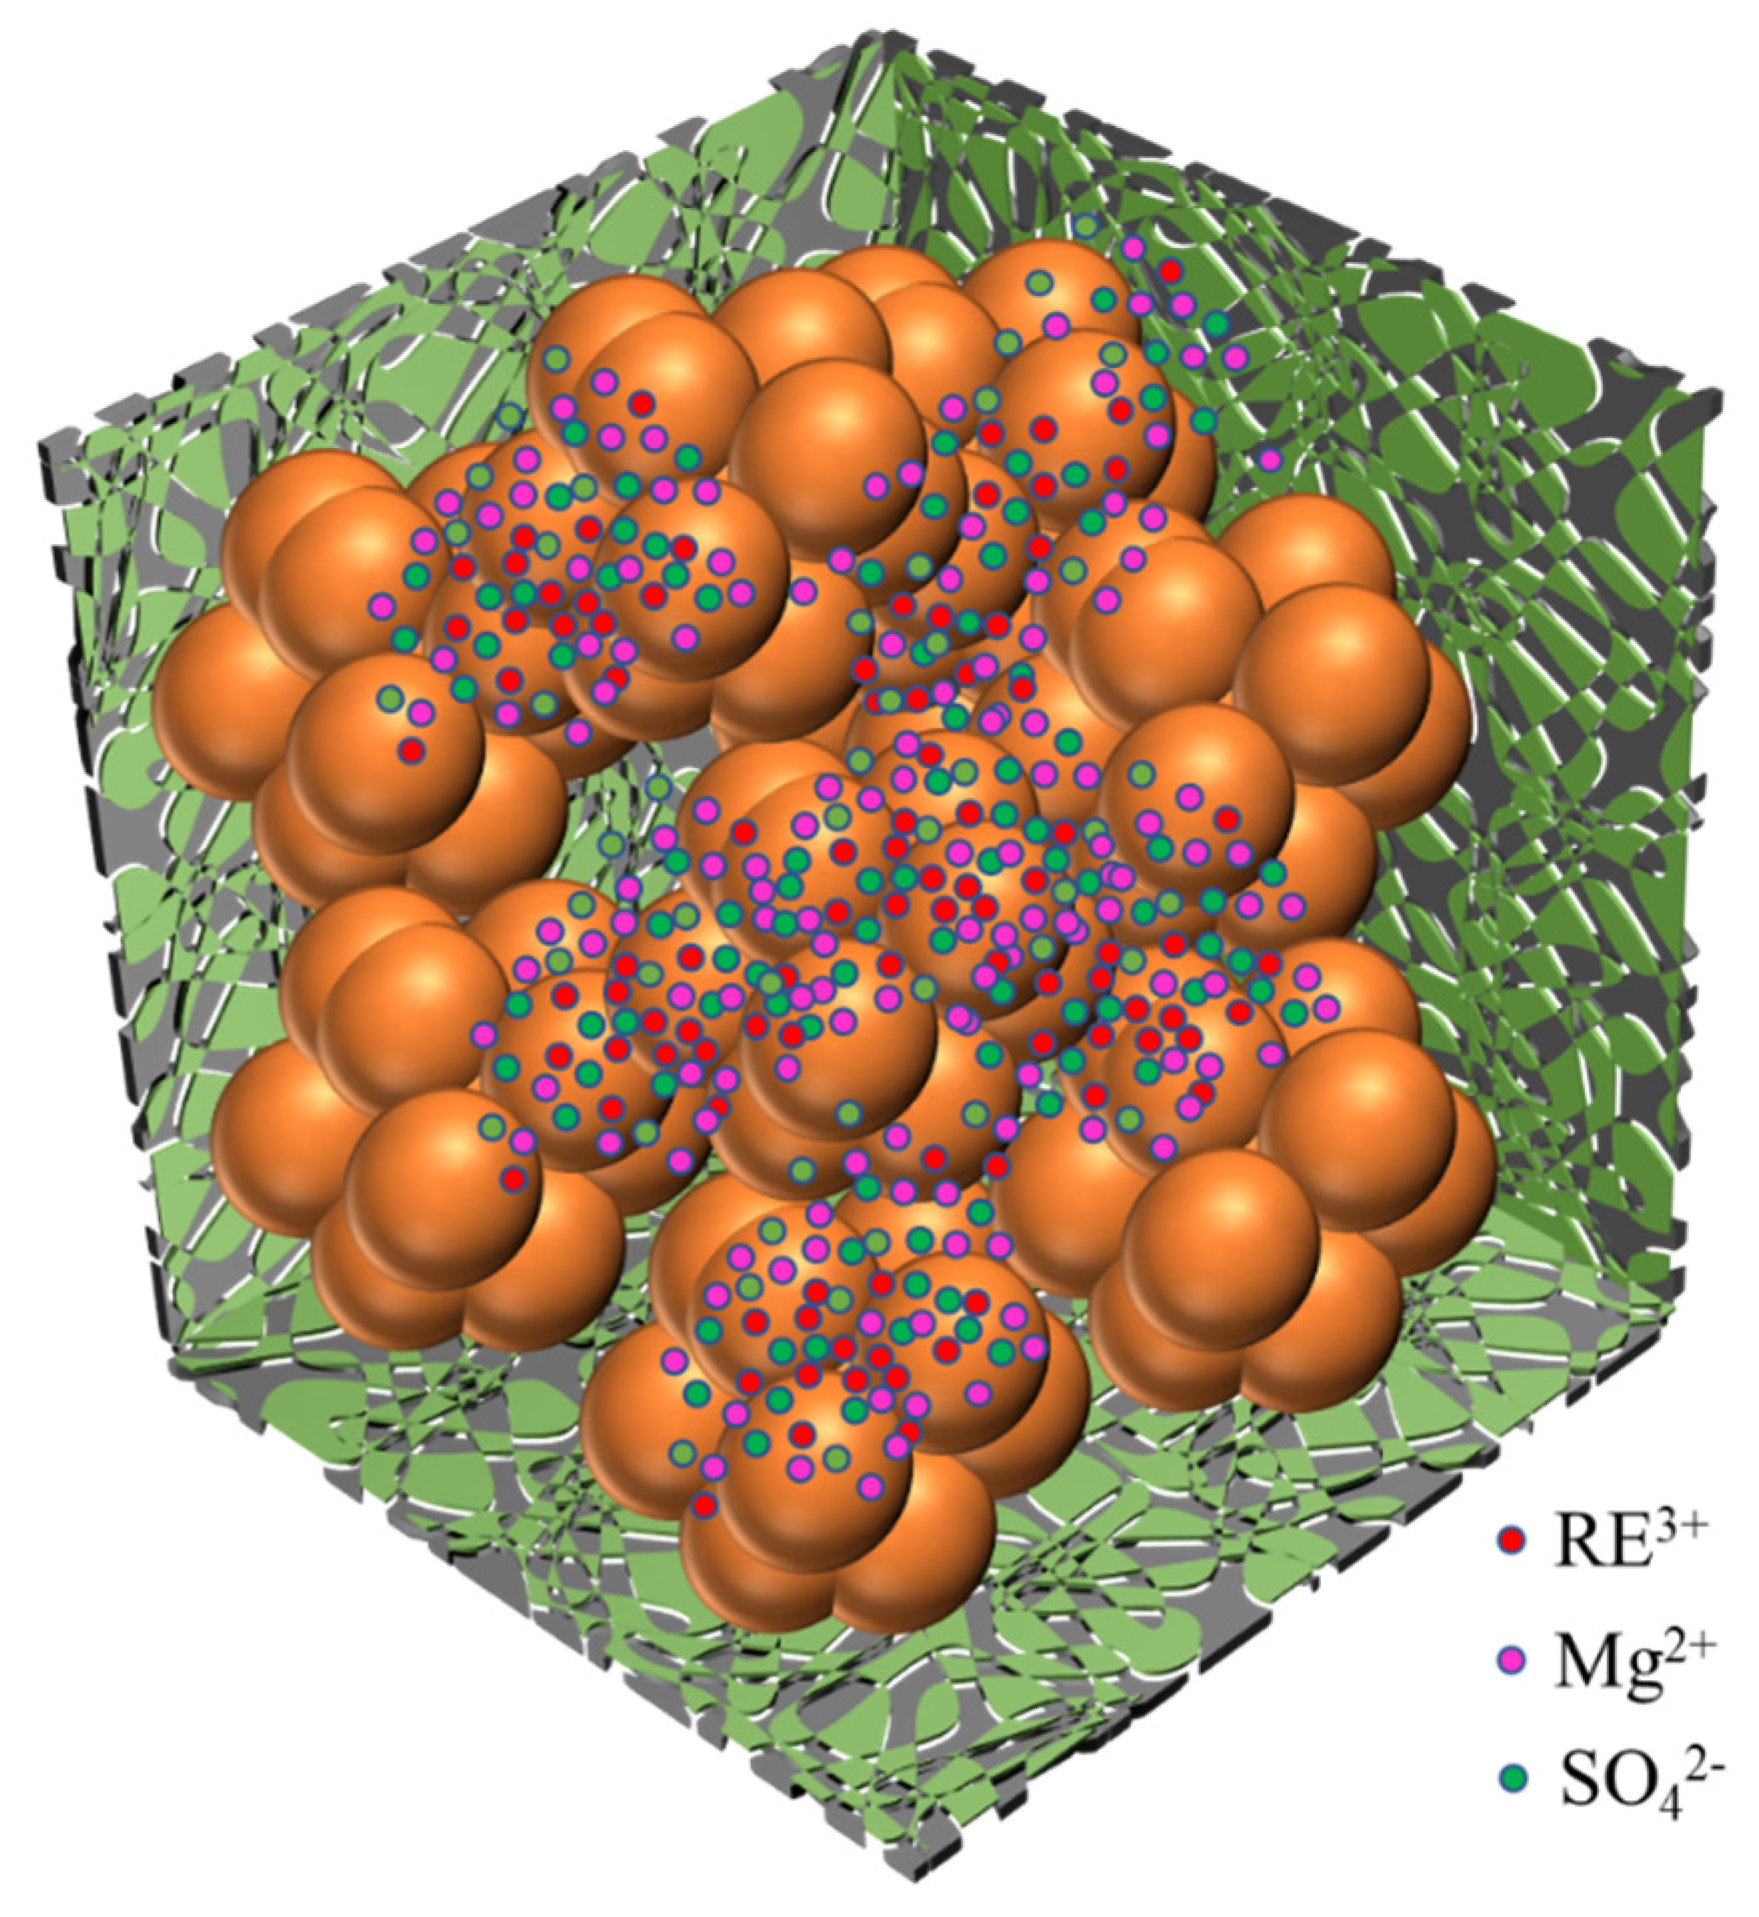
(2)
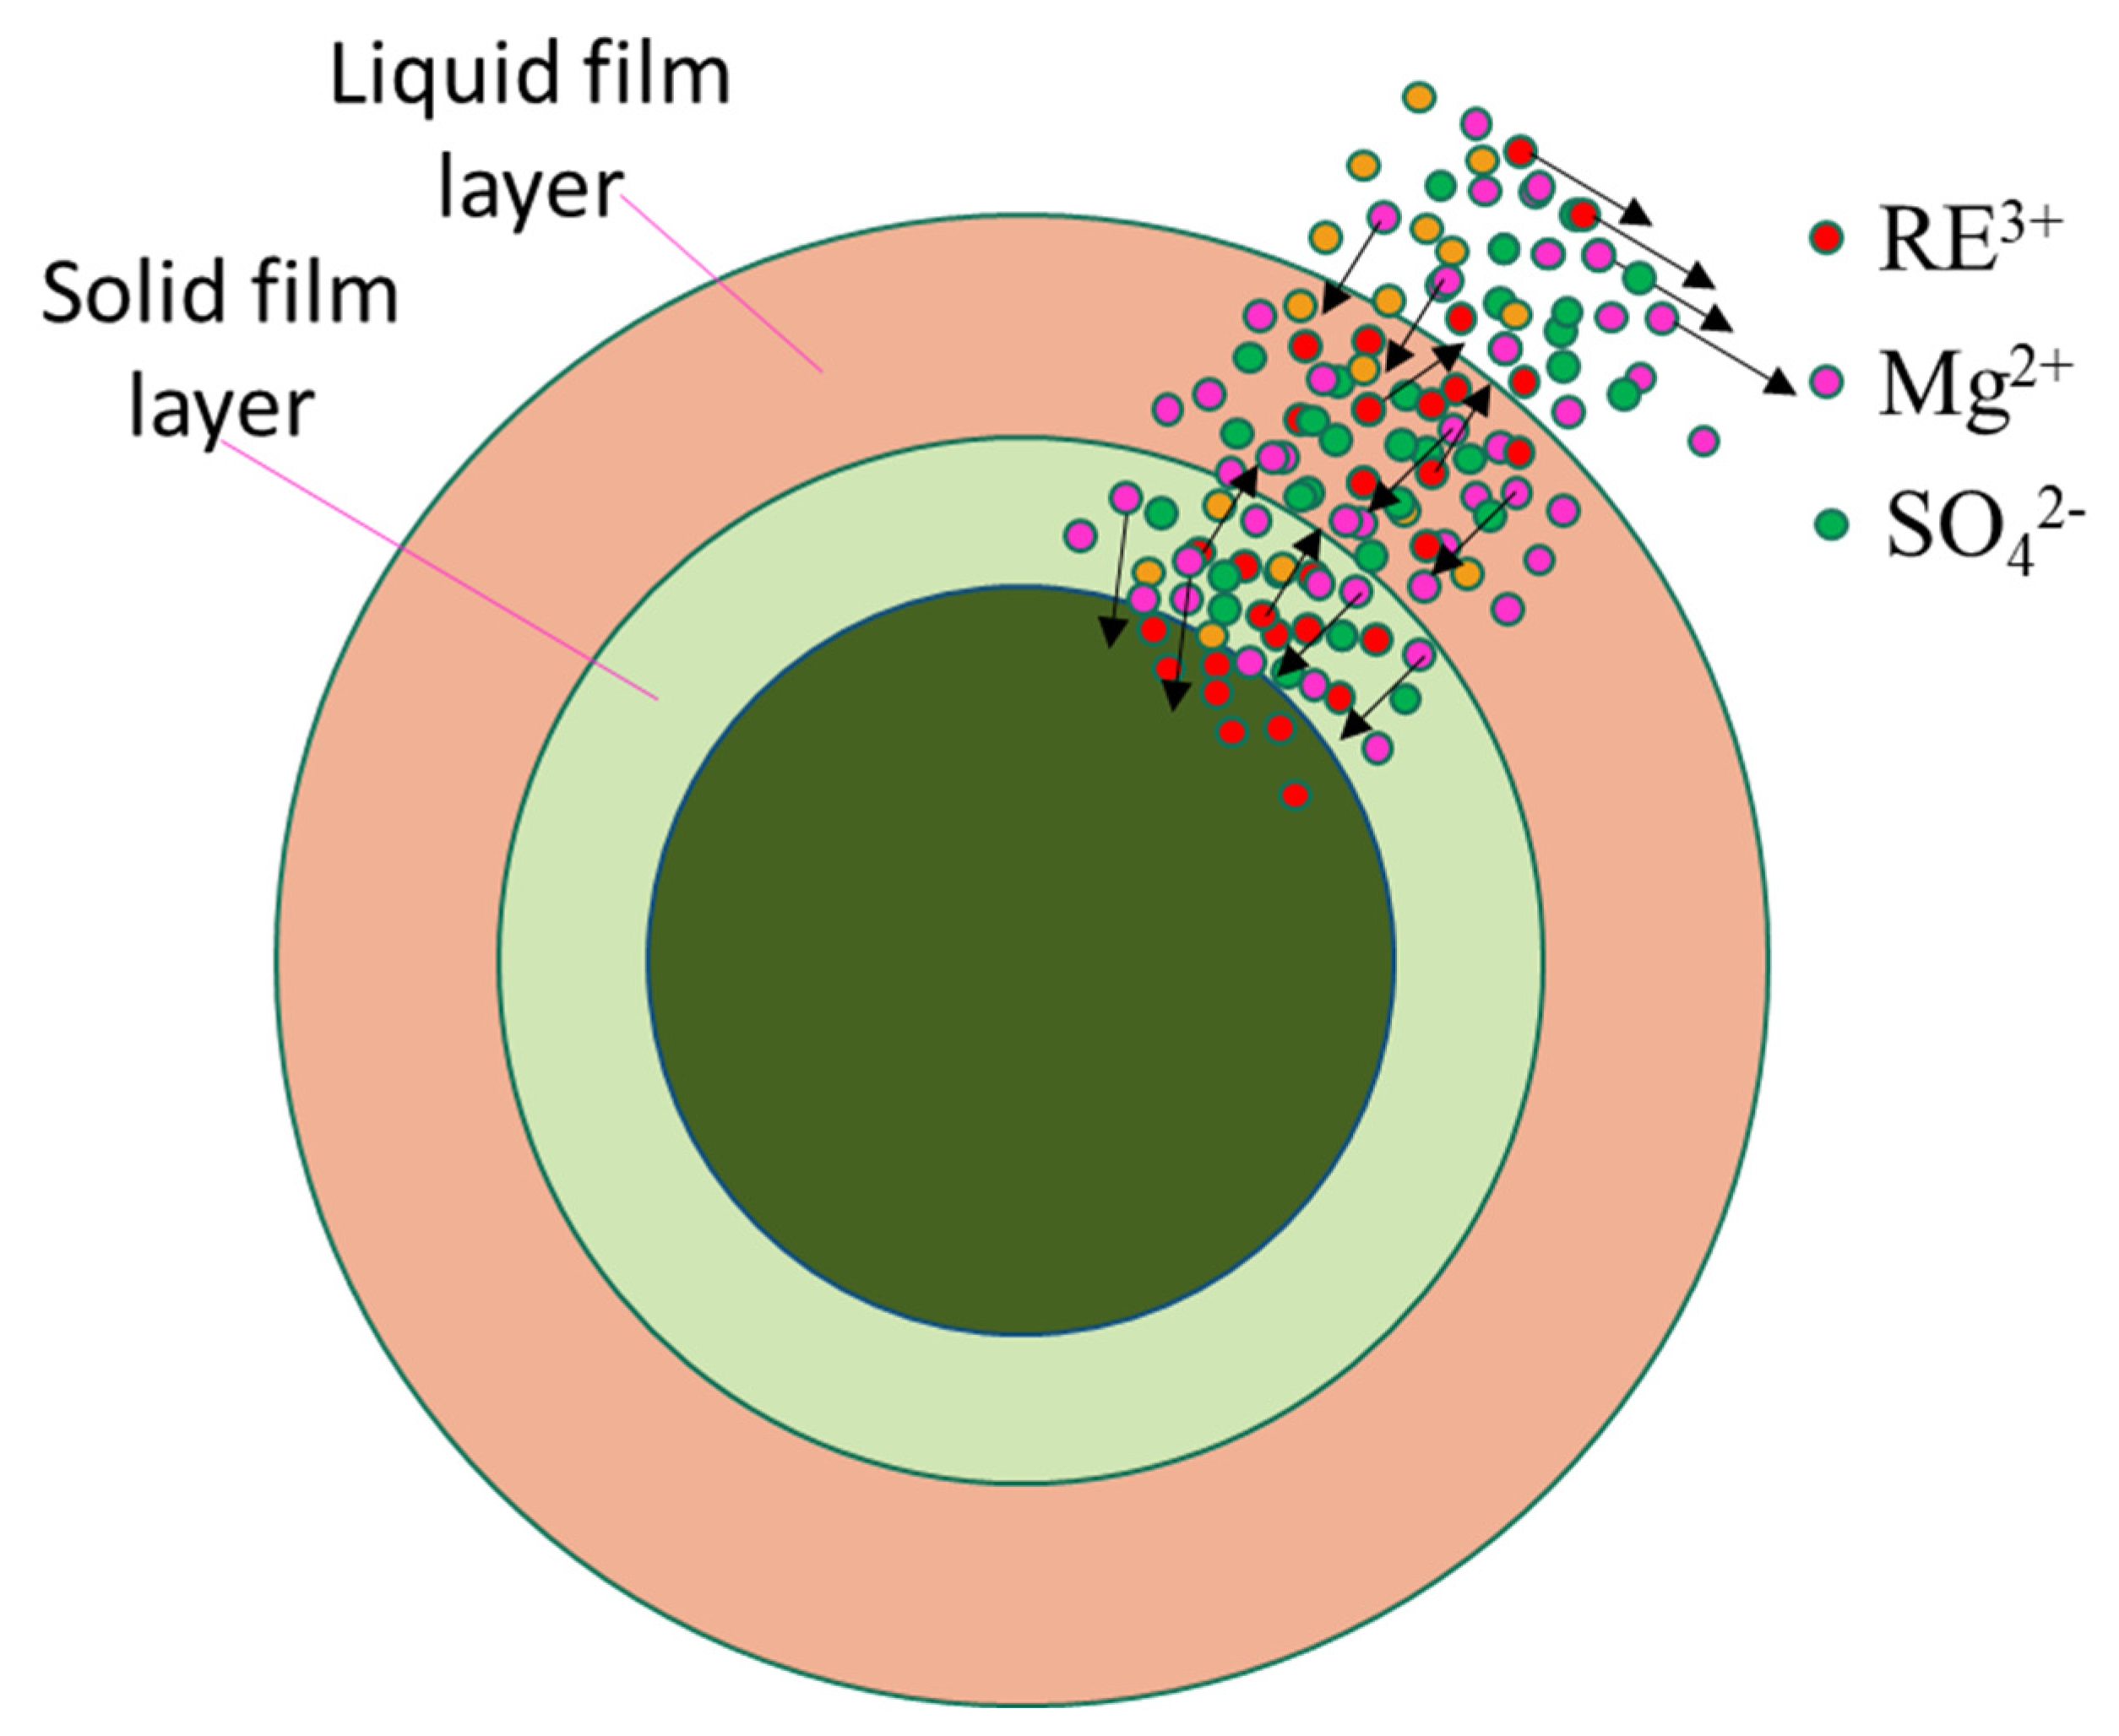
The leaching process of rare earth was simulated by coupling ion exchange reactions, and the migration process of rare earth ions and Mg2+ in the stope was analyzed. The cutoff time for leaching was determined according to the cloud map of the Mg2+ migration profile and the time–history curve of the Mg2+ concentration in the stope.

Author Contributions

Conceptualization, D.W. and Y.R.; methodology, D.W. and F.W.; software, D.W. and F.W.; validation, W.X.; data curation, L.S.; writing—original draft preparation, D.W. and Y.R.; writing—review and editing, D.W., Y.R., and W.X.; visualization, L.S., M.H., and W.X.; supervision, Y.R.; project administration, Y.R.; funding acquisition, Y.R. and L.S. All authors have read and agreed to the published version of the manuscript.

Funding

This research was funded by the National Natural Science Foundation of China (51964014); the Education Department of Jiangxi Province (GJJ209414).

Data Availability Statement

Not applicable.

Acknowledgments

Thanks for the great effort by editors and reviewers.

Conflicts of Interest

The authors declare no conflict of interest.

References

  1. Wang, S.; Yang, X.; Wang, C.; Jia, C.; Wang, H.; Liu, J. Research on the Transport of Pollutants in Municipal Solid Waste Landfill. China Rural Water Hydropower 2021, 465, 81–86. [Google Scholar]
  2. Wang, D.; Rao, Y.; Shi, L.; Xu, W.; Huang, T. Relationship between Permeability Coefficient and Fractal Dimension of Pore in Ionic Rare Earth Magnesium Salt Leaching Ore. Geofluids 2022, 2022, 2794446. [Google Scholar] [CrossRef]
  3. Liu, L.; Rao, Y.; Tian, C.; Huang, T.; Lu, J.; Zhang, M.; Han, M. Adsorption Performance of La (III) and Y (III) on Orange Peel: Impact of Experimental Variables, Isotherms, and Kinetics. Adsorpt. Sci. Technol. 2021, 2021, 7189639. [Google Scholar] [CrossRef]
  4. Wissmeier, L.; Barry, D.A. Simulation tool for variably saturated flow with comprehensive geochemical reactions in two and three-dimensional domains. Environ. Model. Softw. 2011, 1, 210–218. [Google Scholar] [CrossRef]
  5. Yang, K.B. Heavy Metal Pollution of Farmland in China and its Botanical Rehabilitation. Geol. Explor. 2007, 8, 58–61. [Google Scholar]
  6. Sun, B.; Zhou, S.; Zhao, Q. Combined Pollution of Heavy Metal in Soil Based on Spatial Variation Analysis. J. Agro-Environ. Sci. 2003, 22, 248–251. [Google Scholar]
  7. Hu, G.; Peng, S.; Zhang, S. Research on numerical simulation for transmission of contaminants in soil. Chin. J. Environ. Eng. 2010, 7, 1659–1662. [Google Scholar]
  8. Liu, C.; Zhou, F.; Wu, X.; Feng, J.; Chi, R. Development and Prospect in Seepage and Mass Transfer Process of Weathered Crust Elution-Deposited Rare Earth Ore. Chin. Rare Earths 2021, 42, 111–121. [Google Scholar]
  9. Zadeh, G.A.S.; Mehrabian, M.A.; Mansouri, S.H.; Sarrafi, A. Computational modelling of unsaturated flow of liquid in heap leaching-using the results of column tests to calibrate the model. Int. J. Heat Mass Transf. 2005, 48, 277–289. [Google Scholar]
  10. Wu, A.; Liu, J.; Tang, L.; Guo, X. Simulation of Coupled Flowing-Reaction-Deformation with Mass Transfer in Heap Leaching Processes. Appl. Math. Mech. 2007, 3, 297–304. [Google Scholar] [CrossRef]
  11. Liu, J.; Yang, B.; Li, Y. Coupling Mechanism and Numerical Simulation of Heap Leaching Process. Min. Metall. Eng. 2015, 35, 114–116. [Google Scholar]
  12. Hu, S.; Cao, X.; Wang, G.; Long, P.; Zhou, X. An Ion Exchange Model for Leaching Process of Weathered Crust Elution-deposited Rare Earth. Min. Metall. Eng. 2018, 38, 516. [Google Scholar]
  13. Long, P.; Wang, G.; Tian, J.; Hu, S.; Luo, S. Simulation of one-dimensional column leaching of weathered crust elution-deposited rare earth ore. Trans. Nonferrous Met. Soc. China 2019, 29, 625–633. [Google Scholar] [CrossRef]
  14. Zhang, H.; Zhang, S.; Zhang, Y.; Liu, K.; Pan, W.; Xu, J.; Bian, Z.; Yang, S.; Pan, Y.; Xu, Z. Nitrogen Regulation of Shallow Groundwater Based on Visual MODFLOW Software. J. Univ. Jinan (Sci. Technol.) 2022, 1, 56–64. [Google Scholar]
  15. Chen, L.; Zhang, C.; Zheng, L.; Fu, G.; Zhang, W. Simulation of groundwater pollution control in a valley-basin industrial park based on GMS. Environ. Pollut. Control 2022, 44, 1025–1029. [Google Scholar]
  16. Xi, L.; Ni, Y.; He, J.; Liang, K.; Chen, K.; Xia, Z.; Chen, M.; Xue, Q. Three-Dimensional Geological Modeling and Resource Estimation of the Marine Sand and Gravel Orebodies Based on GMS. Geol. Explor. 2022, 58, 429–441. [Google Scholar]
  17. Panah, M.; Blanchette, F. Simulating flow over and through porous media with application to erosion of particulate deposits. Comput. Fluids 2018, 166, 9–23. [Google Scholar] [CrossRef]
  18. Guo, Z.; Zhao, K.; Jin, J.; Zhu, Z.; Li, G. Solute Transport Mechanism of Ion-Adsorption Type Rare Earth in-situ Leaching Mining. J. Chin. Soc. Rare Earths 2019, 37, 121–128. [Google Scholar]
  19. Liu, J.; Brady, B.H. Evaluation of velocity-dependent in situ leaching processes: Single-porosity model. Metall. Mater. Trans. B. Process Metall. Mater. Process. Sci. 1998, 29, 1227–1234. [Google Scholar] [CrossRef]
  20. Zhou, K.; Li, J.; Xu, Y.; Zhang, Y. Measurement of rock pore structure based on NMR technology. J. Cent. South Univ. (Sci. Technol.) 2012, 43, 4796–4800. [Google Scholar]
  21. Zhou, F.; Huang, S.; Liu, X.; Wang, Z.; Li, C.; Xu, Y. Adsorption kinetics and thermodynamics of rare earth on Montmorillonite modified by sulfuric acid. Colloids Surf. A Physicochem. Eng. Asp. 2021, 627, 127063. [Google Scholar]
  22. Zhang, Y.; Jiang, Z.; He, M.; Hu, B. Determination of trace rare earth elements in coal fly ash and atmospheric particulates by electrothermal vaporization inductively coupled plasma mass spectrometry with slurry sampling. Environ. Pollut. 2007, 2, 459–467. [Google Scholar] [CrossRef]
  23. Chai, X.; Li, G.; Zhang, Z.; Chi, R.; Chen, Z. Leaching Kinetics of Weathered Crust Elution-Deposited Rare Earth Ore with Compound Ammonium Carboxylate. Minerals 2020, 10, 516. [Google Scholar] [CrossRef]
  24. Wu, A.; Yin, S.; Wang, H.; Su, Y. Solute transport mechanism and model of dump leaching. J. Cent. South Univ. (Sci. Technol.) 2006, 2, 385–389. [Google Scholar]
  25. Liu, Q.; Xiao, H.; Tan, C.; Yu, X.; Wang, D.; Qiu, T. Simulation Research on Multi-field Coupling in Leaching Process of Ionic Rare Earth Ore Based on COMSOL. J. Chin. Soc. Rare Earths 2022, 40, 880–892. [Google Scholar]
Figure 1. Schematic diagram of the rare earth ion exchange process.
Minerals 12 01500 g001
Figure 2. Longitudinal section of ore body thickness variation.
Minerals 12 01500 g002
Figure 3. Schematic diagram of weathered crust stratification.
Minerals 12 01500 g003
Figure 4. Geological and topographic map of the mining area.
Minerals 12 01500 g004
Figure 5. Modeling process of the test stope.
Minerals 12 01500 g005
Figure 6. Test stope: (a) test stope assembly model; (b) test stope photos.
Minerals 12 01500 g006
Figure 7. Unit division.
Minerals 12 01500 g007
Figure 8. Particle reaction bed model.
Minerals 12 01500 g008
Figure 9. Overall steady flow field.
Minerals 12 01500 g009
Figure 10. Steady flow field of ore-bearing layer.
Minerals 12 01500 g010
Figure 11. Steady flow field of non-ore-bearing layer.
Minerals 12 01500 g011
Figure 12. Longitudinal section of steady-state flow field of regolith.
Minerals 12 01500 g012
Figure 13. Time–history curve of the rare earth ion concentration at the lower boundary.
Minerals 12 01500 g013
Figure 14. Cloud diagram of rare earth ion migration in the stope.
Minerals 12 01500 g014
Figure 15. Time–history curve of the Mg2+ concentration at the lower boundary.
Minerals 12 01500 g015
Figure 16. Cloud image of the Mg2+ migration profile in the stope.
Minerals 12 01500 g016
Publisher’s Note: MDPI stays neutral with regard to jurisdictional claims in published maps and institutional affiliations.

