Article

Evolutionary Law of Pore Structure of Ion-Adsorbed Rare Earth Ore Leaching Process

1
School of Civil and Surveying & Mapping Engineering, Jiangxi University of Science and Technology, Ganzhou 341000, China
2
School of Resources and Environmental Engineering, Jiangxi University of Science and Technology, Ganzhou 341000, China
3
The Seventh Geological Brigade of Jiangxi Bureau of Geology, Ganzhou 341000, China
*
Author to whom correspondence should be addressed.
Minerals 2023, 13(3), 322; https://doi.org/10.3390/min13030322
Submission received: 20 December 2022 / Revised: 20 February 2023 / Accepted: 22 February 2023 / Published: 24 February 2023
(This article belongs to the Special Issue Recent Developments on the Leaching Process of Rare Earth Ore)

Abstract

:
In the process of ion-adsorbed rare earth (RE) ore leaching and mining, the injected chemical agent and rare earth particles have a strong chemical reaction, resulting in changes in the structure of the rare earth, and thus affecting the macroscopic mechanical properties and permeability of soil. To investigate the evolution of the pore structure during the leaching process, indoor leaching simulation experiments were used to compare and analyze the changes of Zeta potential during the leaching process with different concentrations of leaching solution, the process of the gradual change of the strong and weak combined water layer was analyzed, and a nuclear magnetic resonance (NMR) instrument was used to obtain the structural parameters such as the porosity, T2 spectrum and pore radius to analyze the evolution law of microscopic pore structure. The experimental results show that the deionized (DI) water leaching process has less effect on the pore structure of the ore body, and the pore structure inside the ore body evolves gradually from small and medium pore size pores to large pore size pores, while the pore structure of the ore body changes more during the leaching process of the MgSO4 leaching solution. In the initial leaching stage, the number of minimal pores (0–0.24 μm) and small pores (0.24–0.65 μm) of the ore body decreases rapidly, and the number of large pores (1.6–10 μm) increases. In the effective leaching stage, the number of minimal pores (0–0.24 μm), small pores (0.24–0.65 μm) and medium pores (0.65–1.6 μm) increases, while the number of large pores (1.6–10 μm) and mega pores (greater than 10 μm) decreases. At the end of leaching stage, the pore size evolves from medium pores (0.65–1.6 μm) and small pore (0.24–0.65 μm) to large pores (1.6–10 μm). Both chemical replacement reaction and solution percolation can induce changes in the pore structure of the ore body, and the influence of the chemical replacement reaction is higher than that of percolation in the leaching process. The evolution of pore structure during ion exchange is caused by the difference of ionic strength in leaching solution. RE ore particles are adsorbed or released to the solid phase, and the migration of particles leads to changes in the interface properties of RE particles, which affects the pore structural changes.

1. Introduction

Ion-adsorbed rare earth (RE) ore, also known as weatheres crust infiltration RE ore, is a unique type of RE ore found in China. RE resources play an extremely vital role in the modern high-tech industry and have received widespread attention. The exploitation of RE resources in China is done poorly, the utilization rate is low, and landslide safety accidents are caused. It is necessary to promote green, safe and sustainable development and utilization of RE resources. The current RE ore mining process uses an in situ leaching process, which mainly uses the chemical replacement reaction of the leaching solution to recover RE cations during the percolation of the ore body, and thus achieve RE element extraction [1,2,3]. At present, compared with pool leaching and heap leaching, in situ leaching has the advantages of higher efficiency, lower cost, and relatively small environmental damage [4]. However, it leads to changes in the pore structure of the ore body due to continuous liquid injection. In the process of ore leaching, the uneven degree of pore distribution increases, local argillization occurs, and the pore ratio decreases [5]. The pore structure of the ore body changes more significantly under the action of the chemical replacement reaction than under the action of DI water percolation [6]. Cations with different valence states in the leaching solution lead to changes in the pore structure of the ore body [7]. Ion exchange, migration of particles and the properties of the particles jointly affect the pore structure of the ore body [8]. Different size fractions of rare earth ores correspond to different seepage effects. When the pore ratio is small, the bound water film of rare earth ore particles occupies a certain effective pore space and has a large viscosity for the flow of the leaching solution. As the pore ratio increases, the bound water film effect gradually weakens, and the percolation effect enhances [9]. Pore structure and percolation velocity are the key factors affecting particle transport in saturated porous media, and the larger the percolation velocity the more obvious the role of pore structure [10]. The surface bound water of mineral particles has a viscous and absorptive effect on the leached solution, and has the characteristic of being able to reduce the pore volume. The two main factors that affect the seepage law of in situ leaching solution are surface-bound water and loose particles [11]. Ion exchange reactions lead to the deposition and release of fine RE particles, which further affect the percolation of leaching solution in the ore body [12]. In the leaching process of ion-adsorbed RE ore, the evolution of the pore structure of the ore body plays a crucial role in the percolation of the leaching solution [13]. The factors influencing the leaching process on the micro-structure of RE ore body include both solution percolation and ion exchange, where the main factor is determined by the dual action of ion exchange [14]. The ion concentration and valence transition have significant effects on the permeability of clay [15]. The change of permeability coefficient of the rare earth ore body during leaching is closely related to pore structure [16,17]. The ion exchange reaction occurring in the leaching ore changes the composition, size and classification of the particles in the RE ore, which in turn changes the strength and other mechanical properties of the RE ore [18]. The percolation and liquid injection exacerbates the vertical migration of fine particles, which affects the particle size distribution of RE ore particles and induces ore body landslides [19]. Research has found that the cohesive force of the leached samples shows a decreasing trend during the leaching process and a small increase in the cohesive force of the specimens after the end of leaching, while the internal friction angle of the specimens tends to decrease during the leaching process [20]. It has also been found that the process of liquid injection induces a gradual weakening of the strength parameters of the ore body, and the cohesive force between soil particles, shear strength and bearing capacity of the ore body all tend to decrease to different degrees, which can easily cause landslide accidents [21,22]. Both chemical replacement reactions and seepage induce changes in the internal pore structure of the ore body, which leads to the gradual weakening of the ore body strength parameters [23,24].
According to the conclusion of the many studies mentioned above, the seepage and the transfer of leaching particles leads to changes in the internal structure of the ore body. Compared with (NH4)2SO4 solution, an MgSO4 leaching solution can reduce the environmental pollution caused by leaching. Therefore, we took the RE ore body in Longnan County, Ganzhou as the research object, and conducted indoor simulated leaching experiments by injecting different concentrations leaching solution, namely, DI water, 2% MgSO4 and 5% MgSO4. The leaching rate of RE ions is not only related to the seepage of the leaching agent and the migration of ions, but to the ion exchange reaction on the surface of the ore particles [25,26,27,28]. By comparing the evolution of the internal pore structure of the RE ore during the two leaching processes, the influence of the ion exchange process on the pore structure of the ore body was revealed. The results provide scientific methods and theoretical support for the mining of ion-adsorbed RE ore, and promote the development towards high efficiency, green and safety.

2. Experimental Program

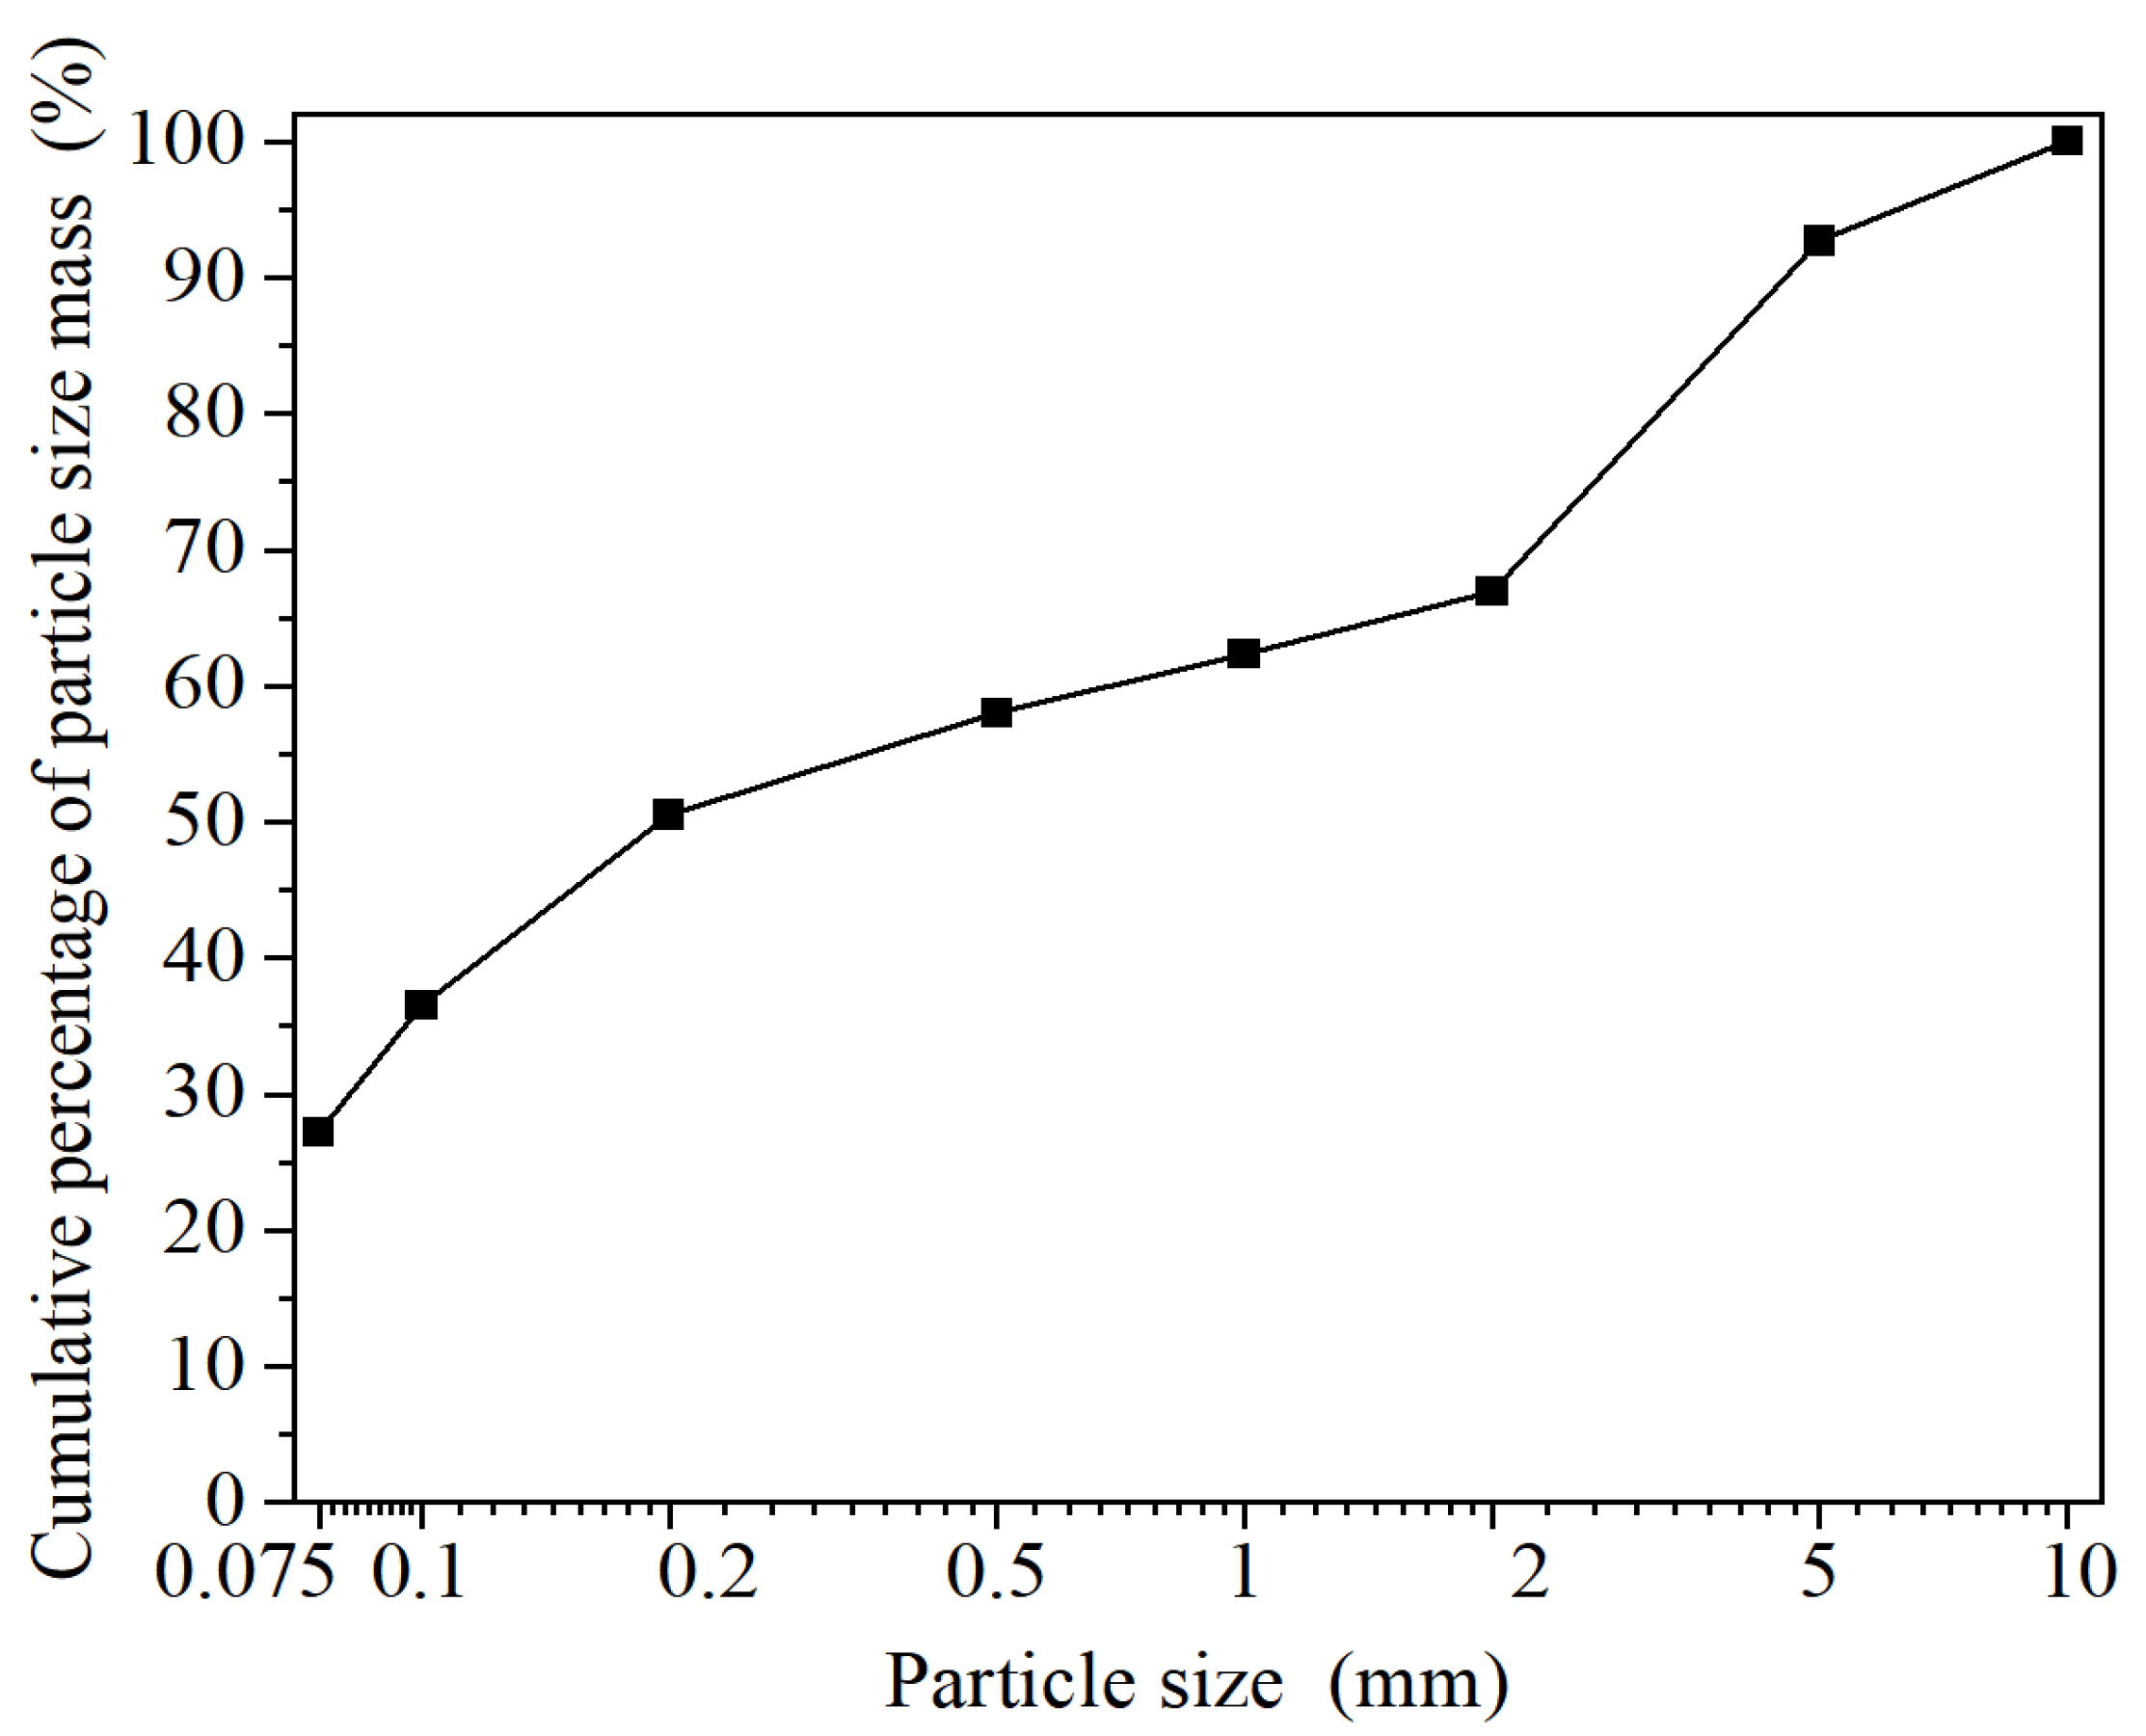
2.1. Experimental Materials and Their Characteristic Parameters

The RE specimens selected in this study were taken from an RE ore in Longnan County, Ganzhou. A number of RE ore samples were taken by the ring-knife method, then sealed by cling film, and the physical parameters of the mineral soil were measured according to the geotechnical test procedure. The results are shown in Table 1. According to the Geotechnical Test Procedure, the sieving method for gravel soil containing clay particles, named the water sieve method, the soil samples were air-dried and crushed, 500 g of mineral sample was taken out for sieving experiment using the quarter diagonal sampling method, and the grain size of the sieve were 5, 2, 1, 0.5, 0.2, 0.1, 0.075 mm in order. The results of particle size distribution of the mineral sample are shown in Figure 1, which can be judged as coarse-grained sandy soil. In this test, MgSO4 solution and DI water were used as leaching agents, and three groups of 2.0% and 5.0% MgSO4 solution and DI water were prepared for the indoor column leaching test. The corresponding mass of MgSO4 particles was weighed and dissolved in DI water with an electronic balance to obtain the corresponding mass percent concentration of MgSO4 solution.

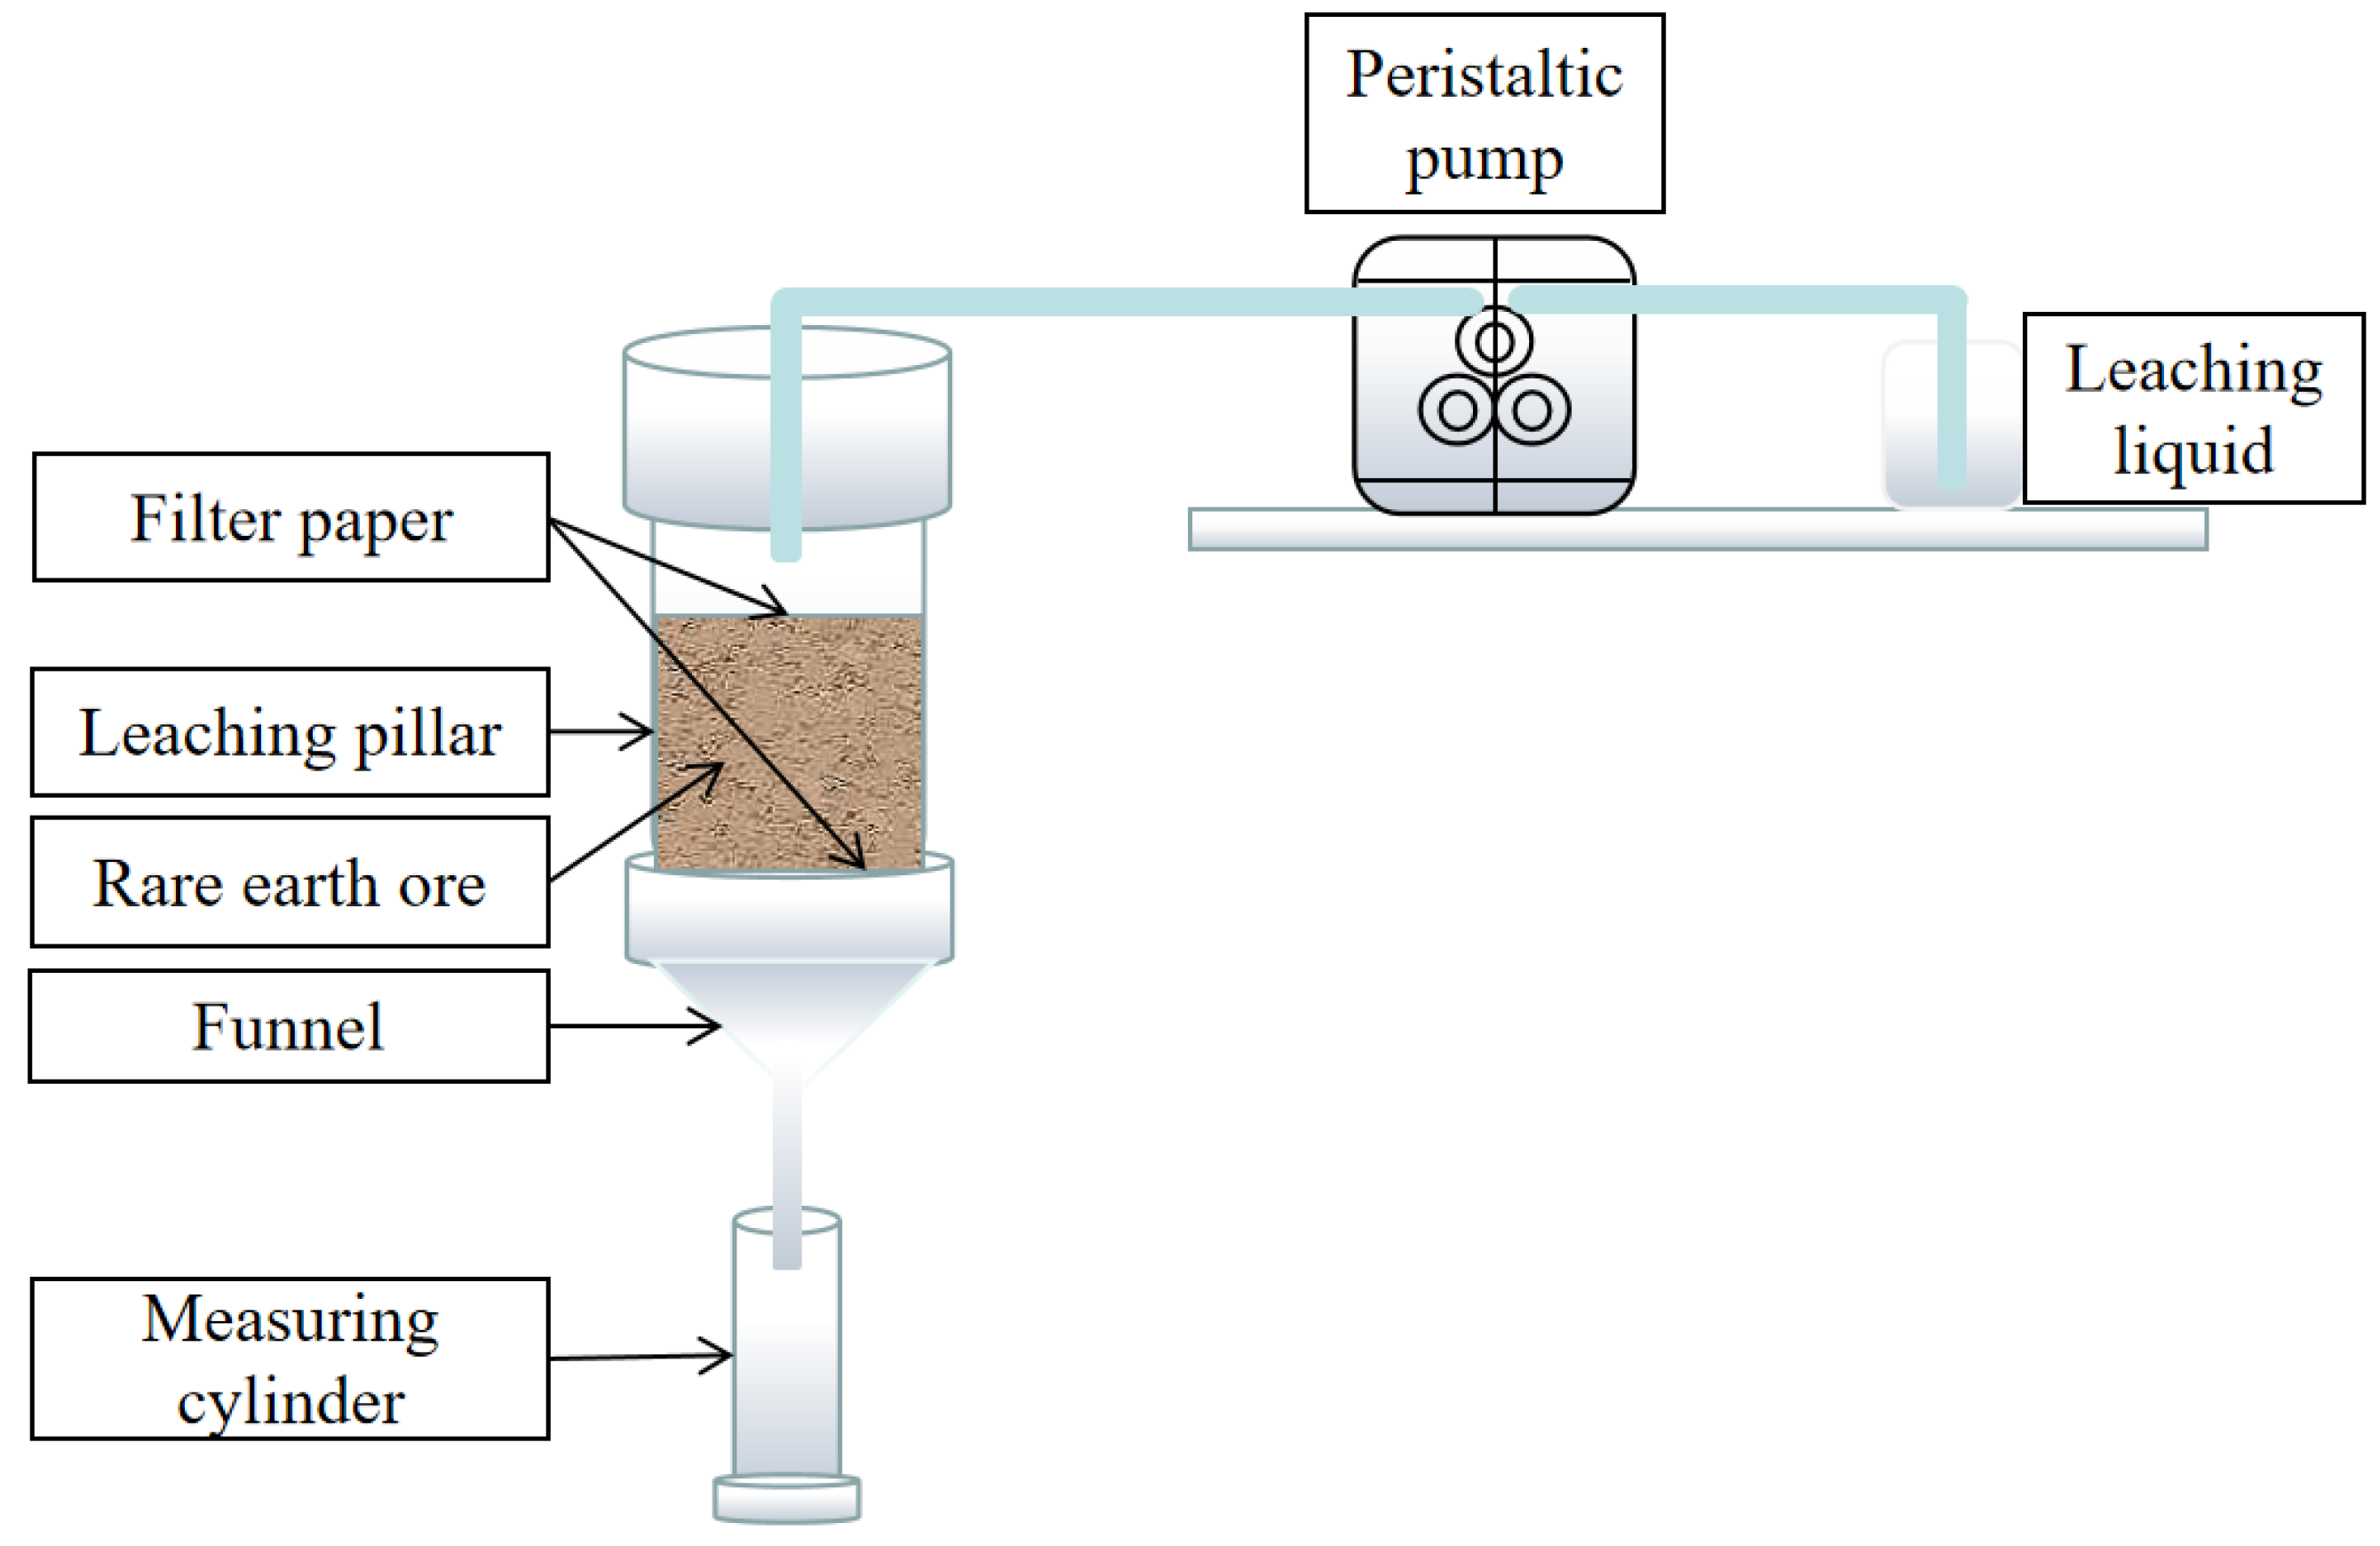
2.2. Experimental Methods and Procedures

The experimental method used in this study was mainly an indoor simulated column leaching method for ionic RE ore, and was strictly implemented with reference to the standard of remodeled soil samples, so that the physical parameters of the remodeled soil were as consistent as possible with the original RE ore. Figure 2 shows the indoor simulated column leaching experimental device. The inner diameter of the selected acrylic tube was 44 mm, the thickness of the tube wall was 2 mm, and the diameter to height ratio of the remodeled soil sample was 44:60 according to the effective area detected by NMR. The leaching of ion-adsorbed RE ores with different concentrations of MgSO4 solution leachant (2.0% and 5.0% mass percent concentration) and DI water was studied in indoor simulated leaching. In the process of leaching, a large number of ion exchange reactions occur within the ionic RE ore, and this process is a dynamic desorption process. The test procedure was to use indoor simulated column leaching method. While using a peristaltic pump to adjust the liquid injection flow rate, the leached mother liquor was collected at the end of each leaching to obtain the required data. The concentration of RE ions in the collected leached mother liquor was determined by using the EDTA volumetric method. During the leaching process, the ion-exchange reaction between Mg2+ in the solution and RE3+ in the RE ore sample resulted in a change in the thickness of the sliding layer on the surface of the RE ore sample particles. According to the theory of the diffusion electric double layer model, the Zeta potential of the colloidal particles was measured by using a Zeta probe potential analyzer from American Colloidal Dynamics (Ponte Vedra Beach, FL, USA). The Zeta potential is usually used to characterize the stability of a colloid [29], which reflects the state of adsorption and desorption of colloids and ions. An NM-60 magnetic resonance rock micro-structure instrument (NM-60, Suzhou Niumaga Analytical Instrument Corporation, Suzhou, China) was selected as the pore structure test of the leached specimens. By using NMR technology, the pore structure parameters of the specimens could be determined quickly and nondestructively, and the T2 distribution curve and porosity of each leached specimen could be obtained. By analyzing the porosity and different pore size distribution of the samples in the column leaching experiment stage, the evolution process of the internal pore structure in the column leaching process could be analyzed dynamically from the microscopic perspective.

3. Result Analysis and Discussion

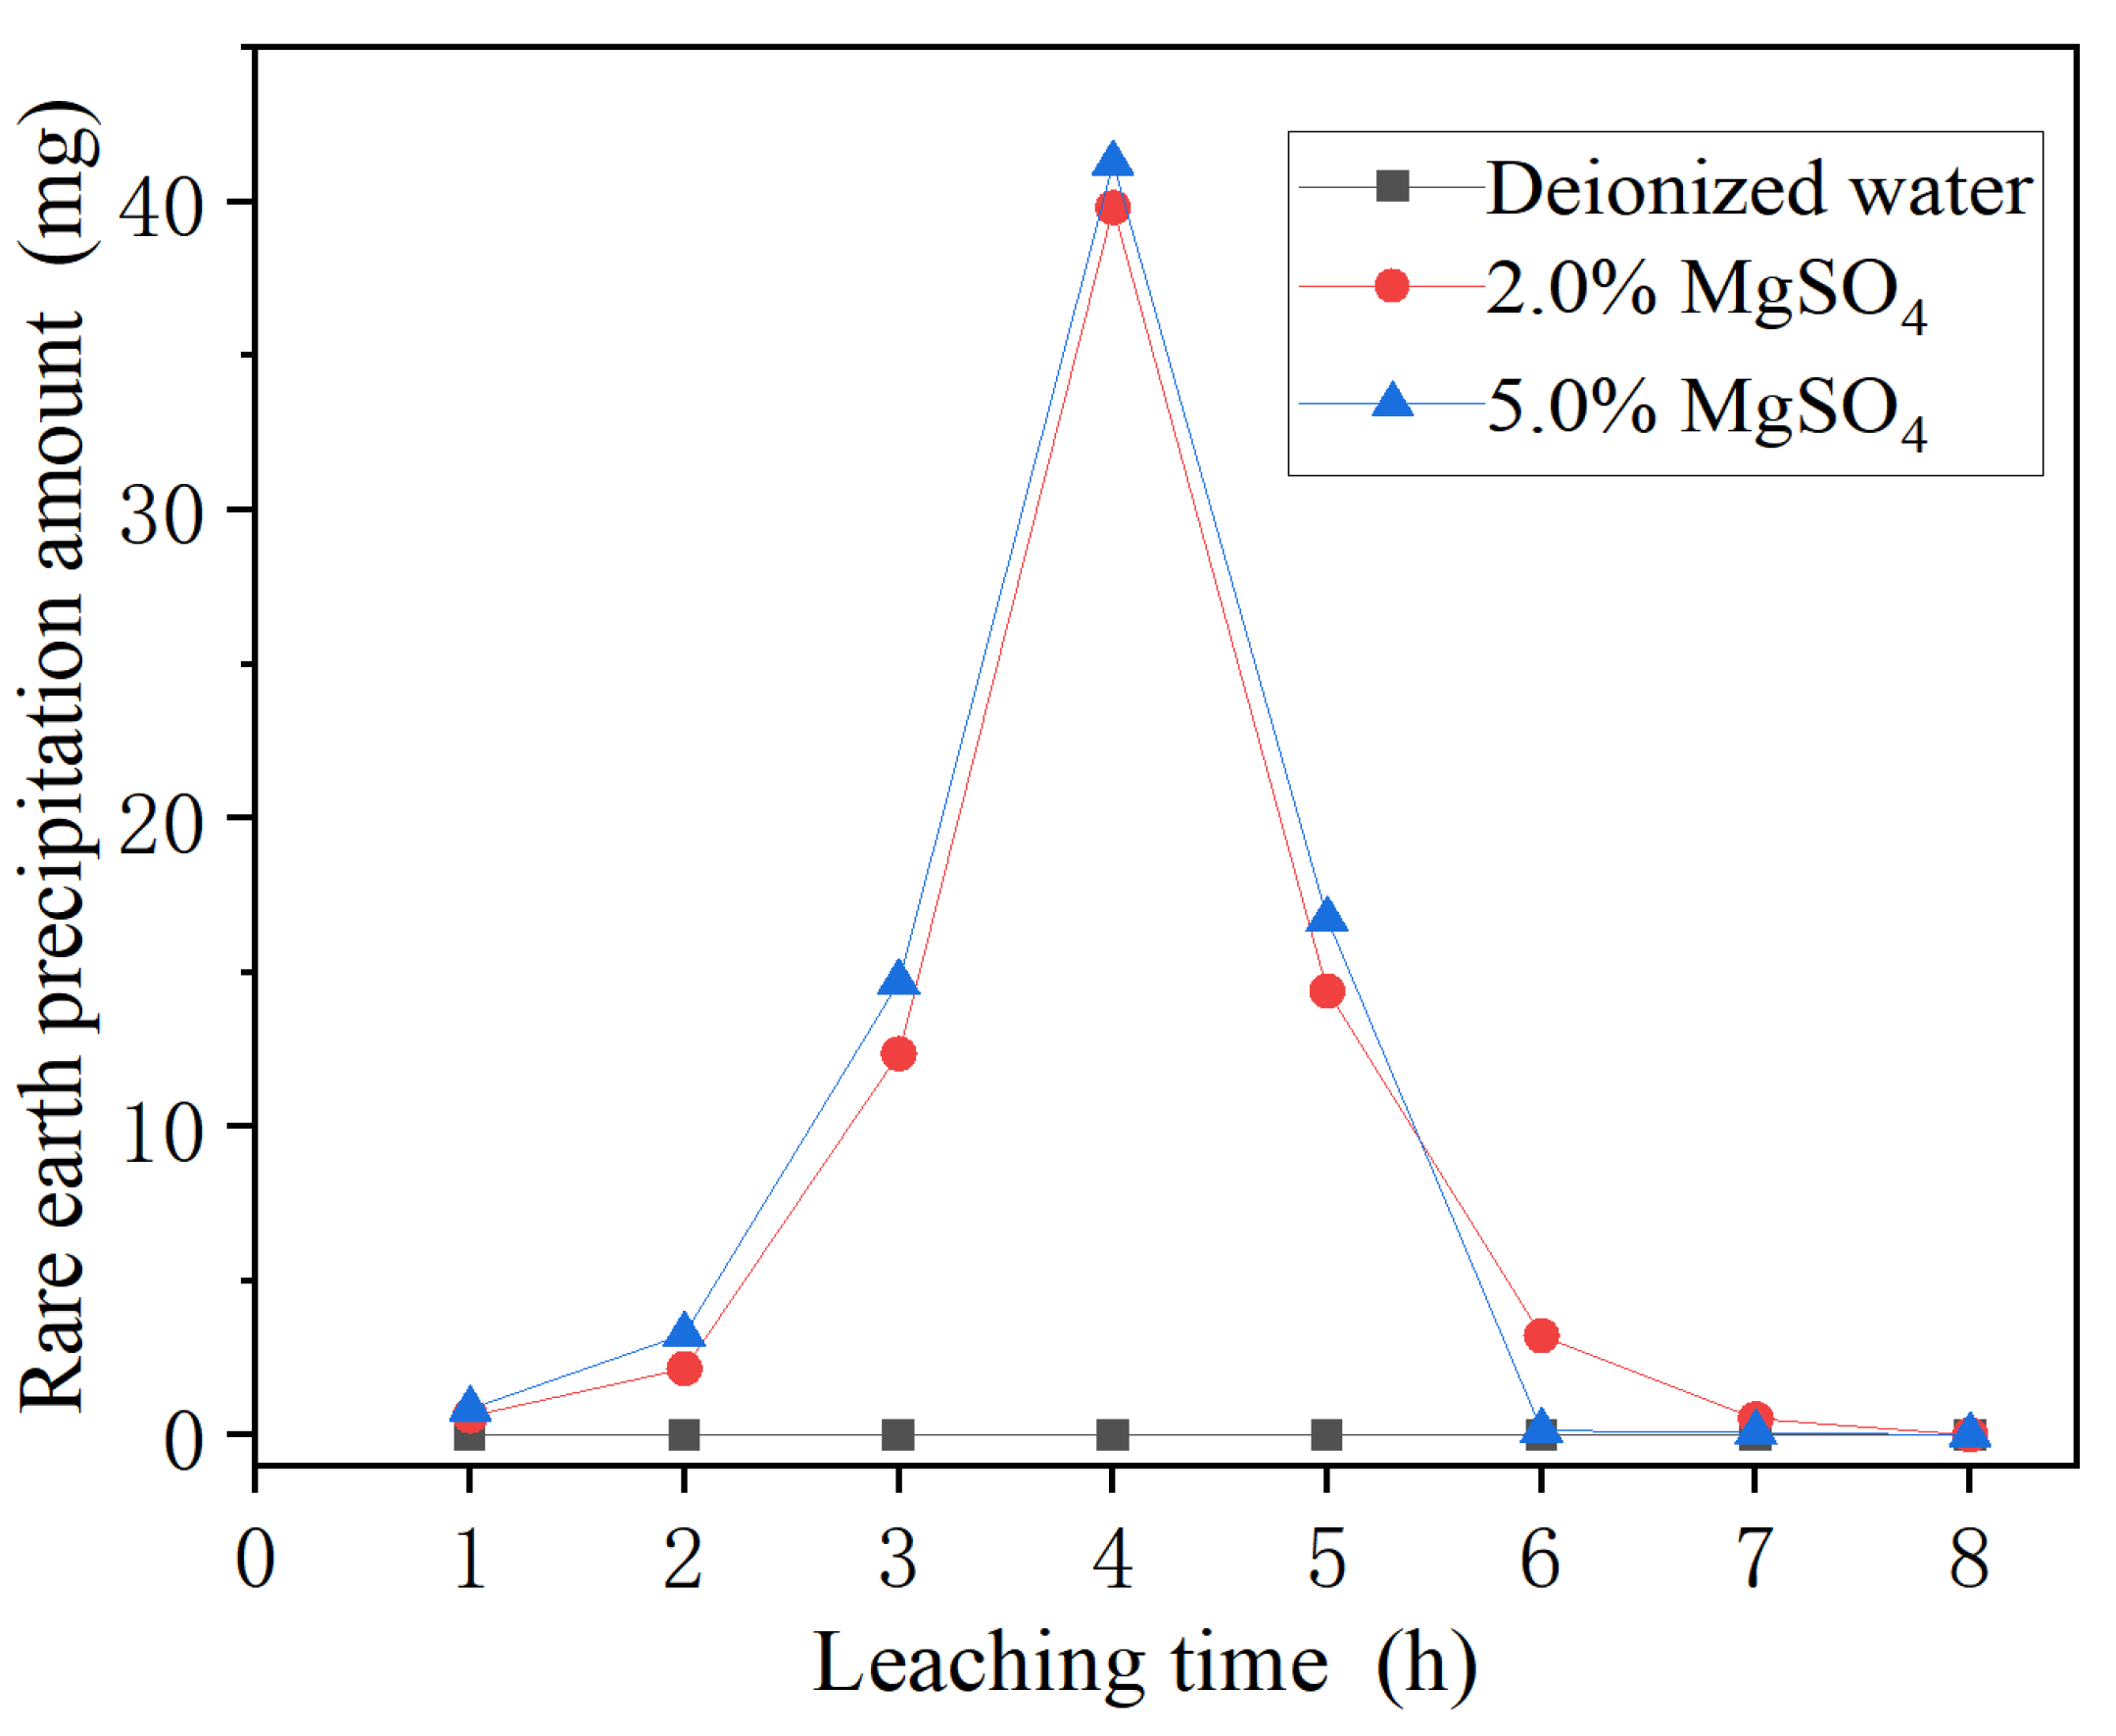
3.1. Changes in RE Ion Content during Leaching

The concentration change of RE cations in the mother solutions collected under different concentration and time was studied. The RE ion content in the leaching solution was detected at one-hour intervals, and the analysis of the detection results is shown in Figure 3. It can be seen from Figure 3 that the content of RE ions in the leaching solution hardly changed when DI water was used as the leaching solution, indicating that DI water leaching cannot induce chemical reactions within the RE ore bodies. However, when the MgSO4 solution was leached, the change curve of the RE ions content in leaching solution first rose slowly and then rose sharply. When the leaching process entered the 4th hour, a large amount of RE ions were exchanged and released at this stage, and the content of RE ions in the leaching solution increased significantly, and precipitation of RE ions reached a maximum at the fourth hour, which indicated the strongest ion exchange. Subsequently, the change curve of RE ions content in the leaching solution decreased sharply and then slowly, and the content of RE ions in leaching solution decreased gradually. At last, there were almost no RE ions detected in leaching solution, indicating that the ion exchange reaction was completed at this moment. By comparing the change curves of RE ions content of 2% MgSO4 and 5% MgSO4 solutions, it was found that the higher the concentration of leaching solution, the shorter the duration of the chemical reaction. There was a difference between the effective leaching time of the two, and the effective leaching time of the high concentration leaching solution was shorter, which also indicates that the high concentration leaching solution accelerated the leaching rate of RE ions.

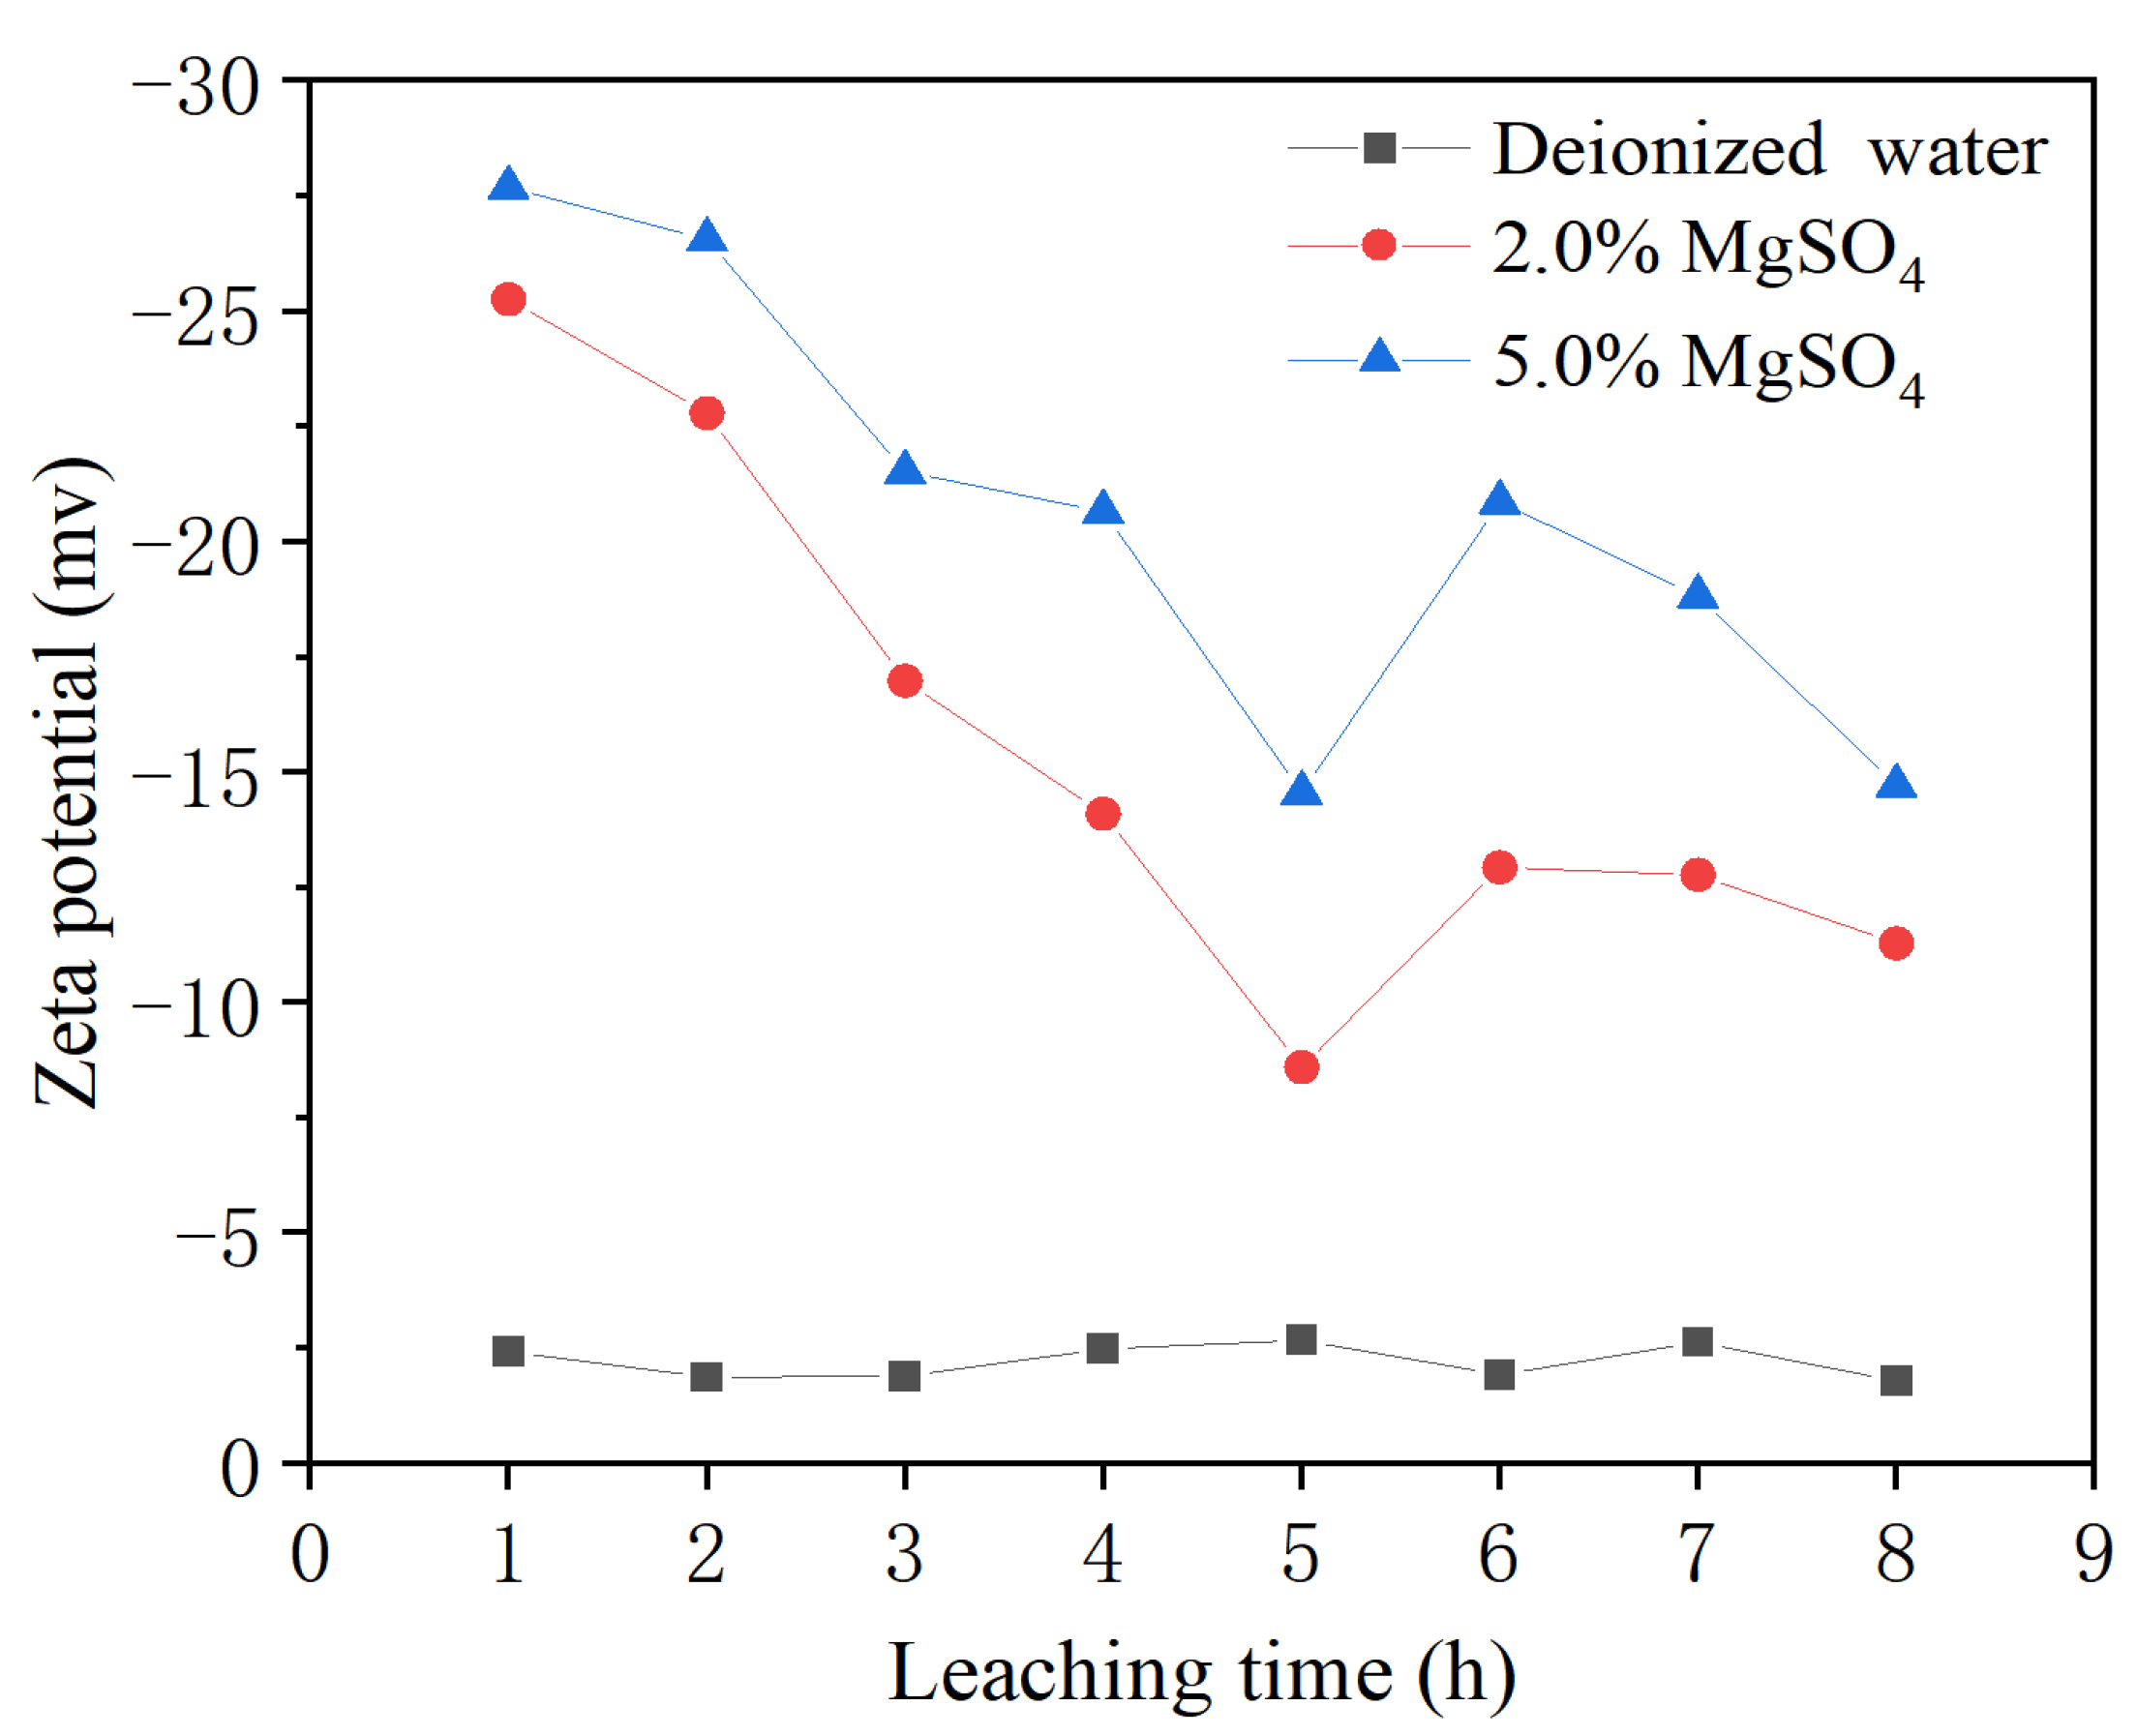
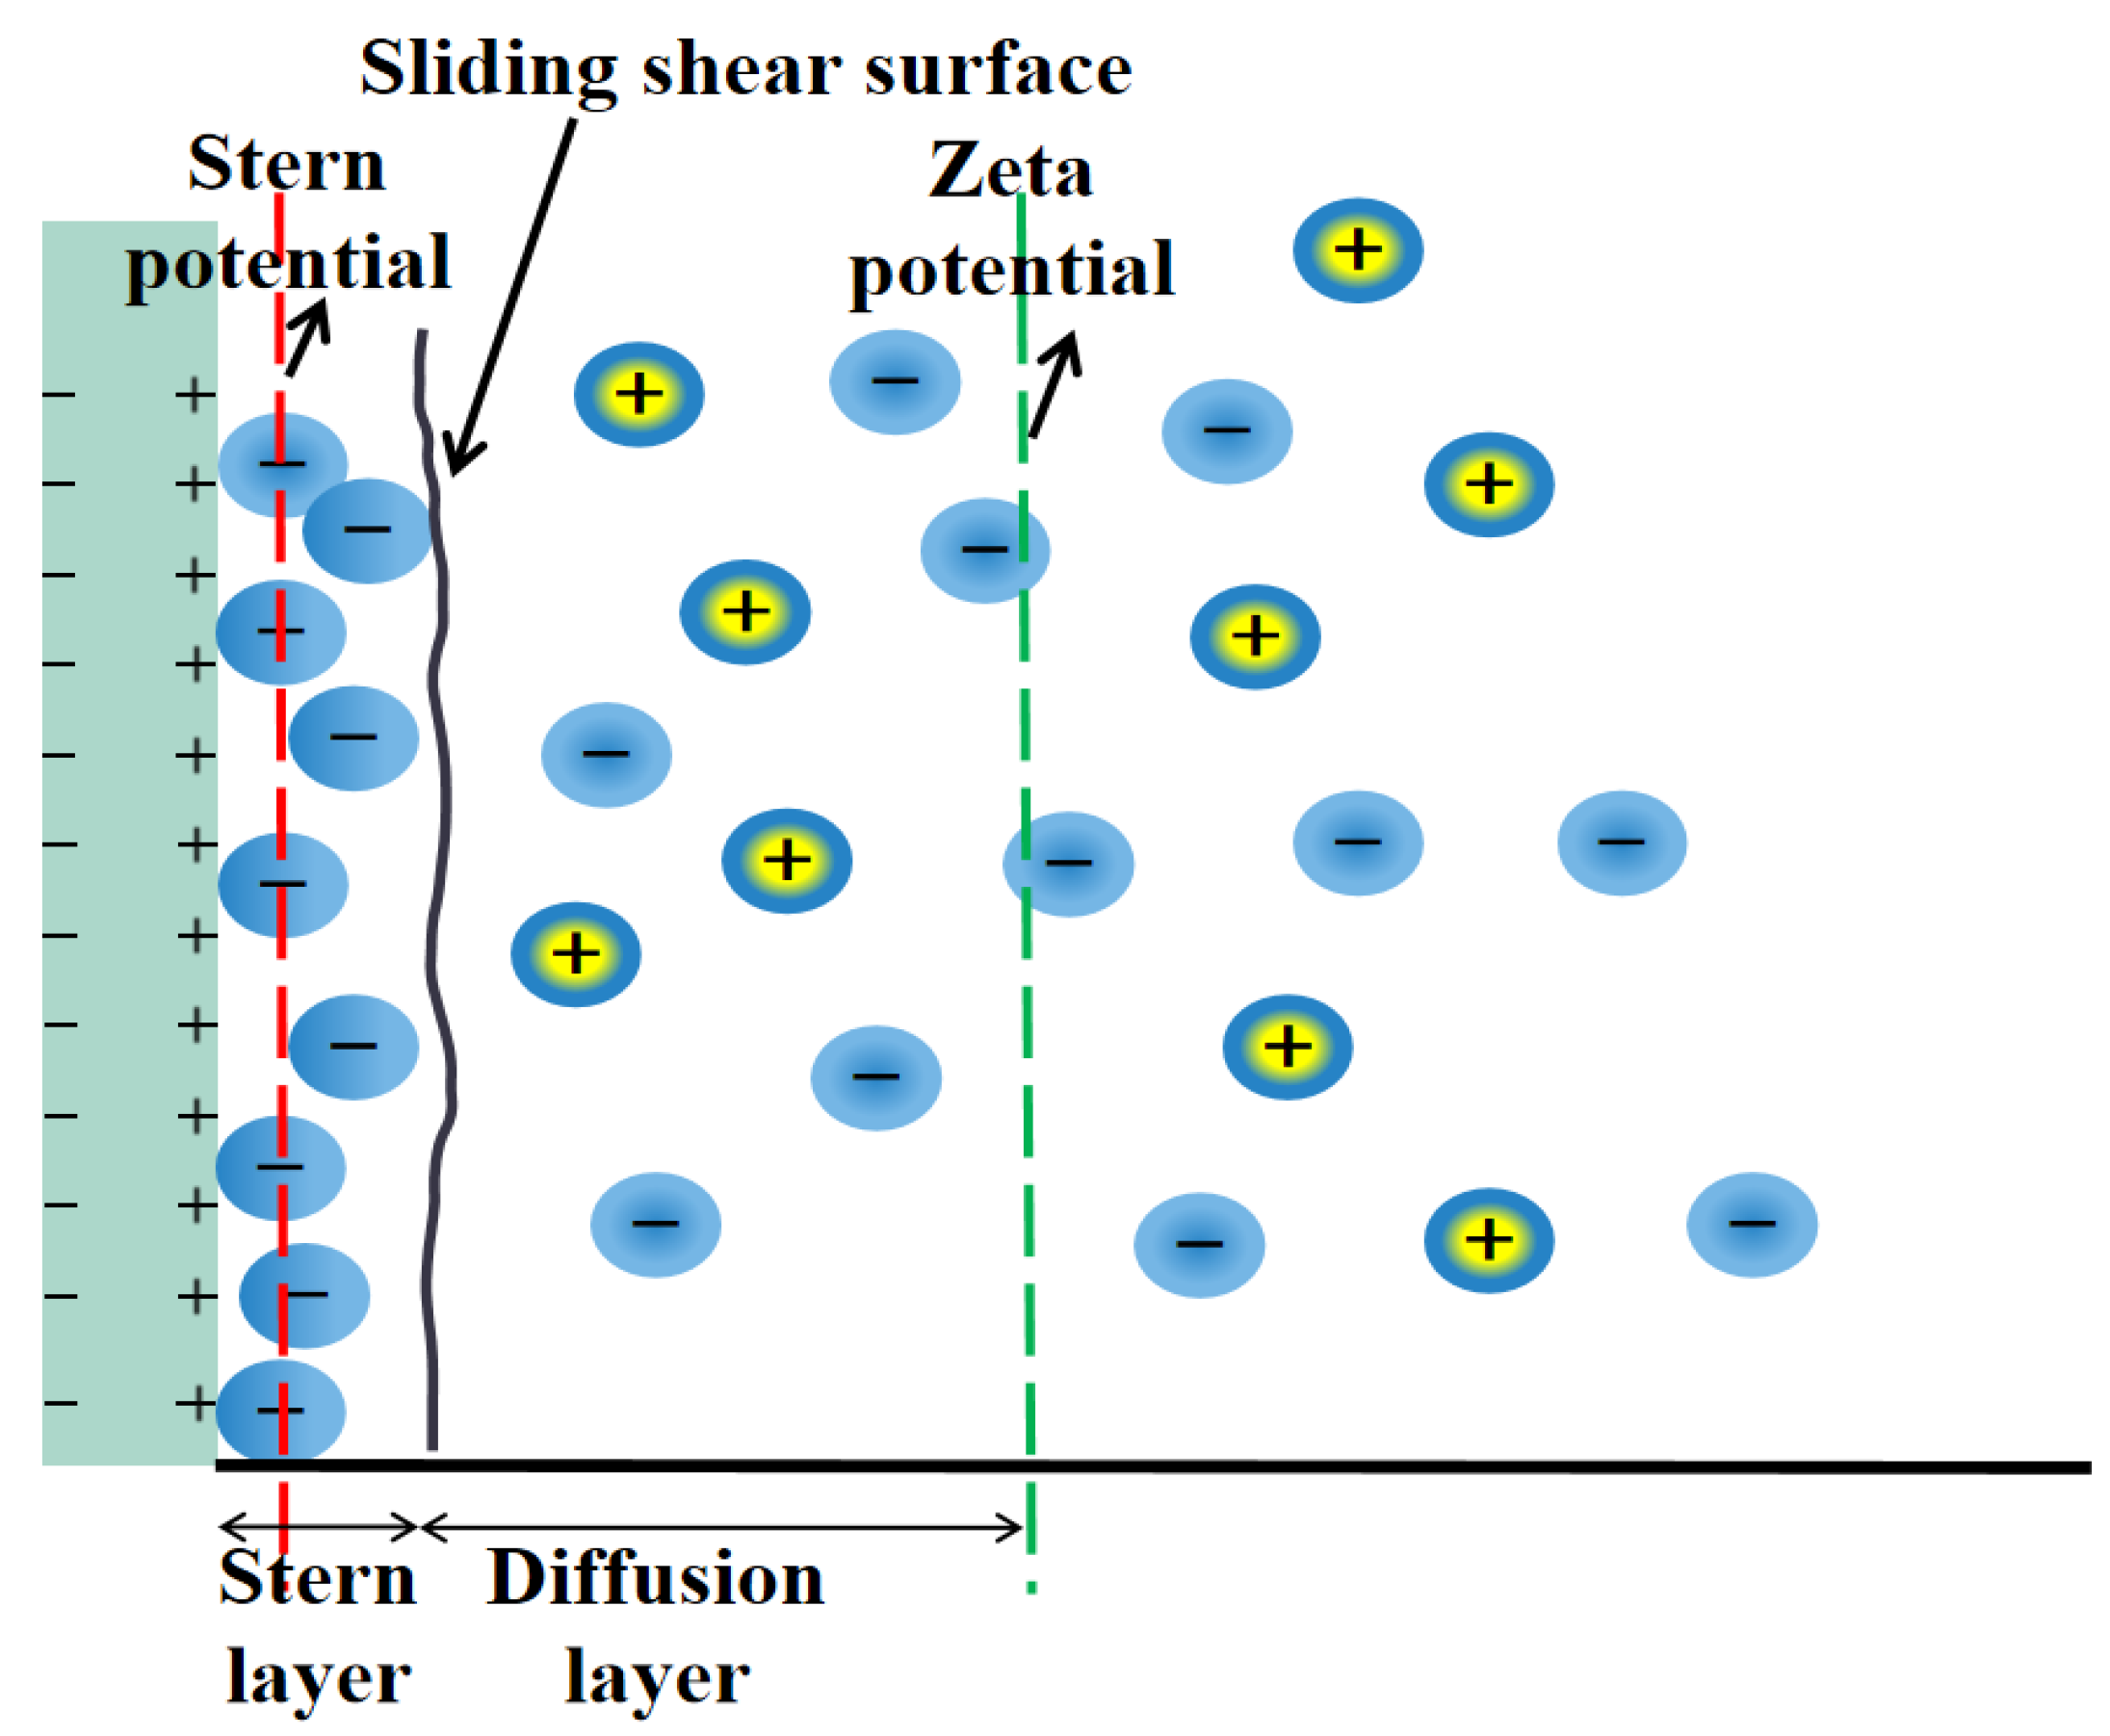
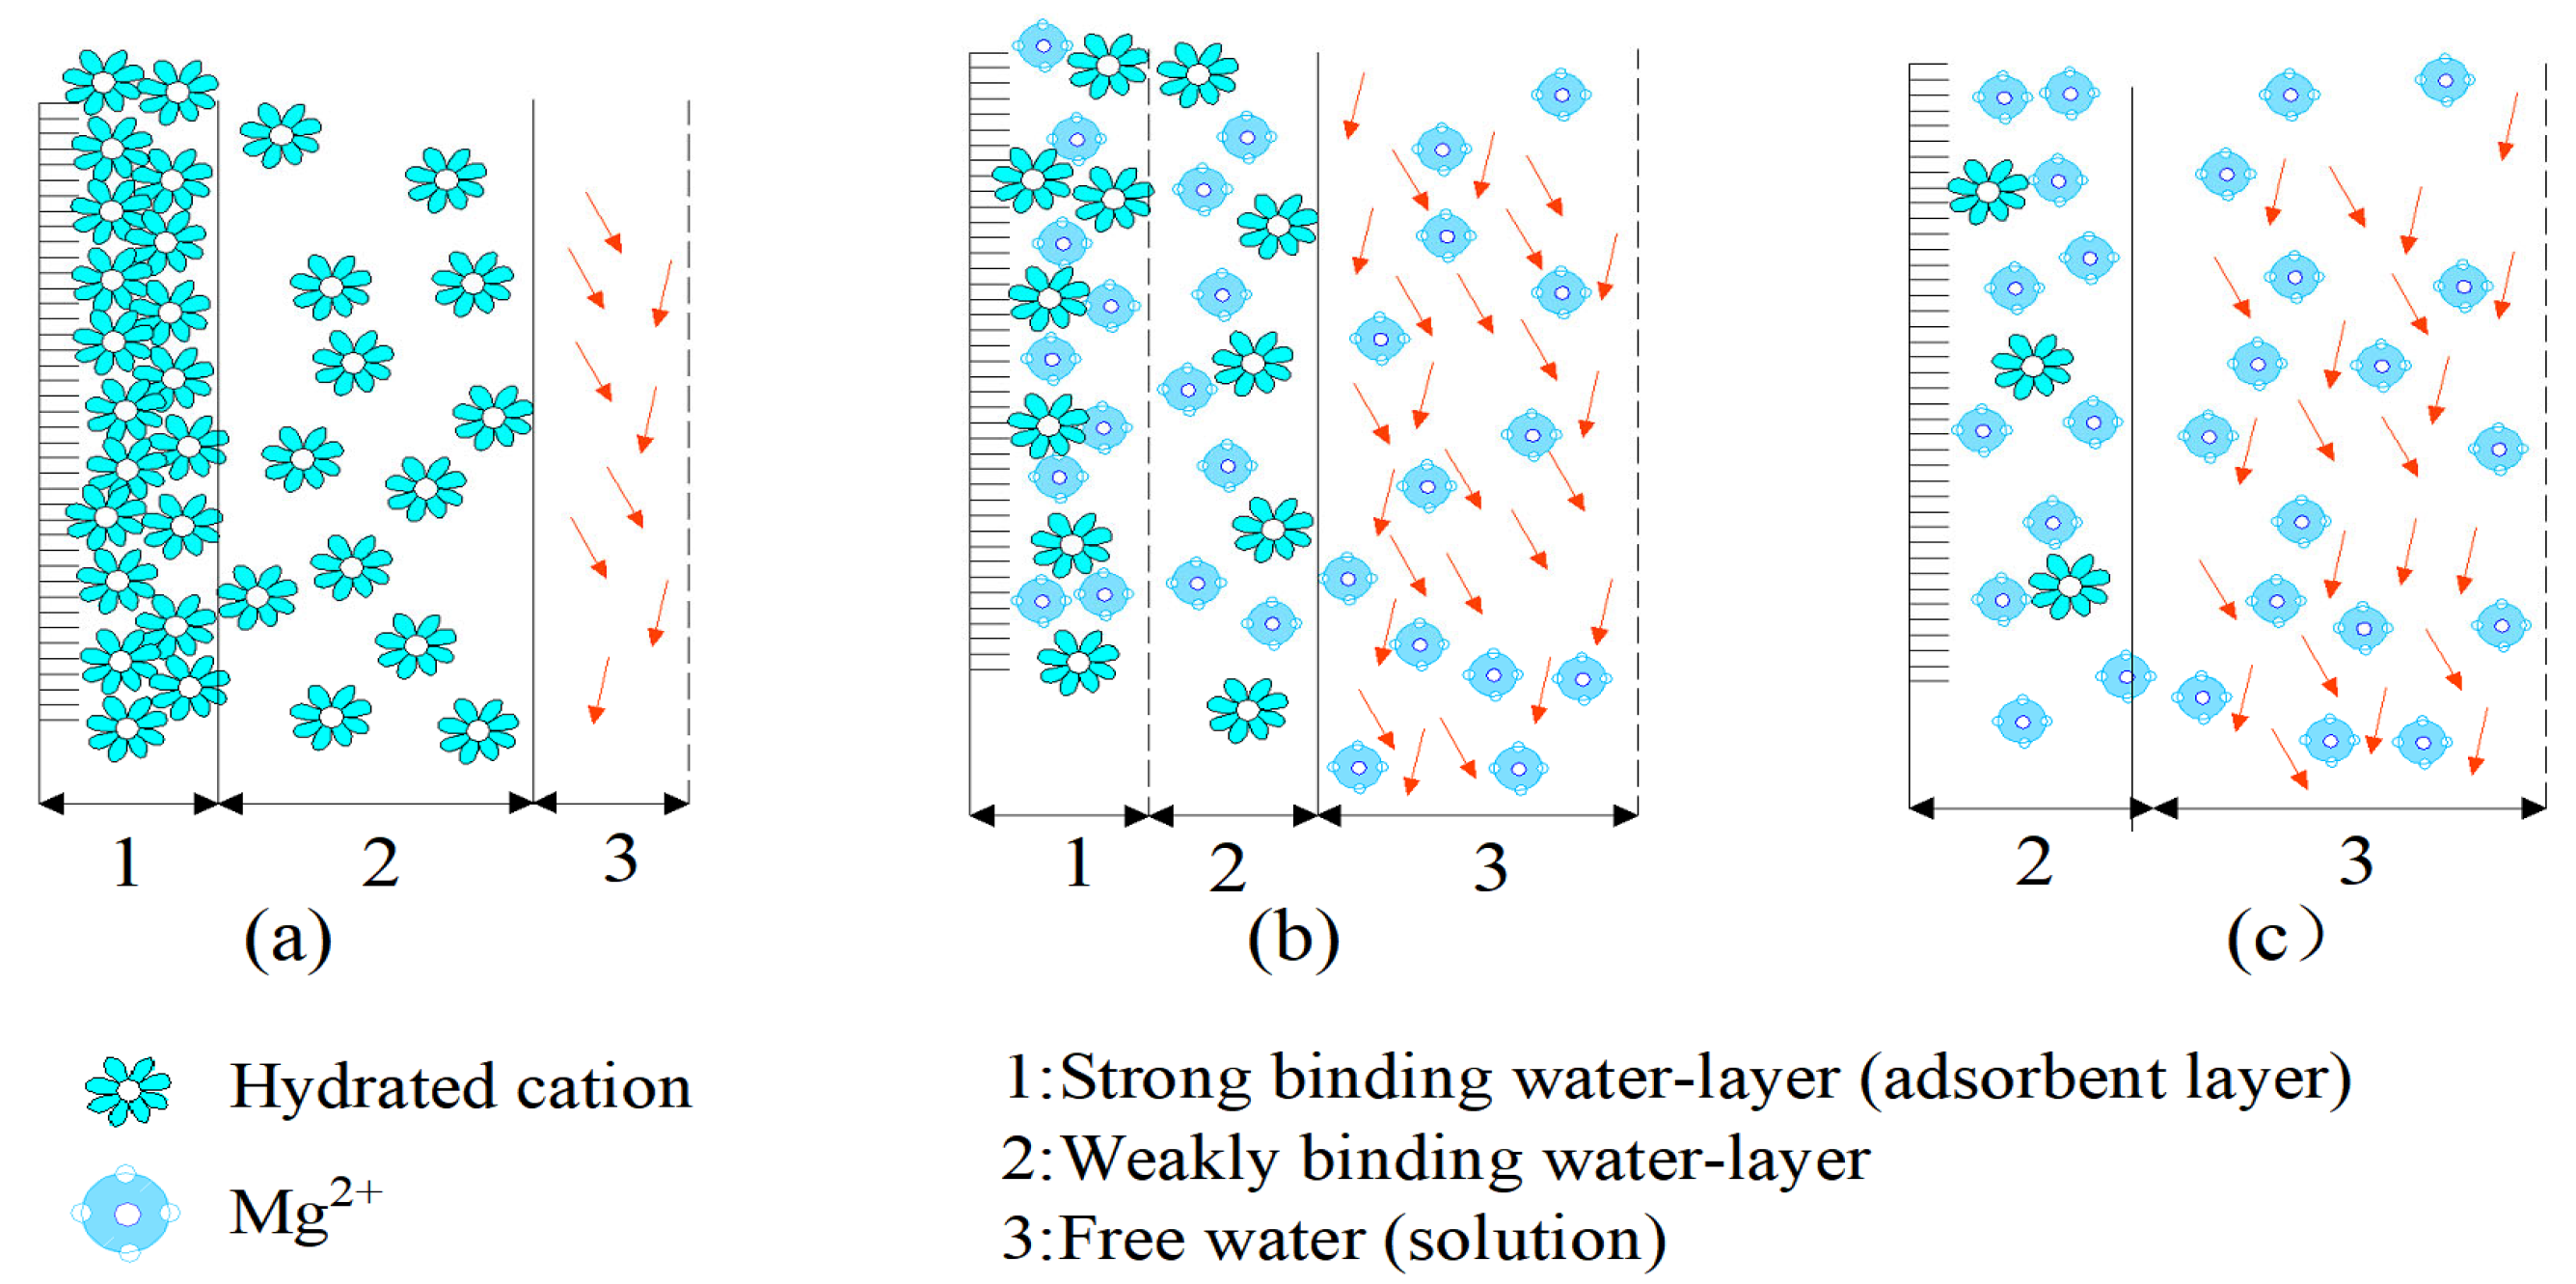
3.2. Zeta Potential Analysis of the Leaching Process

An indoor column leaching experiments were carried out by using three groups of 2.0% and 5.0% MgSO4 solution and DI water was used to analyze pore structure change of the ore body from the Zeta potential. The changes of Zeta potential on the surface of RE particles were measured at one-hour intervals, aiming to systematically analyze the effects of different concentrations of MgSO4 and DI water leaching solutions on the surface Zeta potential of RE particles at different times in the leaching process. The measured Zeta potential results are shown in Figure 4. In the process of ore leaching, the Mg2+ in solution and RE3+ in ore sample undergo ion exchange, which changes the thickness of sliding layer on the surface of ore sample particles. The change of microstructure was analyzed according to the theory of diffusion double layer model. In the first hour, the RE3+ in the mineral sample had already exchanged with Mg2+ in the solution, and the absolute value of Zeta potential on the surface of the RE particles was the highest at this time. The absolute value of Zeta potential on the surface of the RE particles decreased as the ion exchange reaction proceeded, which may be due to the decrease of permeability caused by the blockage of some pore structures during the leaching process. The precipitation rate of RE ions was smaller than the rate of ion replacement reaction, resulting in a small increase in the amount of RE ion in the specimen, which caused a small increase in the absolute value of Zeta potential.
The mechanism of pore structure evolution is actually the deposition and release of particles on the pore structure of the ore body. The double electric layer structure generated during the ion exchange reaction causes inter-particle interaction forces, resulting in the deposition and release of fine particles within the ore body, which in turn produces dynamic pore structure evolution. The pore structure change caused by Zeta potential change was analyzed from the microscopic point of view. Since the RE ore body has a large number of negative charges, equal amounts of positive charges of different sign must exist around the particles to achieve overall electrical neutrality. Due to the electrostatic attraction of the surface negative charge, the anti-ions tend to gather on the particle surface. At the same time, due to the thermal movement of the ions, the ions tend to be evenly distributed in the solution. Finally, a special structure, namely a diffusion double electric layer, appears near the ore body surface. The surface charge of the dispersed particles attracts the surrounding counter ions, which are distributed in a diffuse state at the interface of the two phases. According to DLVO (Derjaguin-Landan-Verwey-Overbeek) theory, these phenomena are well established and reviewed based on classical DLVO theory. The electric double layer can be divided into two parts, i.e., the Stern layer and diffusion layer. The model of electric double layer structure is shown in Figure 5.
Due to van der Waals force and electrostatic repulsion, the first layer of cations are strongly bound to the surface of the adsorption layer, constituting the compact layer of the electric double layer. The cations outside the compact layer can diffuse to the fluid body due to the concentration difference, which in turn forms the diffusion layer of the electric double layer. The diffusion layer is controlled by electrostatic forces and concentration difference diffusion, the interface between the compact layer. The diffusion layer is called the sliding shear surface. The potential at that point to a point in the fluid away from the interface is called the Zeta potential. The Zeta potential is the potential difference between the continuous phase and the stable layer of fluid attached to the dispersed particles, which can be directly determined by a Zeta potential meter. The electric double layer structure plays a key role in particle interactions and interfacial phenomena. While the sliding layer thickness is an important parameter in diffusion electric double layer, it refers to the distance from the sliding surface to the particle surface, which has an important effect on the generation of numerous interfacial processes such as particle stability. The electric double layer structure can be used to analyze the process of gradual change of the strong and weak bound water layer [30]. When the RE ore is leached with DI water, a large number of hydrated cations are adsorbed, and a strong bound water layer is formed due to the electric field generated between the mineral particles. The strongly bound water layer hinders the percolation of DI water, so the permeability of DI water in the ore body is small, as shown in Figure 6a. When leaching with 2% MgSO4 solution, the presence of Mg2+ in the solution and the negatively charged material in the mineral particles form part of the new charge equilibrium, weakening the original electric field effect, resulting in a weakening of the strong binding water layer. The weakened strong binding water layer reduces the 2% MgSO4 solution in the ore body percolation obstruction, the channel of the free solution becomes larger in the percolation, and the effective pore of the ore body becomes larger (see Figure 6b). The 2% MgSO4 solution in increases the ore body permeability more than the DI water. However, when leaching with 5% MgSO4 solution, due to the increase of Mg2+ concentration in the solution, the Mg2+ concentration time is fully able to balance the negatively charged mineral particles in the mineral, so the strongly bound water layer in the ore body gradually changes into a weakly bound water layer, so that the channel of free solution in the ore body continues to increase and the effective pore space in the ore body increases (see Figure 6c). It can be seen that the change of the internal structure of the ore body is further increased when leaching with 5% MgSO4 solution, the corresponding permeability increased and the effective pore space increased, which accords with the later pore structure experimental results of NMR.

3.3. Pore Structure Evolution of RE Ore Specimens during Leaching

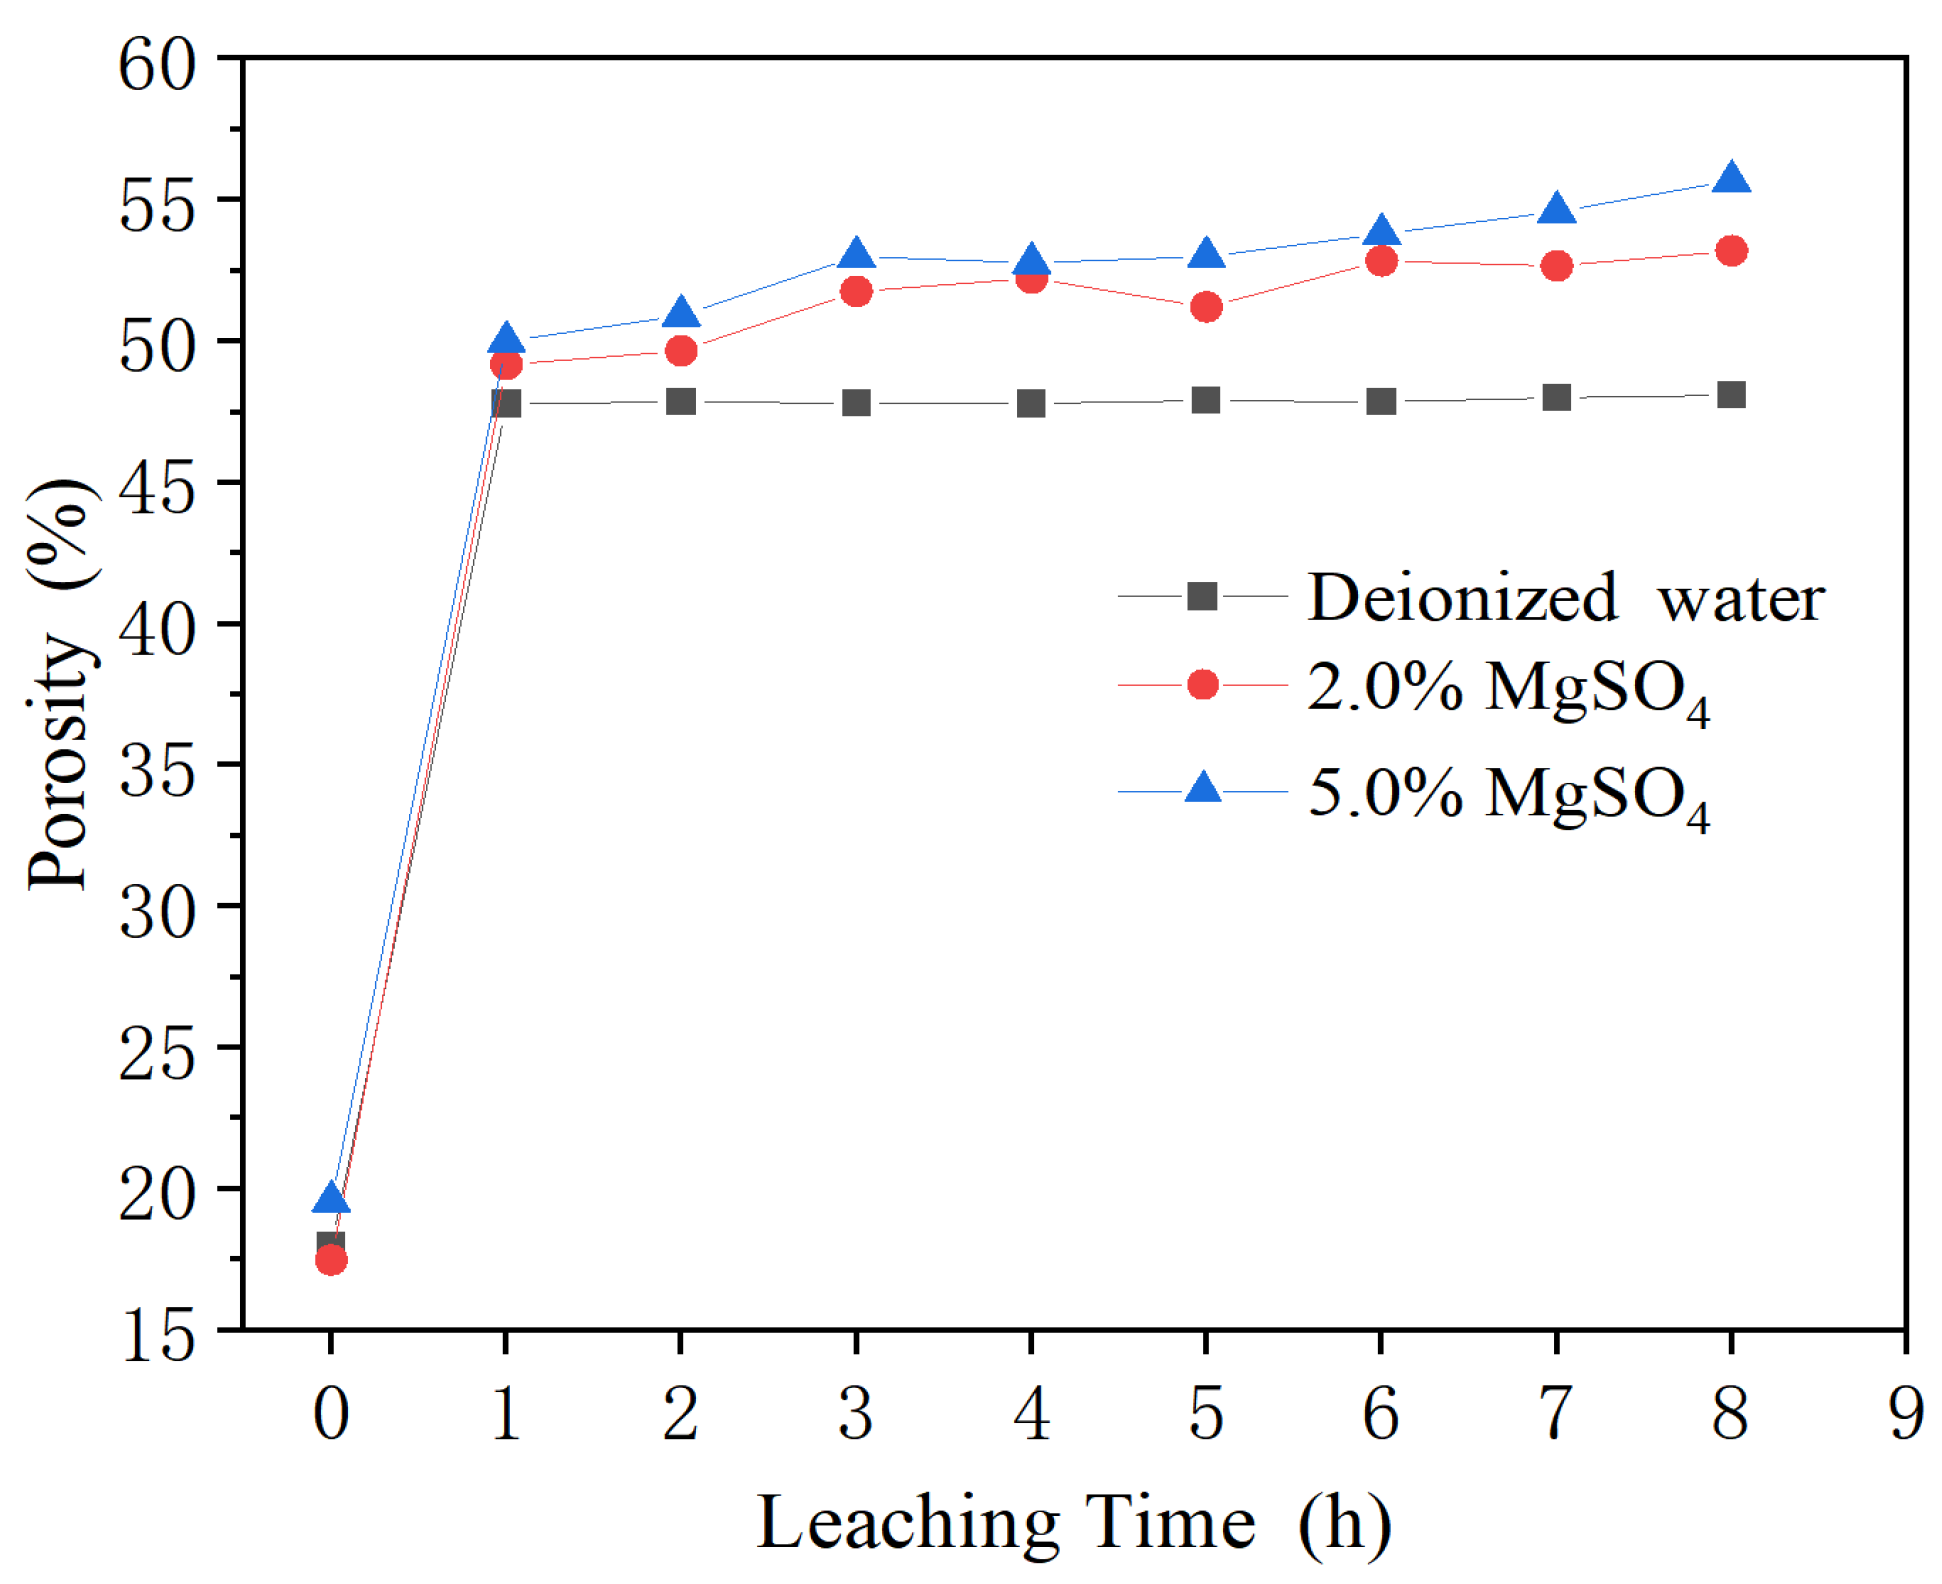
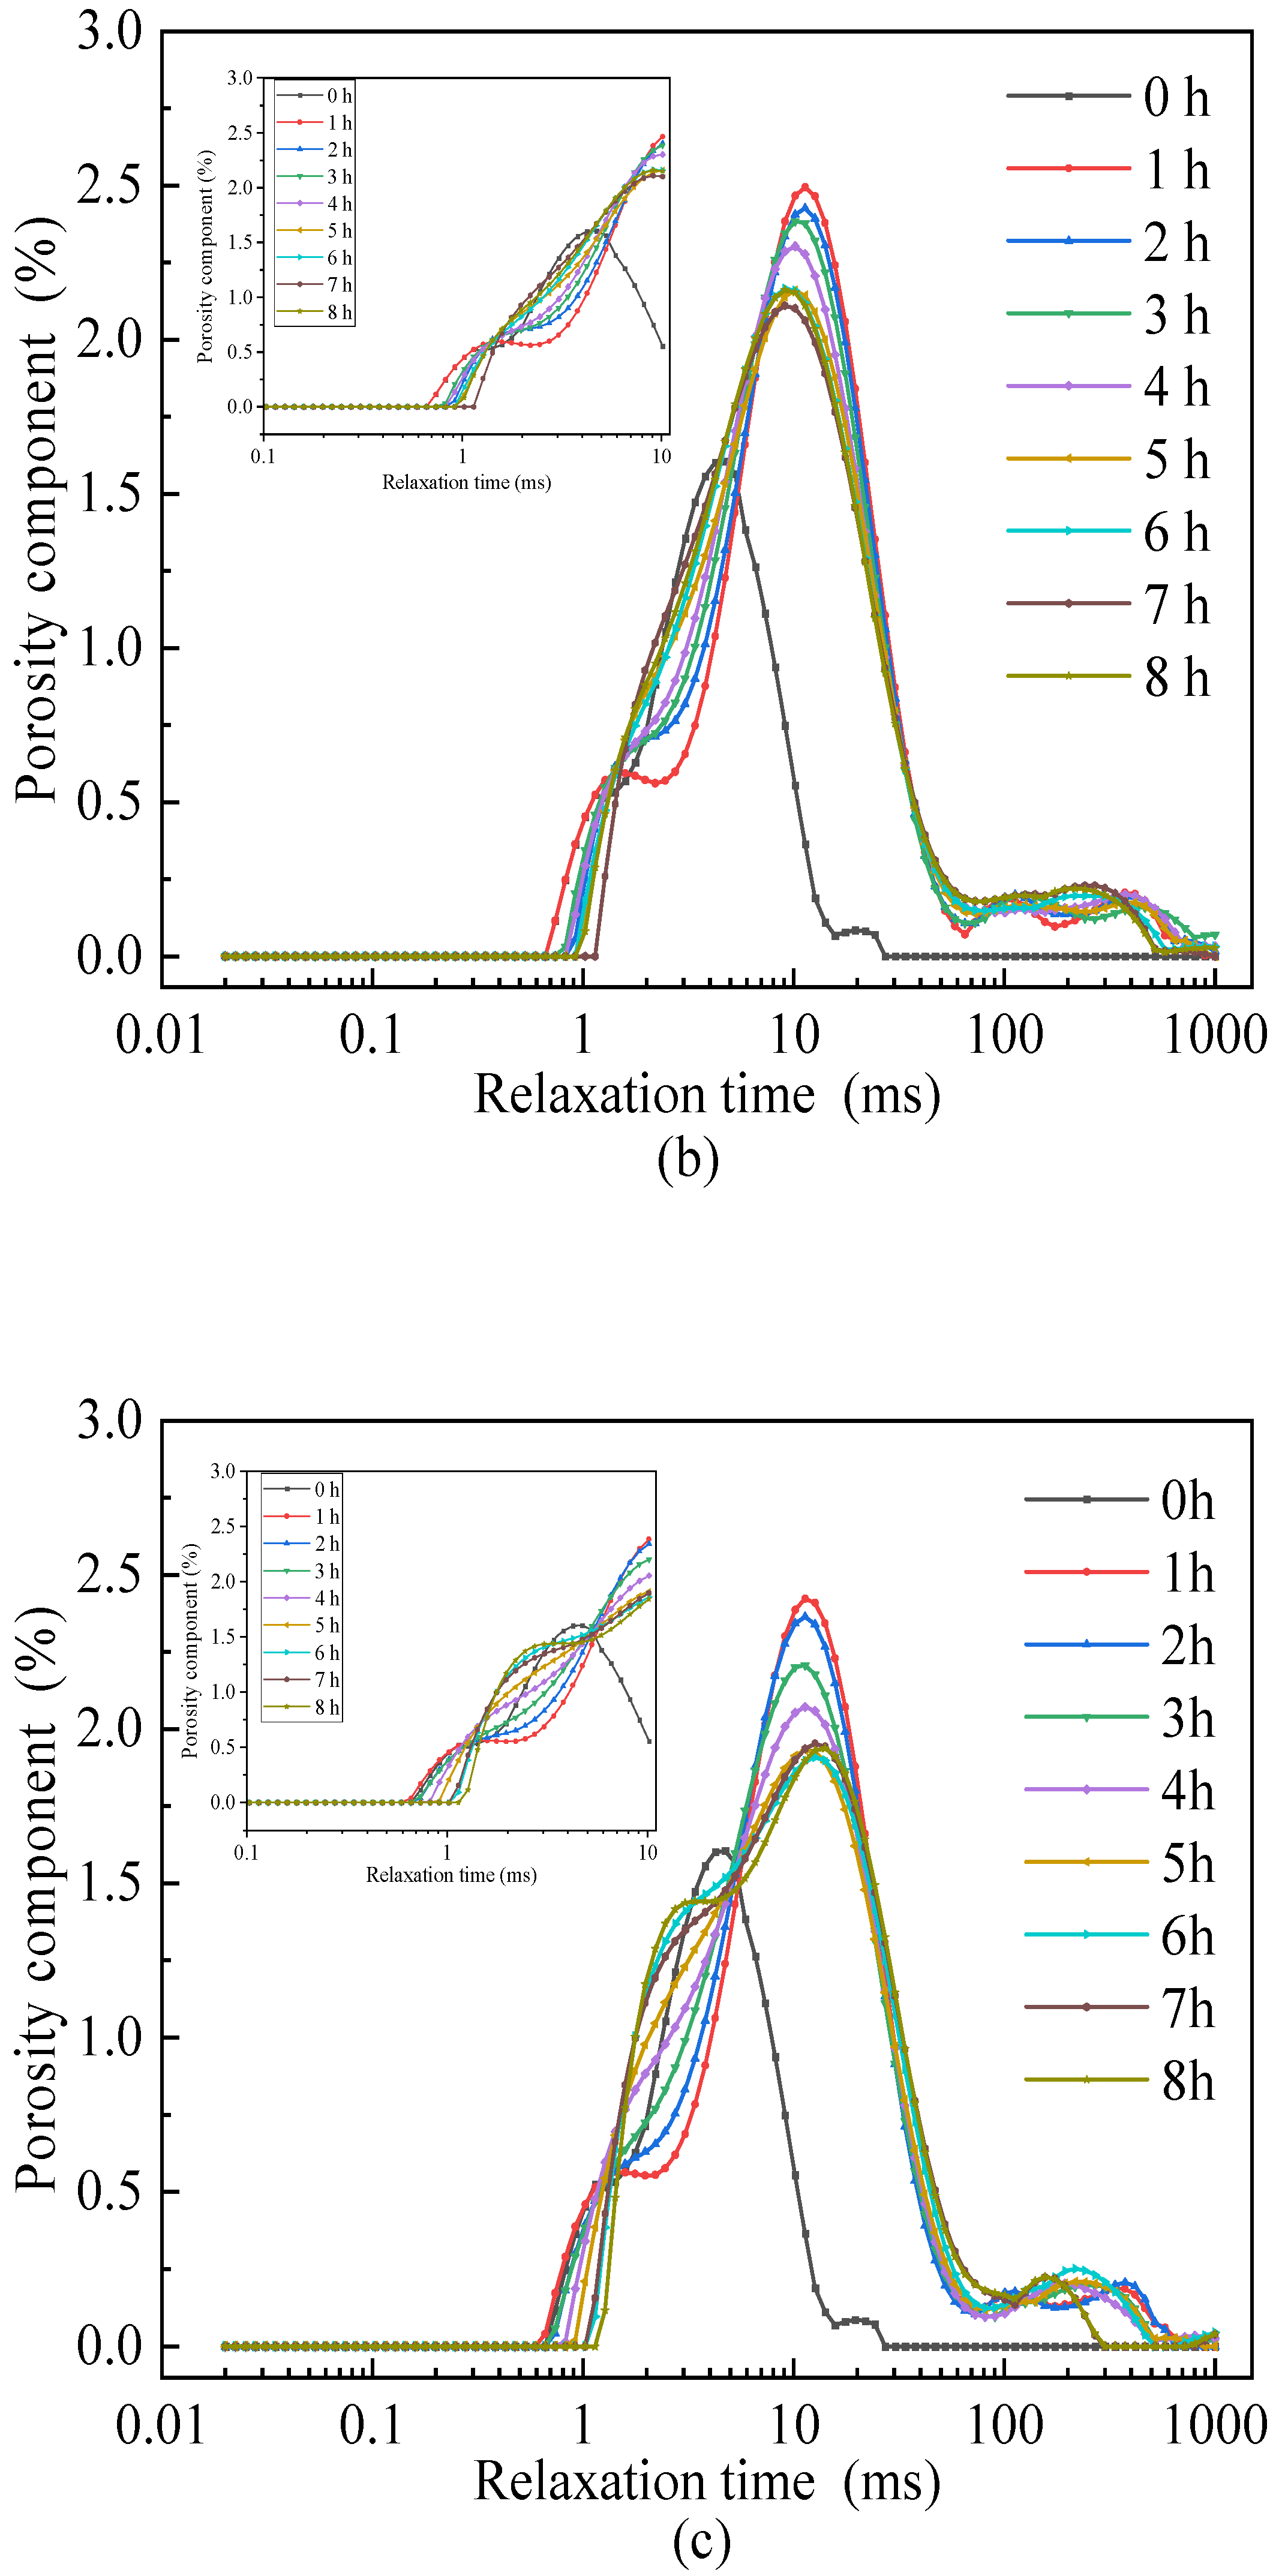
3.3.1. Changes in Porosity of the Ore Body during Leaching

In the parallel experiments, the pore structure of the leached specimens was examined by putting them into the NMR instrument at one-hour intervals, and the change of porosity of the remodeled RE specimens at different moments under the action of leaching solution was obtained by the NMR instrument. The measured data are shown in Figure 7. The porosity of the specimen with DI water leaching increased rapidly and reached the maximum value in the first stage (0–1 h), then remained unchanged later stage of leaching. The porosity of the specimen with MgSO4 solution leaching increased rapidly in the first stage (0–1 h), and showed a small increase in the later stage of leaching. The change of porosity of MgSO4 solution leaching was greater than that of DI water, which indicates that the chemical replacement effect had a greater influence on the pore structure than the percolation effect. Relative to DI water leaching, a chemical reaction occurs when MgSO4 solution leaches the ore. The ion exchange reaction changes the thickness of the sliding layer on the surface of the ore sample so that the channel of free solution in the ore body continues to expand, which increases the porosity of the specimen. As shown in Figure 7, the porosity of the MgSO4 solution leaching ore is larger than that of DI water leaching. The values of porosity under the combined action of permeation and chemical reaction are larger than those of DI water leaching without chemical action, which also indicates that the chemical reaction action further induces the change of porosity in the RE ore body.

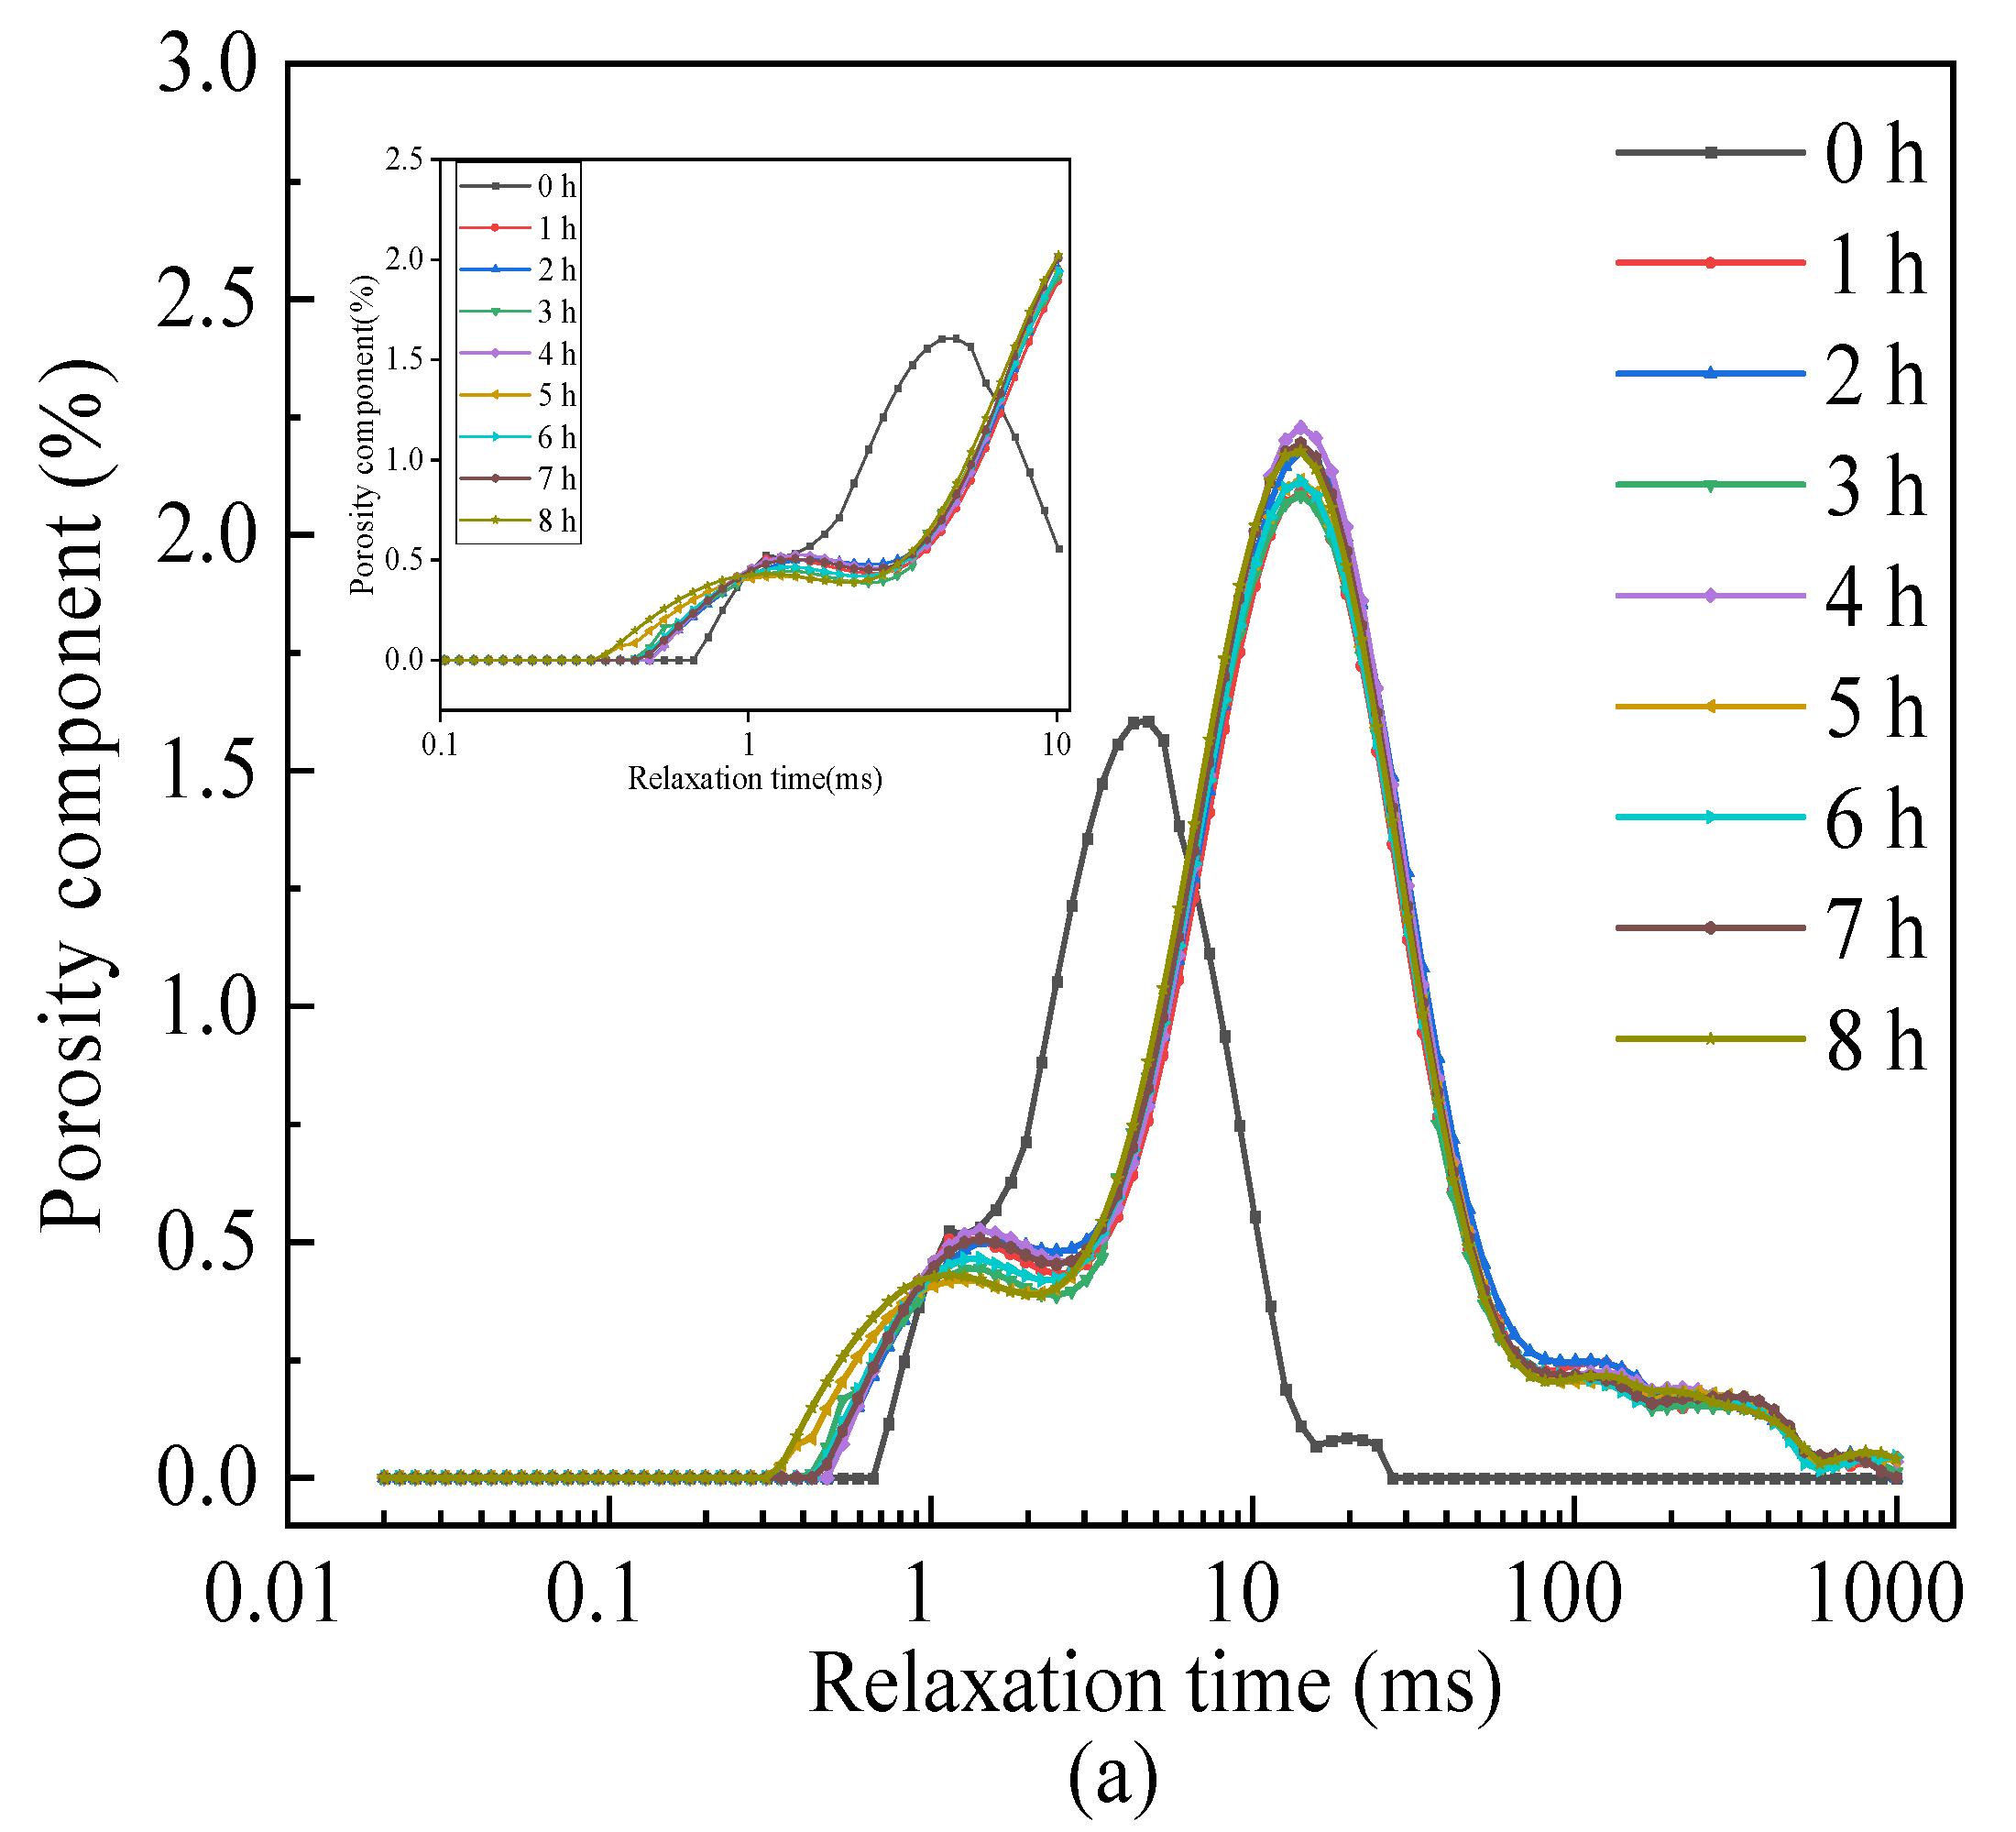
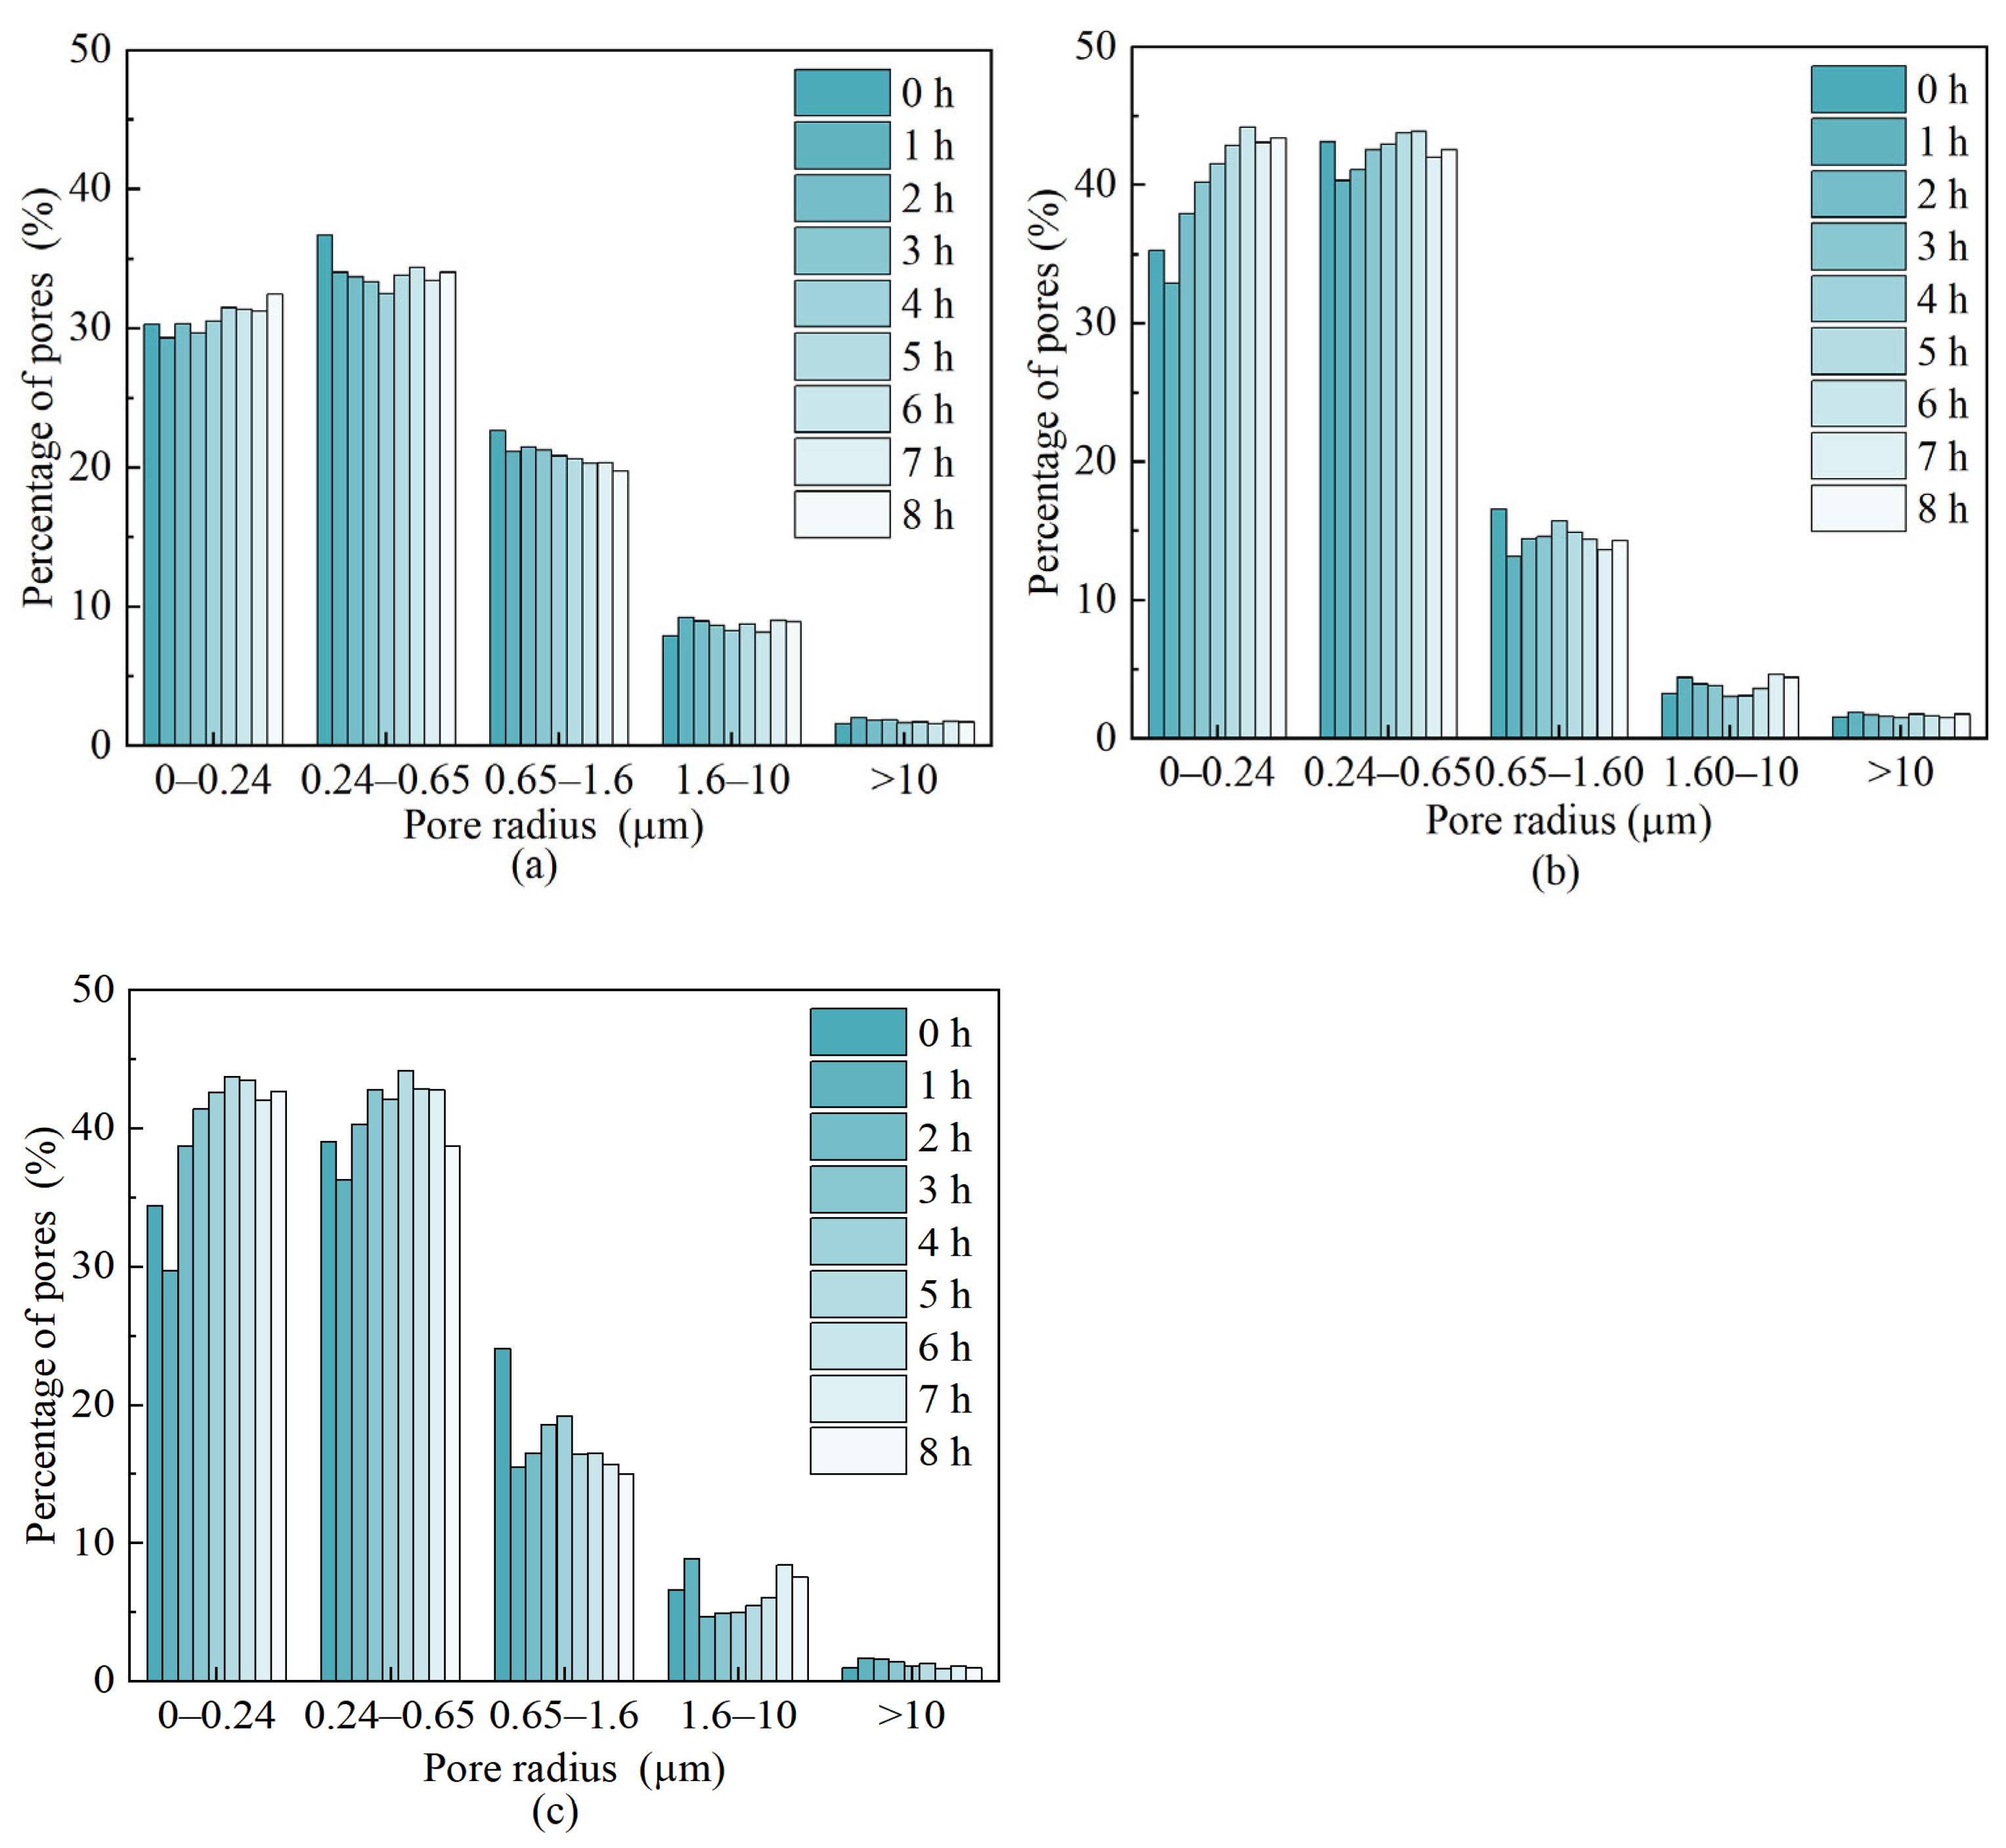
3.3.2. Changes in the Pore Size of the Ore Body during Leaching

The change of pore structure in the sample was measured by NMR technology, and the evolutionary relationship of microscopic pore structure of the sample was obtained. NMR is a technique for obtaining information about hydrogen protons based on the interaction of hydrogen nuclei in the sample measured with an external magnetic field. During the test, the sample is placed in a magnetic field and a pulse of a certain frequency is applied. The hydrogen nucleus in the sample absorbs the electromagnetic wave of a specific frequency and jumps from a low energy state to a high energy state, with the magnetization vector deviating from the equilibrium state. When the pulse stops, the absorbed energy is released from the nucleus and the nucleus returns to the equilibrium state from the disequilibrium state. According to the relaxation mechanism of NMR, there are three kinds of relaxation for the fluid in the pore, namely, transverse volume relaxation, transverse surface relaxation and diffusion relaxation. The transverse relaxation time T2 can be expressed by the following Equation (1) [31]:
1 T 2 = 1 T 2 B + ρ 2 ( S V ) + D ( γ G T E ) 2 12
where T is the volume relaxation time of the fluid, ms, D is diffusion coefficient, μm2/ms, G is the magnetic field gradient, 10−4 T/μm, TE is echo interval, ms, V is the pore volume, μm3, S is the pore surface area, μm2, γ is the magnetic spin ratio, (T∙ms)−1, and ρ2 is the transverse surface magnetic susceptibility, μm/ms. ρ2 depends on the nature of the pore surface, mineral composition and fluid properties. T2B value is 2000~3000 ms. Since the value of T2B is much larger than T2, the first term on the right side of Equation (1) can be ignored; When TE is small enough, the third term on the right side of Equation (1) can also be ignored, so Equation (1) can be simplified as follows:
1 T 2 = ρ 2 S V
Then the relationship between the transverse relaxation time and the pore radius can be expressed as [32]:
1 T 2 = ρ 2 S V = F S ρ 2 r
where r is the pore radius, μm, FS is the pore shape factor, with a spherical pore, Fs = 3, and a columnar pore, Fs = 2.
The T2 distribution curve of the leached specimens was measured using three groups of 2.0% and 5.0% MgSO4 solution and DI water in indoor column leaching experiments, and the T2 distribution curves of the leached specimens were measured at one-hour intervals using the NMR technique. The envelope formed by the T2 spectrum curve, and the x-axis is an indicator of the number of pores inside the specimen; the larger the area of the envelope, the greater the number of pores. The transverse relaxation time indicates the pores in the specimen were filled with water, i.e., the time that the hydrogen protons in water go from a stable arrangement state to a stable arrangement state under the action of a magnetic field. The shorter the transverse relaxation time, the fewer the hydrogen protons in the pore, the smaller the pore. The change of transverse relaxation time represent the change of internal pore structure. From a comparison of the T2 distribution curves in Figure 8a–c, it is seen that the T2 curve of the MgSO4 sample gradually shifts to the right with the increase of the leaching process time, indicating that the internal pore structure of the sample changes from large pores to small and medium pores. The envelope area of the T2 curve and the relaxation time in the first hour increases rapidly, indicating that the porosity of the mineral soil increases significantly at this time, and then the T2 curve for each moment of the MgSO4 solution specimen changed slightly. However, the T2 curves for the DI water solution specimen almost overlapped, due to the fact that there was no chemical reaction between DI water and the RE ore. When the specimen was completely filled with water, the pore structure inside the ore body did not change significantly.
The pore radius in microns (μm) refers to the maximum radius of the sphere that can pass through the pore throat. The size and percentage distribution of the pore radii are closely related to the pore structure. The larger the pore radius, the better the connectivity of the pore space. Pore radii of different sizes as a percentage of the total pore reflect the pore radius distribution in different leaching time periods. According to the range of measured values of pore radius, the pore size is divided into five major categories: a pore with a size range of 0–0.24 μm is called a minimal pore; a pore size range of 0.24–0.65 μm is called a small pore; a pore size range of 0.65–1.6 μm is called a medium pore; a pore size range of 1.6–10 μm is called a large pore, and a pore with a radius greater than 10 μm is called a mega pore. The distribution of different pore sizes was calculated by T2 distribution curves, which are shown in Figure 9a–c. In this way, the dynamic change of each pore radius in the internal structure of the pore reflects the evolution of the pore structure of the specimen under the coupling effect of solution percolation and the ion exchange reaction.
RE ore is a special mineral. Rare earth elements are usually in the form of ions mainly on kaolinite or mica-like minerals. In the leaching process, when the rare earth cations adsorbed in the ore body meet the more active magnesium ions, the rare earth elements are leached into the leaching solution through a chemical replacement reaction, which leads to a change in the internal pore structure of the ore body, which can be expressed by the following chemical reaction equation:
2 A l 2 S i O 5 O H 4 n R E ( s ) 3 + + 3 n M g ( a q ) 2 + = 2 A l 2 S i O 5 O H 4 m 3 n 2 M g ( s ) 2 + + 2 n R E ( a q ) 3 +
where s indicates solid phase, aq indicates liquid phase.
Due to the coupling effect of both seepage and chemical fields, the pore structure of RE specimens goes through dynamic changes during the leaching process. The mechanism of pore structure evolution is actually the deposition and release of particles in the pore structure of the ore body, which is caused by the ionic strength change of the MgSO4 leaching solution during the leaching process. When DI water is used as the leaching solution, the pores in the specimen gradually increase with the increase of leaching time, and the small and medium pore size pores gradually evolve into large size pores. Due to the formation of stable seepage channels in the internal pore structure, the pore structure does not change significantly. When MgSO4 is used as leaching solution, the number of micro-pores and small pores decreases rapidly and the number of large pores increases at the early stage of leaching, which is mainly due to the effect of seepage flow. The ion exchange reaction has not occurred at this time. In the effective leaching stage of MgSO4 leaching solution, the number of micro-pores, small and medium pores increases, while the number of large pores and mega pores decreases. The ion exchange reaction between the leaching solution and the RE specimen leads to an increase in the ionic strength of the leaching solution. During the ion exchange process, the RE3+ in the RE ore is replaced by the Mg2+ in leaching solution, leading to an increase in the cation content in the solution and an increase in the charge strength. The clay colloid particles inside the electric double layer are compressed, causing enhanced van der Waals forces, and the repulsive forces between the colloidal particles and the mineral surface are unbalanced, leading to the deposition of a large number of micro-particles on the surface of the mineral body and blocking the pore structure. As a result, the large pores in the specimen are blocked, leading to a decrease in the number of large pores. With the end of the ion exchange process, the pore size evolves from a medium and small pore structure to a large pore structure again. When most of the RE3+ has been precipitated from the RE ore, the thickness of the electric double layer of the clay colloidal particles inside the colloid increases again, and the electric double layer repulsive force becomes the dominant force again [33,34]. The micro-particles adsorbed around the large pores are released, and the large pores become back to the initial state. The pore structure of the whole ore body changes from medium and small pore structure to large pore structure; therefore, the ion exchange process causes the deposition and release of fine particles in the ore body, which results in dynamic pore structure evolution.

4. Conclusions

(1) By comparing the leaching process of DI water, 2% MgSO4 and 5% MgSO4, it was found that DI water leaching did not involve chemical reactions, and no RE ions were leached during the whole leaching process. In the process of MgSO4 as the leaching solution, the leaching amount of RE ions first increased and then decreased. The effective leaching time was gradually shortened as the concentration of MgSO4 leaching solution increased, indicating the higher the concentration of leaching solution, the more obvious the chemical replacement effect, which provides a certain basis for rare earth leaching efficiency.
(2) The change law of the double electric layer and pore structure was analyzed. With the ion exchange reaction, the absolute value of the Zeta potential on the surface of RE particles decreased, due to the effect of van der Waals force and electrostatic force affects the original electric field, thus affecting the pore structure of the ore body. The high concentration of leaching solution further increased changes of internal structure of the ore body, causing increased permeability and effective pore size. This provides a clear basis for the evolution mechanism of ore body pore structure.
(3) The values of porosity under the combined effect of infiltration and chemical replacement were larger than those of DI water leaching, indicating that chemical replacement induces changes in porosity in RE ore body. During the effective leaching time, the change curve of porosity of MgSO4 as the leaching solution had a greater magnitude, indicating that chemical replacement had a greater effect on the pore structure than percolation.
(4) During the DI water leaching process, small and medium pore size pores gradually evolved into large pore size pores with the increase of leaching time. At the early stage of MgSO4 leaching, the number of micro-pores and small pores rapidly decreased and large pores increased. At the effective leaching stage, the number of micro-pores, small pores and medium pores increased, while the number of large pores and mega pores decreased. At the end of ion exchange reaction, the pore size evolved from a medium and small pore structure to a large pore structure again.

Author Contributions

Conceptualization, X.Z. and Y.R.; methodology, X.Z. and Z.G.; software, X.Z.; validation, Z.G. and L.S.; data curation, L.S.; writing—original draft preparation, X.Z. and Y.R.; writing—review and editing, X.Z., Y.R. and W.X.; visualization, L.S. and W.X.; supervision, Y.R.; project administration, Y.R.; funding acquisition, Y.R. and L.S. All authors have read and agreed to the published version of the manuscript.

Funding

This research was funded by the National Natural Science Foundation of China (51964014); the Education Department of Jiangxi Province (GJJ209414).

Data Availability Statement

Not applicable.

Acknowledgments

Thanks for the great effort by editors and reviewers.

Conflicts of Interest

The authors declare no conflict of interest.

References

  1. Chi, R.; Tian, J. Review of Weathered Crust Rare Earth Ore. J. Chin. Rare Earth Soc. 2007, 25, 641–650. [Google Scholar] [CrossRef]
  2. Zhang, L.; Wu, K.; Chen, L.; Zhu, P.; Ouyang, H. Overview of Metallogenic Features of Ion-adsorption Type REE Deposits in Southern Jiangxi Province. J. Chin. Rare Earth Soc. 2015, 33, 10–17. [Google Scholar] [CrossRef]
  3. Wu, H.; Yin, F.; Fang, X. The present situation and development trends of the mining and separation technologies of weathering crust ion-absorbed type rare-earth ores. Nonferr. Met. Sci. Eng. 2010, 1, 73–76. [Google Scholar] [CrossRef]
  4. Wang, D.; Rao, Y.; Shi, L.; Xu, W.; Huang, T. Relationship between Permeability Coefficient and Fractal Dimension of Pore in Ionic Rare Earth Magnesium Salt Leaching Ore. Geofluids 2022, 2022, 2794446. [Google Scholar] [CrossRef]
  5. Yin, S.; Qi, Y.; Xie, F.; Chen, X.; Wang, L.; Shao, Y. Porosity characteristic of leaching weathered crust elution-deposited rare earth before and after leaching. Chin. J. Nonferr. Met. 2018, 28, 2112–2119. [Google Scholar] [CrossRef]
  6. Wang, X.; Li, Y.; Huang, G.; Deng, S.; Xiao, W.; Liao, S. Changes of pore structure in leaching ion-adsorption type rare earth ore. J. Chin. Rare Earth Soc. 2017, 35, 528–536. [Google Scholar] [CrossRef]
  7. Zhou, L.; Wang, X.; Huang, C.; Wang, H.; Ye, H.; Hu, K.; Zhong, W. Development of pore structure characteristics of a weathered crust elution-deposited rare earth ore during leaching with different valence cations. Hydrometallurgy 2021, 201, 105579. [Google Scholar] [CrossRef]
  8. Wang, G.; Wang, X.; Hu, S.; Hong, B. Experimental study on the effect of particle migration on the structure of ionic rare earth ore body. Min. Res. Dev. 2015, 35, 37–42. [Google Scholar] [CrossRef]
  9. Yin, S.; Qi, Y.; Xie, F.; Chen, X.; Wang, L. Permeability characteristic of weathered crust elution-deposited rare earth ores under different pore structures. Chin. J. Nonferr. Met. 2018, 28, 1043–1049. [Google Scholar] [CrossRef]
  10. Zhang, P.; Bai, B.; Jiang, S. Coupled effects of hydrodynamic forces and pore structure on suspended particle transport and deposition in a saturated porous medium. Rock Soil Mech 2016, 37, 1307–1316. [Google Scholar] [CrossRef]
  11. Wu, A.; Yin, S.; Li, J. Influential factors of permeability rule of leaching solution in ion absorbed rare earth deposits with in situ leaching. J. Central South Univ. (Sci. Technol.) 2005, 36, 506–510. [Google Scholar] [CrossRef]
  12. Omkar, D.; Milani, S.; Narayanan, N. Permeability Reduction in Pervious Concretes Due to Clogging: Experiments and Modeling. J. Mater. Civil. Eng. 2010, 22, 741–751. [Google Scholar] [CrossRef]
  13. Zhou, L.; Wang, X.; Zhuo, Y.; Hu, K.; Zhong, W.; Huang, G. Dynamic pore structure evolution of the ion adsorbed rare earth ore during the ion exchange process. R. Soc. Open Sci. 2019, 6, 191107. [Google Scholar] [CrossRef]
  14. Wang, X.; Zhuo, Y.; Deng, S.; Li, Y.; Zhong, W.; Zhao, K. Experimental Research on the Impact of Ion Exchange and Infiltration on the Microstructure of Rare Earth Orebody. Adv. Mater. Sci. Eng. 2017, 2017, 4762858. [Google Scholar] [CrossRef] [Green Version]
  15. Zhang, Z.; Li, H.; Chen, J.; Lei, Y. Permeability of saturated clay eroded by mixed heavy metal ions. Rock Soil Mech 2016, 37, 2467–2476. [Google Scholar] [CrossRef]
  16. Zhao, Z.; Zhou, X.; Qian, Q. Fracture characterization and permeability prediction by pore scale variables extracted from X-ray CT images of porous geomaterials. China Technol. 2020, 63, 755–767. [Google Scholar] [CrossRef]
  17. Wang, G.; Qin, Y.; Shen, J.; Chen, S.; Han, B.; Zhou, X. Dynamic-change laws of the porosity and permeability of low- to medium-rank coals under heating and pressurization treatments in the eastern Junggar Basin, China. J. Earth Sci. 2018, 29, 607–615. [Google Scholar] [CrossRef]
  18. Luo, S.; Yuan, L.; Wang, G.; Hu, S.; Wang, X. The effect of leaching on the strength of ion-adsorption rare-earth ore. Nonferr. Met. Sci. Eng. 2013, 4, 58–61. [Google Scholar] [CrossRef]
  19. Wu, K.; Zhang, L.; Zhu, P.; Chen, L.; Tian, Z.; Xing, X. Research on particle size distribution and its variation of ion-adsorption type rare earth ore. Chin. Rare Earths 2016, 37, 67–74. [Google Scholar] [CrossRef]
  20. Huang, G.; Wang, X.; Li, Y.; Li, S.; Chen, X.; Hang, J. Evolution law of mechanical characteristics of the sample in the ion-type rare earth leaching process. Met. Mine 2018, 2, 50–55. [Google Scholar] [CrossRef]
  21. Wang, X.; Zhuo, Y.; Deng, S.; Liao, S.; Li, Y. Experimental study on the evolution law of the strength characteristics of REO in displacement reaction. J. Jiangxi Univ. Sci. Technol. 2016, 37, 56–60. [Google Scholar] [CrossRef]
  22. Zhuo, Y.; Wang, X.; Cao, S.; Deng, S.; Li, Y.; Han, J. Study on Relationship Between Pore Structure and Strength Weakening of Rare Earth Ore Under Seepage. Gold Sci. Technol. 2017, 25, 101–106. [Google Scholar] [CrossRef]
  23. Zhuo, Y.; Wang, X.; Zhao, K.; Deng, S.; Li, Y.; Zhong, W. Study on strength weakening mechanism of iron-adsorbed rare earth ore during displacement reaction. Chin. Rare Earths 2017, 38, 57–63. [Google Scholar] [CrossRef]
  24. Rao, Y.; Zhang, Y.; Rao, R.; Wang, D.; Wang, L. Sensitivity analysis on the influence factors of slope stability for ion-absorbed rare earth ore by in-situ leaching. Min. Res. Dev. 2015, 35, 60–63. [Google Scholar] [CrossRef]
  25. Liu, L.; Rao, Y.; Tian, C.; Huang, T.; Lu, J.; Zhang, M.; Han, M. Adsorption Performance of La (III) and Y (III) on Orange Peel: Impact of Experimental Variables, Isotherms, and Kinetics. Adsorpt. Sci. Technol. 2021, 2021, 7189639. [Google Scholar] [CrossRef]
  26. Wissmeier, L.; Barry, D.A. Simulation tool for variably saturated flow with comprehensive geochemical reactions in two and three-dimensional domains. Environ. Model. Softw. 2011, 1, 210–218. [Google Scholar] [CrossRef]
  27. Yang, K.B. Heavy Metal Pollution of Farmland in China and its Botanical Rehabilitation. Geol. Explor. 2007, 8, 58–61. [Google Scholar] [CrossRef]
  28. Sun, B.; Zhou, S.; Zhao, Q. Combined Pollution of Heavy Metal in Soil Based on Spatial Variation Analysis. J. Agro-Environ. Sci. 2003, 22, 248–251. [Google Scholar]
  29. Kanti, S.; Khilar, K. Review on subsurface colloids and colloid-associated contaminant transport in saturated porous media. Adv. Colloid Interface Sci. 2006, 119, 71–96. [Google Scholar] [CrossRef]
  30. Wang, X.; Li, Y.; Huang, G.; Fang, S.; Zhong, W. Research of Permeability and Porosity in Ion-type Rare Earth Leaching Process. Chin. Rare Earths 2017, 38, 47–55. [Google Scholar] [CrossRef]
  31. Liu, Y.; Li, Z.; Guo, L.; Kang, W.; Zhou, Y. Pore characteristics of soft soil under triaxial shearing measured with NMR. Chin. J. Rock Mech. Eng. 2018, 37, 1924–1932. [Google Scholar] [CrossRef]
  32. Liu, Y.; Li, Z. Grey-relation analysis and neural networks model for relationship between physico-mechanical indices and microstructure parameters of soft soils. Rock Soil Mech. 2011, 32, 1018–1024. [Google Scholar] [CrossRef]
  33. Li, R.; Liu, S.; Miao, L. Microcosmic mechanism of ion transport in charged clay soils. Chin. J. Geotech. Eng. 2010, 32, 1794–1799. [Google Scholar]
  34. Ding, W.; Zhu, Q.; Wang, L.; Luo, Y.; Li, Q.; Zhu, H. Calculation of thickness of shear plane in diffuse double layer of constant charge soil colloid in single electrolyte system. Acta Pedol. Sin. 2015, 52, 859–868. [Google Scholar] [CrossRef]
Figure 1. Cumulative curve of particle size mass percentage.
Minerals 13 00322 g001
Figure 2. Indoor column immersion experimental device.
Minerals 13 00322 g002
Figure 3. Variation of RE precipitation in different concentrations of MgSO4 and DI water leaching solution with leaching time.
Minerals 13 00322 g003
Figure 4. Variation of Zeta potential on the surface of RE particles in different concentrations of MgSO4 and DI water leaching solution with leaching time.
Minerals 13 00322 g004
Figure 5. Electric double layer structure model.
Minerals 13 00322 g005
Figure 6. The process of gradual disappearance of a strong binding layer. (a) DI water; (b) 2% MgSO4; (c) 5% MgSO4.
Minerals 13 00322 g006
Figure 7. Variation of porosity of specimens in different concentrations of MgSO4 and DI water leaching solution with leaching time.
Minerals 13 00322 g007
Figure 8. Variation of T2 distribution curves of specimens in different concentrations of MgSO4 and DI water leaching solution with leaching time. (a) DI water; (b) 2% MgSO4; (c) 5% MgSO4.
Minerals 13 00322 g008aMinerals 13 00322 g008b
Figure 9. Variation of pore percentage of specimens in different concentrations of MgSO4 and DI water leaching solution with leaching time. (a) DI water; (b) 2% MgSO4; (c) 5% MgSO4.
Minerals 13 00322 g009
Table 1. Physical parameters of ionic RE ore.
ParameterNumerical Value
Natural density (g/cm3)1.59
Dry density (g/cm3)1.37
Plasticity index11.12
Water content (%)14.00
Porosity ratio0.90
Specific gravity of soil particles2.65
Disclaimer/Publisher’s Note: The statements, opinions and data contained in all publications are solely those of the individual author(s) and contributor(s) and not of MDPI and/or the editor(s). MDPI and/or the editor(s) disclaim responsibility for any injury to people or property resulting from any ideas, methods, instructions or products referred to in the content.

