
Influence of Leaching Solution on the Soil-Water Characteristics of Ion-Absorbed Rare Earth Minerals and Its Hysteresis Effect

Abstract
:1. Introduction
2. Test Materials and Methods
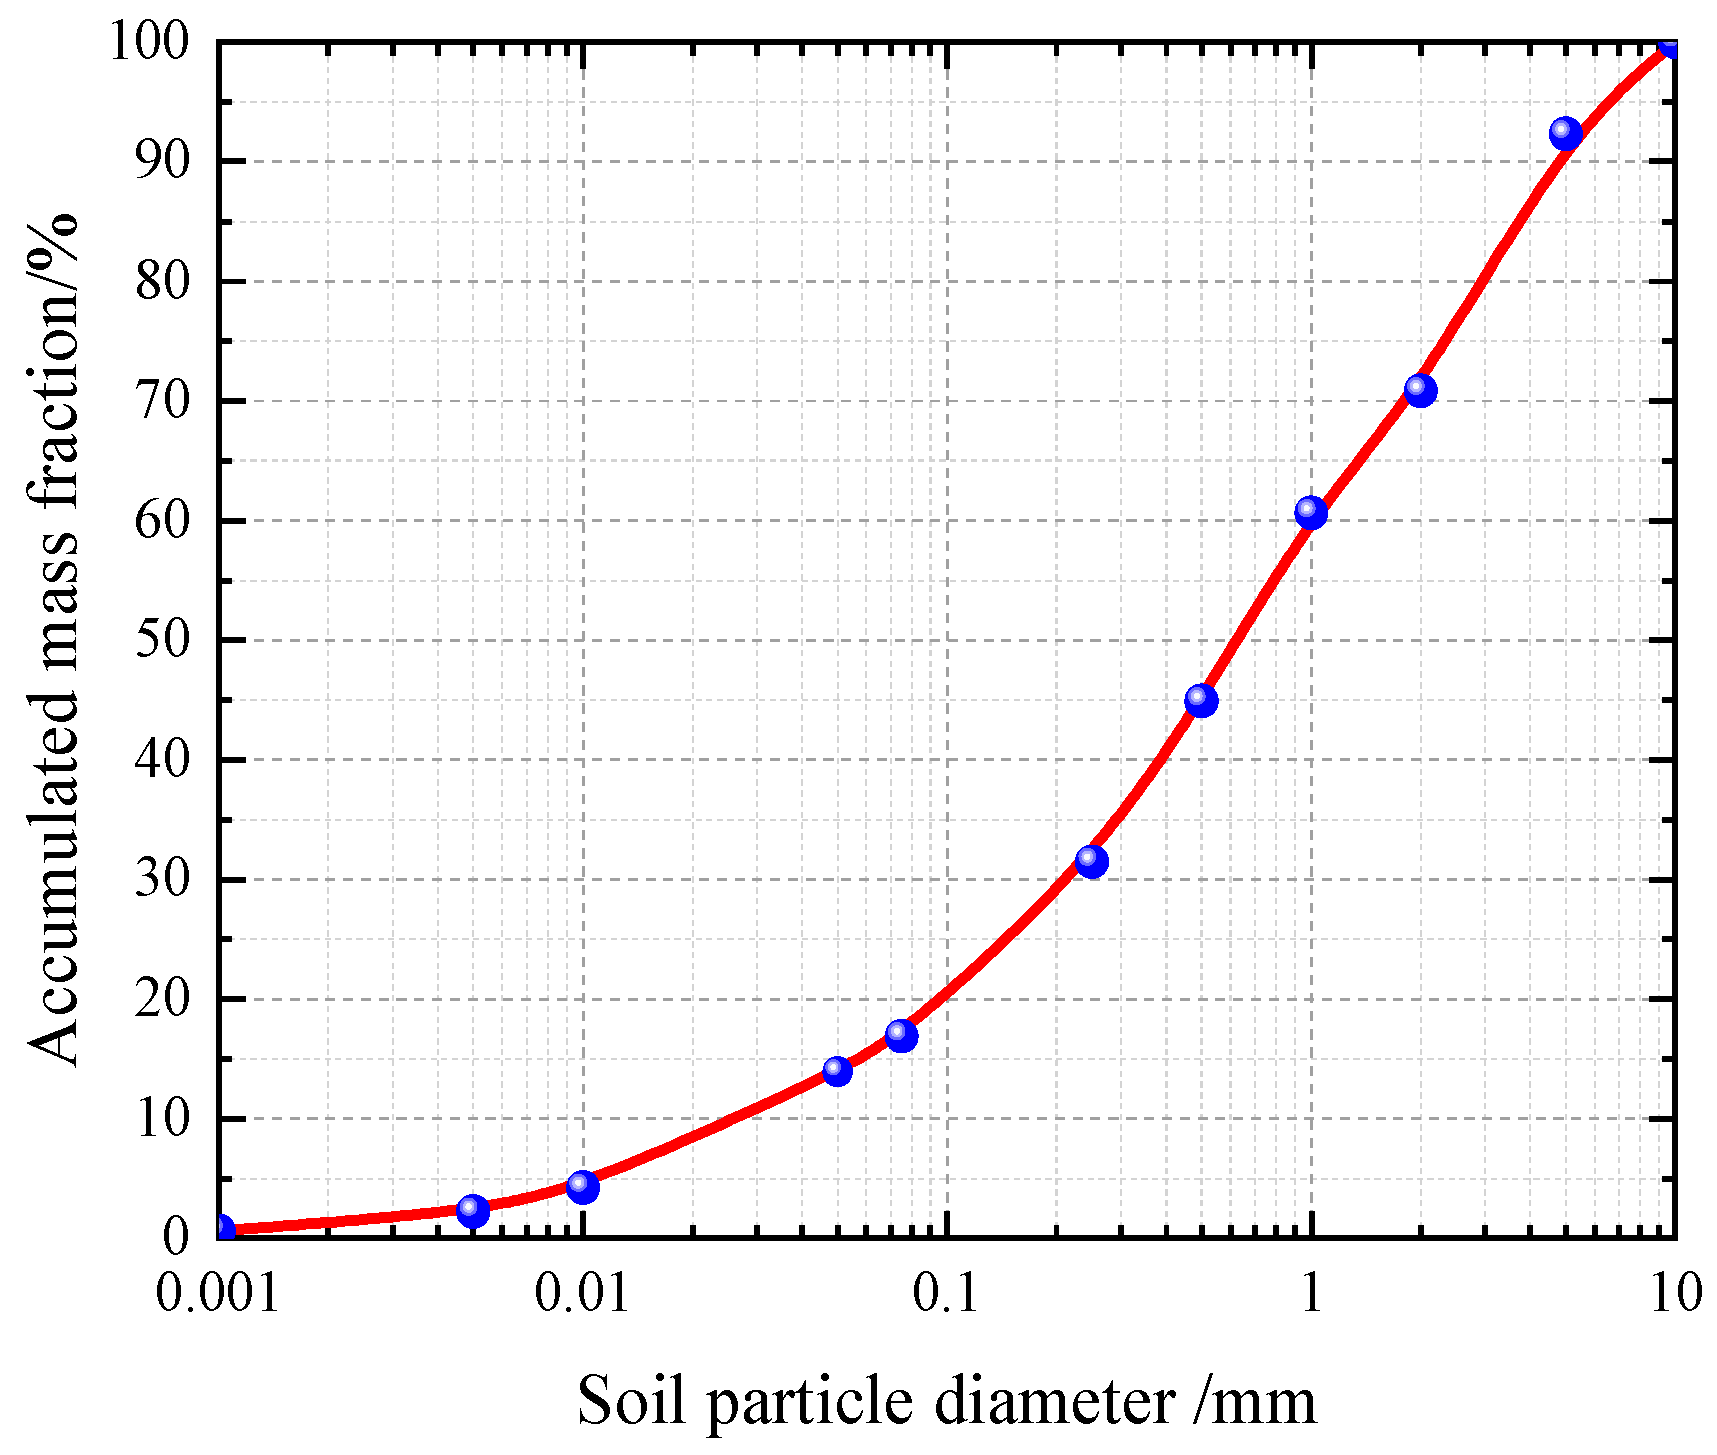
2.1. Samples
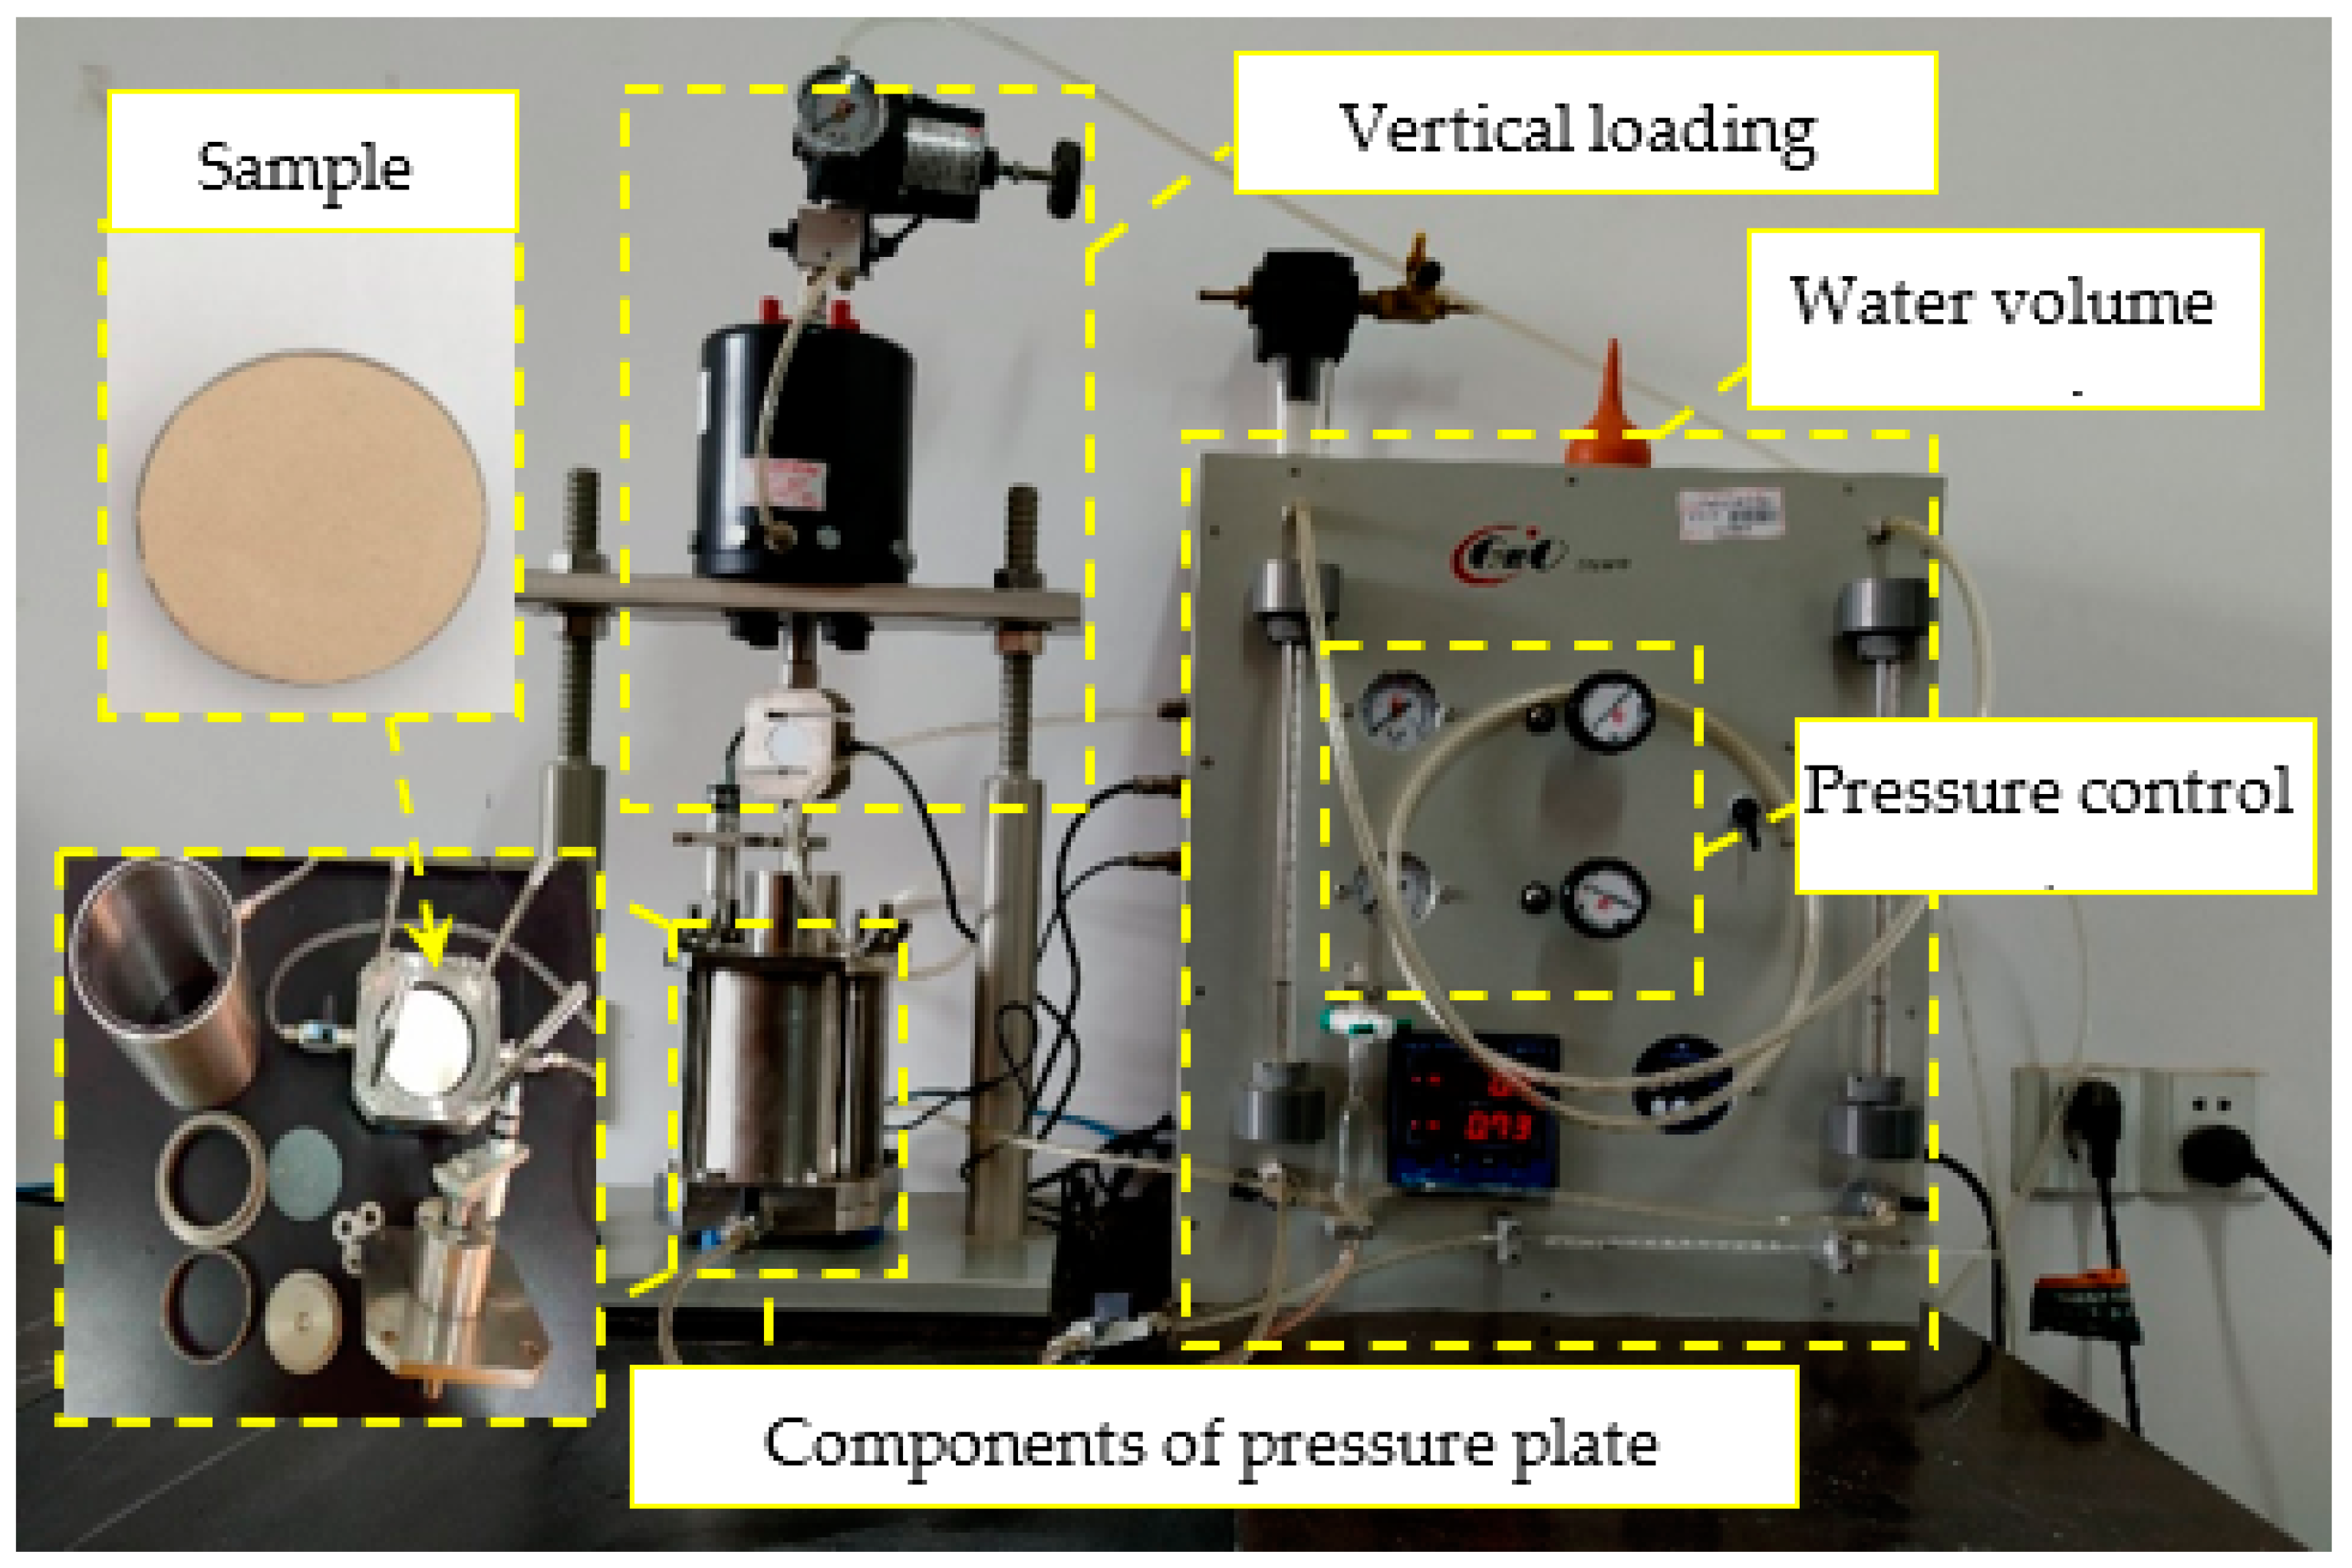
2.2. Test Method
2.3. Soil-Water Characteristic Curve Model
3. Effect of Leaching Solution on Water-Holding Characteristics of Ion-Absorbed Rare Earth
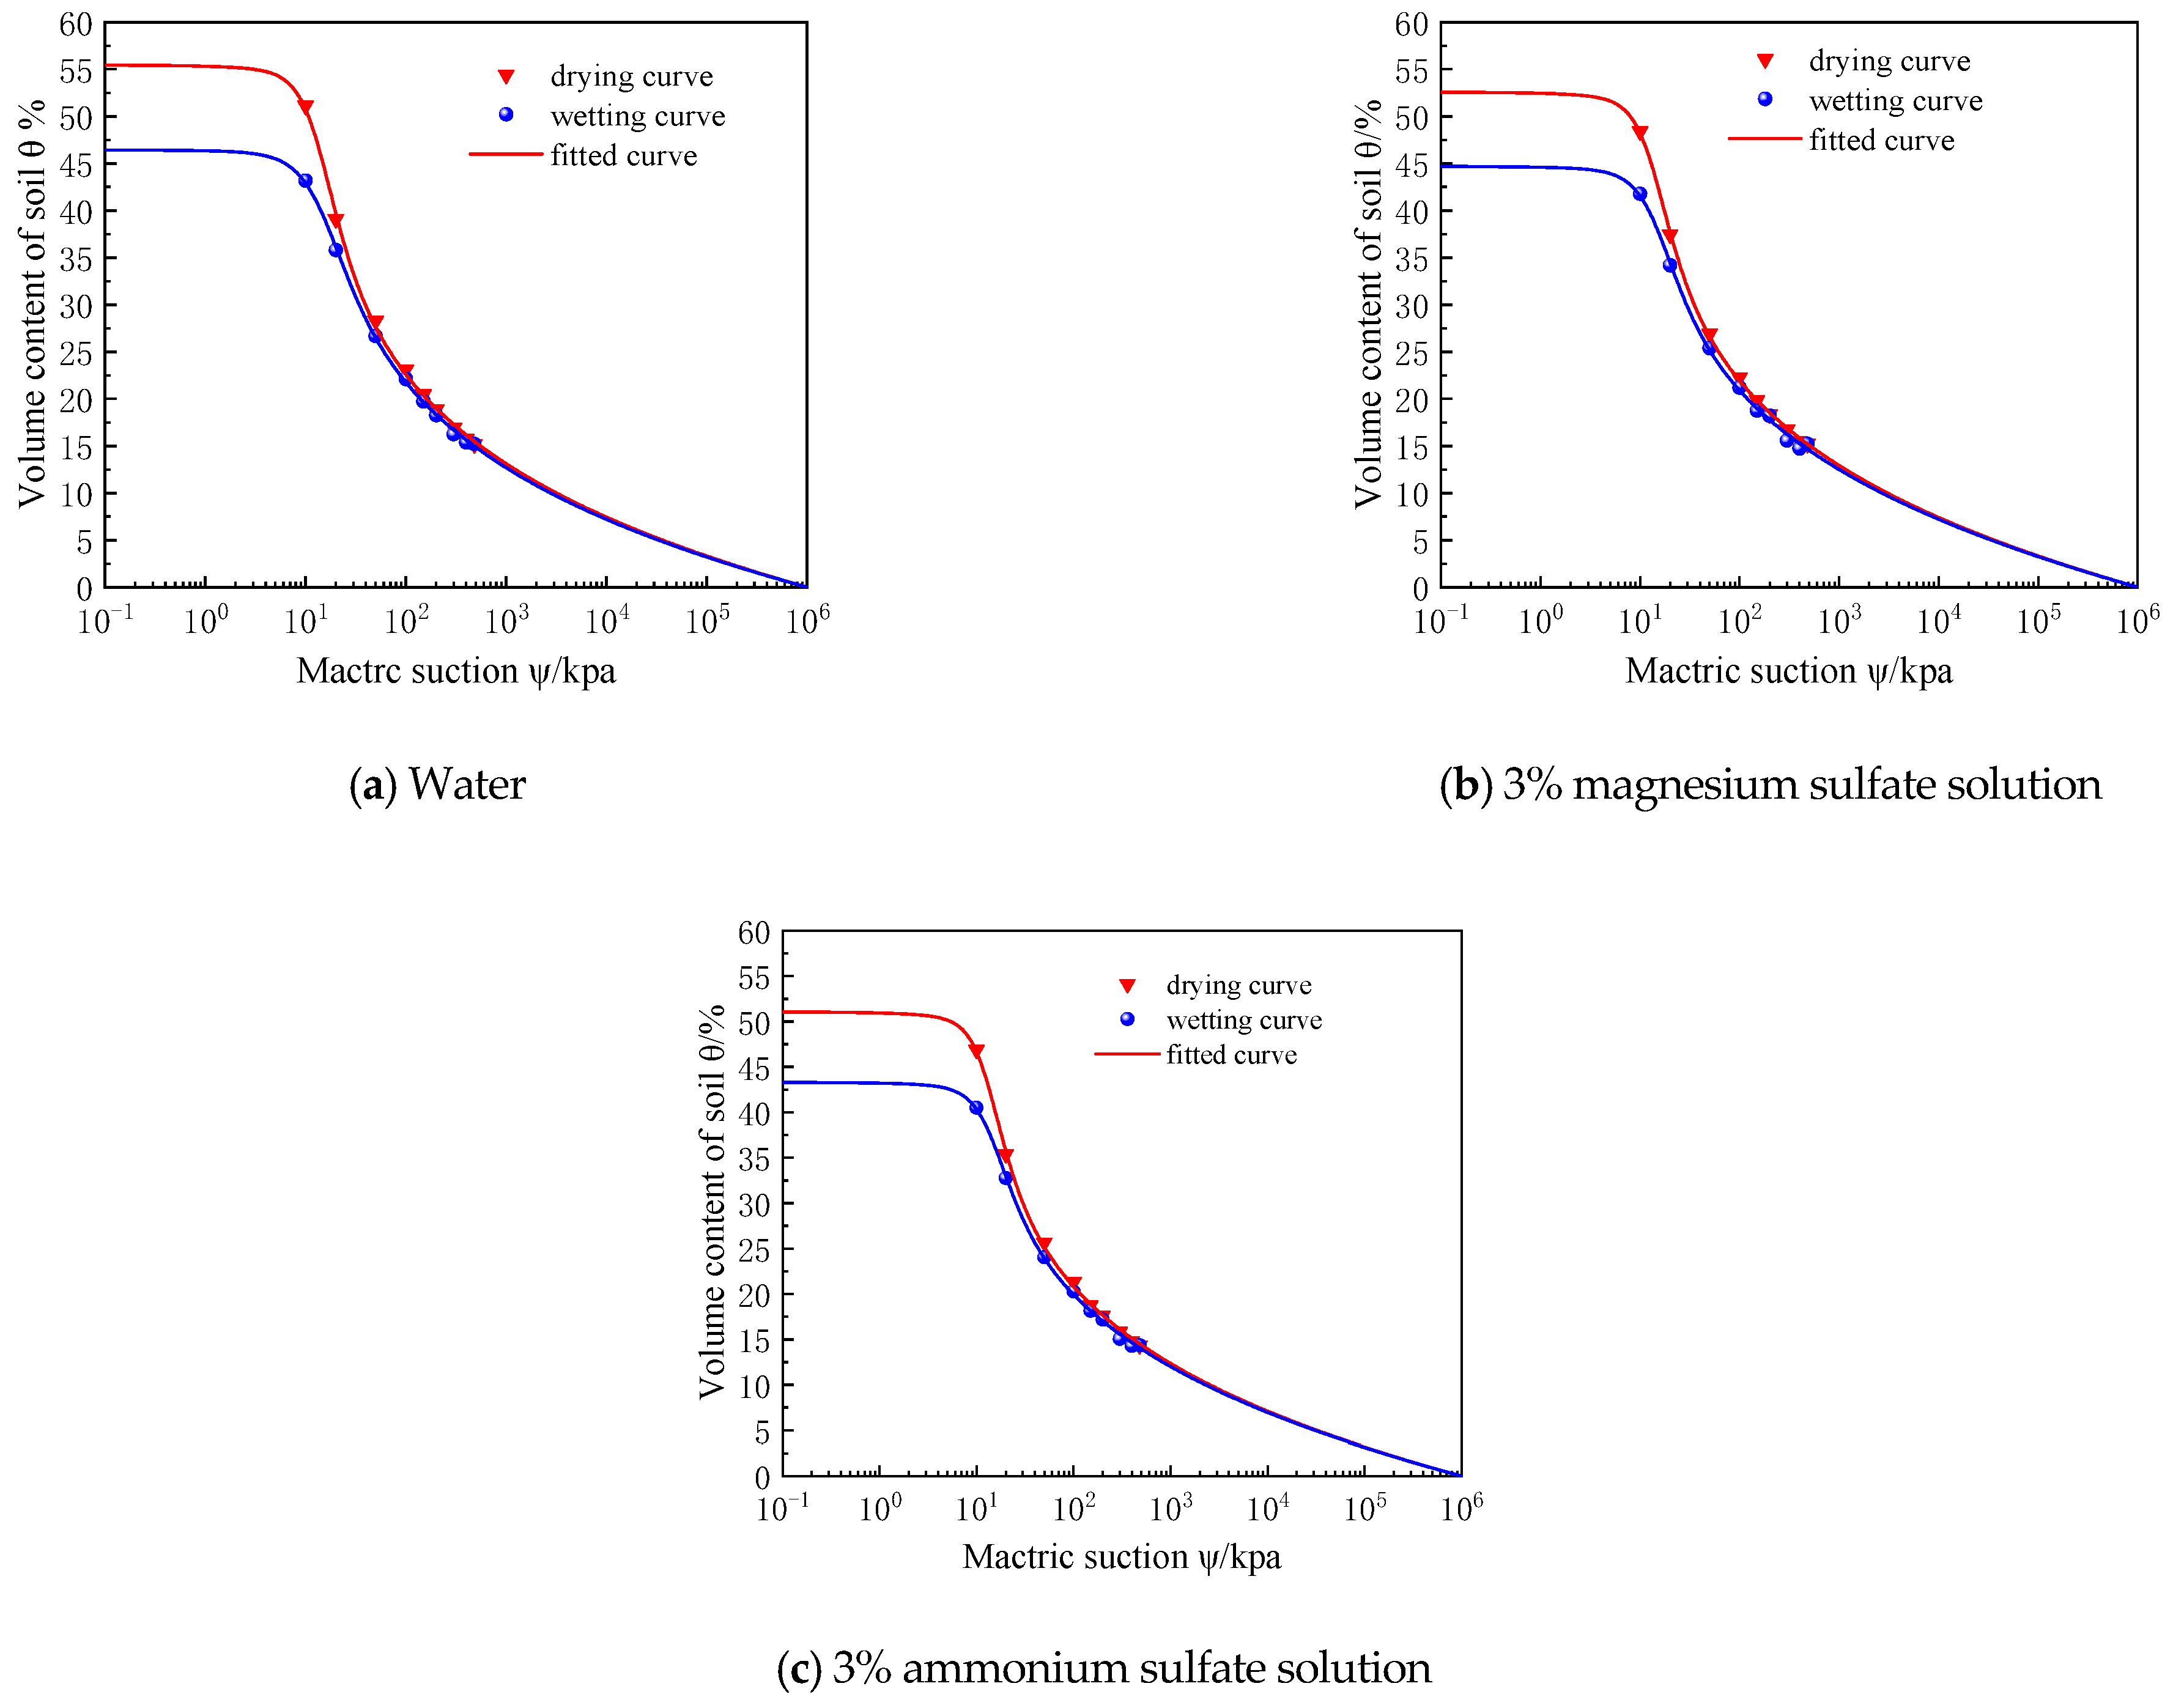
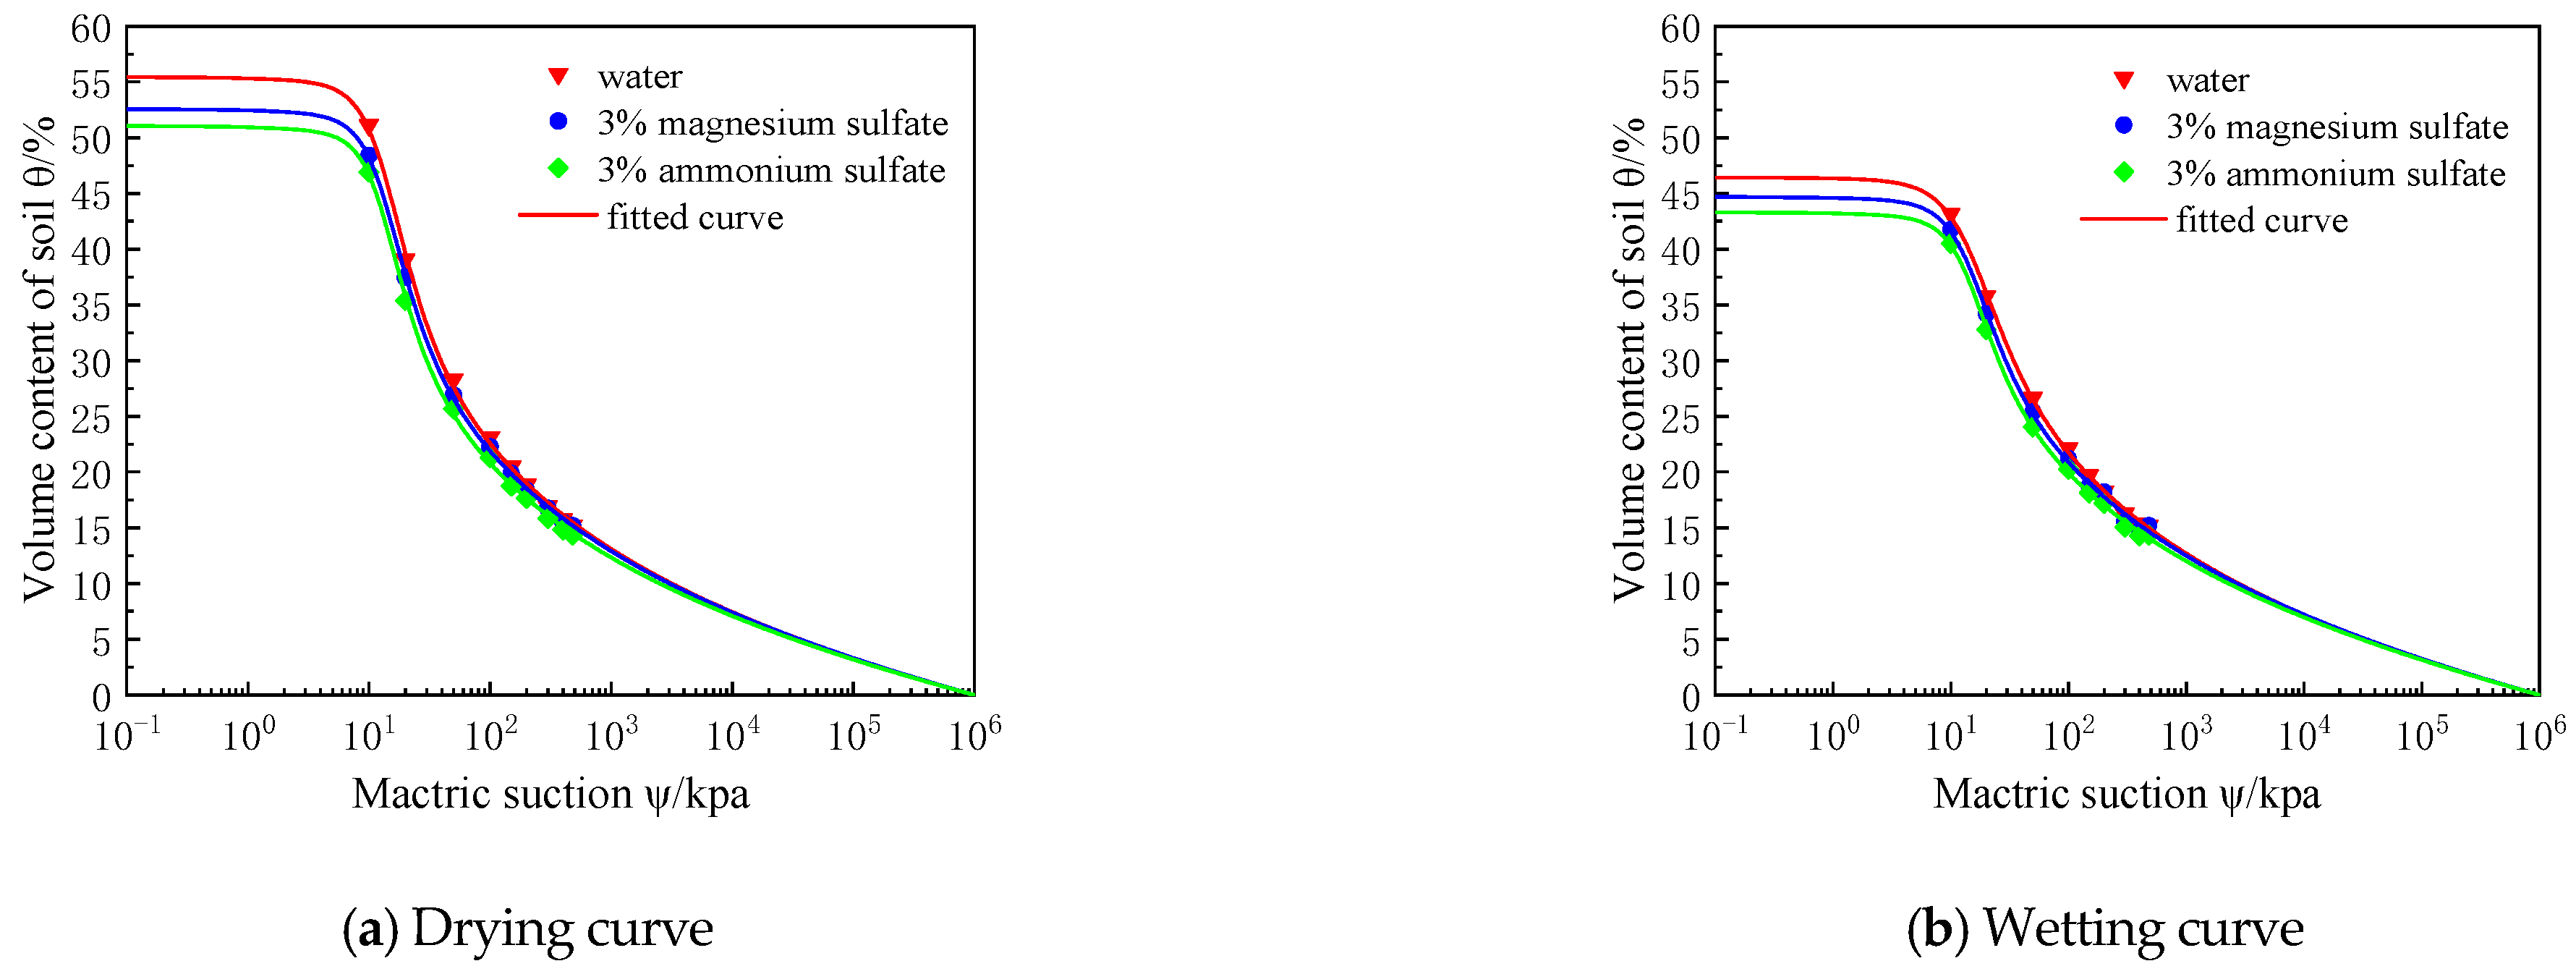
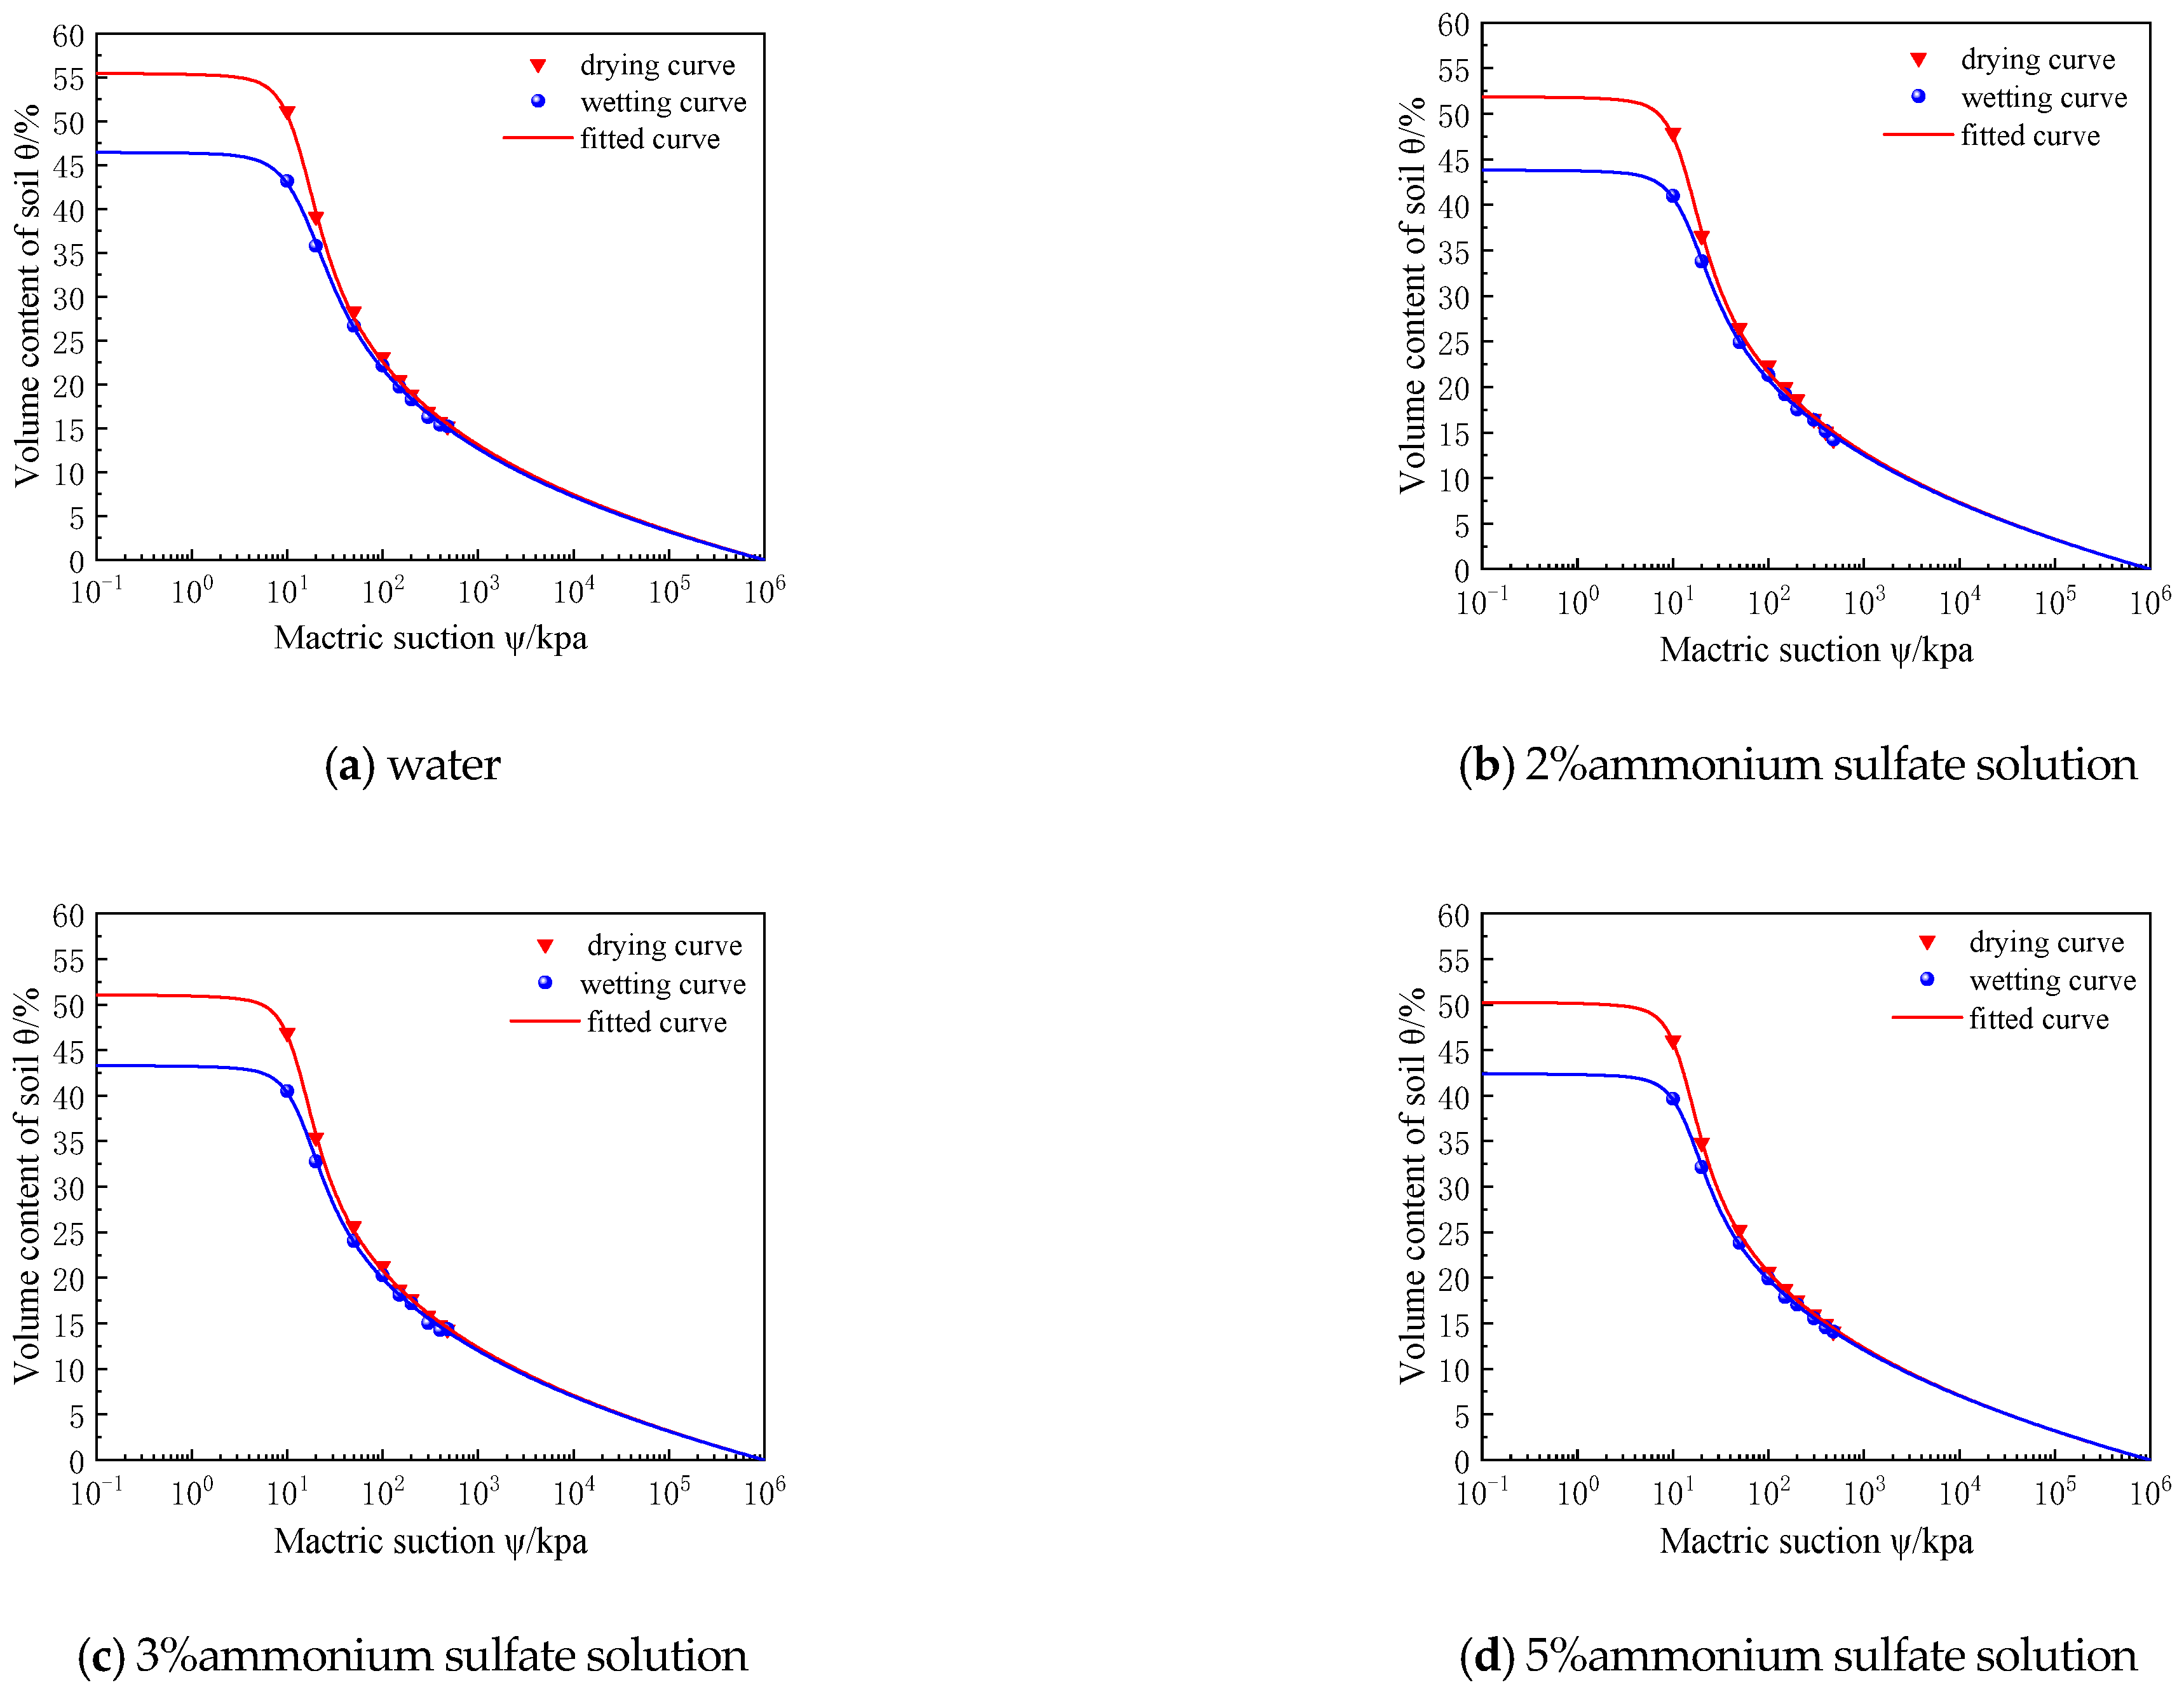
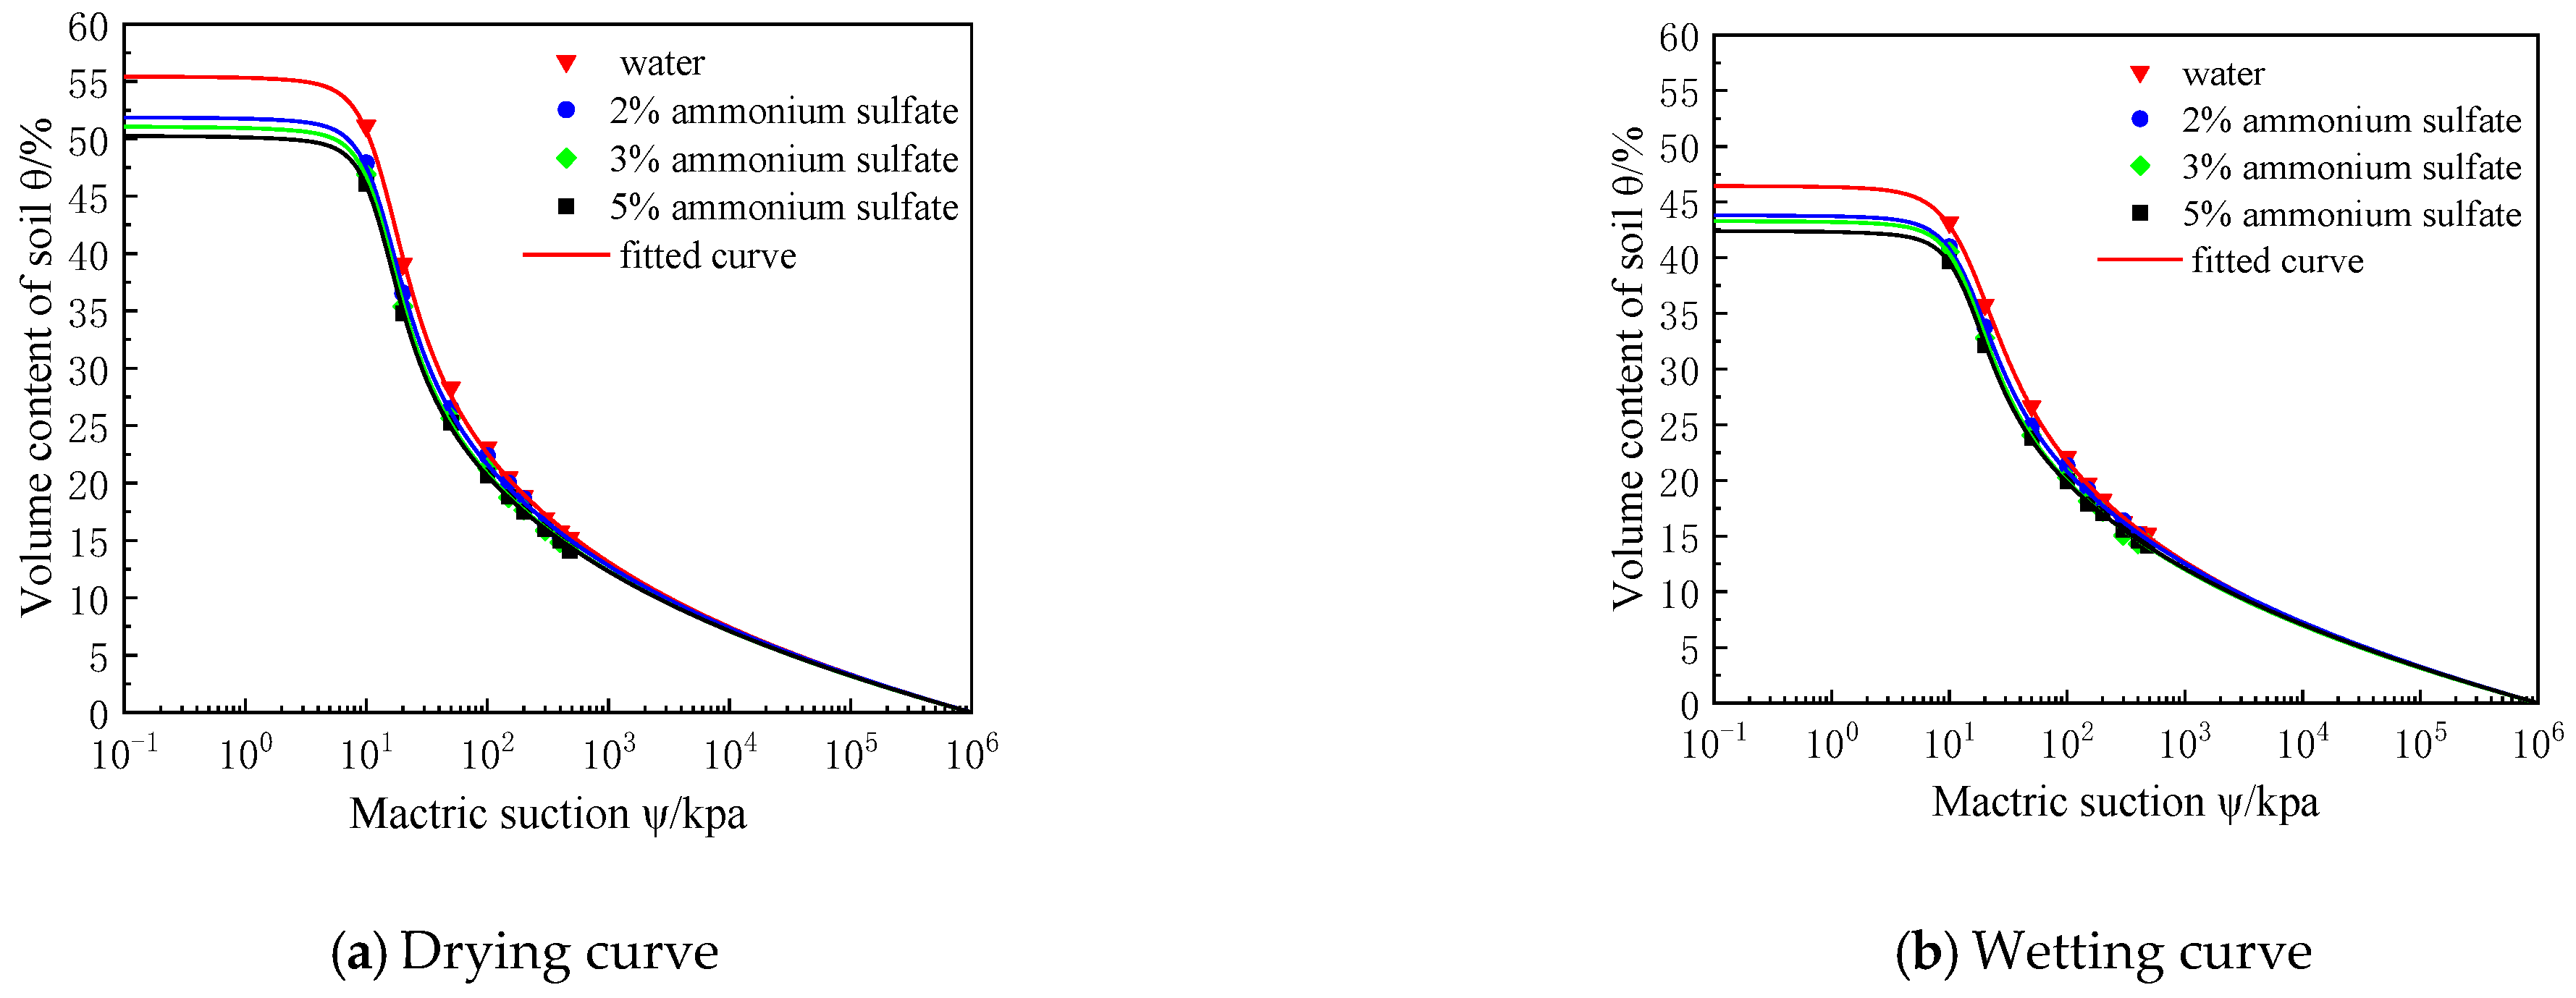
3.1. Effect of Leaching Solution Type on Water-Holding Characteristics
3.2. Effect of Leaching Concentration on Water-Holding Characteristics
4. Analysis of “Hysteresis Effect” on Soil-Water Characteristic Curve
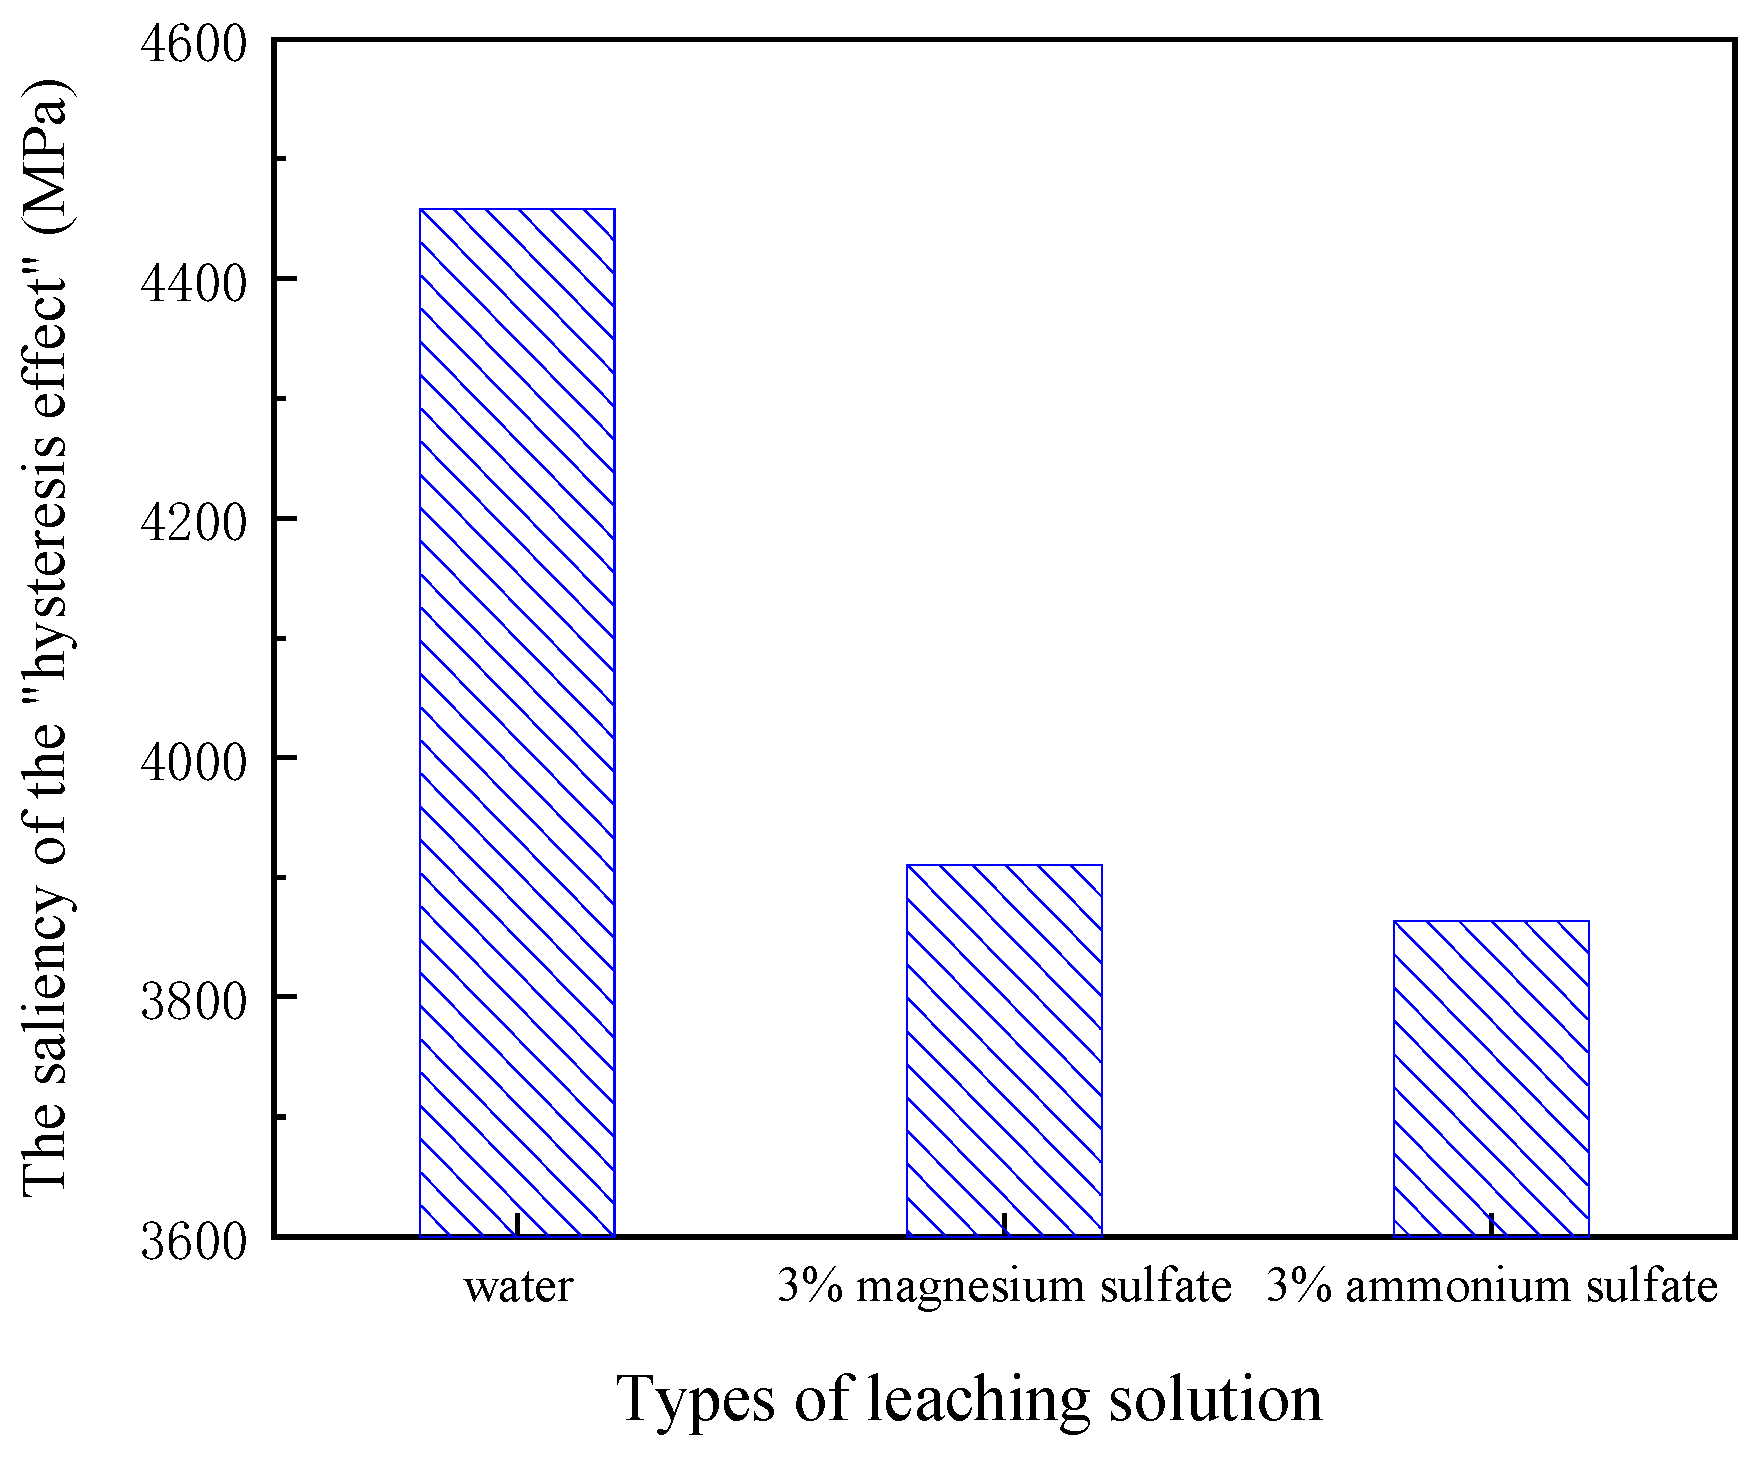
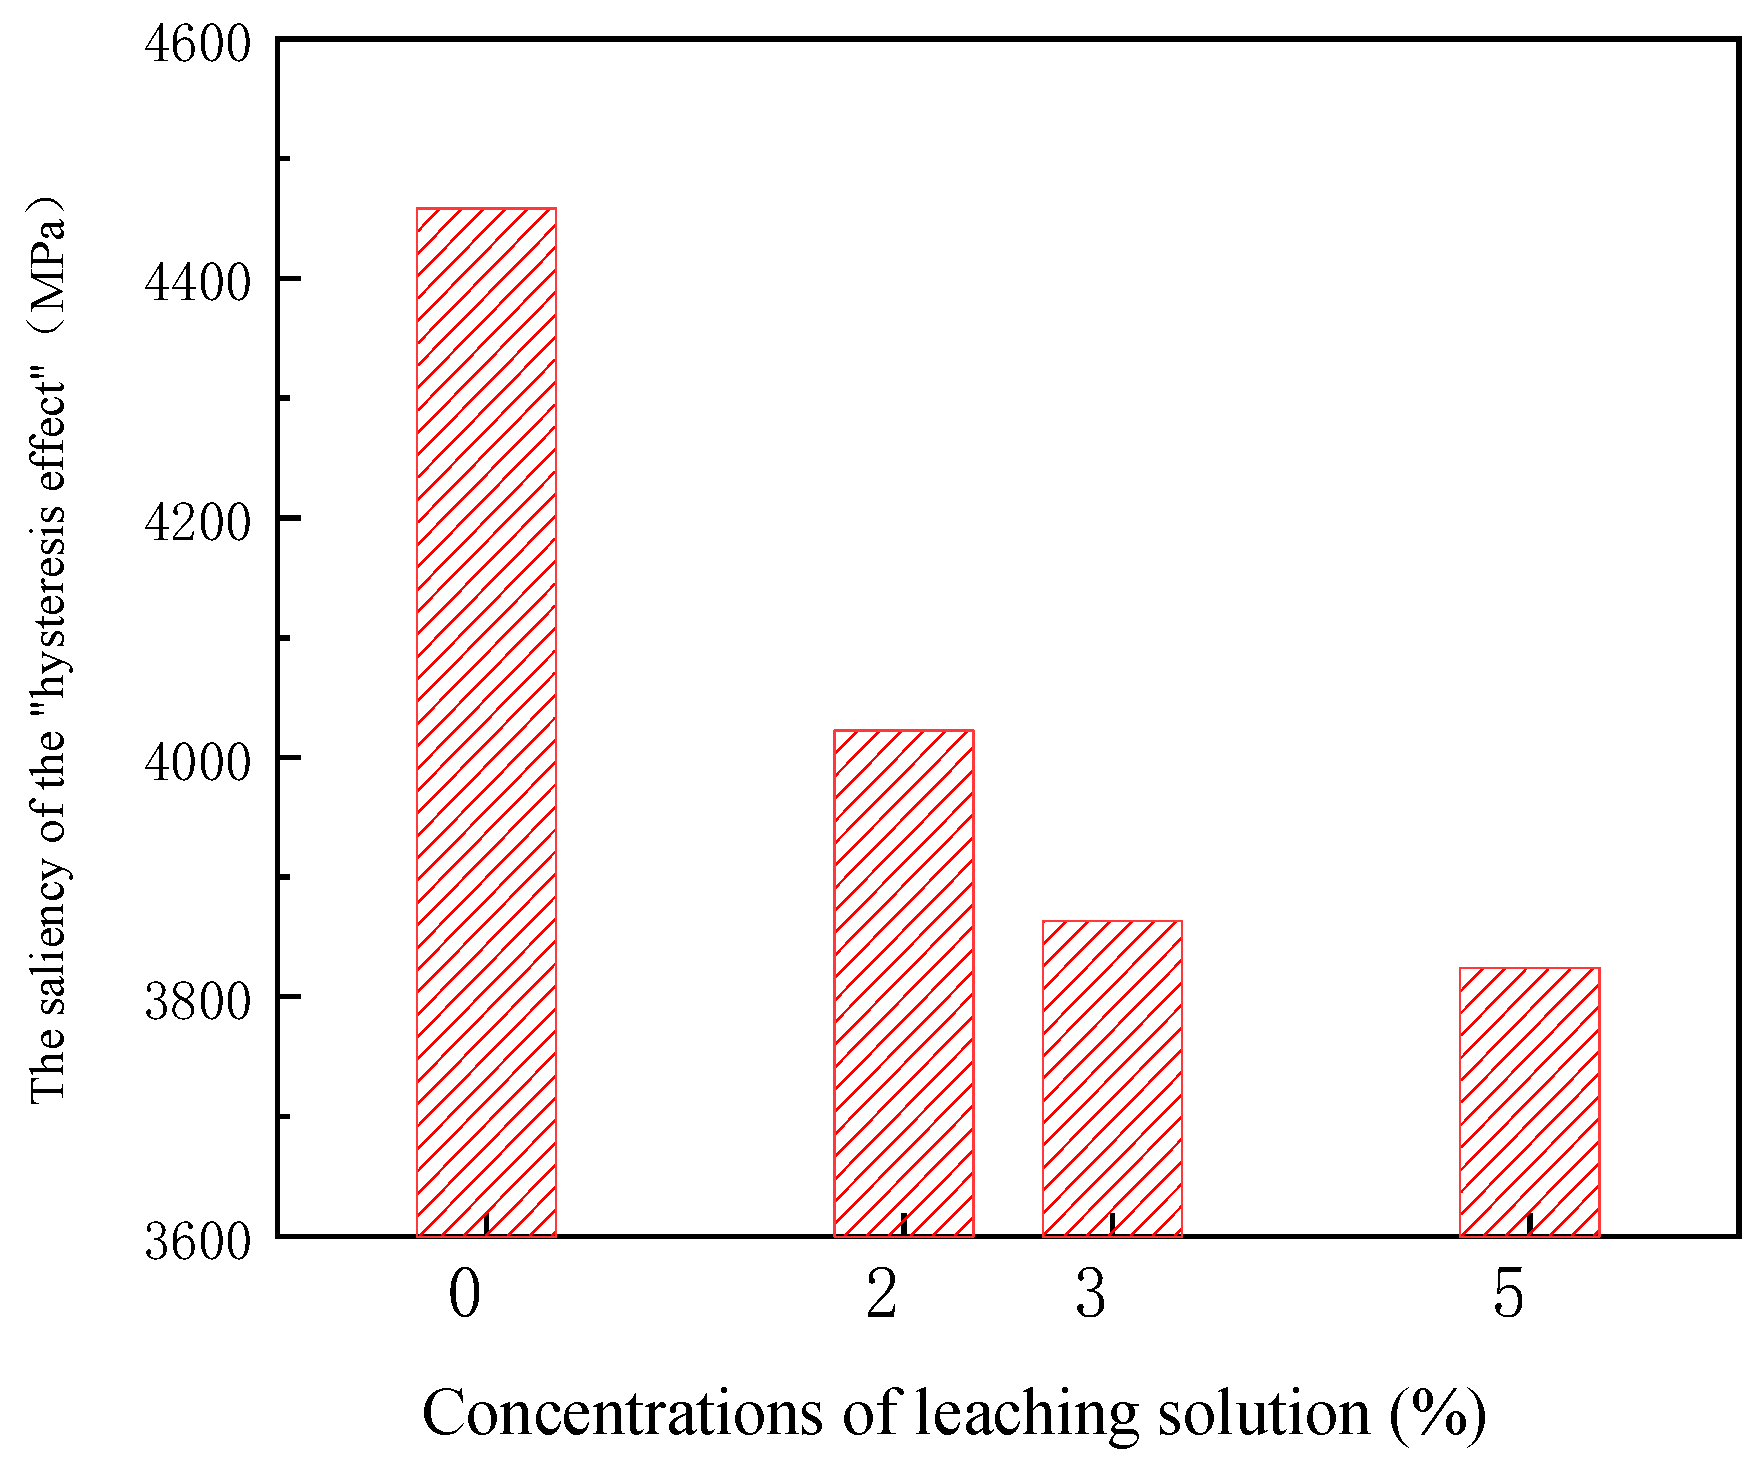
4.1. Effect of Different Leaching Action on the “Hysteresis Effect” of Soil-Water Characteristic Curve
4.2. Mechanism Analysis of “Hysteresis Effect”
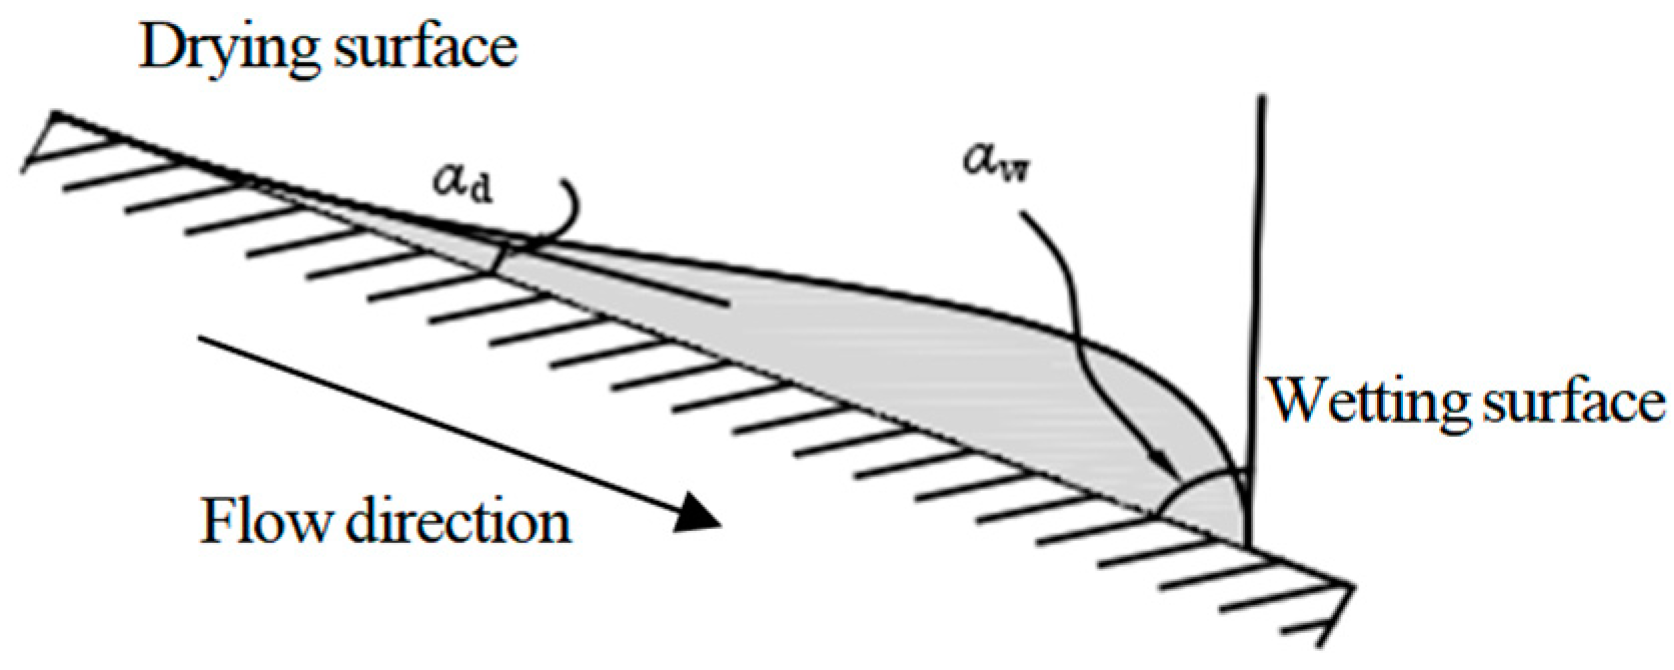
- (1)
- The contact angle between the soil and the liquid.
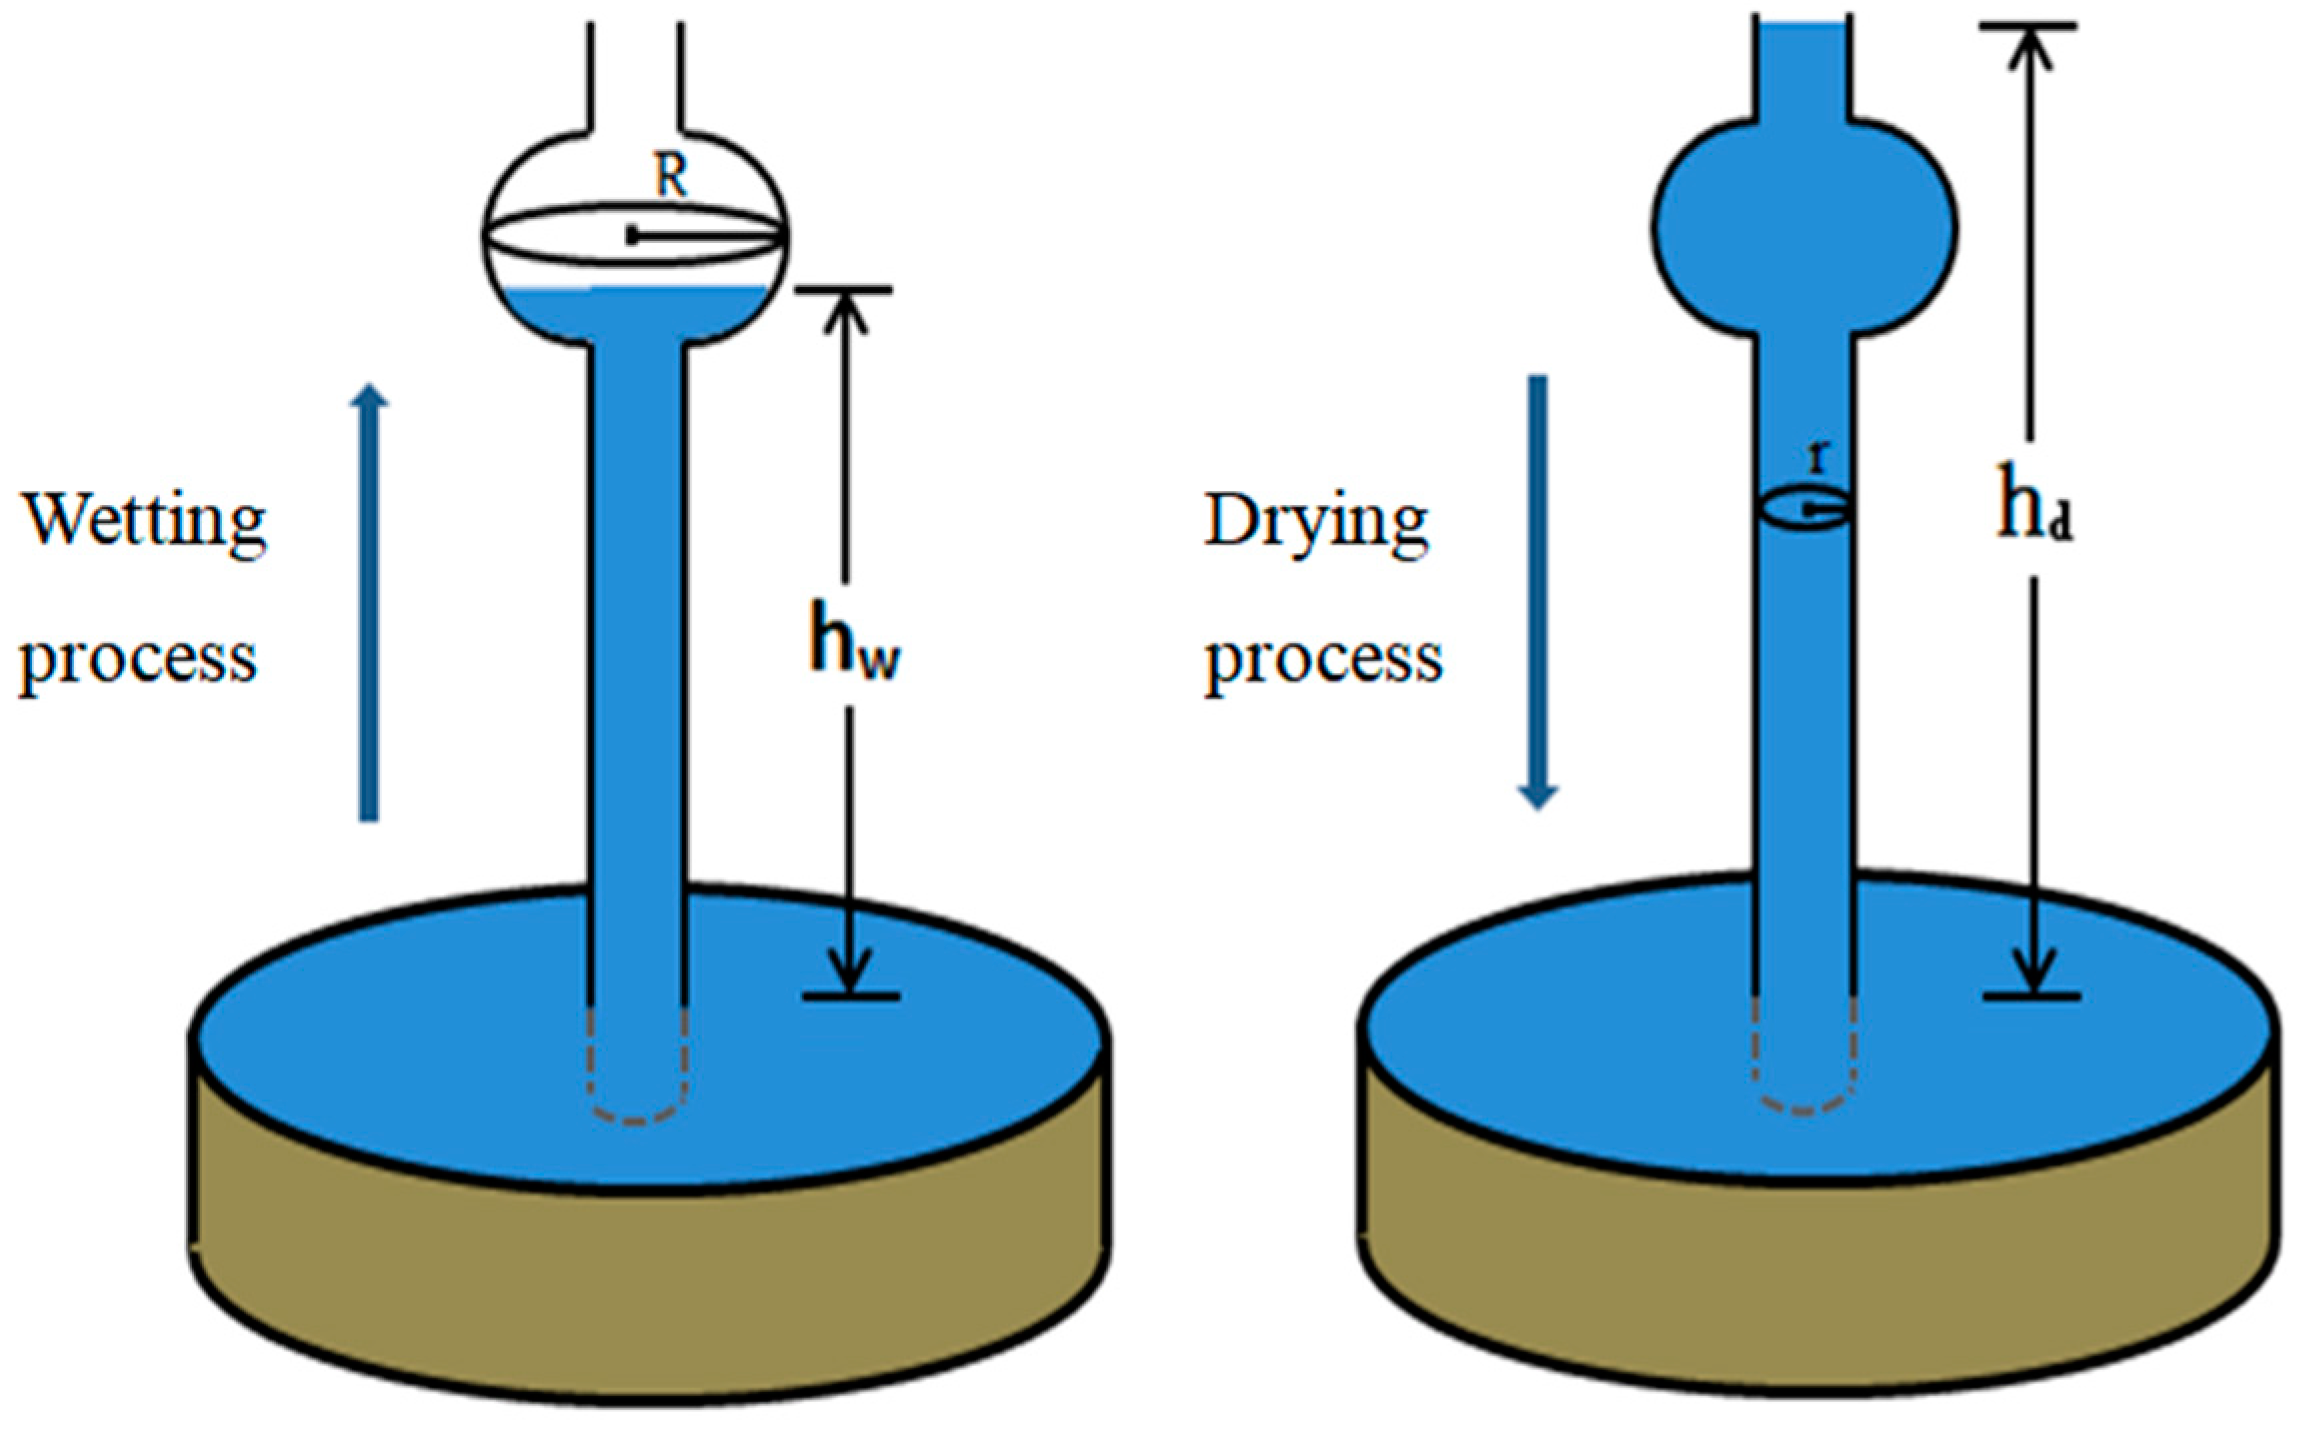
- (2)
- The “ink-bottle” effect.
5. Conclusions
Author Contributions
Funding
Data Availability Statement
Acknowledgments
Conflicts of Interest
References
- Zhao, L.S.; Huang, X.W.; Feng, Z.Y.; Liu, D.P.; Zheng, X.D.; Yin, W.Q. Research progresses and development tendency of pollution prevention and control technologies for mining of weathered crust elution-deposited rare earth ore. J. Chin. Soc. Rare Earths 2022, 40, 988–997. [Google Scholar]
- Ilankoon, I.M.S.K.; Tang, Y.; Ghorbani, Y.; Northey, S.; Yellishetty, M.; Deng, X.; McBride, D. The current state and future directions of percolation leaching in the Chinese mining industry: Challenges and opportunities. Miner. Eng. 2018, 125, 206–222. [Google Scholar] [CrossRef]
- Liu, C.F.; Zhou, F.; Wu, X.Y.; Feng, J.; Chi, R.A. Development and prospect in seepage and mass transfer process of weathered crust elution-deposited rare earth ore. J. Chin. Soc. Rare Earths 2021, 42, 111–121. [Google Scholar]
- Nie, W.R.; Zhang, R.; He, Z.Y.; Zhou, J.; Wu, M.; Xu, Z.G.; Chi, R.A.; Yang, H.F. Research progress on leaching technology and theory of weathered crust elution-deposited rare earth ore. Hydrometallurgy 2020, 193, 105295. [Google Scholar] [CrossRef]
- Chi, R.A.; Zhang, Z.Y.; Yu, J.X.; Xiao, C.; Zhang, Y.; Zhou, F.; Liu, D.; Wu, X. Research process of weathered crust elution-deposited rare earth ore. J. China Univ. Ming Technol. 2022, 51, 1178–1192. [Google Scholar]
- Li, Q.; Qin, L.; Wang, G.S.; Luo, S.H.; Long, P.; Peng, C.L. Leaching mechanism of ion-adsorption rare earth. J. Chin. Soc. Rare Earths 2021, 39, 543–554. [Google Scholar]
- Feng, J.; Zhou, F.; Chi, R.A.; Liu, X.X.; Yuan, L.; Liu, Q. Effect of anovel compound on leaching process of weathered crust elution-deposited rare earth ore. Miner. Eng. 2018, 129, 63–70. [Google Scholar] [CrossRef]
- Guo, Z.Q.; Lai, Y.M.; Jin, J.F.; Zhou, J.R.; Zhao, K.; Sun, Z. Effect of particle size and grain composition on two-dimensional infiltrationprocess of the weathered crust elution deposited rare earth ores. Trans. Nonferrous Met. Soc. China 2020, 30, 1647–1661. [Google Scholar] [CrossRef]
- Jiang, S.; Lu, R.L.; Wei, W.; Wang, G.S. Slope deformation mechanisms and stability of ion-adsorption rare-earth mines by in-situ leaching. Eng. J. Wuhan Univ. 2022, 2, 1–9. [Google Scholar]
- Deng, W.J.; Rao, Y.Z.; Wang, D.; Xu, W.F.; Chen, J.L. Effect of rain fall infiltration on the stability of Ion-adsorbed rare earth slope. Min. Res. Dev. 2019, 39, 6–12. [Google Scholar]
- Chen, F.; Xiong, R.Z.; Guo, S.; Zhong, L.X. Study on slope stability of in-situ leachingstopes under heavy rainfall. Min. Res. Dev. 2019, 39, 34–37. [Google Scholar]
- Guo, Z.Q.; Zhou, J.R.; Zhou, K.F.; Jin, J.F.; Wang, X.J.; Zhao, K. Soil−water characteristics of weathered crust elution-deposited rare earth ores. Trans. Nonferrous Met. Soc. China 2021, 31, 1452–1464. [Google Scholar] [CrossRef]
- Guo, Z.Q.; Lai, Y.M.; Jin, J.F.; Zhou, J.R.; Sun, Z.; Zhao, K. Effect of Particle Size and Solution Leaching on Water Retention Behavior of Ion-Absorbed Rare Earth. Geofluids 2020, 4921807. [Google Scholar] [CrossRef]
- Miller, C.J.; Yesillern, N.; Yaldo, K.; Merayyan, S. Impact of soil type and compaction conditions on soil water characteristic. J. Geotech. Geo. Eng. 2002, 128, 733–742. [Google Scholar] [CrossRef]
- Zhou, A.N.; Sheng, D.C.; Carter, J.P. Modelling the effect of initial density on soil-water characteristic curves. Geotechnique 2012, 62, 669–680. [Google Scholar] [CrossRef]
- Miao, L.C.; Jing, F.; Houston, S.L. Soil-water characteristic curve of remolded expansive soils. In Proceedings of the Fourth International Conference on Unsaturated Soils, Carefree, Arizona, 2–6 April 2006; pp. 997–1004. [Google Scholar]
- Vanapalli, S.K.; Fredlund, D.G.; Pufahl, D.E. The influence of soil structure and stress history on the soil-water characteristics of acompacted till. Geotechnique 2001, 51, 573–576. [Google Scholar] [CrossRef]
- Charles, W.W.N.G.; Pang, Y.W. Experimental investigations of the soil-water characteristics of avolcanic soil. Can. Geotech. J. 2011, 37, 1252–1264. [Google Scholar]
- Salager, S.; Elyoussoufi, M.S.; Saix, C. Effect of temperature on water retention phenomena in deformable soils: Theoretical and experimental aspects. Eur. J. Soil Sci. 2010, 61, 97–107. [Google Scholar] [CrossRef]
- Pham, H.Q. A Volume-Mass Constitutive Model for Unsaturated Soils. Ph.D. Thesis, University of Saskatchewan, Saskatoon, SK, Canada, 2005. [Google Scholar]
- Fredlund, D.G.; Pham, H.Q. A volume-mass constitutive model for unsaturated soils in terms of two independent stress state variables. In Proceedings of the Fourth International Conference on Unsaturated Soils, Carefree, Arizona, 2–6 April 2006; pp. 105–134. [Google Scholar]
- VanGenuchten, M.T. A closed-form equation for predicting the hydraulic conductivity of unsaturated soils. Soil Sci. Soc. Am. J. 1980, 44, 892–898. [Google Scholar] [CrossRef]
- Fredlund, D.G.; Xing, A.Q. Equations for the soil-water characteristic curve. Can. Geotech. J. 1994, 31, 521–532. [Google Scholar] [CrossRef]
- Fredlund, D.G.; Xing, A.Q.; Fredlund, M.D.; Barbour, S.L. The relationship of the unsaturated soil shear strength to the soil-water characteristic curve. Can. Geotech. J. 1996, 33, 440–444. [Google Scholar] [CrossRef]
- Guo, Z.Q.; Jin, J.F.; Zhao, K.; Wang, X.J.; Chen, G.L. Ionadsorption type rare earth mining technology and theoretical research status. Rare Earth 2018, 39, 132–141. [Google Scholar]
- Zhao, M.H.; Liu, X.P.; Peng, W.X. Application of Water Film Theory in Unsaturated Soils. Rock Soil Mech. Chin. 2007, 28, 1323–1327. [Google Scholar]
- Wang, X.J.; Li, Y.X.; Huang, G.L.; Deng, S.Q.; Xiao, W.J.; Liao, S.Y. Changes of Pore Structure in Leaching Ion-adsorption Type Rare Earth Ore. Chin. J. Rare Earth 2017, 35, 528–536. [Google Scholar]
- Gallge, C.P.K.; Uchimura, T. Effects of dry density and grain size distribution on soil-water characteristic curves of sandy soils. Soils Found. 2010, 50, 161–172. [Google Scholar] [CrossRef]


| Physical Indexes | Water Content (%) | Density, ρ/(g/cm3) | Dry Density (g/cm3) | Liquid Limit, WP/(%) | Plastic Limit, WP/(%) | Plastic Index, IP |
|---|---|---|---|---|---|---|
| Original rare earth | 16.95 | 1.67 | 1.428 | 40.56 | 30.27 | 10.29 |
| Array | Different Types of Leaching Solutions | Different Concentrations of Leaching Solutions | |||||
|---|---|---|---|---|---|---|---|
| Water | 3% Magnesium Sulfate | 3% Ammonium Sulfate | Water | 2% Ammonium Sulfate | 3% Ammonium Sulfate | 5% Ammonium Sulfate | |
| Sdrying/(kPa) | 26, 285, 881 | 24, 846, 699 | 24, 147, 965 | 26, 285, 881 | 24, 508, 822 | 24, 147, 965 | 23, 637, 732 |
| Swetting/(kPa) | 21, 827, 473 | 20, 936, 176 | 20, 284, 435 | 21, 827, 473 | 20, 486, 381 | 20, 284, 435 | 19, 812, 978 |
| Shysteresis/(kPa) | 4, 458, 408 | 3, 910, 523 | 3, 863, 530 | 4, 458, 408 | 4, 022, 441 | 3, 863, 530 | 3, 824, 754 |
Disclaimer/Publisher’s Note: The statements, opinions and data contained in all publications are solely those of the individual author(s) and contributor(s) and not of MDPI and/or the editor(s). MDPI and/or the editor(s) disclaim responsibility for any injury to people or property resulting from any ideas, methods, instructions or products referred to in the content. |
© 2023 by the authors. Licensee MDPI, Basel, Switzerland. This article is an open access article distributed under the terms and conditions of the Creative Commons Attribution (CC BY) license (https://creativecommons.org/licenses/by/4.0/).
Share and Cite
Guo, Z.-q.; Liu, L.-f.; Tang, T.; Zhou, K.-f.; Wang, X.-j. Influence of Leaching Solution on the Soil-Water Characteristics of Ion-Absorbed Rare Earth Minerals and Its Hysteresis Effect. Minerals 2023, 13, 637. https://doi.org/10.3390/min13050637
Guo Z-q, Liu L-f, Tang T, Zhou K-f, Wang X-j. Influence of Leaching Solution on the Soil-Water Characteristics of Ion-Absorbed Rare Earth Minerals and Its Hysteresis Effect. Minerals. 2023; 13(5):637. https://doi.org/10.3390/min13050637
Chicago/Turabian StyleGuo, Zhong-qun, Ling-feng Liu, Tao Tang, Ke-fan Zhou, and Xiao-jun Wang. 2023. "Influence of Leaching Solution on the Soil-Water Characteristics of Ion-Absorbed Rare Earth Minerals and Its Hysteresis Effect" Minerals 13, no. 5: 637. https://doi.org/10.3390/min13050637