1. Introduction
Laser-Induced Breakdown Spectroscopy (LIBS) is one prominent spectroscopic technique used for material characterizations. The robustness of this technique for the analysis of a multitude of samples with varied applications has already been established. It is a technique for elemental analysis with the potential to be used on different kinds of samples [
1,
2,
3]. This work reports the applicability of LIBS for meteorite analysis.
Meteorites are solar system objects—basically debris of some astronomical object such as a planet, satellite, comet or meteoroid—that originate in outer space and end up on Earth. In a manner of speaking, meteorites can be deemed as carriers of the history of our solar system which can be traced back several millennia. They bear and shed wisdom on what is beyond our daily perception. They contain information on the history and evolution of the solar system in the form we know today. The chemical signature and age of the solar system can be discerned from a closer look at the meteorites. Since some meteorites contain stardust from the stars formed prior to even the solar system, the study of these pre-solar grains gives a more pellucid picture of star formation and evolution [
4].
An understanding about the structural and elemental composition of the meteorites will not just give a clue about its origin, throwing more light on the origin of the universe, but also on how planets and asteroids formed and impacts of large meteorites on Earth and life on Earth. For instance, it is conjectured that meteorites might have carried down to the Earth organic compounds such as carboxylic acids, complex amino acids, aliphatic amines, acetic acid and formic acid which are responsible for life on Earth. Meteorites are not just life-starters but are also believed to be life-extinguishers too, as in the case of the extinction of dinosaurs around 65 million years ago which is attributed to meteorite impacts [
5].
Certain meteorites, referred to as “primitive meteorites” are believed to contain the first ever solid material formed in the solar system. Moreover, these primitive meteorites serve as a perfect sampling specimen to represent the solar system in terms of age and composition, providing insights on the proportions of the elements present in the solar system as a whole. In this context, the class of meteorites called chondrites deserves special attention. They are the oldest known rocks and come under the category of primitive meteorites which supposedly formed during the formation of the solar system. The chondrites were formed from the coalescence of the dust and grains from the early solar system and are characterized by the presence of chondrules which are the solidified droplets of molten granular materials. This extra-resemblance of the chondrite composition to the composition of the solar system in comparison to the other types of meteorites is because chondrites have undergone little or no further changes—igneous processing or any other form of differentiation of the parent body—since their formation [
6].
Thus, the study of meteorites is important to scientists, astronomers, geologists, anthropologists and archaeologists alike. Since meteorite composition to a great extend represents the bulk composition of the solar system, it makes sense to probe into the elemental or structural making of the meteorite when one is curious about these specific aspects of the solar system. The components and structure of the meteorites depend on a number of factors. The parent body or the source is one factor here. The point of impact when it falls on the Earth also plays a crucial role in the structure. In addition to these, the meteorite structure is affected by the path the astronomical object took through the atmosphere and the concomitant aspects, such as friction, pressure and the chemical reactions with atmospheric gases, that it was subjected to. Consequently there are numerous types of meteorites that are classified and sub-classified in different schemes based on different criteria [
7].
For several decades an area of interest for scientists has been the cosmochemistry of Rare Earth Elements (REEs) [
8]. As early as in 1935, Noddack determined the abundance of REEs in a composite mixture of meteorites using X-ray spectroscopy. After more than two decades, Schmitt et al. successfully identified all REEs, including Sc and Y in several meteorite samples by means of neutron activation analysis [
9]. Of particular interest are the primitive meteorites of which chondrite meteorites is a category. The presence of REEs in chondrite meteorites is suggestive of the REE abundance in the solar system whose compositional signature these chondrites carry [
10].
The analyses of these kinds of materials are conventionally carried out by Inductively Coupled Plasma Mass Spectroscopy (ICP-MS), Energy Dispersive X-Ray Spectroscopy (EDS), Scanning Electron Microscope (SEM), etc. A fast and reliable analytical technique for the study of meteorites that allows these classifications to be easier and more accurate would hence be a boon to astronomers, geologists and archaeologists alike. Among the different laser spectroscopy techniques, Laser-Induced Breakdown Spectroscopy (LIBS) is one used for elemental characterizations. The significance of this technique is due to its wide range of application, versatility, accuracy, speed and efficiency. Moreover, in comparison to conventional techniques, LIBS offers several advantages such as precision, low cost, rapidity, portability, low destructivity and lack of waste production. In addition to all these features, what makes LIBS stand out as the most-suited technique for meteorite studies is its capability of identifying even the elements which are present in the sample as trace elements. This aspect is highly significant when one seeks to look for elements which are found in minimal quantities in a sample as is often the case of REEs in meteorites [
11,
12,
13,
14,
15,
16].
In LIBS, an intense nanosecond laser pulse is focused on the sample to be analysed, which causes a small portion of the sample, in the order of a nanogram to a microgram, to be ablated. This leads to the formation of plasma that is characteristic of the elements present in the sample. The excited ions and atoms in the plasma emit radiation which is collected and studied to gain understanding of the sample at hand [
17,
18,
19]. The potential of the LIBS technique as an efficient, strong spectroscopic technique for the identification of the elements present in the sample even up to trace element levels is now well-established [
18,
19,
20]. Oztoprak, in 2016, reported the application of this technique for the study of ceramics. Biomedical application of LIBS has been studied in our center at the Department of Atomic and Molecular Physics, Manipal Academy of Higher Education by Unnikrishnan et al. [
21]. Since the technique can be used to identify and quantify several elements simultaneously, it is regarded as a robust tool for multi-elemental analysis in different types of samples such as soil, stones, pottery, biological samples, archaeological artefacts, pigments, agricultural crops, water, etc. [
21,
22,
23]. Moreover, the possibility of remote application of the technique is promising for studies in adverse conditions and when the samples cannot be brought to the laboratory [
24,
25,
26,
27].
Although the applicability of LIBS as a potent tool for elemental analysis has been well-established in several fields, very few groups have worked on investigating its usefulness in the study of meteorites. One of the groups that is already looking into the possibility of using LIBS for meteorite analysis is De Giacomo et. al [
13]. The team reported the applicability of LIBS as a simple and fast tool for meteorite analysis by studying four different kinds of samples and determined the prowess of the technique in recognizing different types of extra-terrestrial basalts. The same group also carried out the compositional study of meteorite samples and was successful in understanding the concentration profiles of iron, nickel and cobalt in a single meteorite specimen. With this, they used the capability of LIBS for quantitative study combined with multi-elemental analysis.
Thompson et. al. carried out LIBS analysis on a couple of Martian meteorites [
26]. The team employed a remote LIBS technique to study two basaltic rock types. They could differentiate between the olvine–phyric and basaltic shergotitte on the basis of MgO and CaO. LIBS also offers an easy method to tackle misrepresentation of meteorites. Many times, other similar materials are passed off as meteorites, either deliberately or otherwise. These “meteor-wrongs” can be distinguished from meteorites by looking for the presence of specific major elements, nickel, cobalt and trace elements gallium and iridium. Senesi et. al. reported a study wherein they could distinguish between a certified iron meteorite and a pig iron product that was suspected to be a meteorite fragment [
16].
There is much more to be explored when it comes to the application of LIBS for meteorite studies. The multitude of possible kinds of meteorite materials itself presents a vast scope for more rigorous studies in this field. Only very few types of meteorites have been subjected to LIBS studies so far, and many more remain to be closely studied. Determining the applicability of LIBS on different kinds of meteorite samples which are complex matrices of several elements configured in different structures is the motivation behind this work.
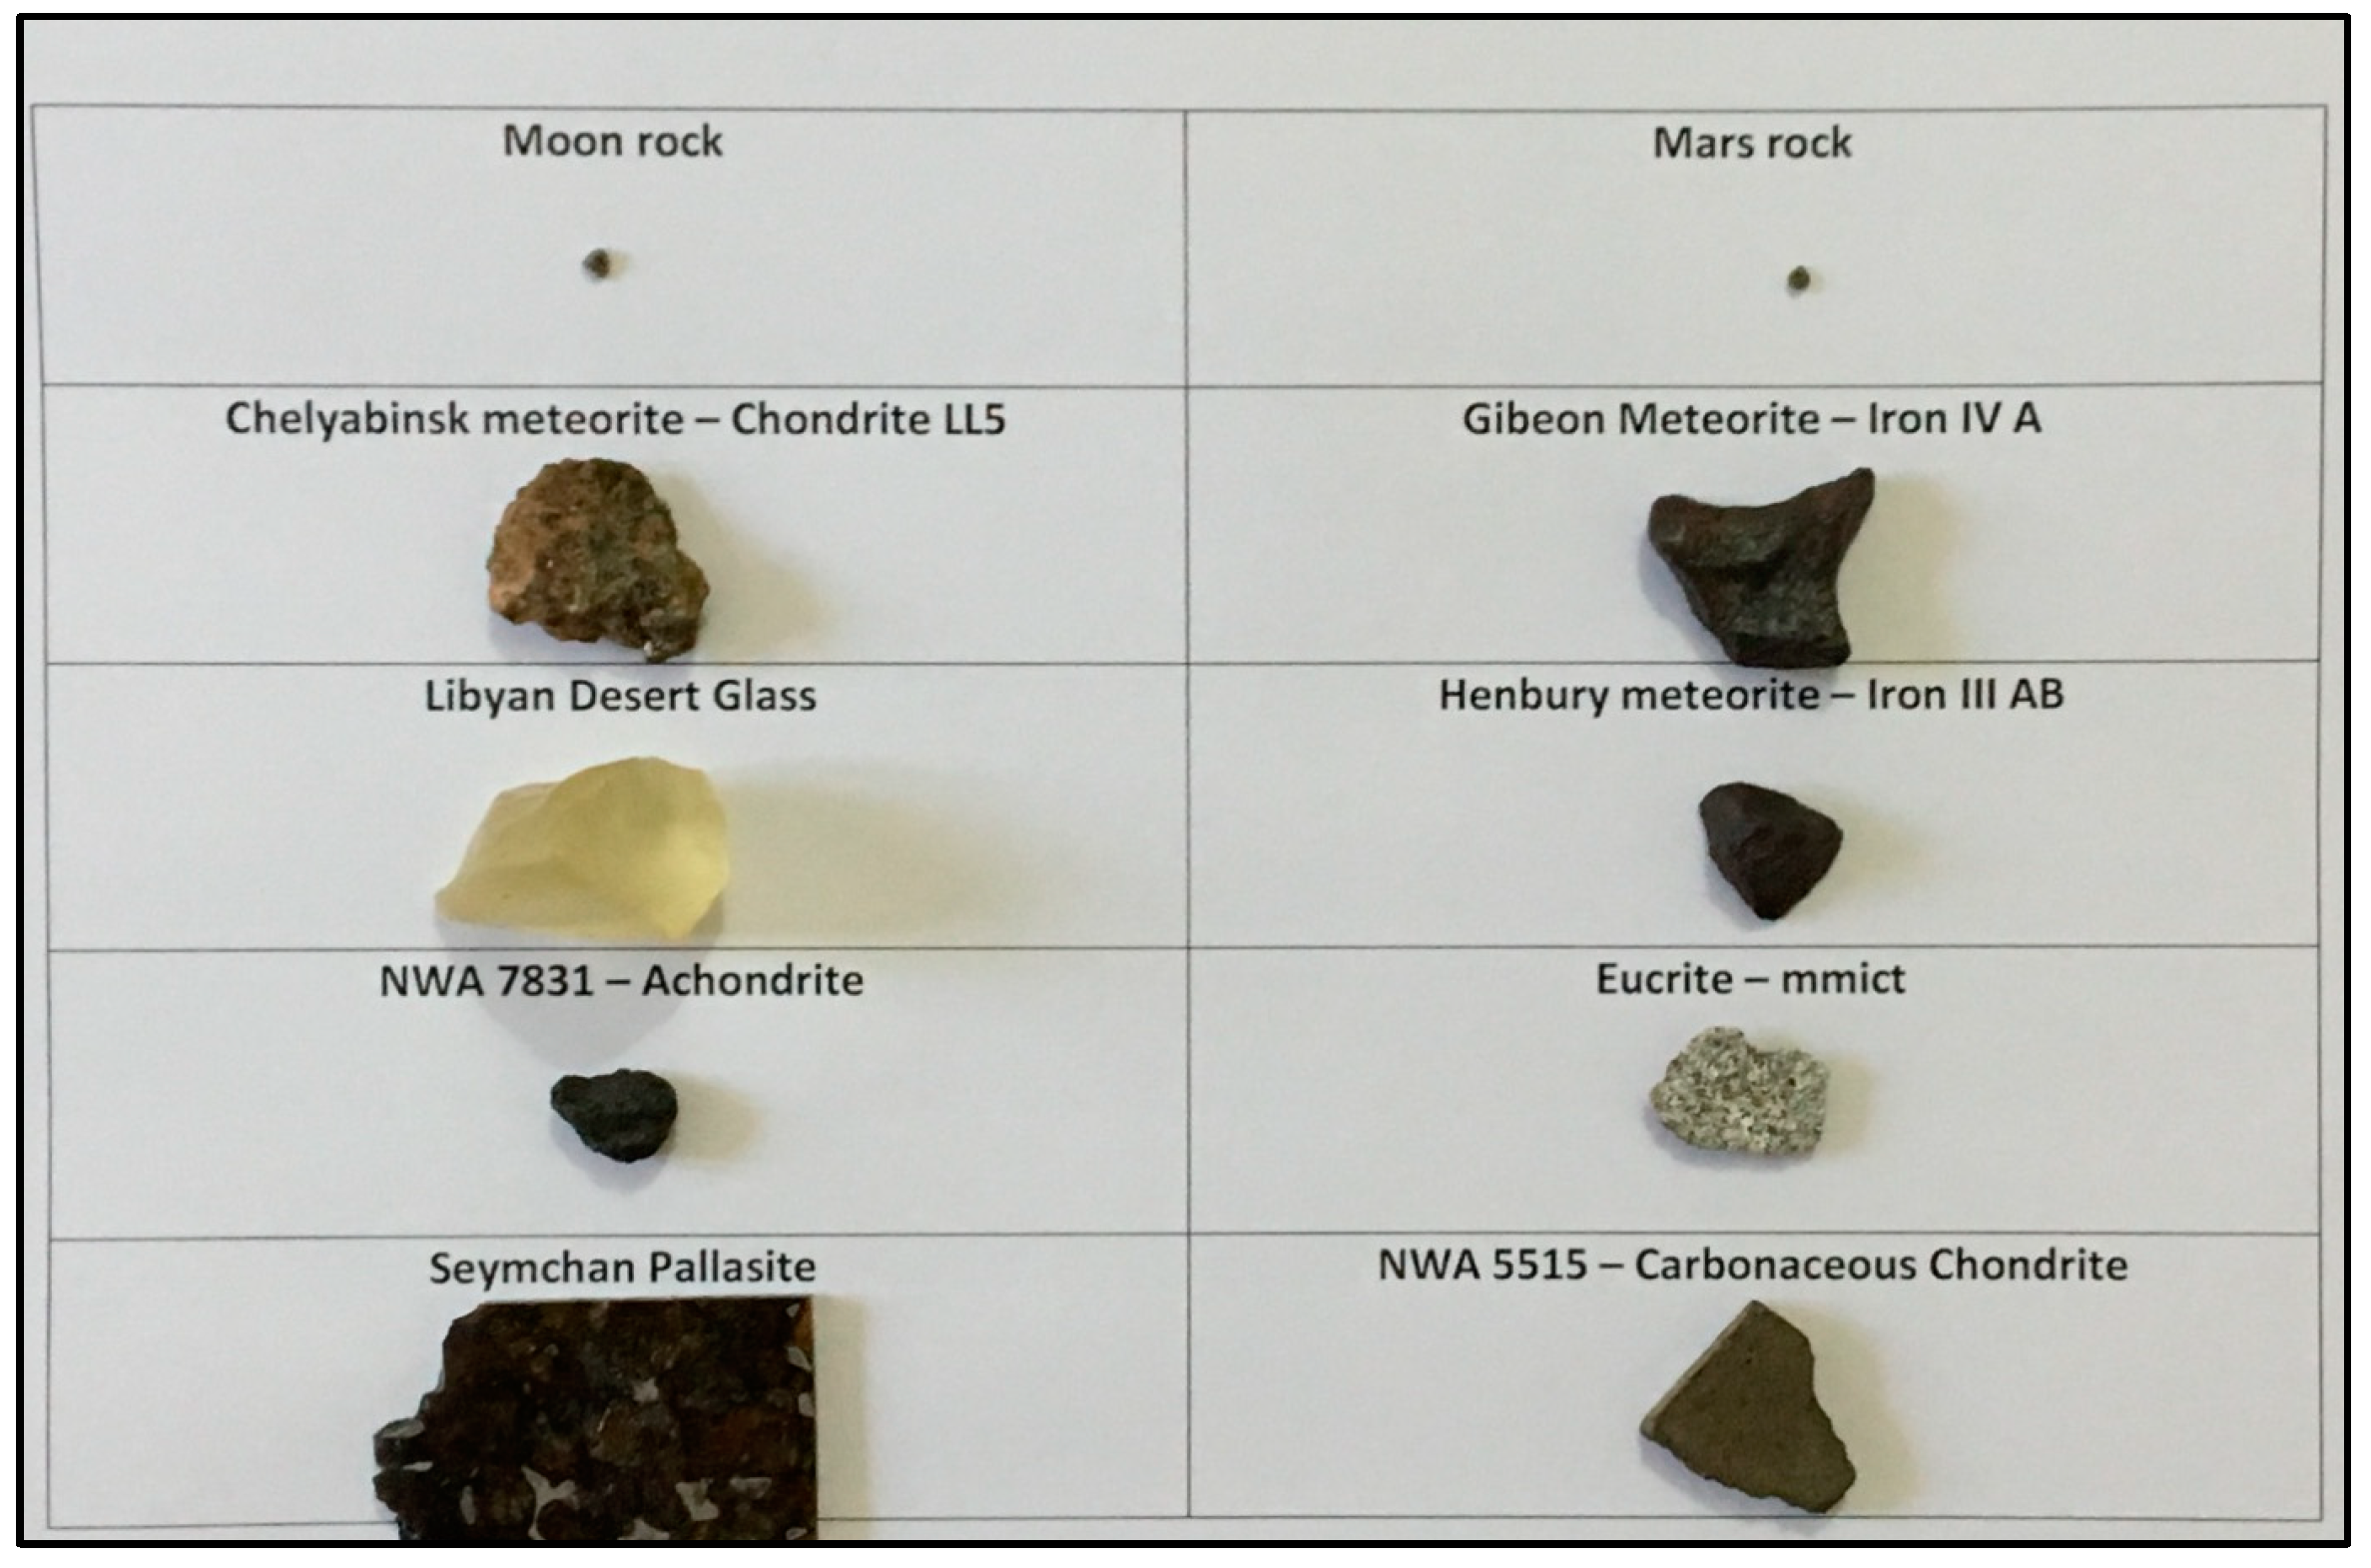
Herein, we demonstrate the potential of LIBS to investigate different astronomical samples. The focus is on the elemental characterization of the samples and confirmation of the major and minor components in each sample as inferred from the literature. We also look for any element in addition to those expected from the literature. Of special interest would be examining the presence of any REEs and looking into the possibility of a classification based on the presence of REEs in these samples. The samples studied include a few meteorite samples, a lunar meteorite, a Martian meteorite and one impact material. A lunar material refers to any kind of specimen material obtained from the moon or a meteorite of lunar origin. Similarly, a Martian meteorite is a sample of material from the planet Mars. An impact glass, also known as impactite, is a terrestrial material formed or modified by the impact of a meteorite. Among the meteorites studied are metallic meteorites as well as stony meteorites in which category chondrites and achondrites fall.
This work seeks to verify the applicability of LIBS as a tool for a qualitative and quantitative analysis of these different kinds of astronomical specimens. Moreover, a multivariate analysis of the LIBS data has also been carried out. PCA of the data obtained from the LIBS studies proved to be successful in the classification of the studied samples into different groups.
3. Results and Discussions
The LIBS spectra obtained, with the echelle spectrograph, for all the samples are given below (
Figure 3,
Figure 4,
Figure 5,
Figure 6,
Figure 7,
Figure 8,
Figure 9,
Figure 10,
Figure 11 and
Figure 12). In the case of Sample A1 (Moon rock), a lunar material, the characteristic iron lines were observed at 422.59 nm, 429.92 nm and 396.23 nm, and the decisive lines of oxygen were observed at 430.28 nm and 445.64 nm. In addition, the chromium lines were observed at 396.90 nm. In addition to these, less intense lines corresponding to the minor components were observed at 406.55 nm and 427.45 nm for titanium, 430.81 nm and 445.53 nm for manganese and 418.33 nm for silicon [
28].
In the case of Sample A2 (Mars rock), the characteristic iron lines were observed at 422.78 nm, 430.90 nm and 396.87 nm, and the decisive lines of oxygen were observed at 430.28 nm and 404.61 nm. The magnesium line can be observed at 442.31 nm. In addition, aluminium line was observed at 394.47 nm and 393.35 nm. In addition to these, lines corresponding to the minor components were observed at 526.55 nm and 445.47 nm for calcium and at 438.41 nm for sodium. However, there was no line indicative of the presence of potassium.
Sample A3 belongs to the class of chondrites. These are stony meteorites with less iron content when compared to iron meteorites, such as the Gibeon meteorites or the Henbury meteorites, which are going to be discussed after this. Although iron content in chondrites is less compared to metallic meteorites, even in chondrites iron dominates in comparison to other elements. Here, one can observe the distinct presence of other elements as well which is not the case with iron meteorites.
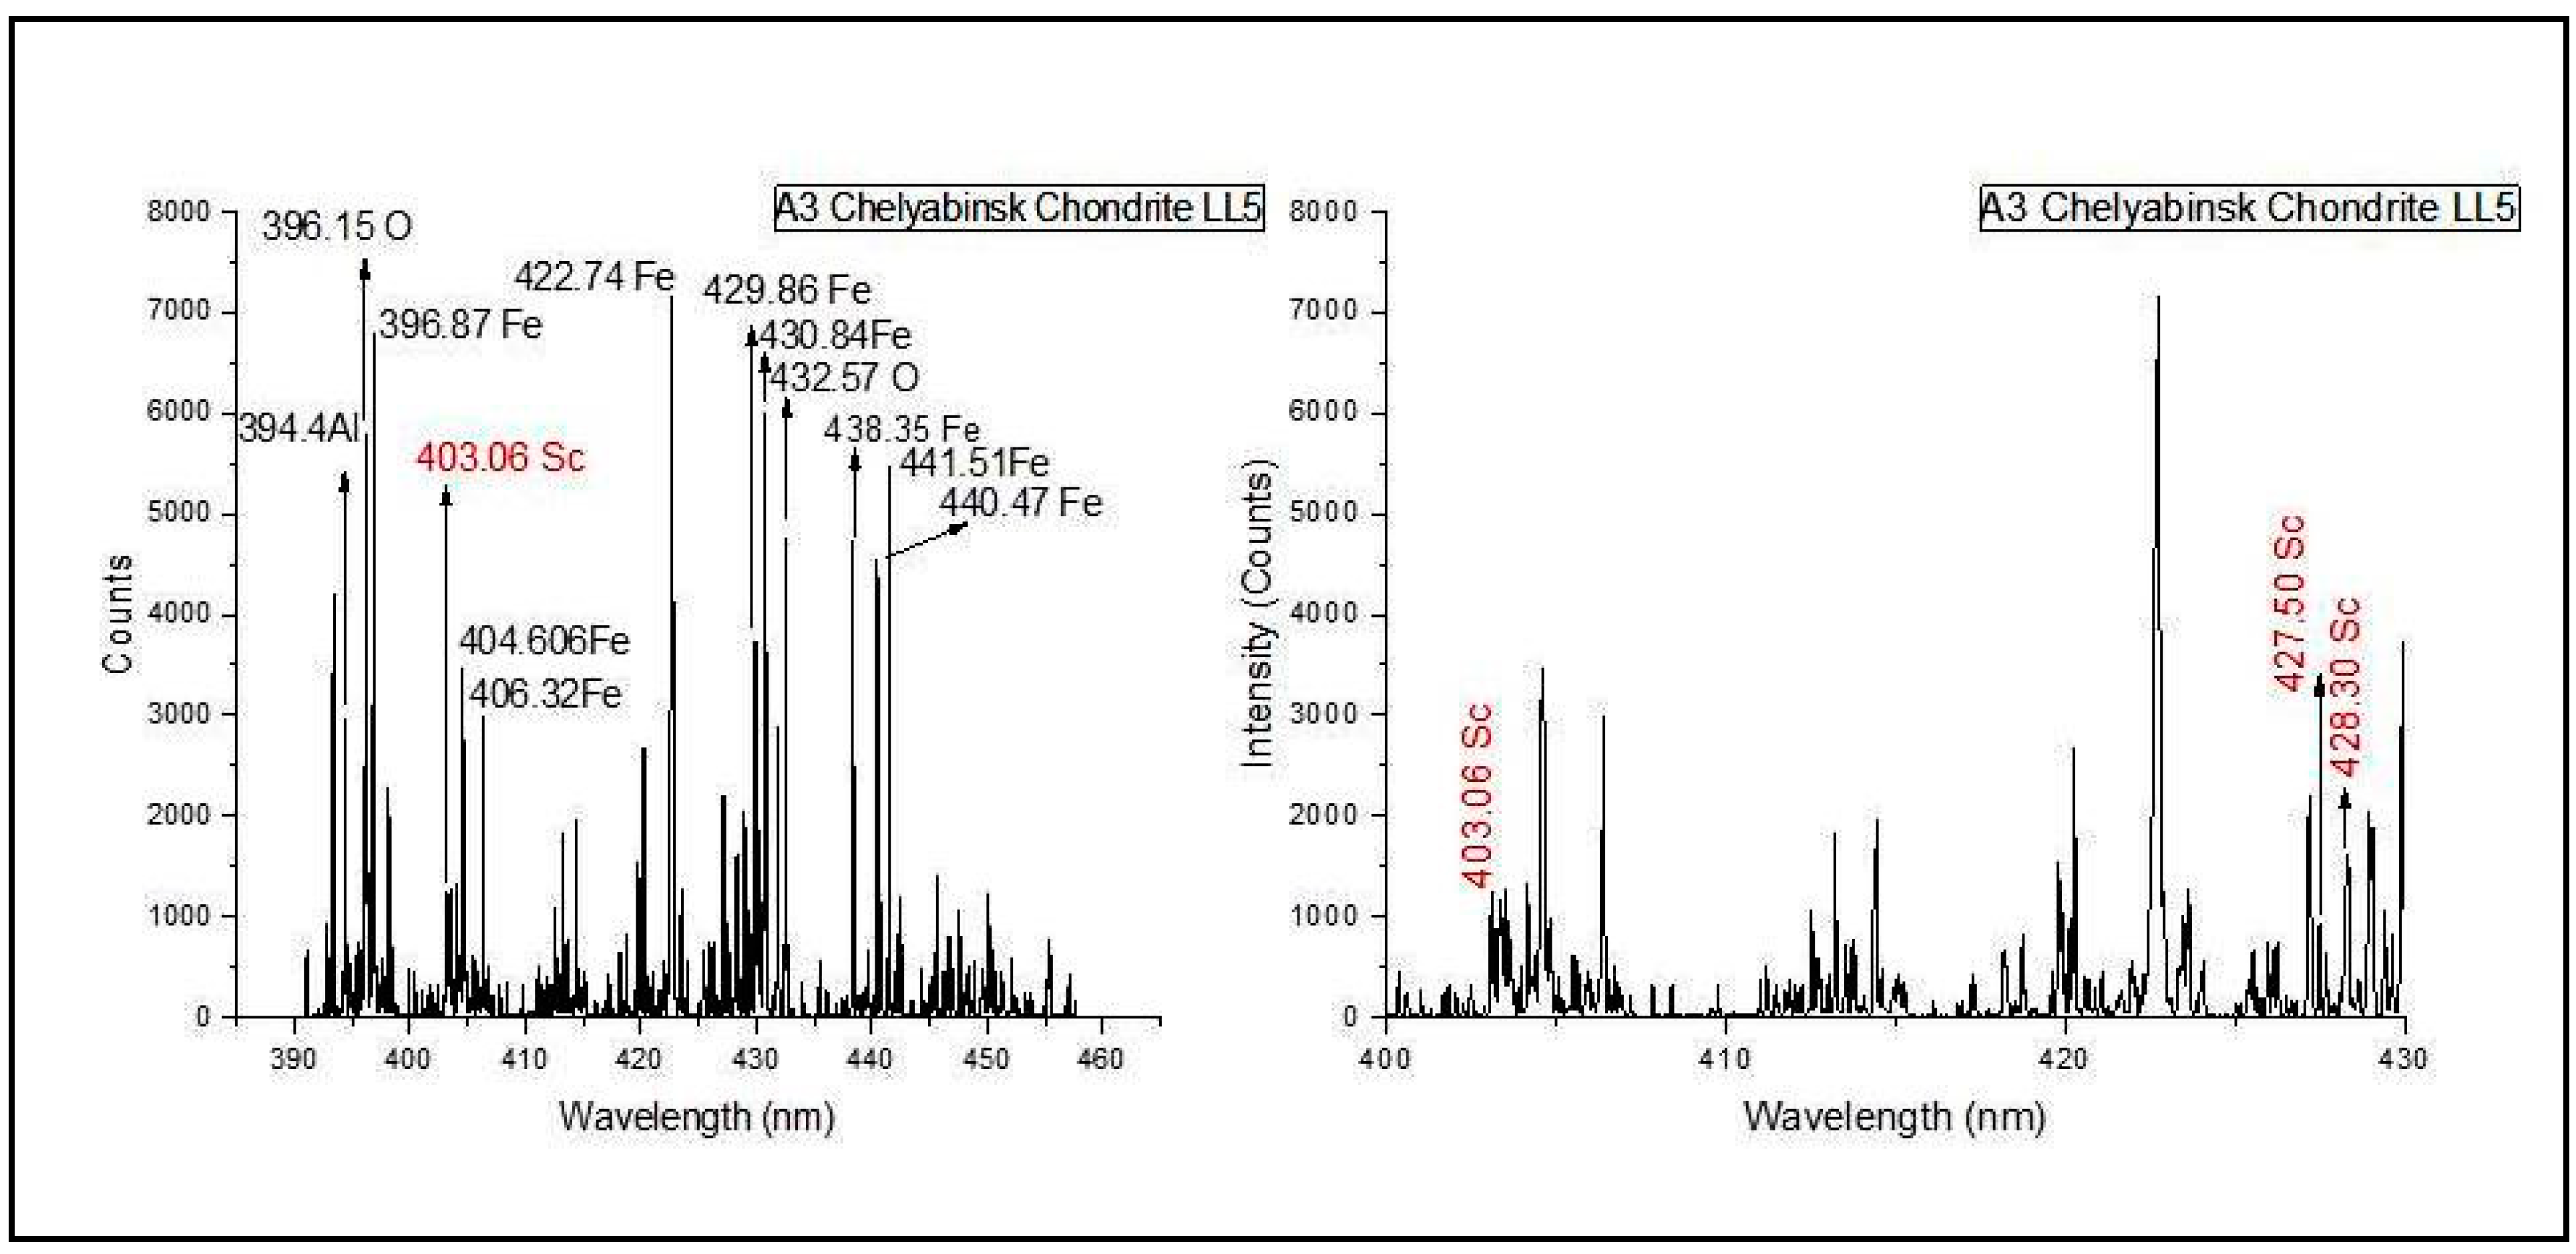
In the case of Sample A3 (Chelyabinsk chondrite LL5), the presence of iron as the major constituent is clearly evident from the spectrum with the characteristic iron lines observed at 438.35 nm, 430.84 nm, 422.74 nm and 396.87 nm. The lines of oxygen were observed at 432.57 nm and 396.15 nm. In addition, the minor component aluminium shows its presence at 394.4 nm. Barely could any Ni line could be identified in this regime of wavelength studied. To examine if nickel lines are present in any other wavelength region of the spectrum, a comparison was made with the LIBS spectra recorded for pure nickel with the same setup. In this, several nickel lines were found to be prominent in the wavelength range from 300 nm to 380 nm, a wavelength region which was not included in the earlier analysis. The LIBS spectrum of Sample A3 was again analysed in this wavelength range to reveal two emission lines corresponding to nickel at 303.79 nm and 306.46 nm.
In A3, interestingly, a scandium line was observed at 403.06 nm in the LIBS spectrum of A3. The presence of this rare Earth element which was not among the expected components as per the meteorite bulletin was intriguing since the existing information on the presence of rare Earths in chondrite meteorites is not something that can be ruled out. Further probing of less intense lines of the LIBS emissions of the same samples in the wavelength range from 400 nm to 430 nm revealed a few more lines of scandium at very low intensities when compared to the other expected constituents of the sample. These scandium lines were observed at 427.50 nm, 428.30 nm and 442.50 nm.
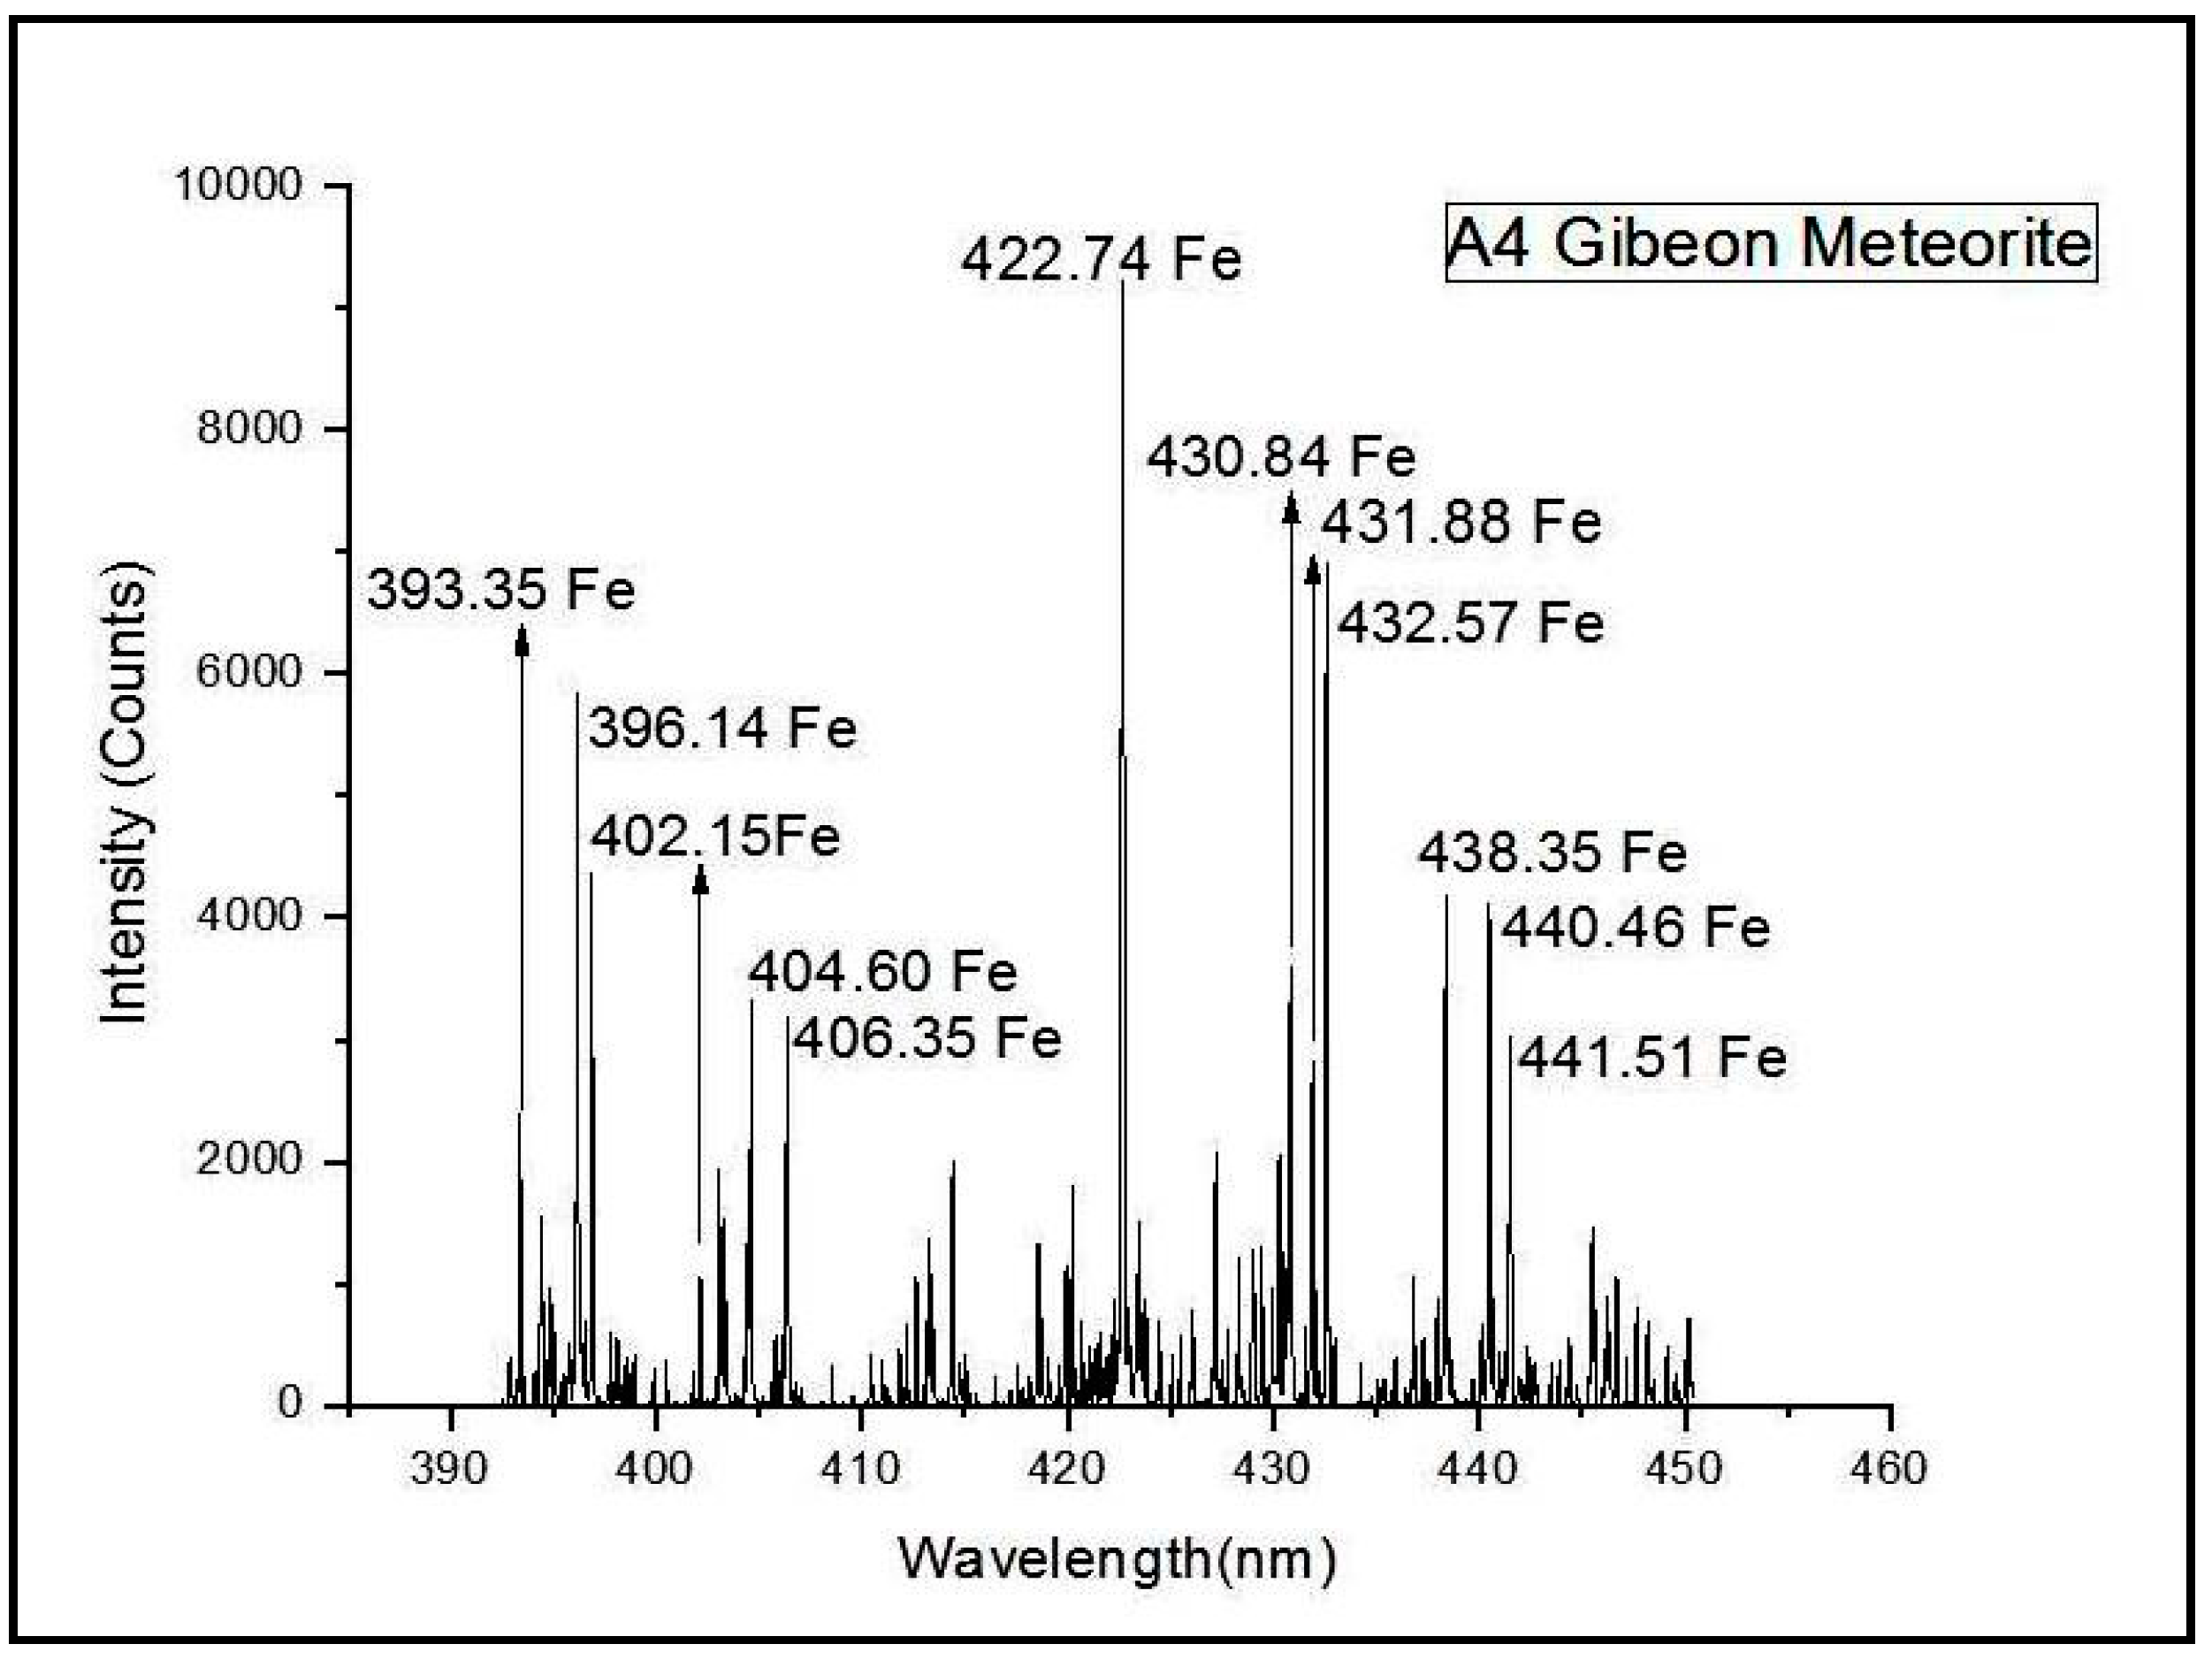
In Sample A4 (Gibeon meteorite), iron is again clearly seen by many characteristic lines such as the ones seen at 422.74 nm, 438.35 nm, 430.84 nm, 396.14 nm and 393.35 nm. This is expected since the Gibeon meteorite is a metallic meteorite, unlike non-metallic meteorites such as chondrites and achondrites. In fact, more precisely put, the Gibeon meteorite is an iron meteorite, and this is very clearly understandable from the LIBS data obtained. Here, the strongest lines all correspond to iron emission. The minor components, such as nickel, gallium, indium and iridium, however, are not observed in the spectrum although they are expected to be present in the sample in low quantities.
Sample A5 is not a meteorite, but an impact material formed as a result of a meteorite hitting the Earth. It is an impact glass called the Libyan Desert glass. In A5, silicon lines were identified at 390.55 nm and 288.18 nm [
28]. Oxygen lines were observed at 396.15 nm and 432.57 nm, thus establishing the major constituent of glass, viz., silicon dioxide. The line at 422.67 may be attributed to chromium which also shows its presence at 612.24 nm. Less intense lines indicative of minor constituents, such as zirconium (361.85 nm) and titanium (518.38 nm and 589.15 nm) were also identified. In addition to these, thorium lines can be seen at 589.63 nm, 616.22 nm and 769.97 nm. The presence of thorium was not expected and needs to be compared to the lines from a standard thorium spectrum recorded under the same experimental conditions.
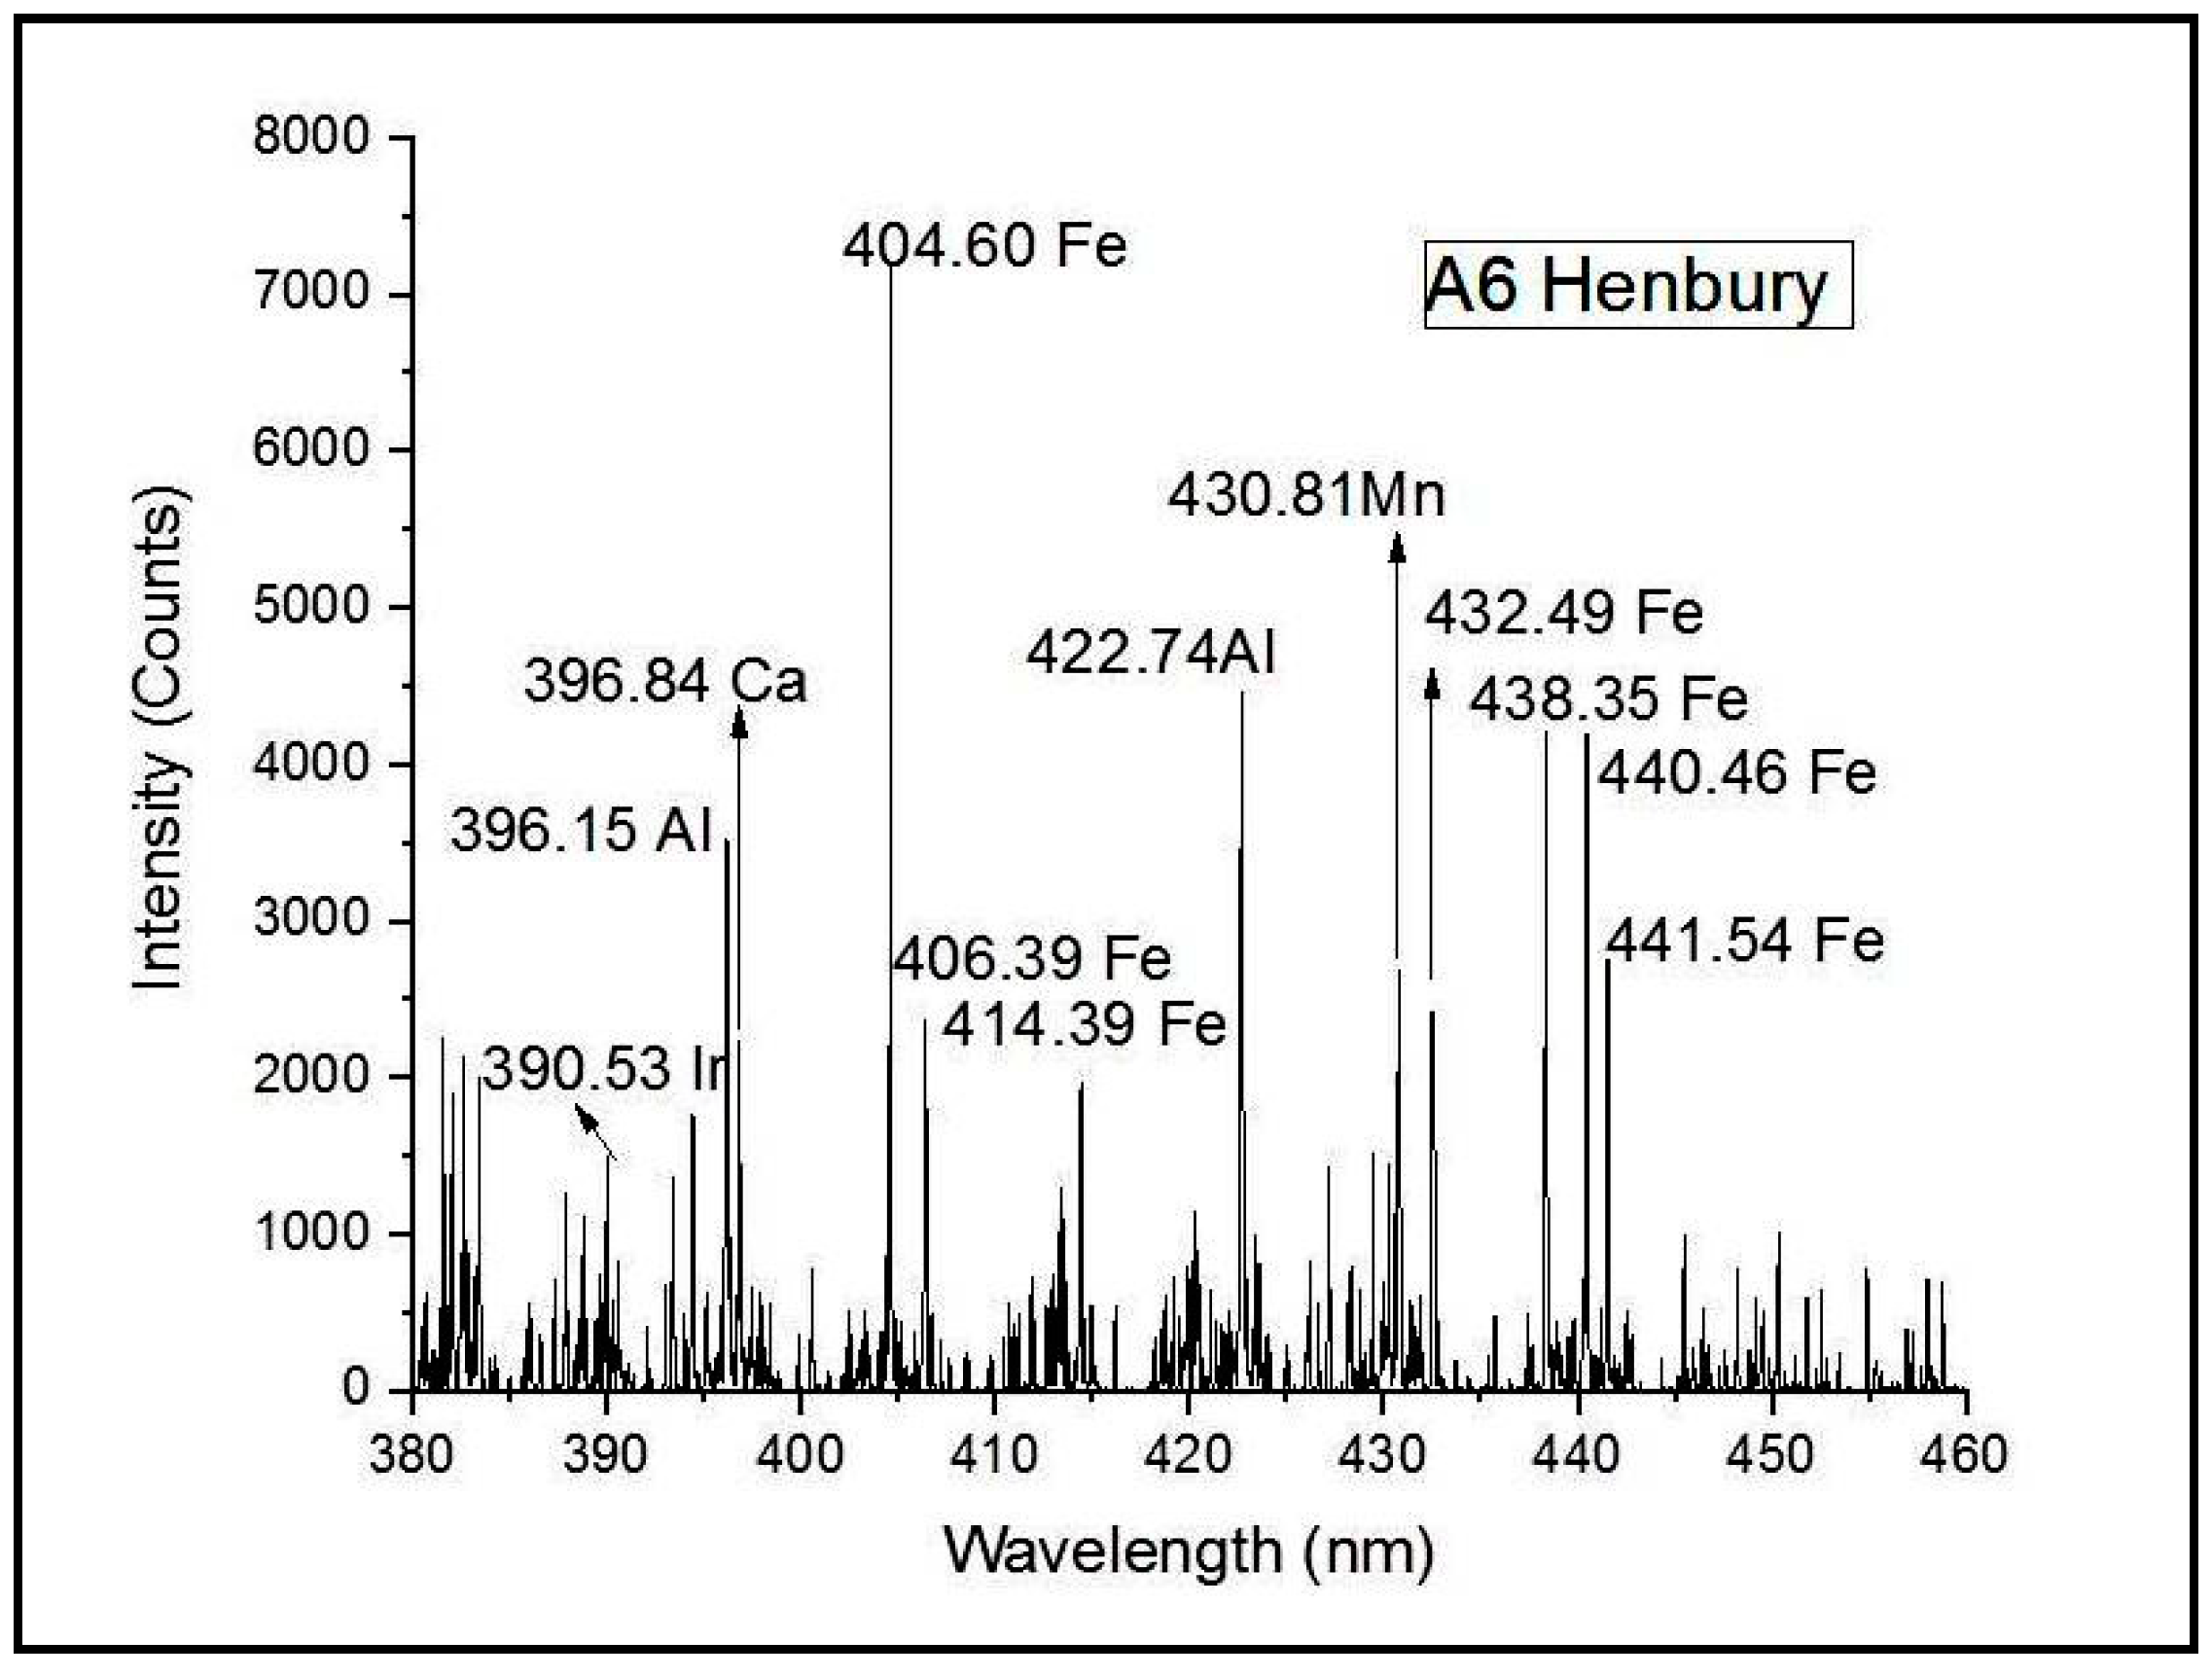
Sample A6, similar to the Gibeon meteorite, is a metallic meteorite and hence the dominance of iron is expected to be more than in the case of stony meteorites. In sample A6, the Henbury meteorite, the strongest lines were identified corresponding to iron [
28] at 404.60 nm, 406.39 nm, 414.39 nm, 432.49 nm, 438.35 nm, 440.46 nm and 441.54 nm as well as for aluminium at 422.74 nm and 396.15 nm. The line at 430.81 nm corresponding to emission from manganese was also identified. The emission at 396.84 nm can be attributed to emission from calcium as per NIST data. The weaker lines identified corresponded to iridium at 390.53 nm.
Sample A7 comes under the class of achondrites which is another stony meteorite like the chondrites but does not contain the chondrule structures present in the chondrites. Here again, unlike the iron meteorites, other elements are expected along with iron, with iron being a major constituent. For Sample A7 (Achondrite NWAf), the characteristic iron lines can be observed at 404.61 nm, 432.52 nm, 438.36 nm, 440.47 nm, 441.51 nm and so on. In addition, a strong aluminium line is observed at 422.69 nm. In addition to these, lines corresponding to the minor components were observed at 396.84 and 431.89 nm for calcium. A closer investigation for more emission from rare Earths from among the less intense lines, revealed the presence of samarium and dysprosium corresponding to the emission lines at 382.42 nm and 396.84 nm, respectively.
Although the initial assignments were calculated only for the most intense lines in the spectrum, which usually confirmed the presence of most of the major and minor components expected, to confirm the presence of the rare Earths, a few weaker emissions were also studied, and this gave more convincing evidence of the presence of these rare Earth elements. The presence of dysprosium was reconfirmed by the lines at 403.36 nm and 420.19 nm. Similarly, the lines at 403.07 nm, 404.02 nm, 406.72 nm, 426.02 nm and 429.47 nm show the presence of scandium in the sample. The presence of neodymium was indicated by the lines at 423.41 nm and 428.27 nm, while the lines at 423.65 nm and 431.90 nm reconfirmed the presence of samarium.
Sample A8 is another stony achondritic meteorite and comes under the subclass of HED meteorites. HED stands for howardite–eucrite–diogenite, and these came from a differentiated parent body and underwent igneous processing such as magmatic rocks found on Earth, and for this reason, they closely resemble terrestrial igneous rocks. Sample A8 (Eucrite MMICT) showed the strong presence of iron at 422.63 nm, 422.78 nm, 429.96 nm, 431.88 nm, 432.59 nm, 445.80 nm, 396.87 nm and so on [
28]. Lines of calcium were identified at 396.84 nm, 428.30 nm and 430.25 nm. The presence of aluminium, another major component, can be confirmed from the line at 396.15 nm. The minor component manganese has been identified at 430.81 nm and 445.82 nm, while the presence of lithium can be seen at emission with wavelength of 413.25 nm.
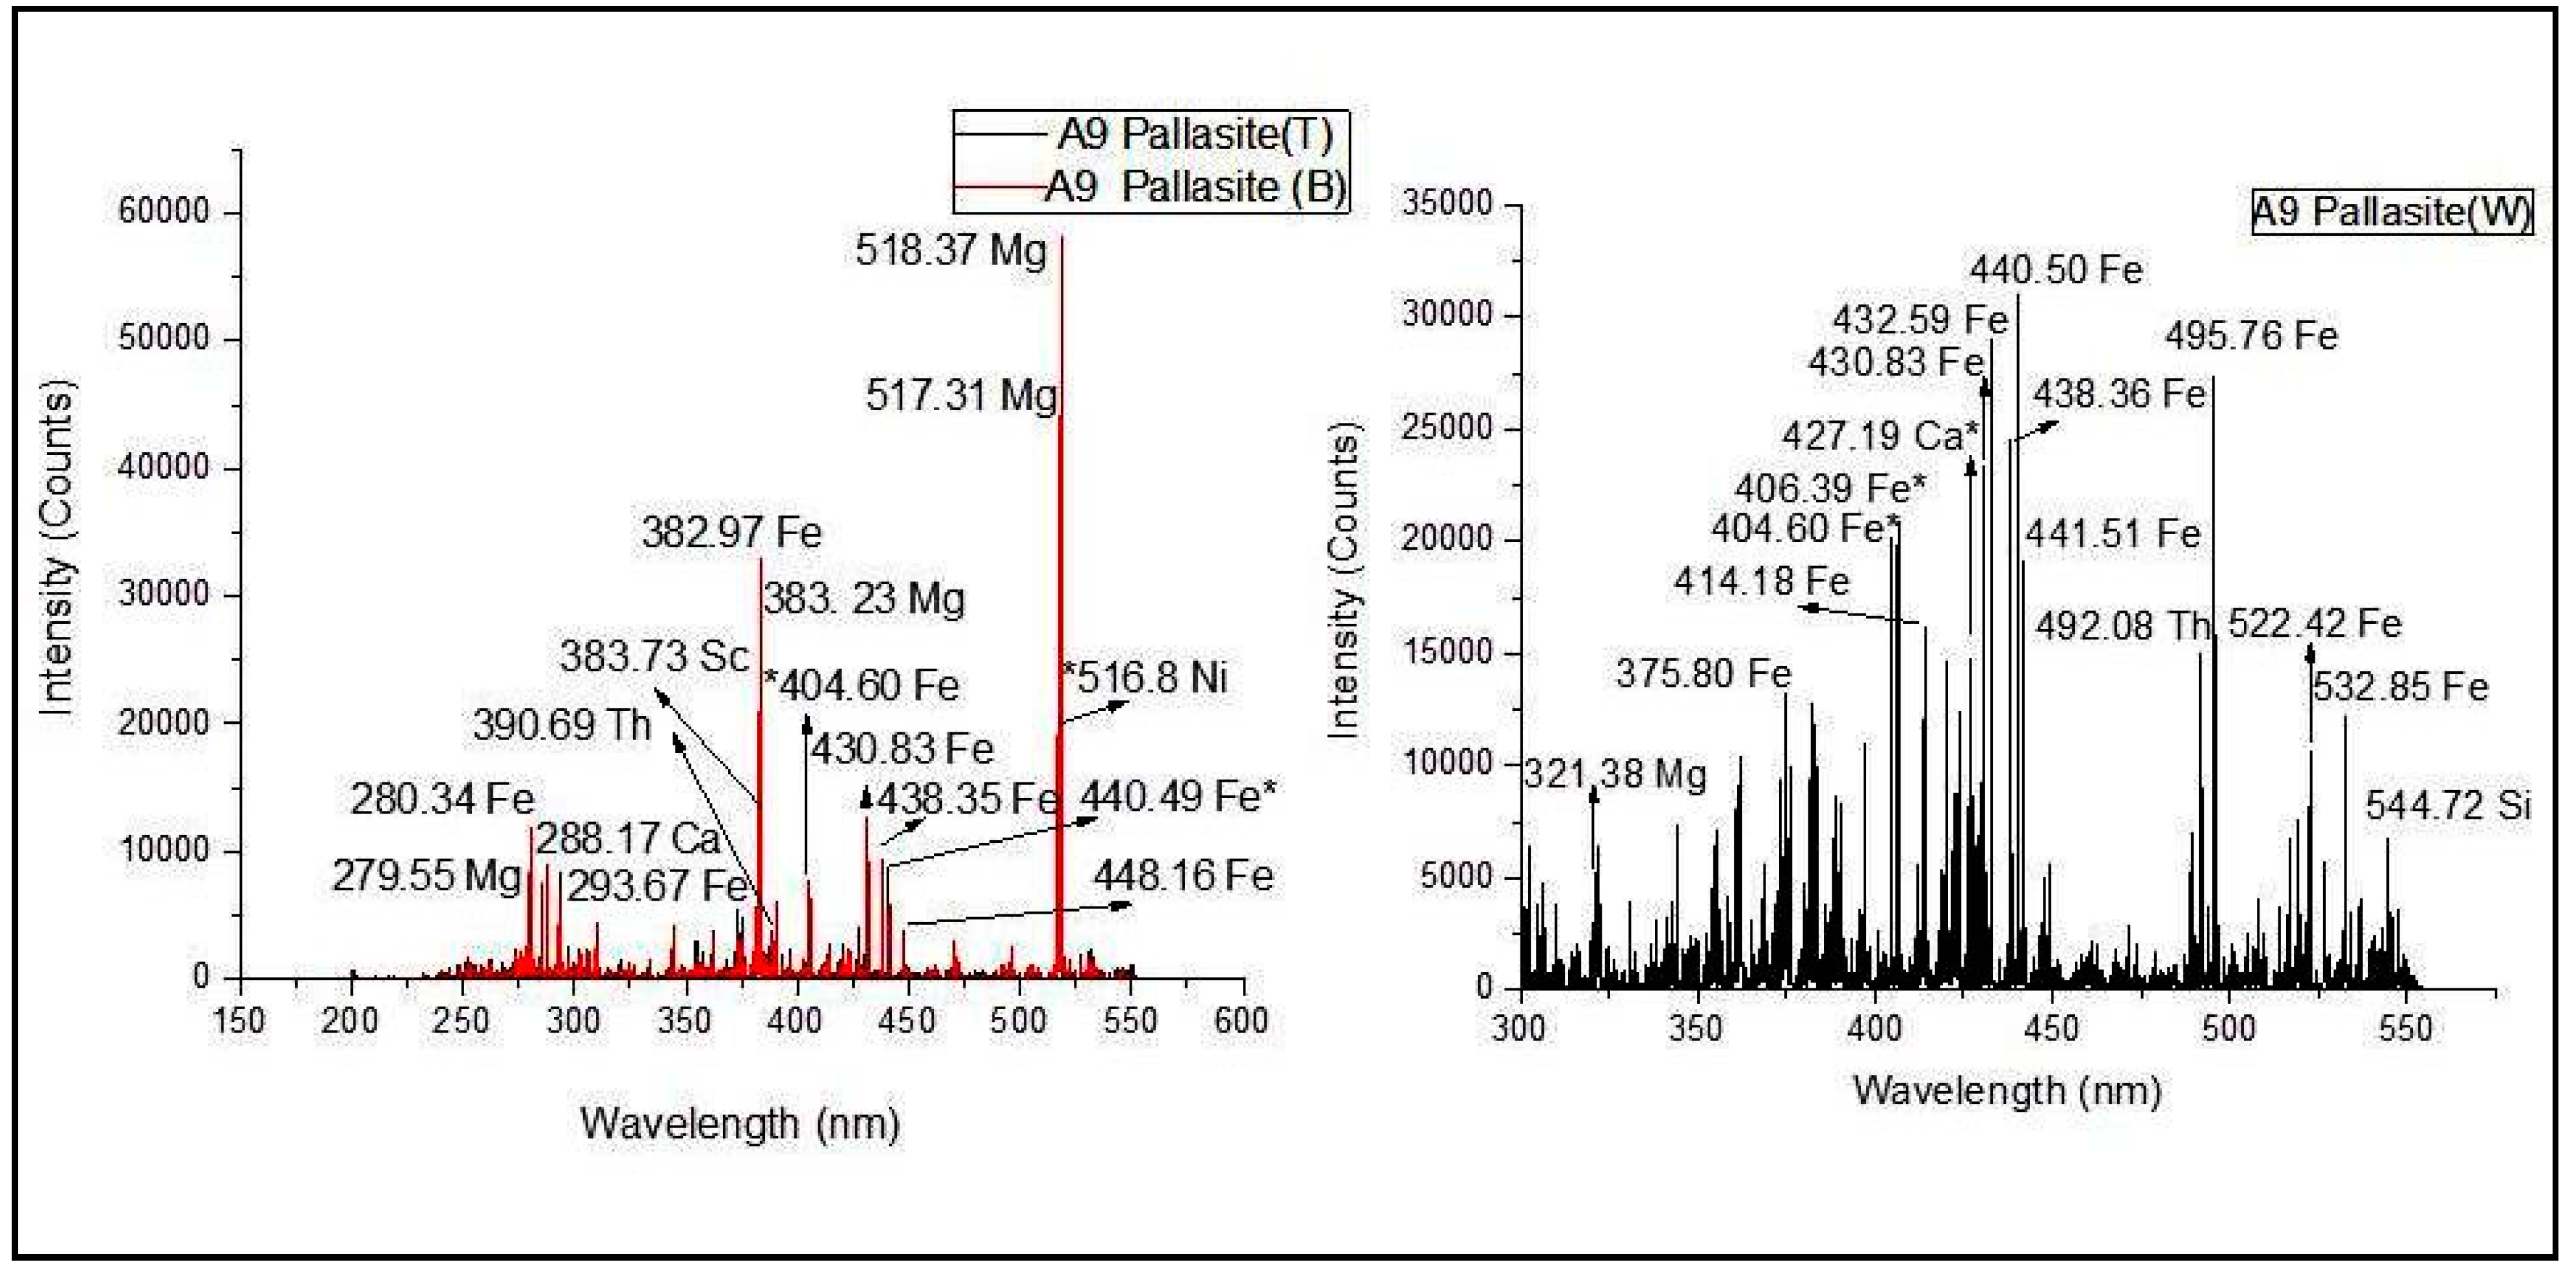
The next sample analysed was pallasite. Pallasites are stony iron meteorites. What sets them apart from the rest of the meteorites is the crystalline olivine (magnesium–iron silicate) in the iron–nickel matrix. As a result, physically, this meteorite looks very different from the rest. The pallasite sample studied had three kinds of regions on it. Hence, LIBS data was recorded separately for each: (i) a transparent region named pallasite (T), (ii) a dark region named pallasite (B), and (iii) a relatively lighter region named pallasite (W). The spectra of pallasite B and pallasite (T) are strikingly similar and show emission lines at the same wavelengths. The peak assignments for these have been calculated on the overlaid spectra. The spectrum of pallasite (W) is different from the other two.
In pallasite (T) and pallasite (B), iron lines are observed at 430.83 nm, 438.35 nm, 440.49 nm, 404.60 nm, 382.97 nm and so on. Magnesium lines can be seen at 518.37 nm, 517.31 nm, 383.23 nm and 279.54 nm. Nickel and calcium lines can be observed at 516.80 nm and 288.17 nm, respectively.
The spectra of pallasite (W) have more lines in the same wavelength range with evidence of the presence of silicon at 544.72 nm as compared to the other regions of the same sample. The major lines all correspond to iron as expected, and these can be observed throughout the entire spectrum, a few strong lines being at 440.50 nm, 432.59 nm, 495.76 nm, 430.83 nm and 406.39 nm. A magnesium line can be observed at 321.38 nm. The line at 427.19 nm shows the presence of calcium as a minor component. Since the structure of pallasite has olivine in an iron matrix and since most of the magnesium emissions are coming from the transparent and black regions of the sample, while the white region is majorly iron rich, it is reasonable to deduce that the transparent and black regions of the samples are part of the crystalline olivine.
The spectrum of A10 reveals the presence of iron as the major component with the strongest iron lines at 422.74 nm, 518.42 nm and many more lines of iron along the entire range of spectrum analysed. Another major component, magnesium, can also be seen as represented by the lines at 517.30 nm, 309.29 nm and 285.16 nm. Other lines of magnesium are probably masked by the iron lines which are present throughout the spectral range. Lines corresponding to manganese may be seen at 375.98 nm, 445.53 nm and 492.12 nm. The line at 430.89nm can be attributed to the presence of oxygen in the sample. Chromium and cobalt lines can be seen at 466.93 nm and 495.79 nm, respectively.
Since this is a carbonaceous chondrite sample, it was decided to take a closer look at the not-so-strong lines as well in an effort to verify the presence of any rare Earth elements as was seen in the chondrite sample studied earlier. A primary attempt in this direction revealed the presence of rare Earth elements such as dysprosium from the line 396.86 nm, lutetium as seen from the line at 427.19 nm and scandium as seen from the lines at 387.82 nm, 441.46 nm and 482. 01 nm. For further confirmation of the presence of rare Earths, a selected region of the spectrum was studied more extensively. For this, as in the earlier case, the closer examination was performed in the wavelength range from 400 nm to 450 nm. This resulted in the identification of neodymium and samarium, which was in addition the confirmation of dysprosium at line 414.38 nm. The samarium lines can be seen at 404.61 nm, 423.63 nm and 438.41 nm, while the neodymium lines can be seen at 432.57 nm.
It may be noted that nickel and magnesium lines which are supposed to be present in many of the samples could not be identified as the analysis was completed only for the range of wavelength from 390 nm to 460 nm where the majority of the emission lines are present. Analysis of pure nickel and magnesium lines showed that Ni emission lines are mostly in the wavelength range from 300 nm to 380 nm, while the magnesium lines in a standard magnesium sample were observed at wavelengths above 500 nm. The presence of nickel and magnesium was confirmed in the samples where they were expected by probing into the regions beyond the wavelength range earlier studied.
Given below is a
Table 3 containing details of elements expected in each sample, as per the meteorite bulletin, and the elements identified along with REEs expected and identified.
Multivariate Analysis by Principal Component Analysis (PCA)
Since the samples under consideration are seemingly composed of a number of constituent elements, some common to all and some unique to a few, and since multiple LIBS spectra were recorded from each sample, a multivariate analysis was performed to supplement the elemental analysis on the LIBS data. The LIBS analysis and peak assignments were carried out on a typical representative spectrum from all samples. However, the multivariate analysis was performed including the details from all the spectra that were recorded.
The elemental information from the LIBS spectra were analyzed using Principal Component Analysis (PCA). The computational steps involved were discussed in detail in our earlier studies [
23,
30,
31,
32]. All data processing exercises were carried out using the PLS plus/IQ module of the commercially available GRAMS software (Thermo Scientific Inc., Rockford, IL, USA).
Usually, pre-processing of the data is required before carrying out PCA. On the LIBS spectral data, no pre-processing except data interpolation was carried out. Four spectra were recorded from each sample except Samples 1 and 2, on which only two spectra could be recorded due to their smaller size. Twelve spectra were recorded from three different areas—the light, dark and transparent regions—(four spectra from each) of Sample 9. Thus, there were a total of 44 spectra in the complete dataset. Full range spectra of all 44 samples were used for PCA with the intent of possible clustering in coherence with the elemental information obtained from LIBS analysis. PCA results showing scores of Principal Component 1 (PC1 i.e., F1) versus those of Principal Component 2 (PC2 i.e., F2) are shown in
Figure 13.
From the results, one can clearly observe the individual grouping of the samples. That is, the scores of two spectra of Sample 1 have clustered together. Similarly, the scores corresponding to Sample 2 are together. This clustering can be observed in all samples except Sample 9T (transparent region of the pallasite sample) and Sample 10, the carbonaceous chondrite. The non-clustering of the spectra from Sample 10 can be due to the observed spectrum-to-spectrum variation in the maximum intensity. Since no pre-processing steps were involved in the current analysis, this variation affected the overall clustering of Sample 10. This could be further corrected if the intensity normalization procedure is followed before carrying out the PCA. In the case of Sample 9, it is clear that the three visibly different regions on it have led to data points that clustered separately. While the scores of the spectra collected from the dark (spectral series 9B) and white (spectral series 9W) regions have clustered into two separate groups, those from the transparent region of the sample (spectral series 9T) have scattered, with two of them near 9B and the other two near 9W.
Apart from the fact that the scores from the same samples have clustered together, one can also observe that the different samples with compositional similarities have scores clustering together. Sample A4 is an iron meteorite, while A3 and A6 are also meteorites with iron as the major constituent and differing only in the minor constituents. It can be observed that all of these three have grouped together in close proximity. Even the scores corresponding to the white region of Sample 9 fall in close proximity to this group, while the scores due to the dark region of the same sample are ostensibly away from this. Pallasite is also an iron-rich meteorite, but the number of minor components in it is more than that in the Gibeon or Henbury meteorites. So, it is not surprising that the different regions of the samples (which are visibly different) form different groups of scores, with the white regions grouping with the iron-rich group of meteorites, while the scores from the dark region fall away from this.
The scores corresponding to A1 and A2 have also clustered into two distinct groups separate from the rest of the iron meteorites, clearly indicating the compositional difference of the lunar and Martian matter from the rest of the meteorites. While A7 and A8 are also iron-rich materials, they are different from the A3, A4 and A6 samples in the minor components, and this can be seen in the separate clustering of the scores of these two samples away from the clusters corresponding to the other iron meteorites. It can also be seen that though A7 and A8 are both achondrites, their scores are not clustering together but remain as two different groups which can again be attributed to the difference in the minor components present in them. In fact, Samples A7 and A8 are different kinds of achondrites; diogenite and eucrite, respectively. Eucrite A8 consists of basaltic rock from the crust of the 4 Vesta in the asteroid belt. On the other hand, the diogenite achondrite A7 is composed of igneous rocks of plutonic origin which solidified on the crust of Vesta, forming crystals which are larger than those in eucrites. This may be the reason for the compositional difference between these two samples causing the two sets of data points from the two achondrites to cluster separately from the rest of the iron meteorites and from each other. It can also be observed from the multivariate studies that the rare-Earth-containing samples (A3, A7 and A10) are more or less clustered together with no other scores grouping amidst them.
The curious case among the data points seen on the result plot is that of Sample 5, Libyan glass. This is not a meteorite, but an impact glass with its chief constituents supposedly being silicon and oxygen. The LIBS spectra also confirm the same with lines corresponding to silicon and oxygen being present, along with some lines of chromium and thorium. Iron is absent in this particular sample. However, in the PCA plots, the data points corresponding to Sample 5 have also clustered along with the iron-rich meteorite group, while what was expected was for them to form a separate cluster. The reason for this will be investigated in future with more rigorous data analysis.

 ,
, 


