Article

Applied Methodological Approach for the Assessment of Soil Contamination by Trace Elements around Abandoned Coal Mines—A Case Study of the Jerada Coal Mine, Morocco

1
Resources Valorization, Environment and Sustainable Development Research Team (RVESD), Department of Mines, Mines School of Rabat, Ave Hadj Ahmed Cherkaoui, Agdal, BP 753, Rabat 10090, Morocco
2
Geology & Sustainable Mining Institute (GSMI), Mohammed VI Polytechnic University (UM6P), Lot 660, Hay Moulay Rachid, Ben Guerir 43150, Morocco
3
Faculty of Science and Technology, Cadi Ayyad University (UCA), IMED-Lab, BP 549 Av. A. El Khattabi, Marrakech 40000, Morocco
*
Author to whom correspondence should be addressed.
Minerals 2023, 13(2), 181; https://doi.org/10.3390/min13020181
Submission received: 24 December 2022 / Revised: 20 January 2023 / Accepted: 23 January 2023 / Published: 26 January 2023

Abstract

:
Previously conducted studies have established that soil contamination by trace elements (TEs) around coal mines affects ecological biodiversity and human health. One of the ways to protect the health of the surrounding population of coal mine sites is through the assessment of contamination impacts by accurate procedures for the establishment of relevant reclamation plan. The aim of the study is to develop an applied methodological approach to easily assess and quantify the impact of coal mining on the surrounding soils. To achieve this goal, a set of relevant geochemical indexes (enrichment factor—EF, geochemical background—GB, and geoaccumulation index—Igeo) and a geostatistical interpolation for mapping soil contamination were applied. It is experimentally established that the process of combining these techniques can be of great interest in highlighting the anomalous areas and revealing the contamination sources. A case study has been carried out on of the abandoned coal Jerada mine site in Morocco. Soils and coal mine waste rocks (CMWR) samples were collected from this site. Soil and CMWR samples were analyzed for their geochemical content. CMWRs were characterized further for their mineralogical composition and environmental behavior. Based on the EF, three TEs (As, Pb, and Zn) were targeted. The results of GB and Igeo calculations have established an evident relationship between the CMWR dump and the occurred soil contamination. TEs distribution pattern has been revealed using the obtained geochemical maps. The developed methodological approach may be in high demand when assessing soil contamination in most of abandoned coal mine sites around the word.

1. Introduction

Soil trace elements (TEs) contamination is a severe problem in many parts of the world [1,2], and Morocco is no exception. Over the last several decades, the mining industry in Morocco has developed at revolutionary rates. Morocco has consequently become one of the largest African producers of metals such as Cu, Pb, Zn, Co, Ag, and Mn. In 2021, a national survey on mine waste valorization in Morocco indicated that the country has 259 mines, including 165 abandoned sites [3]. Unfortunately, these mine sites were abandoned without measures to control environmental risks related to mine waste rocks and tailings storage [4,5]. In this context, several environmental studies in Morocco have shown that water resources in the vicinity of abandoned mine sites have been widely contaminated by TEs [6,7]. Similarly, the surrounding soils have been heavily contaminated by TEs [8,9]. Likewise, numerous studies from around the world have proven the negative impact of both open-pit and underground mining on the environment through the distribution of micro-elements in soils and groundwater [10,11,12].
Coal mining activities are known to be associated with increases in TE concentrations in subsurface soils [13,14]. According to Liu et al. [15], previous research activities have been conducted on surrounding soils of more than 50 coal mine sites around the world and indicated that soils were slightly to severely contaminated by TEs when compared with the provincial geochemical background levels. In the case of coal mining, the production of 1 ton of coal ore generates 0.3 tons of coal mine waste rocks (CMWR) [16,17]. The mineralogical composition of CMWRs is commonly rich of sulfide-bearing minerals which are responsible for acid mine drainage (AMD) generation due to atmospheric oxidation [17,18]. Therefore, the landfilled CMWRs release a large number of contaminants, including TEs, into the surrounding environment [1]. Of course, as the soil is the most vulnerable compartment of the terrestrial ecosystems, high TE concentrations in soil may have toxic effects on the reservoirs of biodiversity as well as reduce the agricultural productivity [13,19]. Furthermore, the exposure of particulate matter in the vicinity of coal mines has also been associated with serious health issues and chronic diseases [20].
To minimize such impacts, recent studies have proposed the creation of safer storage sites for industrial waste [21]. Others have proposed a decision-making algorithm to select a mining system to ensure the reduction of the potential for contamination, which would significantly reduce the risk of micro-elements spreading and the impact of mining on the environment [22].
The aim of this study is to develop a methodological approach that can be applied for any abandoned coal mine to assess the potential for soil contamination by TEs using a geochemical approach. The proposed workflow was conducted as follows: (1) At the beginning, representative CMWR and soil samples were collected from the study area; (2) After that, the collected samples were prepared and analyzed for their chemical and mineralogical compositions; (3) Furthermore, the environmental behavior of the CMWR was characterized and TEs of interest were selected by the enrichment factor (EF) calculation; (4) Then, the geochemical background GB and geoaccumulation index (Igeo) of the selected TEs in soils were determined; (5) Finally, geochemical maps showing the spatial distribution regarding the selected TEs were elaborated using geostatistics and the obtained values were compared with the elaborated GB to assess the soil contamination degree.

2. Materials and Methods
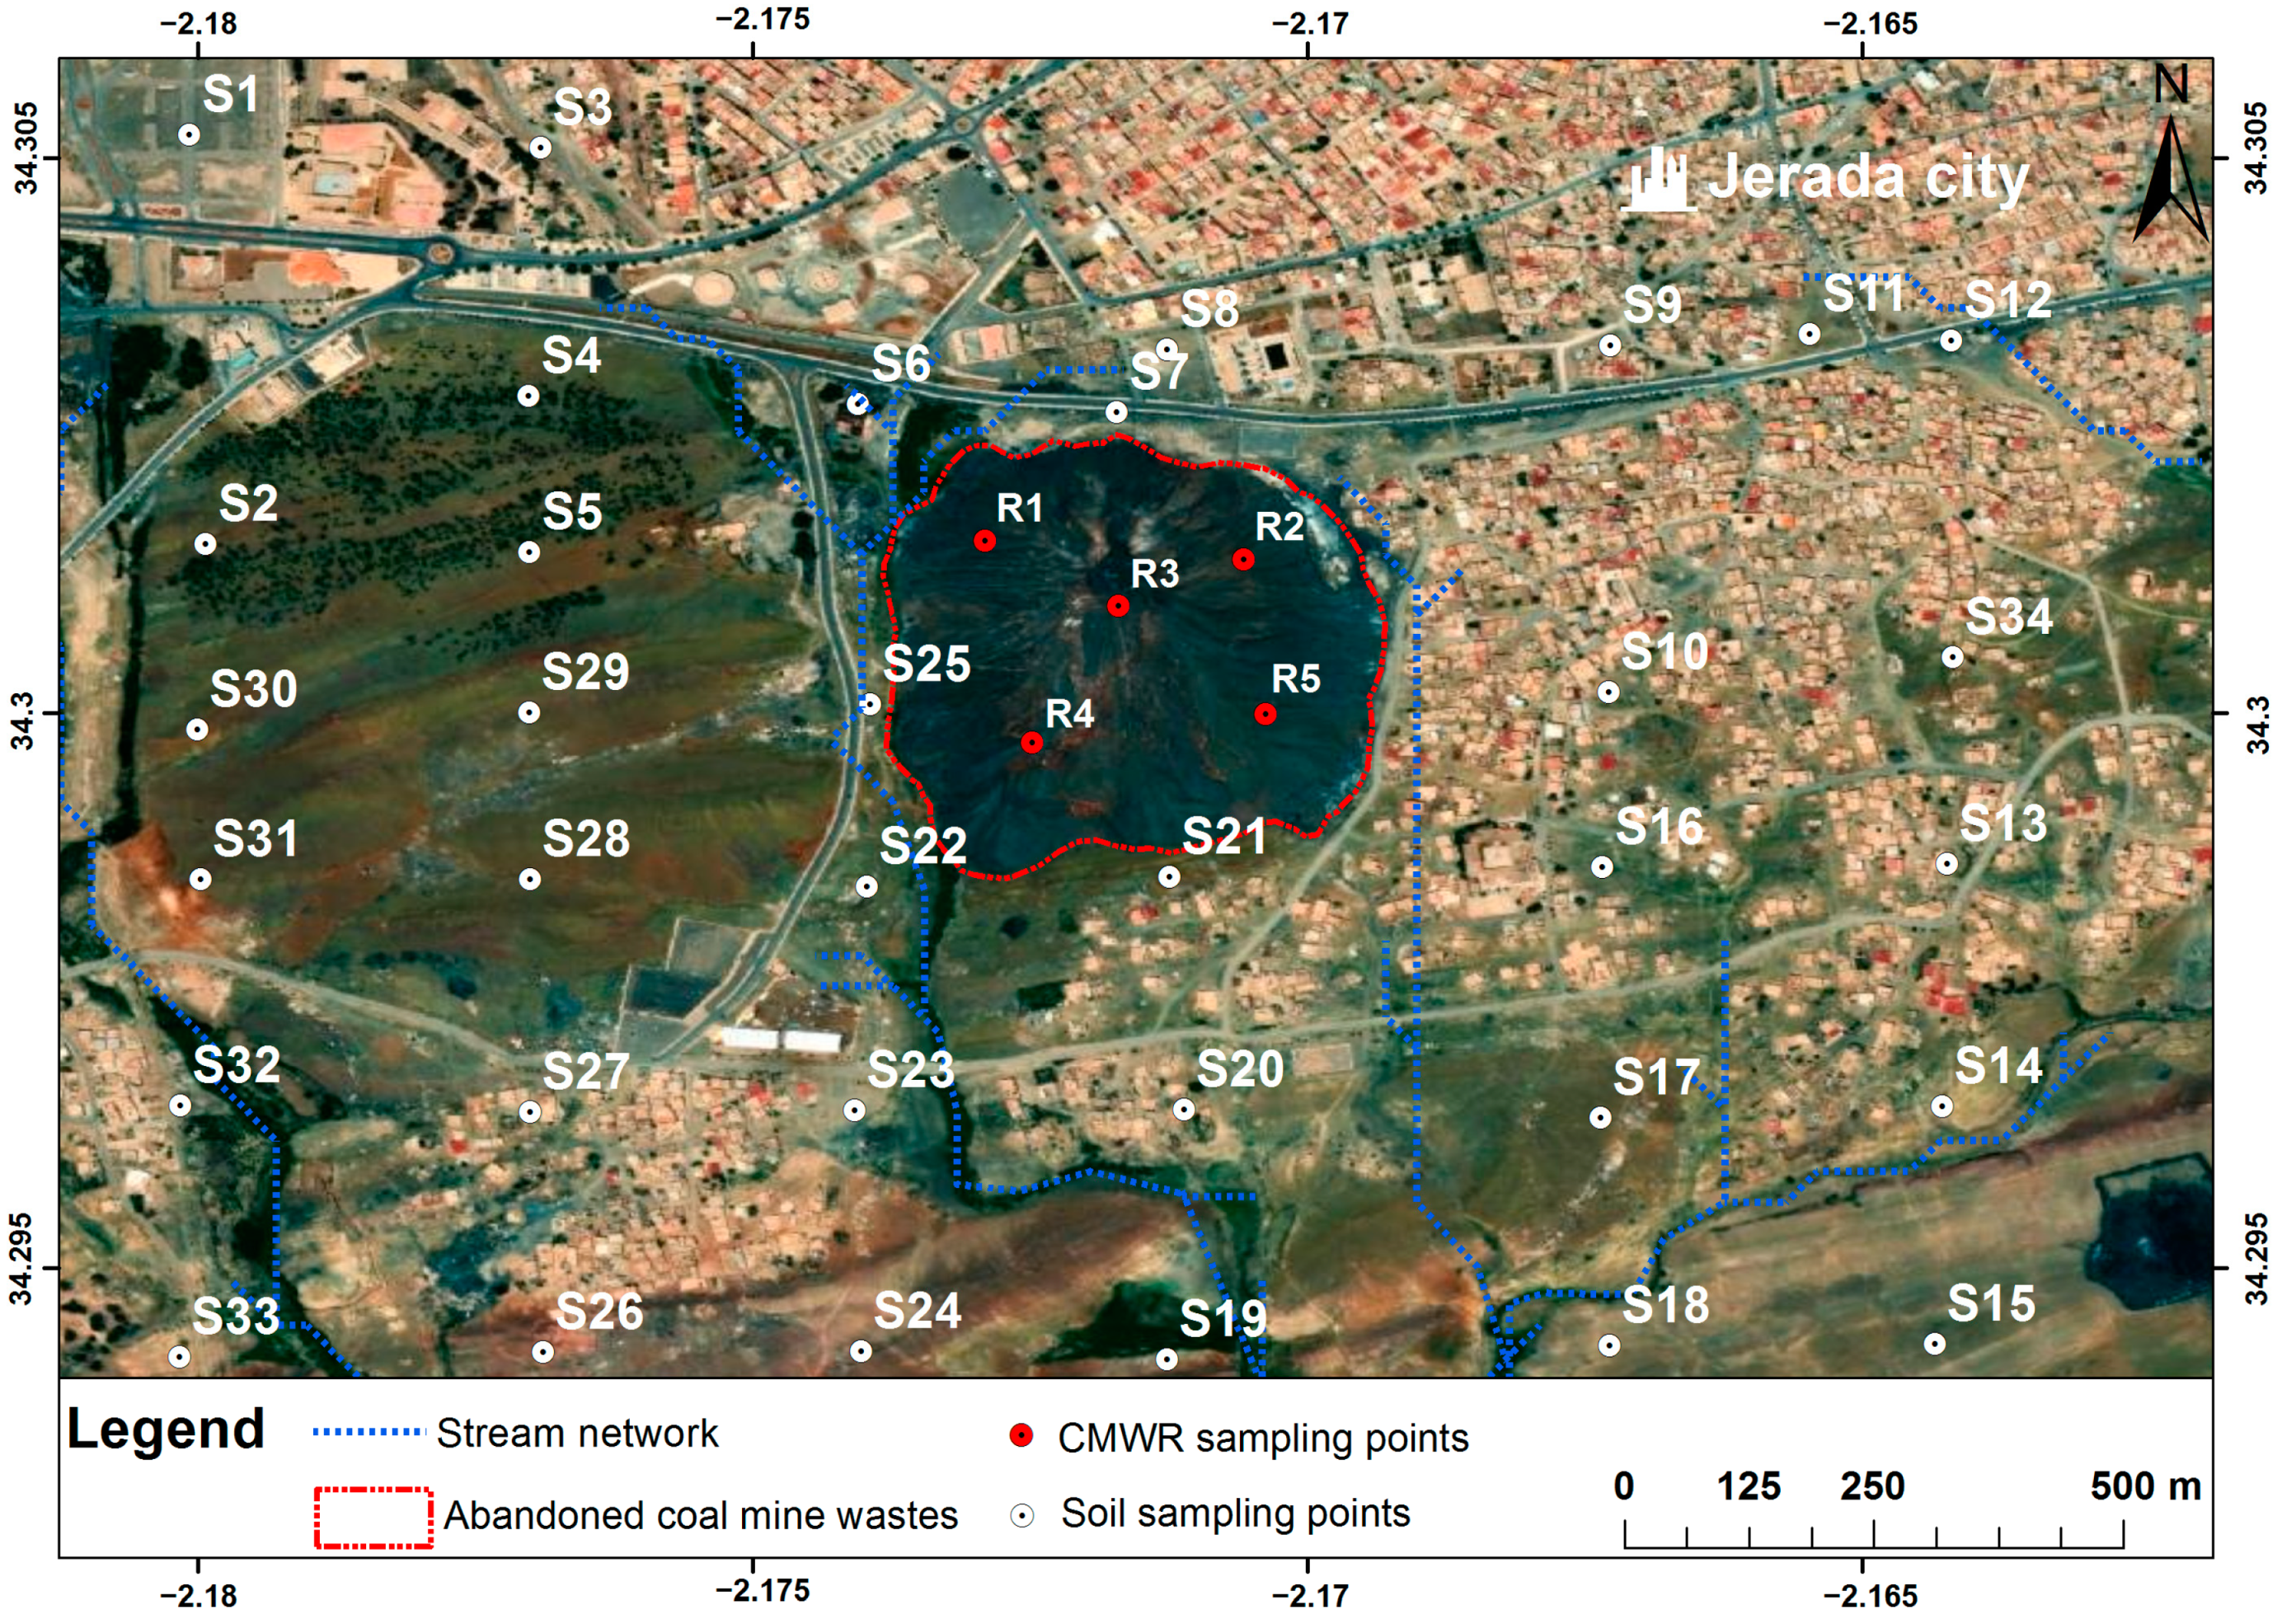
2.1. Study Area

The abandoned Jerada mine site in Morocco was selected to implement the proposed methodological approach and assess soil contamination by TEs. The abandoned anthracite coal Jerada mine is located 60 km south of Oujda city in northeast Morocco (Figure 1). According to the latest governmental census (2014), the population of Jerada city is approximately 43,500 people. The climate of this region is classified as a semi-arid environment with average maximum and minimum temperatures ranging from 14 °C in January to 35 °C in July, respectively. The average annual rainfall is 408 mm [23].
The Upper Westphalian anthracite coal basin of Jerada is located in the core horst chain. The deposit was discovered in 1927 and the mining operations began in 1936 [24]. The Jerada mine has undergone two main phases of exploitation. The first phase, between 1936 and 1966, was characterized by the extraction of the upper anthracite coal stratigraphic layers. During this phase, the mined ore was exported to Europe. In the second phase, between 1967 and 2001, the Jerada coal mine played a significant role in the energy supply of the country. The extraction of the coal anthracite ore in deeper layers was used to feed the local coal power plant, which had provided more than 7% of the total energy in Morocco.
However, the increasing production costs related to technical and operating constraints, both with the dynamic of the decrease of coal prices, had led to the decline of the financial results for the mining company of Jerada (Charbonnages du Maroc) that could no longer compete with the competitive prices of Russian and South African coal. Therefore, the Jerada mine was abandoned in 2001 with more than 10 Mt of unexploited coal ore.
Throughout the long mining exploitation of the coal deposits of Jerada, more than 20 Mt of CMWR was generated and stockpiled over an area of about 15 ha, forming a big dump at a height of around 100 m (Figure 2). The CMWR consists of shale with a small fraction of pyrite and other secondary minerals such as goethite and gypsum. Although the local population and the house buildings of Jerada are very close to the big dump, the CMWR was abandoned without any environmental concern and no reclamation program was implemented. Many previous studies have focused on the negative environmental impact of these CMWRs on the ground water quality. According to Battioui et al. [7], ground water samples collected at the surrounding areas of the CMWR dump show high pollution levels. After the mine closure, the local mine workers proceeded to an artisanal-scale exploitation of the remaining superior coal layers, between 60 and 70 m.

2.2. Experimental Procedures

2.2.1. Sampling and Samples Preparation

The big coal weathered dump was selected for CMWR sampling. To insure the representativity of the sampling procedure, CMWR samples were collected from different depths (between 0 and 60 m) using a drill rig with an adopted depth step of 2 m. Afterwards, soil samples were taken within the first 20 cm of soil using a stainless-steel shovel. The sampling points were selected carefully after a review of a high spatial resolution satellite image of the study area; the wind rose, which provides both the wind direction and the speed frequencies; and finally, the Digital Elevation Model (DEM) used to derive the slope and the surface runoff direction maps. Of course, the sampling plan was designed in a way to compare the trace element concentration gradient and possible mobilization. Therefore, samples were collected upstream and downstream of the coal dump with a special focus on the west of the CMWR dump because it is suspected to be the place where contaminants have accumulated. Geographic coordinates of sampling points were measured using a Global Positioning System (GPS) within ±5 m accuracy, with the “World Geodetic System 1984” coordinate system. Finally, 5 composite CMWR samples (from R1 to R5) and 34 soil samples (from S1 to S34) were collected within the study site (Figure 3).
All the collected samples were stored and transported in hermetically sealed and labelled polyethylene bags that had been emptied of air. Each collected sample was dried in an oven at 60 °C for 24 h. The coarse fraction (+2 mm) was removed. Then, the fine fraction under 2 mm was ground in agate mortar until reaching a fraction smaller than 63 μm for subsequent analysis. The sieve and the agate mortar were carefully cleaned after each sample preparation to avoid contamination.

2.2.2. Analytical Techniques

  • Mine waste rocks samples
First, a composite sample was prepared by a riffle-splitter after mixing and homogenizing the previously grinded Jerada CMWR samples. Then, the mineralogical phases were determined by X-ray diffraction spectroscopy (XRD) using a Bruker AXS D8 Advance diffractometer equipped with a copper anticathode and scanning over a diffraction angle (2θ) range from 5 to 70°. The identification of the existing mineral species was performed using “DiffracPlus” EVA® software. “TOPAS”® software programs implementing Rietveld refinement [25] were employed to quantify the abundance of all identified mineral species. Afterward, trace elements were analyzed using a digestion (HNO3/Br2/HF/HCl) followed by inductively coupled plasma with atomic emission spectroscopy (ICP-AES) (Perkin Elmer Optima 3100 RL) analysis. The toxicity characteristic leaching procedure test (TCLP) [26] was applied to evaluate the leaching behavior of the studied composite sample using acetic acid solution (pH 2.88) at a 20:1 liquid-to-solid ratio. The flask was agitated in an end-over-end rotation at 30 rpm for 18 h using an agitation rotary apparatus. The leachate was then analyzed by ICP-AES analysis after filtration (0.45 μm membranes) and acidification of the solution. Table 1 summarizes the mineralogical and the chemical composition of the analyzed CMWR as well as its environmental behavior.
  • Soil samples
The chemical analyses of the dry, grinded soil samples were carried out using an X-ray fluorescence (XRF) analyzer (Thermo Scientific NITON 2008). The considered analyzed elements were Ba, As, Pb, Zn, Cu Fe, Mn, Ti, Al, S, Cr, Cd, Mo, Co, Ni, and Sn. A 3 g split of each prepared soil sample was piled in the polyethylene sample holder then covered with a Mylar film. The sample was then placed the portable test stand and scanned for 3 min to obtain the chemical data. In order to avoid contamination, a new polyethylene sample holder and Mylar film were used for each analyzed sample.
The XRF device was calibrated using certified reference material OC USGS SAR-M 180–673. The data quality control and the concentration measurement accuracy estimation were evaluated using duplicate sample analyses by means of analyzing the same sample twice and comparing the results afterward. According to data quality assessment result, the concentration measurement accuracy was estimated at ±5% for all the considered elements.

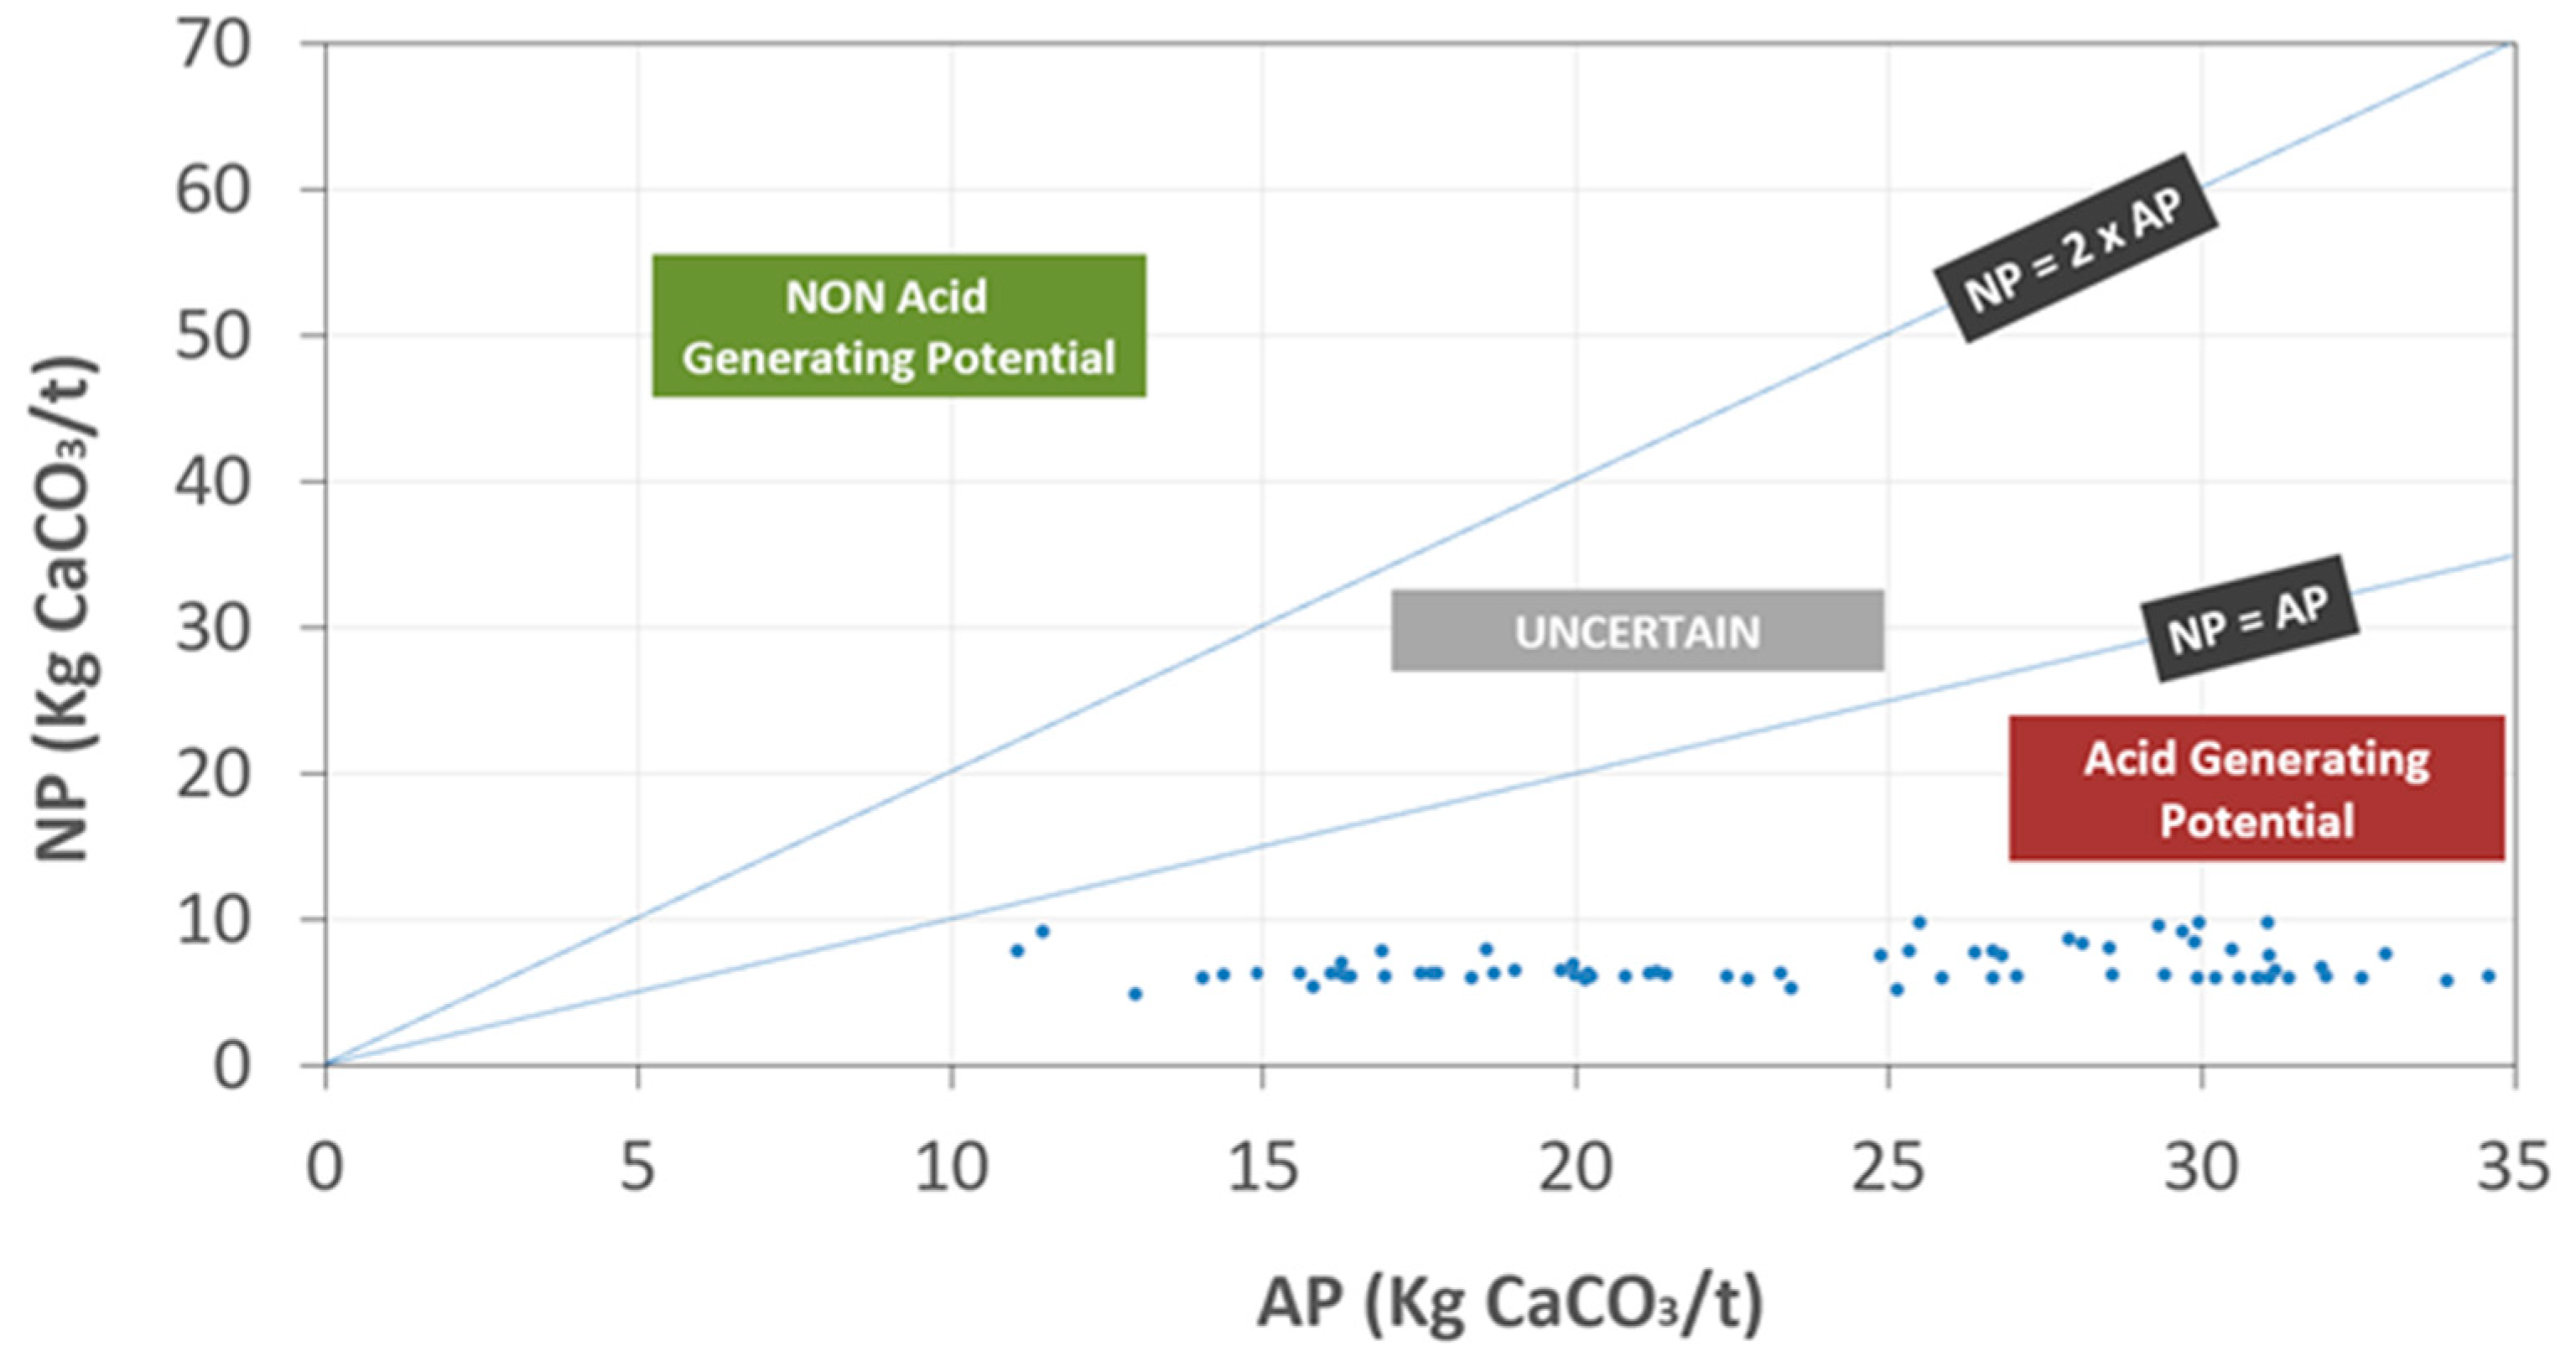
2.2.3. Acid Generation Potential of CMWR

To determine the acidity potential of the CMWR, carbon and sulfur contents were measured using an induction furnace with a detection limit of 0.09 wt.% (ELTRA CS2000). Static tests were then used to measure the rate of AGP. Potential acidity, also known as net neutralization potential (NNP), is the amount of acid that can be produced over time due to the oxidation of sulfide minerals, such as pyrite, in tailings and waste rock. It is determined through static tests and calculated as the difference between the acid neutralization potential (ANP) and the acid generation potential (AP). The acid generation potential (AP) was calculated using sulfur–sulfide (AP (Kg CaCO3/t) = 31.25x%S − sulfide). The neutralization potential (NP) was calculated using total inorganic carbon (NP (Kg CaCO3/t) = 83.3x%C − carbonate) [28]. The interpretation of the AP and NP was carried out using neutralization potential ratio criteria (NPR = NP/AP).

2.3. Data Analysis

2.3.1. Descriptive Statistics for TEs Concentrations

The following statistical parameters were determined for the considered analyzed elements in soils: minimum, maximum, mean and median for the central tendency measurement, and standard deviation for the data dispersion measurement; while the data distribution was tested for normality using skewness and kurtosis (Table 2). According to Beygi and Jalali [29], these statistical parameters are very relevant for comparing and summarizing the obtained geochemical results, therefore facilitating their subsequent interpretation.

2.3.2. Enrichment Factors

The enrichment factor (EF) is an efficient tool to highlight the TEs that were enriched in the soils. It was widely employed to identify the anthropogenic source of TEs and evaluate their influence on the environment [31,32,33]. Based on the EF, five contamination categories were recognized: (1) EF < 2 states deficiency to minimal enrichment; (2) 2 ≤ EF < 5, moderate enrichment; (3) 5 ≤ EF < 20, significant enrichment; (4) 20 ≤ EF ≤ 40, very high enrichment; and (5) EF > 40, extremely high enrichment [34,35,36]. The EF was calculated for the considered TEs in the Jerada soils using the following generalized equation according to Chester and Stoner [37] and Zoller et al. [38]:
E F E l = [ E l ] s a m p l e / [ X ] s a m p l e [ E l ] c r u s t / [ X ] c r u s t
where “El” is the element under consideration, the square brackets indicate concentration (usually in mass/mass units, such as mg/kg), “X” is the chosen reference element, and the subscripts “sample” or “crust” indicate which medium the concentration refers to. Crust refers to Clarke of Earth’s crust, most often continental or upper continental crust (UCC). The Clarke values corresponding to mean concentrations of chemical elements in the UCC were given by [38]. The referenced elements are aluminum, iron, manganese, calcium, scandium, and titanium. However, in the current study, aluminum was selected to be the referenced element because it is the most commonly employed [8,33].
Table 2 summarizes EF values, which indicate how many times measured concentrations exceeded the Clarke values.

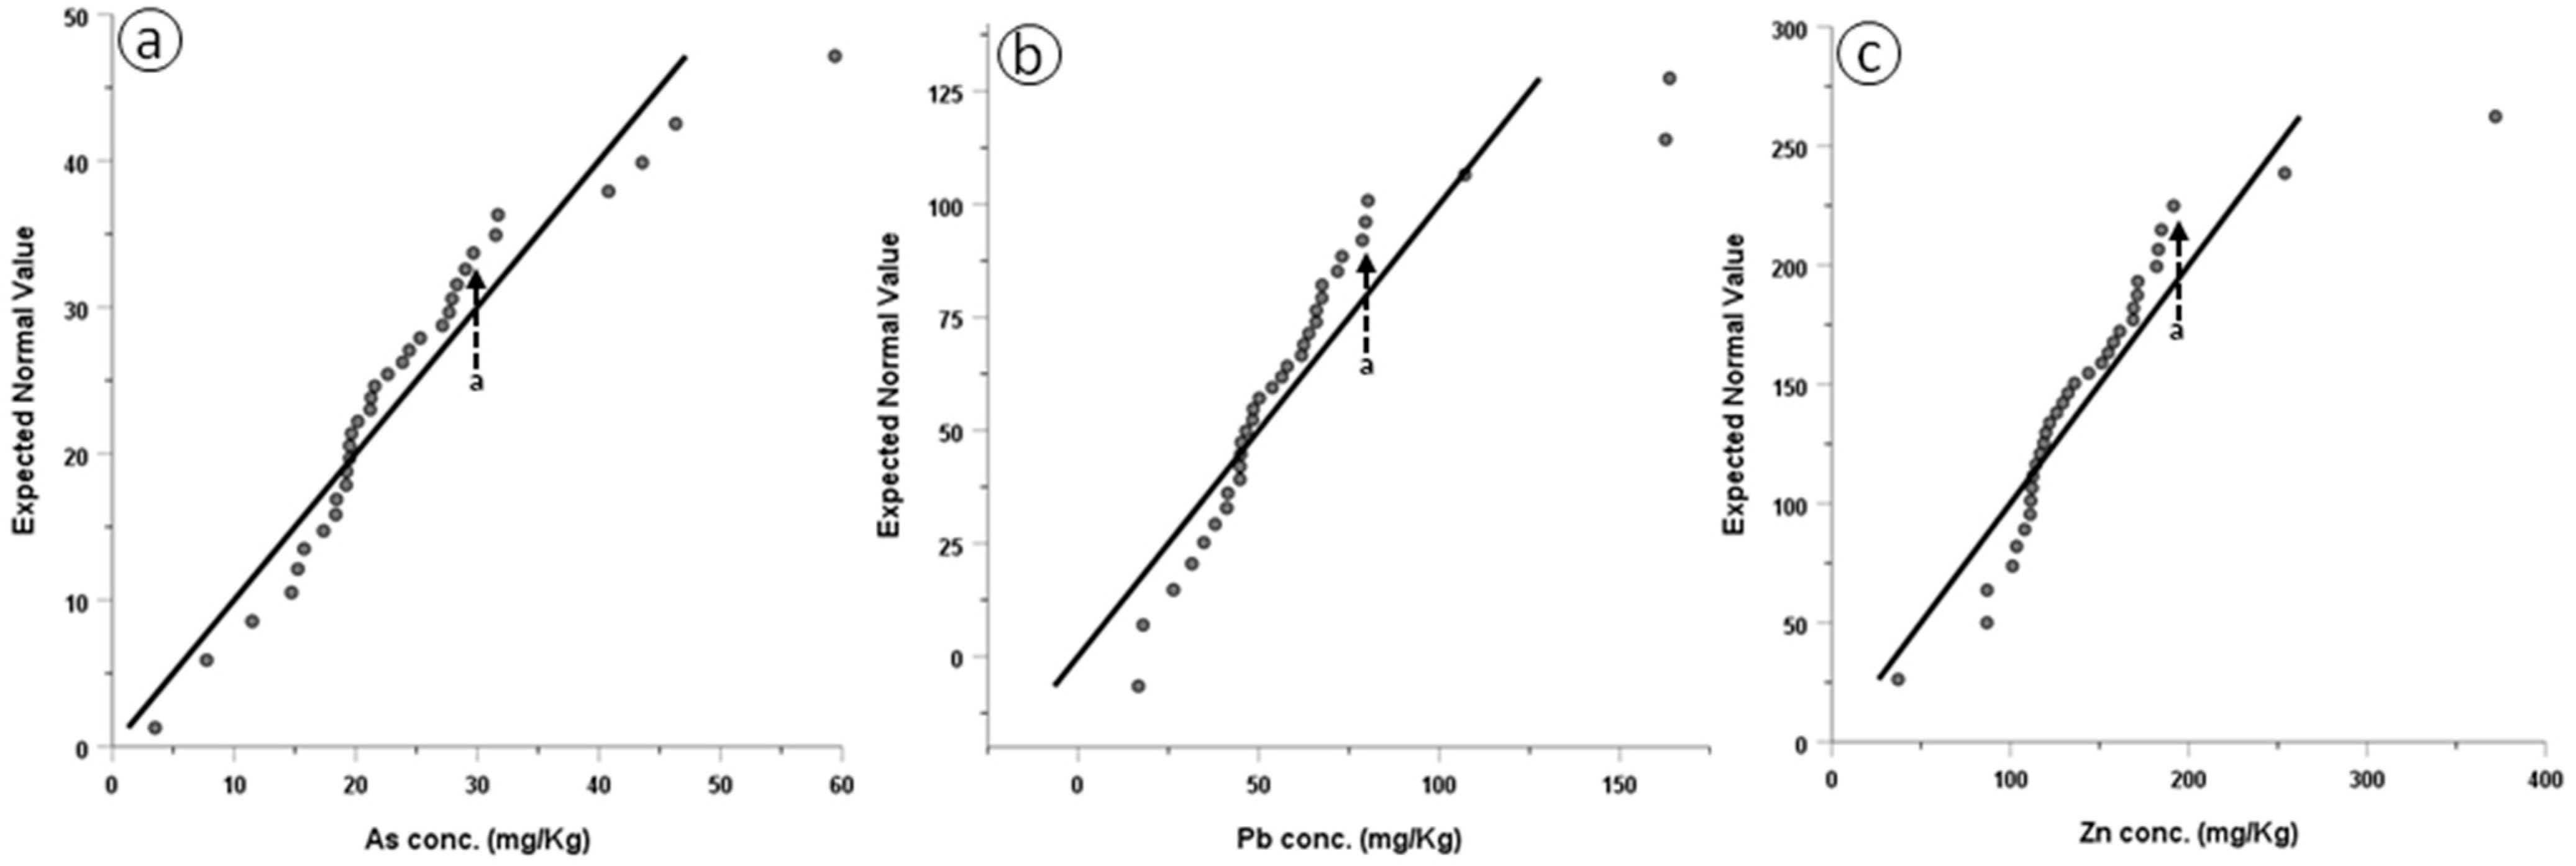
2.3.3. Geochemical Background

Generally, TEs in soils may have been introduced by natural sources related to the geological background or anthropogenic origins, including the mining industry, atmospheric deposition, waste materials, and agriculture [39]. Thus, the geochemical background (GB) index makes it possible to accurately evaluate the influence of anthropogenic sources on the studied soils and therefore distinguish between geogenic and anthropogenic enrichment [8]. The GB, defined by Hawkes and Webb [40] as ‘‘the normal abundance of a chemical element in barren earth material’’, was determined for the selected TEs using the graphical test of normality: normal quantil–quantil (Q–Q) plot [8,30]. This test was applied to look for different intervals of TE concentrations which imply the likely presence of different processes or multiple populations [41].

2.3.4. Geoaccumulation Index

Geoaccumulation index (Igeo) was used to assess TE contamination by comparing current and pre-anthropogenic concentrations [42]. The Igeo grades for the selected TEs were determined using Müller’s expression [42]:
I g e o = l o g 2 ( C n 1.5 B n )
where Cn is total concentration of element n in the soil sample and Bn is the GB concentration of the TE (n). Factor 1.5 is the background matrix correction factor used to account for the possible variations of the GB due to lithological variations. The geoaccumulation index consists of seven grades or classes: (0) Igeo ≤ 0 states practically uncontaminated; (1) 0 < Igeo < 1, uncontaminated to moderately contaminated; (2) 1 < Igeo < 2, moderately contaminated; (3) 2 < Igeo < 3, moderately to heavily contaminated; (4) 3 < Igeo < 4, heavily contaminated; (5) 4 < Igeo < 5, heavily to extremely contaminated; and (6) this class is an open class and comprises all values of the Igeo higher than class 5 [43].

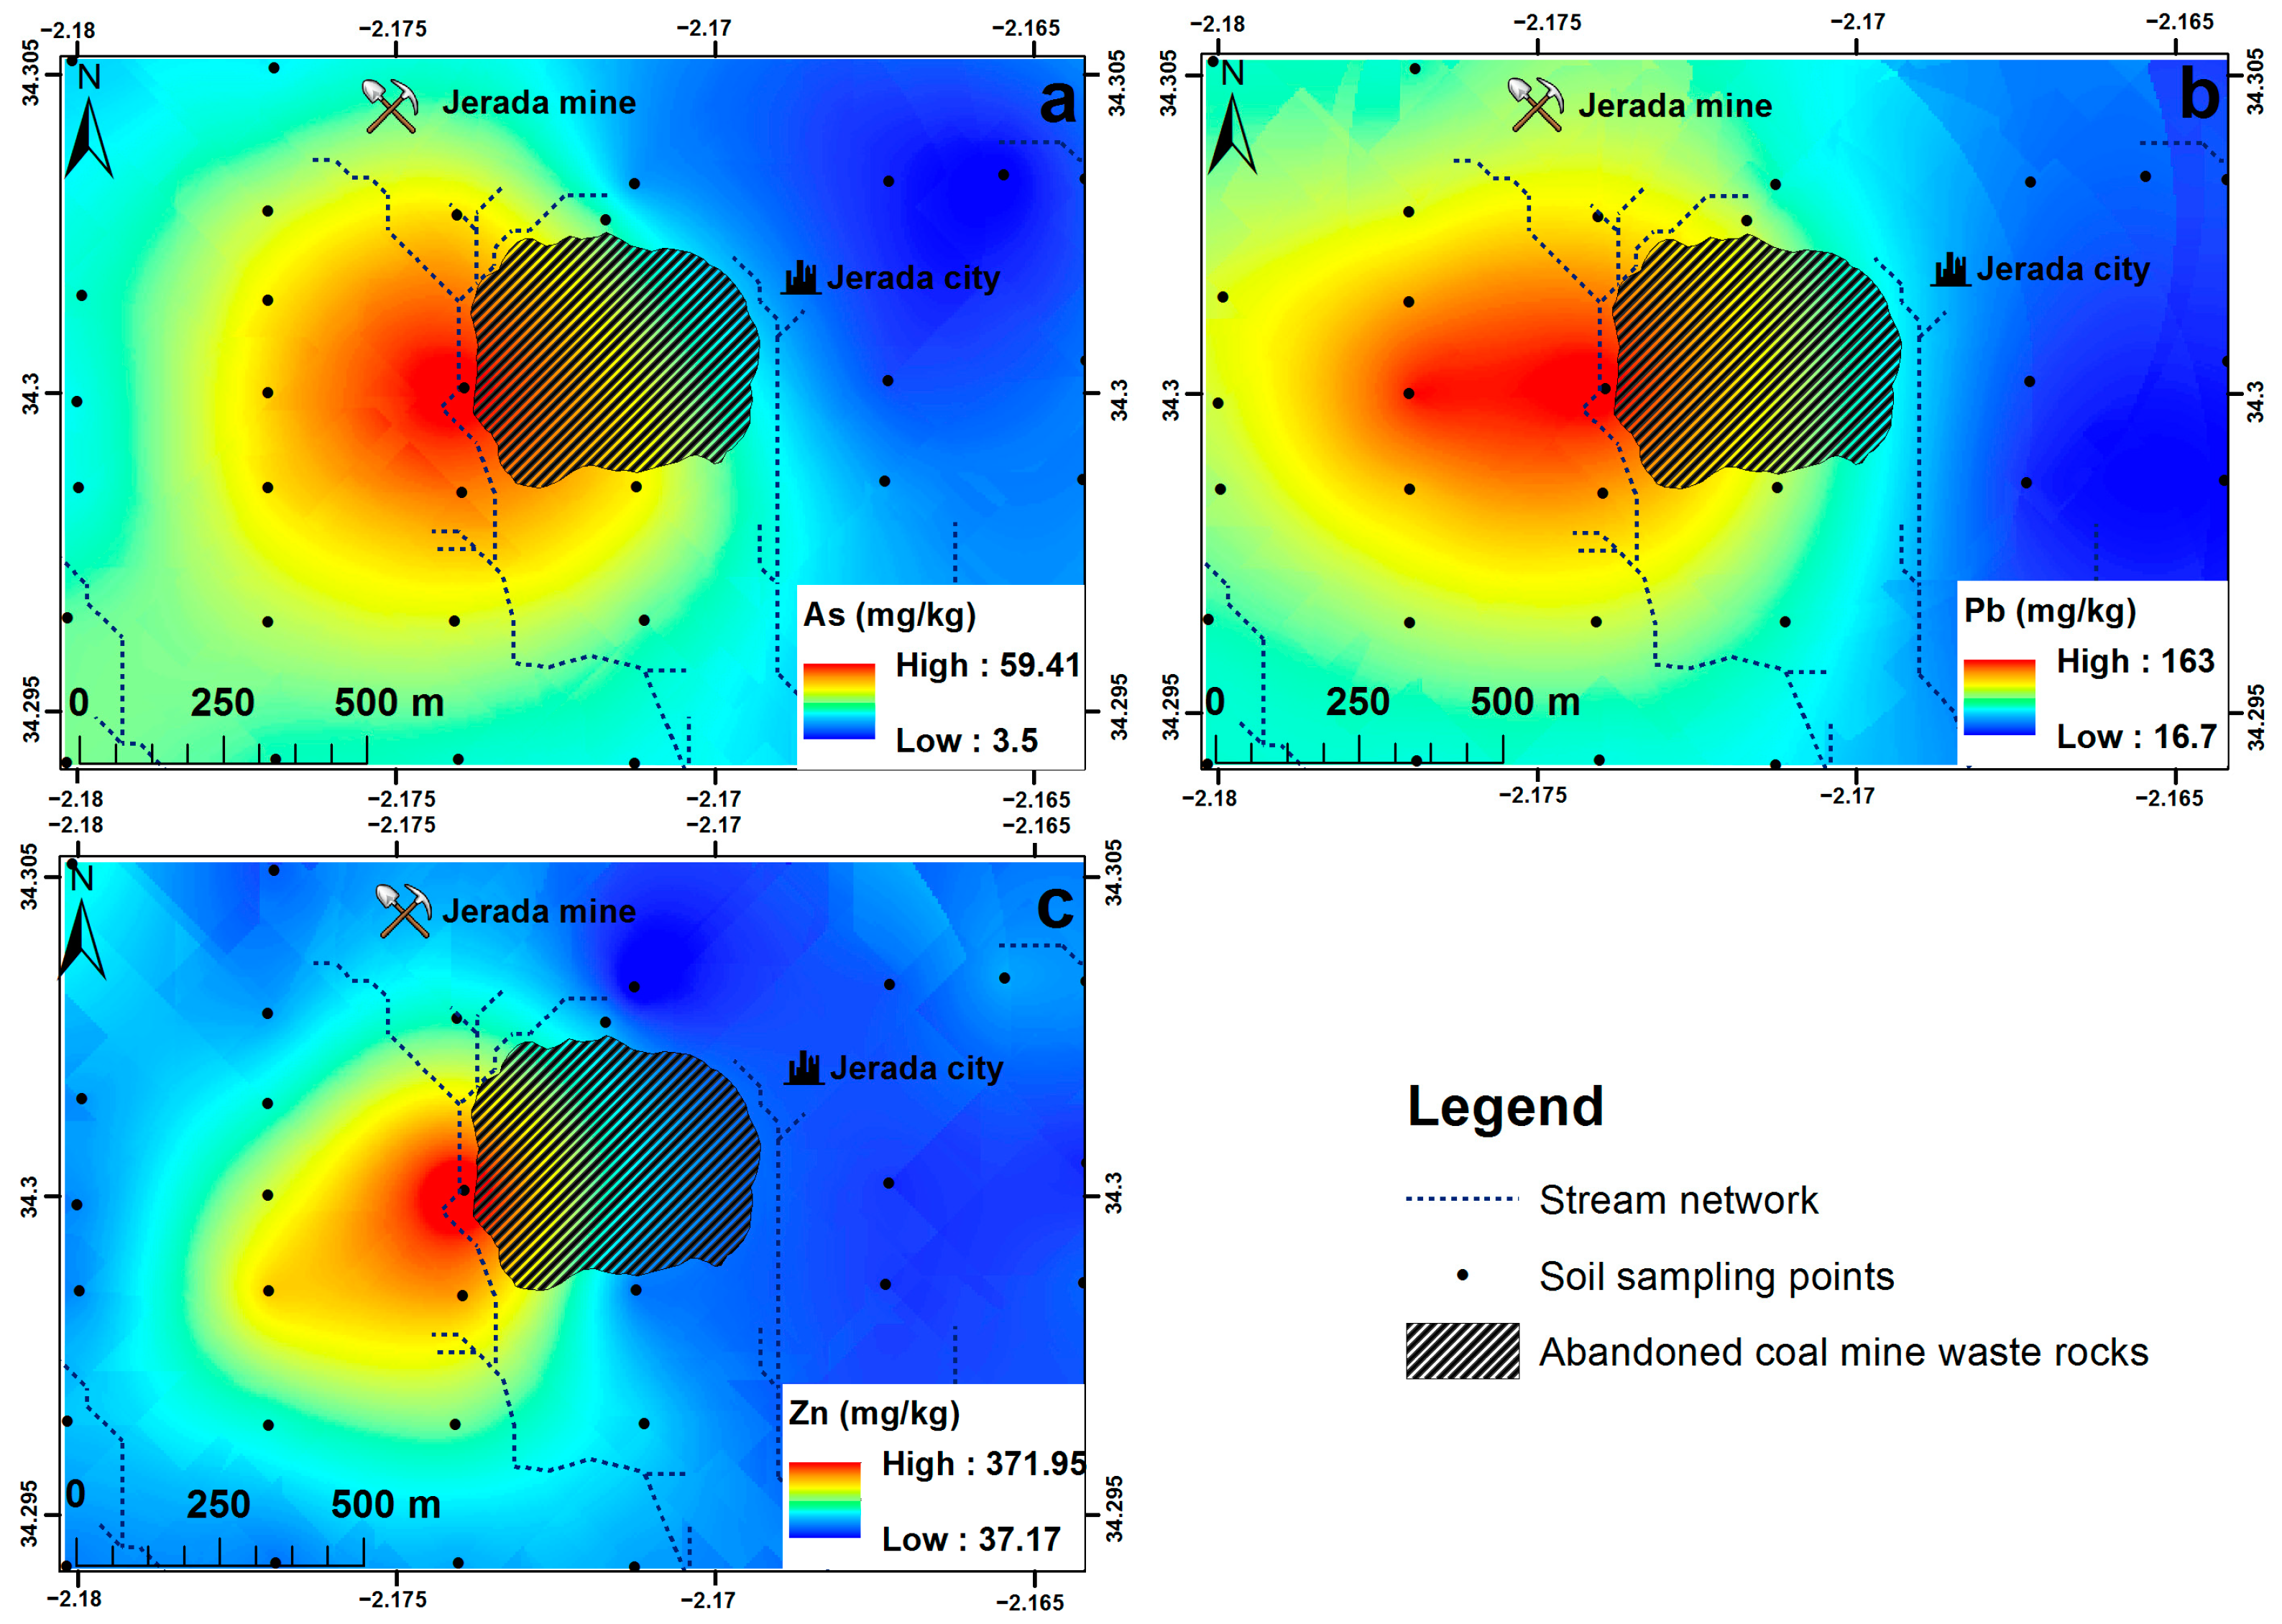
2.3.5. Geochemical Mapping Based on Geostatistics

Geochemical maps of TE distributions were created for highlighting the anomalous regions in the study area. The geostatistical analyst extension provided by ArcGIS software v.10.8 [44] was used for preparing data for interpolation and plotting the geochemical maps of the selected TEs. Of course, geostatistics was applied to estimate and map the attributes of objects in unsampled areas [45]. The coordinate locations of sampling soils and the concentration values of selected TEs were intergraded in the ArcGIS database and the spatial interpolation and mapping were carried out for the target elements using kriging. This consisted of complex semi-variograms for each considered TE (As, Pb, and Zn). In this study, both simple and ordinary kriging processes were tested, considering different mathematical models for adjustment. It is noteworthy, moreover, that no data transformation was applied to the data during the kriging process. According to Li et al. [46], the optimized model should minimize the standard mean (close to 0), and the standard root mean square error (RMSE) should be closest to 1. Therefore, iterative testing was applied and the exponential model provided the best adjustment with excellent RMSE values. Furthermore, ordinary kriging was selected as it presented the highest accuracy. The theoretical semi-variogram model values and error estimation are summarized in Table 3.

3. Results and Discussion

3.1. Coal Mine Waste Rocks Characterization

3.1.1. Mineralogical and Chemical Characterization

The mineralogical and chemical compositions of the studied CMWRs are summarized in Table 1. The mineralogical quantification results, using TOPAS software, showed that the quartz, muscovite, and chlorite were the major crystalline mineral phases contained in the CMWRs while albite, ankerite, and anatase were present as minor phases. Furthermore, a low proportion of pyrite was also detected. Regarding the chemical composition, high concentration levels were found especially for Pb and Cr. Cu, Mo, and Co were detected in low concentrations; however, As, Zn, and Cd concentrations were inferior to the detection limits.

3.1.2. Environmental Behavior Characterization

The results of the toxicity characteristic leaching procedure (TCLP) test are summarized in Table 1. It is observed that the amounts of TEs leached from the grinded CMWR were generally very low and below the limits acceptable by the US-EPA [27] regulation for non-hazardous wastes. Therefore, the Jerada CMWR could be considered as non-hazardous waste.
The acidity generation potential of the CMWR samples is highlighted in Figure 4. The results show that the majority of the CMWR samples were acid-generating. The acidity potential (AP) values ranged between 10 and 35 Kg CaCO3/t while the neutralization potential was low and ranged between 5 and 10 Kg CaCO3/t. The acidity generation was mainly explained by the presence of sulfide minerals in the form of pyrite FeS2 (around 1%). On the other hand, the neutralization potential was low, as the carbonaceous mineral content was very low. The results of this study are in accordance with previous studies [47,48].

3.2. Statistical Analysis of Soil Geochemical Data

The studied soils in the vicinity of the abandoned Jerada coal mine site presented high concentration levels of As, Pb, and Zn compared to the Clarke values given by [38], and therefore, high EFs (Table 2). As was highly enriched at 21.89 times the Clarke value. It was followed by Pb and Zn which were moderately enriched at 4.84 and 2.76 times the Clarke values, respectively. Except for Cr, Cd, Mo, Co, Ni, and Sn, which were not detected in soil samples by the XRF analysis, the EF values calculated for the rest of the considered TEs indicate minimal enrichment, with EF values of less than two (Table 2). Therefore, As, Pb, and Zn were selected as TEs of interest in the Jerada mining area.
The selected TEs show a wide range of concentrations around the studied soils of Jerada. The concentrations of As, Pb, and Zn ranged between 3.5 and 59.41, 16.70 and 163.80, and 37.17 and 371.95 mg/kg, respectively, with mean concentrations of 24.21, 60.64, and 144.27 mg/kg, respectively (Table 2). The mean values of the total content in the studied soils follow an ascending order: As > Pb > Zn. Furthermore, the median concentrations of As, Pb, and Zn were less than their mean concentrations (Table 2), while their skewness values were larger than one. Therefore, As, Pb, and Zn were positively skewed toward lower concentrations.

3.3. Determination of the Soil Geochemical Background and Anomalous Values

The geochemical background (GB) of the selected TEs was determined using their Q–Q plots. Measured concentrations were plotted on the X axis and the expected values under a normal distribution were plotted on the Y axis (Figure 5). According to Zhang et al. [49], this graphical representation gives a detailed visualization of the geochemical data; inflection points indicate the involvement of different processes.
The As, Pb, and Zn curves reveal such an inflection point (Figure 5a–c). This enables us to differentiate between the GB (geogenic contribution), which can be determined by calculating the mean concentration of the first bend of the plot, and the anthropogenic activity, which is represented by high concentrations of subsequent populations [8,30]. Following the division of the two concentrations’ populations, the GB and the anomalous values of the studied soils were determined by calculating the mean concentrations of the first and second populations, respectively, as represented in the Q–Q plots (Figure 5a–c). The net anomalous values were deduced by subtracting the GB values from the anomalous values [30].
The GB values, anomalous values, and net anomalous values are summarized in Table 4. Because of the absence of national reference values, the obtained values were compared with guidelines adopted by the Canadian community for the residential soils [50]. The GB value of As (20.01 mg/kg) is much higher than the Canadian guideline value (12 mg/kg), suggesting that this metalloid was naturally enriched in the study area. In addition to the high natural geogenic content of As, the studied soils contained high anomalous content (40.42 mg/kg) which was two times the calculated GB value (Table 4), which implies an anthropogenic source. Moreover, As showed a significantly anomalous net value (20.41 mg/kg).
On the other hand, the results indicate that the GB values of Pb (49.62 mg/kg) and Zn (131.86 mg/kg) are below the used reference values (70 mg/kg and 200 mg/kg, respectively). Therefore, the geogenic concentrations of Pb and Zn in the studied soils will not have any adverse health effects. However, the calculated anomalous values of Pb (112.01 mg/kg) and Zn (272.46 mg/kg) reveal the contribution of anthropogenic activity in the contamination of the Jerada soils. The origin of anthropogenic activity and the dispersion mechanism of contaminants will be discussed in the following sections.

3.4. Assessment of As, Pb, and Zn Contamination Using the Geoaccumulation Index

The Igeo values for As, Pb and Zn are illustrated in the boxplot graph in Figure 6. According to the Igeo classification system [43], almost all the Igeo values for As, Pb and Zn of the examined soil samples fell into class 0 (practically uncontaminated soils), indicating a lack of anthropogenic As, Pb, and Zn contamination. This finding is in perfect agreement with the result of the GB calculation discussed above, where the majority of concentrations values belong to the first population determined by the first bend of the Q-Q plots. However, the three Igeo values of As and Pb that fell into class 1 (uncontaminated to moderately contaminated soils) belonged to soil samples located close to the CMWR (Figure 3). In light of these findings, the Igeo calculation suggests that anthropogenic activity slightly contributed to the contamination of the studied soils.

3.5. Geochemical Mapping Using GIS and Geostatistics

Using GIS mapping approach based on geostatistics (ordinary kriging), the spatial distribution of the selected TEs in the Jerada soils was examined. Following that, other thematic layers, such as stream networks and the CMWR dump, were overlaid on the obtained geochemical maps (Figure 7). These maps showed higher concentration levels of As, Pb, and Zn, especially downstream of the CMWR dump. These concentrations decreased with increasing distances from the CMWR dump. In general, locations upstream presented lower concentration levels than those downstream of the CMWR dump. Moreover, the general distribution pattern showed that the eastern areas from the CMWR dump did not present any contamination. This result corroborates perfectly with our expectations deduced from the review of the DEM and the wind rose during the design of the soil sampling plan of the study area.
The studied Jerada soils are characterized by moderate concentration levels of As ranging from 3.50 to 59.41 mg/kg (Figure 7a). This result is in agreement with the low concentration level of As in the CMWR (Table 1). Normal values that are lower than the established GB (20.01 mg/kg) were located essentially upstream of the CMWR dump. However, the highest values which widely exceed the established GB were located downstream of the CMWR dump. Intermediate values were located far from the CMWR dump and downstream. The geochemical map of As (Figure 7a) showed clearly that this TE was derived essentially from the CMWR dump. It should be noted that the flow path of surface runoff follows slopes, which facilitates the spread of TEs. Moreover, the predominant wind flow has substantially the same direction of TE dispersion; therefore, mechanical transport via wind action plays a major role in contamination spread.
Furthermore, Pb was characterized by relatively high concentration values ranging from 16.70 to 163.80 mg/kg (Figure 7b). Similar to As, uncontaminated areas were located upstream of the CMWR dump. However, contaminated areas where concentration levels widely exceed the established GB (49.62 mg/kg) occurred only in the vicinity of the CMWR dump. Furthermore, intermediate Pb concentrations were located in areas downstream of the CMWR dump. As indicated in Table 1, the Pb concentration in the CMWR was very high (164 mg/kg) which explains the creation of the occurred hot spot of Pb. The resulting geochemical map (Figure 7b) demonstrates that Pb was disseminated in the study area by the surface runoff during rainfall events as well as the mechanical action of the wind.
Finally, for Zn, Figure 7c shows its relatively similar distribution pattern to As and Pb. It illustrates that Zn concentrations ranged from 37.17 to 371.95 mg/kg. This map shows a big contrast in concentrations between areas located upstream of the CMWR dump, where Zn concentrations were normal and inferior to the established GB (131.86 mg/kg), and those located downstream, where high soil contaminations occurred. Compared to As and Pb, the contaminated areas of Zn were represented by one hot spot where concentration levels exceeded 370 mg/kg. Intermediate concentration levels were also observed in the vicinity of the CMWR. Although the Zn concentration was not very high in the CMWR (Table 1), Zn is a relatively mobile TE which can easily be released from minerals in the CMWR. This fact is proved by the result of TCLP test which showed that the concentration of Zn in the leachate was relatively high comparing with the other studied TEs. Like As and Pb, Zn had the same dispersion mechanism that prevailed in the study area.

4. Conclusions

Based on the conducted case study on the abandoned Jerada coal mine in Morocco, it can be concluded that it can be possible to assess and accurately quantify the impact of the coal mining activity on the surrounding soils. Therefore, the proposed methodological approach can be applied successfully to any other abandoned coal mine.
It was found that the use of the Enrichment Factor index is very useful for targeting only trace elements of interest. Furthermore, it was proved that the geochemical background and the geoaccumulation indexes are powerful tools for distinguishing between the geogenic enrichment of trace elements and the anthropogenic inputs, particularly in mineralized areas. Finally, by means of geochemical mapping based on the kriging interpolation technique, the relationship between the coal mine waste rock dump and the contaminated areas was demonstrated and the spreading mechanism was revealed.

Author Contributions

Conceptualization, A.K. and R.H.; methodology, A.K.; software, A.K.; validation, A.K., Y.T., R.H., and M.B.; investigation, A.K.; resources, A.K. and R.H.; data curation, A.K.; writing—original draft preparation, A.K. and Y.T.; writing—review and editing, A.K., Y.T., R.H., and M.B.; visualization, R.H.; supervision, R.H.; project administration, R.H.; funding acquisition, R.H. All authors have read and agreed to the published version of the manuscript.

Funding

This work was financially supported through the International Research Chairs Initiative, a program funded by the International Development Research Centre, Canada (IDRC), and supported by the Canadian Research Chairs Program.

Data Availability Statement

The data set is presented directly in the present study.

Conflicts of Interest

The authors declare no conflict of interest.

References

  1. Liu, X.; Shi, H.; Bai, Z.; Zhou, W.; Liu, K.; Wang, M.; He, Y. Heavy Metal Concentrations of Soils near the Large Opencast Coal Mine Pits in China. Chemosphere 2020, 244, 125360. [Google Scholar] [CrossRef] [PubMed]
  2. Tapia-Gatica, J.; Selles, I.; Bravo, M.A.; Tessini, C.; Barros-Parada, W.; Novoselov, A.; Neaman, A. Global Issues in Setting Legal Limits on Soil Metal Contamination: A Case Study of Chile. Chemosphere 2022, 290, 133404. [Google Scholar] [CrossRef] [PubMed]
  3. MED. Plan d’action National Pour La Valorisation Des Rejets Miniers. Moroccan Environmental Department, 2021. Available online: https://mtedd.gov.ma/images/PUBLICATIONS/plan_national_dechets_miniers.pdf (accessed on 22 January 2023).
  4. Argane, R.; El Adnani, M.; Benzaazoua, M.; Bouzahzah, H.; Khalil, A.; Hakkou, R.; Taha, Y. Geochemical Behavior and Environmental Risks Related to the Use of Abandoned Base-Metal Tailings as Construction Material in the Upper-Moulouya District, Morocco. Environ. Sci. Pollut. Res. 2016, 23, 598–611. [Google Scholar] [CrossRef] [PubMed]
  5. Hakkou, R.; Benzaazoua, M.; Bussière, B. Acid Mine Drainage at the Abandoned Kettara Mine (Morocco): 2. Mine Waste Geochemical Behavior. Mine Water Environ. 2008, 27, 160–170. [Google Scholar] [CrossRef]
  6. Ait Lemkademe, A.; Michelot, J.L.; Benkaddour, A.; Hanich, L.; Heddoun, O. Origin of Groundwater Salinity in the Draa Sfar Polymetallic Mine Area Using Conservative Elements (Morocco). Water 2023, 15, 82. [Google Scholar] [CrossRef]
  7. Mounia, B. Impact of Mining Wastes on Groundwater Quality in the Province Jerada (Eastern Morocco). Int. J. Eng. Sci. Technol. 2013, 5, 1601–1615. [Google Scholar]
  8. Khalil, A.; Hanich, L.; Bannari, A.; Zouhri, L.; Pourret, O.; Hakkou, R. Assessment of Soil Contamination around an Abandoned Mine in a Semi-Arid Environment Using Geochemistry and Geostatistics: Pre-Work of Geochemical Process Modeling with Numerical Models. J. Geochemical Explor. 2013, 125, 117–129. [Google Scholar] [CrossRef]
  9. Elyaziji, A.; Khalil, A.; Hakkou, R.; Benzaazoua, M.; Alansari, A. Bewertung von Spurenelementen in Böden Und Grubenwasser Eines Stillgelegten Manganbergwerks (Anti Atlas, Marokko). Mine Water Environ. 2016, 35, 486–496. [Google Scholar] [CrossRef]
  10. Golik, V.I.; Gashimova, Z.A.; Liskova, M.Y.; Kongar-Syuryun, C.B. To the Problem of Minimizing the Volume of Mobile Dust in the Development of Pits. Bezop. Tr. v Promyshlennosti 2021, 28–33. [Google Scholar] [CrossRef]
  11. Golik, V.I.; Stas, G.V.; Liskova, M.Y.; Kongar-Syuryun, C. Improvement of the Occupational Safety by Radical Isolation of Pollution Sources during Underground Ore Mining. Bezop. Tr. v Promyshlennosti 2021, 7, 7–12. [Google Scholar] [CrossRef]
  12. Strugała-Wilczek, A.; Kapusta, K. Migration of Co, Cd, Cu, Pb to the Groundwater in the Area of Underground Coal Gasification Experiment in a Shallow Coal Seam in the Experimental Mine ‘Barbara’ in Poland. Fuel 2022, 317, 122831. [Google Scholar] [CrossRef]
  13. Li, H.; Ji, H. Chemical Speciation, Vertical Profile and Human Health Risk Assessment of Heavy Metals in Soils from Coal-Mine Brownfield, Beijing, China. J. Geochem. Explor. 2017, 183, 22–32. [Google Scholar] [CrossRef]
  14. Fatkulina, A.V.; Konokotin, D.N.; Koroleva, L.A.; Salov, S.M.; Samoylenko, D.V. Environmental Problems in the Coal Mining Industry in Russia. IOP Conf. Ser. Earth Environ. Sci. 2021, 867, 012087. [Google Scholar] [CrossRef]
  15. Liu, X.; Bai, Z.; Shi, H.; Zhou, W.; Liu, X. Heavy Metal Pollution of Soils from Coal Mines in China. Nat. Hazards 2019, 99, 1163–1177. [Google Scholar] [CrossRef]
  16. Kalisz, S.; Kibort, K.; Mioduska, J.; Lieder, M.; Małachowska, A. Waste Management in the Mining Industry of Metals Ores, Coal, Oil and Natural Gas—A Review. J. Environ. Manag. 2022, 304, 114239. [Google Scholar] [CrossRef]
  17. Vo, T.L.; Nash, W.; Del Galdo, M.; Rezania, M.; Crane, R.; Mousavi Nezhad, M.; Ferrara, L. Coal Mining Wastes Valorization as Raw Geomaterials in Construction: A Review with New Perspectives. J. Clean. Prod. 2022, 336, 130213. [Google Scholar] [CrossRef]
  18. Pinetown, K.L.; Ward, C.R.; van der Westhuizen, W.A. Quantitative Evaluation of Minerals in Coal Deposits in the Witbank and Highveld Coalfields, and the Potential Impact on Acid Mine Drainage. Int. J. Coal Geol. 2007, 70, 166–183. [Google Scholar] [CrossRef]
  19. Kumar, V.; Sharma, A.; Kaur, P.; Singh Sidhu, G.P.; Bali, A.S.; Bhardwaj, R.; Thukral, A.K.; Cerda, A. Pollution Assessment of Heavy Metals in Soils of India and Ecological Risk Assessment: A State-of-the-Art. Chemosphere 2019, 216, 449–462. [Google Scholar] [CrossRef]
  20. de Souza, M.R.; Garcia, A.L.H.; Dalberto, D.; Nicolau, C.; Gazzineu, A.L.; Grivicich, I.; Boaretto, F.; Picada, J.N.; de Souza, G.M.S.; Chytry, P.; et al. Evaluation of Soils under the Influence of Coal Mining and a Thermoelectric Plant in the City of Candiota and Vicinity, Brazil. Mutat. Res. Toxicol. Environ. Mutagen. 2021, 866, 503350. [Google Scholar] [CrossRef]
  21. Łupieżowiec, M.; Rybak, J.; Różański, Z.; Dobrzycki, P.; Jędrzejczyk, W. Design and Construction of Foundations for Industrial Facilities in the Areas of Former Post-Mining Waste Dumps. Energies 2022, 15, 5766. [Google Scholar] [CrossRef]
  22. Khayrutdinov, M.M.; Golik, V.I.; Aleksakhin, A.V.; Trushina, E.V.; Lazareva, N.V.; Aleksakhina, Y.V. Proposal of an Algorithm for Choice of a Development System for Operational and Environmental Safety in Mining. Resources 2022, 11, 88. [Google Scholar] [CrossRef]
  23. Moulouya Hydraulic Basin Agency. Meteorological Data; Gafayt Meteorological Station: Gafayt, Morocco, 2020. [Google Scholar]
  24. Chellai, H.; Essamoud, R.; Rjimati, E.C. Les Principales Mines Du Maroc: Les Mines Du Moyen Atlas et Des Horsts, Le Bassin Houiller de Jerada (Chaîne Des Horsts, Maroc Oriental) / The Jerada Coal Basin (Horst Chain, Eastern Morocco). Nouv. Guid. Géologiques Min. Du Maroc 2011, 9, 331–335. [Google Scholar]
  25. Young, R. The Rietveld Method; Oxford University Press: Oxford, UK, 1995. [Google Scholar]
  26. EPA-1311 SW-846 Test Method 1311: Toxicity Characteristic Leaching Procedure; EPA: Washington, DC, USA, 1992.
  27. US-EPA. Hazardous Waste Characteristics. United States Environmental Protection Agency, 2009. Available online: https://www.epa.gov/hw/user-friendly-reference-document-hazardous-waste-characteristics (accessed on 22 January 2023).
  28. Plante, B.; Bussière, B.; Benzaazoua, M. Static Tests Response on 5 Canadian Hard Rock Mine Tailings with Low Net Acid-Generating Potentials. J. Geochem. Explor. 2012, 114, 57–69. [Google Scholar] [CrossRef]
  29. Beygi, M.; Jalali, M. Background Levels of Some Trace Elements in Calcareous Soils of the Hamedan Province, Iran. CATENA 2018, 162, 303–316. [Google Scholar] [CrossRef]
  30. McLennan, S.M. Relationships between the Trace Elementcomposition of Sedimentary Rocks and Uppercontinental Crust. Geochem. Geophys. Geosyst. 2001, 2. [Google Scholar] [CrossRef]
  31. Martínez, J.; Llamas, J.; de Miguel, E.; Rey, J.; Hidalgo, M.C. Determination of the Geochemical Background in a Metal Mining Site: Example of the Mining District of Linares (South Spain). J. Geochem. Explor. 2007, 94, 19–29. [Google Scholar] [CrossRef]
  32. Li, X.; Feng, L. Multivariate and Geostatistical Analyzes of Metals in Urban Soil of Weinan Industrial Areas, Northwest of China. Atmos. Environ. 2012, 47, 58–65. [Google Scholar] [CrossRef]
  33. Ferreira, S.L.C.; da Silva, J.B.; dos Santos, I.F.; de Oliveira, O.M.C.; Cerda, V.; Queiroz, A.F.S. Use of Pollution Indices and Ecological Risk in the Assessment of Contamination from Chemical Elements in Soils and Sediments—Practical Aspects. Trends Environ. Anal. Chem. 2022, 35, e00169. [Google Scholar] [CrossRef]
  34. Yongming, H.; Peixuan, D.; Junji, C.; Posmentier, E.S. Multivariate Analysis of Heavy Metal Contamination in Urban Dusts of Xi’an, Central China. Sci. Total Environ. 2006, 355, 176–186. [Google Scholar] [CrossRef]
  35. Lu, X.; Li, L.Y.; Wang, L.; Lei, K.; Huang, J.; Zhai, Y. Contamination Assessment of Mercury and Arsenic in Roadway Dust from Baoji, China. Atmos. Environ. 2009, 43, 2489–2496. [Google Scholar] [CrossRef]
  36. Lu, X.; Wang, L.; Lei, K.; Huang, J.; Zhai, Y. Contamination Assessment of Copper, Lead, Zinc, Manganese and Nickel in Street Dust of Baoji, NW China. J. Hazard. Mater. 2009, 161, 1058–1062. [Google Scholar] [CrossRef] [PubMed]
  37. CHESTER, R.; STONER, J.H. Pb in Particulates from the Lower Atmosphere of the Eastern Atlantic. Nature 1973, 245, 27–28. [Google Scholar] [CrossRef]
  38. Zoller, W.H.; Gladney, E.S.; Duce, R.A. Atmospheric Concentrations and Sources of Trace Metals at the South Pole. Science 1974, 183, 198–200. [Google Scholar] [CrossRef] [PubMed]
  39. Imin, B.; Abliz, A.; Shi, Q.; Liu, S.; Hao, L. Quantitatively Assessing the Risks and Possible Sources of Toxic Metals in Soil from an Arid, Coal-Dependent Industrial Region in NW China. J. Geochem. Explor. 2020, 212, 106505. [Google Scholar] [CrossRef]
  40. Hawkes, H.; Webb, J.S. Geochemistry in Mineral Exploration; Harper Row Publ.: New York, NY, USA, 1962. [Google Scholar]
  41. Zhou, X.; Xia, B. Defining and Modeling the Soil Geochemical Background of Heavy Metals from the Hengshi River Watershed (Southern China): Integrating EDA, Stochastic Simulation and Magnetic Parameters. J. Hazard. Mater. 2010, 180, 542–551. [Google Scholar] [CrossRef]
  42. Müller, G. Index of Geoaccumulation in Sediments of the Rhine River. GeoJournal 1969, 2, 108–118. [Google Scholar]
  43. Müller, G. Die Schwermetallbelastung Der Sedimente Des Neckars Und Seiner Nebenflusse. Chem. Zeitung 1981, 105, 157–164. [Google Scholar]
  44. ESRI Environmental Systems Research Institute Inc. Available online: https://www.esri.com/en-us/arcgis (accessed on 15 January 2023).
  45. Zhen, J.; Pei, T.; Xie, S. Kriging Methods with Auxiliary Nighttime Lights Data to Detect Potentially Toxic Metals Concentrations in Soil. Sci. Total Environ. 2019, 659, 363–371. [Google Scholar] [CrossRef]
  46. Li, H.; Lin, Z.-H.; Liu, S.X. Application of Kriging Technique in Estimating Soil Moisture in China. Geogr. Res. 2001, 20, 446–452. [Google Scholar]
  47. Taha, Y.; Benzaazoua, M.; Hakkou, R.; Mansori, M. Coal Mine Wastes Recycling for Coal Recovery and Eco-Friendly Bricks Production. Miner. Eng. 2017, 107, 123–138. [Google Scholar] [CrossRef]
  48. Taha, Y.; Elghali, A.; Derhy, M.; Amrani, M.; Hakkou, R.; Benzaazoua, M. Towards an Integrated Approach for Zero Coal Mine Waste Storage: Solutions Based on Materials Circularity and Sustainable Resource Governance. Miner. Process. Extr. Metall. Rev. 2022, 43, 1–14. [Google Scholar] [CrossRef]
  49. Zhang, C.; Fay, D.; McGrath, D.; Grennan, E.; Carton, O.T. Statistical Analyses of Geochemical Variables in Soils of Ireland. Geoderma 2008, 146, 378–390. [Google Scholar] [CrossRef]
  50. CCME. Canadian Soil Quality Guidelines for the Protection of Environment and Human Health. Canadian Council of Ministers of the Environment. 2006. Available online: https://ccme.ca/en/resources (accessed on 22 January 2023).
Figure 1. Geographical location of the study area.
Minerals 13 00181 g001
Figure 2. Coal mine waste rock dump in the Jerada city.
Minerals 13 00181 g002
Figure 3. Map of sampling point locations of soil and coal mine waste rocks (Google Earth image modified).
Minerals 13 00181 g003
Figure 4. Results of acid generation potential of CMWR.
Minerals 13 00181 g004
Figure 5. Normal Q–Q plots for (a) As, (b) Pb, and (c) Zn (arrow a indicates inflection point).
Minerals 13 00181 g005
Figure 6. Boxplots for Igeo values of As, Pb, and Zn.
Minerals 13 00181 g006
Figure 7. Geochemical map of the selected trace elements.
Minerals 13 00181 g007
Table 1. Mineralogical, chemical compositions, and metal leaching behavior (TCLP) of CMWR.
CMWR
Mineralogical composition (%)Quartz SiO242
Chlorite(Mg,Fe)5Al(Si3Al)O10(OH)812
MuscoviteKAl2(Si3Al)O10(OH)237
AlbiteNaAlSi3O84
PyriteFeS21
AnkeriteCa(Fe,Mg,Mn)(CO3)22
AnataseTiO22
Trace elements (mg/Kg)As <5
Pb 164
Zn <55
Cu 34
Cd <5
Mo 33
Cr 198
Co 29
Ni 92
Ba 399
Metal leaching (TCLP) (µg/L)As2000 *30
Pb5000 *90
Zn2000 *536
Cu5000 *87
Cd5000 *1.5
Mo-4.5
Cr-7
Ba1000 *51
* TCLP level limits [27].
Table 2. Descriptive statistics: Clarke values and enrichment factors (compared to the upper continental crust) of the chemical elements of the examined Jerada soils (34 samples).
ElementsMinMaxMeanMedianSDSkewnessKurtosisClarke Values aEnrichment Factor
Ba270.81755.25466.62449.1694.241.092.045501.15
As3.5059.4124.2121.4210.971.182.51221.89
Pb16.70163.8060.6455.0832.141.934.78174.84
Zn37.17371.95144.27130.9856.452.057.49712.76
Cu7.10145.6032.5726.5627.852.387.52251.77
Fe15,337.9178,705.3348,037.9247,666.2110,697.850.053.5335,0001.86
Mn148.502158.32851.69757.02485.931.582.396001.90
Ti2138.325406.203846.463881.35672.53−0.130.5645001.16
Al30,617.0877,279.1459,291.5260,379.7710,375.55−0.580.4480,4001
S388.959780.532184.131488.351853.722.447.80NDND
Cr, Cd, Mo, Co, Ni, and Sn are inferior to the detection limit of the XRF apparatus. Bold values in enrichment factor limit are superior values. SD = standard deviation. a Clarke values = mean concentrations of the chemical elements in the upper continental crust (UCC) given by [30]; Geochemical data are expressed in mg/kg; ND: Not determined.
Table 3. Theoretical semi-variogram model values and error estimation.
ElementNuggetNumber of LagsRoot-Mean-SquareAverage Standardized
Errors
Mean
Standardized
RMSE
Pb811.111228.883033.66680.06410.8708
Zn1931.011252.740263.60560.033630.8413
As102.561210.249211.58440.074430.89060
Table 4. Geochemical background values, anomalous values, and net anomalous values obtained for the Jerada soils.
ElementsJerada SoilsGeochemical Background of Soils (1st Population)Anomalous Content
(2nd and 3rd Populations)
Net Anomalous
Values
Canadian Soils Quality
Guidelines *a
NMeanMedianNMean (a)MedianNMean (b)Median(b−a)
As3424.2121.422720.0119.66740.4240.7920.4112
Pb3460.6455.082849.6248.416112.0193.6762.3970
Zn34144.27130.9831131.86126.023272.46253.89140.6200
N is number of samples, (all concentrations are expressed in mg·kg−1). *a Canadian soil quality guideline [50].
Disclaimer/Publisher’s Note: The statements, opinions and data contained in all publications are solely those of the individual author(s) and contributor(s) and not of MDPI and/or the editor(s). MDPI and/or the editor(s) disclaim responsibility for any injury to people or property resulting from any ideas, methods, instructions or products referred to in the content.

