
Non-Destructive Study of Egyptian Emeralds Preserved in the Collection of the Museum of the Ecole des Mines
 , , ,
, , ,  , ,
, ,
Abstract
:1. Introduction
2. Materials and Methods
3. Results
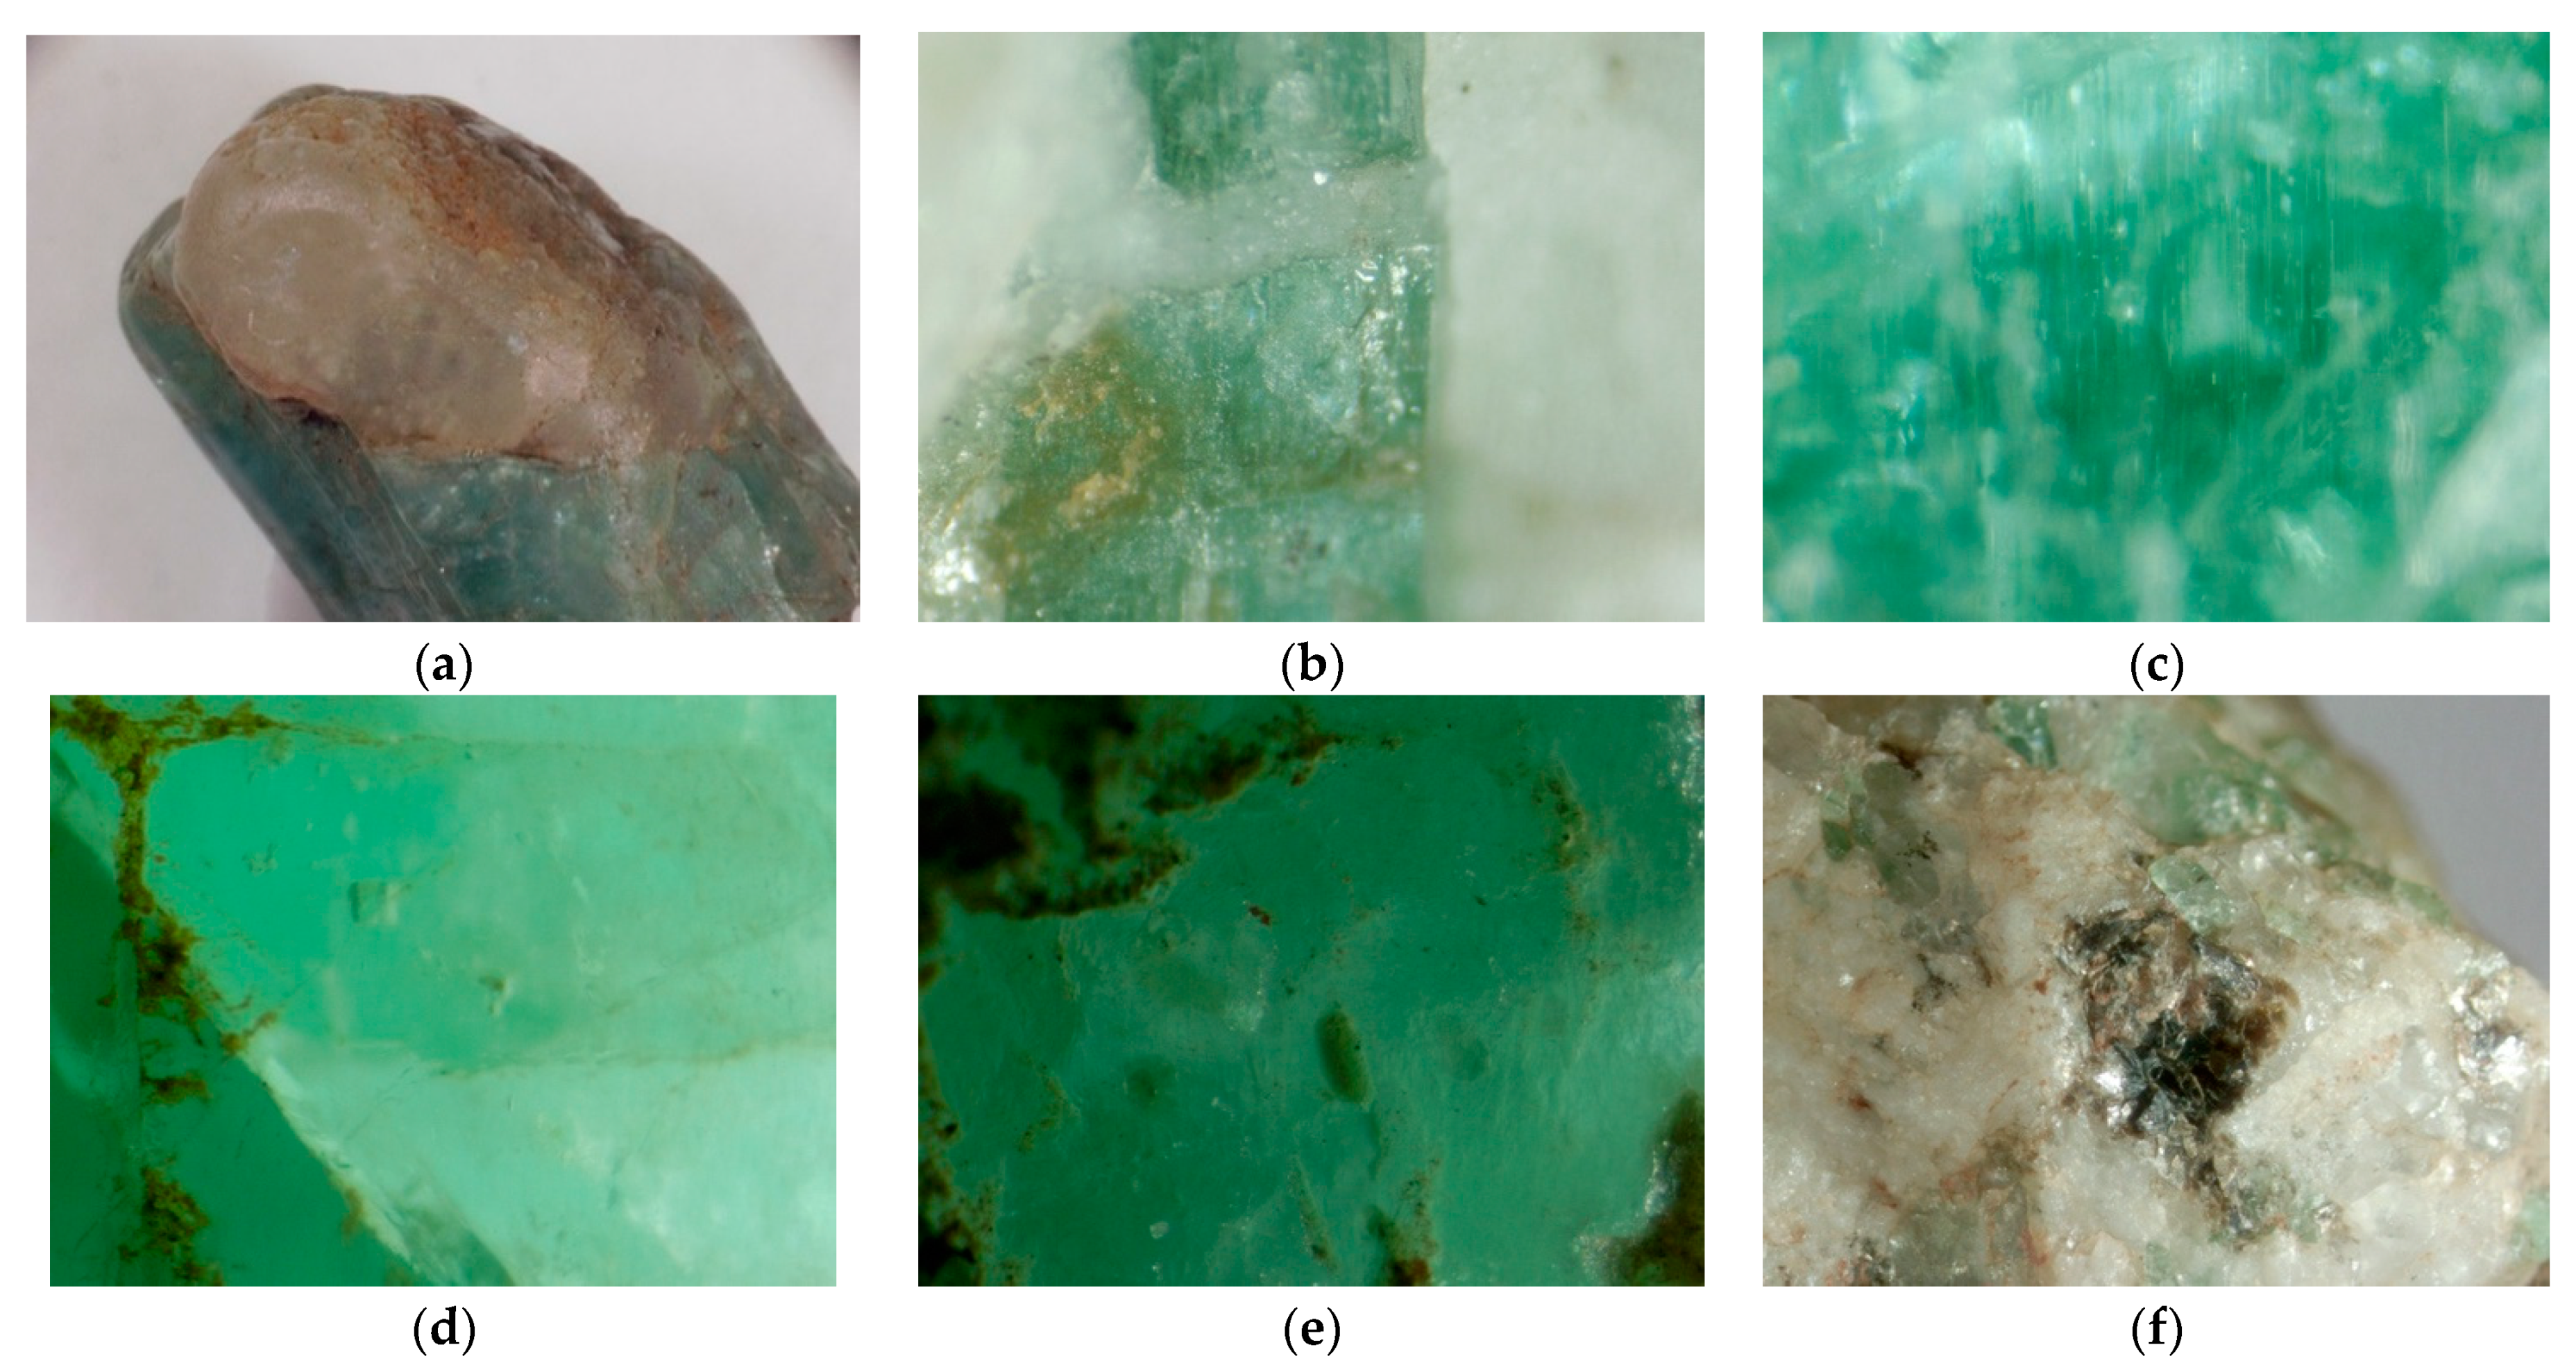
3.1. Macroscopic, Microscopic and Gemological Observations
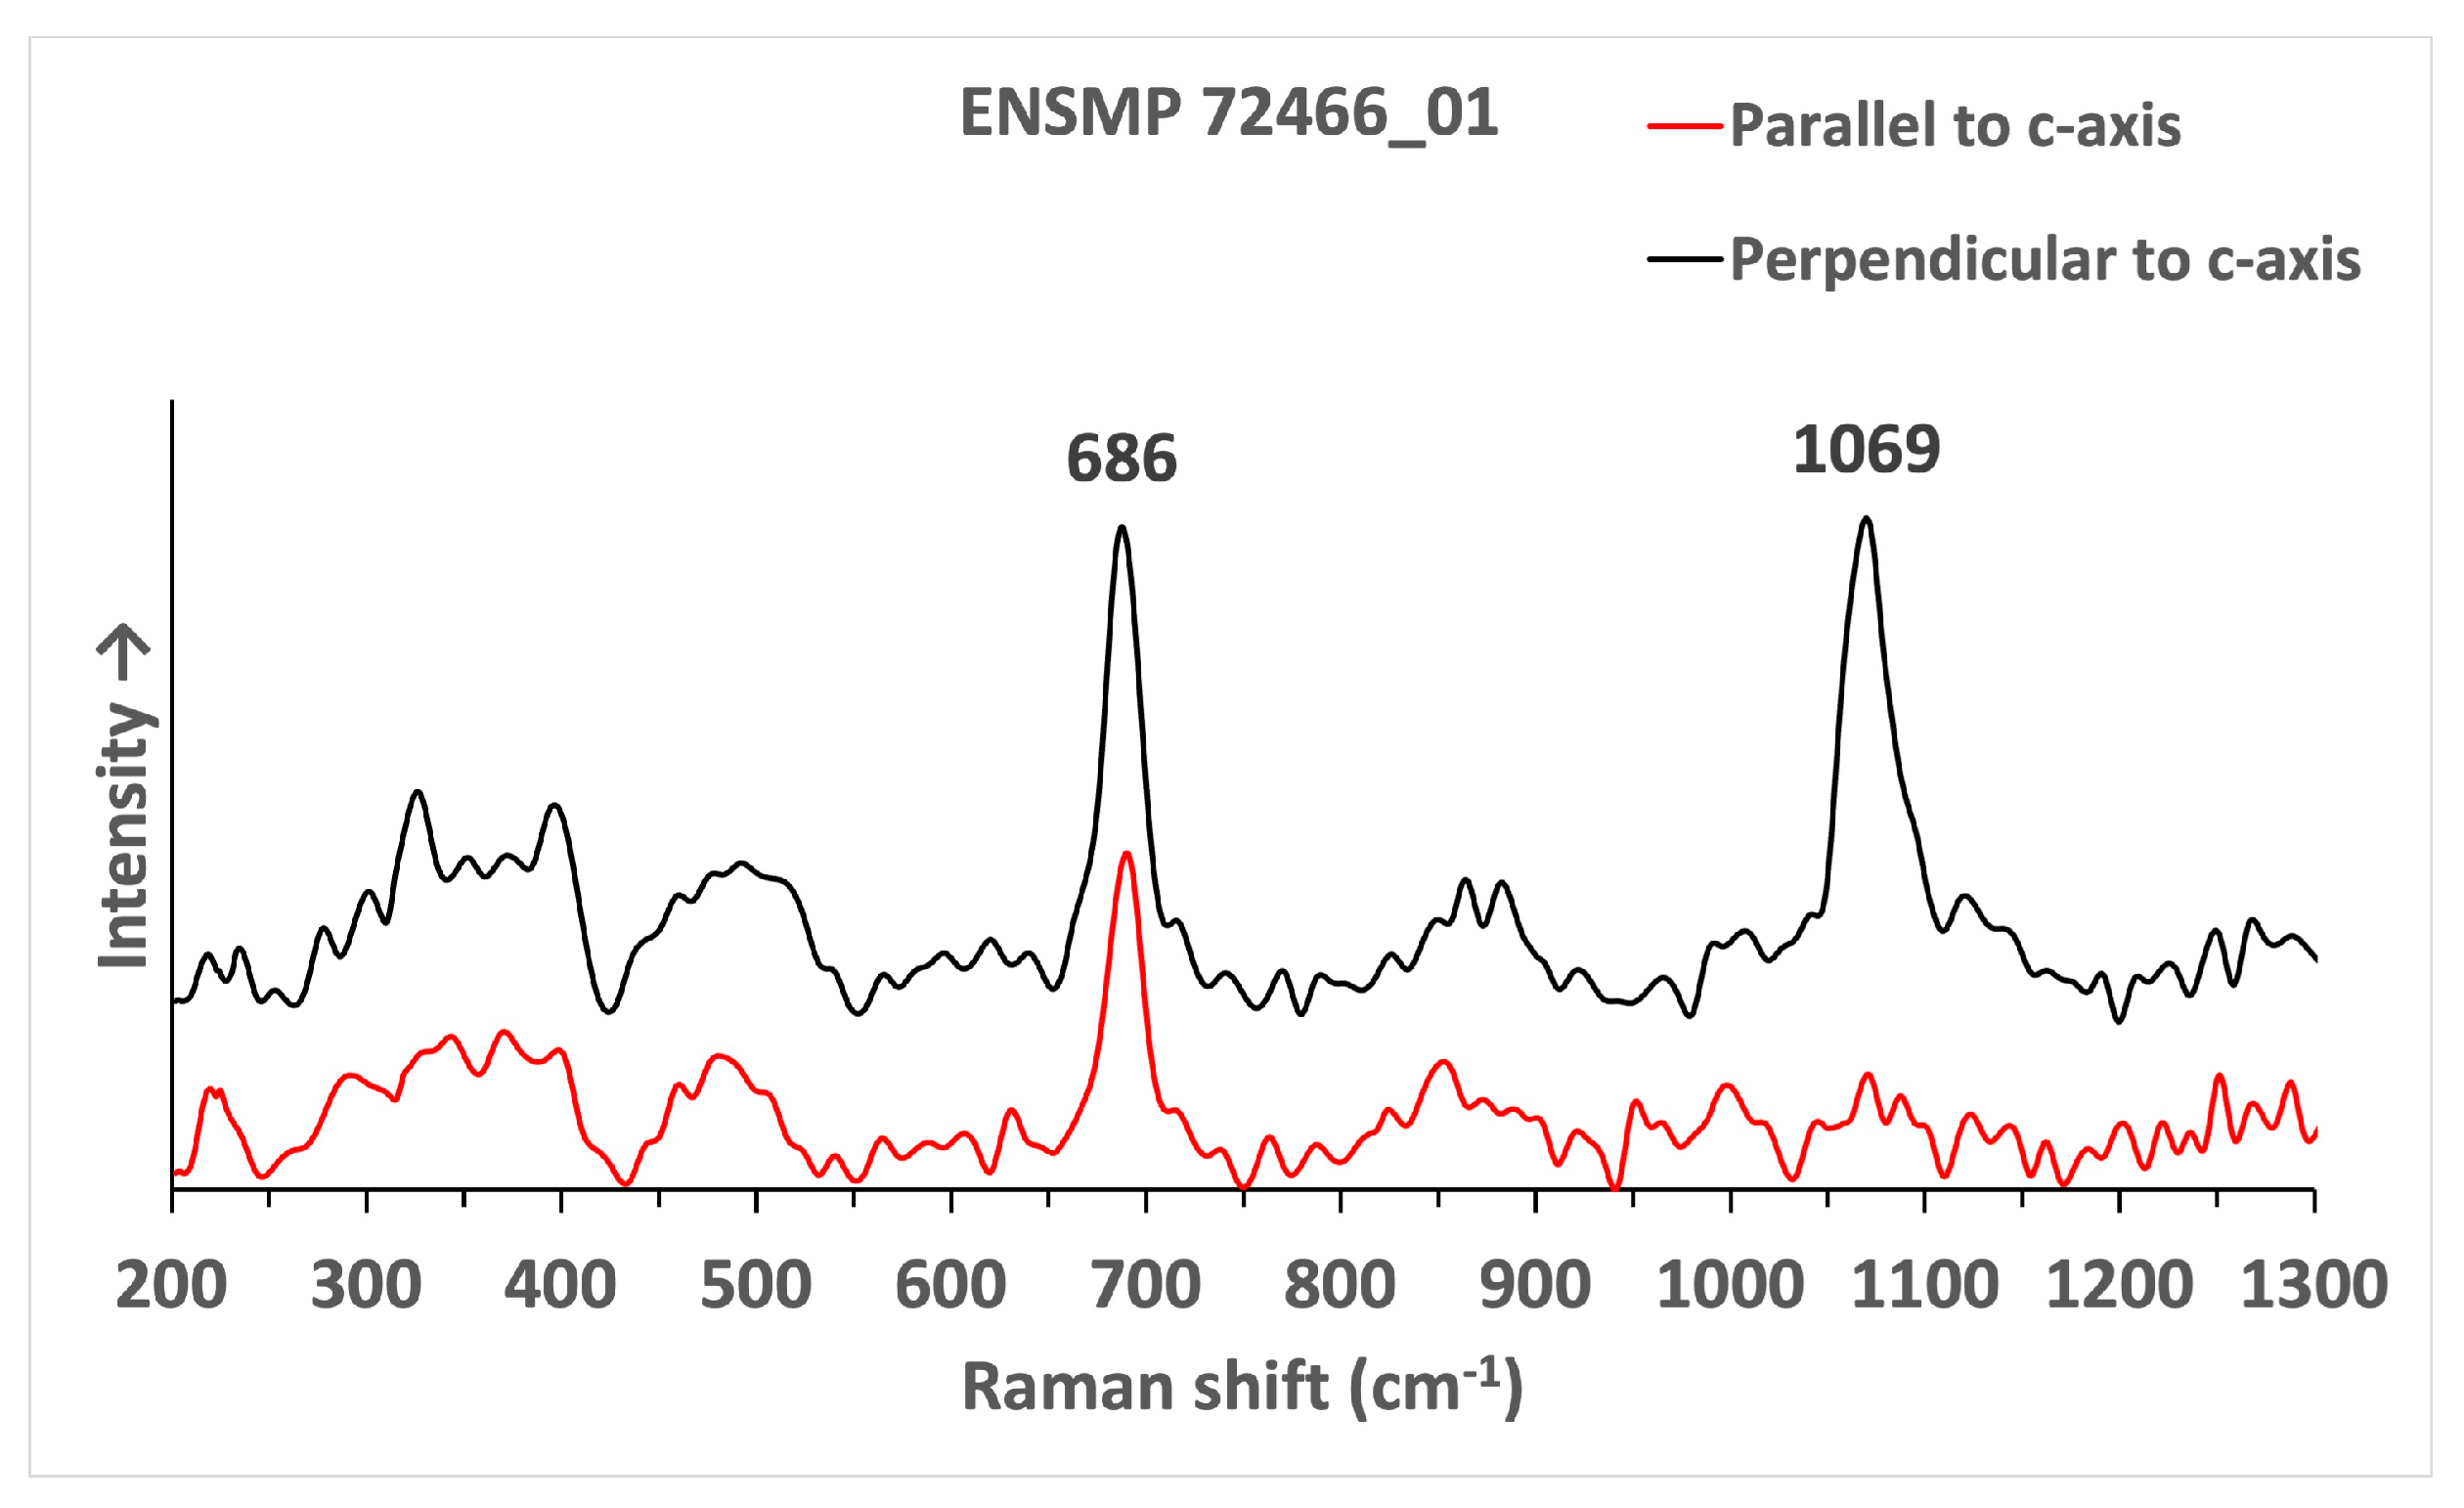
3.2. Raman Spectroscopy
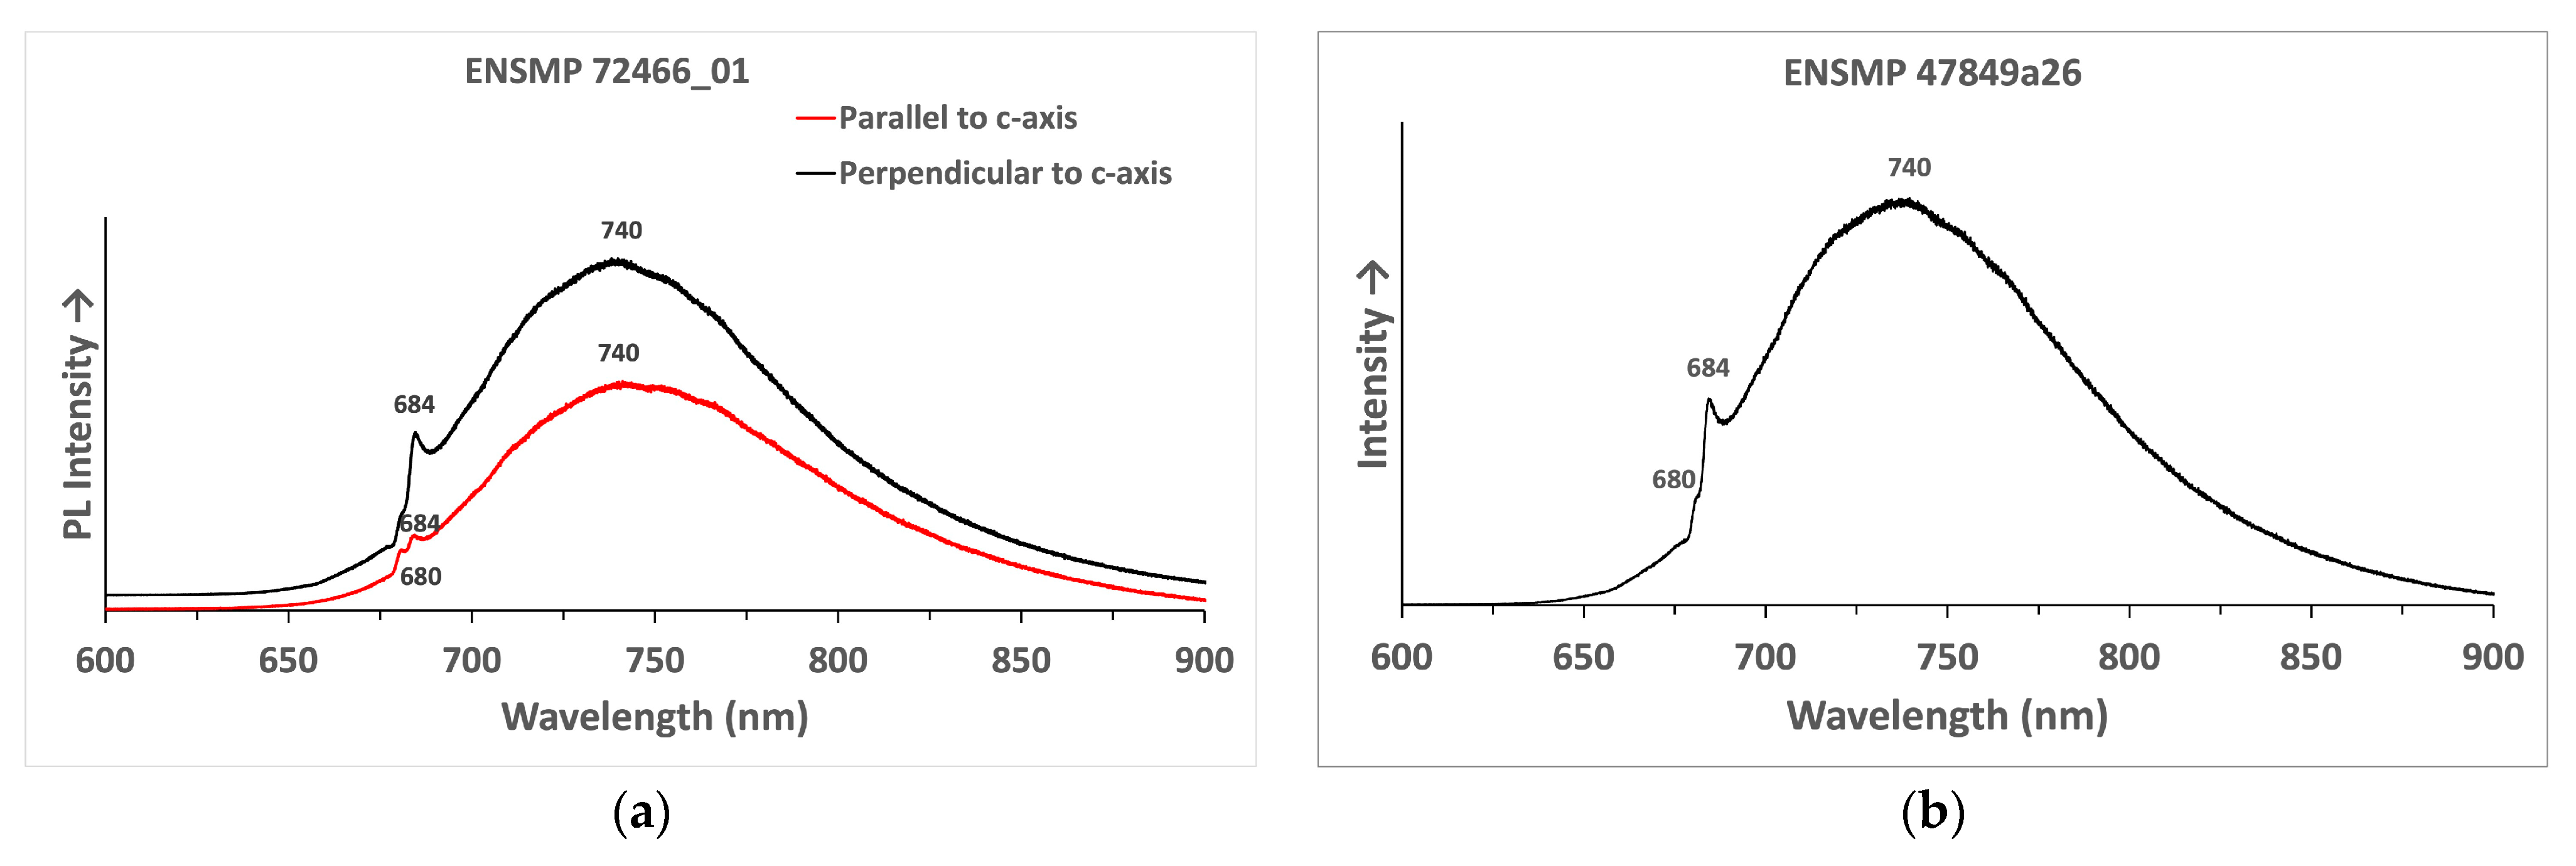
3.3. PL Spectroscopy
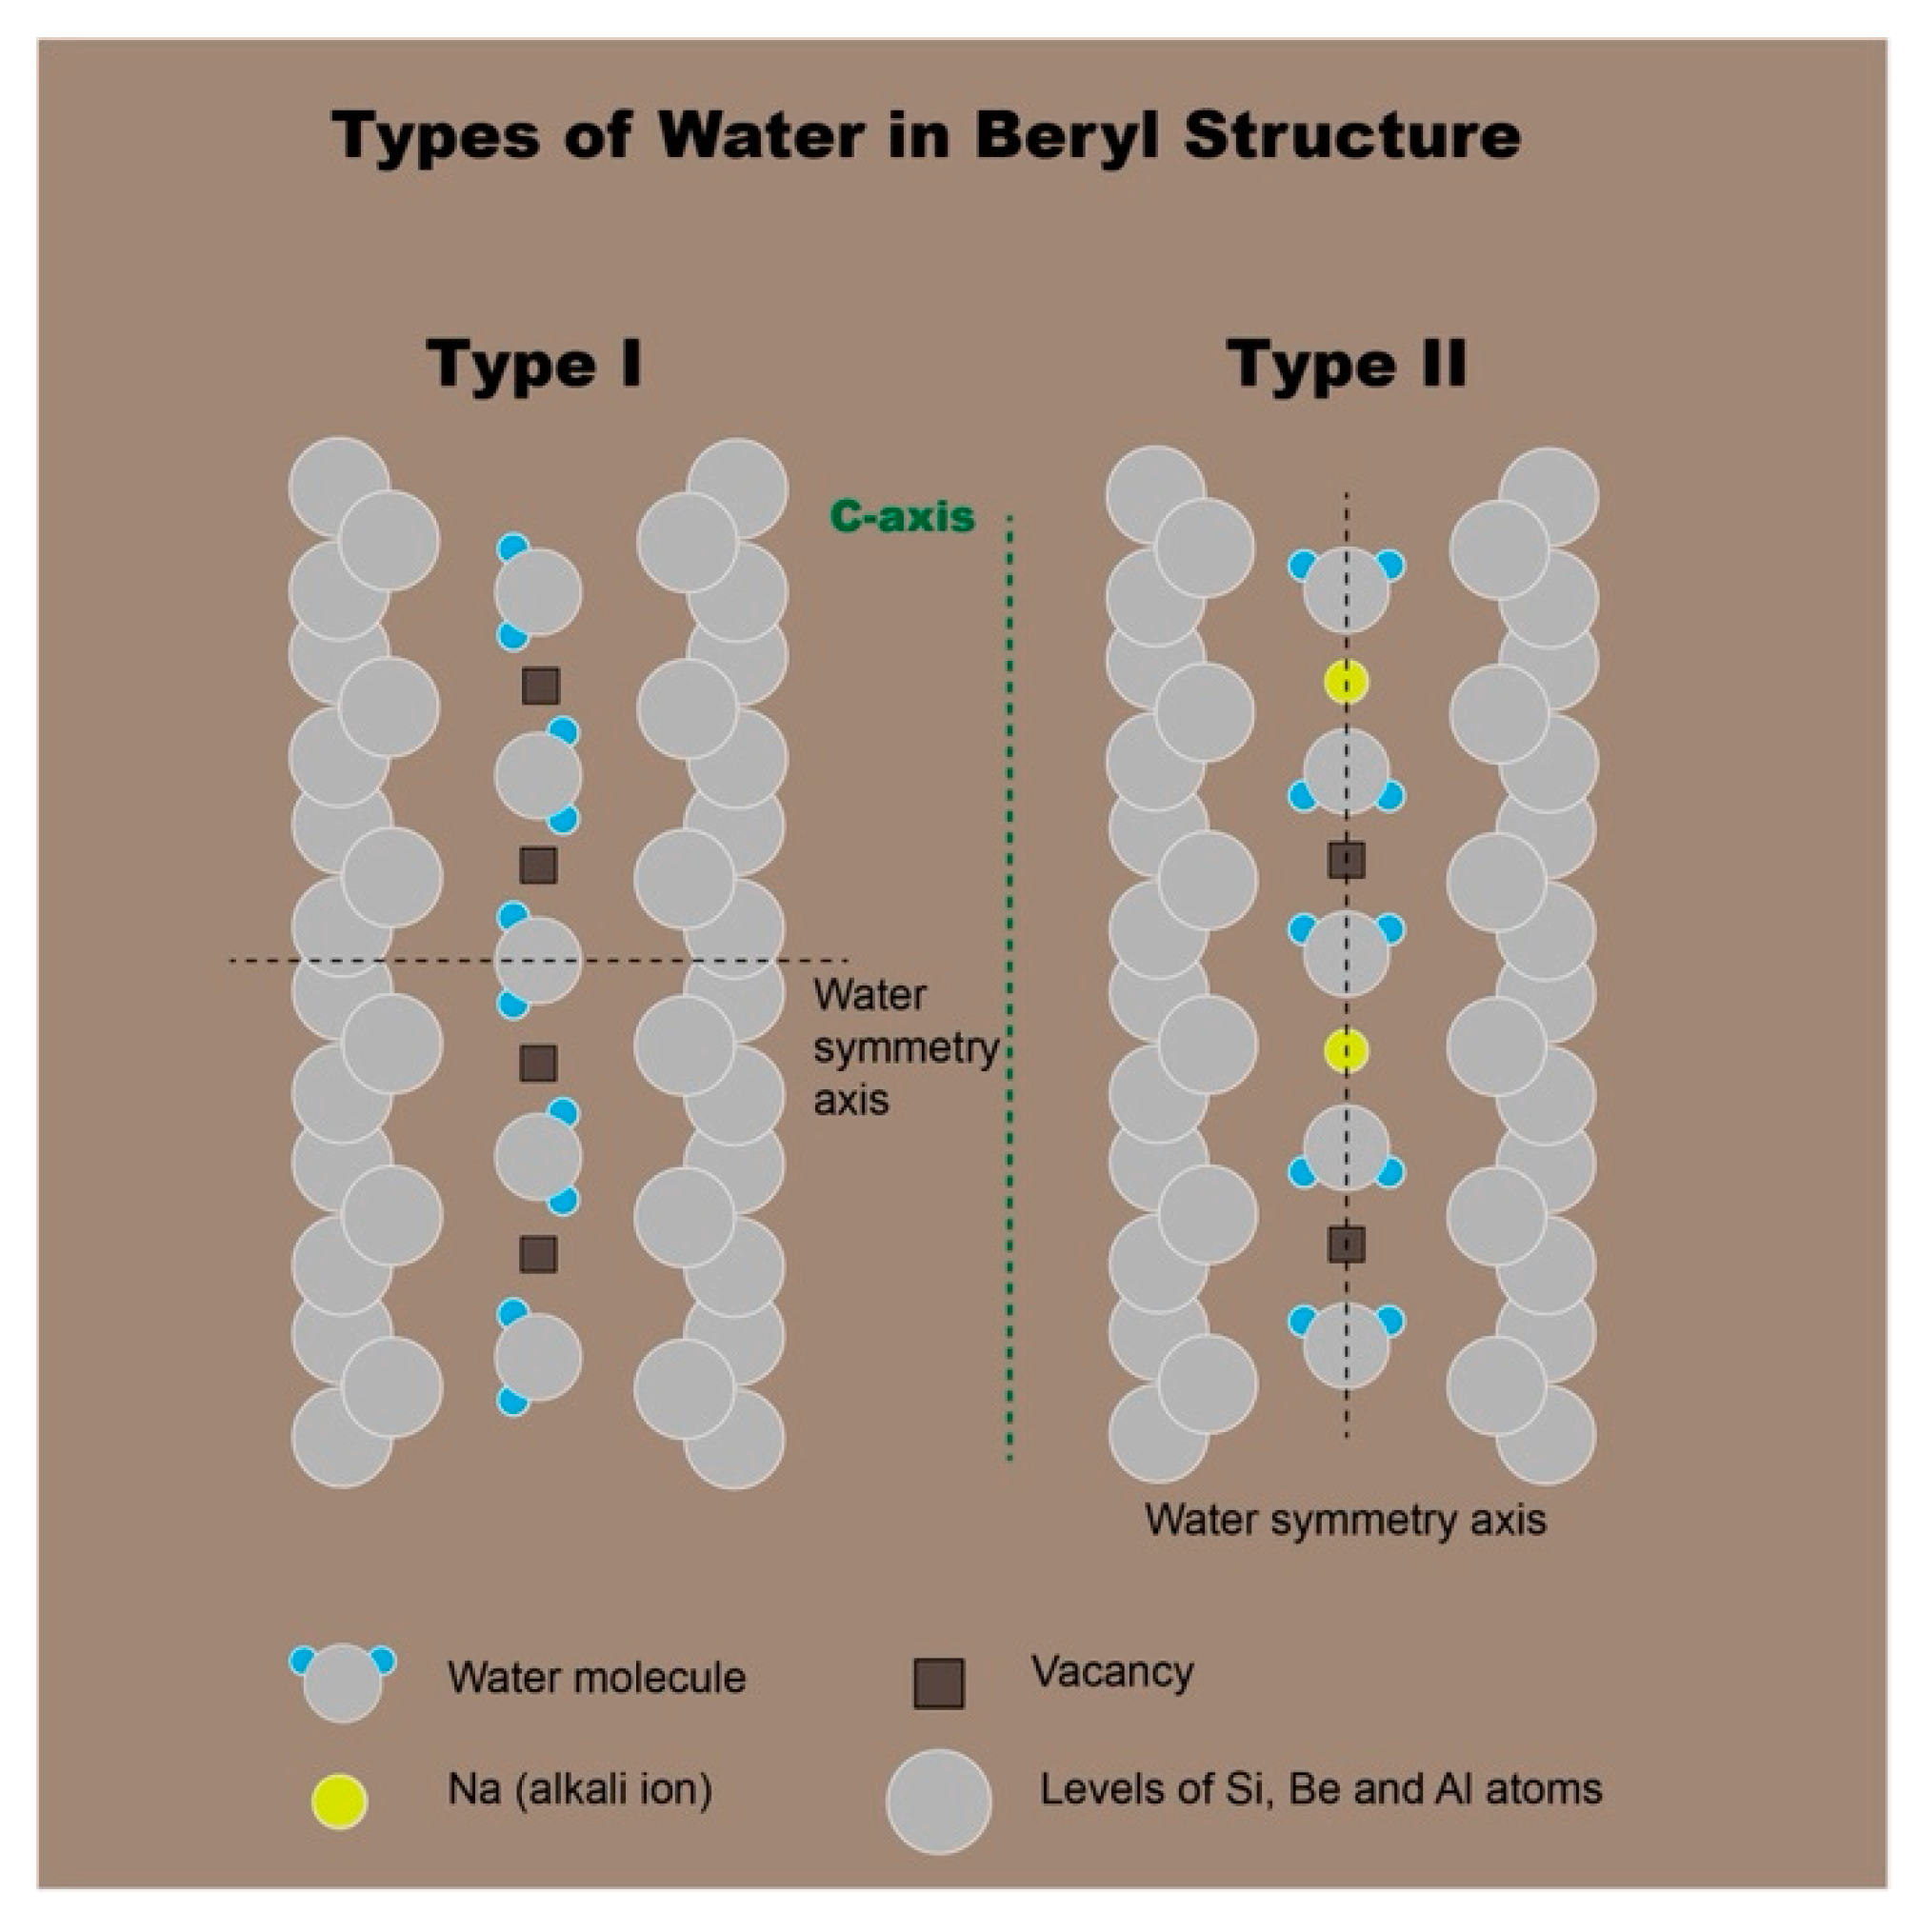
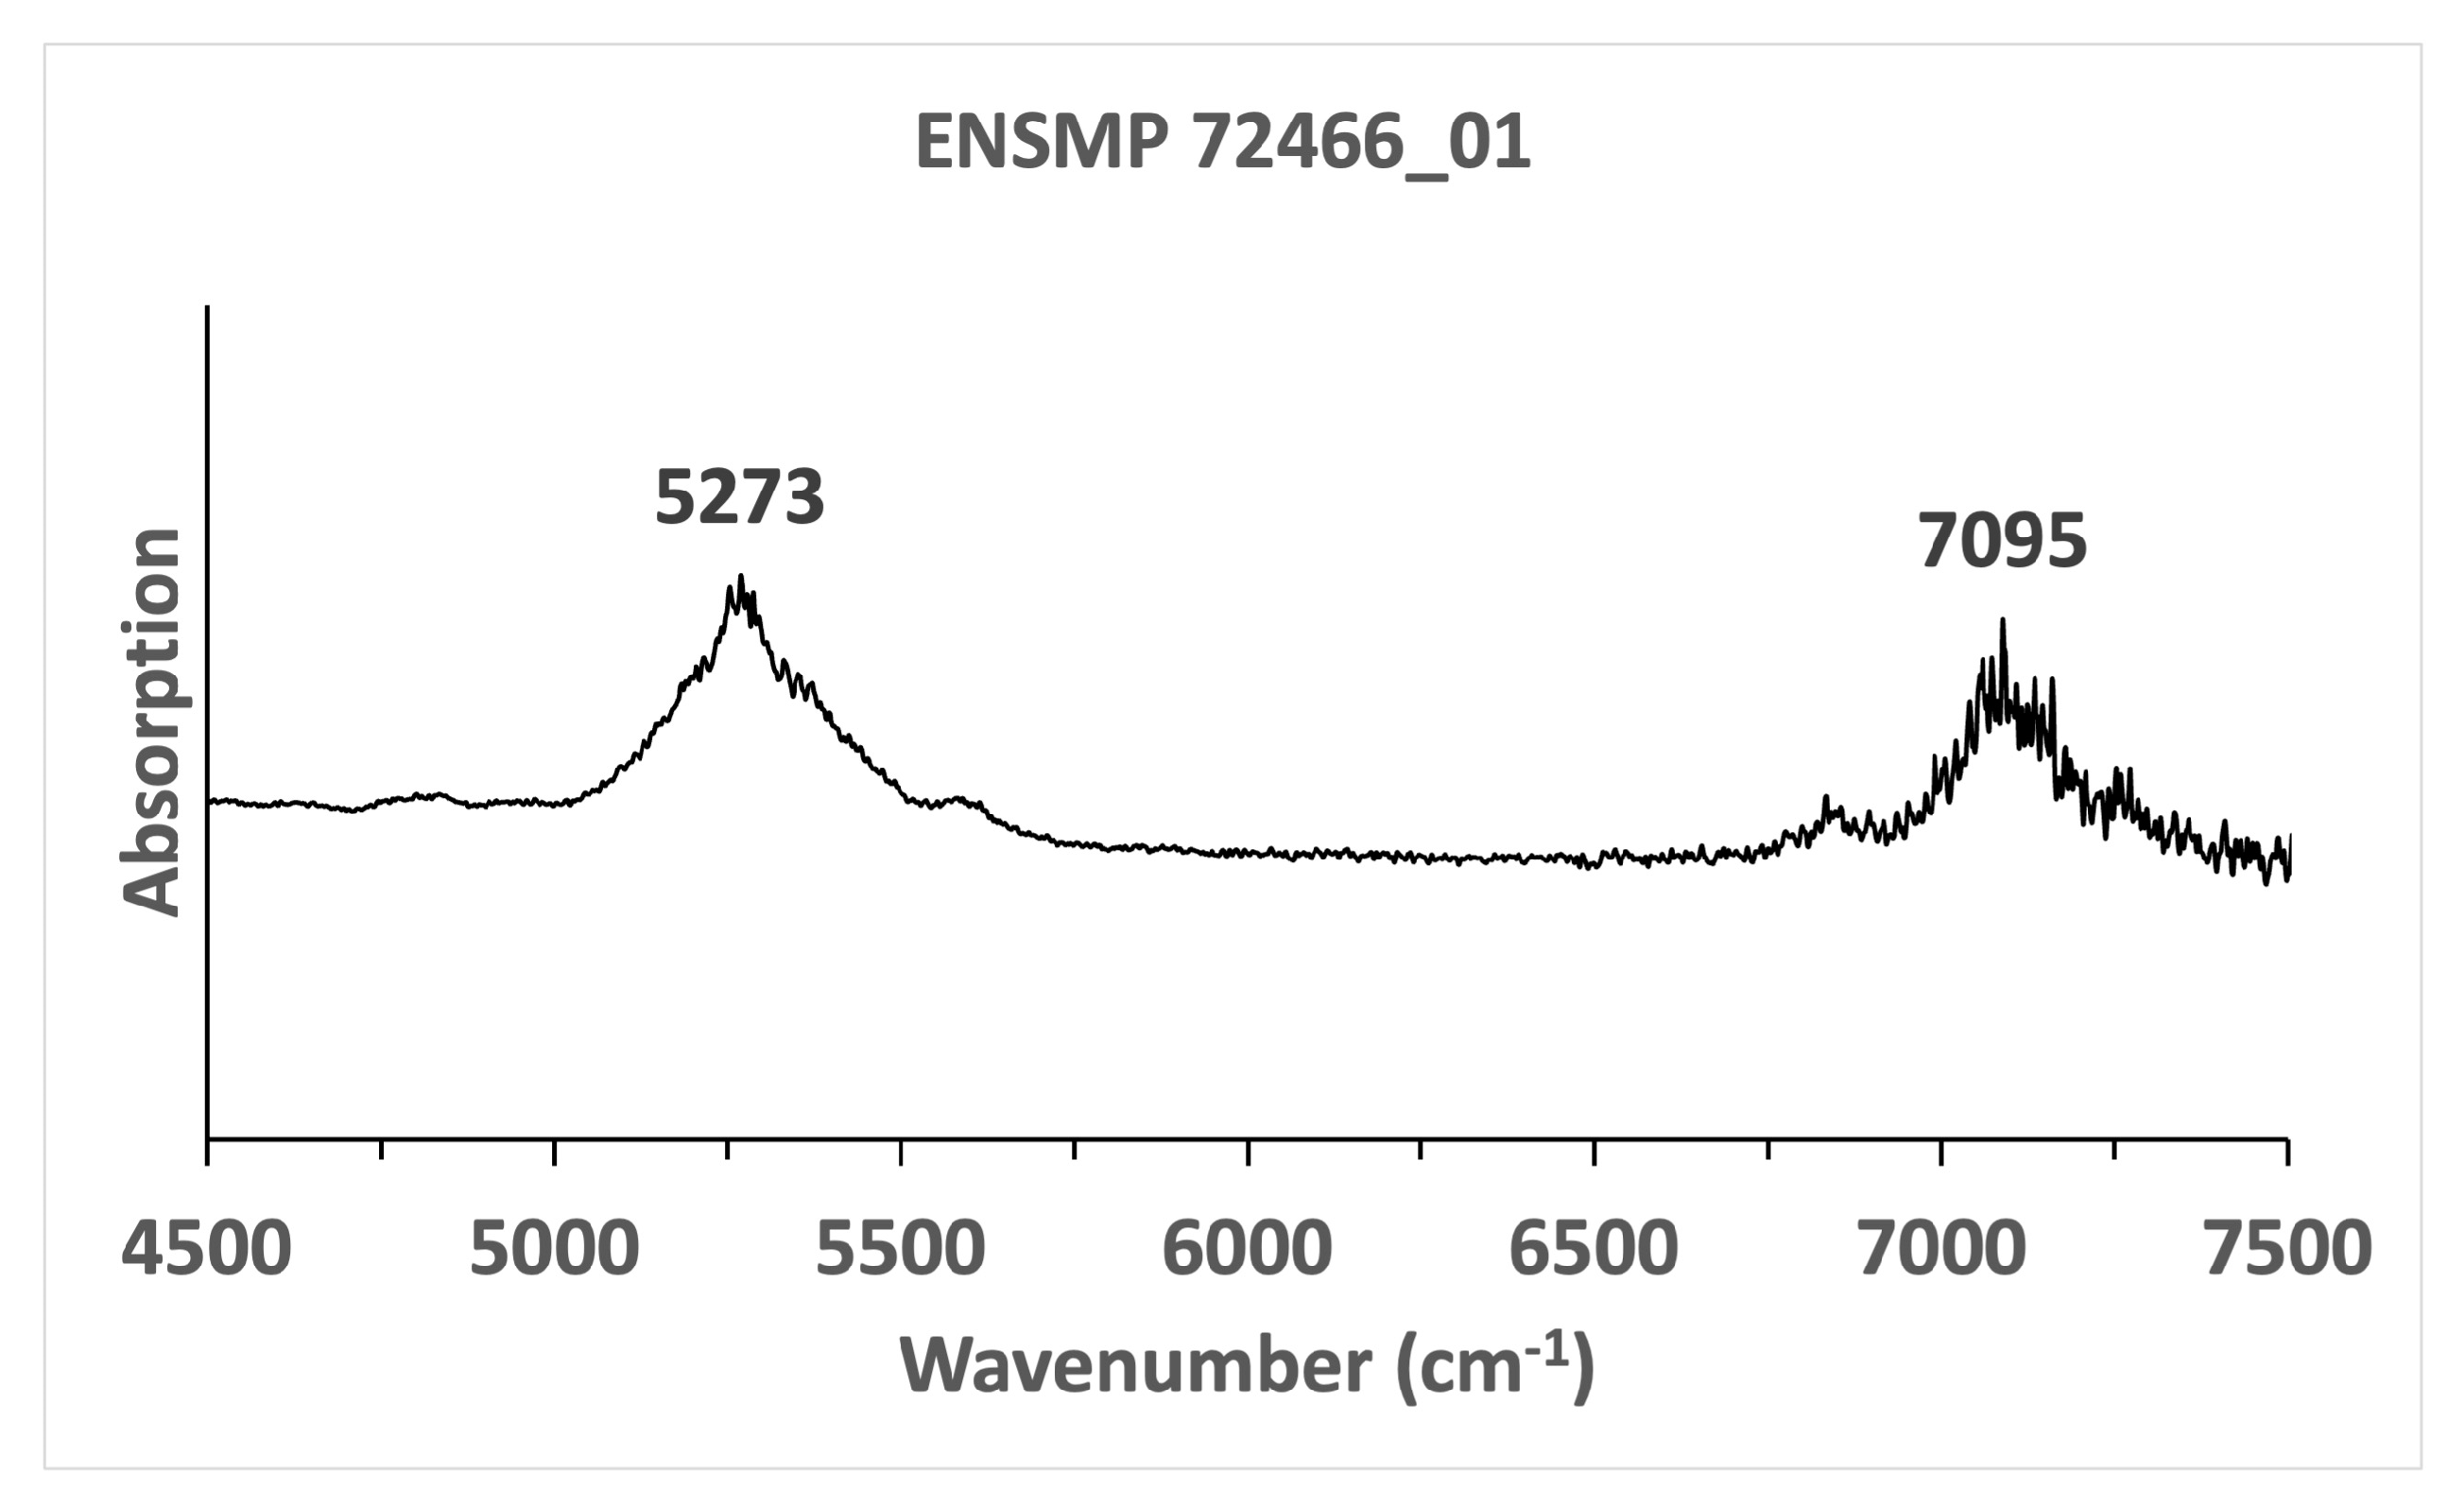
3.4. FTIR Spectroscopy
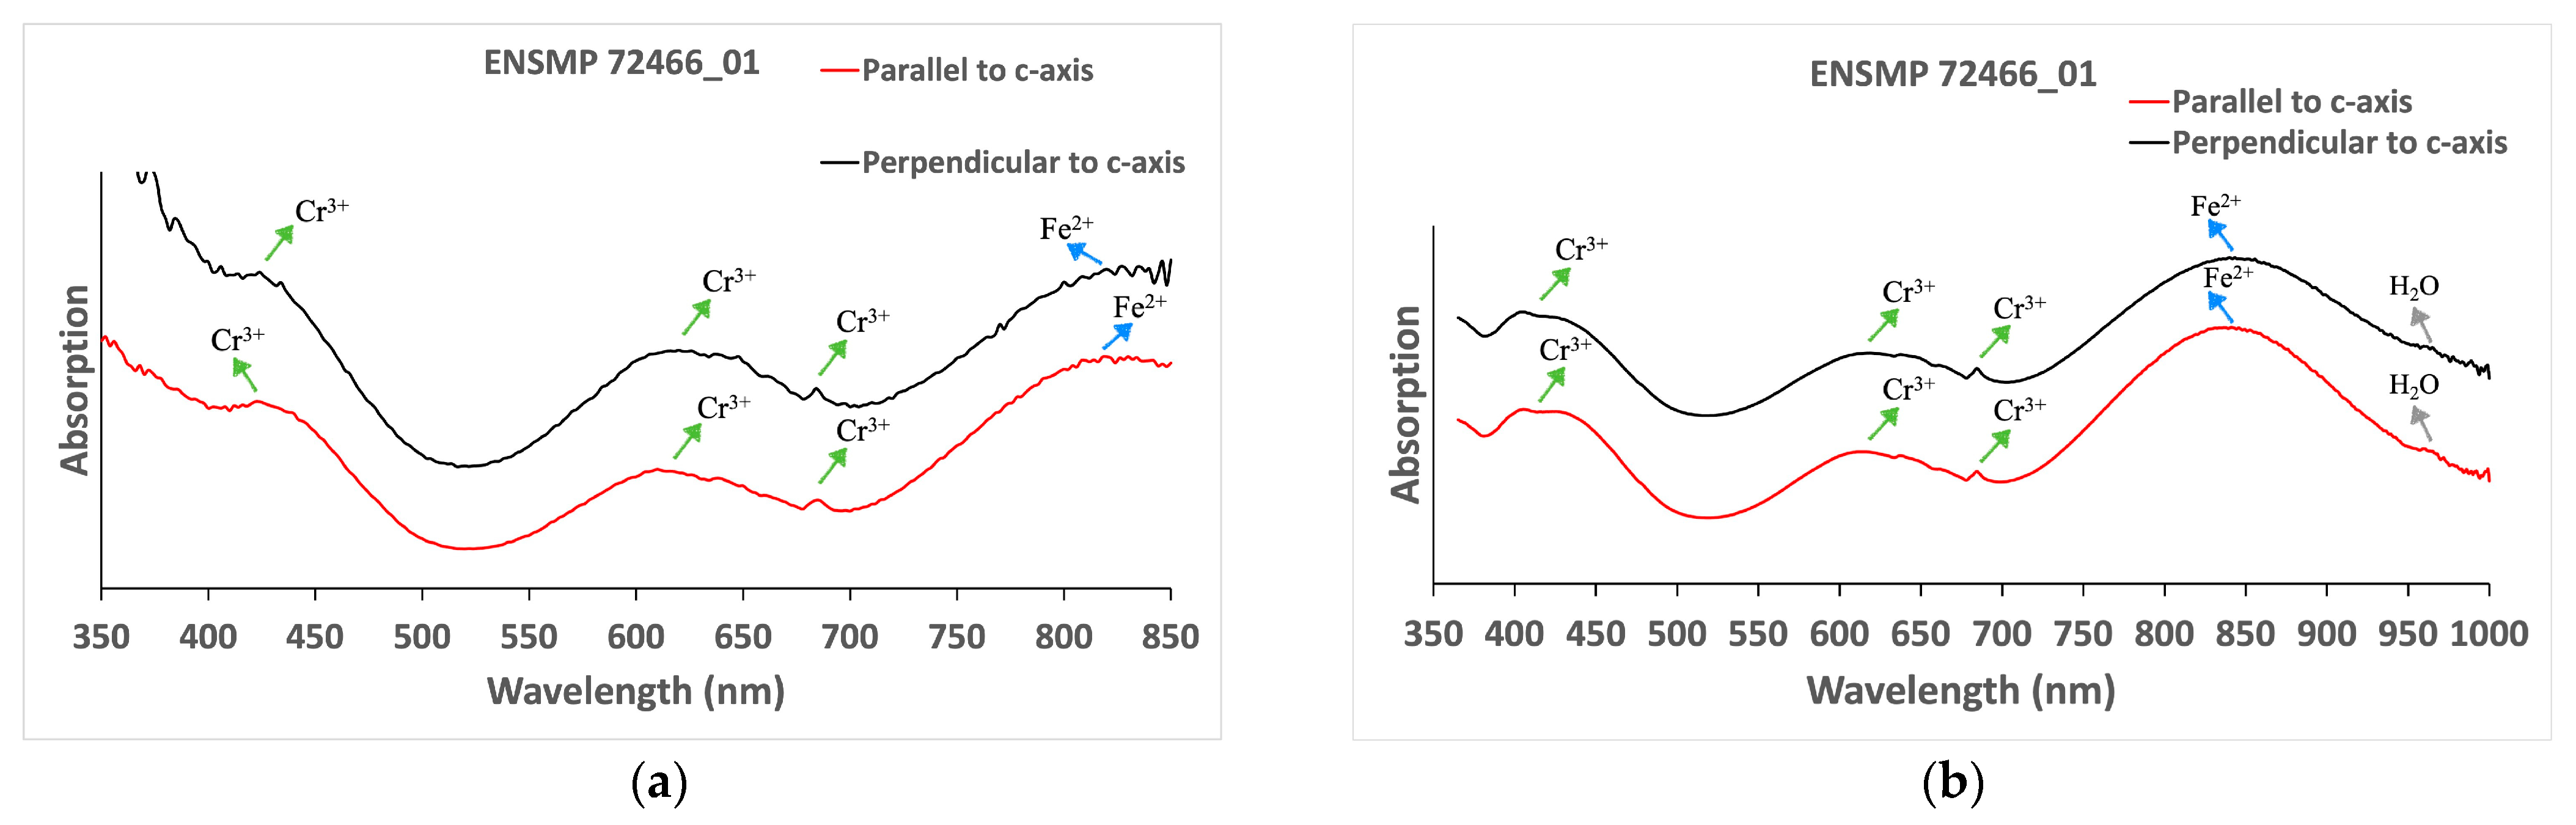
3.5. UV-Vis-NIR Spectroscopy
3.6. EDXRF
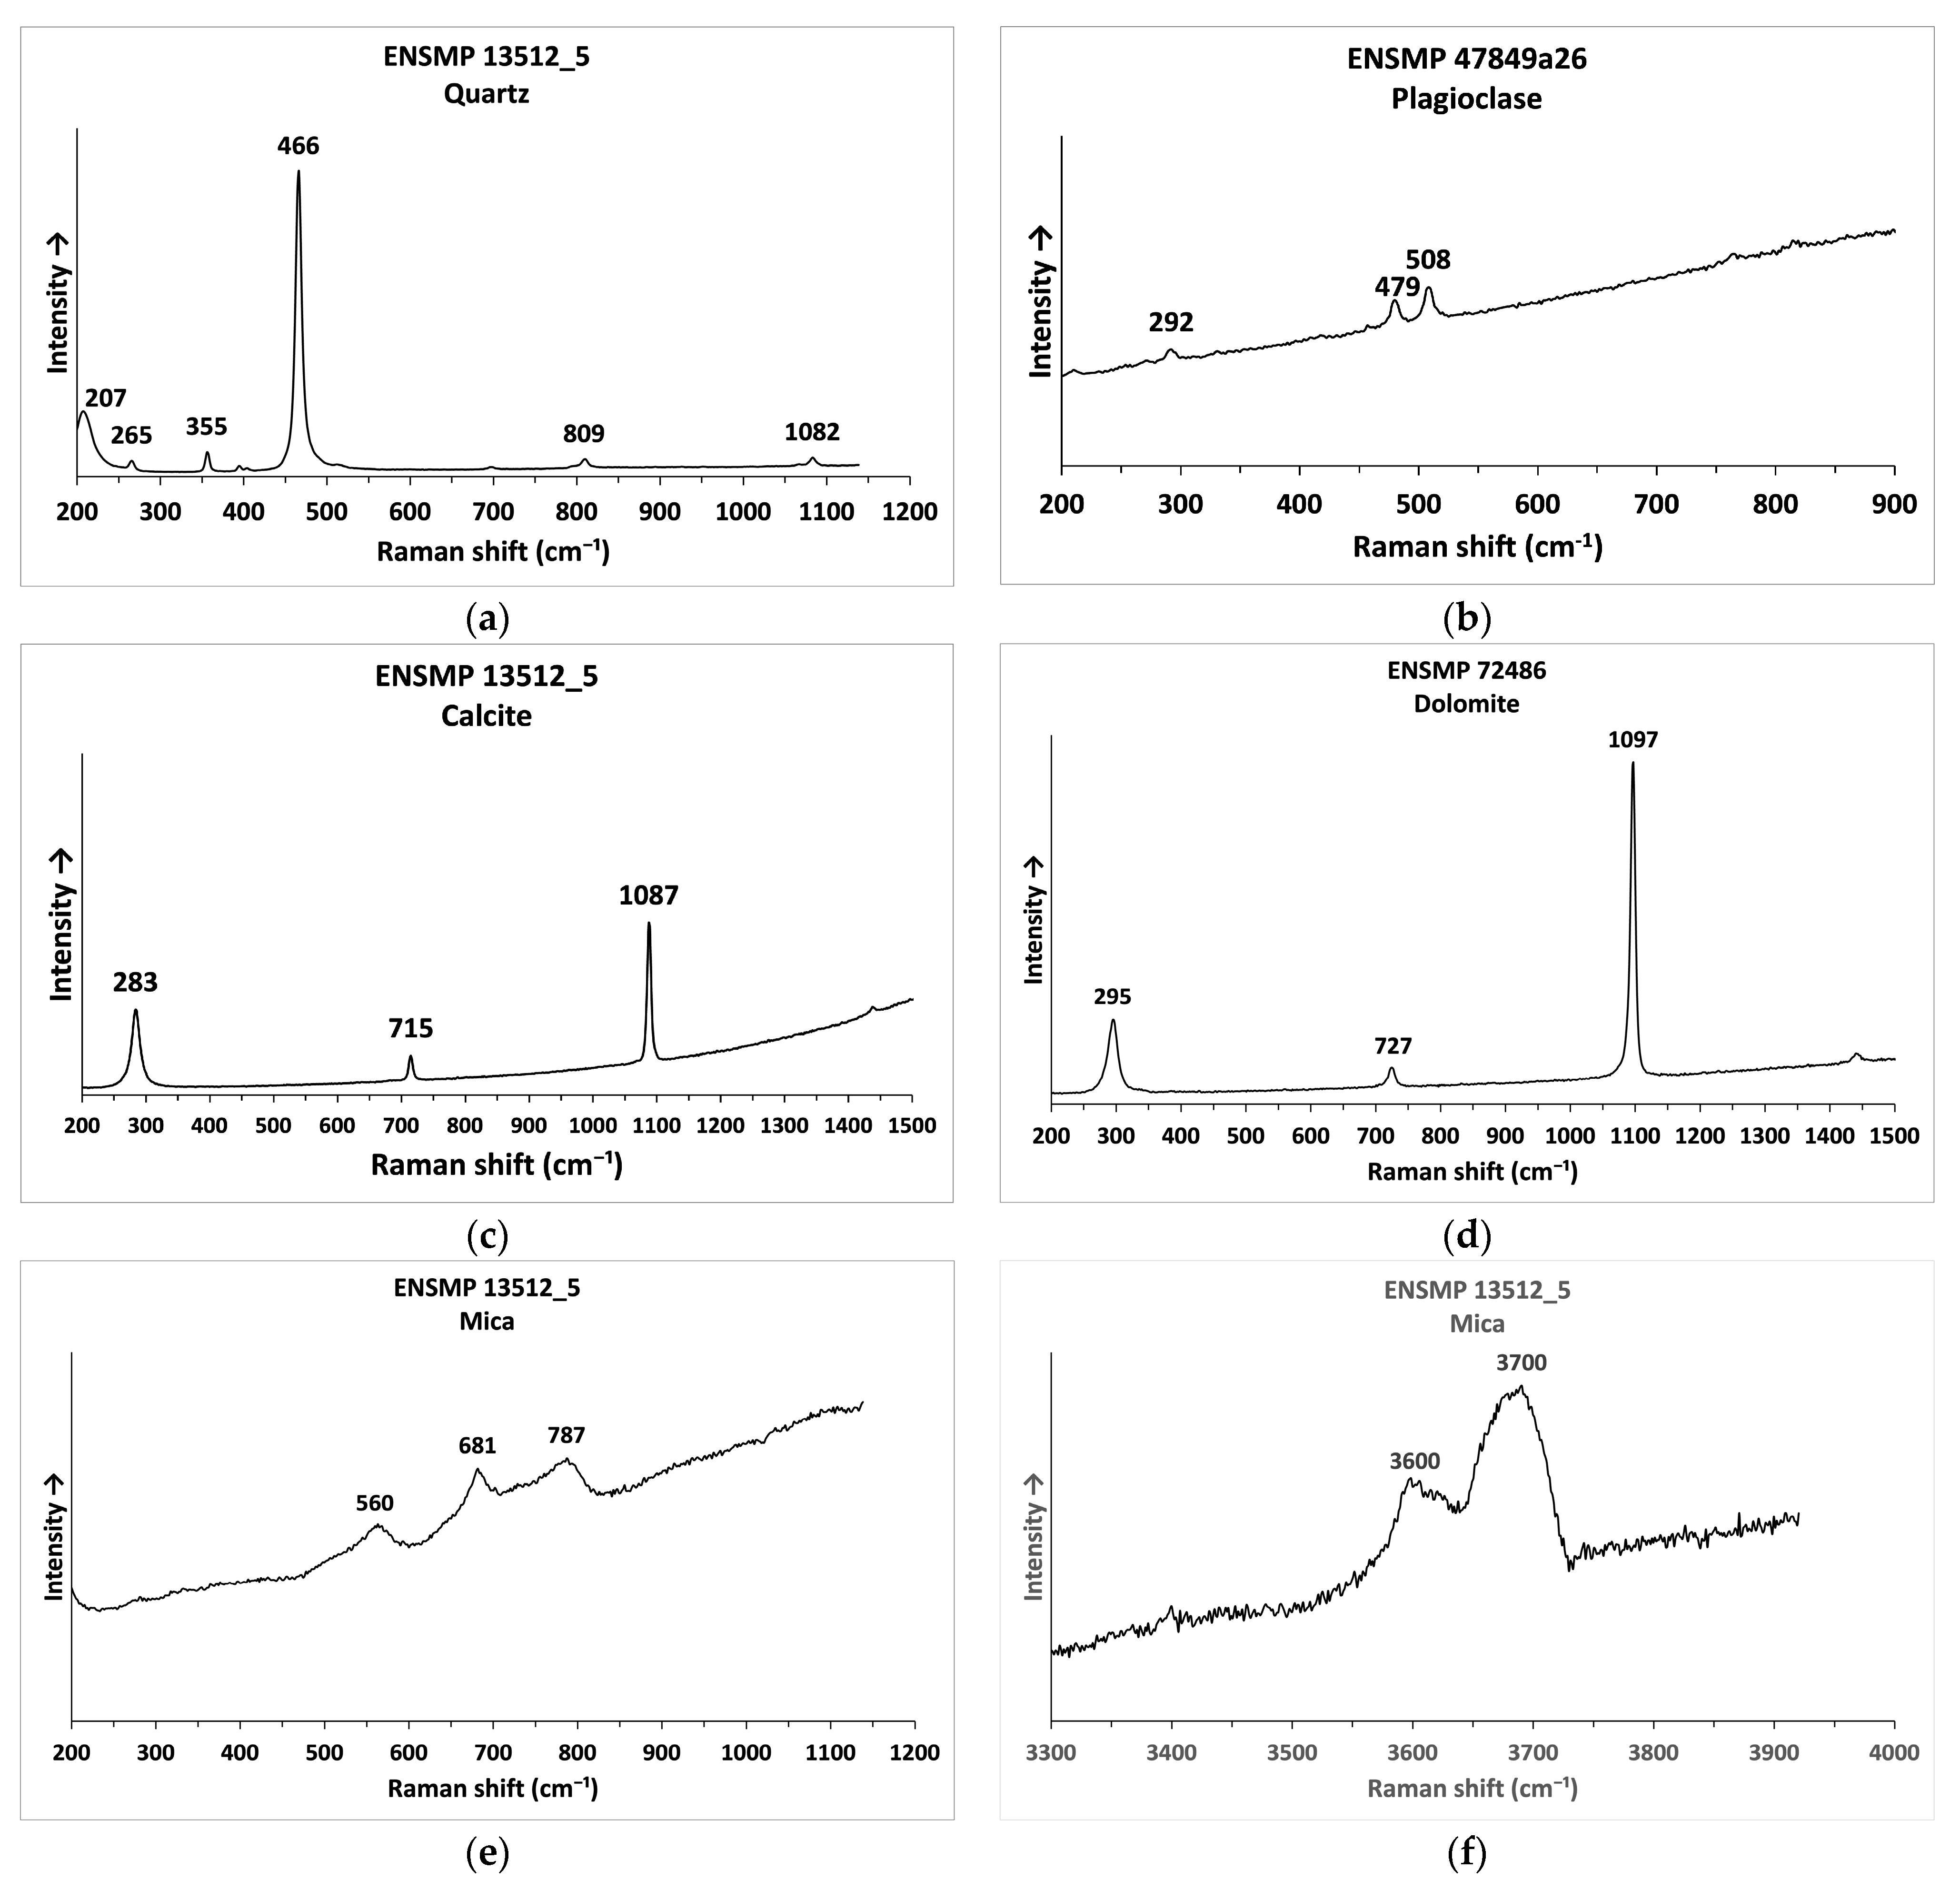
3.7. Associated Minerals
4. Discussion and Conclusions
Author Contributions
Funding
Data Availability Statement
Acknowledgments
Conflicts of Interest
References
- Groat, L.A.; Giuliani, G.; Marshall, D.D.; Turner, D. Emerald Deposits and Occurences; A Review. Ore Geol. Rev. 2008, 34, 87–112. [Google Scholar] [CrossRef]
- Giuliani, G.; Groat, L.A.; Marshall, D.; Fallick, A.E.; Branquet, Y. Emerald Deposits: A Review and Enhanced Classification. Minerals 2019, 9, 105. [Google Scholar] [CrossRef] [Green Version]
- Karampelas, S.; Al-Shaybani, B.; Mohamed, F.; Sangsawong, S.; Al-Alawi, A. Emeralds from the Most Important Occurrences: Chemical and Spectroscopic Data. Minerals 2019, 9, 561. [Google Scholar] [CrossRef] [Green Version]
- Sinkankas, J. Emerald and Other Beryls; Geoscience Press: Prescott, AZ, USA, 1981. [Google Scholar]
- Wood, D.L.; Nassau, K. The Characterization of Beryl and Emerald by Visible and Infrared Absorbtion Spectroscopy. Am. Mineral. 1968, 53, 777–800. [Google Scholar]
- Huong, L.T.; Häger, W.; Hofmeister, W. Confocal Micro-Raman Spectroscopy: A Powerful Tool to Identify Natural and Synthetic Emeralds. Gems Gemol. 2010, 64, 36–41. [Google Scholar] [CrossRef] [Green Version]
- Wang, H.; Shu, T.; Chen, J.; Guo, Y. Characteristics of Channel-Water in Blue-Green Beryl and Its Influence on Colour. Crystals 2022, 12, 435. [Google Scholar] [CrossRef]
- Ogden, J. Cleopatra’s Emerald Mines: The Marketing of a Myth. J. Gemmol. 2022, 38, 156–170. [Google Scholar] [CrossRef]
- Jennings, R.H.; Kammerling, R.C.; Kovaltchouk, A.; Calederon, G.P.; El Baz, M.K.; Koivula, J.I. Emeralds and Green Beryls of Upper Egypt. Gems Gemol. 1993, 29, 100–115. [Google Scholar] [CrossRef] [Green Version]
- Hume, W.F. Geology of Egypt; Goverment Press: Cairo, Egypt, 1934; Volume 2, p. 300. [Google Scholar]
- Giuliani, G. Émeraudes, Tout Un Monde; Les Editions du Piat, Galvenas-F-43200: Saint-Julien-de-Pinet, France, 2022. [Google Scholar]
- Gawad, A.; Ene, A.; Skublov, S.G.; Gavrilchik, A.K.; Ali, M.A.; Ghoneim, M.M.; Nastavkin, A.V. Trace Element Geochemistry and Genesis of Beryl from Wadi Nugrus, South Eastern Desert, Egypt. Minerals 2022, 12, 206. [Google Scholar] [CrossRef]
- Soliman, M.M. Ancient Emerald Mines and Beryllium Mineralization Associated with Precambrian Stanniferous Granites in the Nugrus-Zabara Area, Southeastern Desert, Egypt. Arab Gulf Res. 1986, 4, 529–548. [Google Scholar]
- Grundmann, G.; Morteani, G. Multi-Stage Emerald Formation during Pan-African Regional Metamorphism: The Zabara, Sikait, Umm Kabo Deposits, South Eastern Desert of Egypt. J. Afr. Earth Sci. 2008, 50, 168–187. [Google Scholar] [CrossRef]
- Hassan, M.A.; El-Shatouri, H.M. Beryl Occurrences in Egypt. Min. Geol. 1976, 26, 253–262. [Google Scholar] [CrossRef]
- Gaillou, E.; Maouche, F.; Barthe, A.; Nectoux, D.; Lechartier, M. Émeraudes Historiques de La Collection de l’École Nationale Supérieure Des Mines de Paris. Le Règne Minéral 2022, in press. [Google Scholar]
- Cailliaud, F. Voyage à l’Oasis de Thèbes et Dans Les Déserts Situés à l’Orient et à l’Occident de La Thébaïde (Histoire); Hachette Livre-BNF: Paris, France, 2022; ISBN 978-2-01-351722-5. (In French) [Google Scholar]
- Saeseaw, S.; Pardieu, V.; Sangsawong, S. Three-Phase Inclusions in Emerald and Their Impact on Origin Determination. Gems Gemol. 2014, 50, 114–132. [Google Scholar] [CrossRef] [Green Version]
- Jehlička, J.; Culka, A.; Bersani, D.; Vandenabeele, P. Comparison of Seven Portable Raman Spectrometers: Beryl as a Case Study. J. Raman Spectrosc. 2017, 48, 1289–1299. [Google Scholar] [CrossRef] [Green Version]
- Bersani, D.; Azzi, G.; Lambruschi, E.; Barone, G.; Mazzoleni, P.; Raneri, S.; Longobardo, U.; Lottici, P.P. Characterization of Emeralds by Micro-Raman Spectroscopy. J. Raman Spectrosc. 2014, 45, 1293–1300. [Google Scholar] [CrossRef]
- Moroz, I.; Roth, M.; Boudeulle, M.; Panczer, G. Raman Microspectroscopy and Fluorescence of Emeralds from Various Deposits. J. Raman Spectrosc. 2000, 31, 485–490. [Google Scholar] [CrossRef]
- Huong, L.T. Microscopic, Chemical and Spectroscopic Investigations on Emeralds of Various Origins. Ph.D. Thesis, Fachbereich Chemie, Pharmazie und Geowissenschaften der Johannes Gutenberg-Universität Mainz, Mainz, Germany, 2008. [Google Scholar]
- Hagemann, H.; Lucken, A.; Bill, H.; Gysler-Sanz, J.; Stalder, H.A. Polarized Raman Spectra of Beryl and Bazzite. Pgysiscs Chem. Miner. 1990, 17, 395–401. [Google Scholar] [CrossRef]
- Moroz, I.; Panczer, G.; Roth, M. Laser-Induced Luminescence of Emeralds from Different Sources. J. Gemmol. 1998, 26, 357–363. [Google Scholar] [CrossRef]
- Huong, L.T.T.; Hofmeister, W.; Häger, T.; Karampelas, S.; Kien, N.D.T. A Preliminary Study on the Seperation of Natural and Synthetic Emeralds Using Vibrational Spectroscopy. Gems Gemol. 2014, 50, 287–292. [Google Scholar] [CrossRef]
- Wood, D.L. Absorption, Fluorescence, and Zeeman Effect in Emerald. J. Chem. Phys. 1965, 42, 3404–3410. [Google Scholar] [CrossRef]
- Thompson, D.B.; Kidd, J.D.; Åström, M.; Scarani, A.; Smith, C.P. A Comparison of R-Line Photoluminescence of Emeralds from Different Origins. J. Gemmol. 2014, 34, 334–343. [Google Scholar] [CrossRef]
- Mathieu, V.M. IR and UV-Vis Spectroscopy of Gem Emeralds, a Tool to Differentiate Natural, Synthetic and/or Treated Stones? Master’s Thesis, Universiteit Gent, Ghent, Belgium, 2009. [Google Scholar]
- Saeseaw, S.; Renfro, N.D.; Palke, A.C.; Sun, Z.; McClure, S.F. Geographic Origin Determination of Emerald. Gems Gemol. 2019, 55, 614–646. [Google Scholar] [CrossRef]
- Araújo Neto, J.F.; Brito Barreto, S.; Carrino, T.A.; Müller, A.; Lira Santos, L.C.M. Mineralogical and Gemological Characterization of Emerald Crystals from Paraná Deposit, NE Brazil: A Study of Mineral Chemistry, Absorption and Reflectance Spectroscopy and Thermal Analysis. Braz. J. Geol. 2019, 49, 684–698. [Google Scholar] [CrossRef] [Green Version]
- Buzgar, N.; Apopei, A.I.; Diaconu, V.; Buzatu, A. The Composition and Source of the Raw Material of Two Stone Axes of Late Bronze Age from Neamț County (Romania)—A Raman Study. An. Stiintifice Ale Univ. “Al. I. Cuza” Din Iasi AUI Ser. Geol. 2013, 59, 5–22. [Google Scholar]
- Bersani, D.; Aliatis, I.; Tribaudino, M.; Mantovani, L.; Benisek, A.; Carpenter, M.A.; Gatta, G.D.; Lottici, P.P. Plagioclase Composition by Raman Spectroscopy. J. Raman Spectrosc. 2018, 49, 684–698. [Google Scholar] [CrossRef]
- Sharma, S.K.; Misra, A.K.; Ismail, S.; Singh, U.N. Remote Raman Spectroscopy of Various Mixed and Composite Mineral Phases at 7.2 m Distance. In Proceedings of the 37th Lunar and Planetary Science Conference, League City, TX, USA, 13–17 March 2006. [Google Scholar]
- Wang, A.; Freeman, J.; Jolliff, B.L. Understanding the Raman Spectral Features of Phyllosilicates. J. Raman Spectrosc. 2015, 46, 829–845. [Google Scholar] [CrossRef]
- McKeown, D.A.; Bell, M.I.; Etz, E.S. Raman Spectra and Vibrational Analysis of the Trioctahedral Mica Phlogopite. Am. Minerol. 1999, 84, 970–976. [Google Scholar] [CrossRef]
- Tlili, A.; Smith, D.C.; Beny, J.M.; Boyer, H. A Raman Microprobe Study of Natural Micas. Mineral. Mag. 1989, 53, 165–179. [Google Scholar] [CrossRef] [Green Version]
- Schwarz, D.; Giuliani, G. Emerald Deposits-A Review. Aust. Gemmol. 2001, 21, 17–23. [Google Scholar]
- Giuliani, G.; Chaussidon, M.; Schubnel, H.-J.; Piat, D.H.; Rollion-Bard, C.; Rrance-Lanord, C.; Giard, D.; de Narvaez, D.; Rondeau, B. Oxygen Isotopes and Emerald Trade Routes Since Antiquity. Science 2000, 287, 631–633. [Google Scholar] [CrossRef] [PubMed] [Green Version]
- Calligaro, T.; Dran, J.-C.; Poirot, J.-P.; Querre, G.; Salomon, J.; Zwaan, J.C. PIXE/PIGE Characterization of Emeralds Using an External Micro-Beam. Nucl. Instrum. Methods Phys. Res. Sect. B Beam Interact. Mater. At. 2000, 161–163, 769–774. [Google Scholar] [CrossRef]
- Schmetzer, K. History of Emerald Mining in the Habachtal Deposit of Austria, Part II. Gems Gemol. 2022, 58, 18–46. [Google Scholar] [CrossRef]


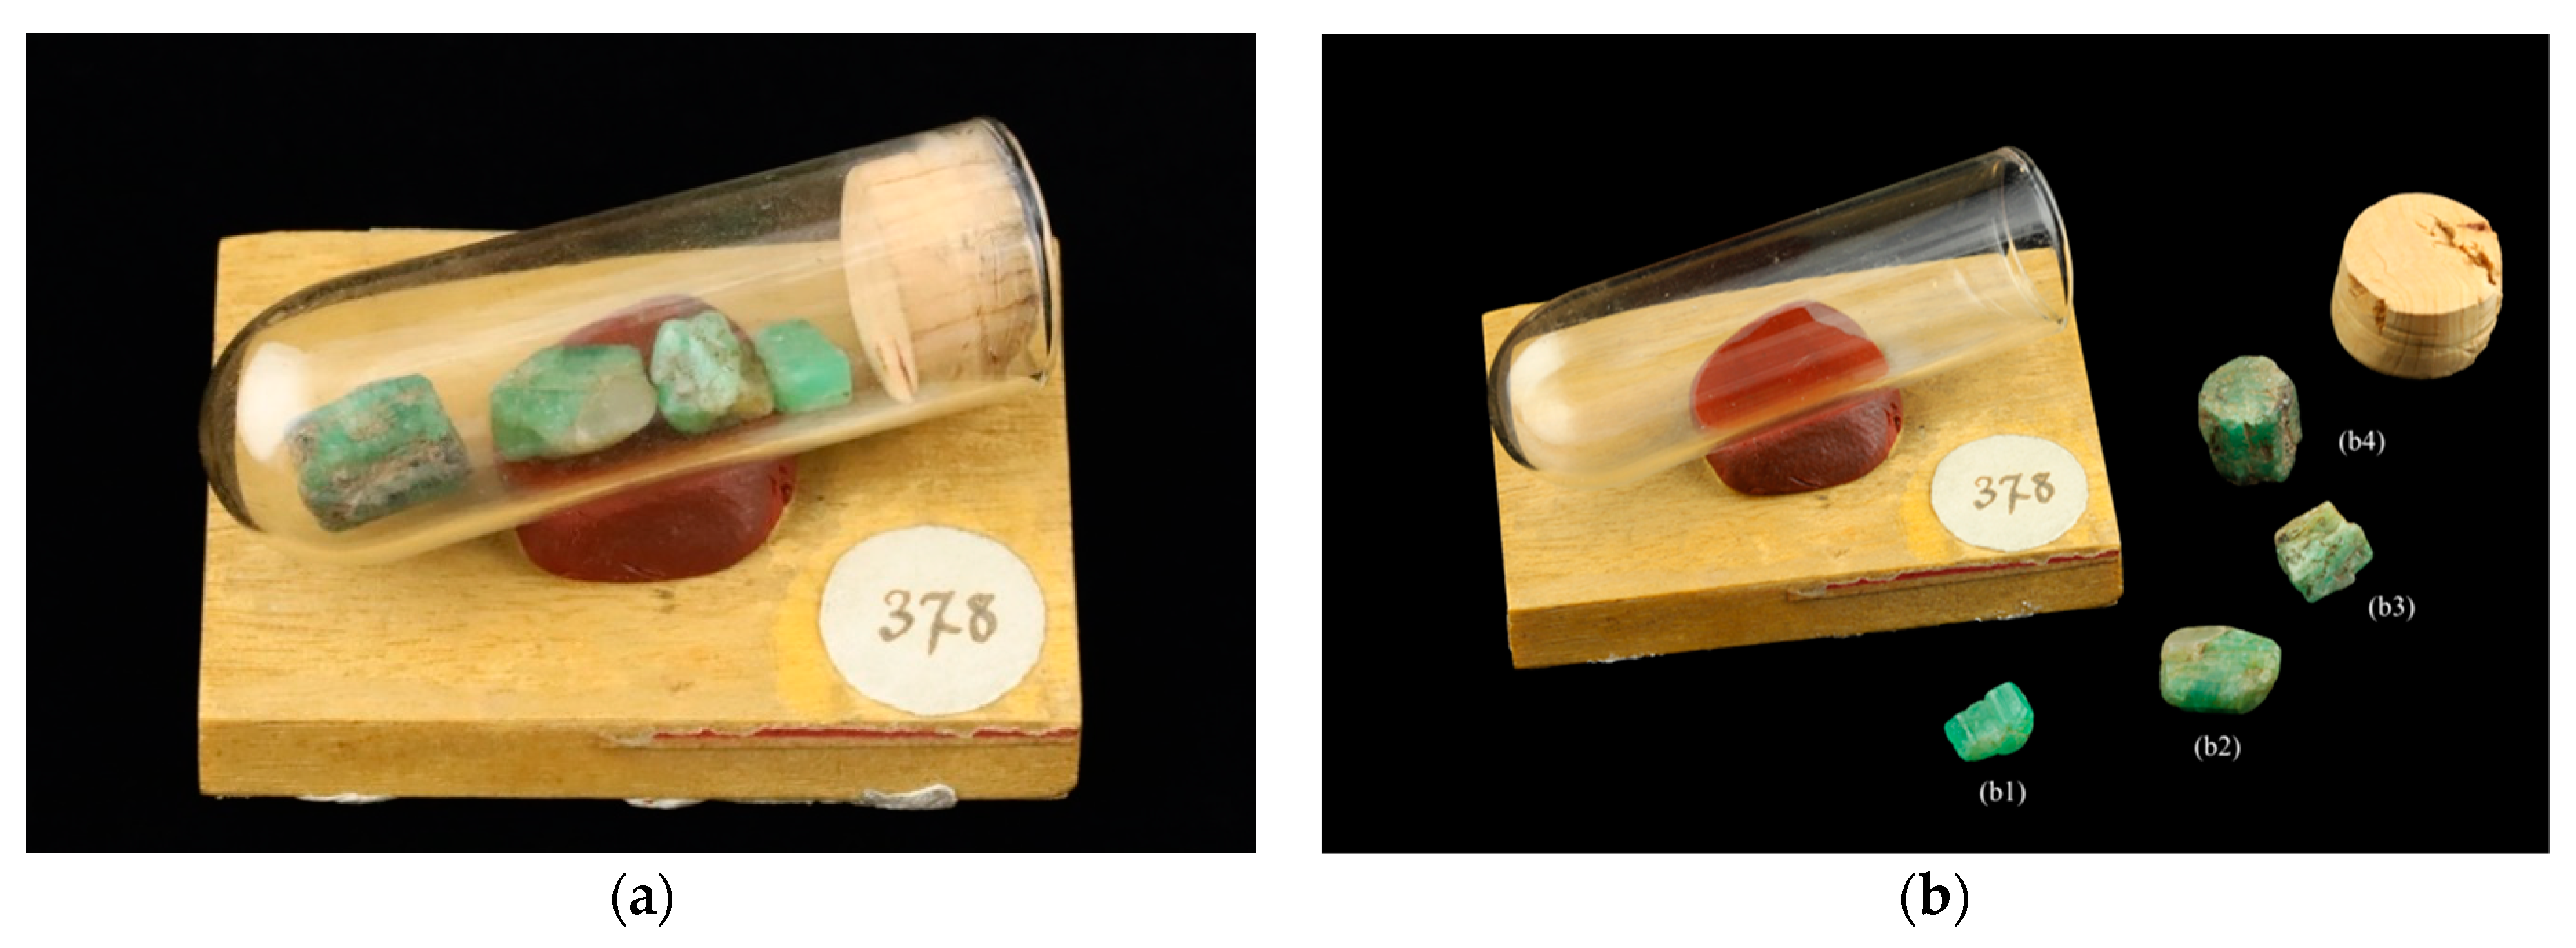
| No. | Donor’s Name | Wt. (Ct.) | Dimensions (mm) | Density | Color | Shape | Observations |
|---|---|---|---|---|---|---|---|
| ENSMP 72466_01 | Emile Bertrand | 1.002 | 7.25 × 3.73 × 4.33 | 2.71 | Vivid green | Rough | Translucent RI: 1.57-1.58 LWUV-SWUV: Inert |
| ENSMP 72466_02 | Emile Bertrand | 2.038 | 7.29 × 5.43 × 5.55 | 2.63 | Vivid green | Rough | Translucent LWUV-SWUV: Inert |
| ENSMP 72466_03 | Emile Bertrand | 3.154 | 9.94 × 5.69 × 7.38 | 2.71 | Vivid bluish-green | Rough | Translucent LWUV-SWUV: Inert |
| ENSMP 72466_04 | Emile Bertrand | 5.392 | 10 × 7.98 × 8.32 | 2.77 | Vivid bluish-green | Rough | Translucent RI: 1.58 LWUV-SWUV: Inert |
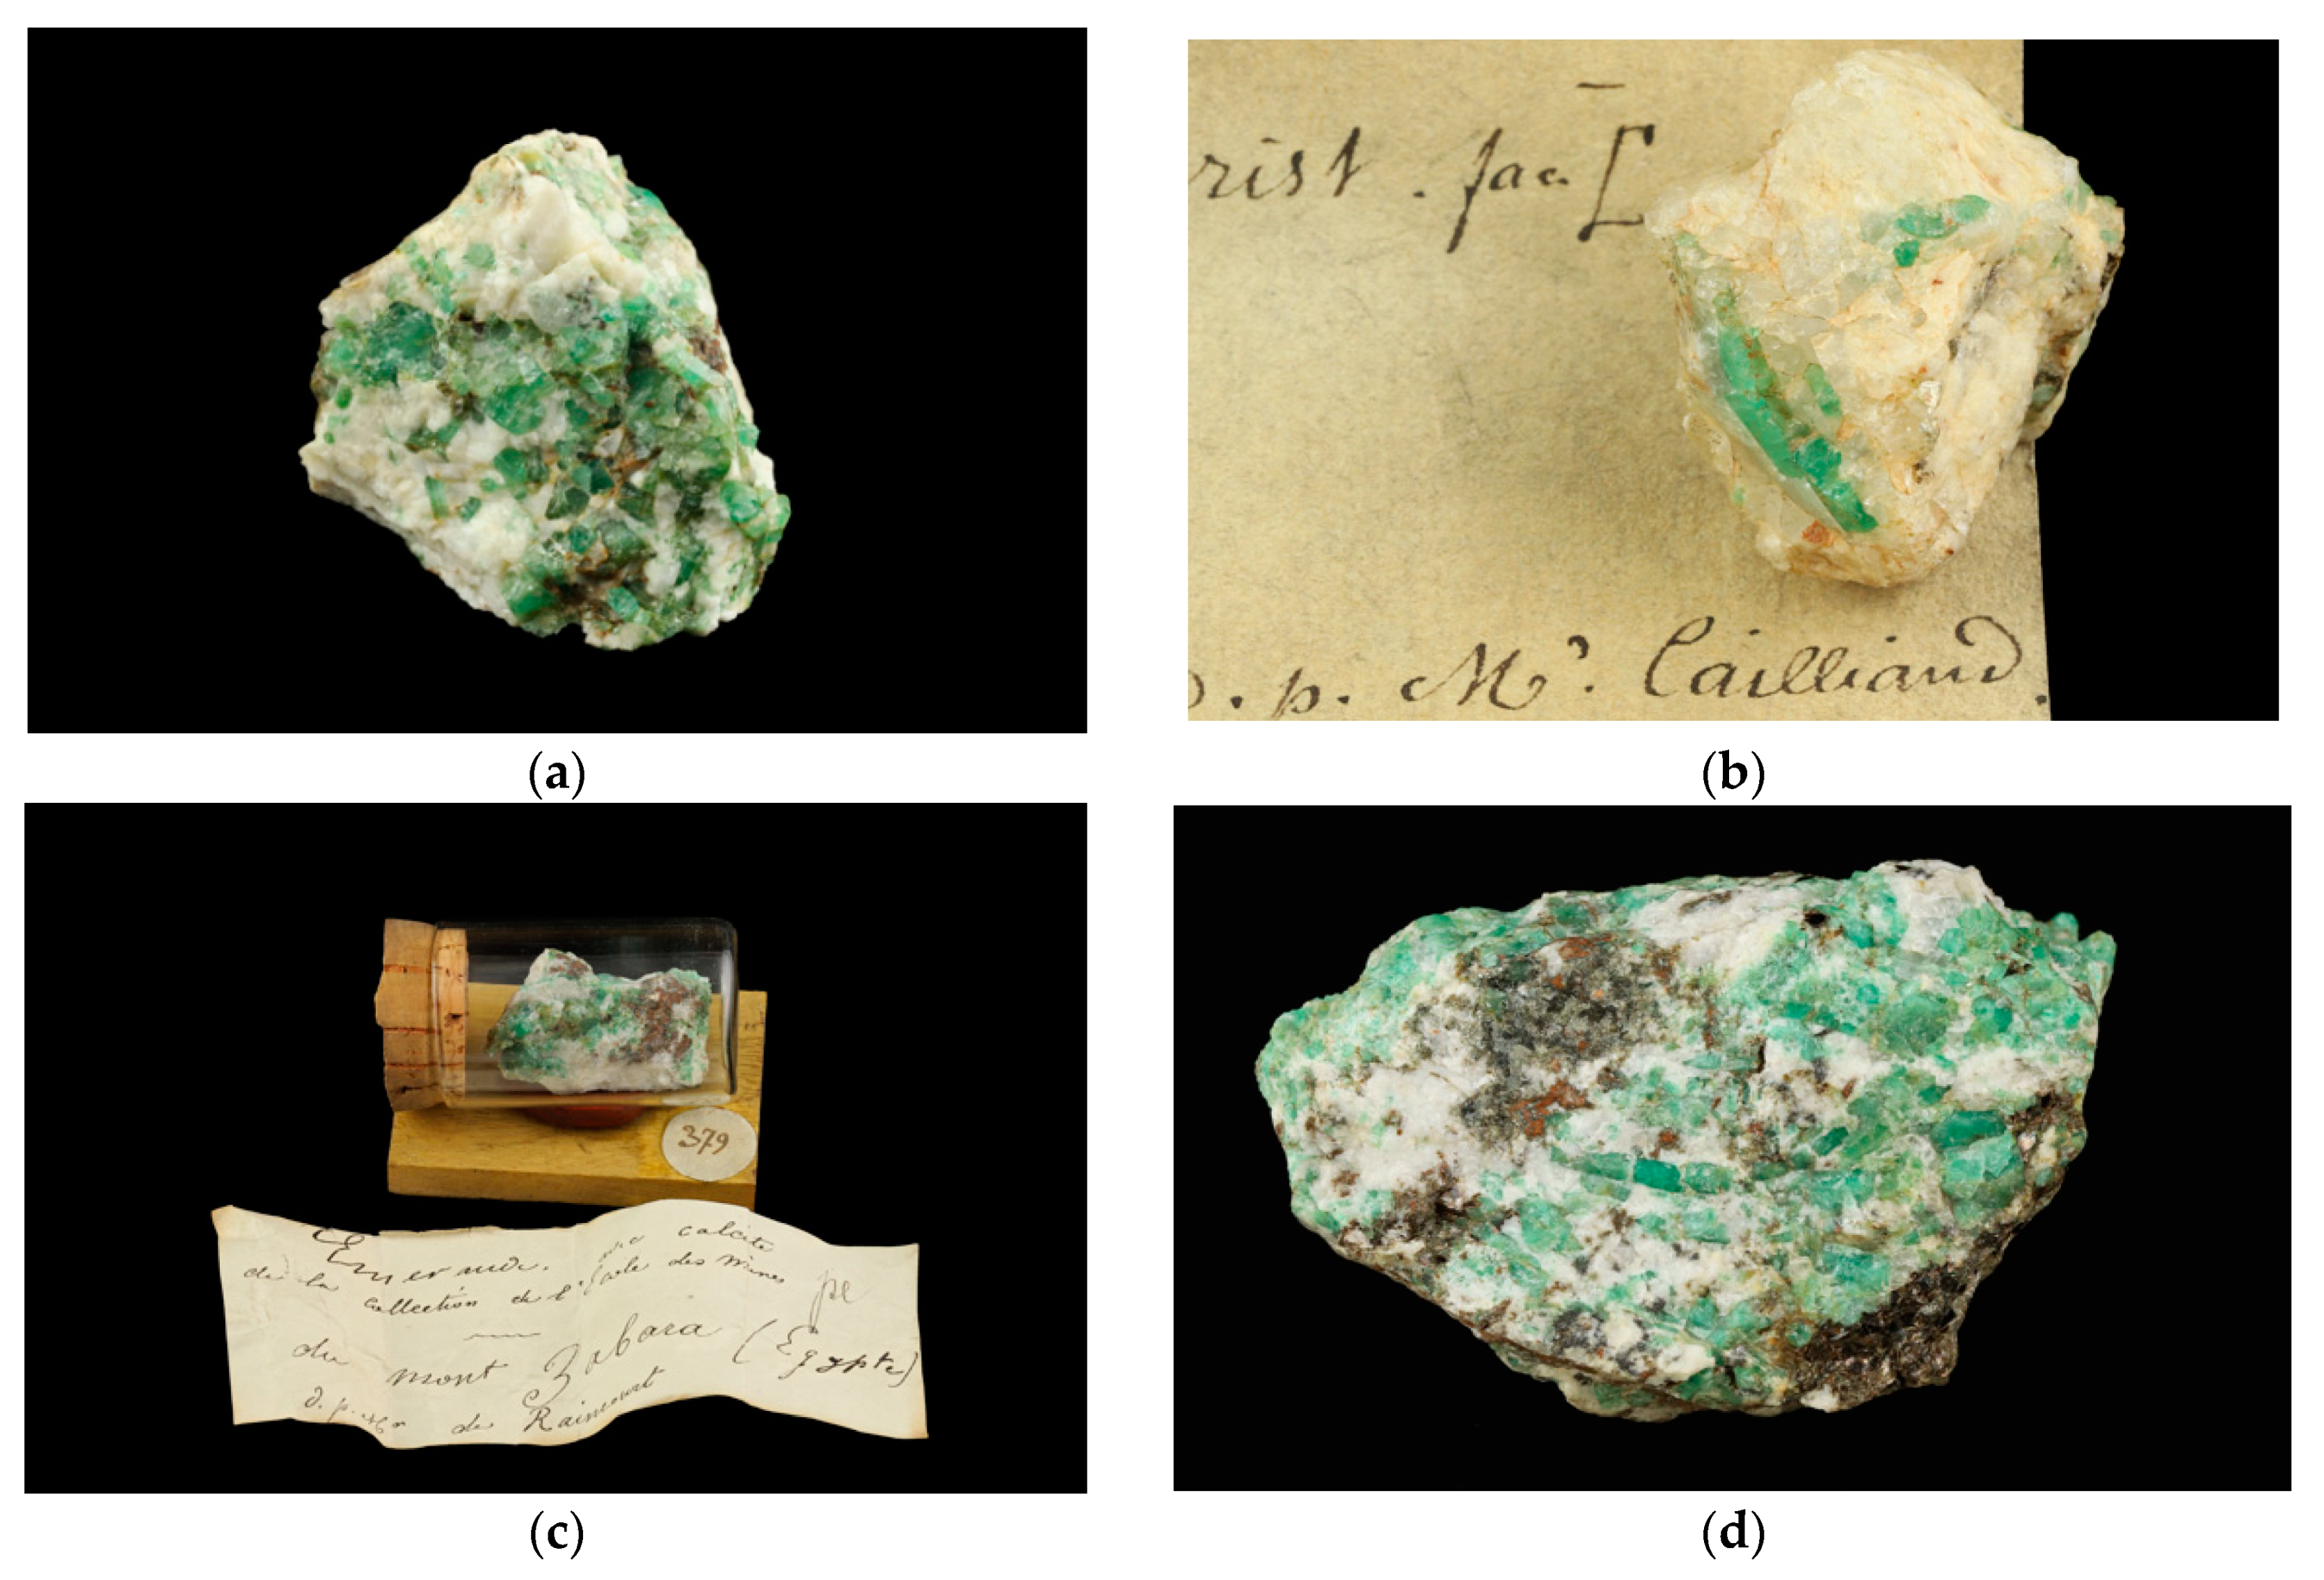
| ENSMP 47849a26 | Marquis de Raincourt | - | 34.66 × 29.23 × 30.76 | - | Vivid green crystals | Crystals in host rock | Translucent LWUV-SWUV: Inert |
| ENSMP 47849a27 | Frédéric Cailliaud | - | 25.93 × 22.74 × 24.52 | - | Vivid green crystals | Crystals in host rock | Translucent LWUV-SWUV: Inert |
| ENSMP 72486 | Marquis de Raincourt | - | 31.83 × 16.83 × 21.50 | - | Vivid bluish-green crystals | Crystals in host rock | Translucent LWUV-SWUV: Inert |
| ENSMP 13512_5 | Marquis de Raincourt | - | 85.6 × 57.53 × 50.08 | - | Vivid bluish-green crystals | Crystals in host rock | Translucent LWUV-SWUV: Inert |
| Sample No. | FWHM of Band 1069 cm−1 | R1/Rn |
|---|---|---|
| ENSMP 72466_01 | 24.5 | 0.41 |
| ENSMP 72466_02 | 27 | 0.43 |
| ENSMP 72466_03 | 26 | 0.35 |
| ENSMP 72466_04 | 24.5 | 0.43 |
| ENSMP 13512_5 | 24.5 | 0.45 |
| ENSMP 47849a26 | 23 | 0.51 |
| ENSMP 47849a27 | 24.5 | 0.43 |
| ENSMP 72486 | 23.5 | 0.36 |
| Samples | ENSMP 72466_01 (No. of Analysis: 3) | ENSMP 72466_02 (No. of Analysis: 4) | ENSMP 72466_03 (No. of Analysis: 4) | ENSMP 72466_04 (No. of Analysis: 3) | ||||
|---|---|---|---|---|---|---|---|---|
| Oxides | Min–Max Range | Average | Min–Max Range | Average | Min–Max Range | Average | Min–Max Range | Average |
| V2O3 | 303–665 | 551.7 | 303–563 | 436 | 284–414 | 320.7 | 172–344 | 257.3 |
| Cr2O3 | 811–1202 | 1007.8 | 941–1735 | 1293.4 | 512–1000 | 715.8 | 1244–2228 | 1474.8 |
| FeO | 5018–13,348 | 7676.7 | 8909–14,057 | 11,700.3 | 8168–12,871 | 9797.3 | 10,577–19,791 | 16,233.7 |
| Rb2O | 11–19 | 15.3 | 22–31 | 25 | 37–84 | 61 | 23–42 | 32.5 |
| Samples | ENSMP 47849a26 (No. of Analysis: 3) | ENSMP 72486 (No. of Analysis: 3) | ENSMP 47849a27 (No. of Analysis: 1) | ||
|---|---|---|---|---|---|
| Oxides | Min–Max Range | Average | Min–Max Range | Average | Results |
| V2O3 | 429–506 | 460 | 408–475 | 438 | 397.3 |
| Cr2O3 | 1568–2315 | 1935 | 1788–2120 | 1996 | 1873 |
| FeO | 2782–10,548 | 7296.7 | 11,277–12,052 | 11,710 | 7139 |
| Rb2O | 25–53 | 36.6 | 48–63 | 54.3 | 10 |
Disclaimer/Publisher’s Note: The statements, opinions and data contained in all publications are solely those of the individual author(s) and contributor(s) and not of MDPI and/or the editor(s). MDPI and/or the editor(s) disclaim responsibility for any injury to people or property resulting from any ideas, methods, instructions or products referred to in the content. |
© 2023 by the authors. Licensee MDPI, Basel, Switzerland. This article is an open access article distributed under the terms and conditions of the Creative Commons Attribution (CC BY) license (https://creativecommons.org/licenses/by/4.0/).
Share and Cite
Nikopoulou, M.; Karampelas, S.; Gaillou, E.; Hennebois, U.; Maouche, F.; Herreweghe, A.; Papadopoulou, L.; Melfos, V.; Kantiranis, N.; Nectoux, D.; et al. Non-Destructive Study of Egyptian Emeralds Preserved in the Collection of the Museum of the Ecole des Mines. Minerals 2023, 13, 158. https://doi.org/10.3390/min13020158
Nikopoulou M, Karampelas S, Gaillou E, Hennebois U, Maouche F, Herreweghe A, Papadopoulou L, Melfos V, Kantiranis N, Nectoux D, et al. Non-Destructive Study of Egyptian Emeralds Preserved in the Collection of the Museum of the Ecole des Mines. Minerals. 2023; 13(2):158. https://doi.org/10.3390/min13020158
Chicago/Turabian StyleNikopoulou, Maria, Stefanos Karampelas, Eloïse Gaillou, Ugo Hennebois, Farida Maouche, Annabelle Herreweghe, Lambrini Papadopoulou, Vasilios Melfos, Nikolaos Kantiranis, Didier Nectoux, and et al. 2023. "Non-Destructive Study of Egyptian Emeralds Preserved in the Collection of the Museum of the Ecole des Mines" Minerals 13, no. 2: 158. https://doi.org/10.3390/min13020158