Article

Characteristics and Controlling Factors of Pores in Different Shale Lithofacies Reservoirs of Lower Cambrian Qiongzhusi Formation, Southwestern Sichuan Basin, China

1
State Key Laboratory of Petroleum Resources and Prospecting, China University of Petroleum, Beijing 102200, China
2
College of Geosciences, China University of Petroleum, Beijing 102200, China
*
Author to whom correspondence should be addressed.
Minerals 2023, 13(11), 1442; https://doi.org/10.3390/min13111442
Submission received: 4 October 2023 / Revised: 8 November 2023 / Accepted: 10 November 2023 / Published: 15 November 2023

Abstract

:
The shale reservoirs of the Lower Cambrian Qiongzhusi Formation are widely distributed in the Sichuan Basin and have abundant gas resources. However, the shale lithofacies of the Qiongzhusi Formation are complex due to frequent sea level changes. The reservoir pore structure characteristics and gas content of different shale lithofacies vary significantly, which makes identifying the ‘sweet spot’ a challenging task. In this study, core observation and X-ray diffraction (XRD) were used to analyze the lithofacies types and characteristics of the study area. The pore types of different shale lithofacies were observed using field emission-scanning electron microscopy. Pore structures were studied using low-temperature gas (including N2 and CO2) physisorption, and the pore volume (PV), specific surface area (SSA) and pore structure were systematically characterized. The primary factors influencing pore formation in different types of shale lithofacies were analyzed by combining geochemical experiments and mineral contents. The results indicate that the lithofacies of the Qiongzhusi Formation shale in the study area can be classified into five categories according to mineral compositions: Siliceous argillaceous shale (CM-1), Argillaceous siliceous mixed shale (M-2), Argillaceous siliceous shale (S-3), Siliceous rock (S) and Calcareous siliceous shale (S-2). Pores are abundant in S-3 shale, M-2 shale and CM-1 shale. The S-3 shale is more enriched in organic pores and clay mineral pores compared to other lithofacies shales, and the pore morphology is mainly wedge-shaped and plate-like. M-2 shale and CM-1 shale are rich in clay minerals and mainly develop clay mineral pores and are mainly wedge-shaped and plate-like. The S shale and S-2 shale mainly develop interparticle pores and clay mineral pores, which are mainly slit-like. The results show that TOC, pyrite content, quartz and feldspar mineral content, clay mineral type and content affect the pore structure in the study area. Quartz and feldspar content have a negative effect on micropore and mesopore volumes. TOCs have a weak positive correlation with micropore volume and micropore SSA. Clay mineral content has significant positive effects on the PV and SSA of micropores and mesopores, indicating that clay mineral content is the main factor affecting the pore structure of shale.

1. Introduction

Shale gas is an abundant unconventional energy source and has become a focal point in the field of oil and gas exploration and development in recent years. The United States, relying on the unconventional oil and gas revolution, significantly increased its domestic oil production, transitioning from an importer to an exporter of energy, achieving ‘energy independence’ [1,2,3]. In recent years, China’s research and development in shale gas have rapidly progressed, making it the second-largest producer of shale gas in the world [4]. Sichuan Basin is rich in shale gas resources and is a key area for shale gas exploration and development in China [5].
Different from conventional reservoirs, shale has self-contained source-reservoir systems with a complex pore structure [6,7]. Shale gas can be stored as free gas in intercrystalline pores and cracks, or as gas adsorbed on the surface of organic matter and clay minerals, and a small amount of dissolved shale gas dissolved in liquid hydrocarbons and water [8,9,10]. Previous studies have shown that the pores of rocks are the main places for shale gas storage, and the pore structure plays an important role in the reservoir of shale gas [11,12]. Therefore, it is essential to determine the volume and structure of shale pores to evaluate the shale reservoir. The size of the specific surface area of shale directly affects the reservoir capacity of adsorbed gas, and the size of the pore volume of shale directly affects the reservoir capacity of free gas [13,14]. The term pore size defined by the International Union of Pure and Applied Chemistry (IUPAC) is widely used in shale research: micropore (pore size < 2 nm), mesopore (2 nm pore size 50 nm) and macropore (pore size > 50 nm) [15]. Micropores have a large specific surface area, which plays an important role in shale adsorption. Mesopores also have a certain specific surface area, and mesopores and macropores provide the main pore volume [11].
The TOC, mineral composition and pore structure of shale are all obviously heterogeneous, which increases the difficulty of shale reservoir research. Lithofacies reflect different sedimentary environments and geological characteristics, and the differences in mineral composition and organic matter content of different lithofacies lead to different pore structure characteristics [16,17]. At present, different scholars have different classification schemes for shale lithofacies, and there are a variety of classification schemes. Shale lithofacies classification schemes widely used by scholars fall into three categories: (1) lithofacies classification according to the structure and sedimentary characteristics of shale; (2) lithofacies classification according to the mineral composition of shale; (3) lithofacies classification according to the paleontological assemblage [18,19,20]. Previous studies have found that the mineral types, organic matter and thermal maturity of rocks are the main factors affecting pore structure. TOC content is an important factor controlling the development of micropores. Organic matter in mature shale forms a large number of micropores, which have a larger specific surface area [21]. Rigid particles such as siliceous minerals and pyrite can inhibit compaction and protect pores [22]. The type and content of clay minerals can affect the specific surface area and pore volume of the reservoir. Clay minerals in shale have a larger specific surface area and pore volume. Illite and montmorillonite have large specific surface area [11,23]. Annular chlorite can protect pores, while pore-filling chlorite can block pores and lead to poor physical properties [24].
The Lower Cambrian Qiongzhusi Formation in southwest Sichuan has a rapid change in sea level, developed multiple lithofacies, strong heterogeneity, and the pore structure characteristics between different lithofacies are quite different [25]. Therefore, it is of great significance to analyze the pore structure of different lithofacies in the Qiongzhusi Formation for evaluating shale reservoirs and finding sweet spots. The pore characteristics of the Qiongzhusi Formation shale reservoir were studied by predecessors [26,27]. However, these studies mainly focus on characterizing pore structure and studying the factors controlling the development of pore structure, but they rarely analyze the differences in pore structure between different lithofacies. At present, the difference in pore structure and the controlling factors of pore difference development in different shale reservoirs of Qiongzhusi Formation in southwest Sichuan are not clear. Therefore, it is of great significance to analyze the pore structure of different lithofacies in the Qiongzhusi Formation for evaluating shale reservoirs and finding sweet spots.
In this study, we performed a pore structure analysis of shale samples from the Qiongzhusi Formation in southwestern Sichuan Basin. The lithofacies of shale are divided according to mineral composition. On this basis, the pore size distribution and pore structure of different lithofacies were analyzed by mercury injection and low-pressure gas (CO2 and N2) adsorption measurement. The factors affecting the development of pore structure were analyzed combined with the mineral composition and organic matter characteristics. This paper provides important insights and evaluation for the study of shale gas enrichment mechanism.

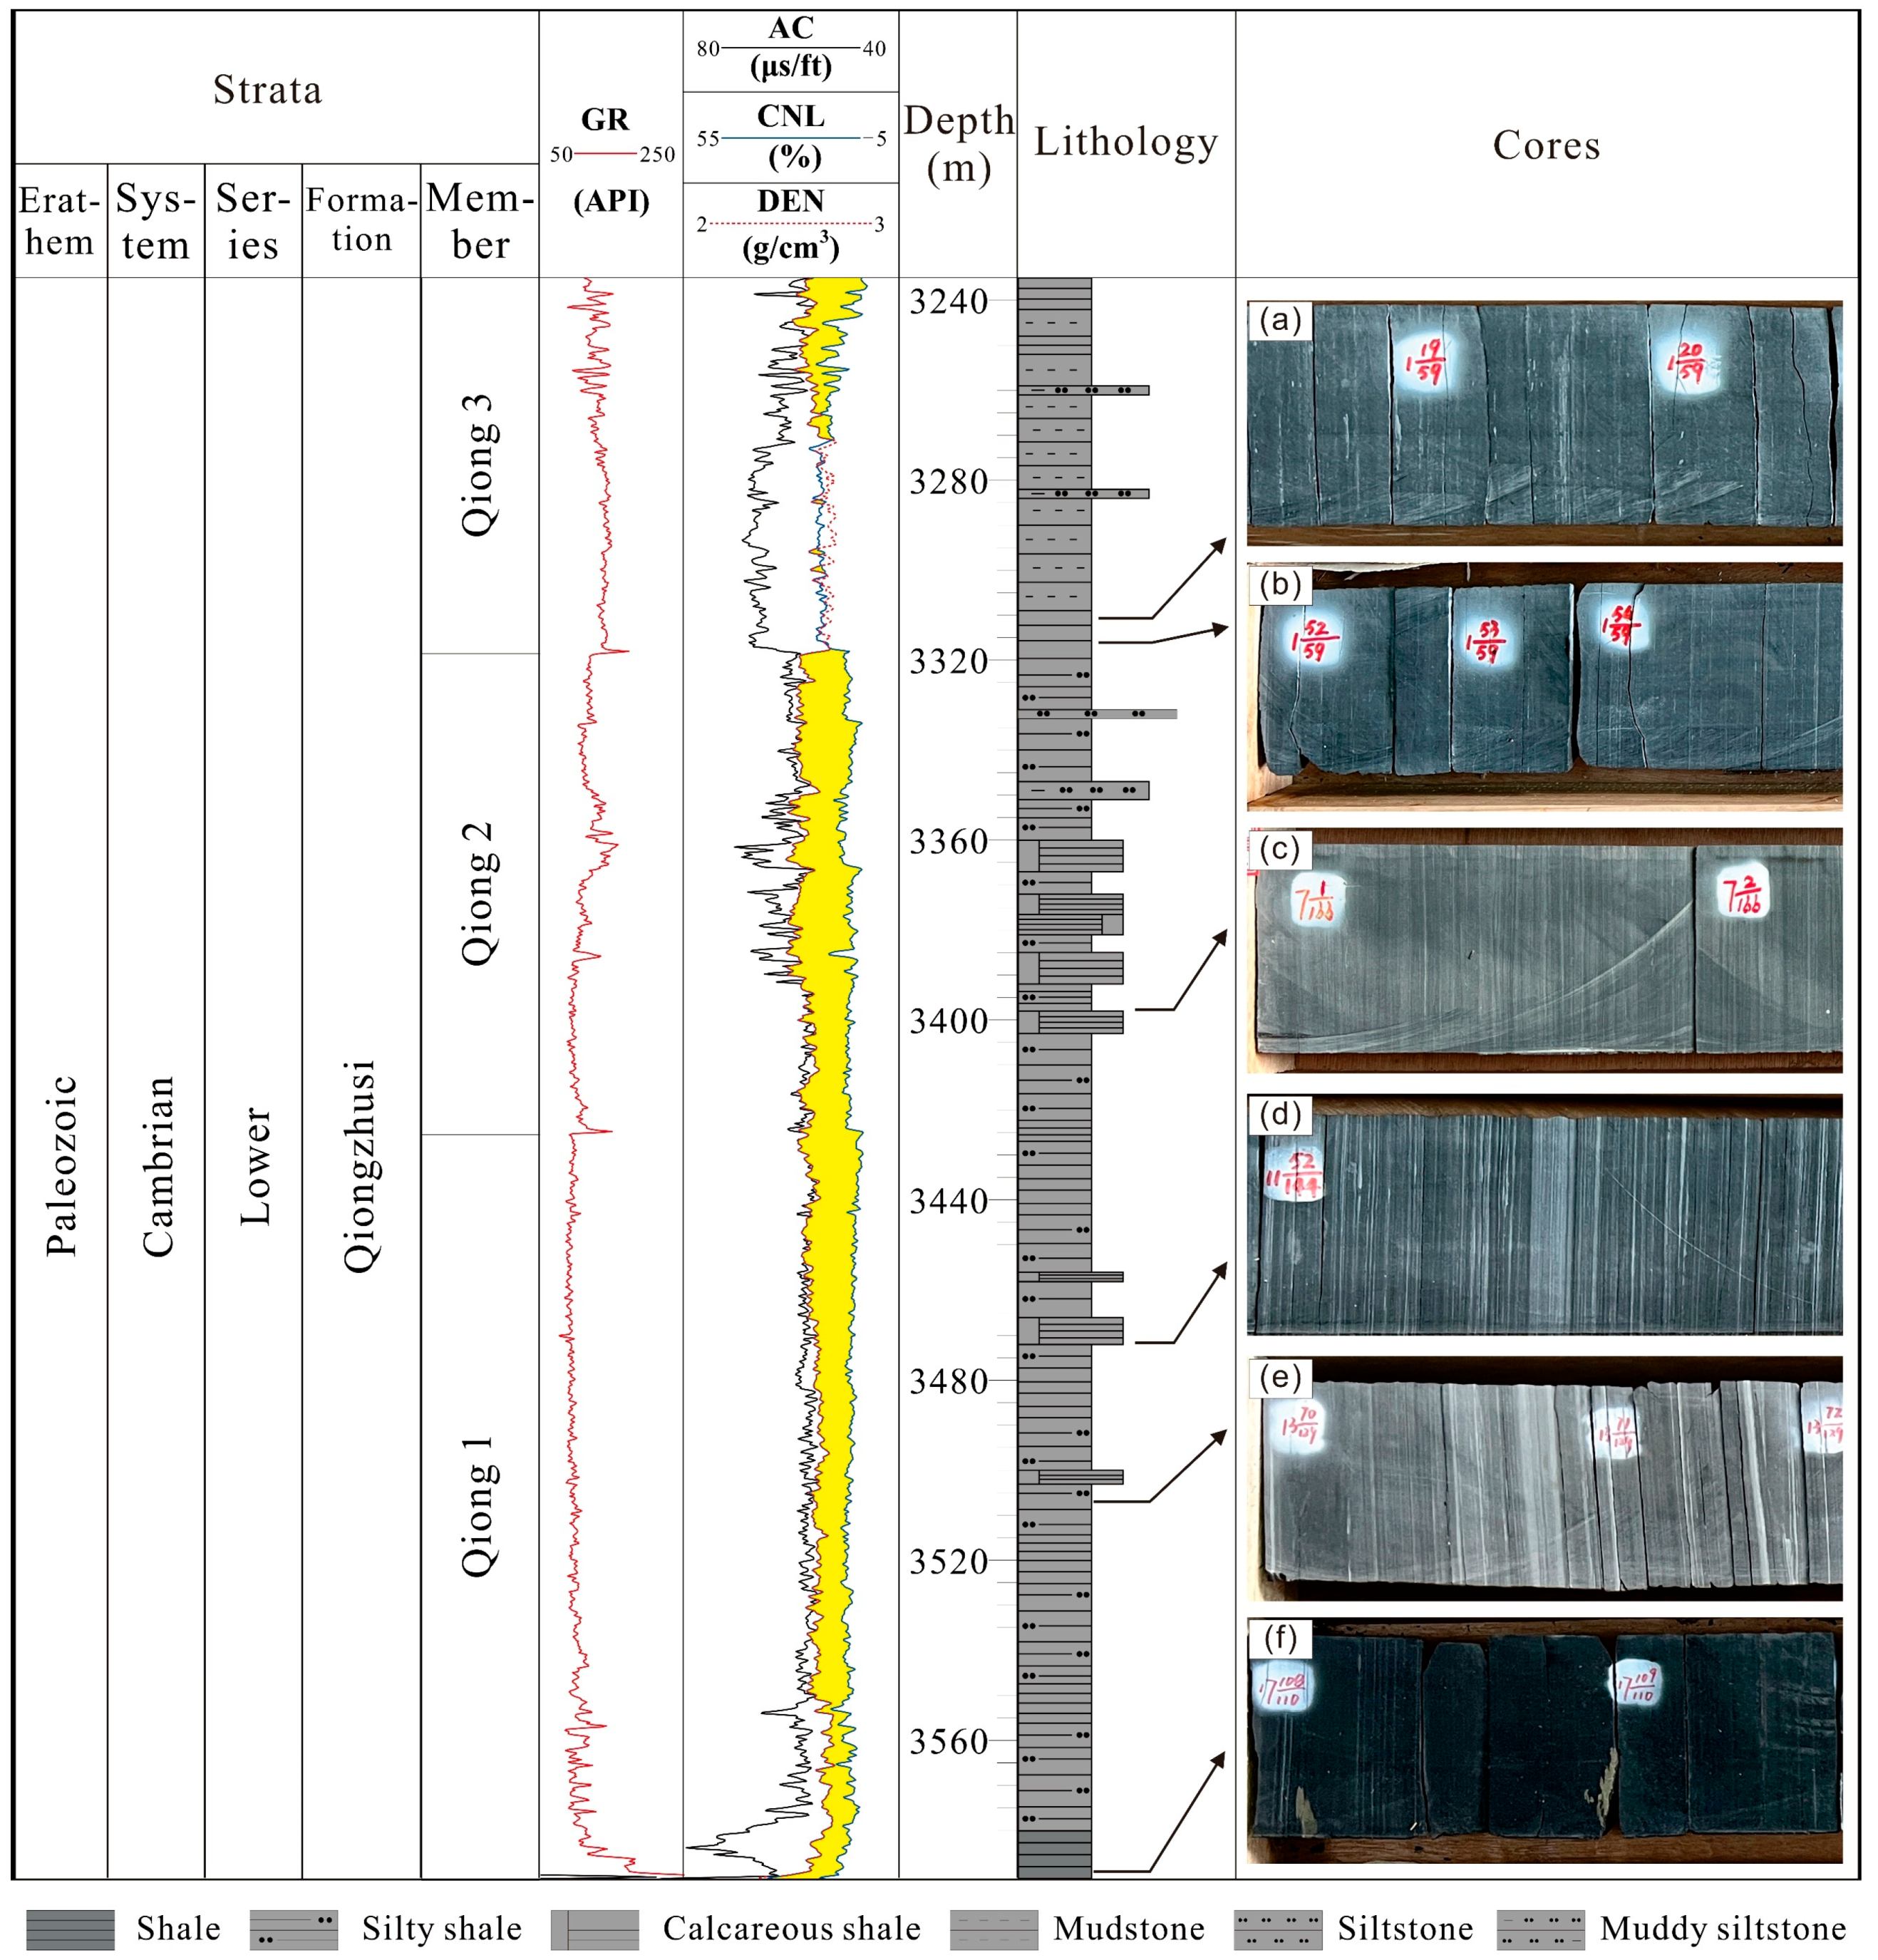
2. Geological Setting

The Sichuan Basin, located in the southwest of China, is a northeast southwest trending diamond-shaped basin with a total area of about 1.8 × 10⁴ km2 [28,29]. The Sichuan Basin is rich in natural gas resources, with shale gas resources exceeding 4.0 × 10¹² m3, which is currently the largest gas-producing area in China [30]. It is structurally bounded by the Qiyao Mountains in the east, the Longmen Mountains in the west, the Daliang Mountains in the south, and the Daba Mountains in the north (Figure 1a) [31]. The Sichuan basin is divided into six structural units based on the nature of the basement and hydrocarbon distribution, including the low gentle structural belt in northern Sichuan, gentle structural belt in central Sichuan, high steep structural belt in eastern Sichuan, low steep structural belt in western Sichuan, low steep structural belt in southern Sichuan, and low folded structural belt in southwestern Sichuan [32,33].
The Sichuan Basin has undergone several stages of tectonic movement, including the early Paleozoic craton depression stage, the late Paleozoic craton rift stage, and the Mesozoic–Cenozoic foreland depression stage [34,35]. The study area is a low folded structural belt in southwestern Sichuan, which is located in a passive continental margin with a stagnant and anaerobic marine sedimentary environment. The Lower Cambrian strata are widely distributed in the low steep structural belt in southern Sichuan, buried at a depth of 3000–7500 m, including the Maidiping Formation, the Qiongzhusi Formation, the Canglangpu Formation and the Longwangmiao Formation (Figure 1b) [36]. The organic rich shale of the Qiongzhusi formation is a typical Marine shale, which was formed during the sea level rise period in the early Cambrian, and was the main source rock of the Lower Cambrian oil and gas system in Sichuan Basin. According to previous studies, the shale gas in the Qiongzhusi Formation in the southwestern Sichuan basin derived from organic hydrocarbon generation in the local Qiongzhusi shale, and also migrated from the Qiongzhusi shale in the tensional trough [37]. The sedimentary environment of Qiongzhusi shale gradually changed from deep water environment to shallow water environment from bottom to top. The Qiongzhusi formation can be segmented into three members by the logging data and core observations. The lower member is deposited in a deep shelf sedimentary environment and is mainly composed of massive black shale, and it gradually transitions upward into dark-gray shale, intercalated with thin-layer siltstone (Figure 2d–f). The middle member is dominated by dark-gray silty shale, intercalated with thin-layer siltstone with horizontal bedding, which indicates a shallow shelf environment (Figure 2c). The upper member is composed of dark-gray silty shale and gradually transitions upward into gray silty shale and gray shale with horizontal bedding, which indicates a shallow shelf environment (Figure 2a,b). Three sets of organic-rich shale were located at the bottom of each member.

3. Samples and Methods

3.1. Samples

A total of 55 samples of Qiongzhusi Formation were obtained from three wells, including L4, W1 and C1 in Southwest Sichuan Basin, Figure 1. Thirty-one samples were collected in the L4 core, eight samples were from C1 well, and sixteen samples were from W1 well. All analytical experiments were conducted at the SINOPEC East China Oil & Gas Company Experimental Research Center.

3.2. Analytical Methods

In this paper, the mineral composition of the Qiongzhusi Formation shale was analyzed by XRD, and the TOC characteristics were analyzed by geochemical experiments. The lithofacies of the Qiongzhusi Formation were divided according to the mineral composition. The pore structure characteristics of different lithofacies of the Qiongzhusi Formation were analyzed by using integrated field emission scanning electron microscopy (FE-SEM), X-ray diffraction (XRD), low-pressure gas (CO2 and N2) adsorption and mercury intrusion porosity measurement.

3.2.1. TOC and Minerals
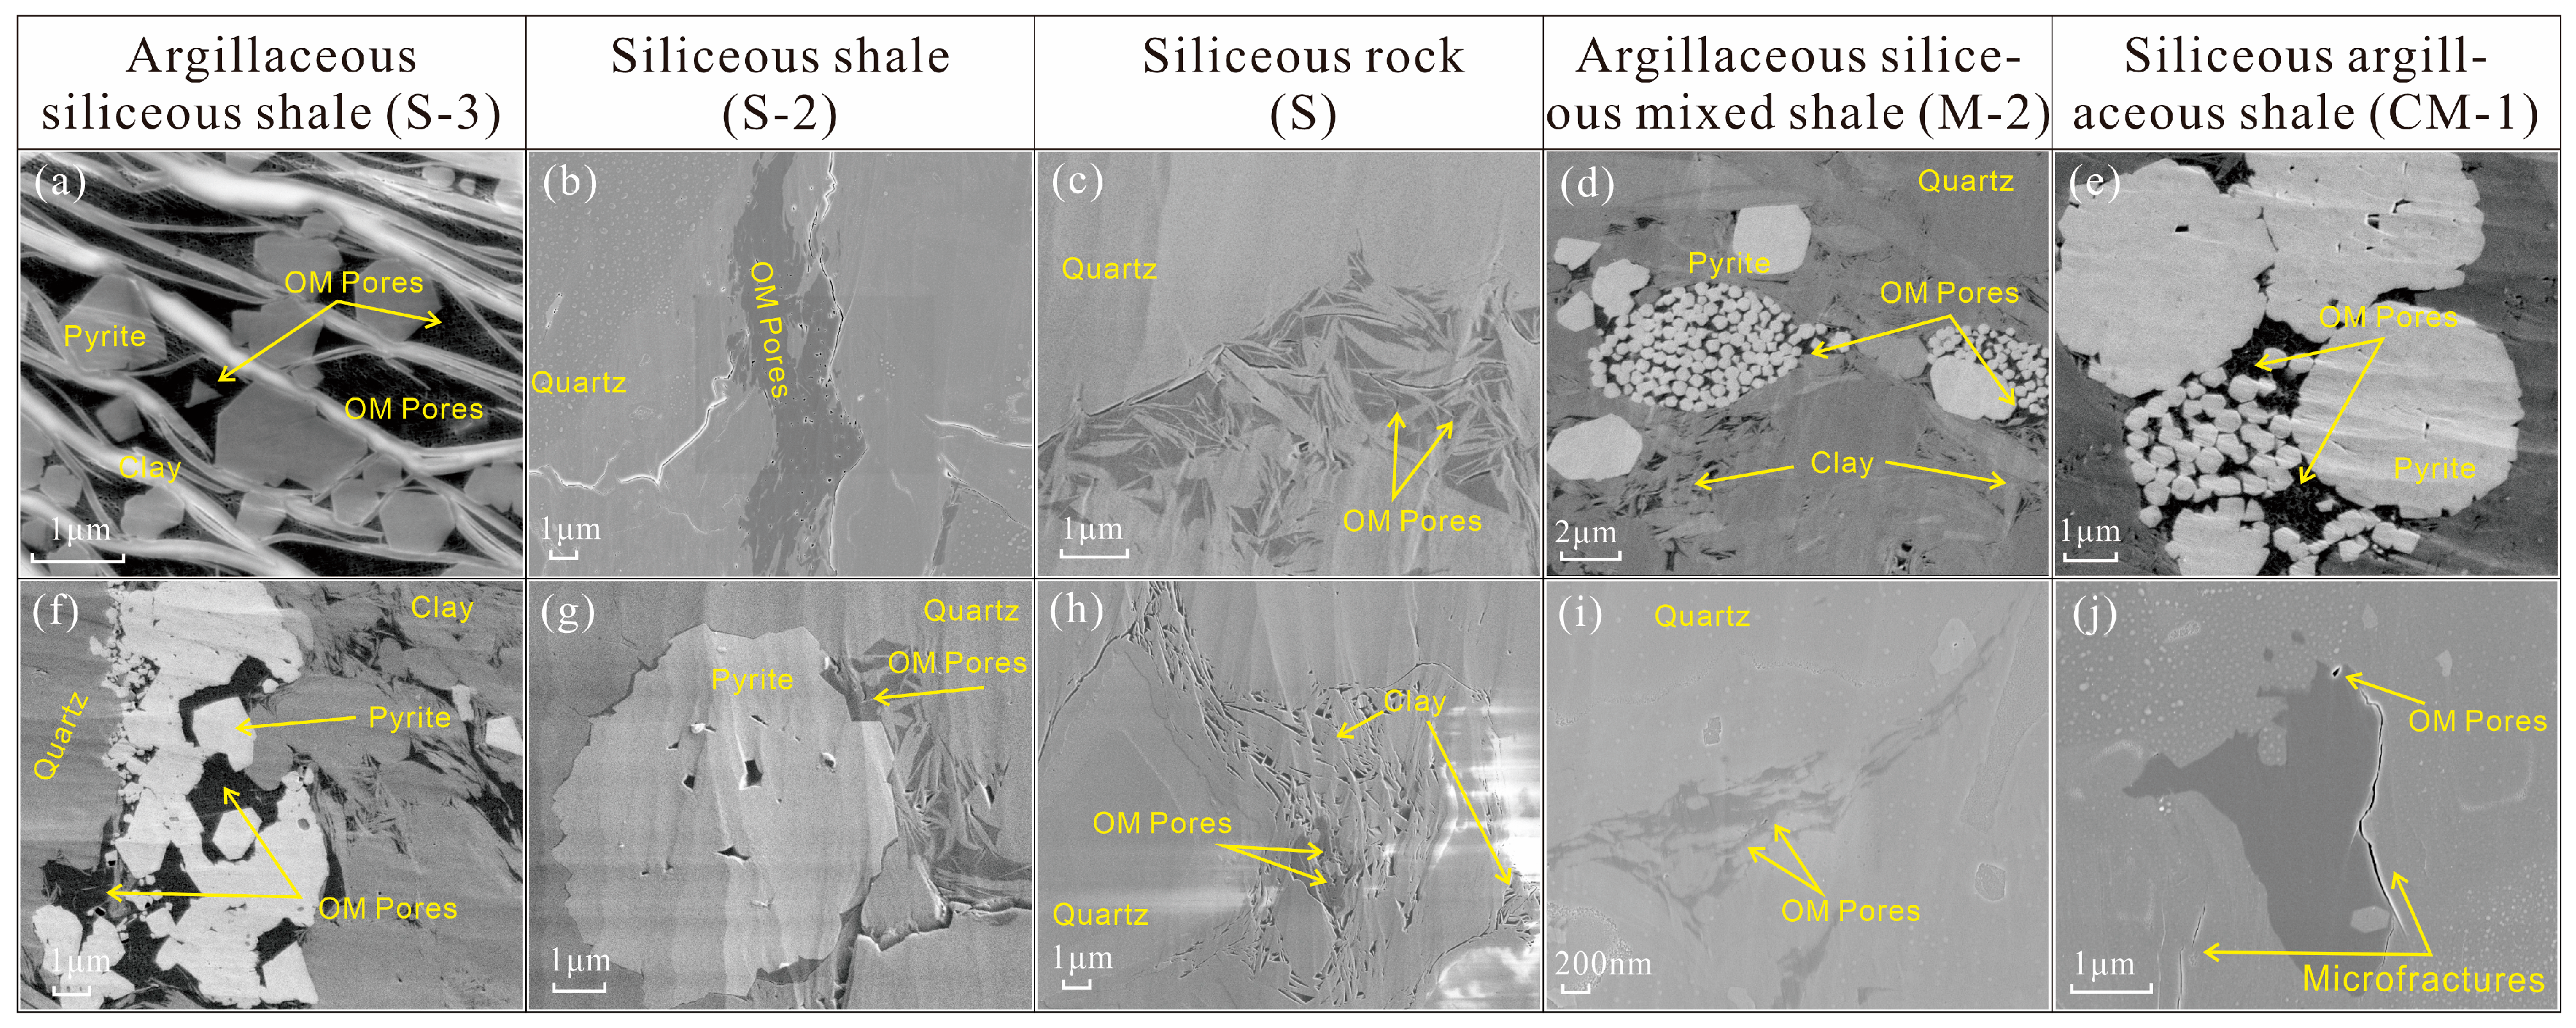
First, the sample was crushed in 200 mesh for the determination of TOC content and mineral composition. The TOC content was analyzed by a CS-230 carbon-sulfur analyzer, which is designed on the basis of the infrared absorption detection principle. The powder sample was treated with excess of 5% HCl to remove carbonate mineral. The sample was then burned under oxygen-rich conditions to burn the organic matter and release CO2, which were then transformed into the measurable signals using infrared spectroscopy.
The shale sample was crushed and ground to about 300 mesh. The shale samples’ mineralogical compositions were identified by X-ray diffraction on a diffractometer Rigaku Ultima IV in Cu-Kα radiation (λ = 0.154178 nm) using Soller slits.
Carbonate minerals and organic matter in shale were removed with 2% HCl and H2O2. After collecting the clay components (<2 μm) from the aqueous dispersion through disaggregation and ultrasonic dispersion, they were loaded onto a glass slide to form a 20 mm × 20 mm area and then air-dried. After saturation in ethylene glycol vapor (at around 40 °C for 7 h), the glass slide was identified by a Rigaku-Ultima-IV X-ray diffractometer, with Cu-Kα radiation, as a function of the 2θ angle (8 to 80°, with 0.02° step, and 5 s time per step). The clay mineral composition and content of shale samples were calculated based on the Chinese oil and gas industry standard SY/T 5163-2018 [38].

3.2.2. FE-SEM

The size and morphology of pores can be directly observed by field emission scanning electron microscopy (FE-SEM). Shale samples were observed by Zeiss SIGMA electron microscope combined with argon ion polishing technique. Finly grinding and argon ion polishing were applied on the surface of the shale sample, and spraying gold on the sample surface was applied to enhance electrical conductivity, which can significantly improve the quality of the image.

3.2.3. Polarizing Microscope

The laminated structure, grain size, morphology of mineral crystals and organic matter distribution of shale can be observed by polarizing microscope. In this experiment, Zeiss skopA.1 polarizing microscope was used to observe a thin section of shale samples from the Qiongzhusi Formation in southwest Sichuan.

3.2.4. Low-Pressure Gas Adsorption

Low-pressure nitrogen adsorption (LPNA) experiments can characterize the pore structure parameters of macroscopic pores (2~100 nm) in shale, and low-pressure CO2 adsorption experiments can characterize the pore structure characteristics of micropores (0~2 nm) in shale. In this study, the adsorption/desorption experiments of low-pressure N2/CO2 gas were conducted using the Micromeritics ASAP2020 analyzer. The sample powder was degassed for 12 h at 150 °C before the experiment. The density functional theory (DFT) was used to analyze the CO2 adsorption experiment results, and the pore structure parameters (PV, SSA, PSD, etc.) of shale micropores were obtained. The nitrogen adsorption experiment results were analyzed by using the Brunauer–Emmett–Teller (BET) equation and Barrett––Johner–Halenda (BJH) theory, and the pore size distribution, pore volume and specific surface area of mesopore and macropore were calculated.

3.2.5. Mercury-Intrusion Porosimetry

According to Chinese oil and gas industry standard (SY/T) 5346-2005 [39], the high-pressure mercury injection experiments were conducted using a porosimeter (Autopore IV 9520). Prior to testing, samples were treated to remove hydrocarbons and then dried to constant weight at 105 °C. The mercury was cleaned to ensure that it was free of mechanical impurities and oxide film. The core plug was placed into the penetrometer. A sealed penetrometer was inserted into the low-pressure port of the device, then the air was removed to inject the mercury. Next, the penetrometer filled with mercury was removed from the low-pressure port and weighed, and finally placed into the high-pressure port to inject mercury under stepwise applied pressure. The AutoPore IV 9520 software will automatically control degassing and intrusion and obtain high-pressure mercury injection capillary pressure data.

4. Results

4.1. Mineral and Organic Chemical Characteristics

The X-ray diffraction results show that the content of siliceous minerals in the shale of Qiongzhusi Formation is the highest, ranging from 31.3% to 80.8%, with an average of 58.03% (Appendix A, Table A1). Among the siliceous minerals, quartz is the most abundant, accounting for 22% to 57.7% of the total mineral content, with an average of 37.15%. Feldspar content ranges from 7.3% to 39.7%, with an average content of 20.87%. According to previous studies, the primary productivity of the Qiongzhusi shale in the southwestern Sichuan basin is at a low level. The quartz in the shale was mainly terrigenous and a small percentage was biogenic [40]. And the feldspar of the Qiongzhusi shale is also mainly terrigenous [41]. The calcareous mineral content is low, ranging from 3.2% to 24.5%, with an average content of 10.56%. The calcareous minerals of Qiongzhusi shale include calcite and dolomite. Among them, the calcite content is 1.3% to 21.3%, and the average content is 5.21%. The dolomite content is 1.9% to 14.1%, and the average content is 5.35%. A small amount of pyrite is developed in the shale of Qiongzhusi Formation, and the content ranges from 0.2% to 8.6%, with an average content of 2.31%. Clay minerals are abundant, ranging from 5.9% to 53.5%, with an average of 28.76%. The shale of Qiongzhusi Formation is in the high-over mature stage, and the kaolinite and smectite are transformed into illite and chlorite, so the shale contains almost no kaolinite and smectite. The clay minerals of Qiongzhusi Formation include mixed-layer I/S, illite and chlorite, with an average proportion of 29.04%, 34.58% and 36.37% relative to clay respectively (Appendix A, Table A2). The results show that TOC content in the shale ranges from 0.01% to 3.55%, with an average value of 0.432%.

4.2. Lithofacies Characteristics

Lithofacies can reflect the characteristics of the lithology, structure and fossils of the sedimentary environment. Different lithofacies reflect various sedimentary environments [42]. The shale lithofacies of the Qiongzhusi Formation are complex due to frequent sedimentary environment changes.
The mineral composition of the shale in different periods is obviously different due to the fact that the sea level of the Qiongzhusi Formation changes frequently. The siliceous mineral content of the Qiongzhusi Formation is the most abundant, which shows a trend of increasing first and then decreasing from bottom to top, followed by the clay mineral content, which decreases first and then increases from bottom to top. The classification of lithofacies by mineral components can reflect the lithological characteristics and sedimentary environment of shale, which is helpful for the study of the influence of rock mineral composition on the development of pore structure. Therefore, this study divides shale lithofacies according to the ternary system composed of siliceous minerals, calcareous minerals and clay minerals
The typical shale lithofacies classification scheme is based on siliceous minerals (quartz and feldspar), carbonate minerals, and clay minerals. Some scholars divide shale into four lithofacies based on the 50% threshold of each of these three mineral contents: (1) Argillaceous shales with clay mineral content greater than 50%. (2) Calcareous shale with calcium mineral content greater than 50%. (3) Siliceous shale with siliceous mineral content greater than 50%. (4) Mixed shale with each mineral content less than 50%, which means that it is mainly formed by the mixing of two or three minerals with similar contents. Based on the four types of shale lithofacies, some scholars further subdivided them into 16 types, with the boundaries of 25%, 50%, and 75% of mineral content. Among them, there are three types of lithofacies that are mainly composed of a single component with a single mineral content greater than 75%, which are named siliceous rock (silica content greater than 75%), mudstone (clay mineral content greater than 75%), and limestone (carbonate mineral content greater than 75%) [18,19,20]. In addition, there are 13 lithofacies, and the specific classification scheme is shown in Figure 3c. Due to the complex lithofacies in the Qiongzhusi Formation area, the four-category division cannot fully characterize the shale lithofacies of the Qiongzhusi Formation. Therefore, this article chooses to divide the Qiongzhusi Formation shale into 16 lithofacies based on mineral content (Figure 3c).
The lithofacies of the Qiongzhusi Formation shale in the study area was eventually classified into five categories according to mineral compositions: Siliceous argillaceous shale (CM-1), Argillaceous siliceous mixed shale (M-2), Argillaceous siliceous shale (S-3), Siliceous rock (S) and Calcareous siliceous shale (S-2) (Figure 3c). S-type shale is rich in siliceous minerals, with the content ranging from 74.5% to 80.8%, with an average of 76.35%. The siliceous mineral content of S-2 shale ranges from 56.2% to 74.8% with an average content of 43.04%, and the clay mineral content ranges from 7.5% to 24.4% with an average content of 18.66%. The siliceous mineral content of S-3 shale ranges from 53.3% to 66.9%, with an average content of 59.75%, and the clay mineral content ranges from 24.8% to 35.4%, with an average content of 28.25%. The clay mineral content of M-2 shale is high, the content range is 32.8% to 48.6%, the average content is 43.04%; the siliceous mineral content is 35.4% to 46.6%, the average content is 39.63%. The CM-1 shale is rich in clay minerals, the content range is 48.5% to 53.5%, the average content is 50.28%; the content of siliceous minerals is the least among the five lithofacies, the content range is 31.3% to 41%, and the average content is 36.26% (Figure 3b).
The TOC content of S-3 shale is the highest among the five lithofacies, ranging from 0.03% to 3.55%, with an average of 0.71%. This is followed by M-2 shale with an average TOC of 0.47%. The mean TOC values of both CM-1 and S-2 shales are 0.34%. S shale has the lowest TOC, ranging from 0.14% to 0.52%, with an average of 0.27% (Figure 3a,d).
By using a polarizing microscope to observe the thin sections of different lithofacies, it can be seen that the microscopic characteristics of different lithofacies shale have obvious differences. The grain size of S-3 shale is 0.01–0.08 mm, the content of quartz + feldspar is 60%–65%, and the organic matter is distributed in clusters (Figure 4a,f). The particle size of S-2 shale is 0.01–0.055 mm, the content of quartz + feldspar is 60%–65% (Figure 4b,g). The thin section shows that the particle size of S shale is 0.01–0.06 mm, the content of quartz + feldspar mineral is 75%–80%, and organic matter with band-like distribution can be observed locally (Figure 4c,h). M-2 shale grain size is between 0.01 and 0.044 mm, with clay mineral content of 45%–50%; organic matter in stellate-dispersed distribution can be observed (Figure 4d,i). CM-1 shale grain size is between 0.01 and 0.055 mm, clay mineral content is 50%–60%, and organic matter and pyrite in stellate dispersed distribution can be observed (Figure 4e,j).

4.3. Pore Characteristics

4.3.1. Organic Matter Pores (OM Pore)

The OM pore is an important part of shale pores in the Qiongzhusi Formation. Organic pores develop in the organic matter, which are mainly elliptical, irregular and honeycomb in shape [43]. The size of OM pores ranges from several nanometers to hundreds of nanometers.
The development of organic pores in different lithofacies has significant differences. The development of organic pores is related to the abundance of organic matter. The S-3 shale has high organic matter content and the most abundant organic pores (Figure 5a,f). Shale with high quartz content has strong compaction resistance, which is favorable to the preservation of organic pores. The S and S-2 lithofacies have low organic matter abundance, and organic pores are not enriched (Figure 5b,g,c,h). Organic pores are almost undeveloped in M-2 and CM-1 shales, which are low in siliceous minerals. Pyrite intergranular pores are filled with organic matter and organic pores are observed (Figure 5d,i,e,j).

4.3.2. Intergranular Pore

Intergranular pores are usually developed between quartz, feldspar, clay minerals and pyrite [44]. Argon ion polishing SEM observation results show that the intergranular pores in the study area are mainly clay mineral pores (CL pore) and pyrite pores. The clay mineral pores are mainly distributed between the clay mineral aggregates, with triangle or slit shapes (Figure 6a–e). They may be caused by the shrinkage of illite during diagenetic transformation into other minerals.
Some clay mineral pores are filled with organic matter or pyrite. The pore size and shape of clay mineral pores of shales with different lithofacies are obviously different. The clay mineral pores in CM-1 shale and M-2 shale are destroyed by compaction, and the pore size distribution is between 17 nm and 200 nm, with triangular shapes (Figure 6d,e). Clay mineral pores in S-3, S-2 and S-type shales are well protected, with pore width being several nanometers to hundreds of nanometers, and pore length being hundreds of nanometers to several microns (Figure 6a–c). Argon ion polishing SEM observation results show that intergranular pores are mainly developed in raspberry-like pyrite, with good connectivity, and the pore sizes are mainly distributed in the range of 50 nm and 300 nm (Figure 6f–j). Organic matter often develops in the intergranular pores of pyrite, which has a certain protective effect on the organic pores. The CM-1, M-2 and S-3 shales contain more pyrite and clay minerals, and the intergranular pores are enriched.

4.3.3. Intragranular Dissolution Pores (IntraGD Pore)

Dissolution pores are common in the shale of the Qiongzhusi Formation in southwest Sichuan. These pores are mainly formed by the dissolution of quartz, feldspar and carbonate minerals by organic acids produced during the thermal evolution of organic matter. The shape of the solution hole is generally irregular, and the pore size ranges from several nanometers to several hundred nanometers (Figure 6c).

4.3.4. Microfractures

The development of micro-fractures can increase permeability, improve the connectivity between pores, and enhance reservoir formation ability [45]. The microfractures in the study area are relatively developed, including shrinkage fractures, grain margin fractures, and clay mineral layered fractures (Figure 6k–o), and organic matter shrinkage fractures can be found locally. Microcracks generally develop along the edges of particles, with widths ranging from tens of nanometers to 200 nanometers.

4.4. Pore Structure

4.4.1. Characteristics of High-Pressure Mercury Injection

High-pressure mercury injection tests can determine the pore-throat parameters, connectivity and other information on rock in a reservoir. In this study, high-pressure mercury injection tests were conducted on shale samples with different lithofacies, and the pore volume distribution curves corresponding to different pore sizes were derived according to the test results. In the shale in the study area, macropores are the most developed, and pores above 10 microns account for a large proportion of the pore volume. The pore distribution of S-2 and S-type shales has an obvious double peak phenomenon, with pore size distributions ranging from 2 to 100 nm and from 10 to 100μm (Figure 7c,d). The primary peak pore size of CM-1 and M-2 lithofacies ranges from 50 to 100 nm, and a small peak pore size range from 2 to 10 nm (Figure 7a,b). The primary peak pore size of S-3 lithofacies shale ranges from 10 to 100 μm, with a small peak of 2 to 10 nm (Figure 7e). The S-2 and S shale has a wider pore range and more developed micropores than other lithofacies (Figure 7f), which may be caused by the better pore preservation conditions due to the higher content of siliceous minerals.

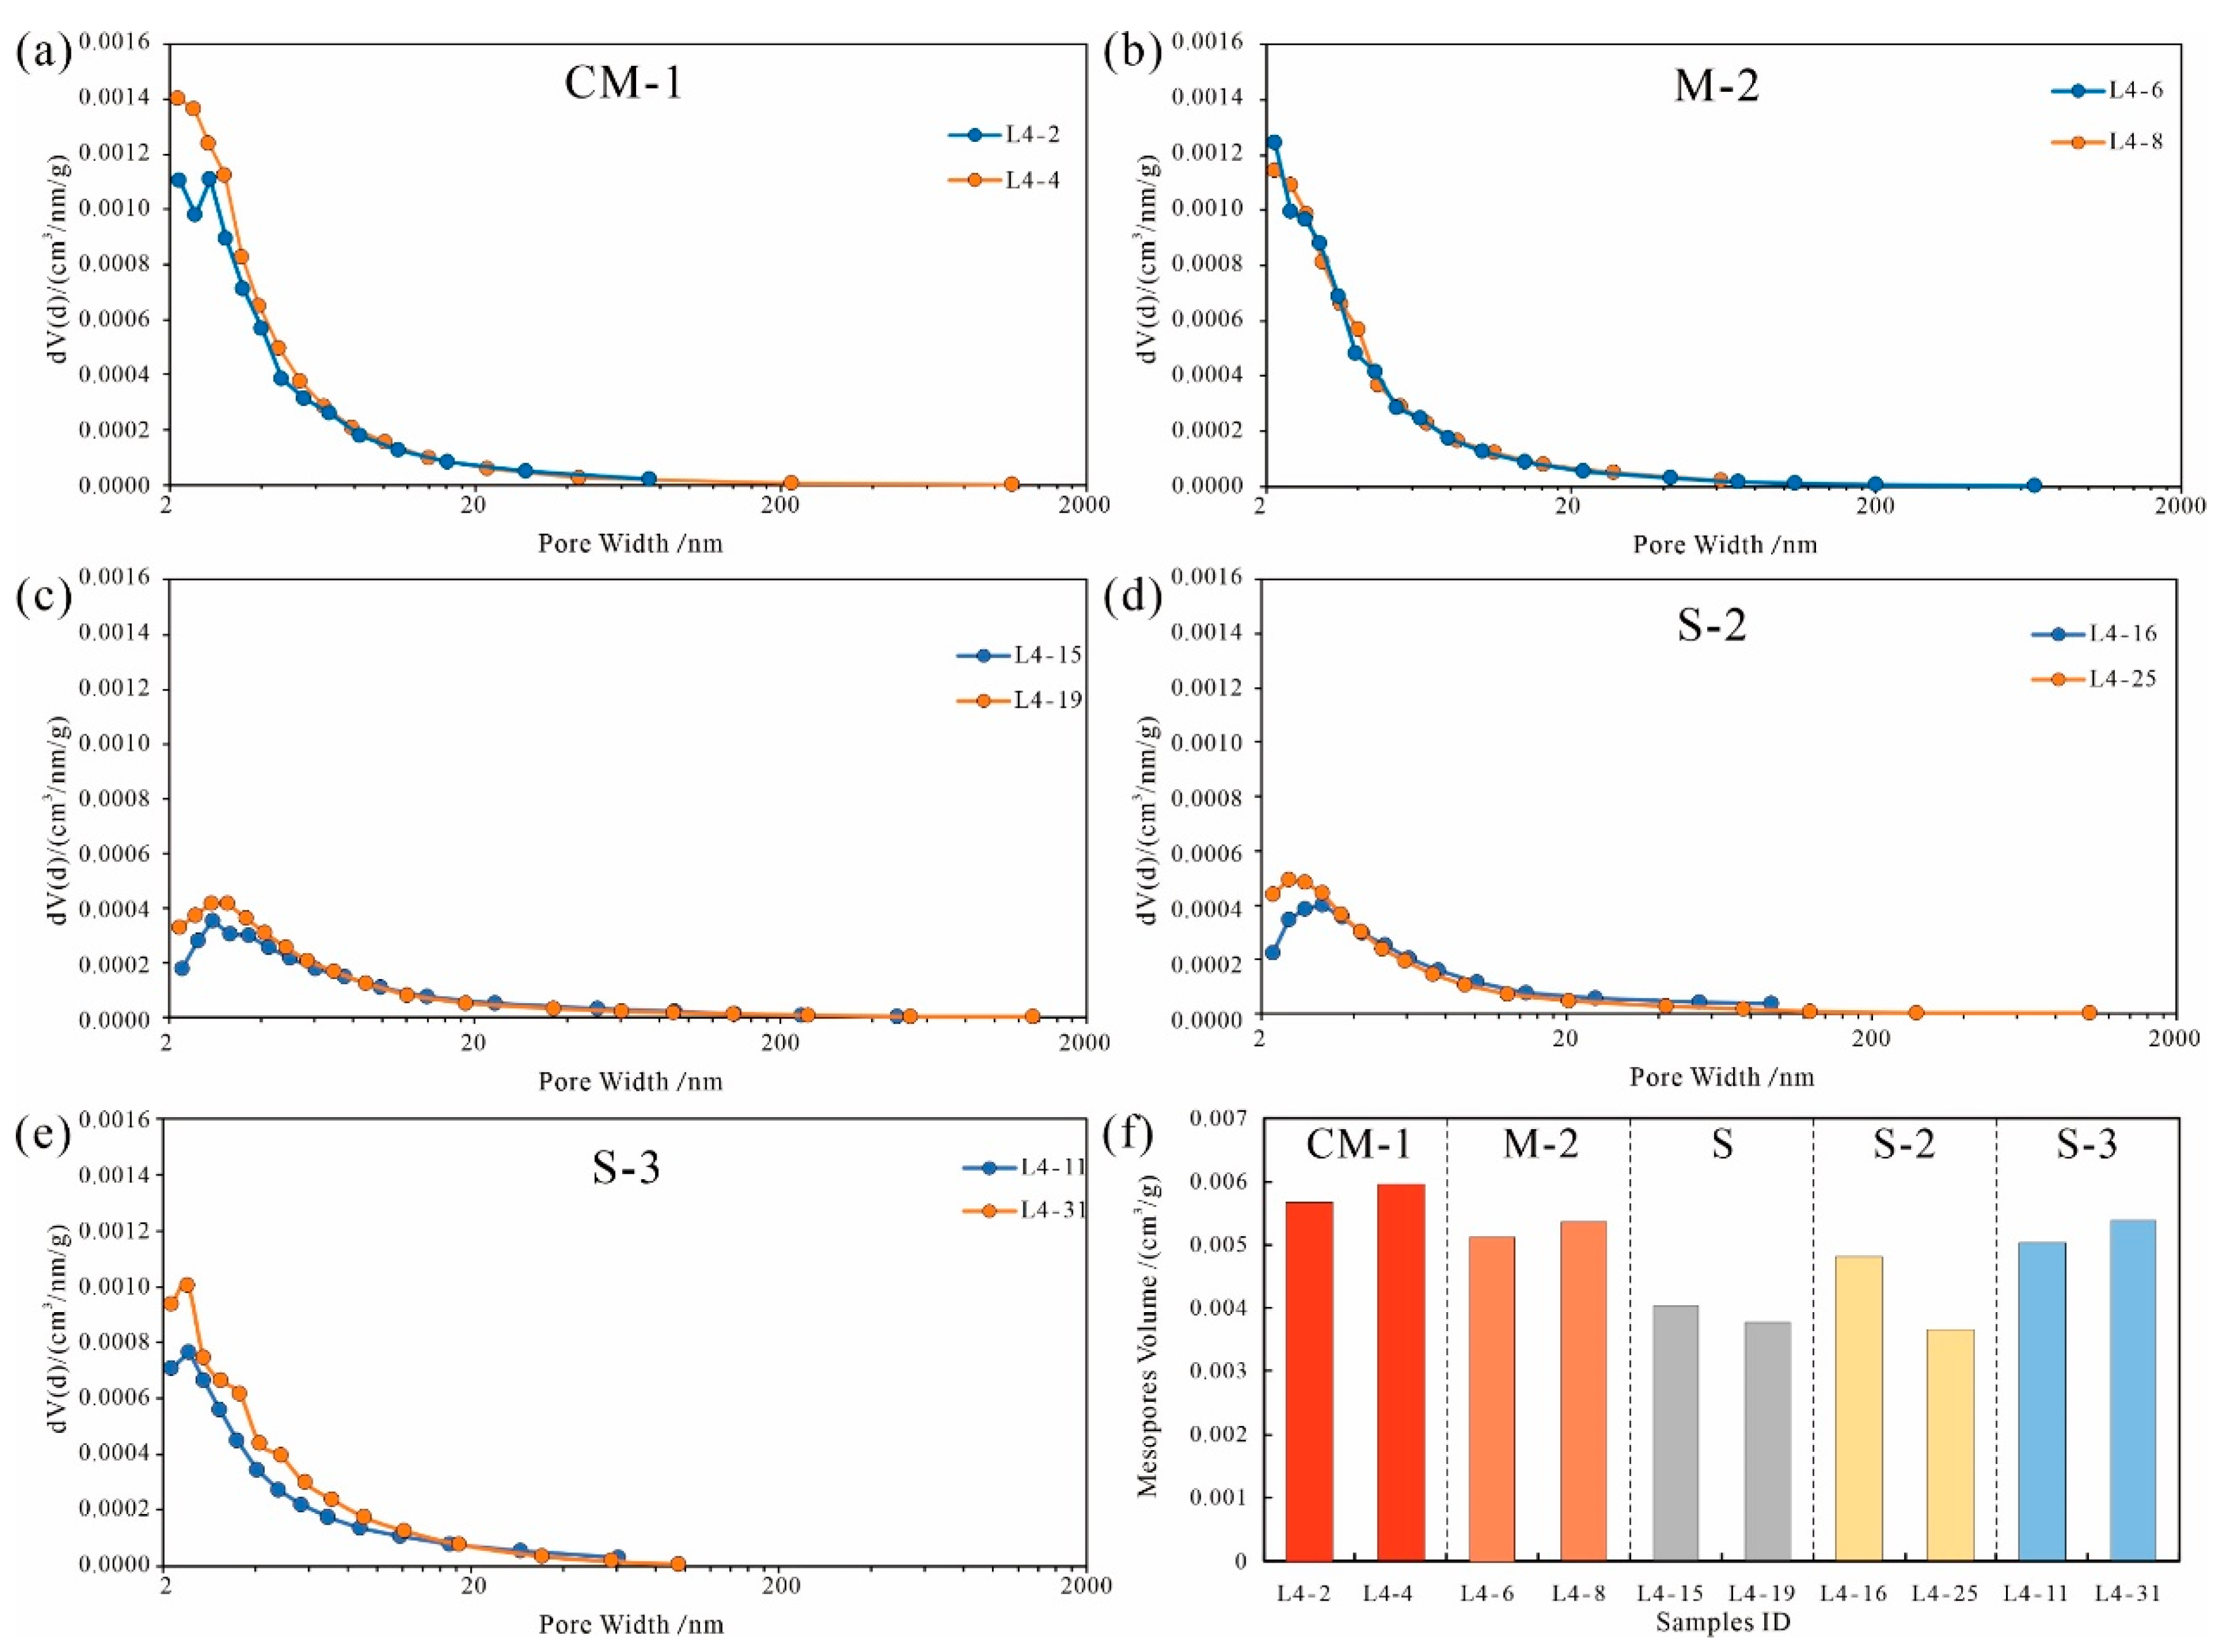
4.4.2. N2 Adsorption Characteristics

N2 adsorption experiments were carried out on different shale facies samples from the Qiongzhusi Formation in southwest Sichuan Basin to characterize the mesopore with pore size of 2~50 nm. The isothermal adsorption curves of Qiongzhusi shale were analyzed according to the classification method of the International Union of Pure and Applied Chemistry (IUPAC) (Figure 8f) [46]. The isothermal adsorption curve of Qiongzhusi shale is mainly type IV, indicating the existence of numerous mesoporous and large pores, and the hysteresis loop of nitrogen adsorption has the characteristics of type H3 and type H4. The hysteresis loop of nitrogen adsorption in S and S-2 lithofacies is mainly H3 type (Figure 8c,d), indicating that the pore morphology is slit-type. The amount of adsorbed nitrogen is less when the relative pressure is low, indicating that there are fewer micropores. When the relative pressure is greater than 0.9, the nitrogen adsorption content increases rapidly, indicating that the pores are mainly medium pores and macro pores. The hysteretic loop of the CM-1 and M-2 lithofacies has the characteristics of both types H3 and H4, and the pore morphology is mainly wedge-shaped and plate-like (Figure 8a,b). The N2 adsorption capacity of CM-1 and M-2 lithofacies increases rapidly when the relative pressure is less than 0.1, and slowly when the relative pressure is higher than 0.9, indicating that the shale is dominated by micropores, with a few mesopores and macropores. The hysteretic loop of S-3 lithofacies has the characteristics of both H3 type and H4 type, and is more similar to H4 type, and the pore morphology is mainly wedge-shaped and plate-like (Figure 8e). The N2 adsorption capacity of S-3 rock facies increases rapidly when the relative pressure is small, and increases slowly when the relative pressure is greater than 0.9, indicating that micropores are mainly developed.
The pore size distribution of Qiongzhusi Formation in the study area was analyzed based on the results of the nitrogen adsorption test. The distribution of the mesopore is mainly unimodal distribution. The pore types are mainly wedge holes and slit holes, and the pore volume is mainly composed of medium pores with a size of 2–5 nm (Figure 9a–e). The mesopores of S-3, CM-1 and M-2 are more enriched than those of S and S-2 (Figure 9f).

4.4.3. CO2 Adsorption Characteristics

CO2 adsorption experiments were conducted on shale samples with different lithofacies of the Qiongzhusi Formation to characterize the pore structure between 0 and 2 nm. The experimental results show that the pore size distribution characteristics of different rock facies in the study area are different. The distribution of micropores in the CM-1 and M-2 shale samples in the study area is generally bimodal, and the corresponding pore size ranges are 0.45–0.65 nm and 0.78–0.84 nm (Figure 10a,b). In the S and S-2 shale samples, the pore size distribution of micropores presents a three-peak characteristic, and the corresponding pore size ranges are 0.45–0.55 nm, 0.58–0.63 nm, and 0.8–0.84 nm (Figure 10c,d). The peak value of micropore pore size of S and S-2 lithofacies is lower than that of other lithofacies, indicating that the amount of micropores is relatively small. In the S-3 shale samples, the pore size distribution of micropores also presents three-peak characteristics, and the corresponding pore size peaks are 0.45–0.55 nm, 0.58–0.63 nm, and 0.78–0.84 nm (Figure 10e). Some samples had the largest pore volume in the range of 0.45–0.55 nm, which may be due to the relatively developed organic pores. The pore size peak value of S-3 facies is high, indicating that micropores are very developed (Figure 10f).
The micropore volume of five lithofacies was calculated. The S-3 shale is the most enriched, followed by CM-1 and M-2, and the S and S-2 lithofacies have fewer micropores.

5. Discussion

The development of pores is affected by many factors. In this research, the effects of organic matter, pyrite, siliceous minerals, carbonate minerals and clay minerals on pores are discussed to determine how the composition of shale affects pores.

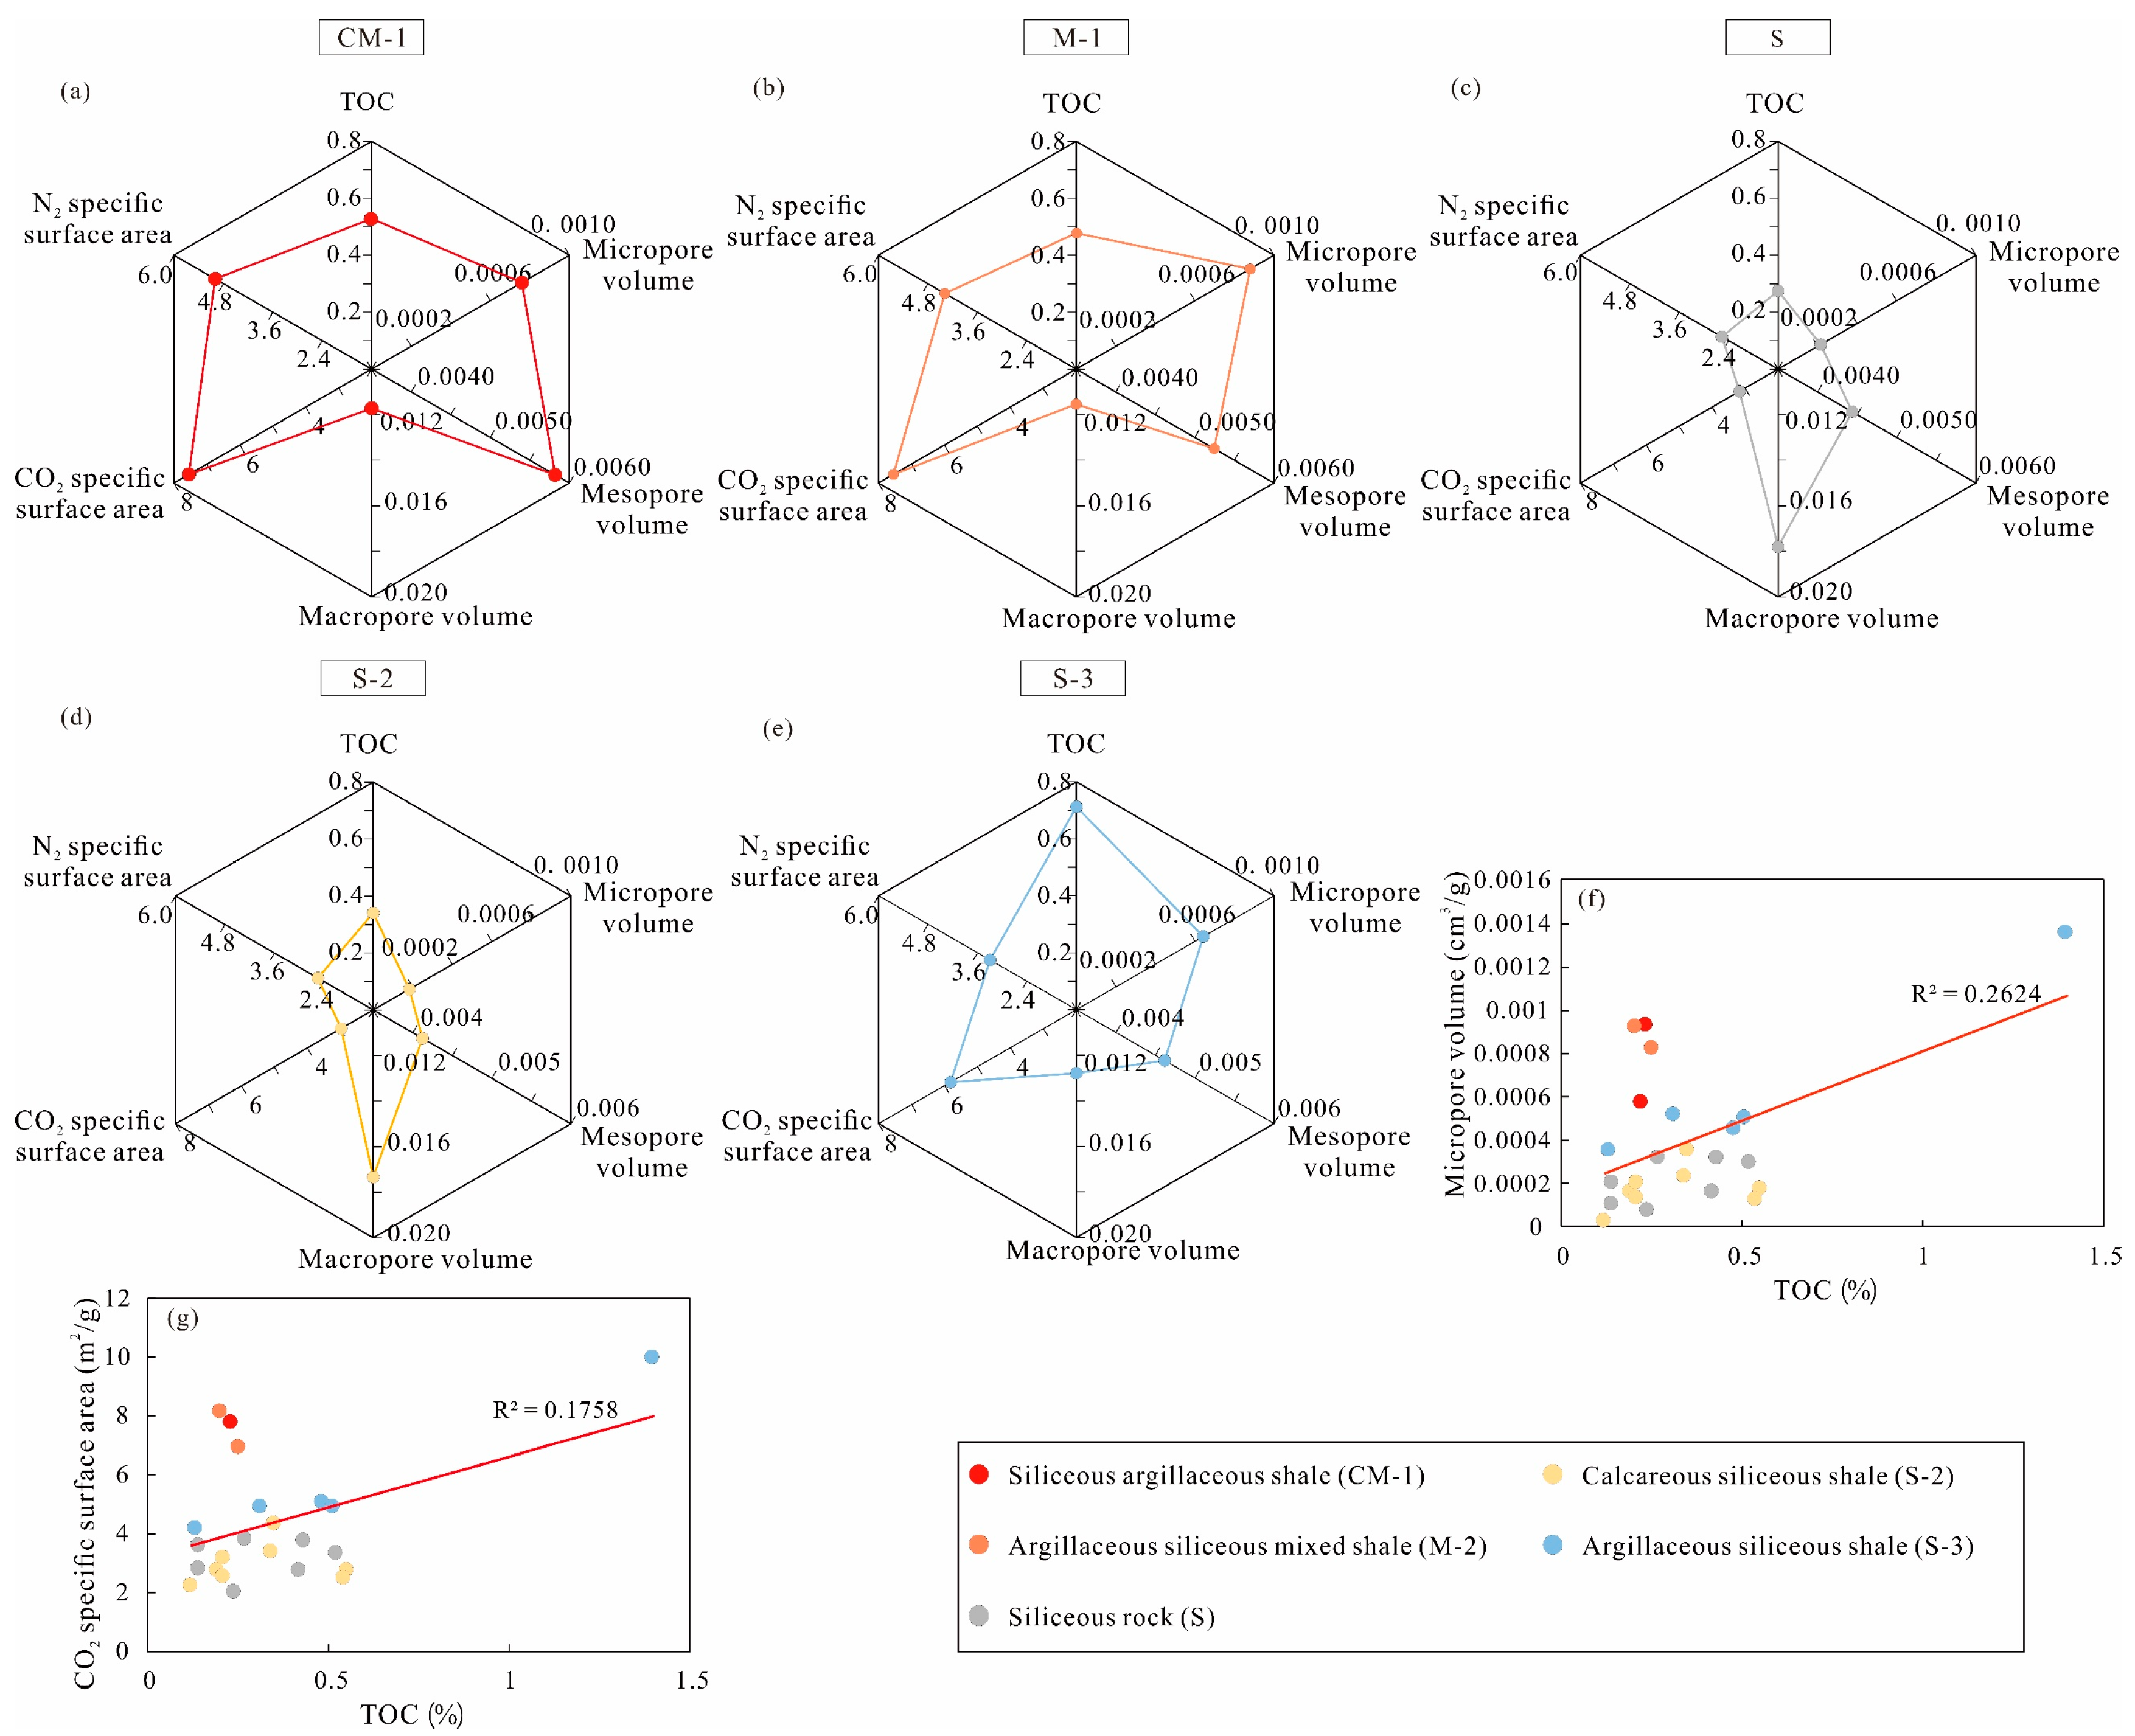
5.1. Effect of Organic Matter on Pores

In the process of hydrocarbon generation in high-maturity marine shales, a large number of organic pores are formed, so the pore volume and specific surface area are positively correlated with the total organic carbon content [47,48]. Due to the low TOC and compaction in the shale of Qiongzhusi Formation in the study area, the organic pores are not abundant. The TOC Micropores volume and CO2 specific surface area are enriched in CM-1, M-1 and S-3 shale (Figure 11a–e). TOC has a positive correlation with the pore volume and specific surface area of micropores, and the R2 were 0.26 and 0.57, respectively (Figure 11f,g). The relationship between the above-mentioned parameters indicates that the organic pores are micropores, and the organic pores increase the specific surface area of the micropores.

5.2. Effect of Pyrite on Pores

The impact of pyrite on the pore structure of the Qiongzhusi Formation was investigated. The poor correlation between pyrite content and the pore volume and specific surface area of mesopores and macropores indicates that pyrite has no positive effect on the development of mesopores and macropores in the shale of the Qiongzhusi Formation (Figure 12b,c,e). Pyrite content showed a significant positive link with the pore volume and specific surface area of micropores, and the correlation coefficient (R) of both were higher than 0.5 (Figure 12a,d). The relationship between the above parameters suggests that pyrite is associated with micropores enrichment. Generally, pyrite is formed under hydrostatic conditions, in which clay minerals and organic matter are abundant, and micropores such as organic pores and clay mineral pores are enriched [49,50]. The clay minerals and organic matter fill the intergranular pores so that the macropores are reduced. At the same time, pyrite can preserve organic pores through the inhibition of compaction, so the enrichment of pyrite is conducive to the development of organic pores [51]. The CM-1, M-2 and S-3 shale are rich in pyrite (Figure 12f), so the preservation conditions of organic pores are good and organic pores are abundant.

5.3. Effects of Minerals on Pores

Pore structure parameters of different lithofacies shale of the Qiongzhusi Formation are obtained based on the data of CO2 adsorption experiment, N2 adsorption experiment and high-pressure mercury injection, (Appendix A, Table A3). As shown in Figure 12, the PSD characteristics of different shale rock facies are significantly different. The number of micropores in Qiongzhusi Formation shale is the largest, followed by mesopores and a few macropores. The number of micropores of CM-1 and M-2 shale was abundant, followed by mesopore (Figure 13a,b). The number of micropores and mesopores of S-3 is abundant, and the mesopore is lower than that of CM-1 and M-2 (Figure 13e). Compared with other lithofacies, the micropores of S and S-2 shales are not enriched, the mesopores are abundant, and the macropores are more abundant (Figure 13c,d).
Previous studies have shown that siliceous minerals generally protect pores [52]. There is a positive correlation between the content of quartz + feldspar minerals and the volume of macropores in the study area, but the correlation coefficient is less than 0.5 (Figure 13h), indicating that quartz and feldspar minerals do not play an obvious role in protecting macropores. The content of quartz + feldspar minerals is negatively correlated with the pore volume of mesopore (Figure 13g), and the R2 is 0.187. The quartz and feldspar content are negatively correlated with the pore volume of micropores (Figure 13f), and the correlation coefficients of both are higher than 0.5. The relationship between the above parameters indicates that high quartz + feldspar content is not conducive to the development of micropores and mesopores. The correlation between carbonate mineral content and the pore volume of micropore, mesopore and macropores is not obvious, and the correlations are all less than 0.2 (Figure 13i–k). Consequently, it can be concluded that carbonate minerals are not the major causes of micropores formation. Previous studies have shown that clay minerals have a large pore volume and specific surface area, which is very important for the development of nanometer-micron pores in shale [53]. According to the analysis of the relationship between clay mineral content and pore structure parameters, the clay mineral content is positively correlated with the pore volume of micropores and mesopores, and the correlation coefficients of the two groups of relationships were all higher than 0.5 (Figure 13i,m). This indicates that clay mineral pores are micropores and mesopores, providing a large amount of pore volume for shale. The content of clay minerals is negatively correlated with the volume of macropores (Figure 13n), which may be caused by clay minerals filling intergranular pores and reducing the volume of macropores.
The content of siliceous mineral is negatively correlated with the CO2 specific surface area and N2 specific surface area, and the R2s are 0.67 and 0.64, respectively (Figure 14a,d,e,h). The poor correlation between carbonate mineral content and the CO2 specific surface area and N2 specific surface area shows that carbonate minerals have no significant effect on the specific surface area of shale pores of the Qiongzhusi Formation in the Sichuan basin (Figure 14b,d,f,h). The clay mineral content is positively correlated with the CO2 specific surface area and N2 specific surface area, which indicates that clay mineral pores provide a large amount of specific surface area for shale (Figure 14c,d,g,h).
Previous studies have shown that the pore volume specific surface area of different clay minerals is obviously different. Illite and montmorillonite have large specific surface area and pore volume [54]. The clay minerals of the Qiongzhusi Formation mainly include mixed-layer I/S, illite and chlorite. In view of pore structure characteristics, different types of clay minerals have different effects on pore structure. Both the content of mixed-layer I/S and illite are positively correlated with the volume of micropores, and the correlation coefficients are 0.81 and 0.53, respectively (Figure 15a,b), indicating that both minerals have a large number of micropores, but the volume of micropores in mixed-layer I/S is much higher than that of other clay minerals. Chlorite content and micropore volume exhibited an obvious negative correlation, as shown in Figure 15c, indicating that chlorite in the study area is mainly pore-filling chlorite, which blocks the pores between particles and reduces the pore volume of the reservoir [24]. Therefore, it can be concluded that clay minerals are the major causes affecting the pore structure of Qiongzhusi Formation shale in the study area.

6. Conclusions

(1)
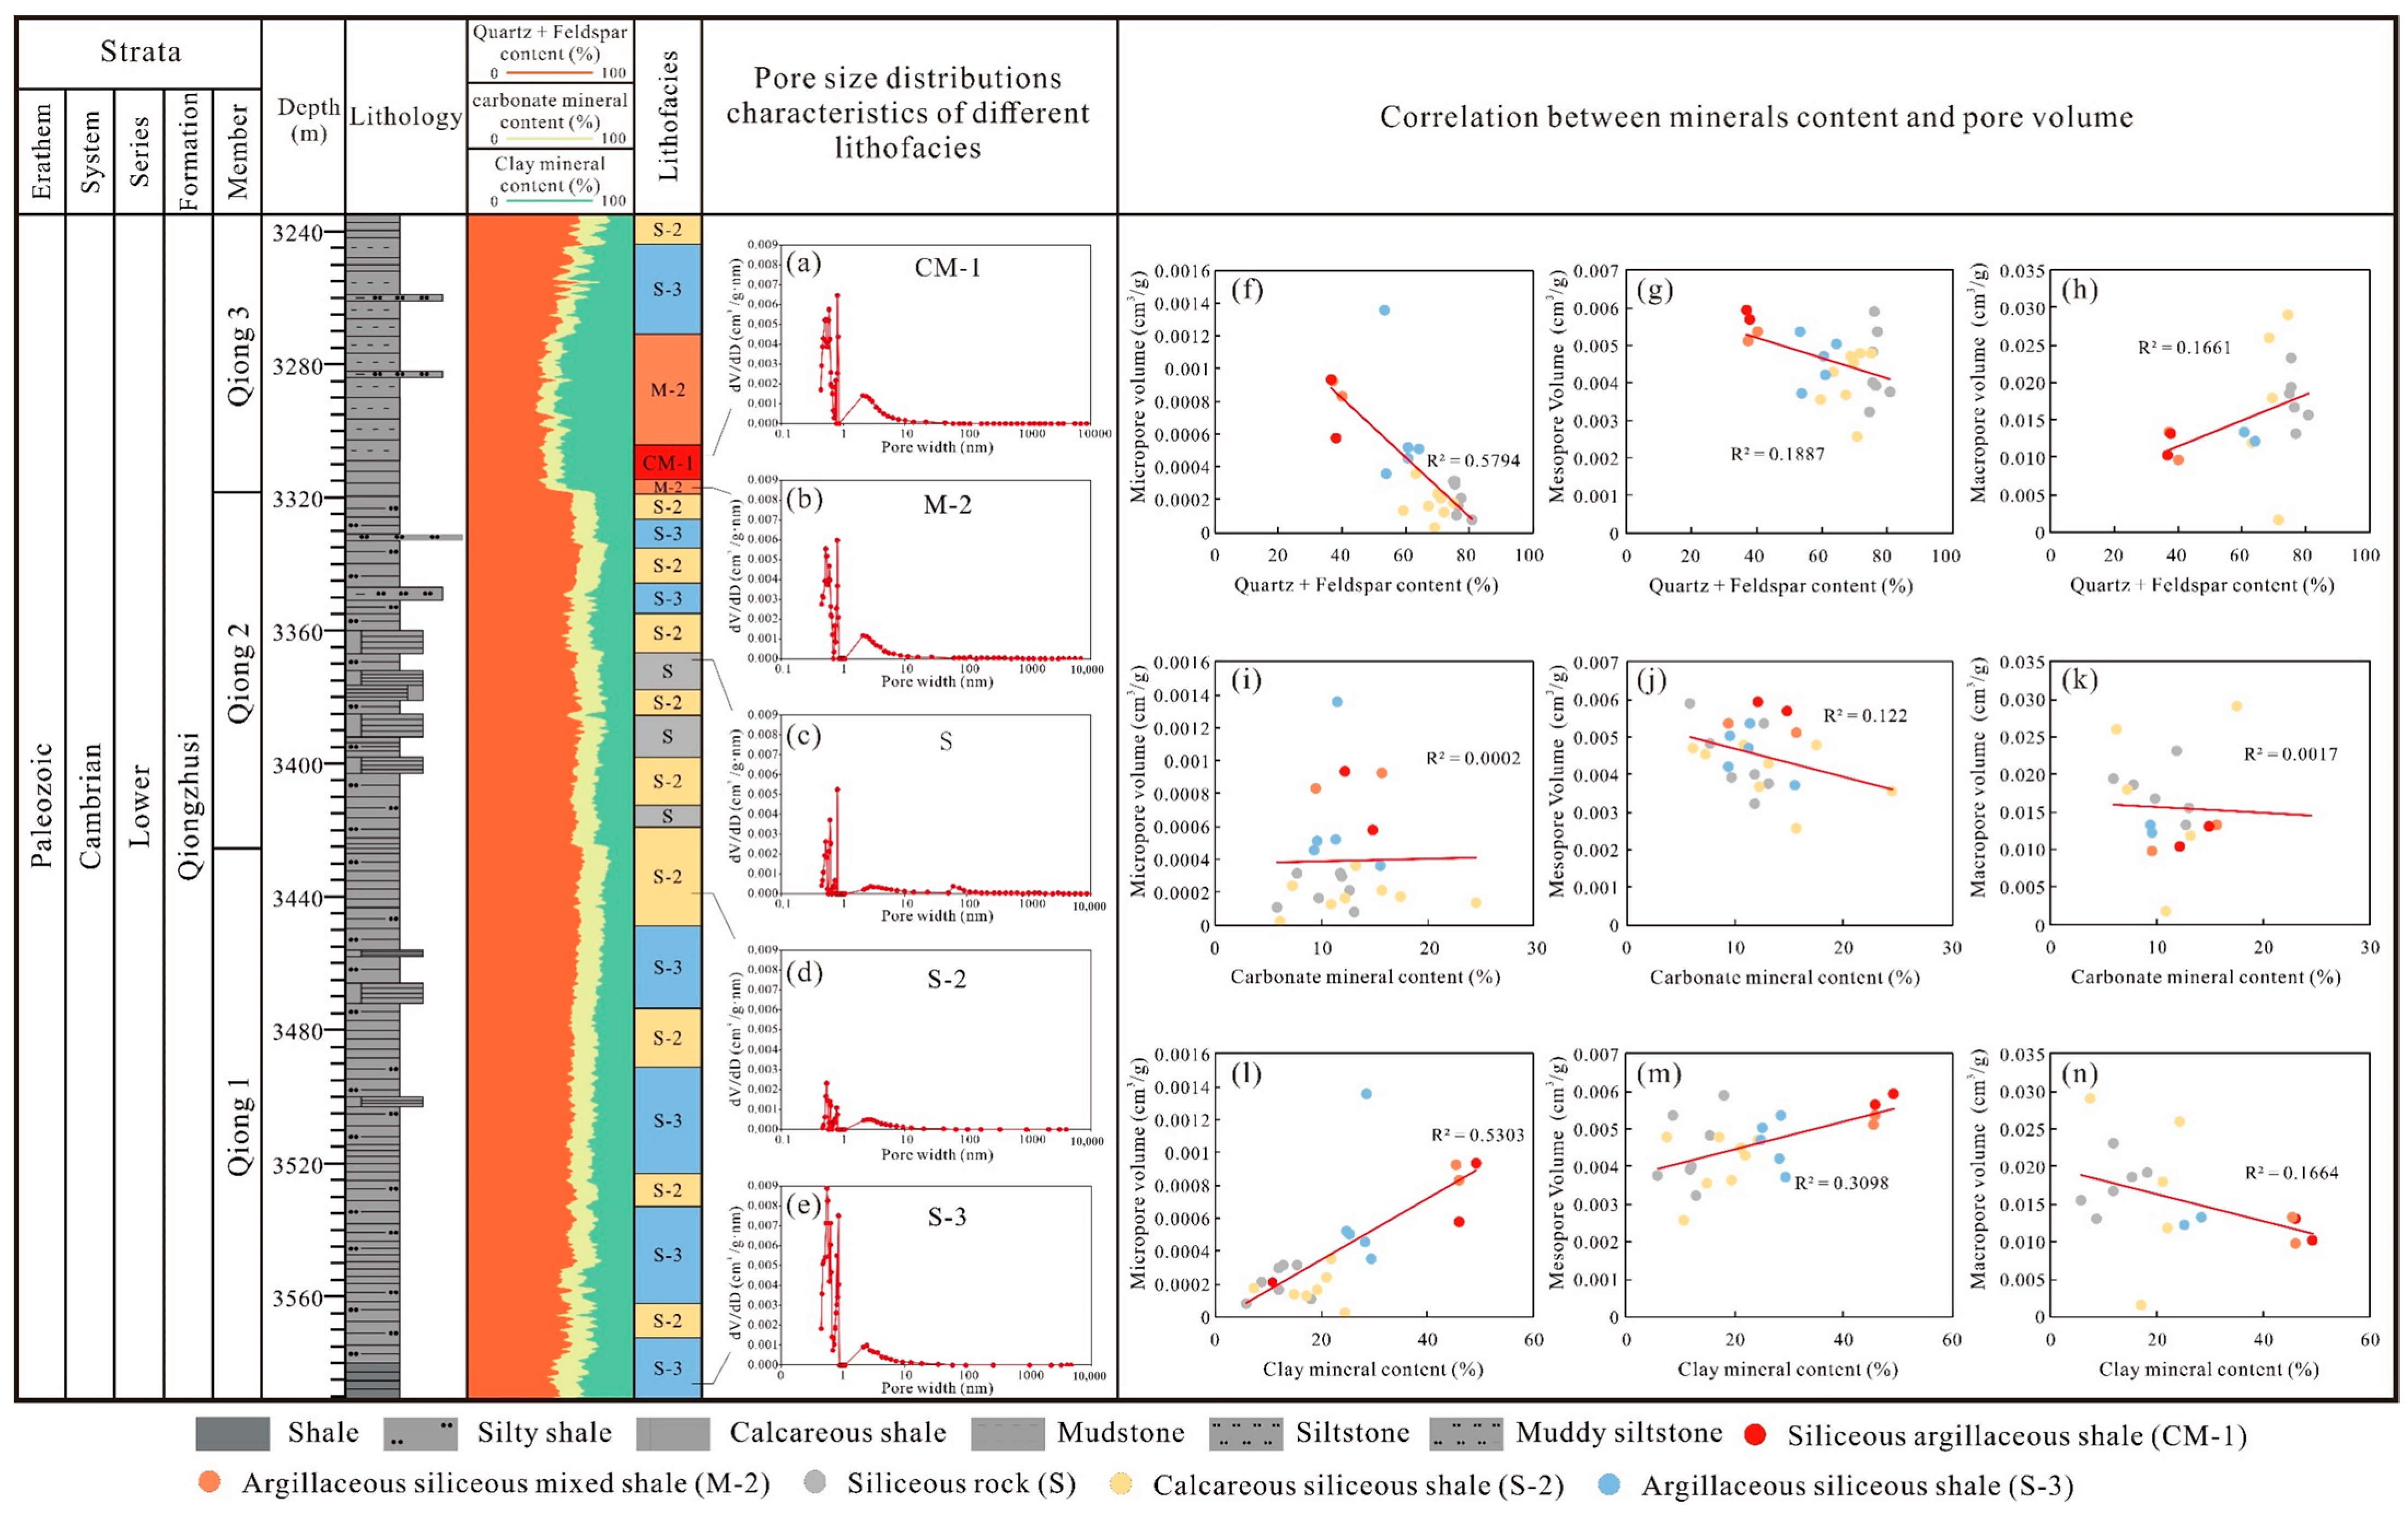
According to mineral composition, the shale of the Qiongzhusi Formation in southwest Sichuan is divided into five lithofacies, including Siliceous argillaceous shale (CM-1), Argillaceous siliceous mixed shale (M-2), Argillaceous siliceous shale (S-3), Siliceous rock (S) and Calcareous siliceous shale (S-2).
(2)
The pore structure of different lithofacies is different. the pore structure of S and S-2 lithofacies is mainly slit-type, and the pore structure of S-3, CM-1 and M-2 lithofacies are predominantly wedge-shaped and plate-like.
(3)
Pores above 10 microns are small in number but have the largest pore volume. Mesopores in S and S-2 shale mainly have sizes in the range of 2–5 nm, while micropores are mainly in the ranges of 0.45–0.55 nm, 0.58–0.63 nm, and 0.8–0.84 nm. Mesopores in CM-1 and M-2 shale also have sizes in the ranges of 2–5 nm, while micropores are mainly in the ranges of 0.45–0.65 nm and 0.78–0.84 nm., and pores are more enriched than S and S-2 types. Mesopores in S-3 shale have sizes in the ranges of 2–5 nm, while the pore size distribution of micropores are in the ranges of 0.45–0.55 nm, 0.58–0.63 nm, and 0.78–0.84 nm. The micropores in S-3 shale is the most enriched
(4)
The pore structure of the Qiongzhusi Formation is affected by TOC, quartz and feldspar mineral content and clay mineral type and content. In organic-rich shale, organic pores are abundant, and the specific surface area and pore volume of micropores are large. Pyrite has a protective effect on micropores, and the environment in which pyrite is formed is rich in clay minerals and organic matter, which is conducive to the formation of micropores and mesopores. Quartz and feldspar do not protect the pores, and their formation environment is not conducive to the enrichment of clay minerals and organic matter. Clay mineral content has significant positive effects on the PV and SSA of micropores and mesopores. Clay mineral content is the primary factor affecting the pore structure of Qiongzhusi Formation shale in the Sichuan Basin. Chlorite has a negative effect on PV, while mixed-layer I/S and illite increase PV in Qiongzhusi shale.

Author Contributions

Conceptualization, Y.W. (Yuqi Wang) and D.C.; methodology, Y.W. (Yuqi Wang); software, Y.W. (Yuqi Wang); investigation, W.L.; formal analysis, Y.W. (Yuchao Wang), F.W. and W.L.; writing—original draft preparation, Y.W. (Yuqi Wang); Supervision, D.C.; Writing—review & editing, D.C. All authors have read and agreed to the published version of the manuscript.

Funding

This work was financially supported by the National Natural Science Foundation of China (Grant No. 41972124), the Science Foundation of China University of Petroleum, Beijing (No. 2462023XKBH011).

Data Availability Statement

The data that has been used for the research was presented in the article.

Conflicts of Interest

The authors declare no conflict of interest.

Appendix A

Table A1. Geological characteristics of Qiongzhusi formation shale samples in southwestern Sichuan Basin.
Sample IDDepth (m)TOC (%)Mineral Content (%)Lithofacies
QuartzFeldsparCalciteDolomitePyriteTotal Clay
W1-13286.950.7629.413.13.19.53.941M-2
W1-33292.561.824.115.62.13.34.550.4CM-1
W1-43294.891.9931.914.72.52.91.846.2M-2
W1-53297.553.5535.922.47.32.9328.5S-3
W1-63300.930.5239.63242.6 21.8S-2
W1-73304.110.4538.328.61.31.92.127.8S-3
L4-13311.19 25.47.439.62.352.3CM-1
L4-23311.510.2228.612.42.23.23.250.4CM-1
L4-33312.270.1727.88.23.714.12.943.3M-2
L4-43313.440.2328.782.39.91.949.2CM-1
L4-53314.730.2287.42.311.32.448.6M-2
L4-63315.740.228.98.34.411.31.645.5M-2
L4-73317.720.3129.68.92.17.53.348.6CM-1
L4-83317.930.25319.22.17.44.346M-2
L4-93320.10.4842.917.92.76.71.528.3S-3
L4-103325.170.3546.916.44.48.81.522S-2
L4-113328.720.5145.11936.6125.3S-3
L4-123342.240.5143.925.53.23.82.321.3S-2
L4-133355.010.1452.123.62.930.318.1S
L4-143363.080.1246.122.72.53.70.224.4S-2
L4-153367.70.5243.731.79.920.712S
L4-163373.770.5551.123.714.82.70.27.5S-2
L4-173377.760.2545.129.45.83.41.414.2S
L4-183383.650.5448.523.27.33.60.317.1S-2
L4-193385.590.2457.723.15.37.80.25.9S
L4-203388.680.4251.724.86.63.21.811.9S
C1-13394.670.0926.69.73.95.71.748.5CM-1
C1-23395.640.0726.5112.74.12.449.6CM-1
C1-33396.290.01229.32.77.82.753.5CM-1
L4-213397.230.1443.531.85.14.10.814.7S
C1-43397.850.0325.411.23.310.52.942.8M-2
C1-53399.930.0525.37.33.57.42.950.1CM-1
C1-63401.250.6625.710.85.893.941.2M-2
L4-223403.020.1450.726.49.33.41.58.7S
W1-83412.390.2141.833.64.92 17.7S
W1-93412.910.1838.239.75.13.2 13.8S
C1-73414.020.662827.21.730.835.4S-3
L4-233416.160.2748.926.44.92.91.515.4S
W1-103416.180.1539.325.473.63.221.5S-2
C1-83416.570.6234.928.13.92.50.225.1S-3
L4-243419.220.3443.526.343.31.821.1S-2
L4-253434.460.1942256.55.81.319.4S-2
L4-263444.050.2136.223.121.33.21.314.9S-2
W1-113522.480.0338.226.54.22.6 28.5S-3
W1-123526.680.0424.721152.24.332.8M-2
W1-133533.140.1237.522.83.32.63.130.7S-3
L4-273541.450.3139.620.94.56.82.824.8S-3
W1-143545.410.3541.836.14.32.5 15.3S
W1-153548.690.3533.234.53.46 22.9S-2
W1-163552.150.3927.728.56.610.78.617.9S-2
L4-283552.780.133419.910.15.51.229.3S-3
W1-173555.740.2831.824.25.16.35.826.8S-3
L4-293556.340.2147.223.611.64.12.710.8S-2
L4-303566.320.4351.123.674.80.712.8S
L4-313589.381.4136.3175.16.46.728.5S-3
Table A2. Clay mineral composition of Qiongzhusi formation shale samples, southwestern Sichuan Basin.
Sample IDDepth (m)Relative Content in Clay Minerals
Mixed-Layer I/SIlliteChlorite
L4-23311.82363826
L4-43313.44363727
L4-63315.74443422
L4-83317.93383824
L4-93320.1374122
L4-103325.17344224
L4-113328.72334225
L4-133355.01132463
L4-143363.08162262
L4-153367.7253540
L4-163373.77204139
L4-183383.65223444
L4-193385.59243838
L4-203388.68153154
L4-223403.02272449
L4-233416.16213049
L4-243419.22232849
L4-253434.46273538
L4-263444.05313138
L4-273541.45373528
L4-283552.78413425
L4-293556.34243937
L4-303566.32253144
L4-313589.3848466
Table A3. Pore characteristic parameters of the Qiongzhusi formation shale samples, southwestern Sichuan.
Sample IDDepth (m)Pore Volume (cm3/g)Surface Area (m2/g)Lithofacies
MicroporeMesoporesMacroporesMicroporeMesopores
L4-23311.820.000580.005680.013107.3114.593CM-1
L4-43313.440.000940.005960.010347.7815.411CM-1
L4-63315.740.000930.005120.013348.1444.361M-2
L4-83317.930.000830.005370.009746.9434.414M-2
L4-93320.10.000110.00590.019372.8093.705S-3
L4-103325.170.00030.004030.023233.3491.982S-2
L4-113328.720.000080.003760.015582.0372.281S-3
L4-133355.010.000170.003930.016772.7592.047S
L4-143363.080.000210.005370.013203.6182.701S-2
L4-153367.70.000320.004830.018633.8313.434S
L4-163373.770.000320.00324 3.7911.802S-2
L4-183383.650.000360.004310.011904.3652.533S-2
L4-193385.590.000030.004720.025952.222.708S
L4-203388.680.000180.004810.029142.7772.22S
L4-223403.020.000130.00480.001712.5173.023S
L4-233416.160.000240.004530.017993.4062.939S
L4-243419.220.000170.00367 2.7512.42S-2
L4-253434.460.000140.003550.0046972.5812.9S-2
L4-263444.050.000210.00259 3.1771.621S-2
L4-273541.450.000460.004210.013385.0723.054S-3
L4-283552.780.000510.005040.012204.9423.34S-3
L4-293556.340.000520.00471 4.9133.139S-2
L4-303566.320.000360.00374 4.1722.766S
L4-313589.380.001360.005380.0051779.9774.177S-3

References

  1. Economides, M.J.; Wood, D.A. The state of natural gas. J. Nat. Gas Sci. Eng. 2009, 1, 1–13. [Google Scholar] [CrossRef]
  2. Bradshaw, M.; Van de Graaf, T.; Connolly, R. Preparing for the new oil order? Saudi Arabia and Russia. Energy Strategy Rev. 2019, 26, 100374. [Google Scholar] [CrossRef]
  3. Maya, J.R.L. The United States experience as a reference of success for shale gas development: The case of Mexico. Energy Policy 2013, 62, 70–78. [Google Scholar] [CrossRef]
  4. Lee, W.J.; Sohn, S.Y. Patent analysis to identify shale gas development in China and the United States. Energy Policy 2014, 74, 111–115. [Google Scholar] [CrossRef]
  5. Feng, Y.; Xiao, X.; Gao, P.; Wang, E.Z.; Hu, D.F.; Liu, R.B.; Li, G.; Lu, C.G. Restoration of sedimentary environment and geochemical features of deep marine Longmaxi shale and its significance for shale gas: A case study of the Dingshan area in the Sichuan Basin, South China. Mar. Pet. Geol. 2023, 151, 106186. [Google Scholar] [CrossRef]
  6. Jarvie, D.M.; Hill, R.J.; Ruble, T.E.; Pollastro, R.M. Unconventional shale-gas systems: The Mississippian Barnett Shale of north-central Texas as one model for thermogenic shale-gas assessment. AAPG Bull. 2007, 91, 475–499. [Google Scholar] [CrossRef]
  7. Bernard, S.; Horsfield, B. Thermal maturation of gas shale systems. Annu. Rev. Earth Planet. Sci. 2014, 42, 635–651. [Google Scholar] [CrossRef]
  8. Pillalamarry, M.; Harpalani, S.; Liu, S.M. Gas diffusion behavior of coal and its impact on production from coalbed methane reservoirs. Int. J. Coal Geol. 2011, 86, 342–348. [Google Scholar] [CrossRef]
  9. Curtis, J.B. Fractured shale-gas systems. AAPG Bull. 2002, 86, 1921–1938. [Google Scholar]
  10. Topór, T.; Derkowski, A.; Ziemiański, P.; Szczurowski, K.; McCarty, D.K. The effect of organic matter maturation and porosity evolution on methane storage potential in the Baltic Basin (Poland) shale-gas reservoir. Int. J. Coal Geol. 2017, 180, 46–56. [Google Scholar] [CrossRef]
  11. Ross, D.J.K.; Bustin, R.M. The importance of shale composition and pore structure upon gas storage potential of shale gas reservoirs. Mar. Pet. Geol. 2009, 26, 916–927. [Google Scholar] [CrossRef]
  12. Zou, C.N.; Dong, D.Z.; Wang, S.J.; Li, J.Z.; Li, X.J.; Wang, Y.M.; Li, D.H.; Cheng, K.M. Geological characteristics and resource potential of shale gas in China. Pet. Explor. Dev. 2010, 37, 641–653. [Google Scholar] [CrossRef]
  13. Kim, J.; Kim, D.; Lee, W.; Kim, H. Impact of total organic carbon and specific surface area on the adsorption capacity in Horn River shale. J. Pet. Sci. Eng. 2017, 149, 331–339. [Google Scholar] [CrossRef]
  14. Labani, M.M.; Rezaee, R.; Saeedi, A.; Hinai, A.A. Evaluation of pore size spectrum of gas shale reservoirs using low pressure nitrogen adsorption, gas expansion and mercury porosimetry: A case study from the Perth and Canning Basins, Western Australia. J. Pet. Sci. Eng. 2013, 112, 7–16. [Google Scholar] [CrossRef]
  15. Rouquerol, J.; Avnir, D.; Fairbridge, C.W.; Everett, D.H.; Haynes, J.M.; Pernicone, N.; Ramsay, J.D.F.; Sing, K.S.W.; Unger, K.K. Recommendations for the characterization of porous solids (Technical Report). Pure Appl. Chem. 1994, 66, 1739–1758. [Google Scholar] [CrossRef]
  16. Nichols, M.M.; Johnson, G.H.; Peebles, P.C. Modern sediments and facies model for a microtidal coastal plain estuary, the James Estuary, Virginia. J. Sediment. Res. 1991, 61, 883–899. [Google Scholar]
  17. Lv, D.W.; Wang, D.D.; Li, Z.X.; Liu, H.Y.; Li, Y. Depositional environment, sequence stratigraphy and sedimentary mineralization mechanism in the coal bed-and oil shale-bearing succession: A case from the Paleogene Huangxian Basin of China. J. Pet. Sci. Eng. 2017, 148, 32–51. [Google Scholar] [CrossRef]
  18. Iqbal, M.A.; Rezaee, R.; Smith, G.; Ekundayo, J.M. Shale lithofacies controls on porosity and pore structure: An example from Ordovician Goldwyer Formation, Canning Basin, Western Australia. J. Nat. Gas Sci. Eng. 2021, 89, 103888. [Google Scholar] [CrossRef]
  19. Qian, C.; Li, X.Z.; Shen, W.J.; Zhang, Q.; Guo, W.; Hu, Y.; Cui, Y.; Jia, Y.Z. Study on the pore structure and fractal characteristics of different lithofacies of Wufeng–Longmaxi Formation shale in southern Sichuan Basin, China. ACS Omega 2022, 7, 8724–8738. [Google Scholar] [CrossRef]
  20. Wang, Y.F.; Zhai, G.Y.; Liu, G.H.; Shi, W.Z.; Lu, Y.C.; Li, J.; Zhang, Y.X. Geological characteristics of shale gas in different strata of marine facies in South China. J. Earth Sci. 2021, 32, 725–741. [Google Scholar] [CrossRef]
  21. Kuila, U.; McCarty, D.K.; Derkowski, A.; Fischer, T.B.; Topór, T.; Prasad, M. Nano-scale texture and porosity of organic matter and clay minerals in organic-rich mudrocks. Fuel 2014, 135, 359–373. [Google Scholar] [CrossRef]
  22. Morad, S.; Al-Ramadan, K.; Ketzer, J.M.; De Ros, L.F. The impact of diagenesis on the heterogeneity of sandstone reservoirs: A review of the role of depositional facies and sequence stratigraphy. AAPG Bull. 2010, 94, 1267–1309. [Google Scholar] [CrossRef]
  23. Wang, X.M.; Cheng, H.J.; Chai, P.C.; Bian, J.H.; Wang, X.M.; Liu, Y.; Yin, X.B.; Pan, S.D.; Pan, Z.J. Pore characterization of different clay minerals and its impact on methane adsorption capacity. Energy Fuels 2020, 34, 12204–12214. [Google Scholar] [CrossRef]
  24. Worden, R.H.; Griffiths, J.; Wooldridge, L.J.; Utley, J.E.P.; Lawan, A.Y.; Muhammed, D.D.; Simon, N.; Armitage, P.J. Chlorite in sandstones. Earth-Sci. Rev. 2020, 204, 103105. [Google Scholar] [CrossRef]
  25. Wang, Z.H.; Jiang, H.; Wang, T.S.; Lu, W.H.; Gu, Z.D.; Xu, A.N.; Yang, Y.; Xu, Z.H. Paleo-geomorphology formed during Tongwan tectonization in Sichuan Basin and its significance for hydrocarbon accumulation. Pet. Explor. Dev. 2014, 41, 338–345. [Google Scholar] [CrossRef]
  26. Li, X.; Jiang, Z.X.; Wang, P.F.; Song, Y.; Li, Z.; Tang, X.L.; Li, T.W.; Zhai, G.Y.; Bao, S.J.; Xu, C.L.; et al. Porosity-preserving mechanisms of marine shale in Lower Cambrian of Sichuan Basin, South China. J. Nat. Gas Sci. Eng. 2018, 55, 191–205. [Google Scholar] [CrossRef]
  27. Zhang, Y.Y.; He, Z.L.; Jiang, S.; Lu, S.F.; Xiao, D.S.; Chen, G.H.; Zhao, J.H. Factors affecting shale gas accumulation in overmature shales case study from lower Cambrian shale in western Sichuan Basin, South China. Energy Fuels 2018, 32, 3003–3012. [Google Scholar] [CrossRef]
  28. Dai, J.X.; Ni, Y.Y.; Qin, S.F.; Huang, S.P.; Pang, W.L.; Han, W.X. Geochemical characteristics of ultra-deep natural gas in the Sichuan Basin, SW China. Pet. Explor. Dev. 2018, 45, 619–628. [Google Scholar] [CrossRef]
  29. Wang, P.W.; Nie, H.K.; Liu, Z.B.; Sun, C.X.; Cao, Z.; Wang, R.Y.; Li, P. Differences in Pore Type and Pore Structure between Silurian Longmaxi Marine Shale and Jurassic Dongyuemiao Lacustrine Shale and Their Influence on Shale-Gas Enrichment. Minerals 2023, 13, 190. [Google Scholar] [CrossRef]
  30. Zou, C.N.; Dong, D.Z.; Wang, Y.M.; Li, X.J.; Huang, J.L.; Wang, S.F.; Guan, Q.Z.; Zhang, C.C.; Wang, H.Y.; Liu, H.L.; et al. Shale gas in China: Characteristics, challenges and prospects (II). Pet. Explor. Dev. 2016, 43, 182–196. [Google Scholar] [CrossRef]
  31. Lei, W.Z.; Chen, D.X.; Liu, Z.Y.; Cheng, M. Paleoenvironment-driven organic matter accumulation in lacustrine shale mixed with shell bioclasts: A case study from the Jurassic Da’anzhai member, Sichuan Basin (China). J. Pet. Sci. Eng. 2023, 220, 111178. [Google Scholar] [CrossRef]
  32. Fu, Q.; Hu, Z.Q.; Qin, T.T.; Feng, D.J.; Yang, B.; Zhu, Z.W.; Xing, L.L. Diagenesis and Pore Formation Evolution of Continental Shale in the Da’anzhai Lower Jurassic Section in the Sichuan Basin. Minerals 2023, 13, 535. [Google Scholar] [CrossRef]
  33. Wang, M.; He, J.; Liu, S.; Zeng, C.L.; Jia, S.; Nie, Z.; Wang, S.X.; Wang, W.; Zhang, C. Effect of Sedimentary Facies Characteristics on Deep Shale Gas Desserts: A Case from the Longmaxi Formation, South Sichuan Basin, China. Minerals 2023, 13, 476. [Google Scholar] [CrossRef]
  34. Chen, Z.X.; Li, W.; Wang, L.N.; Lei, Y.L.; Yang, G.; Zhang, B.J.; Yin, H.; Yuan, B.G. Structural geology and favorable exploration prospect belts in northwestern Sichuan Basin, SW China. Pet. Explor. Dev. 2019, 46, 413–425. [Google Scholar] [CrossRef]
  35. Qiu, N.S.; Liu, W.; Fu, X.D.; Li, W.Z.; Xu, Q.C.; Zhu, C.Q. Maturity evolution of lower cambrian qiongzhusi formation shale of the Sichuan Basin. Mar. Pet. Geol. 2021, 128, 105061. [Google Scholar]
  36. Li, C.R.; Pang, X.Q.; Ma, X.H.; Wang, E.Z.; Hu, T.; Wu, Z.Y. Hydrocarbon generation and expulsion characteristics of the Lower Cambrian Qiongzhusi shale in the Sichuan Basin, Central China: Implications for conventional and unconventional natural gas resource potential. J. Pet. Sci. Eng. 2021, 204, 108610. [Google Scholar] [CrossRef]
  37. Guo, T.L.; Xiong, L.; Ye, S.J.; Dong, X.X.; Wei, L.M.; Yang, Y.T. Theory and practice of unconventional gas exploration in carrier beds: Insight from the breakthrough of new type of shale gas and tight gas in Sichuan Basin, SW China. Pet. Explor. Dev. 2023, 50, 24–37. [Google Scholar] [CrossRef]
  38. Wang, X.; Zhang, J.; Zhao, R.; Gao, P.; Liu, Q.; Pang, Y.; Zhao, Y.; Zhang, J.; Yang, C.; Ding, K.; et al. Siliceous Origin of the Cambrian Qiongzhusi Formation Shale in the Middle Part of the Upper Yangtze Platform: Significance of Organic Matter Enrichment. ACS Omega 2023, 8, 25358–25369. [Google Scholar] [CrossRef]
  39. Yang, L.P.; Shen, J.J.; Chen, K.Q.; Wang, Y.M.; Ji, Y.B.; Wang, C.H.; Wang, P.W.; Meng, J.H. Relationship between paleoenvironmental evolution and organic matter enrichment of shale of the Lower Cambrian Qiongzhusi Formation in Western Sichuan: Evidence from mineral petrology and geochemistry. J. Northeast. Pet. Univ. 2022, 46, 40–54. [Google Scholar]
  40. Driese, S.G.; Byers, C.W.; Dott, R.H. Tidal deposition in the basal upper cambrian mt. simon formation in wisconsin. J. Sediment. Res. 1981, 51, 367–381. [Google Scholar]
  41. Borjigin, T.; Lu, L.F.; Yu, L.J.; Zhang, W.T.; Pan, A.Y.; Shen, B.J.; Wang, Y.; Yang, Y.F.; Gao, Z.W. Formation, preservation and connectivity control of organic pores in shale. Pet. Explor. Dev. 2021, 48, 798–812. [Google Scholar] [CrossRef]
  42. Hakimi, M.H.; Shalaby, M.R.; Abdullah, W.H. Diagenetic characteristics and reservoir quality of the Lower Cretaceous Biyadh sandstones at Kharir oilfield in the western central Masila Basin, Yemen. J. Asian Earth Sci. 2012, 51, 109–120. [Google Scholar] [CrossRef]
  43. Memon, K.R.; Mahesar, A.A.; Ali, M.; Tunio, A.H.; Mohanty, U.S.; Akhondzadeh, H.; Awan, F.U.R.; Iglauer, S.; Keshavarz, A. Influence of cryogenic liquid nitrogen on petro-physical characteristics of mancos shale: An experimental investigation. Energy Fuels 2020, 34, 2160–2168. [Google Scholar] [CrossRef]
  44. Sing, K.S.W. Reporting physisorption data for gas/solid systems with special reference to the determination of surface area and porosity (Provisional). Pure Appl. Chem. 1982, 54, 2201–2218. [Google Scholar] [CrossRef]
  45. Cavelan, A.; Boussafir, M.; Rozenbaum, O.; Laggoun-Défarge, F. Organic petrography and pore structure characterization of low-mature and gas-mature marine organic-rich mudstones: Insights into porosity controls in gas shale systems. Mar. Pet. Geol. 2019, 103, 331–350. [Google Scholar] [CrossRef]
  46. Mastalerz, M.; Schimmelmann, A.; Drobniak, A.; Chen, Y.Y. Porosity of Devonian and Mississippian New Albany Shale across a maturation gradient: Insights from organic petrology, gas adsorption, and mercury intrusion. AAPG Bull. 2013, 97, 1621–1643. [Google Scholar] [CrossRef]
  47. Berner, R.A. Sedimentary pyrite formation: An update. Geochim. Cosmochim. Acta 1984, 48, 605–615. [Google Scholar] [CrossRef]
  48. Hakimi, M.H.; Abdullah, W.H.; Alqudah, M.; Makeen, Y.M.; Mustapha, K.A. Organic geochemical and petrographic characteristics of the oil shales in the Lajjun area, Central Jordan: Origin of organic matter input and preservation conditions. Fuel 2016, 181, 34–45. [Google Scholar] [CrossRef]
  49. Ko, L.T.; Loucks, R.G.; Ruppel, S.C.; Zhang, T.W.; Peng, S. Origin and characterization of Eagle Ford pore networks in the south Texas Upper Cretaceous shelf. AAPG Bull. 2017, 101, 387–418. [Google Scholar] [CrossRef]
  50. Ko, L.T.; Ruppel, S.C.; Loucks, R.G.; Hackley, P.C.; Zhang, T.W.; Shao, D.Y. Pore-types and pore-network evolution in Upper Devonian-Lower Mississippian Woodford and Mississippian Barnett mudstones: Insights from laboratory thermal maturation and organic petrology. Int. J. Coal Geol. 2018, 190, 3–28. [Google Scholar] [CrossRef]
  51. Ross, D.J.K.; Bustin, R.M. Characterizing the shale gas resource potential of Devonian–Mississippian strata in the Western Canada sedimentary basin: Application of an integrated formation evaluation. AAPG Bull. 2008, 92, 87–125. [Google Scholar] [CrossRef]
  52. Macht, F.; Eusterhues, K.; Pronk, G.J.; Totsche, K.U. Specific surface area of clay minerals: Comparison between atomic force microscopy measurements and bulk-gas (N2) and-liquid (EGME) adsorption methods. Appl. Clay Sci. 2011, 53, 20–26. [Google Scholar] [CrossRef]
  53. Omotoso, O.E.; Mikula, R.J. High surface areas caused by smectitic interstratification of kaolinite and illite in Athabasca oil sands. Appl. Clay Sci. 2004, 25, 37–47. [Google Scholar] [CrossRef]
  54. Blum, A.E.; Eberl, D.D. Measurement of clay surface areas by polyvinylpyrrolidone (PVP) sorption and its use for quantifying illite and smectite abundance. Clays Clay Miner. 2004, 52, 589–602. [Google Scholar] [CrossRef]
Figure 1. Study area location (a) and stratigraphic units (b) of the southern Sichuan Basin.
Minerals 13 01442 g001
Figure 2. Stratigraphic column for Qiongzhusi formation of the southwestern Sichuan Basin. (a) Gray shale, well L4, 3313.10–3313.40 m. (b) Gray shale, well L4, 3317.32–3317.52 m. (c) Gray silty shale, well L4, 3404.04–3404.33 m. (d) Gray shale, well L4, 3471.31–3471.55 m. (e) Gray shale, well L4, 3507.52–3507.75 m. (f) Massive black shale, well L4, 3590.64–3590.88 m. GR is abbreviation for gamma ray logs. AC is abbreviation for sonic logs. CNL is abbreviation for compensated neutron logs. DEN is abbreviation for density logs.
Minerals 13 01442 g002
Figure 3. (a) Vertical variation of TOC content in the shale of Qiongzhusi Formation. The samples are the well and sample number. (b) The percentage of mineral compositions. (c) The lithofacies classification based on mineralogy. (d) TOC contents in different lithofacies. Note: CM, CM-1, CM-2, and CM-3 represent mudstone, siliceous argillaceous shale, argillaceous shale, and calcareous argillaceous shale, respectively. M, M-1, M-2, and M-3 represent mixed shale, calcareous siliceous mixed shale, argillaceous siliceous mixed shale, and argillaceous calcareous mixed shale, respectively. S, S-1, S-2, and S-3 represent siliceous rock, calcareous siliceous shale, siliceous shale, and argillaceous siliceous shale, respectively. C, C-1, C-2, and C-3 represent limestone, siliceous calcareous shale, calcareous shale, and argillaceous calcareous shale, respectively.
Minerals 13 01442 g003
Figure 4. Thin section photos of different lithofacies of Qiongzhusi Formation in Well L4 in southwestern Sichuan Basin, plane-polarized light. (a) S-3 shale, 3589.38 m. (b) S-2 shale, 3434.46 m. (c) S-3 shale, 3368.41 m. (d) S-3 shale, 3317.93 m. (e) S-3 shale, 3313.44 m. (f) S-3 shale, 3589.38 m. (g) S-2 shale, 3434.46 m. (h) S-3 shale, 3368.41 m. (i) S-3 shale, 3317.93 m. (j) S-3 shale, 3313.44 m.
Minerals 13 01442 g004
Figure 5. FE-SEM image of organic pores in shale samples from the Qiongzhusi Formation in southwestern Sichuan. (a) Honeycomb organic pores in kerogen, well W1, 3297.55 m. (b) Organic pores in kerogen, well L4, 3325.17 m. (c) Organic pores in kerogen, well L4, 3403.02 m. (d) Organic pores in kerogen which in pyrite pore, well W1, 3294.49 m. (e) Organic pores in kerogen, well W1, 3288.28 m. (f) Honeycomb organic pores in kerogen, well W1 3297.55 m. (g) Organic pores in kerogen, well L4 3419.22 m. (h) Organic pores in kerogen, well L4 3355.29 m. (i) Organic pores in kerogen, well L4 3311.82 m. (j) Organic pores in kerogen, well L4 3313.44 m.
Minerals 13 01442 g005
Figure 6. FE-SEM image of inorganic mineral pores in shale samples from the Qiongzhusi Formation in southwestern Sichuan. (a) Clay pore, well W1, 3328.72 m. (b) Clay pore, well W1, 3363.08 m. (c) Clay pores, well W1, 3328.72 m. (d) Clay pores, well W1, 3311.82 m. (e) Clay pores in clay mineral and microfracture in quartz, well W1, 3313.44 m. (f) Pyrite pores, well W1, 3328.72 m. (g) Pyrite pores, well W1, 3325.17 m. (h) Pyrite pores, well W1, 3355.29 m. (i) Pyrite pores, well W1, 3317.93 m. (j) Pyrite pores, well W1, 3313.44 m. (k) Microfracture, well W1, 3328.72 m. (l) Microfracture, well W1, 3325.17 m. (m) Microfracture, well W1, 3388.68 m. (n) Microfracture, well W1, 3315.74 m. (o) Microfracture, well W1, 3313.44 m.
Minerals 13 01442 g006
Figure 7. Pore size distribution of different lithofacies of Qiongzhusi Formation shale characterized by high-pressure mercury intrusion. L4-2 and L4-4 etc. are well and sample numbers (Figure 3). (a) Pore size distribution of Siliceous argillaceous shale (CM-1). (b) Pore size distribution of Argillaceous siliceous mixed shale (M-2). (c) Pore size distribution of Siliceous rock (S). (d) Pore size distribution of Calcareous siliceous shale (S-2). (e) Pore size distribution of Argillaceous siliceous shale (S-3). (f) Macropore volume of different lithofacies.
Minerals 13 01442 g007
Figure 8. N2 adsorption-desorption curves of different lithofacies of the Qiongzhusi Formation shale in southwest Sichuan basin. L4-2 and L4-4 etc. are well and sample numbers (Figure 3). (a) hysteresis loop of siliceous argillaceous shale (CM-1). (b) hysteresis loop of Argillaceous siliceous mixed shale (M-2). (c) hysteresis loop of siliceous rock (S). (d) hysteresis loop of calcareous siliceous shale (S-2). (e) hysteresis loop of pore size distribution of Argillaceous siliceous shale (S-3). (f) Types of LN2GA hysteresis loop by IUPAC.
Minerals 13 01442 g008
Figure 9. Pore size distribution of Qiongzhusi Formation shale characterized by N2 adsorption in southwest Sichuan basin. L4-2 and L4-4 etc. are well and sample numbers (Figure 3). (a) Siliceous argillaceous shale. (b) Argillaceous siliceous mixed shale. (c) Siliceous rock (S). (d) Calcareous siliceous shale (S-2). (e) Pore size distribution of Argillaceous siliceous shale (S-3). (f) Mesopores volume of different lithofacies.
Minerals 13 01442 g009
Figure 10. Pore size distribution of Qiongzhusi Formation shale characterized by CO2 adsorption in southwest Sichuan basin. L4-2 and L4-4 etc. are well and sample numbers (Figure 3). (a) Siliceous argillaceous shale. (b) Argillaceous siliceous mixed shale. (c) Siliceous rock (S). (d) Calcareous siliceous shale (S-2). (e) Pore size distribution of Argillaceous siliceous shale (S-3). (f) Micropores volume of different lithofacies.
Minerals 13 01442 g010
Figure 11. The average value of pore structure parameters of different lithofacies and the relationship between TOC and micropore parameters. (a) Average values of TOC and pore structure parameters in siliceous argillaceous shale (CM-1). (b) Average values of TOC and pore structure parameters in argillaceous siliceous mixed shale (M-2). (c) Average values of TOC and pore structure parameters in siliceous rock (S). (d) Average values of TOC and pore structure parameters in calcareous siliceous shale (S-2). (e) Pore size distribution of Argillaceous siliceous shale (S-3). (f) The relationship between TOC and micropore volume. (g) The relationship between TOC and CO2 specific surface area.
Minerals 13 01442 g011
Figure 12. Correlation between pyrite content and pore structure parameters. (a) Pyrite content vs. micropore volume. (b) Pyrite content vs. mesopore volume. (c) Pyrite content vs. macropore volume. (d) Pyrite content vs. CO2 specific surface area. (e) Pyrite content vs. N2 specific surface area. (f) Pyrite content in different lithofacies.
Minerals 13 01442 g012
Figure 13. (ae) Pore size distribution characteristics of different lithofacies based on the data of CO2 adsorption experiment, N2 adsorption experiment and high-pressure mercury injection. (fn) Correlation between minerals content and pore volume.
Minerals 13 01442 g013
Figure 14. Specific surface area distribution and the correlation between minerals content and the N2 specific surface area and CO2 specific surface area. (ac) Minerals content vs. CO2 specific surface area. (d) CO2 specific surface area distribution and minerals content. (eg) Minerals content vs. N2 specific surface area. (h) N2 specific surface area distribution and minerals content.
Minerals 13 01442 g014
Figure 15. Correlation between different clay mineral content and the pore volume of micropores. (a) Relative content of Mixed-layer I/S in clay minerals vs. micropore volume. (b) Relative content of illite in clay minerals vs. micropore volume. (c) Relative content of chlorite in clay minerals vs. micropore volume.
Minerals 13 01442 g015
Disclaimer/Publisher’s Note: The statements, opinions and data contained in all publications are solely those of the individual author(s) and contributor(s) and not of MDPI and/or the editor(s). MDPI and/or the editor(s) disclaim responsibility for any injury to people or property resulting from any ideas, methods, instructions or products referred to in the content.

