
A Data-Driven Approach to the Unified Evaluation of Conventional and Unconventional Hydrocarbon Resources: Application to Low-Mature to Mature Source Rocks in the Liaohe Western Depression
 ,
,
Abstract
:1. Introduction
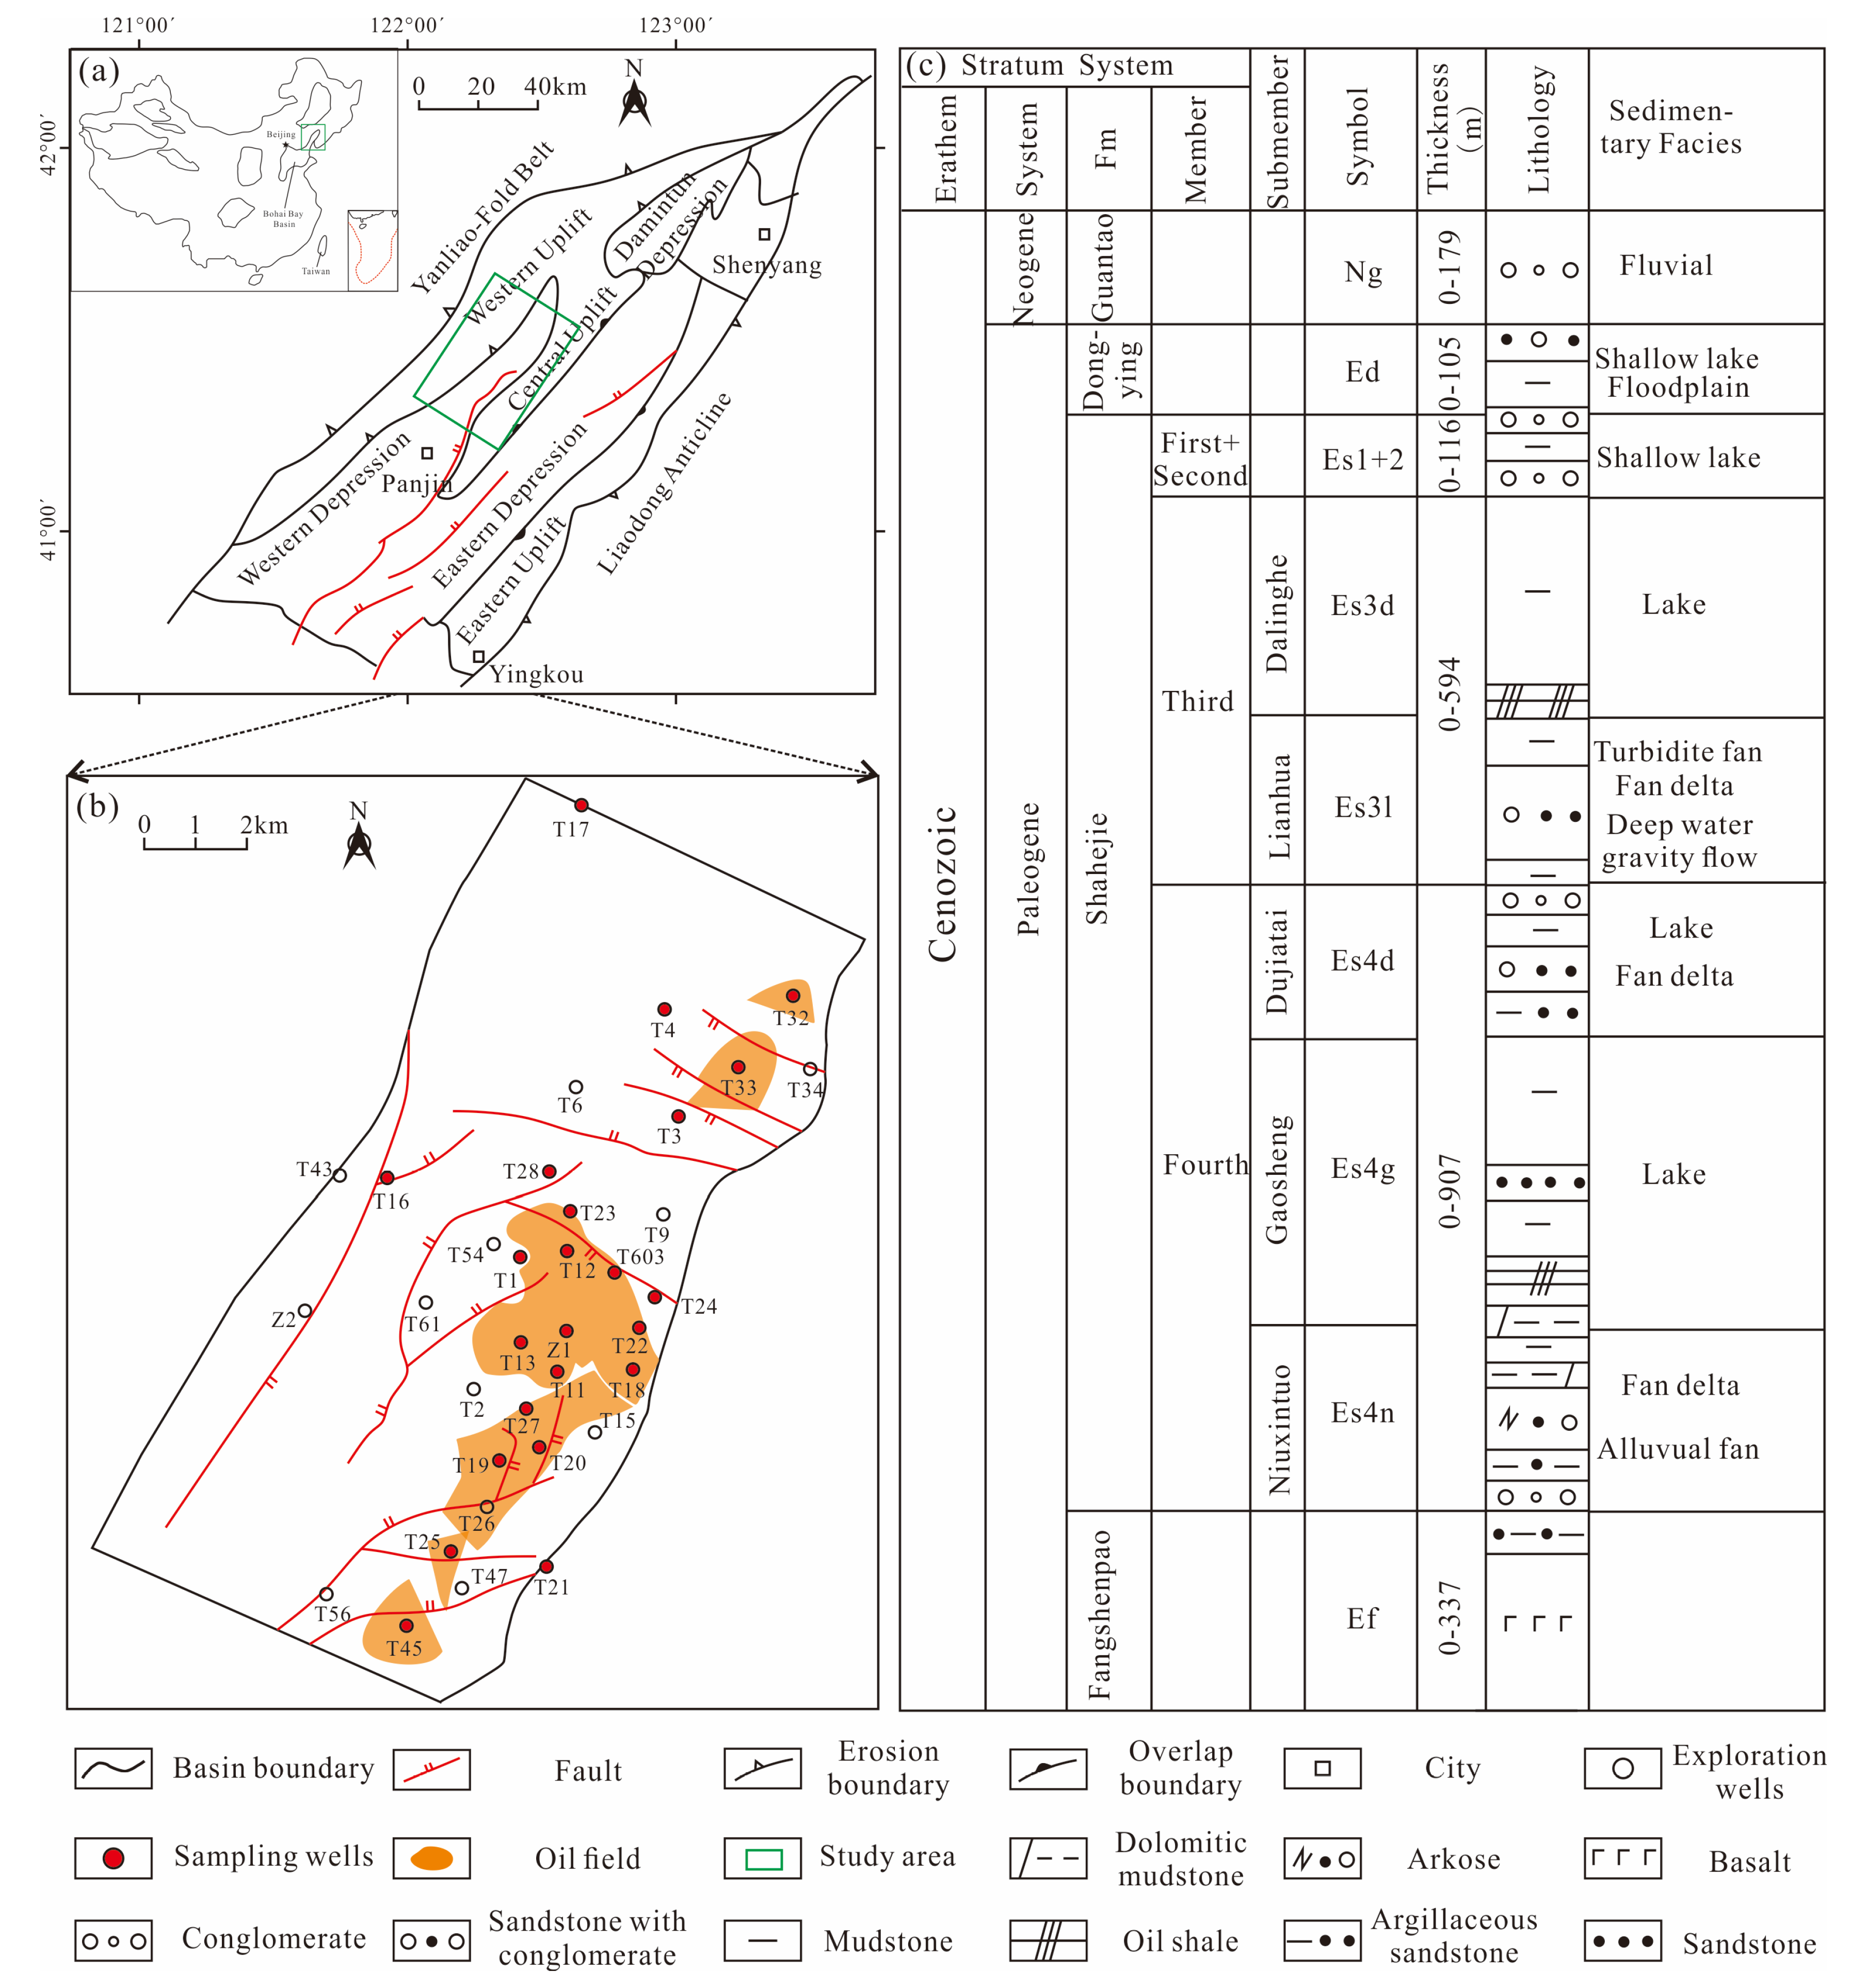
2. Geological Setting
2.1. Tectonic Setting
2.2. Sedimentary Environment
3. Material and Methods
3.1. Samples and Laboratory Instruments
3.2. Methods
4. Results and Discussion
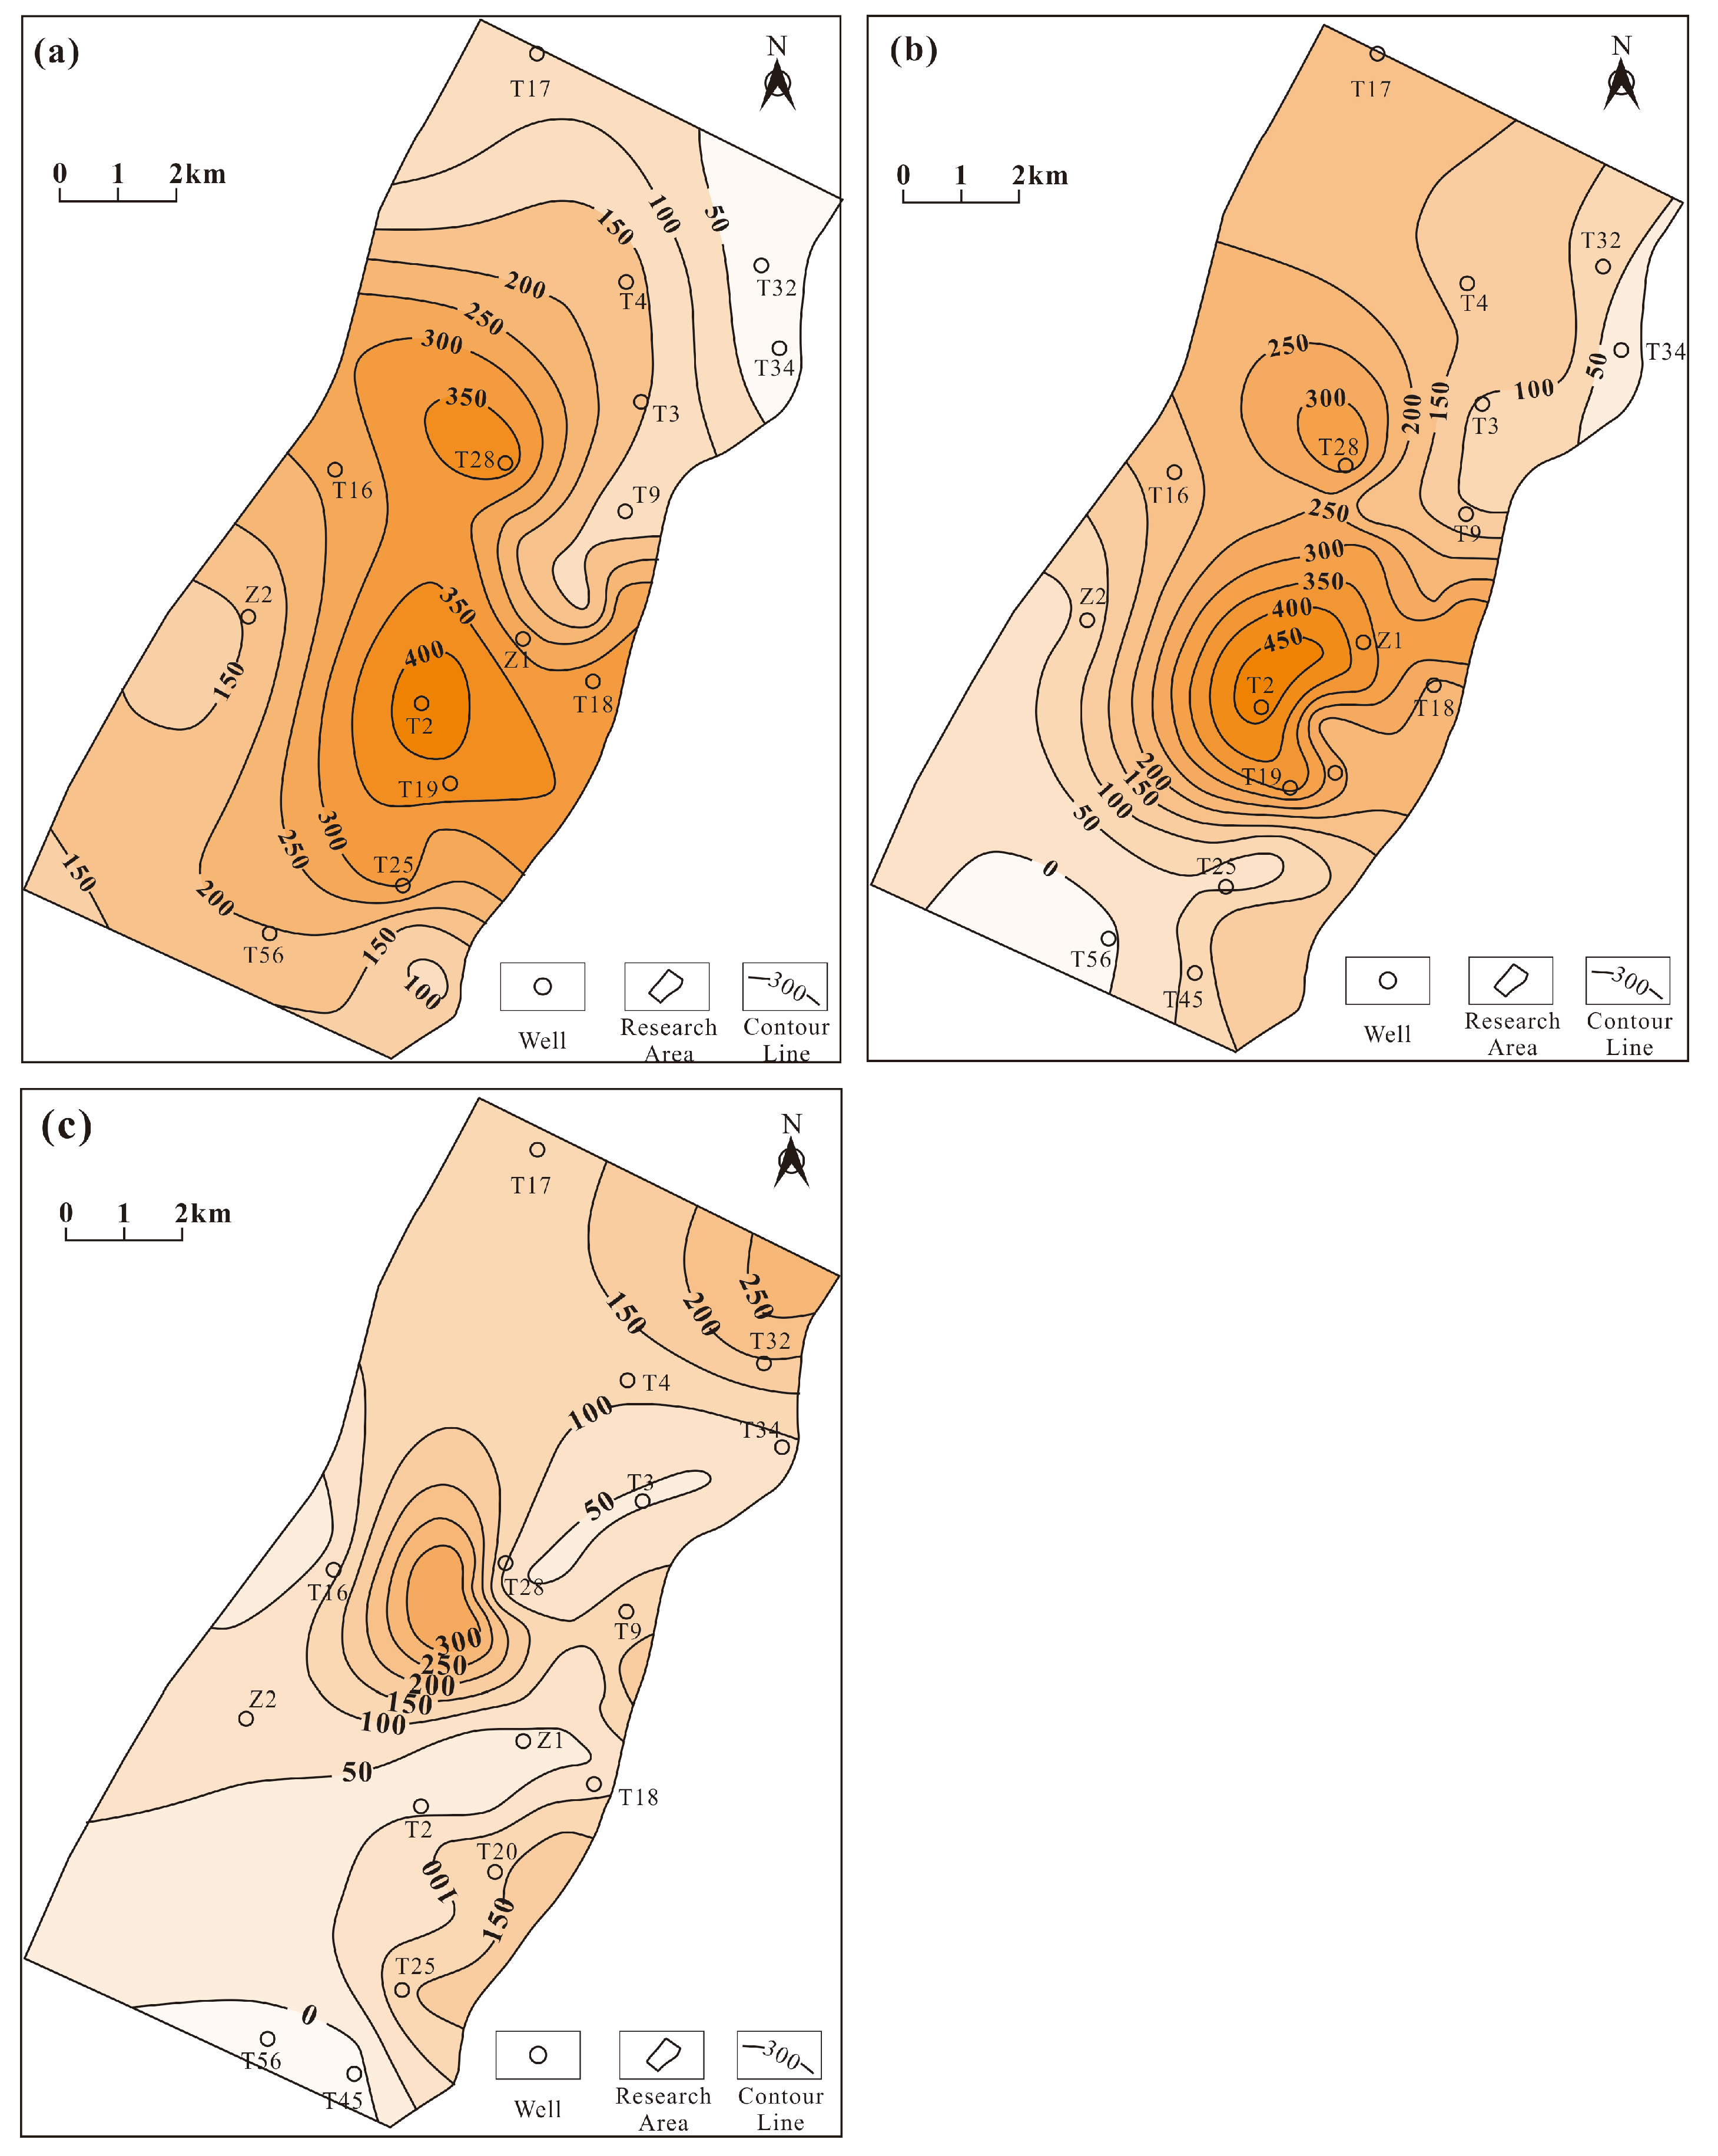
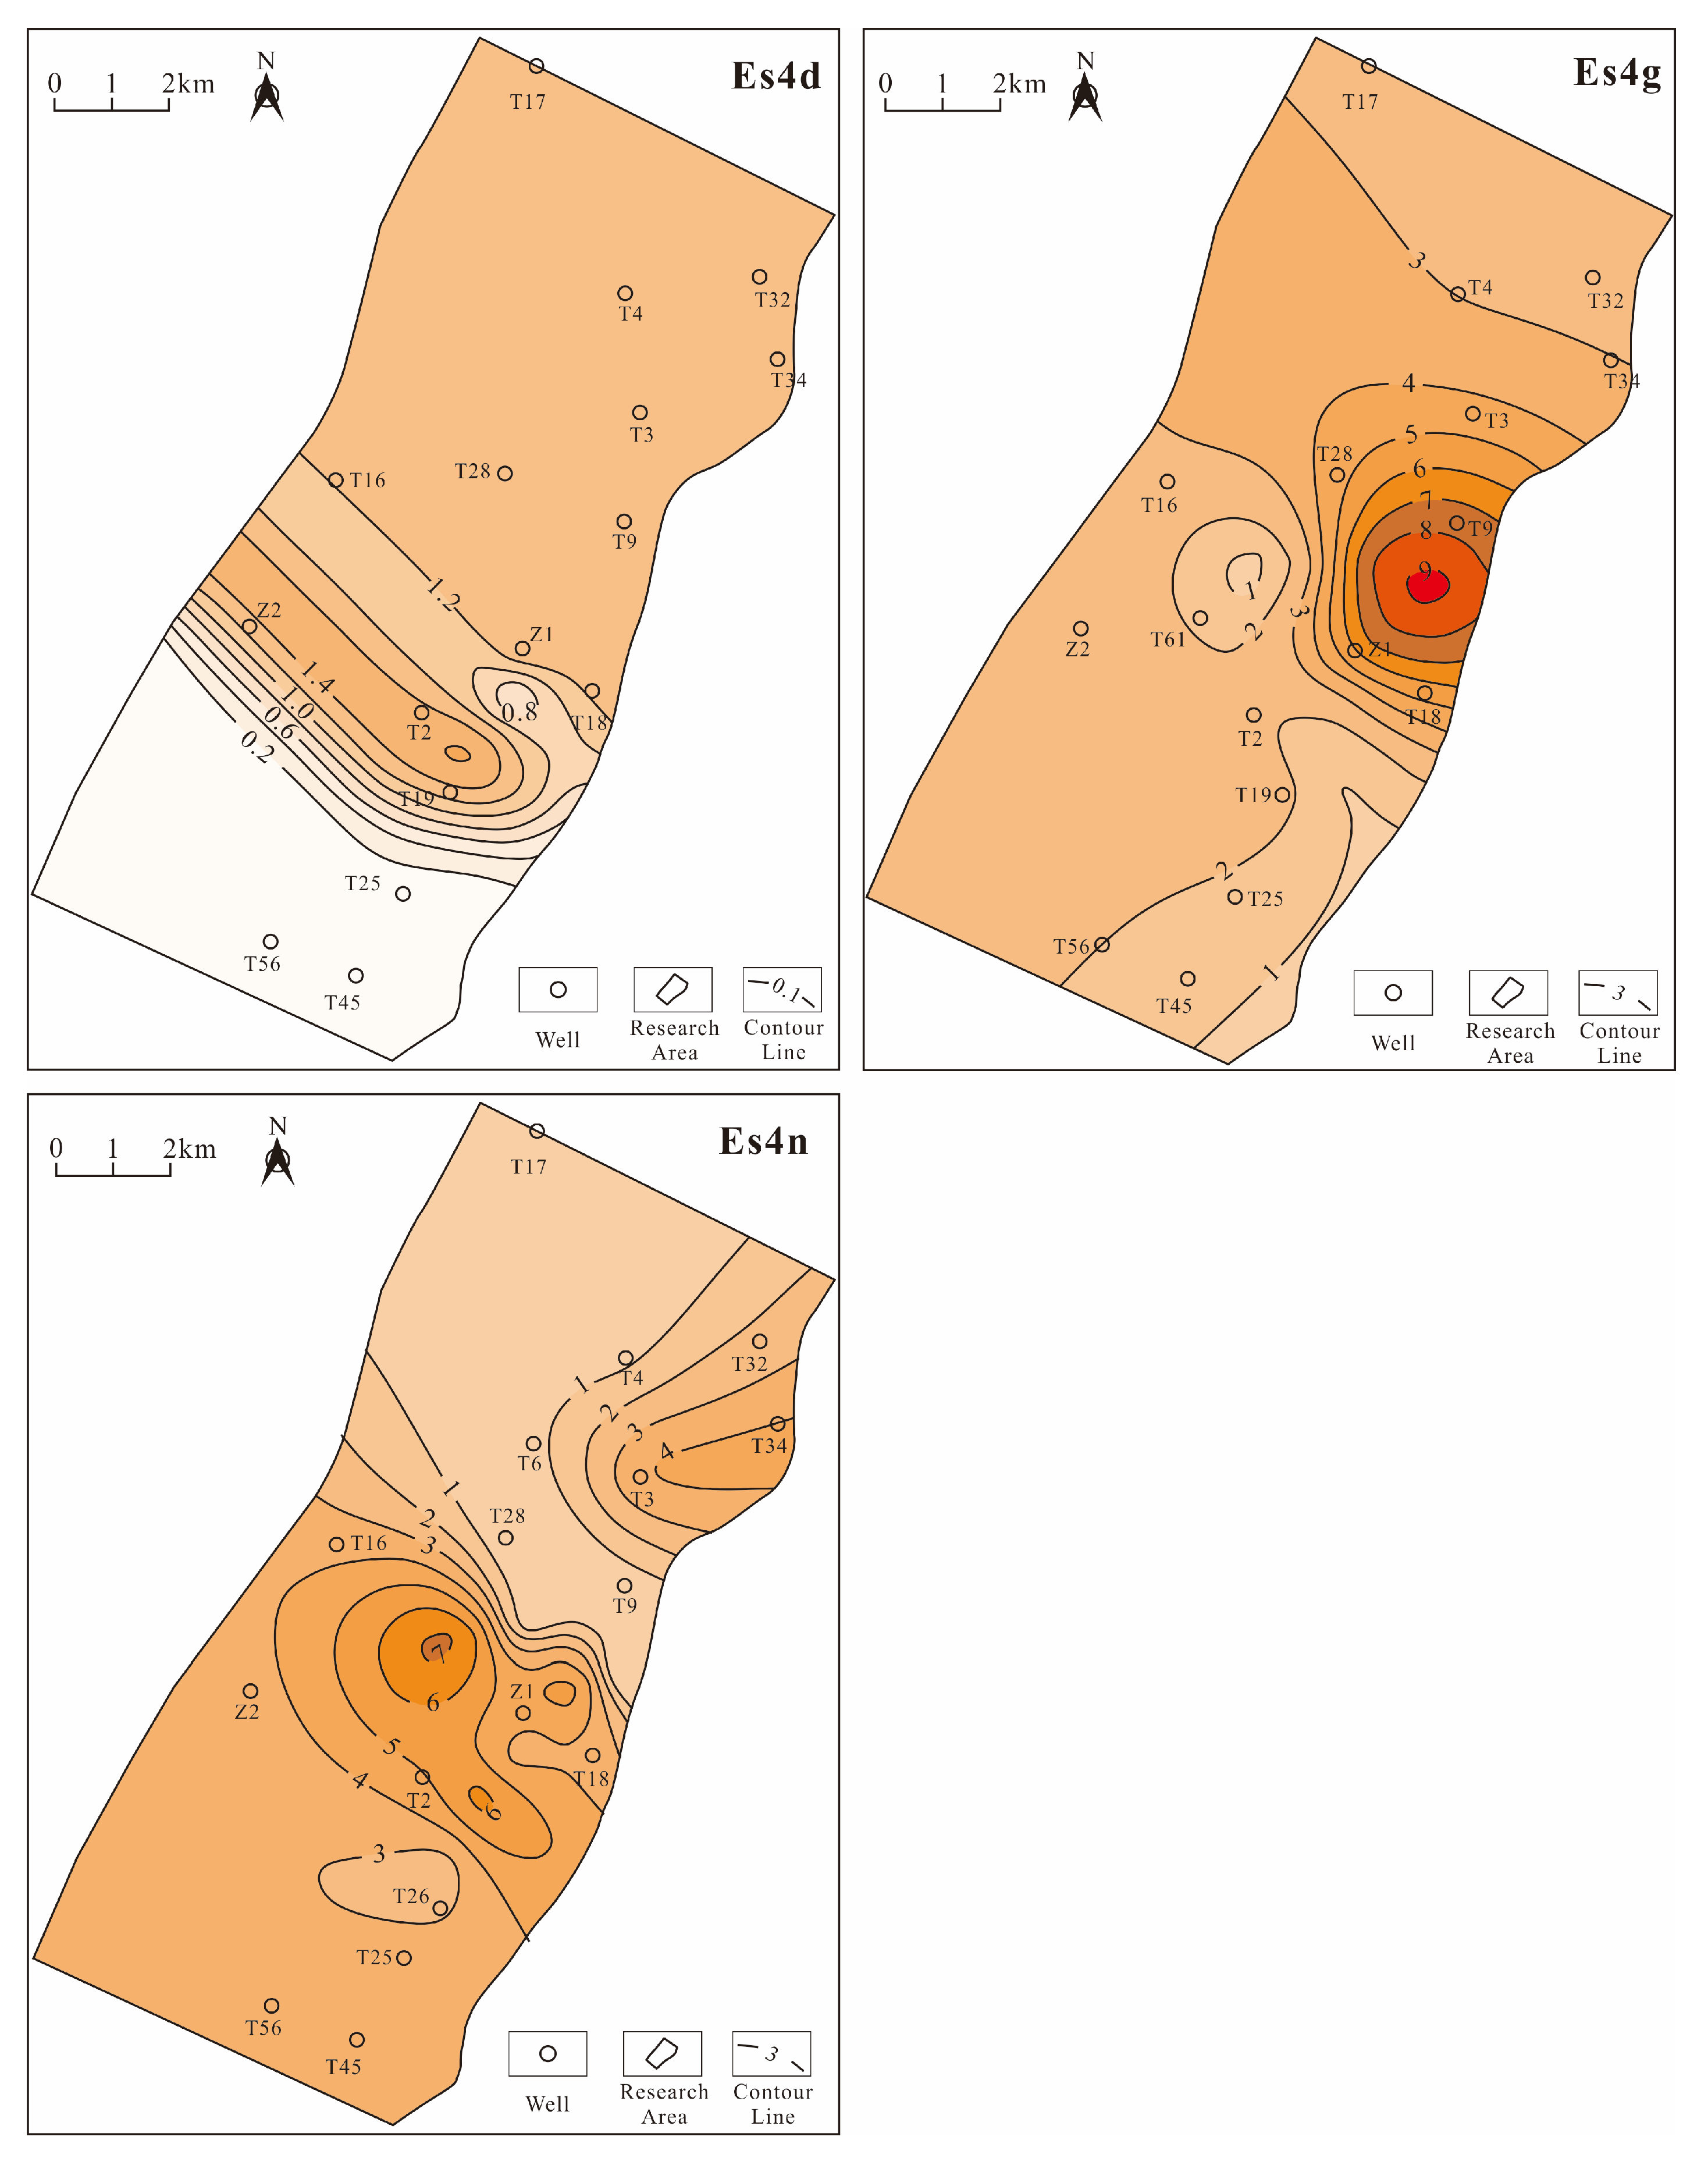
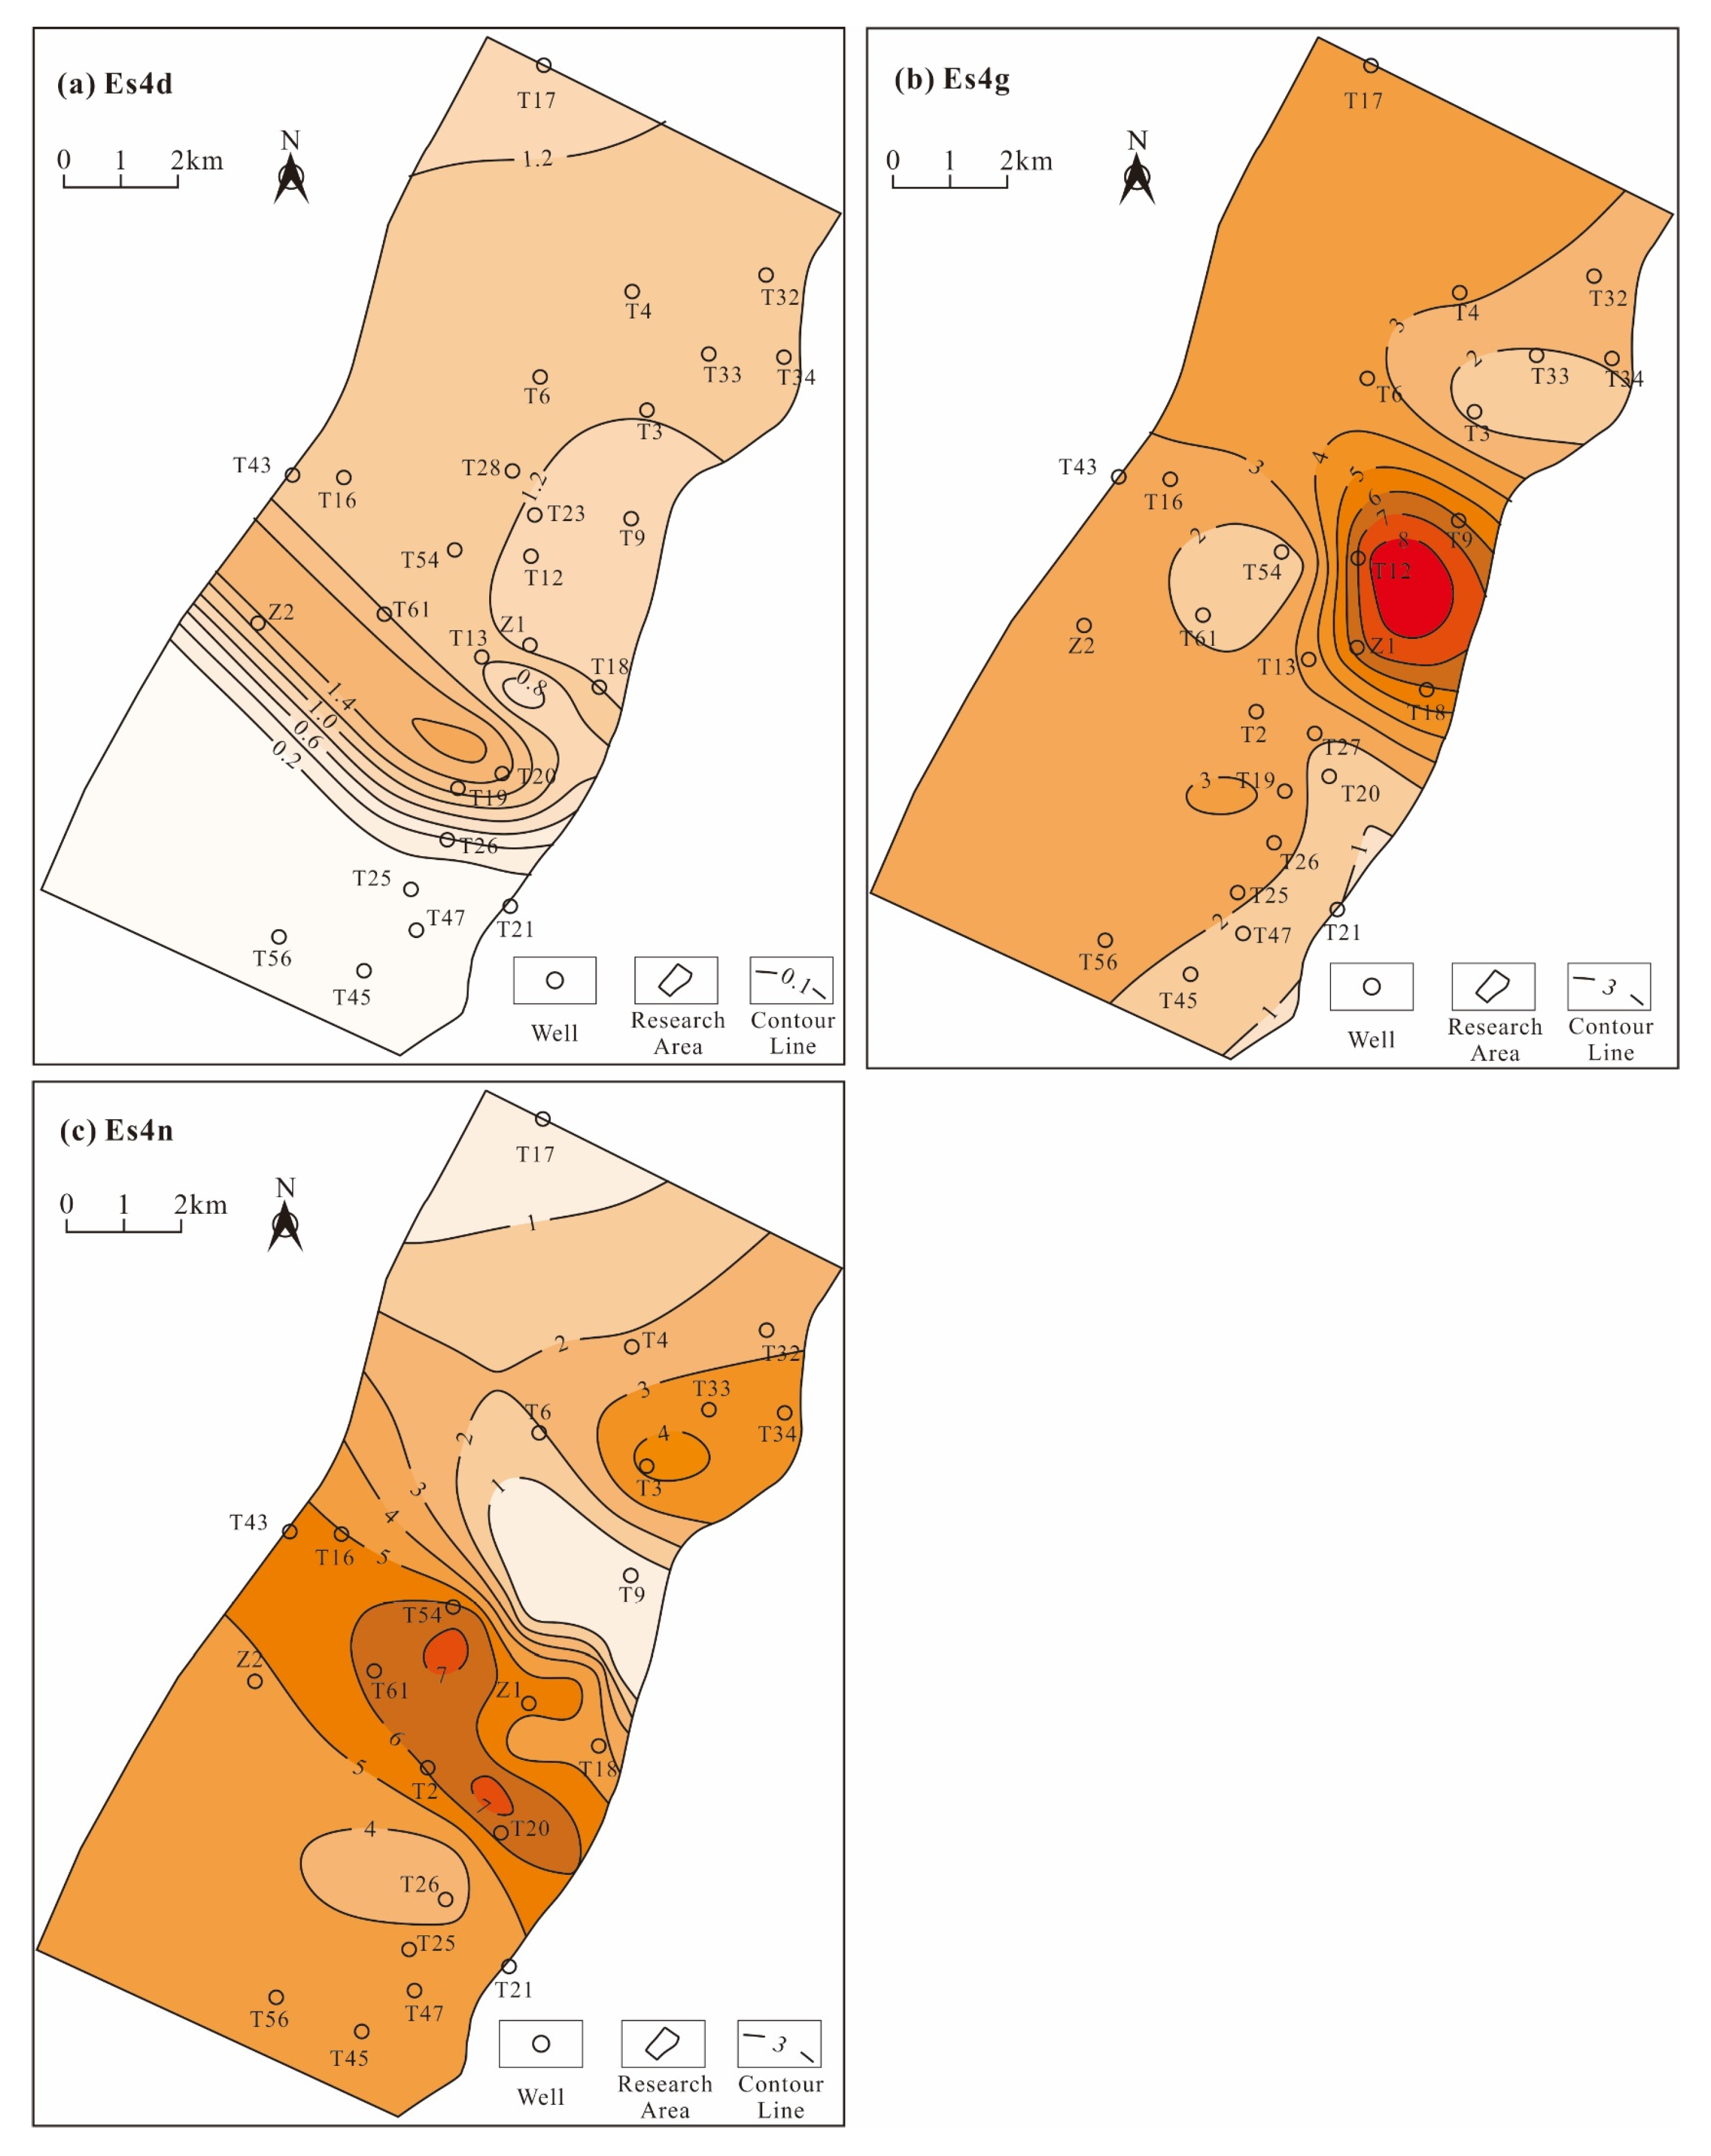
4.1. Thickness of the Es4 Source Rocks
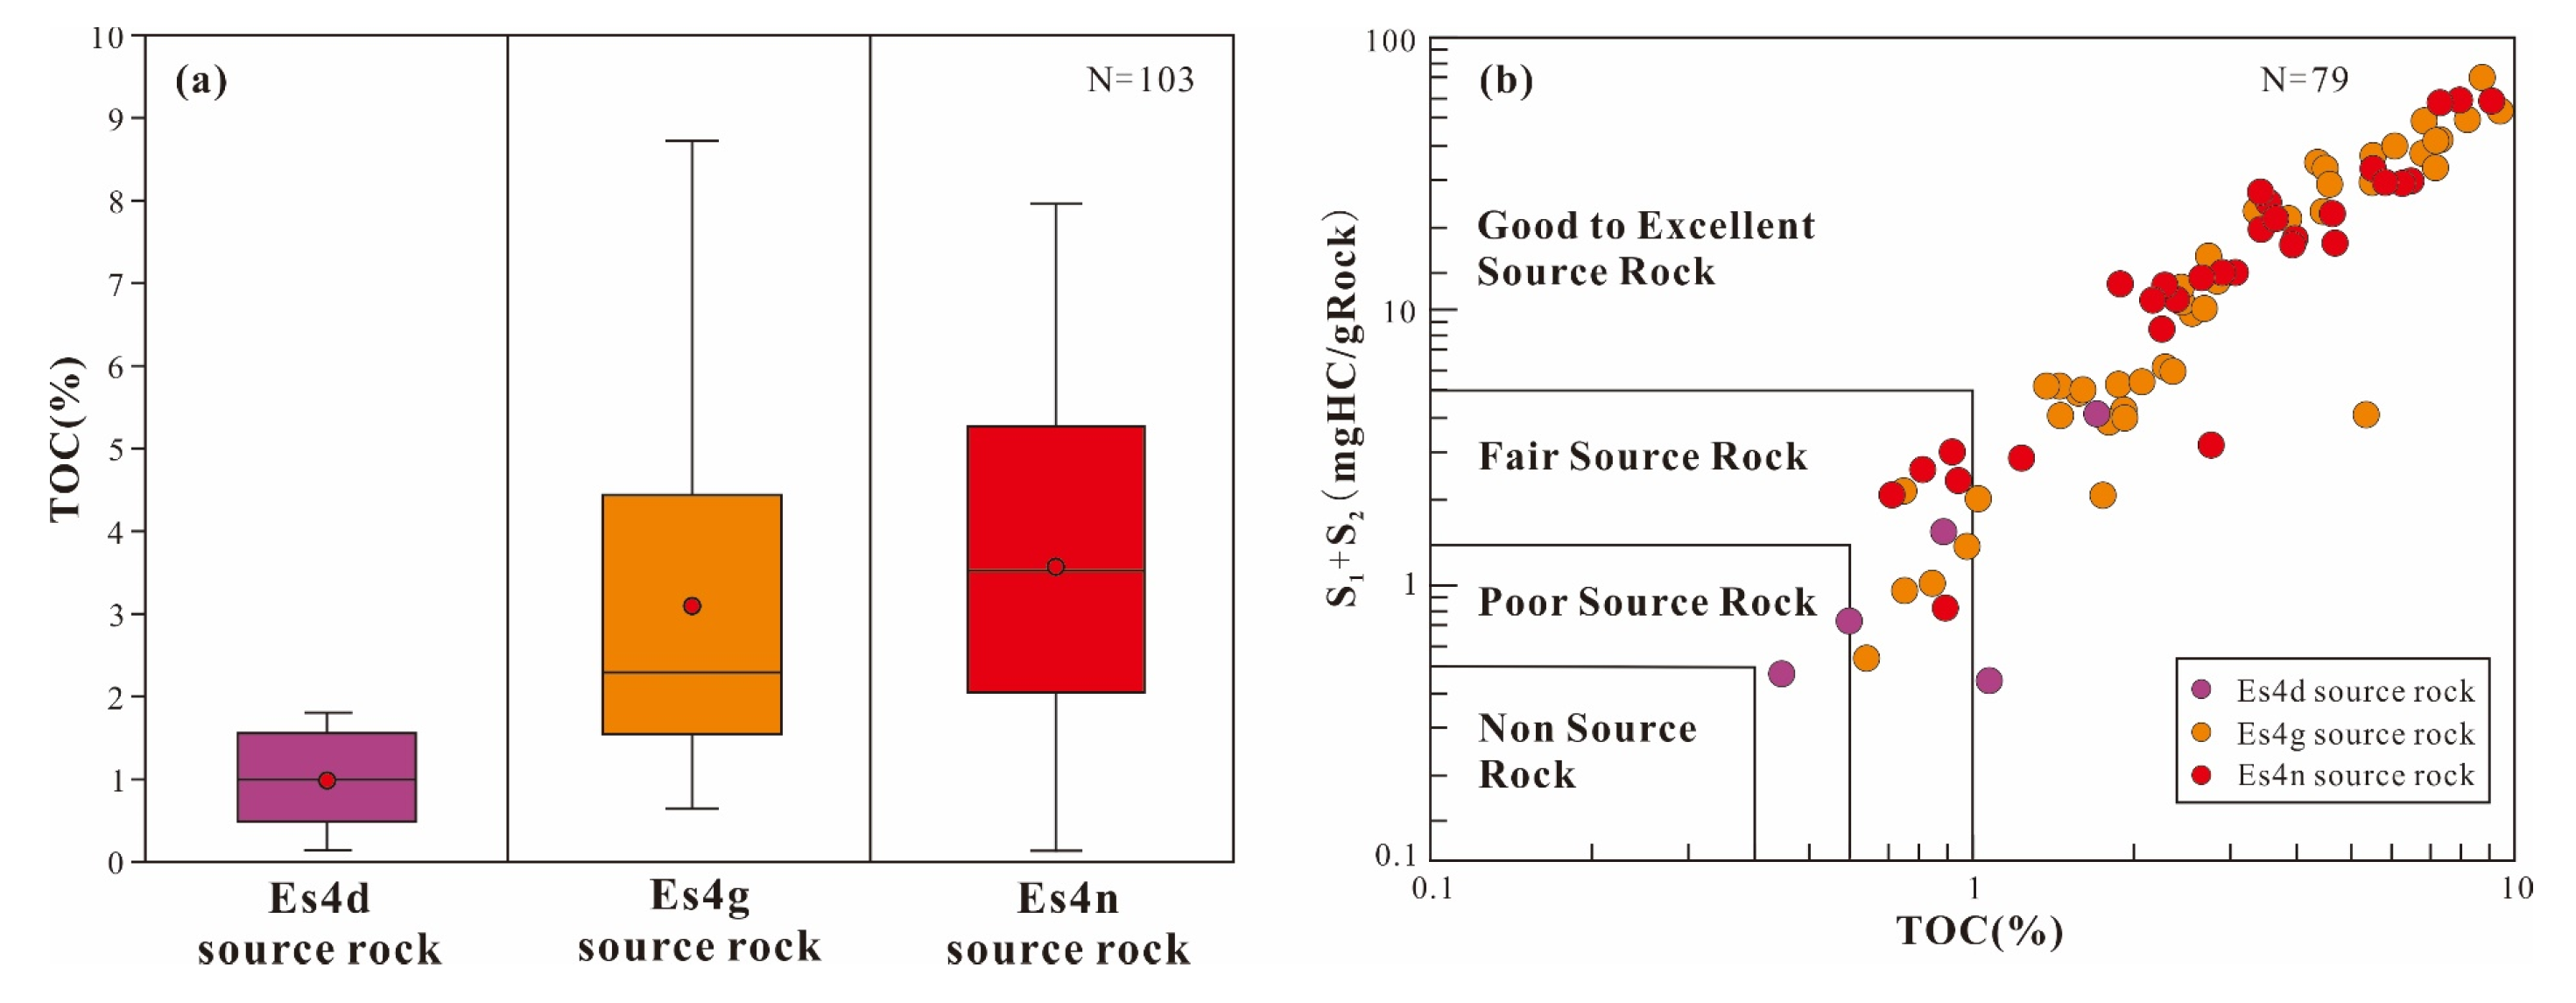
4.2. OM Abundance
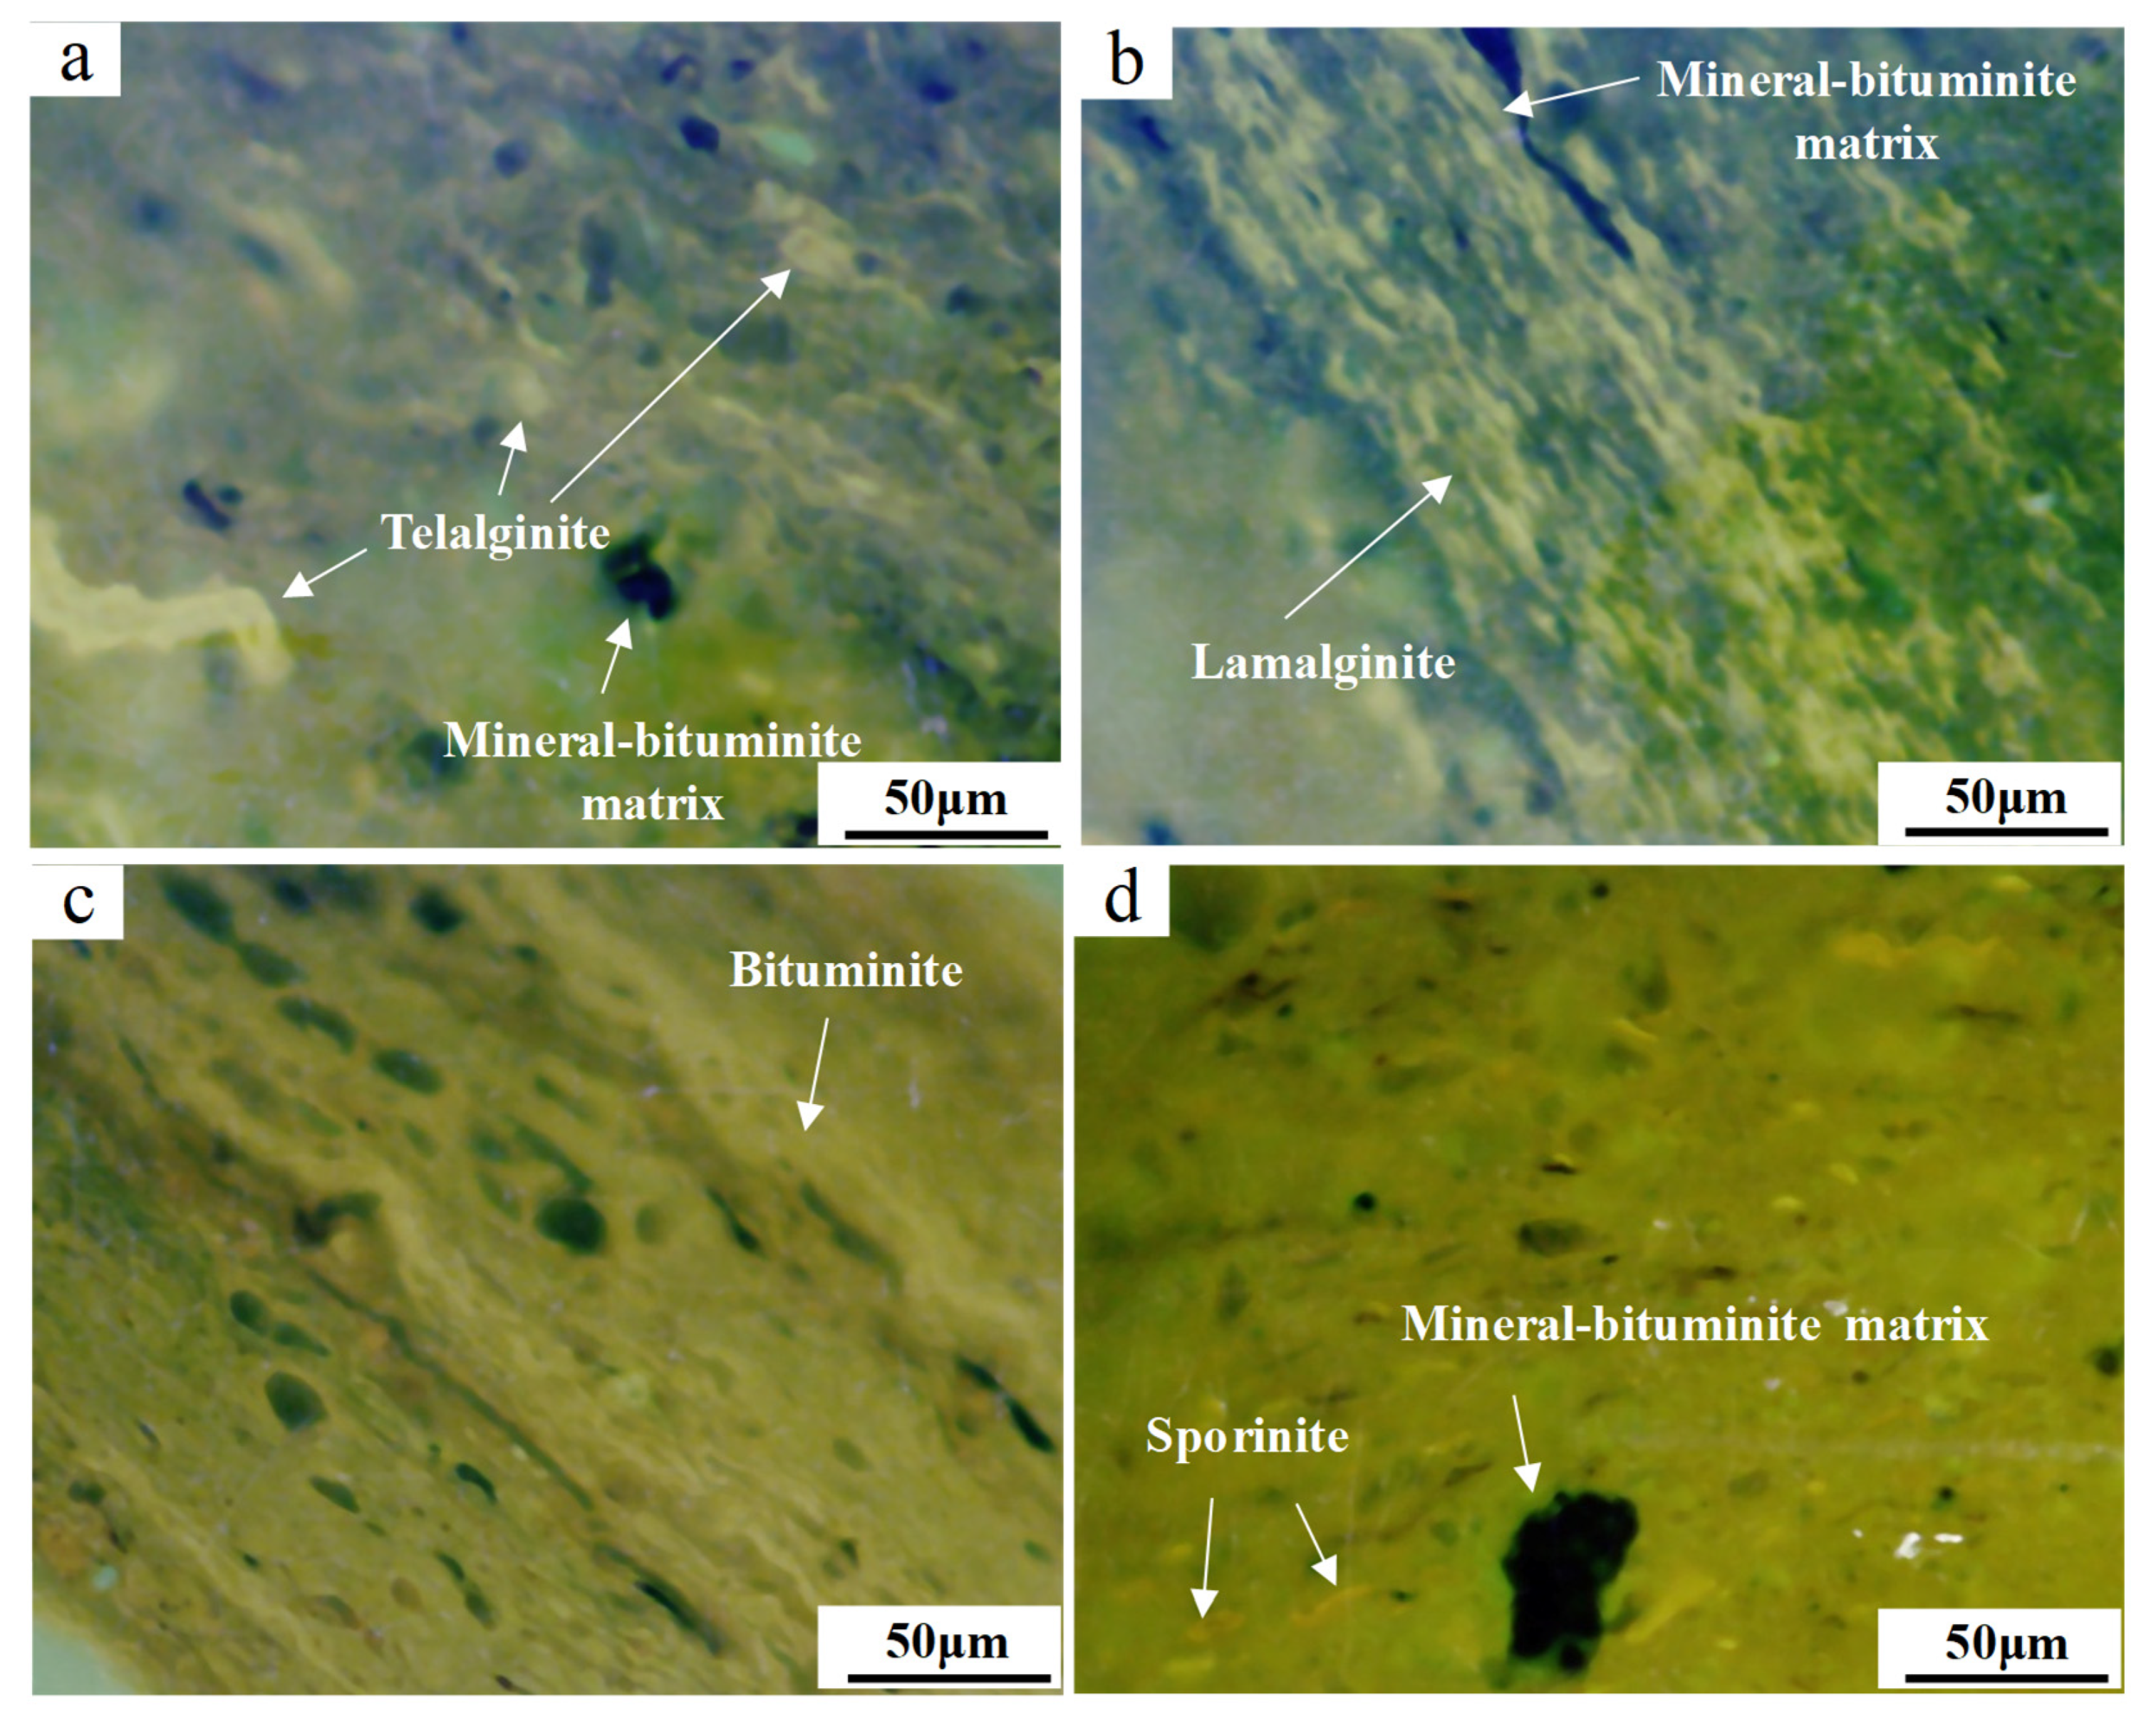
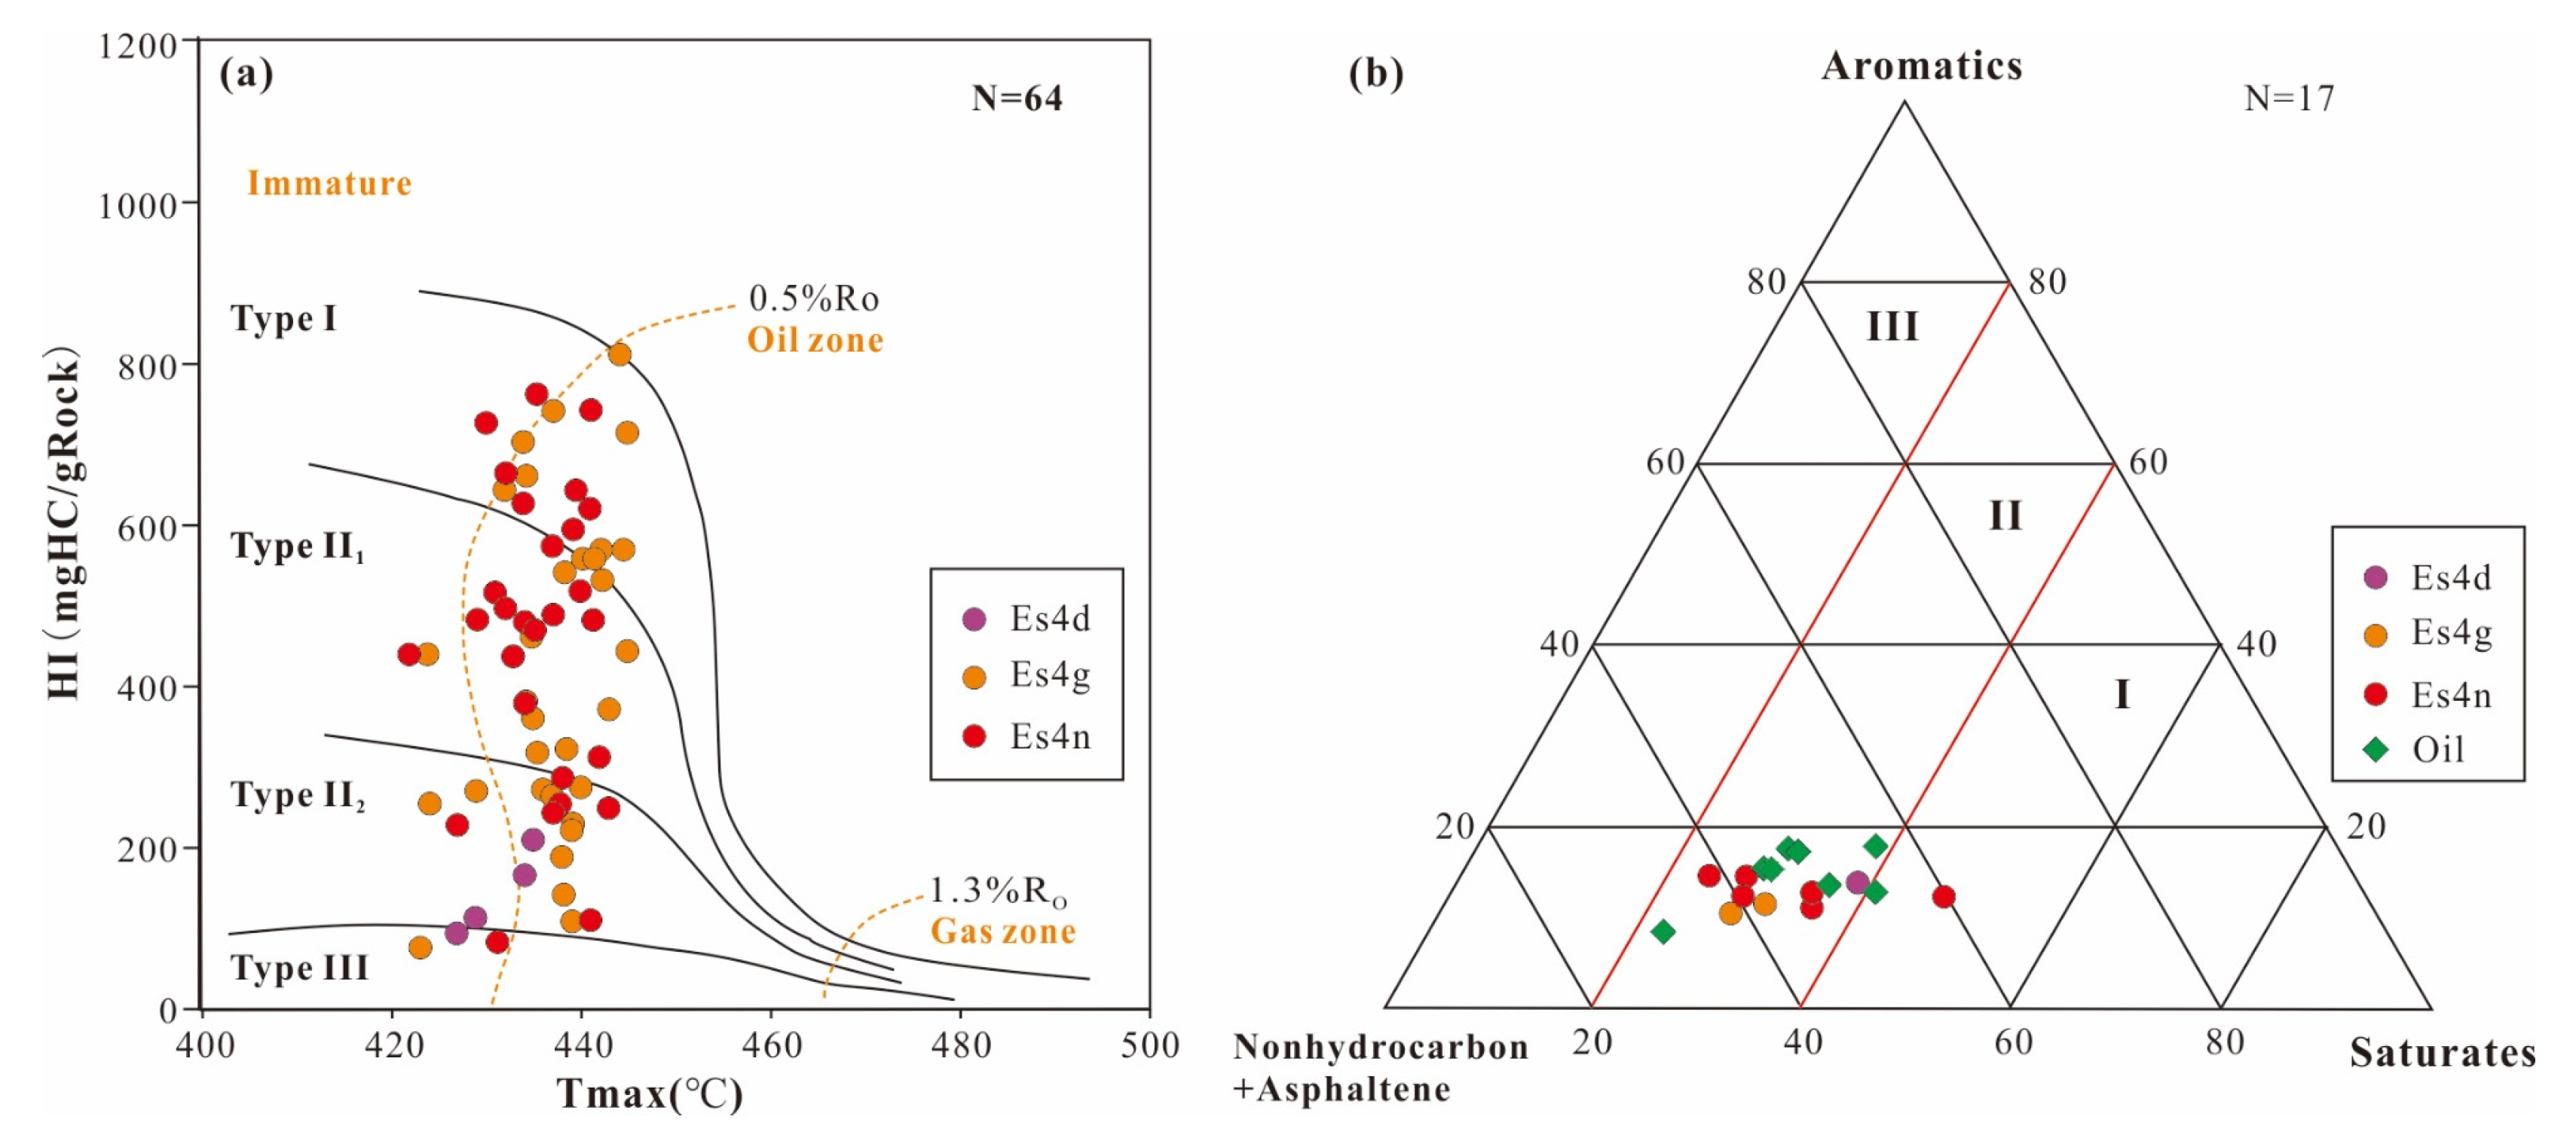
4.3. OM Type
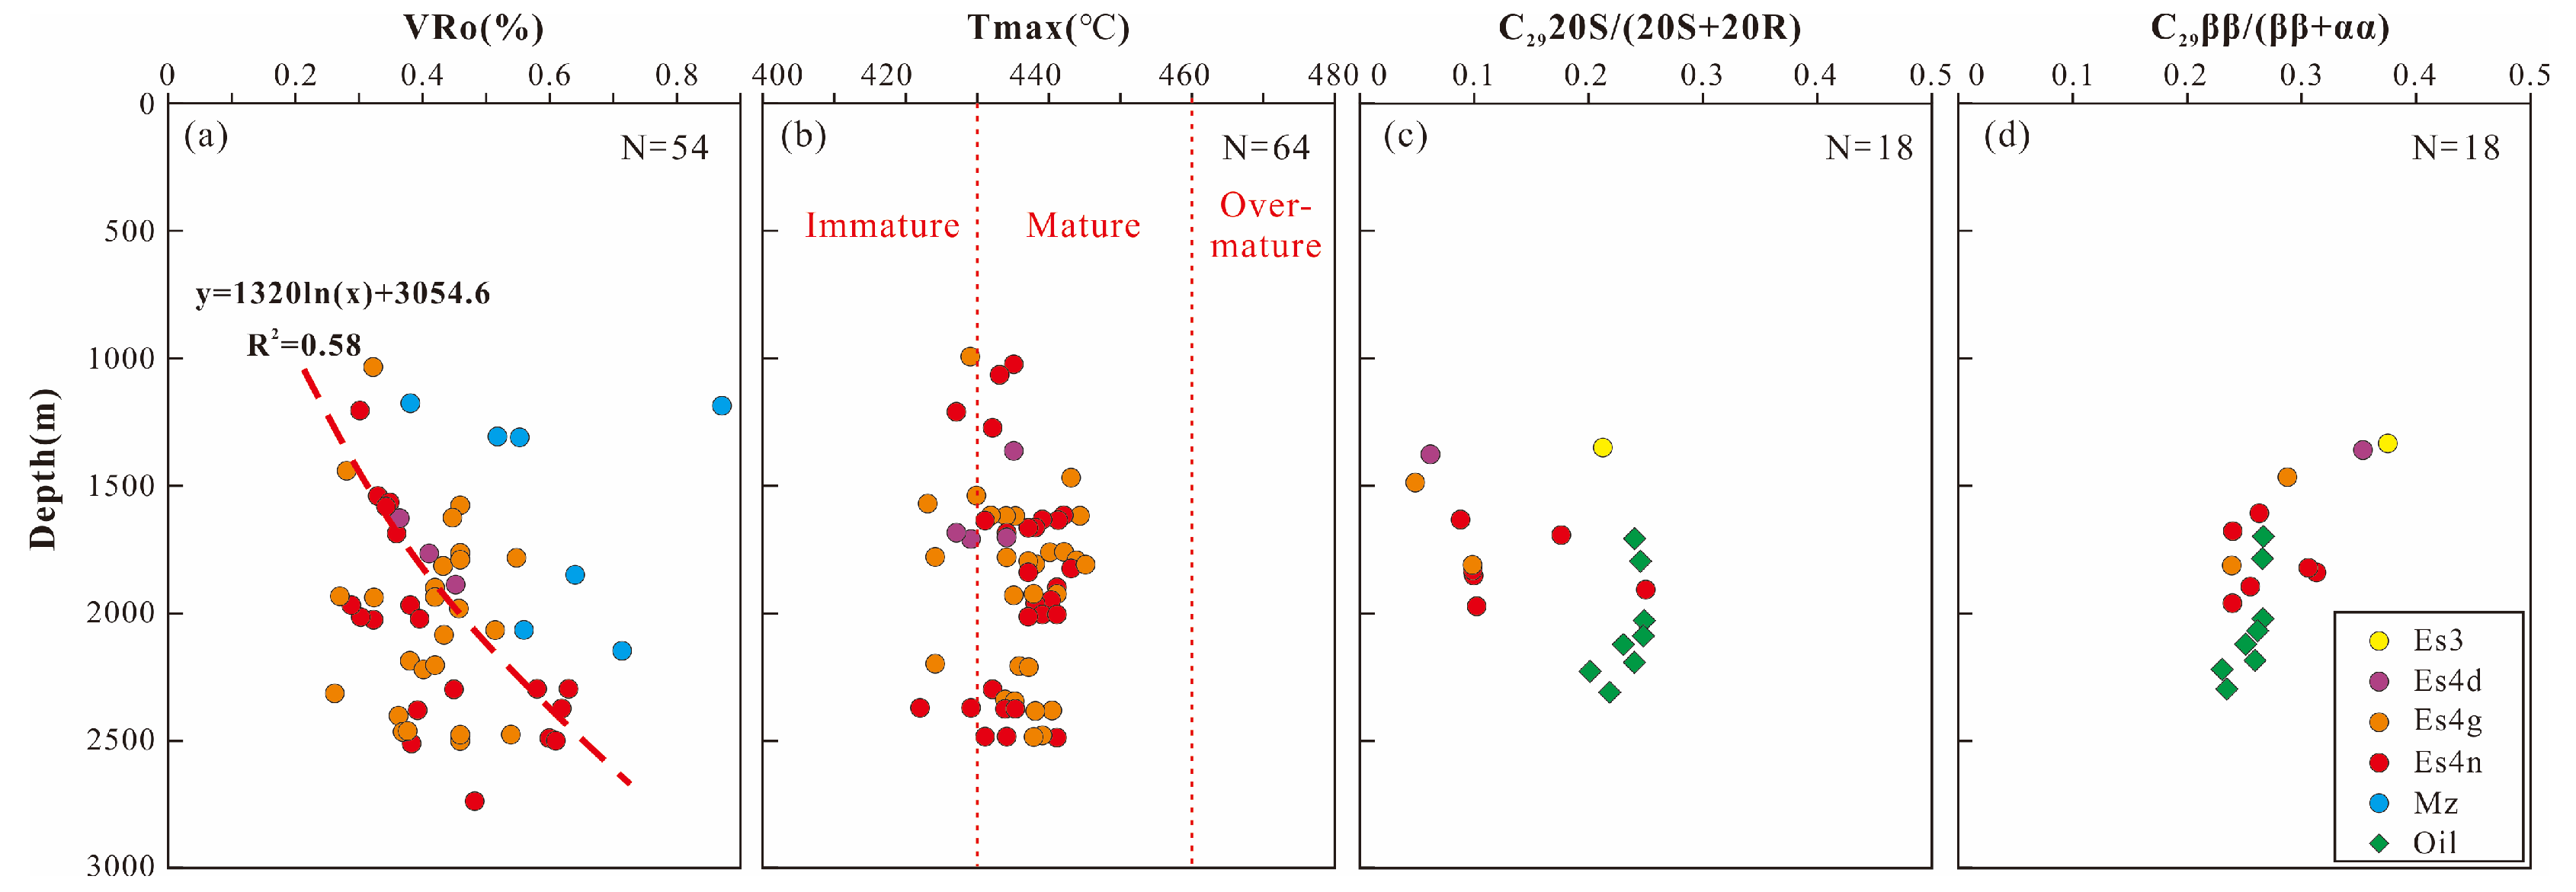
4.4. Thermal Maturity
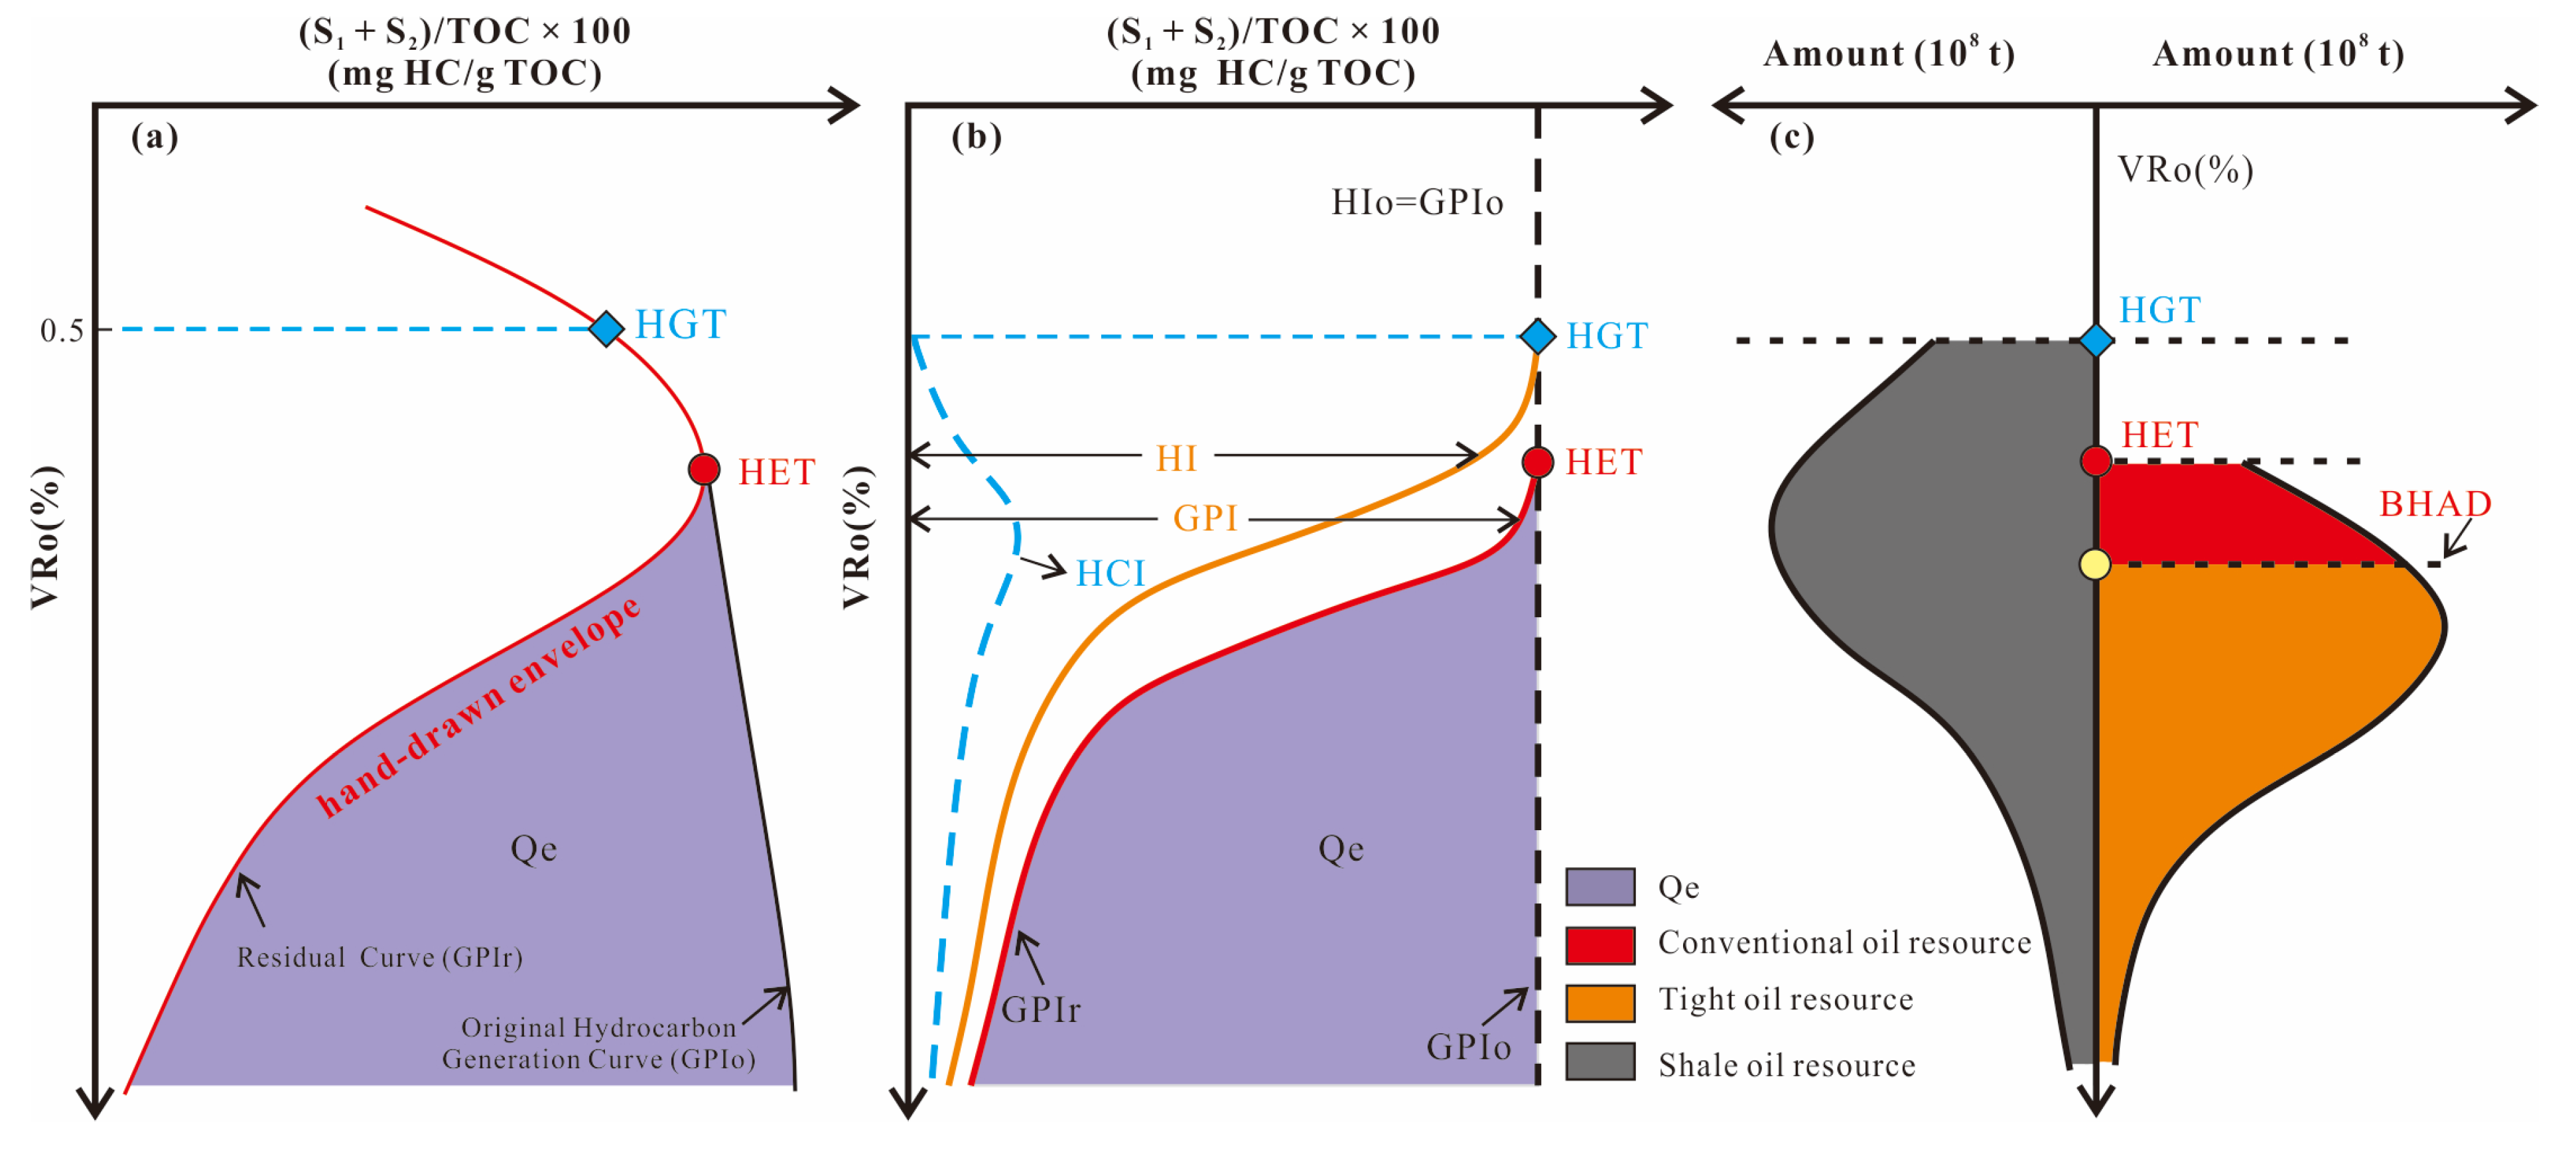
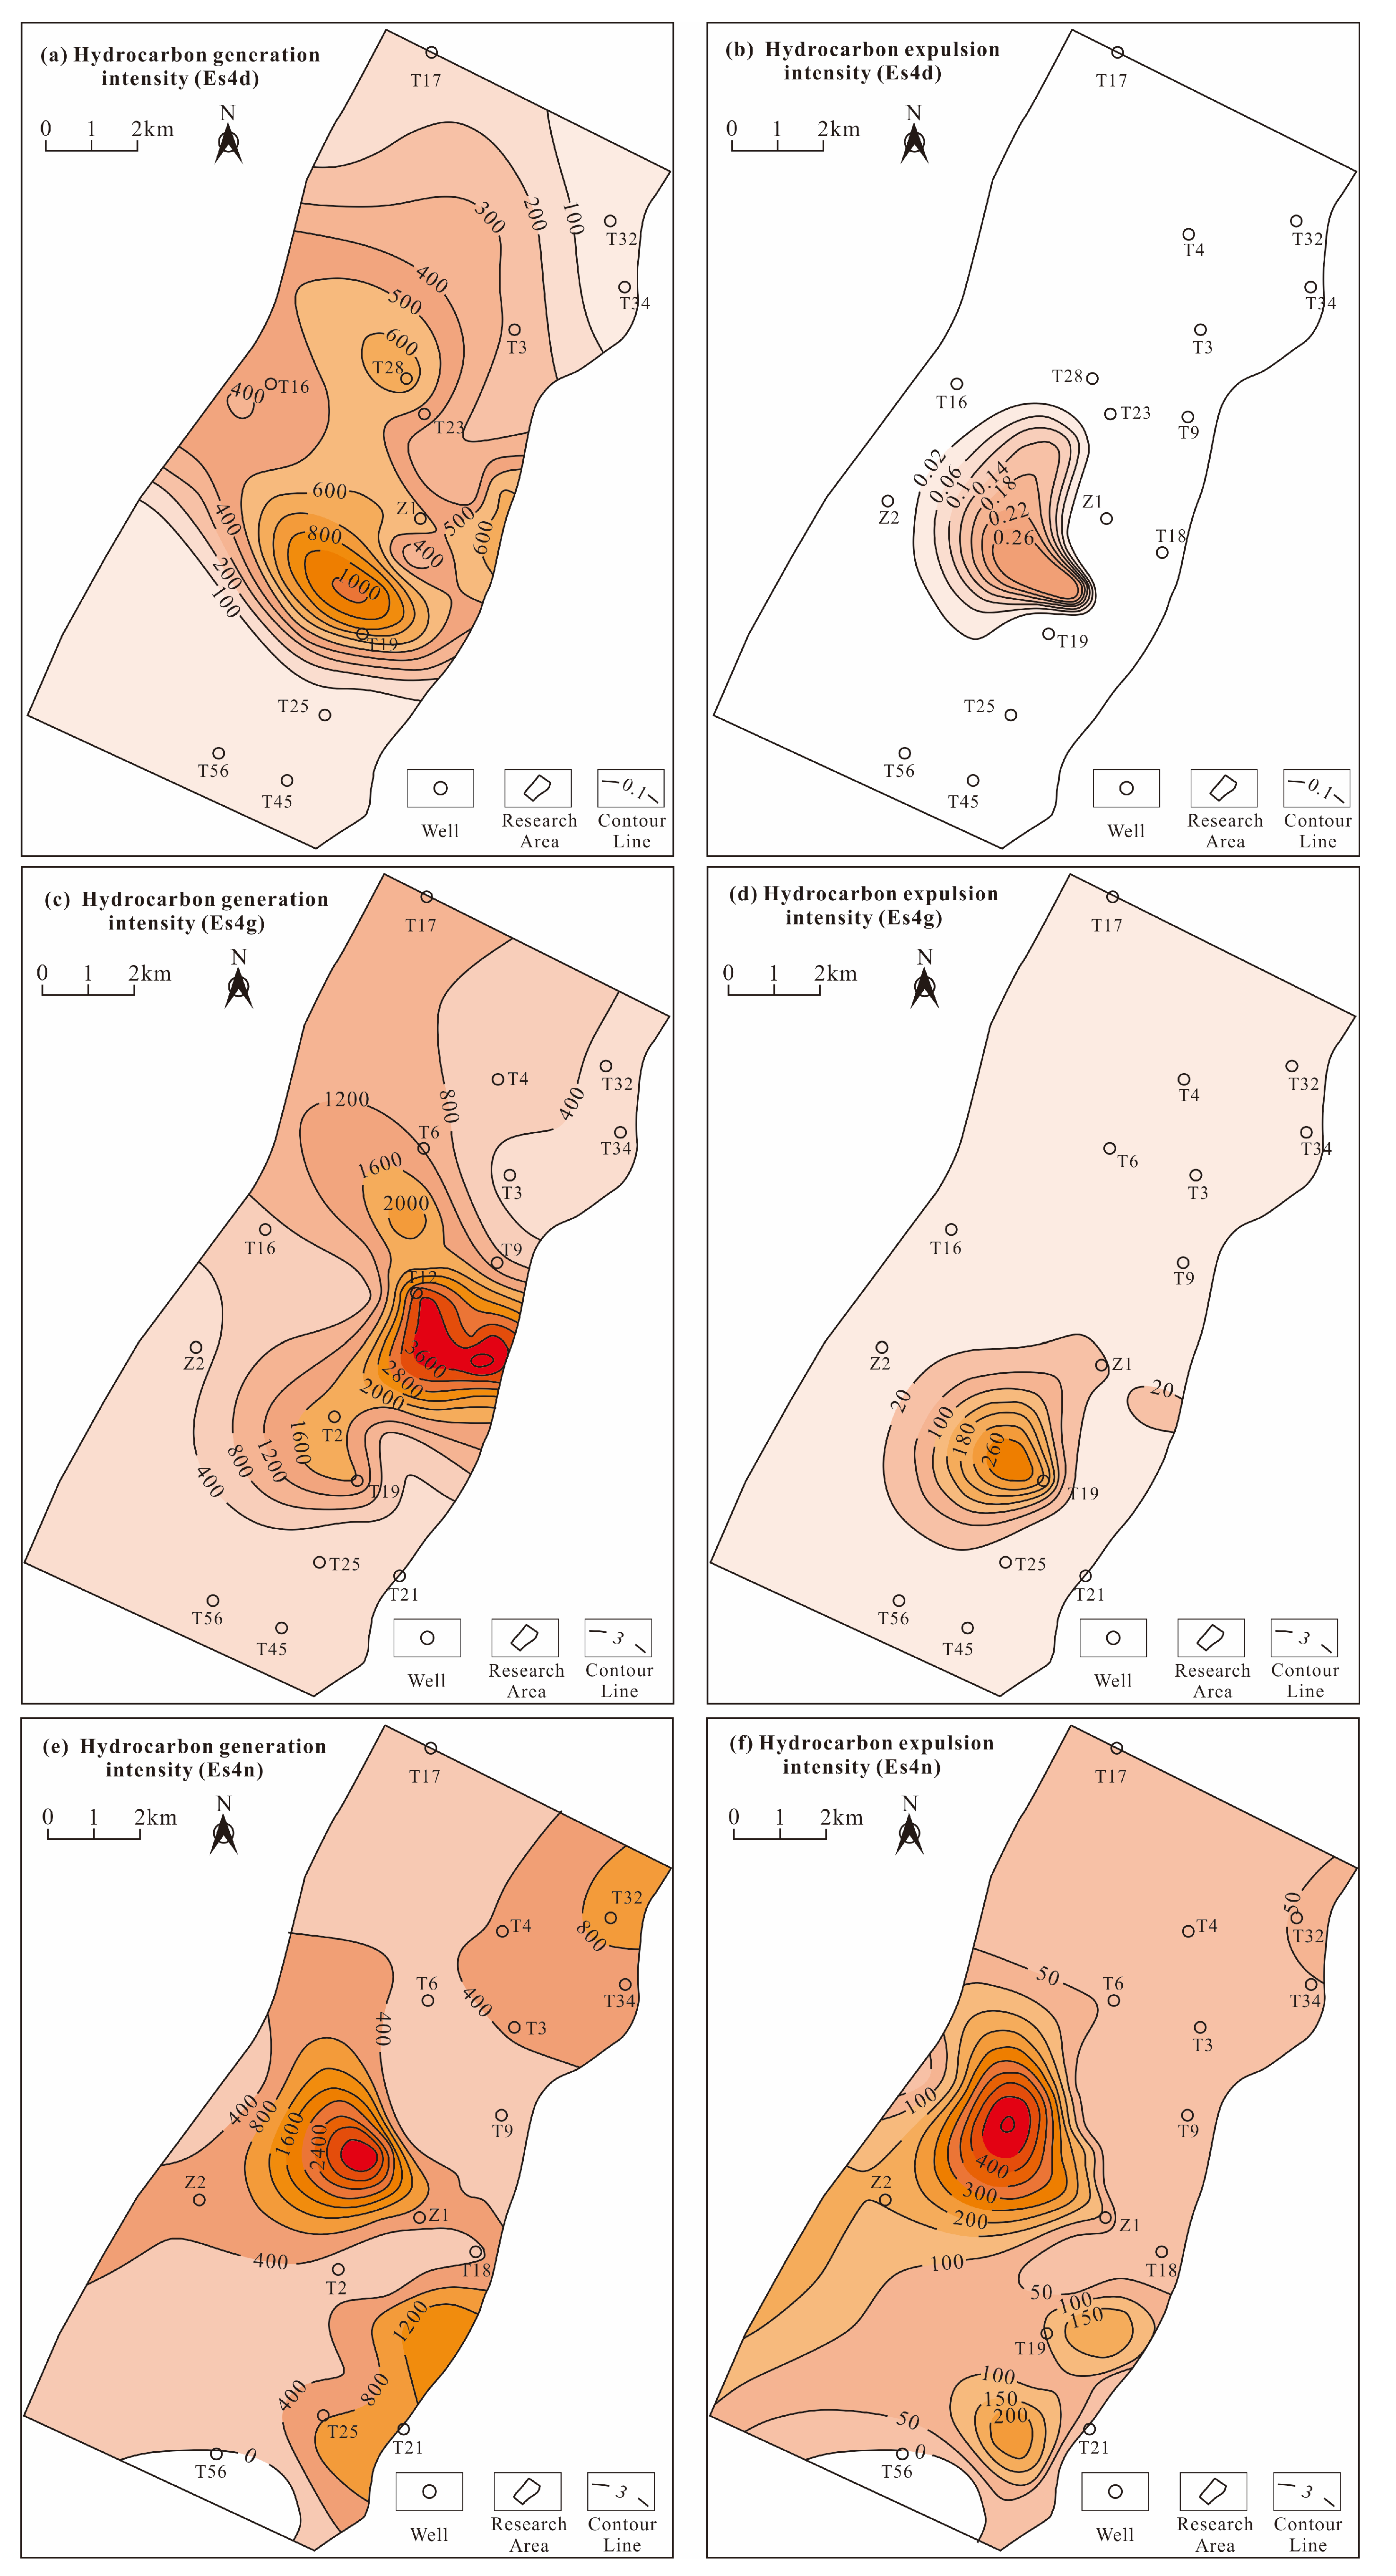
4.5. Hydrocarbon Generation Simulation of Low-Maturity Source Rocks
4.6. Optimal Regression Relationship Based on Rock-Eval/TOC Datasets
5. Discussion
5.1. Optimized HGE Model
5.2. Application in the Low-Mature to Mature Source Rocks
5.3. Limitations
6. Conclusions
Author Contributions
Funding
Data Availability Statement
Acknowledgments
Conflicts of Interest
References
- Jia, C.Z. Breakthrough and significance of unconventional oil and gas to classical petroleum geological theory. Pet. Explor. Dev. 2017, 44, 1–10. [Google Scholar] [CrossRef]
- EIA. Technically Recoverable Shale Oil and Shale Gas Resources: An Assessme 137 Shale Formation in 41 Countries Outside the United States; EIA: Washington, DC, USA, 2013. [Google Scholar]
- Labus, K.; Tarkowski, R.; Wdowin, M. Modeling gas–rock–water interactions in carbon dioxide storage capacity assessment: A case study of Jurassic sandstones in Poland. Int. J. Environ. Sci. Technol. 2015, 12, 2493–2502. [Google Scholar] [CrossRef] [Green Version]
- Tarkowski, R.; Wdowin, M.; Manecki, M. Petrophysical examination of CO2-brine-rock interactions—Results of the first stage of long-term experiments in the potential Zaosie Anticline reservoir (central Poland) for CO2 storage. Environ. Monit. Assess. 2015, 187, 4251. [Google Scholar] [CrossRef] [PubMed] [Green Version]
- Jin, Z.J.; Zhang, J.C. Fundamental principles for petroleum resources assessments. Acta Pet. Sin. 2002, 23, 19–23. [Google Scholar]
- Schmoker, J.W. Resource-assessment perspectives for unconventional gas systems. AAPG Bull. 2002, 86, 1993–1999. [Google Scholar]
- Haskett, W.J.; Brown, P.J. Evaluation of unconventional resource plays. In Proceedings of the SPE Annual Technical Conference and Exhibition, Dallas, TX, USA, 9–12 October 2005. [Google Scholar]
- Arab Amiri, M.; Karimi, M.; Abbas, A.S. Hydrocarbon resources potential mapping using evidential belief functions and frequency ratio approaches, southeastern Saskatchewan, Canada. Can. J. Earth Sci. 2015, 52, 182–195. [Google Scholar] [CrossRef]
- Hu, T.; Pang, X.Q.; Jiang, F.J.; Wang, Q.F.; Liu, X.H.; Wang, Z.; Jiang, S.; Wu, G.Y.; Li, C.J.; Xu, T.W.; et al. Movable oil content evaluation of lacustrine organic-rich shales: Methods and a novel quantitative evaluation model. Earth Sci. Rev. 2021, 214, 103545. [Google Scholar] [CrossRef]
- Tissot, B.P.; Welte, D.H. Petroleum Formation and Occurrence; Springer: New York, NY, USA, 1984. [Google Scholar]
- Jarvie, D.M.; Hill, R.J.; Ruble, T.E.; Pollastro, R.M. Unconventional shale-gas systems: The Mississippian Barnett Shale of north-central Texas as one model for thermogenic shale-gas assessment. AAPG Bull. 2007, 91, 475–499. [Google Scholar] [CrossRef]
- Pang, X.Q.; Li, M.W.; Li, S.M.; Jin, Z.J. Geochemistry of petroleum systems in the Niuzhuang South Slope of Bohai Bay Basin: Part 3. Estimating hydrocarbon expulsion from the Shahejie formation. Org. Geochem. 2005, 36, 497–510. [Google Scholar] [CrossRef]
- Peng, J.W.; Pang, X.Q.; Shi, H.S.; Peng, H.J.; Xiao, S.; Yu, Q.H.; Wu, L.Y. Hydrocarbon generation and expulsion characteristics of Eocene source rocks in the Huilu area, northern Pearl River Mouth basin, South China Sea: Implications for tight oil potential. Mar. Pet. Geol. 2016, 72, 463–487. [Google Scholar] [CrossRef]
- Zheng, D.Y.; Pang, X.Q.; Ma, X.H.; Li, C.R.; Zheng, T.Y.; Zhou, L.M. Hydrocarbon generation and expulsion characteristics of the source rocks in the third member of the Upper Triassic Xujiahe Formation and its effect on conventional and unconventional hydrocarbon resource potential in the Sichuan Basin. Mar. Pet. Geol. 2019, 109, 175–192. [Google Scholar] [CrossRef]
- Wang, E.Z.; Liu, G.Y.; Pang, X.Q.; Li, C.R.; Zhao, Z.F.; Feng, Y.; Wu, Z.Y. An improved hydrocarbon generation potential method for quantifying hydrocarbon generation and expulsion characteristics with application example of Paleogene Shahejie Formation, Nanpu Sag, Bohai Bay Basin. Mar. Pet. Geol. 2020, 112, 104106. [Google Scholar] [CrossRef]
- Li, C.R.; Pang, X.Q.; Huo, Z.P.; Wang, E.Z.; Xue, N. A revised method for reconstructing the hydrocarbon generation and expulsion history and evaluating the hydrocarbon resource potential: Example from the first member of the Qingshankou Formation in the Northern Songliao Basin, Northeast China. Mar. Pet. Geol. 2020, 121, 104577. [Google Scholar] [CrossRef]
- Li, M.; Pang, X.Q.; Luo, B.; Wang, W.; Cao, L.Y.; Hu, T.; Hui, S.S.; Li, C.R. Application of hydrocarbon generation potential method to deep shale gas resource evalution: A case study of high-quality source rocks of the Wufeng-Longmaxi formation in the Sichuan Basin. J. China Uni. Min. Technol. 2021, 50, 1096–1107. [Google Scholar]
- Chen, J.Q.; Pang, X.Q.; Pang, H.; Chen, Z.H.; Jiang, C.Q. Hydrocarbon evaporative loss evaluation of lacustrine shale oil based on mass balance method: Permian Lucaogou Formation in Jimusaer Depression, Junggar Basin. Mar. Pet. Geol. 2018, 91, 422–431. [Google Scholar] [CrossRef]
- Justwan, H.; Dahl, B. Quantitative hydrocarbon potential mapping and organofacies study in the Greater Balder area, Norwegian North Sea. In Petroleum Geology Conference Series; Dore, A.G., Vinino, A., Eds.; Geological Society: London, UK, 2005; pp. 1317–1329. [Google Scholar]
- Li, X.G. Accumulation conditions and key exploration & development technologies of heavy oil in Huanxiling oilfield in Liaohe depression, Bohai Bay Basin. Pet. Res. 2020, 5, 18–38. [Google Scholar]
- Hao, F.; Zhou, X.; Zhu, Y.; Zou, H.; Yang, Y. Charging of oil fields surrounding the Shaleitian uplift from multiple source rock intervals and generative kitchens, Bohai Bay basin, China. Mar. Pet. Geol. 2010, 27, 1910–1926. [Google Scholar] [CrossRef]
- Allen, M.B.; Macdonald, D.I.M.; Xun, Z.; Vincent, S.J.; Brouet-Menzies, C. Early Cenozoic two-phase extension and late Cenozoic thermal subsidence and inversion of the Bohai Basin, northern China. Mar. Pet. Geol. 1997, 14, 951–972. [Google Scholar] [CrossRef]
- Hu, L.G.; Fuhrmann, A.; Poelchau, H.S.; Horsfield, B.; Zhang, Z.W.; Wu, T.S.; Chen, Y.; Li, J. Numerical simulation of petroleum generation and migration in the Qingshui sag, western depression of the Liaohe basin, northeast China. AAPG Bull. 2005, 89, 1629–1649. [Google Scholar] [CrossRef]
- Wei, W.; Zhu, X.M.; Meng, Y.L.; Xiao, L.H.; Xue, M.G.; Wang, J.Y. Porosity model and its application in tight gas sandstone reservoir in the southern part of West Depression, Liaohe Basin, China. J. Pet. Sci. Eng. 2016, 141, 24–37. [Google Scholar] [CrossRef]
- Hao, F.; Zhou, X.; Zhu, Y.; Yang, Y. Lacustrine source rock deposition in response to co-evolution of environments and organisms controlled by tectonic subsidence and climate, Bohai Bay Basin, China. Org. Geochem. 2011, 42, 323–339. [Google Scholar] [CrossRef]
- Meng, Y.; Zhang, L.; Qu, G.; Zhang, F.; Meng, F.; Li, C.; Jiao, J.; Shi, L. Diagenetic characteristics under abnormally low pressure: A case from the Paleogene of southern Western Sag, Liaohe Depression, Bohai Bay Basin. Pet. Explor. Dev. 2016, 43, 731–736. [Google Scholar] [CrossRef]
- Pang, S.Y.; Cao, Y.C.; Liang, C. Lithofacies characteristics and sedimentary environment of Es4U and Es3L: A case study of Well FY1 in Dongying sag, Bohai Bay Basin. Oil Gas Geol. 2019, 40, 799–809. (In Chinese) [Google Scholar]
- Peters, K.E. Guidelines for evaluating petroleum source rock using programmed pyrolysis. AAPG Bull. 1986, 70, 318–329. [Google Scholar]
- Riediger, C.; Carrelliand, G.G.; Zonneveld, J.P. Hydrocarbon source rock characterization and thermal maturity of the Upper Triassic Baldonnel and Pardonet formations, northeastern British Columbia, Canada. Bulletin of Canadian. Petrol. Geol. 2004, 52, 277–301. [Google Scholar]
- SY/T 5124—2012; National Energy Administration. Method of Determining Microscopically the Reflectance of Vitrinite in Sedimentary. Petroleum Industry Press: Beijing, China,, 2012.
- SY/T 6414—2014; National Energy Administration. Maceral Identification and Statistical Methods on Polished Surfaces of Whole Rocks. Petroleum Industry Press: Beijing, China, 2014.
- Chen, J.Q.; Zhang, X.G.; Chen, Z.H.; Pang, X.Q.; Yang, H.J.; Zhao, Z.F.; Pang, B.; Ma, K.Y. Hydrocarbon expulsion evaluation based on pyrolysis Rock-Eval data: Implications for Ordovician carbonates exploration in the Tabei Uplift, Tarim. J. Pet. Sci. Eng. 2021, 196, 107614. [Google Scholar] [CrossRef]
- Cooles, G.P.; Mackenzie, A.S.; Quigley, T.M. Calculation of petroleum masses generated and expelled from source rocks. Org. Geochem. 1986, 10, 235–245. [Google Scholar] [CrossRef]
- Bordenave, M.L.; Espitalie, J.; Leplat, J.L.; Vandenbroucke, M. Screening techniques for source rock evaluation. In Applied Petroleum Geochemistry; Bordenave, M.L., Ed.; Editions Technips: Paris, France, 1993; pp. 217–278. [Google Scholar]
- Chen, Z.H.; Jiang, C.Q. A data driven model for studying kerogen kinetics with application examples from Canadian sedimentary basins. Mar. Pet. Geol. 2015, 67, 795–803. [Google Scholar] [CrossRef]
- Chen, Z.H.; Jiang, C.Q. A revised method for organic porosity estimation in shale reservoirs using Rock—Eval data: Example from Duvernay Formation in the Western Canada Sedimentary Basin. AAPG Bull. 2016, 100, 405–422. [Google Scholar] [CrossRef]
- White, I.C. The geology of natural gas. Science 1885, 6, 42–44. [Google Scholar] [CrossRef] [Green Version]
- Masters, J.A. Deep basin gas trap, Western Canada. AAPG Bull. 1979, 63, 152–181. [Google Scholar]
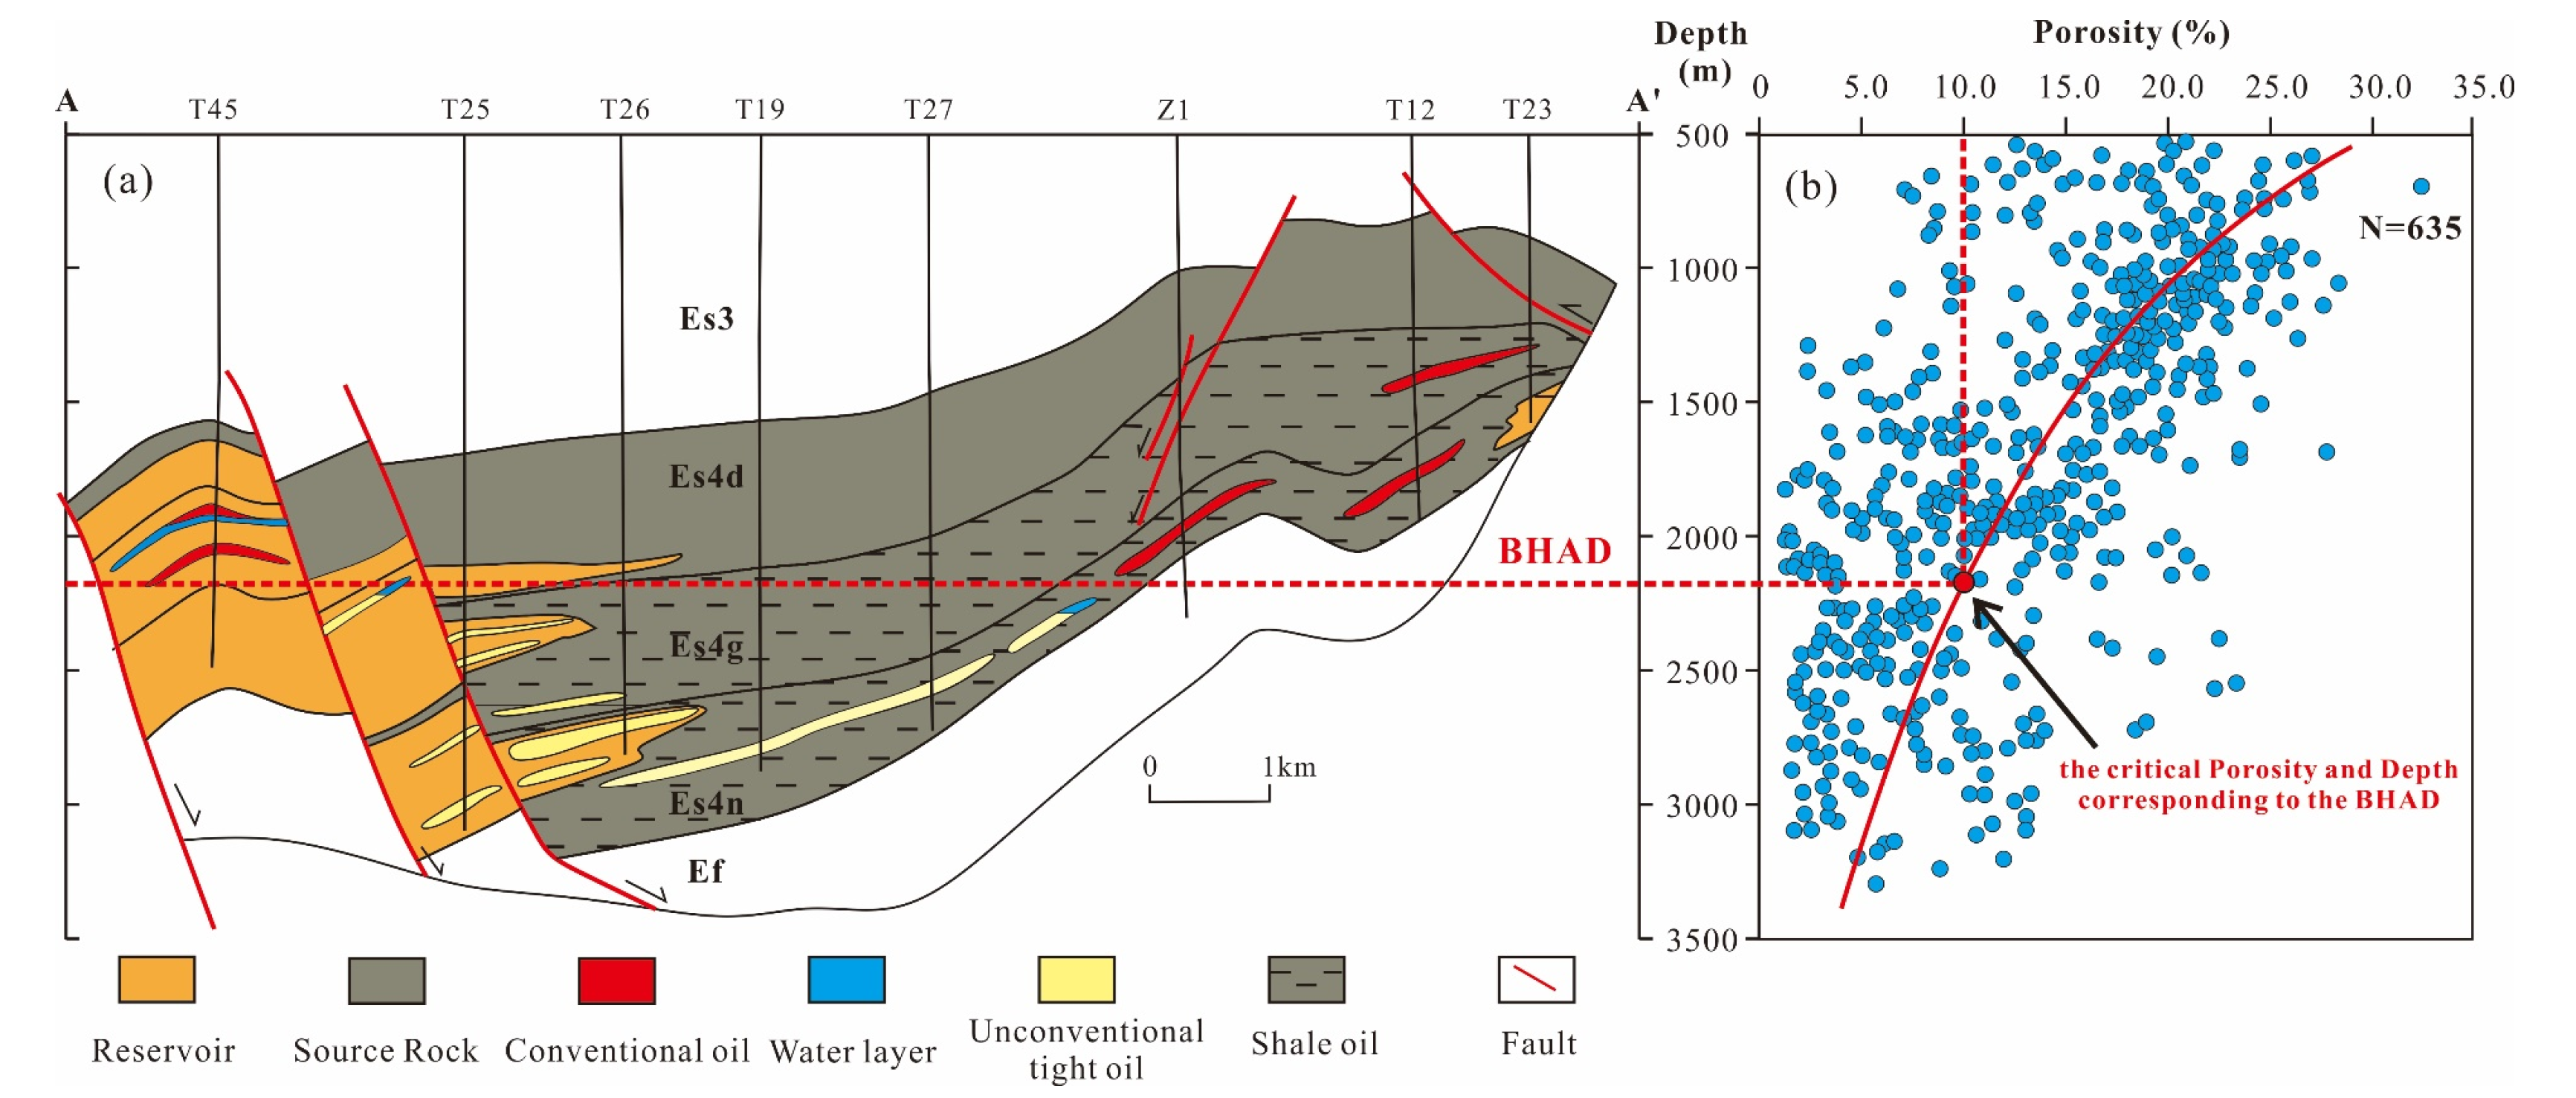
- Pang, X.Q.; Jia, C.Z.; Wang, W.Y.; Chen, Z.X.; Li, M.W.; Jiang, F.J.; Hu, T.; Wang, K.; Wang, Y.X. Buoyance-driven hydrocarbon accumulation depth and its implication for unconventional resource prediction. Geosci. Front. 2021, 12, 101133. [Google Scholar] [CrossRef]
- Huang, S.P.; Feng, Z.Q.; Gu, T.; Gong, D.Y.; Peng, W.L.; Yuan, M. Multiple origins of the Paleogene natural gases and effects of secondary alteration in Liaohe Basin, northeast China: Insights from the molecular and stable isotopic compositions. Int. J. Coal Geol. 2017, 172, 134–148. [Google Scholar] [CrossRef] [Green Version]
- Peng, W.L.; Hu, G.Y.; Feng, Z.Q.; Liu, D.; Wang, Y.W.; Lv, Y.; Zhao, R.M. Origin of Paleogene natural gases and discussion of abnormal carbon isotopic composition of heavy alkanes in the Liaohe Basin, NE China. Mar. Pet. Geol. 2018, 92, 670–684. [Google Scholar] [CrossRef]
- Mackenzie, A.S.; Maxwell, J.R.; Coleman, M.L.; Deegan, C.E. Biological marker and isotope studies of North Sea crude oils and sediments. In Proceedings of the Eleventh World Petroleum Congress, London, UK, 28 August–2 September 1983; John Wiley and Sons: New York, NY, USA, 1984. [Google Scholar]
- Chen, J.Y.; Bi, Y.P.; Zhang, J.G.; Li, S.F. Oil-source correlation in the Fulin basin, Shengli petroleum province, East China. Org. Geochem. 1996, 24, 931–940. [Google Scholar] [CrossRef]
- Huo, Z.; Tang, X.; Meng, Q.; Zhang, J.; Li, C.; Yu, X.; Yang, X. Geochemical characteristics and hydrocarbon expulsion of lacustrine marlstones in the Shulu sag, Bohai bay basin, eastern China: Assessment of tight oil resources. Nat. Resour. Res. 2020, 29, 2647–2669. [Google Scholar] [CrossRef]
- Bazhenova, O.K.; Arefiev, O.A.; Durand, B.; Behar, F. Immature oils as the products of early catagenetic transformation of bacterial-algal organic matter. Org. Geochem. 1990, 16, 307–311. [Google Scholar] [CrossRef]
- Wang, F.Y.; Hao, S.S.; He, P.; Fu, J.M. Lacustrine algae in Biyang sag as high wax oleaginous parent material. Chin. Sci. Bull. 1997, 42, 1193–1197. [Google Scholar]
- Liu, W.H.; Huang, D.F.; Xiong, C.W.; Xu, Y.C. The development of hydrocarbon generation theory and the distribution and research status of immature and low-mature oil/gas abroad. Nat. Gas Geosci. 1999, 10, 1–22. [Google Scholar]
- Zhao, X.Z.; Ma, A.L.; Xiong, B.; Zhong, N.N.; Wang, T.G. Organic petrological characteristics of immature source rocks. Geol. Geochem. 2002, 30, 20–25. [Google Scholar]
- Guo, B.; Ma, S.M.; Li, M.; Wang, X.H.; Xi, J.; Wang, C.J.; Jiang, R.Y. Hydrocarbon generation potential and features of lamellar algae in Shanxi Hunyuan. Coal. Coal Sci. Technol. 2011, 39, 106–109. [Google Scholar]
- Adeyilola, A.; Zakharova, N.; Liu, K.; Gentzis, T.; Carvajal-Ortiz, H.; Ocubalidet, S.; Harrison, W.B. Hydrocarbon potential and Organofacies of the Devonian Antrim Shale, Michigan Basin. Int. J. Coal Geol. 2022, 249, 103905. [Google Scholar] [CrossRef]
- Pang, X.Q.; Liu, K.Y.; Ma, Z.Z.; Jiang, Z.X.; Xiang, C.F.; Huo, Z.P.; Pang, H.; Chen, J.Q. Dynamic field division of hydrocarbon migration, accumulation and hydrocarbon enrichment rules in sedimentary basins. Acta Geol. Sin. 2012, 86, 1559–1592. [Google Scholar]
- Jia, C.Z.; Zou, C.N.; Li, J.Z.; Li, D.H.; Zheng, M. Assessment criteria, main types, basic features and resource prospects of the tight oil in China. Acta Pet. Sin. 2012, 33, 343–350. (In Chinese) [Google Scholar]
- Guo, Y.; Pang, X.; Li, Z.; Guo, F.; Song, L. The critical buoyancy threshold for tight sandstone gas entrapment: Physical simulation, interpretation, and implications to the Upper Paleozoic Ordos Basin. J. Pet. Sci. Eng. 2017, 149, 88–97. [Google Scholar] [CrossRef]


| Well | Depth (m) | Strata | TOC (%) | Tmax (°C) | S1 (mg HC/g rock) | S2 (mg HC/g rock) | S1+S2 (mg/g rock) | HI (mg HC/g TOC) | GPI (mg HC/g TOC) | Well | Depth (m) | Strata | TOC (%) | Tmax (°C) | S1 (mg HC/g rock) | S2 (mg HC/g rock) | S1+S2 (mg HC/g rock) | HI (mg HC/g TOC) | GPI (mg HC/g TOC) |
|---|---|---|---|---|---|---|---|---|---|---|---|---|---|---|---|---|---|---|---|
| T11 | 1690.0 | Es4d | 0.45 | 427 | 0.04 | 0.43 | 0.47 | 95.6 | 104.4 | T1 | 2012.0 | Es4n | 5.56 | 439 | 0.66 | 33.08 | 33.74 | 595.0 | 606.8 |
| T11 | 1716.0 | Es4d | 0.6 | 429 | 0.03 | 0.69 | 0.72 | 115.0 | 120.0 | T12 | 1670.0 | Es4n | 0.72 | 438 | 0.06 | 2.06 | 2.12 | 286.1 | 294.4 |
| T11 | 1720.0 | Es4d | 0.9 | 434 | 0.06 | 1.5 | 1.56 | 166.7 | 173.3 | T12 | 1670.0 | Es4n | 0.95 | 437 | 0.1 | 2.3 | 2.40 | 242.1 | 252.6 |
| Z1 | 1354.0 | Es4d | 1.09 | 430 | 0.01 | 0.44 | 0.45 | 40.4 | 41.3 | T12 | 1690.7 | Es4n | 0.8 | 434 | 0.61 | 2.01 | 2.62 | 250.5 | 326.5 |
| Z1 | 1367.0 | Es4d | 1.7 | 431 | 0.1 | 4.13 | 4.23 | 242.9 | 248.8 | T14 | 1543.0 | Es4n | 7.96 | 430 | 0.88 | 57.68 | 58.56 | 724.6 | 735.7 |
| Z1 | 1369.1 | Es4d | 12.4 | 435 | 0.83 | 21.54 | 22.37 | 173.7 | 180.4 | T14 | 1546.8 | Es4n | 1.37 | NA | NA | NA | NA | NA | NA |
| T1 | 1936.0 | Es4g | 1.56 | 438 | 0.07 | 5.02 | 5.09 | 321.8 | 326.3 | T14 | 1588.5 | Es4n | 6.37 | NA | NA | NA | NA | NA | NA |
| T1 | 1936.0 | Es4g | 1.46 | 435 | 0.13 | 5.24 | 5.37 | 358.9 | 367.8 | T16 | 2490.0 | Es4n | 2.25 | 431 | 0.13 | 11.66 | 11.79 | 518.2 | 524.0 |
| T1 | 1934.5 | Es4g | 3.82 | 441 | 0.37 | 21.28 | 21.65 | 557.1 | 566.8 | T16 | 2490.0 | Es4n | 2.84 | 434 | 0.13 | 13.66 | 13.79 | 481.0 | 485.6 |
| T11 | 2190.9 | Es4g | 2.78 | 434 | 0.35 | 12.98 | 13.33 | 467.0 | 479.5 | T16 | 2378.0 | Es4n | 3.91 | 422 | 0.38 | 17.13 | 17.51 | 438.1 | 447.8 |
| T11 | 2215.0 | Es4g | 4.42 | 436 | 0.38 | 23.48 | 23.86 | 531.0 | 539.8 | T16 | 2378.0 | Es4n | 4.65 | 434 | 0.22 | 17.68 | 17.90 | 380.2 | 385.0 |
| T12 | 1625.0 | Es4g | 7.18 | 435 | 0.25 | 33.04 | 33.29 | 460.2 | 463.7 | T16 | 2378.0 | Es4n | 3.9 | 435 | 0.22 | 18.34 | 18.56 | 470.3 | 475.9 |
| T12 | 1623.0 | Es4g | 5.57 | 432 | 0.89 | 36.2 | 37.09 | 649.9 | 665.9 | T16 | 2377.2 | Es4n | 4.68 | 429 | 0.22 | 22.57 | 22.79 | 482.3 | 487.0 |
| T12 | 1625.0 | Es4g | 5.99 | 434 | 0.45 | 39.52 | 39.97 | 659.8 | 667.3 | T17 | 1216.5 | Es4n | 1.24 | 427 | 0.07 | 2.84 | 2.91 | 229.0 | 234.7 |
| T12 | 1626.5 | Es4g | 7.14 | 442 | 0.59 | 40.61 | 41.20 | 568.8 | 577.0 | T17 | 1071.5 | Es4n | 3.06 | 433 | 0.39 | 13.46 | 13.85 | 439.9 | 452.6 |
| T12 | 1621.3 | Es4g | 8.03 | 442 | 1.14 | 49.87 | 51.01 | 621.1 | 635.2 | T19 | 2726.0 | Es4n | 3.05 | NA | NA | NA | NA | NA | NA |
| T12 | 1622.5 | Es4g | 8.73 | 444 | 0.52 | 70.2 | 70.72 | 804.1 | 810.1 | T20 | 2740.5 | Es4n | 5.14 | NA | NA | NA | NA | NA | NA |
| T16 | 2204.5 | Es4g | 2.06 | 424 | 0.16 | 5.27 | 5.43 | 255.8 | 263.6 | T22 | 1683.0 | Es4n | 3.53 | NA | NA | NA | NA | NA | NA |
| T16 | 2205.0 | Es4g | 2.3 | 437 | 0.13 | 6.02 | 6.15 | 261.7 | 267.4 | T24 | 1583.7 | Es4n | 0.22 | NA | NA | NA | NA | NA | NA |
| T16 | 2205.0 | Es4g | 2.27 | 436 | 0.1 | 6.19 | 6.29 | 272.7 | 277.1 | T25 | 2494.6 | Es4n | 2.79 | 441 | 0.03 | 3.16 | 3.19 | 113.3 | 114.3 |
| T19 | 2485.9 | Es4g | 0.97 | 438 | 0.02 | 1.39 | 1.41 | 143.3 | 145.4 | T25 | 2304.4 | Es4n | 1.9 | 432 | 0.24 | 12.54 | 12.78 | 660.0 | 672.6 |
| T19 | 2390.0 | Es4g | 1.04 | 438 | 0.09 | 1.97 | 2.06 | 189.4 | 198.1 | T25 | 2504.8 | Es4n | 1.05 | NA | NA | NA | NA | NA | NA |
| T19 | 2390.0 | Es4g | 0.73 | 440 | 0.13 | 2.01 | 2.14 | 275.3 | 293.2 | T25 | 2304.0 | Es4n | 2.02 | NA | NA | NA | NA | NA | NA |
| T19 | 2492.0 | Es4g | 1.88 | 439 | 0.11 | 4.17 | 4.28 | 222.0 | 227.7 | T25 | 2304.0 | Es4n | 3.28 | NA | NA | NA | NA | NA | NA |
| T19 | 2492.0 | Es4g | 1.88 | 439 | 0.12 | 4.36 | 4.48 | 231.9 | 238.3 | T25 | 2302.6 | Es4n | 3.68 | NA | NA | NA | NA | NA | NA |
| T20 | 2485.0 | Es4g | 0.76 | 439 | 0.11 | 0.83 | 0.94 | 109.2 | 123.7 | T25 | 2306.1 | Es4n | 4.36 | NA | NA | NA | NA | NA | NA |
| T20 | 2483.0 | Es4g | 0.84 | 439 | 0.07 | 0.93 | 1.00 | 110.7 | 119.1 | T25 | 2304.4 | Es4n | 5.31 | NA | NA | NA | NA | NA | NA |
| T20 | 2345.0 | Es4g | 1.58 | 435 | 0.11 | 5.01 | 5.12 | 317.1 | 324.1 | T27 | 2506.1 | Es4n | 6.12 | NA | NA | NA | NA | NA | NA |
| T20 | 2345.0 | Es4g | 1.36 | 434 | 0.16 | 5.18 | 5.34 | 380.9 | 392.7 | T28 | 1870.5 | Es4n | 0.13 | ||||||
| T28 | 1785.2 | Es4g | 2.42 | 424 | 0.26 | 10.64 | 10.90 | 439.7 | 450.4 | T3 | 1030.0 | Es4n | 7.38 | 435 | 0.83 | 56.12 | 56.95 | 760.4 | 771.7 |
| T28 | 1787.6 | Es4g | 6.94 | 434 | 0.46 | 48.86 | 49.32 | 704.0 | 710.7 | T4 | 1279.7 | Es4n | 2.14 | 432 | 0.17 | 10.66 | 10.83 | 498.1 | 506.1 |
| T3 | 1000.5 | Es4g | 1.49 | 429 | 0.18 | 4.01 | 4.19 | 269.1 | 281.2 | T5 | 1643.0 | Es4n | 0.9 | 431 | 0.06 | 0.76 | 0.82 | 84.4 | 91.1 |
| Z1 | 1477.0 | Es4g | 0.64 | 436 | 0.01 | 0.53 | 0.54 | 82.8 | 82.8 | T5 | 1639.0 | Es4n | 3.51 | 439 | 0.19 | 22.62 | 22.81 | 644.4 | 649.9 |
| Z1 | 1576.3 | Es4g | 1.75 | 433 | 0.04 | 2.04 | 2.08 | 116.6 | 118.9 | T5 | 1639.0 | Es4n | 3.42 | 441 | 0.23 | 25.46 | 25.69 | 744.4 | 751.2 |
| Z1 | 1475.2 | Es4g | 1.76 | 443 | 0.25 | 3.71 | 3.96 | 211.0 | 225.3 | Z1 | 1862.0 | Es4n | 0.92 | 438 | 0.05 | 2.88 | 2.93 | 313.0 | 318.5 |
| Z1 | 1576.5 | Es4g | 5.37 | 423 | 0.04 | 4.11 | 4.15 | 76.5 | 77.3 | Z1 | 1834.7 | Es4n | 2.25 | 433 | 0.19 | 8.39 | 8.58 | 372.9 | 381.3 |
| Z1 | 1725.5 | Es4g | 1.88 | 435 | 0.09 | 5.33 | 5.42 | 283.5 | 288.3 | Z1 | 1832.0 | Es4n | 2.66 | 438 | 0.15 | 12.73 | 12.88 | 478.6 | 484.2 |
| Z1 | 1765.5 | Es4g | 2.55 | 434 | 0.21 | 9.74 | 9.95 | 382.0 | 390.2 | Z1 | 1858.2 | Es4n | 3.66 | 436 | 0.45 | 20.46 | 20.92 | 559.0 | 571.6 |
| Z1 | 1767.0 | Es4g | 2.6 | 440 | 0.82 | 9.69 | 10.51 | 372.3 | 403.8 | Z1 | 1904.4 | Es4n | 8.95 | 441 | 1.55 | 56.34 | 57.89 | 629.6 | 646.9 |
| Z1 | 1767.5 | Es4g | 2.45 | 437 | 0.17 | 11.91 | 12.08 | 486.1 | 493.1 | Z1 | 1841.0 | Es4n | 0.71 | NA | NA | NA | NA | NA | NA |
| Z1 | 1786.2 | Es4g | 2.76 | 434 | 0.29 | 15.28 | 15.58 | 553.6 | 564.5 | Z1 | 1837.0 | Es4n | 2.34 | NA | NA | NA | NA | NA | NA |
| Z1 | 1792.4 | Es4g | 3.35 | 439 | 0.28 | 22.66 | 22.94 | 676.4 | 684.8 | Z1 | 1842.5 | Es4n | 3.64 | NA | NA | NA | NA | NA | NA |
| Z1 | 1809.6 | Es4g | 4.5 | 437 | 0.41 | 28.34 | 28.77 | 629.8 | 639.3 | Z1 | 1840.0 | Es4n | 3.87 | NA | NA | NA | NA | NA | NA |
| Z1 | 1766.0 | Es4g | 5.6 | 442 | 0.57 | 29.73 | 30.30 | 530.9 | 541.1 | Z1 | 1839.0 | Es4n | 4.92 | NA | NA | NA | NA | NA | NA |
| Z1 | 1815.3 | Es4g | 4.42 | 445 | 0.68 | 31.57 | 32.25 | 714.9 | 730.3 | Z1 | 1847.0 | Es4n | 5.38 | NA | NA | NA | NA | NA | NA |
| Z1 | 1815.3 | Es4g | 4.36 | 445 | 0.85 | 32.41 | 33.26 | 743.9 | 763.4 | Z1 | 1843.0 | Es4n | 6.51 | NA | NA | NA | NA | NA | NA |
| Z1 | 1813.9 | Es4g | 6.83 | 438 | 0.62 | 36.88 | 37.50 | 540.0 | 549.1 | Z1 | 1842.0 | Es4n | 6.73 | NA | NA | NA | NA | NA | NA |
| Z1 | 1792.9 | Es4g | 7.18 | 444 | 0.51 | 40.84 | 41.35 | 568.8 | 575.9 | Z1 | 1831.2 | Es4n | 2.39 | 443 | 0.39 | 10.64 | 11.03 | 444.4 | 460.7 |
| Z1 | 1802.0 | Es4g | 9.4 | 437 | 2.33 | 52.6 | 54.93 | 559.8 | 584.6 | NA | NA | NA | NA | NA | NA | NA | NA | NA | NA |
| T1 | 1967.4 | Es4n | 3.37 | 438 | 0.59 | 19.4 | 19.99 | 575.3 | 592.8 | NA | NA | NA | NA | NA | NA | NA | NA | NA | NA |
| T1 | 2020.3 | Es4n | 6 | 437 | 0.49 | 29.25 | 29.74 | 487.5 | 495.7 | NA | NA | NA | NA | NA | NA | NA | NA | NA | NA |
| T1 | 1968.0 | Es4n | 5.72 | 440 | 0.57 | 29.72 | 30.29 | 519.6 | 529.6 | NA | NA | NA | NA | NA | NA | NA | NA | NA | NA |
| T1 | 2012.0 | Es4n | 6.34 | 441 | 0.21 | 30.54 | 30.75 | 481.7 | 485.0 | NA | NA | NA | NA | NA | NA | NA | NA | NA | NA |
| Sample ID | Lithology | Maceral Analysis | Kerogen Type | ||||
|---|---|---|---|---|---|---|---|
| Vitrinite | Inertinite | Exinite | Liptinite | ||||
| Alginite | Bituminite | ||||||
| D16 | Shale | 7 | <2 | 0 | 7 | 84 | I |
| D22 | Calcareous shale | 9 | <1 | 1.5 | 5.5 | 83 | II1 |
| G25 | Shale | 8 | <1 | 2 | 2 | 87 | II2 |
| S499 | Shale | 14 | <1 | 6 | / | 79 | II2 |
| S101 | Mudstone | 4 | <2 | 36 | / | 58 | III |
Disclaimer/Publisher’s Note: The statements, opinions and data contained in all publications are solely those of the individual author(s) and contributor(s) and not of MDPI and/or the editor(s). MDPI and/or the editor(s) disclaim responsibility for any injury to people or property resulting from any ideas, methods, instructions or products referred to in the content. |
© 2023 by the authors. Licensee MDPI, Basel, Switzerland. This article is an open access article distributed under the terms and conditions of the Creative Commons Attribution (CC BY) license (https://creativecommons.org/licenses/by/4.0/).
Share and Cite
Hui, S.; Pang, X.; Pang, H.; Li, C.; Zhou, X.; Hu, T.; Shi, K.; Li, M.; Mei, S.; Yuan, W.; et al. A Data-Driven Approach to the Unified Evaluation of Conventional and Unconventional Hydrocarbon Resources: Application to Low-Mature to Mature Source Rocks in the Liaohe Western Depression. Minerals 2023, 13, 390. https://doi.org/10.3390/min13030390
Hui S, Pang X, Pang H, Li C, Zhou X, Hu T, Shi K, Li M, Mei S, Yuan W, et al. A Data-Driven Approach to the Unified Evaluation of Conventional and Unconventional Hydrocarbon Resources: Application to Low-Mature to Mature Source Rocks in the Liaohe Western Depression. Minerals. 2023; 13(3):390. https://doi.org/10.3390/min13030390
Chicago/Turabian StyleHui, Shasha, Xiongqi Pang, Hong Pang, Changrong Li, Xiaolong Zhou, Tao Hu, Kanyuan Shi, Min Li, Shuxing Mei, Wu Yuan, and et al. 2023. "A Data-Driven Approach to the Unified Evaluation of Conventional and Unconventional Hydrocarbon Resources: Application to Low-Mature to Mature Source Rocks in the Liaohe Western Depression" Minerals 13, no. 3: 390. https://doi.org/10.3390/min13030390