Article

Geochemical and Isotopic Fractionation in the Hypogene Ore, Gossan, and Saprolite of the Alvo 118 Deposit: Implications for Copper Exploration in the Regolith of the Carajás Mineral Province

by
Pabllo Henrique Costa dos Santos
1,*,
Marcondes Lima da Costa
1 and
Desiree Lisette Roerdink
2
1
Geosciences Institute, Federal University of Pará, Belém 66075-110, Brazil
2
Department of Earth Science, University of Bergen, 5007 Bergen, Norway
*
Author to whom correspondence should be addressed.
Minerals 2023, 13(11), 1441; https://doi.org/10.3390/min13111441
Submission received: 25 September 2023 / Revised: 18 October 2023 / Accepted: 24 October 2023 / Published: 15 November 2023
(This article belongs to the Special Issue Mineral Evolution and Mineralization during Weathering)

Abstract

:
In the Carajás Mineral Province, gossan formation and lateritization have produced numerous supergene orebodies at the expense of IOCG deposits and host rocks. The Alvo 118 deposit comprises massive and disseminated hypogene copper sulfides associated with gossan and mineralized saprolites. The hypogene reserves are 170 Mt, with 1% Cu and 0.3 ppm Au, while the supergenes are 55 Mt, comprised of 30% gossan and 70% saprolite, with 0.92% Cu and 0.03 ppm Au. The gossan includes goethite, malachite, cuprite, and libethenite zones. The saprolite comprises kaolinite, vermiculite, smectite, and relics of chlorite. In the hypogene mineralization, Ag, Te, Pb, Se, Bi, Au, In, Y, Sn, and U are mainly hosted by chalcopyrite and petzite, altaite, galena, uraninite, stannite, and cassiterite. In the gossan, Ag, Te, Pb, Se, and Bi are hosted by Cu minerals, while Au, In, Y, Sn, and U are associated with iron oxyhydroxides, in addition to Zn, As, Be, Ga, Ga, Mo, Ni, and Sc. As supporting information, δ65Cu values indicate that the gossan is immature and, at least partly, not affected by leaching. In the saprolite, Ga, Sc, Sn, V, Mn, Co, and Cr are associated with the iron oxyhydroxides, partially derived from the host rock weathering. The δ56Fe values indicate that hypogene low contribution of the hypogene mineralization to the saprolite iron content. The association of Al2O3, Hf, Zr, Th, TiO2, Ce, La, Ba, and Sr represents the geochemical signature of the host rocks, with dominant contributions from chlorites, while In, Y, Te, Pb, Bi, and Se are the main pathfinders of Cu mineralization.

1. Introduction

Gossan generation involves sulfide dissolution and release of sulfate and metal ions, which can be lost or retained by the supergene system [1,2,3]. This retention comprises the generation of newly formed minerals, establishing a mineralogical zoning, which can include secondary sulfides, sulfates, arsenates, phosphates, carbonates, and oxyhydroxides, carrying copper or other metals [4]. These zones represent exploratory guides for the generally much larger hypogene deposits [5,6,7].
In tropical regions like the Amazon, gossan and their host rocks have been modified by weathering, producing thick saprolite blankets that include lateritic profiles and soils [8,9,10]. In this context, ions or ionic compounds not incorporated by gossan are partially retained by the weathering products of the host rocks, forming a geochemical dispersion halo [10,11,12]. This incorporation typically involves clay minerals and iron oxyhydroxides [11,13].
Thus, tropical weathering makes mineral exploitation particularly complex because it modifies the gossans’ classical mineralogical and textural aspects, which are preserved in arid regions [5,14,15]. However, the weathering products of the host rocks can form economically attractive mineralizations, increasing the profitability of the deposit and reducing mining waste [16].
The Carajás Mineral Province (CMP) has been subjected to tropical weathering and lateritization over the past 70 Ma, modifying the pre-existing gossans, especially those located at the top of the Carajás Mountains, which are bounded by the South American/Carajás geomorphic surface [9,17]. Additionally, denudation of the surrounding areas, which commenced at 10 Ma and is now represented by the Velhas/Itacaiúnas geomorphic surface, exposed immature and truncated mature gossans. These secondary orebodies are generally capped by saprolite horizons and colluvial deposits [9,10,12,13]. Thus, mineral exploration in these terrains should consider the evolutionary degree of the gossans (mature or immature), lateritic profiles (complete or truncated), and their metal-retention capacity [11,13].
The Alvo 118 deposit consists of Cu-Au mineralization, typical of the denuded areas of the CMP. It comprises three ore types formed during distinct evolutionary stages: (1) hydrothermal massive and disseminated copper sulfide orebodies, (2) immature gossan, and (3) saprolite [18,19]. The hypogene reserves reach 170 Mt at 1% Cu and 0.3 ppm Au, while those of supergene ores are approximately 55 Mt, of which 30% correspond to the gossan orebody and 70% to the saprolite, with 0.92% Cu and 0.03 ppm Au [20].
This research investigated the Alvo 118 deposit to understand the patterns of fixation and dispersion of copper and other chemical components in the secondary mineralizations (gossan and saprolite) typical of the Itacaiúnas denuded areas. Additionally, mineralogical, textural, and isotopic data were used to evaluate the response of the hypogene mineralization and host rocks to oxidoreduction and hydrolysis reactions, respectively. Both approaches produced implications for mineral exploration.

2. Geological Setting

The Carajás Mineral Province is located in the southeastern Amazon Craton and is home to one of the world’s largest and oldest iron oxide copper gold (IOCG) belts [21,22]. Most deposits are located in the Carajás tectonic domain, in the northern portion of the province (Figure 1A), affected by two mineralizing hydrothermal events. The first (2.57 Ga) produced the Salobo, Sossego, Cristalino, and Alemão deposits; the second (1.88 Ga) formed the Gameleira, Estrela, Breves, Igarapé Cinzento, and Serra Verde deposits [18]. Alvo 118 is the only hybrid orebody, recording the overlapping of both events [19].
The Alvo 118 is a Cu and Au deposit related to shear zone hydrothermal alteration. The hypogene IOCG mineralization comprises NW-SE subvertical tabular orebodies aligned with the neighboring Sossego and Cristalino deposits [18]. The first mineralization type includes hydrothermal breccias comprising chalcopyrite and bornite matrix (with minor magnetite and pyrite), surrounding granite, gabbro, and schist clasts [23]. Stockwork veins formed of quartz, calcite, and chalcopyrite represent the second mineralization type. Hydrothermal xenotime has been dated to 1869 ± 9 Ma in the breccia zone matrix and to 1868 ± 7 Ma in the stockwork veins [18].
Figure 1. (A) Location of the Carajás tectonic domain in northern CMP; (B) geology of the Carajás domain, with the location of the main copper deposits, modified from [18,24]; (C) geological section of the Alvo 118 deposit, with hypogene mineralization, gossans, and saprolite locations (source, Vale).
Minerals 13 01441 g001
The deposit area houses mafic to intermediate volcanic sequences, with mylonitic foliation and intense chloritic alteration correlated with the Grão Pará Group. Then, these rocks are intruded by granodioritic, tonalitic, and gabbroic bodies, and finally, crosscut by dacitic-rhyolitic and diabasic dykes [19]. Toward the sulfide ore, the host rocks have been progressively subjected to sodic (albite and scapolite), potassic (biotite and alkali feldspar), chloritic, and quartz-sericitic hydrothermal alterations [19].
The gossan overlying the sulfide mineralization presents a mineralogical zonation, with progressive replacement of primary sulfides by secondary sulfides, and then by carbonates, phosphates, and copper oxides [25]. In the overlying saprolite, copper is supposed to be carried by the alteration products of the primary silicates, that is, clay minerals and iron oxyhydroxides, such as in Salobo and Furnas deposits [13,26,27], Figure 1C. The Alvo 118 deposit was initially explored in the 1990s, by Docegeo, and investigations were resumed in 2017 by Vale.

3. Materials and Methods

3.1. Sampling

Petrographic descriptions were performed on drill cores and outcrops in the Alvo 118 pilot mine, followed by the collection of 112 samples, including host rock, hypogene mineralization, gossan, and saprolite. Vale collected four hundred samples from two additional drill holes for whole-rock chemical analyses and made the results available for this research.

3.2. Optical and Electron Microscopy

The microtextural aspects were investigated through polished sections analyzed in a LEICA DM 2700 P petrographic microscope with a LEICA MC 170 HD camera (Leica, Wetzlar, Germany). These data were enhanced with scanning electron microscopy (SEM) images (backscattered electrons) taken using Hitachi TM3000 equipment (Tokyo, Japan). The target minerals were analyzed with an Oxford SwiftED3000 (Oxford Instruments, Abingdon, UK) energy dispersive system (EDS). The voltage acceleration was from 5 to 15 kV, using an SDD detector (161 eV Cu-Kα). The microtextural analyses were carried out in the Mineralogy, Geochemistry, and Applications Laboratory (Federal University of Pará).

3.3. X-ray Diffraction (XRD)

Mineral identification was enhanced with powder XRD in a Bruker D2 PHASER (Bruker, Billerica, MA, USA), with a Cu anode, Lynxeye detector (1D mode); the settings were an increment of 0.02°2θ, 0.2 s step time, and 0.1 mm slit, operating at 300 W (30 kV and 10 mA), in the angular range 5–75°2θ. For identification of clay minerals, 150 g aliquots from 20 samples were previously deflocculated in an ultrasonic vat and wet sieved at 63 μm. The passing fraction was centrifuged for 2 min at 1000 rpm. The suspension was centrifuged again at 1800 rpm for 10 min. Then, the suspension was decanted in another recipient and dried at 40 °C. Finally, the isolated clay particles were mounted in oriented sections; ethylene glycol solvated for 48 h; and heated at 540 °C for 2 h. The respective mineralogical response to each treatment was followed by DRX analyses in the angular range 4–75°2θ. These procedures were carried out in the Mineralogy, Geochemistry, and Applications Laboratory (Federal University of Pará).

3.4. Whole-Rock Chemical Analysis

Four hundred 10 Kg samples were analyzed to determine the whole-rock chemical composition. The analyzed elements were Ag, Al, As, Ba, Be, Bi, Cd, Ce, Co, Cr, Cs, Fe, Ga, Ge, Hf, In, K, La, Li, Mg, Mn, Mo, Na, Nb, Ni, P, Pb, Rb, Re, S, Sb, Sc, Se, Sn, Sr, Ta, Te, Th, Ti, Tl, U, V, W, Y, Zn, and Zr. Aliquots of 0.25 g were digested with perchloric, nitric, hydrofluoric, and hydrochloric acids. The residue was diluted with hydrochloric acid and analyzed in an atomic emission spectrometer with inductively coupled plasma (ICP-AES). Following this analysis, the results were reviewed for high concentrations of Bi, Hg, Mo, Ag, and W and diluted accordingly. Then, samples meeting this criterion were analyzed in a mass spectrometer with inductively coupled plasma (ICP-MS). Au was determined by fire essay with ICP-AES finish, and Cu was analyzed by Niton X-ray Fluorescence (Thermo Fisher Scientific, Waltham, MA, USA). The results were kindly provided by Vale.
Additionally, 12 samples collected in specific mineralogical contexts were analyzed to clarify the association between mineralogy and chemical composition. The analyzed elements were SiO2, Al2O3, Fe2O3, CaO, Na2O, K2O, Cr2O3, TiO2, MnO, P2O5, SrO, and BaO. Aliquots of 0.1 g were added to lithium borate and fused at 1025 °C. Then, the resulting melt was cooled and dissolved in a mixture of nitric, hydrochloric, and hydrofluoric acids, and then this solution was analyzed by ICP-AES. Barium, Ce, Cr, Cs, Dy, Er, Eu, Ga, Gd, Ge, Hf, Ho, La, Ku, Nb, Pr, Rb, Sm, Sn, Sr, Ta, Tb, Th, Tm, U, V, W, Y, Yb, and Zr were digested by the same method, but with an additional lithium borate fusion and analyzed by ICP-MS. Loss on ignition was determined by the gravimetric method, using a thermal decomposition furnace. Total S and C were analyzed by LECO infrared spectroscopy.
For Ag, Cd, Co, Cu, Li, Mo, Ni, Pb, Sc, and Zn, 0.25 g aliquots were digested with perchloric, nitric, hydrofluoric, and hydrochloric acids. The final volume of residue was reached by adding dilute hydrochloric acid, and the resulting solution was analyzed by ICP-AES. For Cu, 0.4 g samples were digested in aqua regia and analyzed by ICP-MS. For As, Bi, Hg, In, Re, Sb, Se, Te, and Tl, 0.50 g aliquots were digested with aqua regia for 45 min. After cooling, the solution was diluted to 12.5 mL with deionized water and analyzed by ICP-MS. Gold, Pt, and Pd were determined by fire essay and ICP-AES finish. All the chemical data were acquired in the facilities of ALS laboratories.
Eu anomaly determination was carried out as follows: First, the geometric mean between the normalized values of Sm and Gd was calculated (Eu* = Sm + Gd)/2. Next, the ratio between the normalized Eu content (Eu) and the result of this interpolation (Eu/Eu*) was determined. Results above 1 represent a positive anomaly and results below 1 represent a negative anomaly.
The calculation of correlation coefficients with chemical data was performed using Micosoft Excel 2022. The same software was used to make normalization diagrams. Additionally, Origin 6.0. was used to perform a clusters analysis.

3.5. Stable Isotopes

Powdered samples were heated, at 1000 °C for 90 min, to remove organic compounds, and then dissolved in concentrated HF, HNO3, and HCl in Teflon beakers at 130 °C. Solutions were split into two aliquots, dried down, and redissolved in 1 mL of 6M HCl (for Fe isotope analyses) and 1 mL of 10M HCl (for Cu isotope analyses). Only double-distilled acids were used in the procedure, and labware was precleaned with 10% HCl to minimize contamination. For technical reasons, it was possible to analyze a maximum of eight samples comprised of hypogene mineralization (two samples), gossan (three samples), and saprolite (three samples); all samples were analyzed in triplicate.

3.5.1. Iron Isotopes

Eight aliquots corresponding to 500–1000 µg Fe were loaded onto anion exchange columns with approximately 1 mL of AG1-X8 resin (100–200 mesh) in a class A100 laminar flow hood. Matrix elements were eluted using 5 mL of 6M HCl; Fe was eluted using 2 mL ultrapure water and 4.5 mL of 5M HNO3 [28]. The eluted sample was dried overnight and taken up in 0.3M HNO3. Samples were subsequently analyzed for Fe concentrations using a Nu Plasma II multi-collector inductively coupled plasma mass spectrometer (MC-ICP-MS) with an upgraded Plasma 3 interface at the University of Bergen. A blank acid sample run over the same anion exchange columns yielded a blank of 4 ng Fe, corresponding to less than 0.002% of the Fe in the samples.
Solutions were diluted to 2 ppm Fe in acid-cleaned Teflon vials and analyzed for Fe isotopes in wet plasma mode at pseudo-medium resolution (R5-95% = 9899) with 54Fe in Faraday cup L5, 56Fe in H1, and 57Fe in H4. Zeros were measured by ESA deflection for 30 s before each block, and samples were analyzed in 2 blocks of 20 measurements of 8 s. Each sample was run in duplicate, and an internal standard (Han Fe, δ56Fe = 0.29 ± 0.07‰) [28] was regularly measured to confirm accurate Fe isotope ratios. Fe isotope ratios were corrected for mass bias using standard-sample bracketing (SSB) with the bracketing standard IRMM-014, following the equation: δ56Fespl, corr = {((56Fe/54Fe)spl, meas/[0.5 × (56Fe/54Fe)std1, meas + 0.5 × (56Fe/54Fe)std2, meas]) −1} × 1000 and similarly for δ57Fe.
A plot of δ57Fe versus δ56Fe confirmed that all samples and the standard fall (within error) on the terrestrial mass-dependent fractionation line with a slope of 1.47. Based on repeated analyses of Han Fe (n = 15), the external precision on δ56Fe was 0.10 (2 s). Analyses of the BCR-2 basalt standard yielded an average δ56Fe of 0.07 ± 0.05‰ (n = 3), which is in excellent agreement with the published value of 0.09 ± 0.01‰ [29].

3.5.2. Copper Isotopes

Eight aliquots corresponding to 1000 µg Cu were loaded onto custom-made Teflon columns with 1 mL of AG-MP1 anion exchange resin (100–200 mesh) in a class A100 laminar flow hood. For samples less than 100 µg, Fe was loaded onto the column, matrix elements were eluted using 4 mL of 10M HCl, and Cu was subsequently eluted using 6 mL of 5M HCl [30]. Column calibration showed that higher Cu contents result in earlier elution of Cu. For samples with more than 100 µg Cu, the matrix elements were eluted with only 3 mL of 10M HCl. The eluted samples were dried overnight, refluxed with concentrated HNO3 for 4 h, and taken up in 0.3M HNO3.
Samples were subsequently analyzed for Cu concentrations using a Nu Plasma II MC-ICP-MS at the University of Bergen. A blank acid sample run over the same anion exchange columns yielded a blank of 1 ng Cu, corresponding to less than 0.001% of the Cu in the samples. Solutions were diluted to 100 ppb Cu in acid-cleaned Teflon vials and analyzed for Cu isotopes in wet plasma mode at low resolution with 63Cu in the axial Faraday cup and 65Cu in H4. Zinc abundances were monitored in Faraday cups H6 (66Zn) and H9 (68Zn), and total Zn signals were typically less than 1% of the total Cu signal. Zeros were measured by ESA deflection for 30 s before each block, and samples were analyzed in 2 blocks of 20 measurements of 8 s.
Each sample was run in duplicate, and an internal standard (Bergen Cu, δ65Cu = −0.06 ± 0.06‰, Moeller et al., 2012) was regularly measured to confirm accurate Cu isotope ratios. Cu isotope ratios were corrected for mass bias using standard-sample bracketing (SSB) with the bracketing standard ERM AE647, following the equation: δ65Cuspl, corr = {((65Cu/63Cu)spl, meas/[0.5 × (65Cu/63Cu)std1, meas + 0.5 × (65Fe/63Cu)std2, meas]) −1} × 1000. Values were subsequently recalculated to the SRM976 standard as: δ65CuSRM976 = δ65CuERM AE647 + 0.21 [31]. Based on repeated analyses of Bergen Cu (n = 8), the external precision on δ65Cu was 0.08 (2 s).

4. Results

4.1. Structure and Zonation of the Deposit

The investigated drill cores exhibit three distinct kinds of mineralization: hypogene, gossan, and saprolite. The hypogene and gossan mineralizations are typically interspersed with fresh host rocks (Figure 2A). The base of the profile is comprised of chlorites, consisting of approximately 80 vol% chlorite, 15 vol% plagioclase, 5 vol% quartz, with accessory magnetite, and occasional zones of potassic alteration, indicated by the presence of alkali feldspar. Above that, the host rocks are granodiorites, comprised of quartz (40 vol%), oligoclase (35 vol%), and orthoclase (15 vol%), in addition to biotite and hornblende that together make up approximately 10 vol%. The main accessory minerals in the granodiorites are apatite, zircon, and titanite.
Hypogene mineralization occurs approximately between 110 and 140 m deep, comprised of massive ore, interspersed disseminated ore, and chlorite zones. The disseminated-type mineralization corresponds to stockwork veins formed of quartz with chalcopyrite, alkali feldspar, and calcite, with traces of siderite and fluorite (Figure 2B). The massive type is comprised of chalcopyrite (with traces of nukundamite) surrounding millimetric fragments of chlorite (Figure 2C). Chalcopyrite exhibits numerous inclusions, like apatite, magnetite, petzite, altaite, galena, uraninite, stannite, and cassiterite (Figure 3).
The gossan was divided into four zones according to the dominant minerals: goethite, malachite, cuprite, and libethenite. Chlorites host the first two zones, and the last two are hosted by granodiorites. The goethite zone is at the base of the gossan profile and presents three main faciological variations: (1) cavity-filling, (2) fracture-filling, (3) and breccia facies. The cavity-filling facies are comprised of quartz-rich stockwork veins with numerous cavities formed by the dissolution of chalcopyrite. These cavities are invariably coated with goethite (Figure 2D) and sometimes malachite. The fracture-filling facies consists of goethite and chalcocite locally filling chlorite fractures. The breccia facies consist of a goethite micromass surrounding quartz grains up to 4 cm in diameter (Figure 2E,F). Native copper crystals and pseudomalachite are often identified within the goethite matrix.
The malachite zone is predominantly massive and up to 2 m thick. It consists of a malachite micromass with subordinate chrysocolla and ramsbeckite, surrounding black nodules of cuprite and tenorite (Figure 2G). Massive goethite is often associated with this zone. The cuprite zone is predominantly massive, approximately 1 m thick, and is characterized by the intercalation of (1) reddish portions formed of cuprite and goethite surrounding millimetric quartz grains and (2) brownish sections, consisting of goethite, chalcocite, and quartz (Figure 2H). The libethenite zone is located approximately from 43 to 80 m deep and represents the gossan top. Its distribution is restricted to the granodiorite fracture system, and the main Cu-bearing phase is libethenite, with minor pseudomalachite and malachite (Figure 2I). The gossan mineralogical composition was determined by XRD and electron microprobe microanalysis, both techniques published in previous research that was carried out by the first two authors [32].
The saprolite extends from the surface to approximately 35 m deep, overlying fresh chlorites. Its base is comprised of weakly weathered chlorites, partially preserving the primary foliation, thus composing coarse saprolite (Figure 2J). From the bottom to the top, the saprolite is progressively kaolinized, with the development of fine saprolite, displaying clayey zones with alternating colors, ranging from red to light red with white stains and yellow (Figure 2K–M). Numerous quartz veins crosscut all the saprolite zones.
Kaolinite is the predominant mineral all over the fine saprolite. It was identified from its 001 peak at 7.12 Å in the natural samples, which was not displaced after treatment with ethylene glycol but disappeared after heating at 550 °C. Across the profile, kaolinite may be associated with chlorite, vermiculite, smectite, or both.
Chlorite was identified from its highest intensity peak at 14 Å in the natural sample, whose position remains unchanged after glycolation and heating at 550 °C. Vermiculite was indicated by the 14.18 Å and 14.25 Å peaks in natural samples, which remain unchanged after glycolation and collapse to 12.46 and 12.28 Å, respectively, after heating. Smectite peaks appear at 14.49 Å and 14.05 Å in the natural samples, expanding to 16.5 and 17.12 Å in the glycolated samples; and collapsing to 9.91 and 9.89 Å after heating. Quartz and goethite are present throughout the thin saprolite as resistate and newly formed minerals, respectively.

4.2. Chemical Composition of the Hypogene Mineralization, Gossan, and Saprolite

Aluminum (Al2O3), SiO2, Fe2O3, CaO, MgO, K2O, and LOI are the main components of the hypogene mineralization, gossan, and saprolite, followed by CaO, MgO, K2O, TiO2, MnO, and P2O5 (Table 1). Sodium (Na2O) was detected only in the saprolite, averaging 0.038%. The CuO contents vary from 26.29 to 29.79% in the analyzed samples of the massive hypogene mineralization. However, in the gossan, CuO oscillates according to the mineralogical composition of each zone, goethite (0.9 to 0.91% CuO), malachite (from 46 to >50% CuO), and cuprite (7.9% CuO). This oscillation is also present in the saprolite (from 1.15 to 4.79% CuO). The Au values are higher in the hypogene mineralization (average 2.19 ppm), reduced in the gossan (from 0.05 to 0.47 ppm), and strongly decreased in the saprolite (from not detected to 0.55 ppm).
In the hypogene mineralization, the high Fe2O3, CuO, and S contents reflect the predominance of chalcopyrite, while SiO2, Al2O3, MgO, and part of the Fe2O3 correspond mostly to chlorite. The gossan exhibits a substantial variation in Fe2O3 contents (from 0.77 to 71.4%), in which the lowest values correspond to the malachite and cuprite zones, and the highest values naturally delimit the goethite zone. Intermediate Fe2O3 values are found in the interspersed chlorites, exhibiting the highest SiO2, Al2O3, and MgO contents. In the saprolite, the Fe2O3 contents (6.35 to 20.2%) are controlled by the distribution of iron oxyhydroxides and exhibit very similar behavior to MgO, reflecting relic chlorites and iron release during chlorite weathering.
Among the trace elements, Sn, Pb, U, Te, and Ag concentrations are much higher than those of the upper continental crust (UCC) in the hypogene mineralization because of the inclusions of stannite, cassiterite, galena, uraninite, altaite, and petzite in chalcopyrite. These elements generally show substantially lower values in gossan and saprolite than in hypogene mineralization but are still above UCC.
The proportions of SiO2, Al2O3, and Fe2O3 in selected samples from the hypogene mineralization, gossan, and saprolite demonstrate the compositional heterogeneity of the gossan compared with the saprolite, which forms a more homogeneous group (Figure 4). The assemblage formed by the three types of mineralization shows a trend of increasing Fe2O3 + MgO content. In hypogene mineralization, this reflects the predominance of chalcopyrite; in gossan and saprolite, it is related to iron oxyhydroxides and chlorite contents.
The CuO and Au contents oscillate strongly and similarly along the investigated boreholes (Figure 5). In the hypogene mineralization, this oscillation reflects the alternation between massive and disseminated sulfide domains. In the gossan, the highest contents correspond to the malachite and cuprite zones, which are massive, while the lowest contents are in the libethenite zone, restricted to the fracture system, with a disseminated distribution. The CuO and Au contents in the saprolite are higher than those in the libethenite zone located in the upper portion of the gossan but lower than those of the goethite, malachite, and cuprite zones. In addition to the disseminated phosphate mineral distribution, the lower Cu grades in the libethenite zone could indicate that Cu was mobilized downward from it.

4.3. Copper and Fe Isotopes

The isotopic composition of the analyzed samples initially reflects chalcopyrite dissolution (the main Cu and Fe carrier in the hypogene ore) and the newly formation of Cu/Fe-bearing minerals in the gossan zones. Additionally, the overlying saprolite represents a new Cu and Fe isotopic fractionation stage.
The hypogene mineralization is enriched in the heavy copper isotope (δ65Cu = +0.13 and +0.06‰), as well as the iron oxyhydroxide zone of the gossan, where the δ65Cu value is even heavier (δ65Cu = +0.73‰). However, the malachite zone of the gossan is isotopically lighter (δ65Cu = −0.69 and −0.70‰). The saprolite overlying the gossan is also enriched in heavy isotopes, showing values similar to those observed in the hypogene mineralization (δ65Cu = +0.07, 0.08, and +0.09‰). Therefore, there is no apparent isotopic fractionation between the hypogene mineralization and saprolite, while the zones that make up the gossan show significant positive and negative values (Table 2).
The heavy Fe isotope is enriched in the hypogene mineralization (δ56Fe = +0, 36, and +0.45‰) and further increased in the malachite zone of the gossan (δ56Fe = +0, 57, and +1.00‰). However, the iron oxyhydroxide zone of the gossan is depleted (δ56Fe = −0.56‰). The saprolite overlying the gossan is enriched in the heavy isotope, as in the hypogene mineralization and malachite zone (δ56Fe = +0.02, +0.14, and +0.22‰) (Table 2).

5. Discussion

This section is mainly dedicated to the geochemical behavior of the elements that exhibit high affinity with CuO in the hypogene mineralization, seeking to understand their fractionation along the gossan and the overlying saprolite. The remaining elements will be approached based on their linkage with the accessory minerals of the hypogene mineralization and host rocks.

5.1. Bivariate Geochemical Correlations

The mineralogical distribution of main trace elements was determined using bivariate analysis (Pearson correlation coefficient). Thus, in the hypogene mineralization, the strong correlations between CuO and Au (0.87), Ag (0.93), Te (0.97), and Pb (0.83) reflect petzite, altaite, and galena inclusions in the chalcopyrite mass (Figure 6A–C). There is also a strong correlation between CuO and In (0.88) and Se (0.94), in which the latter reflects possible S substitution, which is common in hydrothermal chalcopyrites [14,34].
The strong Bi × Pb correlation (0.90) may indicate Bi incorporation by galena, typically reported in hydrothermal deposits [35]. Additionally, galena inclusions in chalcopyrite results in an intermediate Bi × CuO correlation (0.56) (Figure 6D). The high As × U (0.90) and Mo × U (0.70) correlations suggest As and Mo are at least partially carried by uraninite, as reported by [36].
The correlations between CuO and Ag (0.73), Te (0.55), Pb (0.57), Se (0.79), and Bi (0.56) are maintained in the gossan, although weaker, suggesting that after the dissolution of petzite, altaite, and galena, these elements have been at least partially incorporated by the newly formed copper minerals [5]. Conversely, Au and In show no correlation with CuO nor Ag but are correlated with Fe2O3 (0.50 and 0.66, respectively). This fact suggests petzite (the only identified gold-bearing mineral) was solubilized, and then gold was complexed and precipitated preferentially with iron oxyhydroxides [37,38].
In the gossan, the most significant correlations are between Fe2O3 and Mo (0.88), Sc (0.65), Sn (0.72), Y (0.78), U (0.49), Zn (0.65), As (0.79), Be (0.88), Ga (0.64), and Ni (0.67), partially illustrated in Figure 6E–H. They suggest iron oxyhydroxides are the main carriers of metals released by hypogene mineralization. These incorporations are possible by coprecipitation or adsorption [39,40,41]. The Fe2O3 × Sn correlation may also indicate the presence of relic cassiterite included in the iron oxyhydroxide micromass.
In the saprolite, Fe2O3 correlates with Ga (0.81), Sc (0.70), Sn (0.78), V (0.73), Mn (0.57), Co (0.65), and Cr (0.57), as partially illustrated in Figure 7A–D, again suggesting their incorporation by iron oxyhydroxides [42]. In weathering profiles, goethite usually presents low crystallinity and is comprised of nanometric particles with high surface area, thus representing an important cation immobilizer [43,44]. The geochemical correlations identified in the hypogene mineralization and gossan are generally absent in the overlying saprolite, except for Fe2O3 with Ga, Sc, and Sn. In addition, V, Mn, Co, and Cr present a good correlation with Fe2O3 only in the saprolite, suggesting they were derived from host rock weathering.
Zircon exhibits a strong correlation with Ti in hypogene mineralization (0.99), in addition to the typical Zr × Hf (0.90) correlation. This behavior is maintained in the gossan (0.90) and saprolite (0.77) because their possible carriers (e.g., zircon and rutile) are stable in the supergene environment [45,46,47,48].

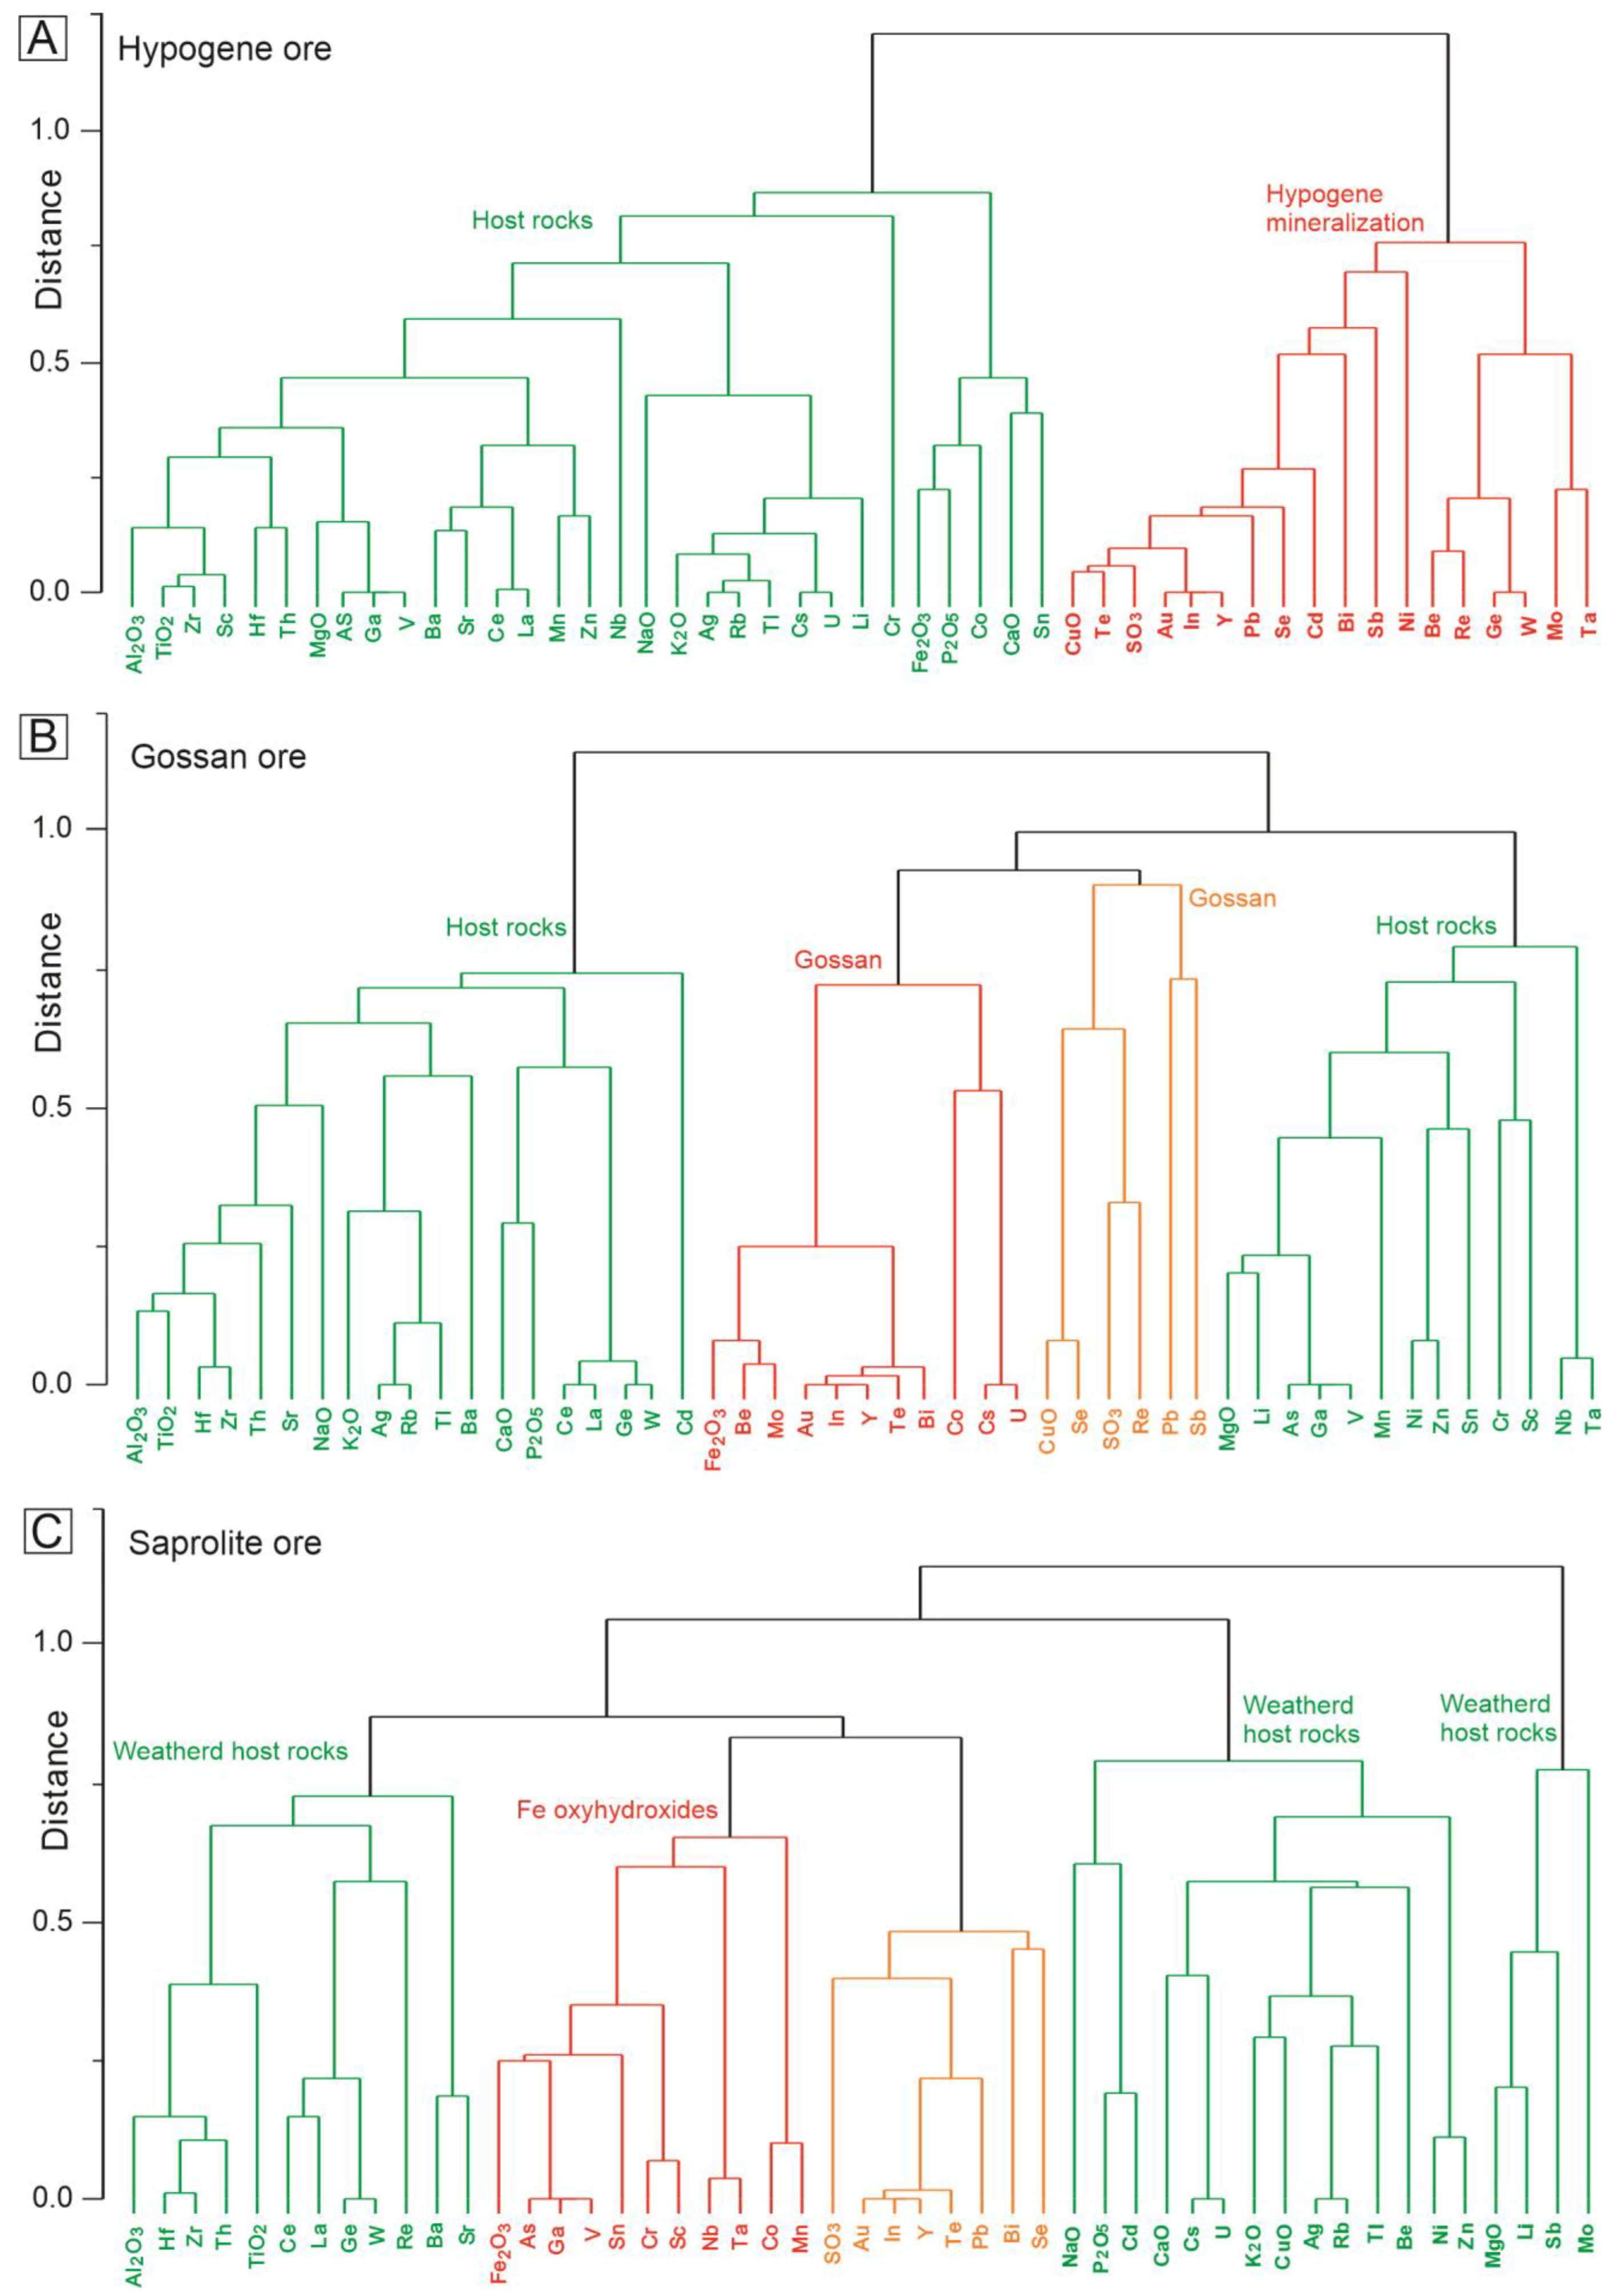
5.2. Multivariate Geochemical Correlations

The chemical composition of the hypogene mineralization is fundamentally controlled by the alternation between disseminated and massive sulfide zones, that is, zones with the greater or lesser influence of the host rock, respectively. Thus, the two identified clusters (Euclidean distance of 0.8) reflect chlorites and hypogene mineralization contribution (Figure 8A). This is supported by the strong correlation between CuO × Se, Cd, Bi, Sb, Te, Au, In, Y, and Pb previously presented, in addition to the identification of petzite, altaite, and galena inclusions.
Four clusters were recognized in the gossan (Euclidean distance of 0.8). Two of them correspond to the composition of the host rocks. The other two represent the chemical composition of the gossan, in which one group can be distinguished by its similarity with Fe2O3 and the other with CuO (Figure 8B). This association suggests that Cu and Fe minerals incorporated the same trace elements initially contained in the hypogene mineralization, with a few exceptions (Cs, U, Ta, Cd, Ge, Ni, and W) that also show affinity with the host rocks.
The four clusters identified in the saprolite are very distinct from those highlighted in the hypogene mineralization and gossan (Euclidean distance of 0.85). Two of them are related to the weathering products of the host chlorites; the third (Fe2O3, As, Ga, V, Sn, Cr, Sc, Nb, Ta, Co, and Mn) suggests incorporation or adsorption by iron oxyhydroxides; the fourth (SO3, Au, In, Y, Te, Pb, Bi, and Se) broadly is the only connection of the saprolite with the hypogene mineralization and gossan (Figure 8C).
The two groups of elements exhibit high similarity in the three mineralization types (hypogene, gossan, and saprolite). The first (Au, In, Y, Te, Pb, Bi, and Se) corresponds to the components of hypogene mineralization, which continue to be associated with each other in the gossan and saprolite. The second group (Al2O3, Hf, Zr, Th, TiO2, Ce, La, Ba, and Sr) is equivalent to the geochemical signature of the host rocks, which is preserved in the form of resistate or newly formed minerals.

5.3. Geochemical Fractionation

In the hypogene mineralization, the CuO, Se, Y, Ag, In, Sn, Pt, and Au concentrations reach values more than ten times higher than that of the UCC, reflecting the composition of chalcopyrite and its inclusions (Figure 9A). In the gossan, the same elements remain above the UCC with the addition of P2O5, Fe2O3, Mo, Pd, and Ag (Figure 9B). This is following the binary and cluster diagrams previously presented, which indicated similarity between the trace elements contained in the hypogene and gossan mineralizations. Se, Ag, Sn, Pt, Au, and Pd concentrations in the saprolite are more than ten times higher than in the UCC (Figure 9C), following the hypogene mineralization and gossan. However, the general pattern for most elements differs from them due to the lower values, near or below the UCC contents. This contrast reflects the predominant influence of the chlorites on saprolite generation rather than hypogene mineralization and gossan.

5.4. REE Fractionation

The distribution patterns of REE normalized to the chondrites [49] demonstrate that they were fractionated during the supergene evolution of the deposit. In the hypogene mineralization, the HREE are enriched relative to the LREE, with an average (La/Lu)N of 0.08. This contrast is attenuated in the gossan, where the average value of (La/Lu)N is 0.28, and it is reversed in the saprolite, where the HREE becomes enriched compared to the LREE and the average (La/Lu)N ratio is 3.95. Additionally, the negative Eu anomaly is stronger in the hypogene mineralization than in gossan and saprolite (Table 1 and Figure 10).
Several REE-bearing accessory minerals have been reported in the hypogene mineralization of the Alvo 118 deposit, including xenotime, monazite, britholite, gadolinite group mineral, and Be-Ba-HREE silicate [19,50]. Their dissolution must have been responsible for the strong fractionation identified along the supergene evolution. Additionally, malachite and goethite have been reported as possible REE-bearing phases in supergene environments [51,52,53].

5.5. Isotopic Fractionation

The initial objective of using isotopic data was to compare copper and iron isotopic fractionation across hypogene, gossan, and saprolite mineralizations. For this, only two gossan zones, i.e., malachite and cuprite zone, were selected. It was later found that, in addition to the fractionation between different mineralization types, there was also significant fractionation between gossan zones, as discussed below.
The δ65Cu values in the hypogene mineralization from Alvo 118 (δ65Cu = +0.06 and +0.13‰) are consistent with massive and disseminated chalcopyrites from hydrothermal deposits, which are generally 0 ± 1‰ [54,55,56]. In the gossan, the goethite and malachite zones show slight positive and negative fractionations, respectively, relative to the hypogene mineralization (Figure 11A). This fractionation is initially due to electron-exchange-driven redox reactions (Cu+/Cu2+) at the surface of the sulfides, which usually occur during the air and aqueous chemical reactions [57].
The higher δ65Cu values in the goethite zone compared with that of the hypogene mineralization are consistent with experimental and field studies, which indicate that redox reactions on hypogene sulfides produce isotopically heavier solutions [58,59] and that goethite can adsorb or coprecipitate Cu from such solutions, acquiring a heavier isotopic composition than that of the parent sulfide [58]. However, in many gossans, the development of a leaching zone overlying the oxidation zone results in successive cycles of alteration of the Cu-bearing neoformed minerals, including Fe oxyhydroxides, which are gradually depleted at 65Cu, reaching lower δ65Cu values compared with the hypogene sulfides [58,60]. That is not the case for the studied goethite zone, which was not affected by the leaching zone, resulting in the preservation of the heavier isotopic composition. The overlying libethenite zone, which is closer to the surface, may have been affected by leaching, but this research did not provide data from this zone, due to technical limitations.
The depletion in δ65Cu in the two samples from the malachite zone is consistent with the results obtained in several gossans worldwide, which are usually between −0.1 and +0.1‰ in oxidation zones [55,57,61,62]. Indeed, experimental studies have reported isotopic fractionation between the solution and malachite, in which malachite isotopic composition is lighter than the precursor solution and parent sulfide [63,64,65].
In the saprolite, the main carrier of Cu released after chalcopyrite dissolution might be goethite, typically by sorption or coprecipitation from isotopically heavier solutions compared with hypogene mineralization [58]. Thus, during adsorption, Fe oxyhydroxides typically accumulate the heavy isotope similar to the gossan goethite zone discussed above. However, the exposure of goethite to leaching close to the surface [66] leads to preferential loss of the heavy isotope, causing a reduction of δ65Cu values. Thus, goethites from the saprolite are isotopically lighter than those from the gossan goethite zone, showing an isotopic composition similar to the hypogene mineralization [67,68].
The δ56Fe values from Alvo 118 chalcopyrites are in the range of hydrothermal chalcopyrites from Lucky Strike, USA (from −0.47‰ to 0.34‰) and Iryan Jaya, Indonesia, from −2.01‰ to 1.08‰ [54,69]. Iron isotopic fractionation is also related to electron-exchange-driven (Fe2+/Fe3+) redox reactions initially at the surface of the hypogene sulfides [57]. It reflects the different degrees of Fe oxidation in chalcopyrite and goethite (Figure 11B).
Considering that goethite is the only iron-bearing mineral in the malachite zone, the increase in the δ56Fe values compared with the hypogene sulfides is consistent with the Fe isotopic fractionation described in supergene environments dominated by redox, in which the oxide zone (e.g., malachite zone) shows higher δ56Fe values than those of the hypogene sulfides and lower δ56Fe than the those of the overlying leaching zone when present [70]. This is also supported by experimental studies, which have indicated that Fe3+-bearing phases are usually enriched in heavy isotopes compared with those carrying Fe2+ [71,72,73]. However, the goethite zone sample is depleted in heavy isotopes compared to hypogene mineralization, which was not expected. This may suggest some variation in the isotopic content of the precursor sulfide or that chalcopyrite is not the only Fe source, and chlorite is a possible additional provenance.
The slightly negative fractionation of the saprolite compared with the hypogene mineralization indicates a low affinity because the sorption of Fe3+ onto goethite arising from the oxidation of aqueous Fe2+ into Fe3+ would typically favor heavy isotopes, causing a considerable increase in δ56Fe [74,75,76]. This behavior reveals the low influence of the hypogene mineralization and gossan on saprolite Fe contents, which are more influenced by chlorite. Thus, chlorite influence must be responsible for isotopic values below the expected, as in the gossan goethite zone.
The interpretations presented must be considered with caution, as the restricted number of samples analyzed prevents a more accurate statistical treatment. Still, in general, the data obtained show equivalence between samples from the same gossan zone or the same mineralization type. Additionally, the data are compatible with the available literature on isotopic fractionation in supergene environments. In this way, copper and iron isotopic fractionation works as supporting information to the major geochemical and mineralogical interpretations.

5.6. Geochemical Evolution and Exploratory Implications

Statistical analyses showed that chalcopyrite is the main carrier of trace elements in the hypogene mineralization, either as a solid solution or in mineral inclusions. This is indicated by the correlation of Cu with Au, Ag, In, Y, Bi, Pb, Se, and U, which is consistent with previous studies on sulfide deposits [77,78,79,80,81].
The oxidation of S, with consequent chalcopyrite dissolution, represents the initial stage of the supergene evolution of the Alvo 118 deposit. This process culminates in the dissolution of petzite, altaite, uraninite, and stannite inclusions and the conversion of magnetite to hematite, while the cassiterite inclusions remain stable.
Metals released by the decomposition of the hypogene minerals were mainly incorporated into the gossan by the newly formed minerals from the goethite, malachite, cuprite, and libethenite zones. Conversely, these elements are at much lower concentrations in the gossan, as they have been predominantly lost from the system, as suggested by the multi-elemental diagrams. In this new environment, Ag, Te, Pb, Se, and Bi still show a high correlation with Cu minerals (represented by CuO). At the same time, U, Au, In, and Y are correlated with iron oxyhydroxides.
Iron oxyhydroxides have also incorporated other metals not correlated with CuO in hypogene mineralization, such as Sn, Zn, As, Be, Ga, Mo, Ni, and Sc. This process may occur via coprecipitation and/or adsorption, with ferrihydrite as the precursor [44,82,83,84,85].
The relatively good preservation of the gossan-hosting chlorites can be attributed to the slightly acidic to neutral conditions of the oxidation zone due to the low S/Cu ratio of chalcopyrite and the presence of carbonate-rich gangue minerals [15,39,86]. This supports the restricted influence of the water table, as demonstrated by the δ65Cu values, so that the chlorite minerals are mostly preserved from hydrolysis reactions. The granodiorites were more reactive with acidic solutions formed during chalcopyrite dissolution. Thus, kaolinite micromasses formed by feldspar hydrolysis are locally distributed in the libethenite zone. However, granodiorite distribution is more restricted than chlorites.
The deepening of the water table led to the development of a new evolutionary stage, with chemical remobilization dominated by hydrolysis reactions and saprolite formation. The vertical zoning of clay minerals in the saprolite suggests that chlorite, in the coarse saprolite, was progressively converted to vermiculite [87,88]. Conversely, in fine saprolite, vermiculite is converted into smectite and kaolinite [82].
Thus, most of the iron required for goethite formation was released during chlorite and vermiculite weathering [89]. This is supported by the fact that the δ56 Fe values are incompatible with the isotopic evolution derived only from the chalcopyrite-rich hypogene mineralization (Figure 11B). Trace elements from the host rocks were then incorporated by goethite, which was demonstrated by the strong correlations of Fe2O3 with Ga, Sc, Sn, V, Mn, Co, and Cr, which was negligible in the hypogene mineralization and gossan.
In, Y, Te, Pb, Bi, and Se comprise the main Cu and Au pathfinder elements since they exhibit as strongly associated in the hypogene mineralization and remain associated in the gossan and saprolite. In contrast, Al2O3, Hf, Zr, Th, TiO2, Ce, La, Ba, and Sr are associated all over the deposit as a geochemical pattern of the host rocks, which are the saprolite’s parent rocks.

6. Conclusions

This research described the geochemical and isotopic fractionation in the two evolutionary stages superimposed on the hypogene mineralization of the Alvo 118 deposit and host rocks, in which gossan and saprolite were formed.
In the hypogene mineralization, the most important trace elements are Ag, Te, Pb, Se, Bi, Au, In, Y, Sn, and U, mainly hosted by chalcopyrite and numerous inclusions of petzite, altaite, galena, uraninite, stannite, and cassiterite.
In the gossan, Ag, Te, Pb, Se, and Bi are associated with the newly formed Cu minerals, while Au, In, Y, Sn, and U show a more significant association with the iron oxyhydroxides, in addition to Zn, As, Be, Ga, Ga, Mo, Ni, and Sc.
The δ65Cu values reveal that the Alvo 118 gossan is immature and was preserved from intense leaching. Conversely, near the surface, the host rocks were converted into a typical saprolite horizon, compatible with lower δ65Cu values. Additionally, the δ56Fe values indicate a restricted contribution of the hypogene mineralization to the Fe content of the saprolite, more related to chlorite weathering. A greater number of analyses would be necessary to reinforce such interpretations with a more accurate statistical treatment.
In the saprolite, Ga, Sc, Sn, V, Mn, Co, and Cr are associated with the iron oxyhydroxides, and the last four are derived from the weathering of the host rocks as they do not correlate with Fe2O3 in the hypogene mineralization and gossan.
The association between Al2O3, Hf, Zr, Th, TiO2, Ce, La, Ba, and Sr corresponds predominantly to the geochemical signature of the host rocks, with primary contribution from the chlorites. Conversely, the association formed of In, Y, Te, Pb, Bi, and Se represents the geochemical signature of the three mineralization types, representing the main Cu and Au pathfinders.

Author Contributions

Conceptualization, P.H.C.d.S. and M.L.d.C.; methodology, P.H.C.d.S. and D.L.R.; software, P.H.C.d.S. and D.L.R.; validation, P.H.C.d.S., M.L.d.C. and D.L.R.; formal analysis, P.H.C.d.S. and D.L.R.; investigation, P.H.C.d.S.; resources, P.H.C.d.S.; data curation, P.H.C.d.S., M.L.d.C. and D.L.R.; writing—original draft preparation, P.H.C.d.S.; writing—review and editing, P.H.C.d.S., M.L.d.C. and D.L.R.; visualization, P.H.C.d.S.; supervision, M.L.d.C.; project administration, M.L.d.C.; funding acquisition, M.L.d.C. and D.L.R. All authors have read and agreed to the published version of the manuscript.

Funding

This work was supported by the National Council for Scientific and Technological Development (CNPq) (305015/2016-8 and 442871/2018-0) and PROPESP/UFPA (PAPQ).

Data Availability Statement

The data presented in this study are available on request from the corresponding author.

Acknowledgments

The authors thank Vale S.A. for access to exploration areas, logistical support during field activities, and access to drill cores and exploratory data; the geologist Clóvis Maurity for the intermediation of the partnership with Vale S.A.; Geosciences Institute of the Federal University of Pará and the University of Bergen for the analytical facilities; the important contributions given by Minerals’s reviewers and editors.

Conflicts of Interest

The authors declare no conflict of interest.

References

  1. Andreu, E.; Torró, L.; Proenza, J.A.; Domenech, C.; García-Casco, A.; Villanova de Benavent, C.; Chavez, C.; Espaillat, J.; Lewis, J.F. Weathering profile of the Cerro de Maimón VMS deposit (Dominican Republic): Textures, mineralogy, gossan evolution and mobility of gold and silver. Ore Geol. Rev. 2015, 65, 165–179. [Google Scholar] [CrossRef]
  2. Yesares, L.; Sáez, R.; Ruiz, A.G.; Nieto, J.M.; Gómez, C.; Ovejero, G. Mineralogical evolution of the Las Cruces gossan cap (Iberian Pyrite Belt): From subaerial to underground conditions. Ore Geol. Rev. 2017, 80, 377–405. [Google Scholar] [CrossRef]
  3. Pires, G.L.C.; Renac, C.; Bongiolo, E.M.; Neumann, R. Gossan mineralogy, textures, and gold enrichment over the Au (As, Bi, Ag) deposit in the Buracão Area (Brasília Fold Belt, Brazil): Implications for gold prospecting in weathering profiles. J. Geochem. Explor. 2020, 218, 106615. [Google Scholar] [CrossRef]
  4. Williams, W.C.; Meissl, E.; Madrid, J.; Machuca, B.C. The San Jorge porphyry copper deposit, Mendoza, Argentina: A combination of orthomagmatic and hydrothermal mineralization. Ore Geol. Rev. 1999, 14, 185–201. [Google Scholar] [CrossRef]
  5. Atapour, H.; Aftabi, A. The geochemistry of gossans associated with Sarcheshmeh porphyry copper deposit, Rafsanjan, Kerman, Iran: Implications for exploration and the environment. J. Geochem. Explor. 2007, 93, 47–65. [Google Scholar] [CrossRef]
  6. Suaréz, A.; Prichard, H.M.; Fisher, P.C.; McDonald, I. Platinum Group-Minerals in the Gossan from the Key West Cu-Ni-Pt Sulphide Occurrence (Nevada, USA). Macla Rev. Soc. Española Mineral. 2012, 16, 242–243. [Google Scholar]
  7. Ozdemir, A.; Sahinoglu, A. Important of Gossans in Mineral Exploration: A Case Study in Northern Turkey. Int. J. Earth Sci. Geoph. 2018, 4, 1–20. [Google Scholar] [CrossRef] [PubMed]
  8. Angélica, R.S.; Costa, M.L.; Pöllmann, H. Gold, wolframite, tourmaline-bearing lateritized gossans in the Amazon region, Brazil. J. Geochem. Explor. 1996, 57, 201–215. [Google Scholar] [CrossRef]
  9. Costa, M.L.; Angélica, R.S.; Fonseca, L.R. Geochemical exploration for gold in deep weathered lateritized gossans in the Amazon region-Brazil: A case history of the Igarapé Bahia deposit. Geochim. Bras. 1996, 10, 13–26. [Google Scholar] [CrossRef]
  10. Porto, C.G. Geochemical exploration challenges in the regolith dominated Igarapé Bahia gold deposit, Carajás, Brazil. Ore Geol. Rev. 2016, 73, 432–450. [Google Scholar] [CrossRef]
  11. Veiga, M.M.; Schorscher, H.D.; Fyfe, W.S. Relationship of copper with hydrous ferric oxides: Salobo, Carajás, PA, Brazil. Ore Geol. Rev. 1991, 6, 245–255. [Google Scholar] [CrossRef]
  12. Silva, E.R.; Kotschoubey, B. Alteração supergênica do depósito de cobre-ouro do Salobo, Serra dos Carajás-PA—Ênfase no comportamento do cobre. Rev. Bras. Geociências 2000, 30, 623–630. [Google Scholar] [CrossRef]
  13. Ildefonse, P.; Manceau, A.; Prost, D.; Toledo-Groke, M.C. Hydroxy-Cu-vermiculite formed by the weathering of Fe-biotites at Salobo, Carajás, Brazil. Clays Clay Miner. 1986, 3, 338–345. [Google Scholar] [CrossRef]
  14. Scott, K.M.; Ashley, P.M.; Lawie, D.C. The geochemistry, mineralogy and maturity of gossans derived from volcanogenic Zn–Pb–Cu deposits of the eastern Lachlan Fold Belt, NSW, Australia. J. Geochem. Explor. 2001, 72, 169–191. [Google Scholar] [CrossRef]
  15. Taylor, R. Gossans and Leached Cappings Field Assessment, 1st ed.; Springer: Townsville, Australia, 2011. [Google Scholar]
  16. Tornos, F.; Velasco, F.; Slack, J.F.; Delgado, A.; Gomez-Miguelez, M.G.; Escobar, J.M.; Gomez, C. The high-grade Las Cruces copper deposit, Spain: A product of secondary enrichment in an evolving basin. Miner. Depos. 2016, 52, 1–34. [Google Scholar] [CrossRef]
  17. Monteiro, H.S.; Vasconcelos, P.M.P.; Farley, K.A.; Lopes, C.A.M. Age and evolution of diachronous erosion surfaces in the Amazon: Combining (U-Th)/He and cosmogenic 3He records. Geochim. Cosmochim. Acta 2018, 229, 162–183. [Google Scholar] [CrossRef]
  18. Grainger, C.J.; Groves, D.I.; Tallarico, F.H.B.; Fletcher, I.R. Metallogenesis of the Carajás Mineral Province, Southern Amazon Craton, Brazil: Varying styles of Archean through Paleoproterozoic to Neoproterozoic base- and precious-metal mineralisation. Ore Geol. Rev. 2008, 33, 451–489. [Google Scholar] [CrossRef]
  19. Torresi, I.; Xavier, R.P.; Bortholoto, D.F.A.; Monteiro, L.V.S. Hydrothermal alteration, fluid inclusions and stable isotope systematics of the Alvo 118 iron oxide–copper–gold deposit, Carajás Mineral Province (Brazil): Implications for ore genesis. Miner. Depos. 2012, 47, 299–323. [Google Scholar] [CrossRef]
  20. Docegeo. Alvo 118 Internal Report; Departamento Nacional de Produção Mineral: Rio de Janeiro, Brazil, 1991.
  21. Schutesky, M.E.; Oliveira, C.G. From the roots to the roof: An integrated model for the Neoarchean Carajás IOCG System, Brazil. Ore Geol. Rev. 2020, 129, 103833. [Google Scholar] [CrossRef]
  22. Santiago, E.S.B.; Xavier, R.P.; Hagemann, S.G.; Monteiro, L.V.S.; Cliff, J. Multiple sulfur isotopes constraints on origin and evolution of the Neoarchean and Paleoproterozoic Cu-Au systems from the Carajás Domain, Amazonian Craton, Brazil. Ore Geol. Rev. 2021, 29, 103872. [Google Scholar] [CrossRef]
  23. Rigon, J.C.; Munaro, P.; Santos, L.A.; Nascimento, J.A.S.; Barreira, C.F. Alvo 118 copper–gold deposit—Geology and mineralization, Serra dos Carajás, Pará, Brazil. In Proceedings of the 31st International Geological Congress, Rio de Janeiro, Brazil, 6–17 August 2000. [Google Scholar]
  24. Vasquez, L.V.; Rosa-Costa, L.R.; Silva, C.G.; Ricci, P.F.; Barbosa, J.O.; Klein, E.L.; Lopes, E.S.; Macambira, E.B.; Chaves, C.L.; Carvalho, J.M.; et al. Geologia e Recursos Minerais do Estado do Pará: Sistema de Informações Geográficas—SIG: Texto Explicativo dos Mapas Geológico e Tectônico e de Recursos Minerais do Estado do Pará. Escala 1:1,000,000; CPRM: Belém, Brazil, 2008. [Google Scholar]
  25. Albuquerque, M.A.C.; Andrade, P.J.M.B.; Maurity, C.; Kwitko, R. Geologia e Características das Mineralizações Cupríferas do Depósito Alvo 118 Província Mineral de Carajás, Pará, Brasil. In Proceedings of the VII Simpósio de Geologia da Amazônia, Belém, Brazil, 4–9 November 2001. [Google Scholar]
  26. Toledo-Groke, M.C.M.; Prost, D.; Ildefonse, P.; Melfi, A.J.; Delvigne, J.; Parisot, J.C. Alteração dos minerais na zona supérgena da formação cuprífera do Salobo 3A (Serra dos Carajás)-Localização do cobre nos produtos secundários. Rev. Bras. Geociências 1985, 15, 293–299. [Google Scholar] [CrossRef]
  27. Mano, E.S.; Caner, L.; Petit, S.; Chaves, A.P. Mineralogical characterization of copper lateritic ore from the Furnas deposit—Carajás, Brazil. Int. Eng. J. 2020, 73, 329–335. [Google Scholar] [CrossRef]
  28. Moeller, K.; Schoenberg, R.; Grenne, T.; Thorseth, I.H.; Drost, K.; Pedersen, R.B. Comparison of iron isotope variations in modern and Ordovician siliceous Fe oxyhydroxide deposits. Geochim. Cosmochim. Acta 2014, 126, 422–440. [Google Scholar] [CrossRef]
  29. Craddock, P.R.; Dauphas, N. Iron Isotopic Compositions of Geological Reference Materials and Chondrites. Geostand. Geoanal. Res. 2014, 35, 101–123. [Google Scholar] [CrossRef]
  30. Borrok, D.M.; Wanty, R.B.; Ridley, W.I.; Wolf, R.; Lamothe, P.J.; Adams, M. Separation of copper, iron, and zinc from complex aqueous solutions for isotopic measurement. Chem. Geol. 2007, 242, 400–414. [Google Scholar] [CrossRef]
  31. Moeller, K.; Schoenberg, R.; Pedersen, R.B.; Weiss, D.; Dong, S. Calibration of the new certified reference materials ERM-AE633 and ERM-AE647 for copper and IRMM-3702 for zinc isotope amount ratio determinations. Geostand. Geoanal. Res. 2012, 36, 177–199. [Google Scholar] [CrossRef]
  32. Santos, P.H.S.; Costa, M.L. Mineralogical and textural evolution of the Alvo 118 copper-bearing gossan: Implications for supergene metallogenesis in Carajás Mineral Province, Brazil. J. S. Am. Earth Sci. 2023, 121, 104108. [Google Scholar] [CrossRef]
  33. Rudnick, R.L.; Gao, S. The Composition of the Continental Crust. In Treatise on Geochemistry; Holland, H.D., Turekian, K.K., Eds.; Elsevier: Oxford, UK, 2003; Volume 3, pp. 1–64. [Google Scholar] [CrossRef]
  34. Loftus-Hills, G.; Solomon, M. Cobalt, nickel and selenium in sulphides as indicators of ore genesis. Miner. Depos. 1967, 2, 228–242. [Google Scholar] [CrossRef]
  35. Deady, E.; Moon, C.; Moore, K.; Goodenough, K.M.; Shail, R.K. Bismuth: Economic geology and value chains. Ore Geol. Rev. 2022, 143, 104722. [Google Scholar] [CrossRef]
  36. Alexandre, P.; Kyser, K.; Layton-Matthews, D.; Joy, B.; Uvarova, Y. Chemical Compositions of Natural Uraninite. Can. Mineral. 2015, 53, 595–622. [Google Scholar] [CrossRef]
  37. Nickel, E.H. Gossan mineralogy viewed in the context of solution chemistry. In Pathfinder and Multi-element Geochemistry in Mineral Exploration: A Seminar Organized by CSIRO and the Department of Geology, University of Western Australia, in Co-Operation with the Extension Service; Glover, J.E., Smith, R.E., Eds.; University of Western Australia: Perth, Australia, 1979. [Google Scholar]
  38. Plyusnin, A.M.; Pogrelnyak, Y.F.; Mironov, A.; Zhmodik, S.M. The behavior of gold in the oxidation of gold-bearing sulfides. Geochem. Int. 1981, 18, 116–123. [Google Scholar]
  39. Andrew, R.L. The geochemistry of selected base-metal gossans, southern Africa. J. Geochem. Explor. 1984, 22, 161–192. [Google Scholar] [CrossRef]
  40. Coughlin, B.R.; Stone, A.T. Nonreversible Adsorption of Divalent Metal Ions (MnII, CoII, NiII, CuII, and PbII) onto Goethite: Effects of Acidification, FeII Addition, and Picolinic Acid Addition. Environ. Sci. Technol. 1995, 29, 2445–2455. [Google Scholar] [CrossRef] [PubMed]
  41. Swedlund, P.J.; Webster, J.G.; Miskelly, G.M. Goethite adsorption of Cu(II), Pb(II), Cd(II), and Zn(II) in the presence of sulfate: Properties of the ternary complex. Geochim. Cosmochim. Acta 2009, 73, 1548–1562. [Google Scholar] [CrossRef]
  42. Smith, K.S. Metal sorption on mineral surfaces: An overview with examples relating to mineral deposits. In The Environmental Geochemistry of Mineral Deposits: Part A: Processes, Techniques, and Health Issues Part B: Case Studies and Research Topics; Vol 6A. Reviews in Economic Geology, Society of Economic Geologists; Plumlee, G.S., Logsdon, M.S., Eds.; Society of Economic Geologists: Littleton, CO, USA, 1999; pp. 161–182. [Google Scholar] [CrossRef]
  43. Cornell, R.M.; Schwertmann, U. The Iron Oxides: Structure, Properties Reactions Occurrence and Uses; VCH Verlagsgeseiischaft mbH: Weinheim, Germany; New York, NY, USA, 2003; 573p. [Google Scholar]
  44. Liu, H.; Chen, T.; Frost, R.L. An overview of the role of goethite surfaces in the environment. Chemosphere 2014, 103, 1–11. [Google Scholar] [CrossRef]
  45. Fralick, P.W.; Kronberg, B.I. Geochemical discrimination of clastic sedimentary rock sources. Sediment. Geol. 1997, 113, 111–124. [Google Scholar] [CrossRef]
  46. Harrison, T.M.; Aikman, A.; Holden, P.; Walker, A.M.; McFarlane, C.; Rubatto, D.; Watson, E.B. Testing the Ti-in-zircon thermometer. In Proceedings of the AGU Fall Meeting Abstracts 2005, San Francisco, CA, USA, 5–9 December 2005; Volume 86, p. V41F-1540. [Google Scholar]
  47. Fu, B.; Page, F.Z.; Cavosie, A.J.; Fournelle, J.; Kita, N.T.; Lackey, J.S.; Wilde, S.A.; Valley, J.W. Ti-in-zircon thermometry: Applications and limitations. Contrib. Mineral. Petrol. 2008, 156, 197–215. [Google Scholar] [CrossRef]
  48. Martínez, M.; Escobar, M.; Morante, F.; Márquez, G.; Lorenzoa, E.; Álvarez, A. Ti/Zr ratio as a geochemical tool for the correlation of weathered coals from geological formations in two Latin American sedimentary basins. Energy Sources 2016, 38, 3542–3548. [Google Scholar] [CrossRef]
  49. Evensen, N.M.; Hamilton, P.J.; O’Nions, R.K. Rare-earth abundances in chondritic meteorites. Geochim. Cosmochim. Acta 1978, 42, 1199–1212. [Google Scholar] [CrossRef]
  50. Xavier, R.P.; Wiedenbeck, M.; Trumbell, R.B.; Dreher, A.M.; Monteiro, L.V.S.; Rhede, D.; Araújo, C.E.; Torresi, I. Tourmaline B-isotopes fingerprint marine evaporites as the source of high-salinity ore fluids in iron-oxide-copper-gold deposits, Carajás Mineral Province (Brazil). Geology 2008, 36, 743–746. [Google Scholar] [CrossRef]
  51. Putter, T.; Mees, F.; Decrée, S.; Dewaele, S. Malachite, an indicator of major Pliocene Cu remobilization in karstic environment (Katanga, Democratic Republic of Congo). Ore Geol. Rev. 2010, 38, 90–100. [Google Scholar] [CrossRef]
  52. Dutrizac, J.E.; Soriano, C. Behaviour of the rare earths during goethite (α-FeOOH) precipitation from sulphate-based solutions. Hydrometallurgy 2018, 176, 87–96. [Google Scholar] [CrossRef]
  53. Mondillo, N.; Balassone, G.; Boni, M.; Chelle-Michou, C.; Cretella, S.; Mormone, A.; Putzolu, F.; Santoro, L.; Scognamiglio, G.; Tarallo, M. Rare Earth Elements (REE) in Al- and Fe-(oxy)-hydroxides in Bauxites of provence and Languedoc (Southern France): Implications for the Potential Recovery of REE as By-products of Bauxite Mining. Minerals 2019, 9, 504. [Google Scholar] [CrossRef]
  54. Graham, S.; Pearson, N.; Jackson, S.; Griffin, W.; O’Reilly, S.Y. Tracing Cu and Fe from source to porphyry: In situ determination of Cu and Fe isotope ratios in sulfides from the Grasberg Cu–Au deposit. Chem. Geol. 2004, 207, 147–169. [Google Scholar] [CrossRef]
  55. Maréchal, C.N.; Télouk, P.; Albarède, F. Precise analysis of copper and zinc isotopic compositions by plasma-source mass spectrometry. Chem. Geol. 1999, 156, 251–273. [Google Scholar] [CrossRef]
  56. Zhu, X.K.; O’Nions, R.K.; Guo, Y.; Belshaw, N.S.; Rickard, D. Determination of natural Cu-isotope variation by plasma-source mass spectrometry: Implications for use as geochemical tracers. Chem. Geol. 2000, 163, 139–149. [Google Scholar] [CrossRef]
  57. Fernandez, A.; Borrok, D.M. Fractionation of Cu, Fe, and Zn isotopes during the oxidative weathering of sulfide-rich rocks. Chem. Geol. 2009, 264, 1–12. [Google Scholar] [CrossRef]
  58. Mathur, R.; Ruiz, J.; Titley, S.; Liermann, L.; Buss, H.; Brantley, S. Cu isotopic fractionation in the supergene environment with and without bacteria. Geochim. Cosmochim. Acta 2005, 69, 5233–5246. [Google Scholar] [CrossRef]
  59. Kimball, B.E.; Mathur, R.; Dohnalkova, A.C.; Wall, A.J.; Runkel, R.L.; Brantley, S.L. Copper isotope fractionation in acid mine drainage. Geochim. Cosmochim. Acta 2009, 73, 1247–1263. [Google Scholar] [CrossRef]
  60. Kříbek, B.; Zachariáš, J.; Knésl, I.; Míková, J.; Mihaljevič, M.; Veselovský, F.; Bamba, O. Geochemistry, mineralogy, and isotope composition of Pb, Zn, and Cu in primary ores, gossan and barren ferruginous crust from the Perkoa base metal deposit, Burkina Faso. J. Geochem. Explor. 2016, 168, 49–64. [Google Scholar] [CrossRef]
  61. Ehrlich, S.; Butler, I.; Halicz, L.; Rickard, D.; Oldroyd, A.; Matthews, A. Experimental study of the copper isotope fractionation between aqueous Cu(II) and covellite, CuS. Chem. Geol. 2004, 209, 259–269. [Google Scholar] [CrossRef]
  62. Borrok, D.M.; Nimick, D.A.; Wanty, R.B.; Ridley, W.I. Isotopic variations of dissolved copper and zinc in stream waters affected by historical mining. Geochim. Cosmochim. Acta 2008, 72, 329–344. [Google Scholar] [CrossRef]
  63. Maréchal, C.N.; Sheppard, S.M.F. Isotopic fractionation of Cu and Zn between chloride and nitrate solutions and malachite or smithsonite at 30 degrees and 50 degrees C. Geoch. Cosmochim. Acta 2002, 66, A484. [Google Scholar]
  64. Albarede, F. The Stable Isotope Geochemistry of Copper and Zinc. Rev. Mineral. Geochem. 2004, 55, 409–427. [Google Scholar] [CrossRef]
  65. Plumhoff, A.M.; Mathur, R.; Milovský, R.; Majzlan, J. Fractionation of the copper, oxygen and hydrogen isotopes between malachite and aqueous phase. Geochim. Cosmochim. Acta 2021, 300, 246–257. [Google Scholar] [CrossRef]
  66. Mason, T.F.D.; Weiss, D.J.; Chapman, J.B.; Wilkinson, J.J.; Tessalina, S.G.; Spiro, B.; Horstwood, M.S.A.; Spratt, J.; Coles, B.J. Zn and Cu isotopic variability in the Alexandrinka volcanic-hosted massive sulphide (VHMS) ore deposit, Urals, Russia. Chem. Geol. 2005, 221, 170–187. [Google Scholar] [CrossRef]
  67. Mathur, R.; Dendas, M.; Titley, S.; Phillips, A. Patterns in the Copper Isotope Composition of Minerals in Porphyry Copper Deposits in Southwestern United States. Econ. Geol. 2010, 105, 1457–1467. [Google Scholar] [CrossRef]
  68. Mathur, R.; Jin, L.; Prush, V.; Paul, J.; Ebersole, C.; Fornadel, A.; Williams, J.Z.; Brantley, S. Cu isotopes and concentrations during weathering of black shale of the Marcellus Formation, Huntingdon County, Pennsylvania (USA). Chem. Geol. 2012, 304–305, 175–184. [Google Scholar] [CrossRef]
  69. Rouxel, O.; Dobbek, N.; Ludden, J.; Fouquet, Y. Iron isotope fractionation during oceanic crust alteration. Chem. Geol. 2003, 202, 155–182. [Google Scholar] [CrossRef]
  70. Cheng, Y.; Mao, J.; Zhu, X.; Liu, Y.W. Iron isotope fractionation during supergene weathering process and its application to constrain ore genesis in Gaosong deposit, Gejiu district, SW China. Gondwana Res. 2015, 27, 1283–1291. [Google Scholar] [CrossRef]
  71. Johnson, C.M.; Skulan, J.L.; Beard, B.L.; Sun, H.; Nealson, K.H.; Braterman, P.S. Isotopic fractionation between Fe(III) and Fe(II) in aqueous solutions. Earth Planet. Sci. Lett. 2002, 195, 141–153. [Google Scholar] [CrossRef]
  72. Welch, S.A.; Beard, B.L.; Johnson, C.M.; Braterman, P.S. Kinetic and equilibrium Fe isotope fractionation between aqueous Fe(II) and Fe(III). Geochim. Cosmochim. Acta 2003, 67, 4231–4250. [Google Scholar] [CrossRef]
  73. Butler, I.B.; Archer, C.; Vance, D.; Oldroyd, A.; Rickard, D. Fe isotope fractionation on FeS formation in ambient aqueous solution. Earth Planet. Sci. Lett. 2005, 236, 430–442. [Google Scholar] [CrossRef]
  74. Bullen, T.D.; White, A.F.; Childs, C.W.; Vivit, D.V.; Schulz, M.S. Demonstration of significant abiotic iron isotope fractionation in nature. Geology 2001, 29, 699. [Google Scholar] [CrossRef]
  75. Icopini, G.A.; Anbar, A.D.; Ruebush, S.S.; Tien, M.; Brantley, S.L. Iron isotope fractionation during microbial reduction of iron: The importance of adsorption. Geology 2004, 32, 205. [Google Scholar] [CrossRef]
  76. Fekiacova, Z.; Pichat, S.; Cornu, S.; Balesdent, J. Inferences from the vertical distribution of Fe isotopic compositions on pedogenetic processes in soils. Geoderma 2013, 209–210, 110–118. [Google Scholar] [CrossRef]
  77. Demir, Y.; Uysal, I.; Sadiklar, M.B.; Sipahi, F. Mineralogy, mineral chemistry, and fluid inclusion investigation of Kostere hydrothermal vein-type deposit (Gumushane, NE-Turkey). Neues Jahrb. Mineral.-Abh. 2008, 185, 215–232. [Google Scholar] [CrossRef]
  78. Helmy, H.M.; Shalaby, I.M.; Rahman, H.B.A. Large-scale metal zoning in a late-Precambrian skarn-type mineralization, Wadi Kid, SE Sinai, Egypt. J. Afr. Earth Sci. 2014, 90, 77–86. [Google Scholar] [CrossRef]
  79. Wang, G.; Wang, Z.; Shi, R.; Zhang, Y.; Wang, K. Mineralogy and isotope geochemical characteristics for Xiaozhen copper deposit, Langao County, Shaanxi Province and their constraint on genesis of the deposit. Geosci. J. 2014, 19, 281–294. [Google Scholar] [CrossRef]
  80. Sadati, S.N.; Yazdi, M.; Mao, J.; Behzadi, M.; Adabi, M.H.; Lingang, X.; Zhenyu, C.; Mokhtari, M.A.A. Sulfide mineral chemistry investigation of sediment-hosted stratiform copper deposits, Nahand-Ivand area, NW Iran. Ore Geol. Rev. 2016, 72, 760–776. [Google Scholar] [CrossRef]
  81. George, L.L.; Cook, N.J.; Crowe, B.B.P.; Ciobanu, C.L. Trace elements in hydrothermal chalcopyrite. Mineral. Mag. 2018, 82, 59–88. [Google Scholar] [CrossRef]
  82. Rose, W.R.; Hawkes, H.E.; Webb, J.S. Geochemistry in Mineral Exploration; Academic Press: Cambridge, MA, USA, 1979; 657p. [Google Scholar]
  83. Fitzpatrick, R.W.; Schwertmann, U. Al-substituted goethite-An indicator of pedogenic and other weathering environments in South Africa. Geoderma 1982, 27, 335–347. [Google Scholar] [CrossRef]
  84. Thornber, M.R. Supergene alteration of sulfides, distribution of elements during gossan forming process. Chem. Geol. 1985, 53, 279–301. [Google Scholar] [CrossRef]
  85. Carlson, L. Aluminum substitution in goethite in Lake Ore. Bull. Geol. Soc. Finl. 1995, 67, 19–28. [Google Scholar] [CrossRef]
  86. Thornber, M.R.; Taylor, G.F. The Mechanisms of Sulphide Oxidation and Gossan Formation; Elsevier: Amsterdam, The Netherlands, 1992; pp. 119–138. [Google Scholar] [CrossRef]
  87. Gilkes, R.J.; Little, I.P. Weathering of chlorite and some associations of trace elements in Permian phyllites in Southeast Queensland. Geoderma 1972, 7, 233–247. [Google Scholar] [CrossRef]
  88. Aspandiar, M.F.; Eggleton, R.A. Weathering of chlorite: II. Reactions and products in microsystems controlled by solution avenues. Clays Clay Miner. 2002, 50, 699–709. [Google Scholar] [CrossRef]
  89. Aspandiar, M.F.; Eggleton, R.A. Weathering of chlorite: I. Reactions and products in microsystems controlled by the primary mineral. Clays Clay Miner. 2002, 50, 685–698. [Google Scholar] [CrossRef]
Figure 2. Distribution of hypogene mineralization, gossan, and saprolite in the investigated drill holes, modified from [32] (A). Disseminated hypogene mineralization, comprising quartz veins with chalcopyrites crosscutting chlorite (B). Massive hypogene mineralization (C). Gossan: goethite (DF), malachite (G), cuprite (H), and libethenite (I) zones. Saprolite: coarse saprolite (J) and fine saprolite (KM).
Minerals 13 01441 g002
Figure 3. SEM images and respective EDS spectra of accessory minerals from hypogene mineralization, identified as chalcopyrites inclusions: Apatite, Apt (A); magnetite, Mag (B); petzite, Ptz (C); altaite, Alt (D); galena, Gal (E); uraninite, Urn (F); cassiterite, Cas (G); and stannite, Stn (H).
Minerals 13 01441 g003
Figure 4. Triangular distribution of SiO2–Al2O3–Fe2O3+MgO (wt.%) for selected samples from the hypogene mineralization, gossan, and saprolite (recalculated to 100%).
Minerals 13 01441 g004
Figure 5. Vertical distribution of CuO (A) and Au (B) along the A118-505 drill hole, crosscutting the hypogene mineralization, gossan, and saprolite.
Minerals 13 01441 g005
Figure 6. Scatter diagrams for selected elements from hypogene mineralization, CuO × U (A), CuO × Ag (B), CuO × Pb (C), CuO × Bi (D); and gossan, Fe2O3 × Mo (E), Fe2O3 × Sc (F), Fe2O3 × Sn (G), Fe2O3 × Y (H).
Minerals 13 01441 g006
Figure 7. Scatter diagrams for selected elements of the saprolite: (A) Fe2O3 × Ga; (B) Fe2O3 × Sc; (C) Fe2O3 × Sn; (D) Fe2O3 × V.
Minerals 13 01441 g007
Figure 8. Cluster diagram of whole-rock chemical composition data from drill hole A118-505, based on hypogene ore (A), gossan (B), and saprolite samples (C).
Minerals 13 01441 g008
Figure 9. Major and trace element distribution in hypogene ore (A), gossan (B), and saprolite (C), normalized to the chemical composition of the upper continental crust, UCC [33].
Minerals 13 01441 g009
Figure 10. Distribution pattern of REE in hypogene ore (A), gossan (B), and saprolite (C), normalized to the chondrites from [49].
Minerals 13 01441 g010
Figure 11. Cu contents vs. δ65Cu (A) and Fe contents vs. δ56Fe (B) in the hypogene mineralization, gossan, and saprolite.
Minerals 13 01441 g011
Table 1. Chemical compositions of selected samples from the hypogene mineralization, gossan, and saprolite, expressed in wt.% (major elements) and ppm (trace elements) and average composition of the upper continental crust, UCC [33].
Hypogene OreGossan ZoneSaprolite OreUCC
GoethiteMalachite Cuprite
Depth129 m127 m98 m70 m69 m68 m94 m15 m12 m10 m7 m5 m
SiO2 wt.%13.410.3536.87.113.7814.243.55548.855.35241.266.6
Al2O34.083.253.415.892.56105.1921.122.217.7517.7520.915.4
Fe2O325.835.449.871.40.776.0736.89.8513.056.3316.620.25.04
CaO1.931.670.080.060.030.040.070.030.030.070.040.023.59
MgO4.63.610.482.550.151.630.62.381.371.412.751.732.48
Na2O<0.01<0.01<0.01<0.01<0.01<0.01<0.010.030.070.190.020.043.27
K2O2.511.850.270.070.050.150.211.330.762.250.281.112.80
TiO20.130.110.240.160.090.290.411.121.141.91.011.010.64
MnO0.020.020.050.06<0.010.030.030.020.080.080.020.120.1
P2O51.281.11.481.28<0.010.290.830.120.270.470.110.190.15
CuO26.2929.790.910.94>5046.327.901.511.654.792.951.150.0035
LOI11.1511.78.4411.715.122.67.19.6112.8510.359.8611.5-
Total91.2098.86101.96101.22>72.54101.62102.65102.16102.31100.93103.4299.20-
C0.020.050.020.092.953.150.060.040.060.080.070.04-
S21.323.80.040.010.670.480.760.01<0.01<0.01<0.01<0.01-
Au ppm2.723.320.0470.4320.0830.3970.2770.0160.0120.0040.551<0.0010.0015
Ag16.222.33.60.843.826.83<0.5<0.50.70.50.50.053
Ba84.868.327.230.6123.540.464.549525337289.1206628
Co1351182255213222966452811317.3
Cr<10<10<1010<1010207070101008092
Cs2.351.911.270.420.020.062.591.10.770.581.821.114.9
Ga18.614.312.237.28.830.222.432.633.11533.937.617.5
Hf<0.1<0.10.70.30.10.91.66.27.49.276.15.3
Li30201010<1010101010<10101024
Mo<1<16057859<12<1<1<11.1
Nb13.89.94.86.51.97.76.48.611.316.813.812.812
Ni127139187905261333981821021212816547
Pb1610<218520113<26<2145<217
Pd0.002<0.0010.001<0.0010.0180.026<0.0010.0070.0120.0020.0060.0130.000522
Pt0.005<0.005<0.005<0.0050.0210.015<0.0050.0090.007<0.0050.005<0.0050.0005
Sn1982782113721294224631282.1
Sr5.98.84.81.50.93.74.224.110.929.810.14.9320
Ta1.31.10.20.50.30.50.20.70.91.30.90.60.9
Th7.113.041.532.090.732.764.4612.99.1716.117.912.9510.5
U7.554.95.42282.138.246.813.245.773.864.425.172.7
V524612222920941902551716022925697
W247522335510451.9
Y112062399.2253173.51065163.539.710417541.6142.521
Zr223824145070213280344276244193
As4.32.21.81.20.74.10.60.20.70.50.30.64.8
Bi0.840.31.3510.72.496.782.210.240.030.070.010.010.16
Hg0.0240.010.0160.0170.191.310.023<0.0050.0170.0080.0140.010.05
In4.425.290.1330.4620.1310.380.1270.040.0240.0220.0360.030.056
Rb30023437.96.31.86.244.510484.711566.677.184
Re0.0070.004<0.0010.0010.0020.0080.0010.001<0.0010.001<0.0010.0010.198
Sc981617168427413217443614.0
Se34.725.91.33.9101.530.315.90.20.32.31.22.70.09
Te18.818.90.651.22.790.732.410.050.050.050.050.07n. a.
Tl0.420.310.050.02<0.02<0.020.10.120.150.070.140.160.9
Zn42361177933412023110359891085167
La8.57.241311.1150.5774.916.438.215.440.631
Ce38.627.710.228.425.131814.615128.481.818.876.863
Pr8.75.821.183.483.1839.61.7216.73.299.683.1412.257.1
Nd67.542.96.217.115.61797.760.613.942.113.353.727
Sm47.328.12.547.315.2748.43.239.253.58.72.6111.454.7
Eu12.657.661.073.032.1116.251.362.71.5531.013.851.0
Gd12269.76.5318.7512.585.99.48.078.2513.34.0817.054
Tb2514.71.324.012.616.721.181.572.340.682.80.7
Dy176100.59.7928.719.3512315.656.5411.3516.354.4217.83.9
Ho3821.52.547.244.8831.74.051.312.824.221.053.90.83
Er111.562.48.4123.716.1510913.353.718.9812.553.3511.452.3
Tm18.3510.051.664.593.3521.52.490.671.522.070.591.950.30
Yb101.556.711.7532.325.2164.515.853.819.8211.53.6410.951.96
Lu14.458.052.215.964.9232.62.70.651.771.930.651.810.31
∑ REE790.05462.9869.4197.57151.311336.65101.1341.09113.12247.7472.72266.36125
(La/Lu)N0.060.090.190.230.230.480.2711.960.962.052.462.33-
Eu/Eu*0.480.500.760.750.760.760.700.940.850.850.940.84-
Table 2. 65Cu and δ56Fe values for samples from hypogene mineralization, gossan, and saprolite.
SampleCu Wt.%δ65CuSE *Fe Wt.%δ56FeSE *
Hypogene ore
505-0721.000.130.12318.040.360.10
505-0823.800.060.01324.760.450.05
Gossan ore
505-150.730.510.03434.83–0.560.05
484-3450.00−0.690.0010.541.000.11
484-3537.00−0.700.0054.250.570.06
Saprolite ore
505-391.320.080.0029.130.220.02
505-403.830.090.0264.430.140.06
505-420.920.070.0514.130.020.020
* Standard error.
Disclaimer/Publisher’s Note: The statements, opinions and data contained in all publications are solely those of the individual author(s) and contributor(s) and not of MDPI and/or the editor(s). MDPI and/or the editor(s) disclaim responsibility for any injury to people or property resulting from any ideas, methods, instructions or products referred to in the content.

