Article

Copper-Bearing Magnetite and Delafossite in Copper Smelter Slags

1
School of Chemical Engineering, The University of Adelaide, Adelaide, SA 5005, Australia
2
BHP Olympic Dam, Adelaide, SA 5000, Australia
3
Adelaide Microscopy, The University of Adelaide, Adelaide, SA 5005, Australia
*
Author to whom correspondence should be addressed.
Minerals 2023, 13(11), 1374; https://doi.org/10.3390/min13111374
Submission received: 28 September 2023 / Revised: 24 October 2023 / Accepted: 24 October 2023 / Published: 27 October 2023

Abstract

:
The cooling paths and kinetics in the system Cu-Fe-O are investigated by the empirical micro- and nanoscale analysis of slags from the flash furnace smelter at Olympic Dam, South Australia. We aim to constrain the exsolution mechanism of delafossite (Cu1+Fe3+O2) from a spinel solid solution (magnetite, Fe3O4) and understand why cuprospinel (CuFe2O4) is never observed, even though, as a species isostructural with magnetite, it might be expected to form. Flash furnace slags produced in the direct-to-blister copper smelter at Olympic Dam contain four Cu-bearing phases: Cu-bearing magnetite, delafossite, metallic copper, and cuprite. Delafossite coexists with magnetite as rims and lamellar exsolutions, as well as bladed aggregates, associated with cuprite within Si-rich glass. The empirical compositions of magnetite and rim delafossite are (Fe2+6.89Cu2+0.86Co0.13Mg0.15Si0.02)8.05 (Fe3+15.52Al0.41Ti0.01Cr0.01)15.95O32, and (Cu1+0.993Co0.002Mg0.002)0.997(Fe3+0.957Al0.027Ti0.005Si0.004)0.993O2, respectively. The measured Cu content of magnetite represents a combination of a solid solution (~6 mol.% cuprospinel endmember) and exsolved delafossite lamellae. Atomic-resolution high-angle annular dark field scanning transmission electron microscope (HAADF STEM) imaging shows epitaxial relationships between delafossite lamellae and host magnetite. Defects promoting the formation of copper nanoparticles towards the lamellae margins suggest rapid kinetics. Dynamic crystallization under locally induced stress in a supercooled system (glass) is recognized from misorientation lamellae in delafossite formed outside magnetite grains. The observations are concordant with crystallization during the cooling of molten slag from 1300 °C to <1080 °C. Melt separation through an immiscibility gap below the solvus in the system Cu-Fe-O is invoked to form the two distinct delafossite associations: (i) melt-1 from which magnetite + delafossite form; and (ii) melt-2 from which delafossite + cuprite form. Such a path also corroborates the published data explaining the lack of cuprospinel as a discrete phase in the slag. Delafossite rims form on magnetite at a peritectic temperature of ~1150 °C via a reaction between the magnetite and copper incorporated in the oxide/Si-rich melt. The confirmation of such a reaction is supported by the observed misfit orientation (~10°) between the rim delafossite and magnetite. HAADF STEM imaging represents a hitherto underutilized tool for understanding pyrometallurgical processes, and offers a direct visualization of phase relationships at the smallest scale that can complement both experimental approaches and theoretical studies based on thermodynamic modelling.

1. Introduction

Magnetite (FeFe2O4) and cuprospinel (CuFe2O4) are “2-3” type spinels (A2+B3+2O4) that crystallize in the space group Fd3m [1]. However, whereas magnetite is very common, cuprospinel is known only from three natural occurrences. The type locality is oxidized dumps of the Consolidated Rumbler Mines Limited, near Baie Verte, Newfoundland, Canada [2], where it is associated with hematite. Cuprospinel formation at Baie Verte is unusual in that it was initiated by the spontaneous ignition of Cu-Zn ores. The two other occurrences are from fumaroles of the Tolbachik Volcano, Kamchatka, Russia [3], and a low-sulfidation epithermal gold deposit in Iran [4].
Two crystal structures were determined for synthetic CuFe2O4, one with cubic symmetry (Fd3m; [5,6]), and a second with tetragonal symmetry (space group I41/amd; [7]. An anthropogenic cuprospinel of composition (Cu2+0.85Zn0.09Fe2+0.06)(Fe3+1.87Al0.1Si0.03)O4 with cubic symmetry was identified from accretions deposited into a waste heat boiler under the flash smelting of copper concentrate [8]. We note the presence of Zn in the analyzed spinel. Pure cuprospinel was also obtained by reactions between magnetite and liquid Cu(OH)2 where Fe2+ was completely replaced by Cu2+ at high temperature (1000 °C) after two hours [9].
Cuprospinel is also known as a copper ferrite considering the higher oxidation state of Fe. A second cuproferrite phase is delafossite Cu1+Fe3+O2. This is known as two polymorphs: trigonal (R 3 ¯ m; [10] and hexagonal (P6_3/mmc; [11,12]). Delafossite is only rarely observed as a primary mineral but forms as a secondary phase near the base of the oxidized zone of copper deposits (http://www.webmineral.com/data, accessed on 20 September 2023).
Delafossite belongs to a family of A1+B3+O2 compounds that includes a variant with essential rare earths: LnCuO2+x (x up to 0.65; Ln = Y or La) [13]. The authors describe the structures as double layers of LnO2-Cu, ~5.6 Å in width that can be stacked in various polytypes, e.g., 3R LaCuO2 and 2H YCuO2. Such stacking sequences can accommodate excess oxygen in the Cu layers, leading to various superstructures, oxygen vacancies, and defects, as documented from high-resolution transmission electron microscopy (HR TEM) studies [13,14]. There is, in fact, a much larger number of ABO2 compounds related to delafossite if we consider other metals occupying the A and B sites in the structure (e.g., [15]). The variation in the chemistry and structures of compounds related to delafossite controls the electric properties and much research has been focused on their use as functional transparent optoelectric devices [15]. For example, the synthesis of CuAlO2 delafossite followed the accelerating technological interest in developing transparent conducting oxide (TCO) or transparent semiconducting oxide (TSO) materials [16].
Looking further into the stability and cationic nonstoichiometry of CuFeO2 as a prototype of the delafossite family, Shorne-Pinto et al. [17] have shown excess Cu according to the formula: CuFe1−γO2−δ; γ = 0.12; δ = 0.08. Such data was included as a distinct ‘delafossite’ field for the optimization of specific applications within existing diagrams for the system Cu-Fe-O [18]. The excess Cu in delafossite, giving the formula Cu1.07Fe0.93O2, was also determined in the study of Stefanova et al. [8].
The co-existence of a spinel solid-solution with delafossite in the system Cu-Fe-O was assessed thermodynamically [18,19]. Khvan et al. [19] assessed the solid solution between cuprospinel and magnetite at high temperature using a model with compound energy formalism and considering Cu1+ on octahedral sites in compounds of composition CuFe5O8. Low-temperature tetragonal CuFe2O4 and delafossite were modelled as stoichiometric phases. Shishin et al. [20] used the same compound energy formalism for the spinel solid solution but introduced vacancies for the octahedral sublattice: T(Cu2+,Fe2+, Fe3+) M[Cu2+, Fe2+, Fe3+, v]O4, T = tetrahedral; M = octahedral, v = vacancy.
In contrast to their restricted occurrence in the natural environment, Cu-bearing magnetite and delafossite are common co-existing phases in slags produced during copper smelting in flash furnaces (e.g., [21,22]).
There is, however, a knowledge gap in terms of understanding the stability and occurrence of cuprospinel as either a cubic or tetragonal phase, the extent of the solid solution with magnetite, and the possibility of a solid solution with delafossite. Flash furnace slags produced during copper smelting offer the possibility to address these questions, and are well-suited for integrated analysis at the micron- to nanoscales. In this contribution, we study the phase assemblages in slags from the Olympic Dam smelting facilities (South Australia) with the dual aims of: (i) defining the compositional range and relationships between Cu-bearing magnetite and delafossite; and (ii) interpreting the formation pathways for these phases during slag cooling. In turn, an in-depth sample characterization can assist the refinement of thermodynamic models for predicting the phase equilibria.

2. Background: Ore Processing

The Olympic Dam plant [23] is designed to produce high-purity cathode copper from a heterogeneous breccia-hosted sulfide ore using a fully integrated circuit. Initially, the ore undergoes comminution (P80 = 75 μm). The finely ground ore is then passed to a froth flotation circuit to selectively separate the sulfides (chalcocite, bornite, chalcopyrite, and pyrite) from Fe-oxides and other gangue minerals with an average recovery of 91%–95% Cu. The flotation concentrate is then anaerobically leached using dilute H2SO4 at 60–70 °C for 6 to 12 h. The primary purpose of concentrate leach is to reduce the fluorine concentration prior to smelting, but also to dissolve uranium for subsequent recovery. The leached copper concentrates (~85 wt% sulfide minerals and ~15 wt.% gangue minerals including largely pyrite, hematite, quartz, and muscovite) are dewatered using thickeners and filters, and combined with controlled ratios of silica flux and pumped into the smelting circuit.
Smelting follows a direct-to-blister Outokumpu approach, employing both a flash furnace and an electric furnace (Figure 1). The direct-to-blister smelting process offers significant energy, SO2 collection, and cost advantages over traditional two-stage processing [24].
Copper concentrates are fed, in slurry form, into the feed preparation thickener. The thickened concentrate is then pumped to batch filters to produce a filter cake. Within the flash furnace, the mixture undergoes a series of reactions at 1300 °C under air enriched in oxygen, leading to instantaneous combustion (residence time 1 s). This includes the production of SO2 off-gas through the oxidation of copper sulphides, alongside the formation of two immiscible melts: slag and blister. The blister layer, which contains ~99% copper, settles at the bottom of the chamber. The slag layer that accumulates above the blister layer comprises iron-oxides, silicates, and glasses, but is also rich in dissolved copper (20–25 wt.% Cu). This slag is directed, by manual tapping, to the electric furnace for the recovery of the remaining copper. In the electric furnace, coke is employed as a reducing agent (5 wt.% of the slag) at 1300 °C to produce blister copper (99.6% Cu). The resulting electric furnace slag, containing 2%–10% copper, is tapped into pots which are tipped onto the surface in an outside bay and cooled for several days. Cooled slag is then crushed and fed into a milling and slag flotation plant to recover the contained metallic copper. The slag flotation concentrate is blended with copper sulfide concentrate prior to being fed into the flash furnace. The slag flotation tailings are discarded into the tailings retention system. Blister copper from the two furnaces is tapped into one of two anode furnaces where sulfur and most of the residual oxygen are removed. Molten copper metal is then cast as anodes (purity approximately 99.6%). Further processing takes place in the on-site electrorefinery, where it is converted to A-grade cathode copper for the market.

3. Materials and Methods

Seven thin, polished sections (measuring 10 cm × 4 cm × 1 mm; Supplementary Materials Table S1) were prepared from three air-quenched slag slabs obtained from the upper region of a flash furnace operating at 1300 °C under oxidizing atmosphere (Figure 1). All instrumentation used is hosted at Adelaide Microscopy, The University of Adelaide.
Initial characterization involved the examination of these sections in reflected light using a Nikon Eclipse LV100 POL microscope. This approach aimed to delineate the textural attributes of distinct phases. Carbon-coated sections were examined using a FEI Quanta 450 scanning electron microscope (FEI, Hillsboro, OR, USA), equipped with a back-scattered electron (BSE) detector and an energy-dispersive X-ray spectrometer (EDS). This enabled a detailed investigation of textural properties and selection of specific regions of interest for subsequent nanoscale characterization. Automated Mineralogy mapping on a Hitachi SU3800 SEM (Hitachi, Japan) was undertaken to provide the concentrations of component phases in two thin sections. Elemental mapping of the sections was also performed using Bruker M4 Tornado PLUS Micro-X-ray fluorescence instrument (Bruker, Mannheim, Germany). Element maps were generated in the Bruker M4 software using X-ray tube settings of 50 kV/600 µA. Mapped areas were acquired with a pixel/step size of 15 um and dwell time of 20 ms.
Quantitative compositional data for phases of interest were obtained using a Cameca SXFive electron probe microanalyzer (Cameca, Gennevilliers Cedex, France), equipped with five tuneable wavelength-dispersive spectrometers. Analysis was performed using operating conditions of 15 kV, 20 nA, and a beam diameter of 2 µm. Twenty-four elements were analyzed. Standards and X-ray lines are: Ca (Kα, wollastonite), Ba (Lα, barite), Ti (Kα, synthetic TiO2), P (Kα, lanthanum phosphate), Si (Kα, wollastonite), Mg (Kα, NMNH-113312-44 olivine), Al (Kα, corundum), Fe (Kα, almandine garnet), Mn (Kα, rhodonite), Cr (Kα, Cr2O3), Ni (Kα, nickel olivine), Sn (Lα, cassiterite), Th (Mα, huttonite), La (Lα, lanthanum phosphate), Ce (Lα, cerium phosphate), Zr (Lα, NMNH-117288-3 zircon), U (Mα, UO2), Nb (Lα, niobium), Pb (Mα, K227), V (Kα, vanadium), Co (Kα, cobalt), Cu (Kα, chalcopyrite), Zn (Kα, willemite), and W (Kα, tungsten). Mean minimum limits of detection (in wt.%) are: CaO (0.013), BaO (0.031), TiO2 (0.016), P2O5 (0.022), SiO2 (0.025), MgO (0.023), Al2O3 (0.021), FeO (0.032), MnO (0.030), Cr2O3 (0.024), NiO (0.040), Sn O2 (0.025), Th O2 (0.066), La2O3 (0.033), Ce2O3 (0.034), ZrO2 (0.048), UO2 (0.048), Nb2O5 (0.031), PbO (0.055), V2O5 (0.027), CoO (0.024), Cu2O (0.045), ZnO (0.061), and WO3 (0.147). Matrix corrections of Armstrong-Love/Scott φ(ρz) and Henke MACs were used for data reduction. The instrument ran PeakSite v6.2 software for microscope operation and ‘Probe for EPMA’ software for all data acquisition and processing. Note that elements falling consistently below the respective minimum limit of detection are not included in the tables.
Eight thinned foils were prepared for nanoscale study on a FEI-Helios nanoLab Dual Focused Ion Beam and Scanning Electron Microscope (FIB-SEM) platform following procedures in Ciobanu et al. [26]. Each foil was analyzed employing high-angle annular dark field scanning transmission electron microscopy (HAADF STEM) imaging and energy-dispersive x-ray spectrometry (EDS)-STEM mapping using an ultra-high resolution, probe-corrected, FEI Titan Themis S/TEM operated at 200 kV. This instrument is equipped with an X-FEG Schottky source and Super-X EDS geometry. The Super-X EDS detector provides geometrically symmetric EDS detection with an effective solid angle of 0.8 sr. Probe correction delivered sub-Ångstrom spatial resolution and an inner collection angle greater than 50 mrad was used for HAADF imaging with a Fischione detector. Velox (v. 2.13.0.1138) software was used for image acquisition, including drift-corrected frame integration package (DCFI), and EDS data acquisition and processing. Indexing of diffraction patterns was conducted with WinWulff© (JCrystalSoft) and publicly available data from the American Mineralogist Crystal Structure Database (http://rruff.geo.arizona.edu/AMS/amcsd.php). Crystal structure models were generated in CrystalMaker® (v10.5.7) and image simulations using STEM for xHREMTM software (v4.1).

4. Results

4.1. Micron-Scale Characterization

The seven FF sections investigated show comparable phase assemblages and textures typified by a fine-scale groundmass comprising magnetite, delafossite, cuprite, SiO2, and glass with disseminations of copper (Figure 2a). There are, however, differences between the samples in terms of the abundance of large, up to cm-sized, voids and variable proportions of silica pockets/patches (Figure 2b). The latter are largely relicts of undigested flux material.
AM mapping (e.g., Figure 2a) of two sections shows the main phases and their modal mineralogy proportions (Supplementary Materials Table S2) with the following averages: 48.8 wt.% magnetite; 24 wt.% glass; 12.6 wt.% copper; 8 wt.% delafossite; 2.9 wt.% cuprite; 1 wt.% SiO2; and others (voids and unknown phases) 2.6 wt.%. There are two Si-bearing glasses, of which the interstitial glass (gl1) is formed early, co-existing with magnetite and delafossite, and contains ~40 wt.% SiO2. Glass 2 (gl2) is late, higher in SiO2 (~60 wt.%), and replaces the pre-existing magnetite.
The three main components are easy to identify in reflected light (Figure 3a,b). The glass occurs interstitial to fine-grained magnetite and as pockets with dense blades of delafossite. Copper occurs as blebs, a few to some tens of μm in size, ubiquitously distributed throughout the groundmass, occasionally coarser, up to several hundred μm across. Higher-resolution AM mapping of such areas shows similar proportions of the main components (Figure 3c), with the dominant phase being magnetite (48.1 wt.%). In detail, magnetite shows a narrow rim of delafossite only a few μm across (Figure 3d). This phase is only partially recognized on the AM maps (Figure 3e).
Rims of delafossite enclosing equigranular magnetite and thin blades of delafossite within interstitial glass are typical textures (Figure 4a). The coarser magnetite, up to hundreds of μm in size, shows more regular or patchy inclusions of glass, delafossite, and copper (Figure 4b,c). There is no magnetite in the glass pockets that host delafossite but copper and cuprite are both abundant (Figure 4d). In detail, the copper phases are attached along/or between delafossite needles (Figure 4e). Likewise, the same association (delafossite and other copper phases) fill the inner part of the inclusions of glass 2 within magnetite (Figure 4f). Both types of glasses are mottled with blebs of other phases containing copper and other elements (Figure 4f).
A further texture illustrative of the relationship between the two Fe-oxides is represented by the <111>magnetite lamellar networks of delafossite in magnetite along <111> or other parting directions (Figure 4g,h). Such networks are, however, relatively scarce, particularly in grains where marginal delafossite protrudes into magnetite (Figure 4h).

4.2. Composition

Magnetite contains Cu, Al, Co, Mg, and Ti as conspicuous minor elements, all of which display variations in their concentration from one grain to another or between samples (Table 1; Figure 5a–c). The mean calculated formula is (Fe2+6.89Cu2+0.86Co0.13Mg0.15Si0.02)8.05 (Fe3+15.52Al0.41Ti0.01Cr0.01)15.95O32. Binary plots (Figure 5a) show that Co concentrations increase with Mg but slightly decrease with higher Cu. There is little correlation between Cu and Al, except in sample FF21-B where the higher Al promotes increased Cu. Aluminum shows the widest range of concentration across the dataset (0.1–0.9 a.p.f.u., 32 oxygen atom basis) and the highest values in sample FF21-3B (0.5–0.9 a.p.f.u). A very weak inverse correlation is observed between Co and Cu. On a ternary Cu-Al-Co plot, the data for all samples except FF21-A (the highest in Al) show a linear variation between Al and Co relative to Cu (Figure 5b). The linear correlation between Co and Mg relative to Al is repeated on the ternary Al-Mg-Co plot (Figure 5c).
Delafossite compositions were measured from the rims around magnetite in the same samples. The mean calculated formula is (Cu1+0.993Co0.002Mg0.002)0.997(Fe3+0.958Al0.028Ti0.005Si0.003)0.993O2 (Table 2). On a ternary Al-Mg-Co plot, delafossite shows a linear cluster with a relative constant Co content but wider ranges of both Al and Mg (Figure 5d).
Around a third of analyses (56 out of 144) are obtained from seven profiles across magnetite grains in sample FF21-B (Figure 5e). An aggregate of such grains showing marginal delafossite was used for nanoscale characterization (see below). Data from the seven profiles form a tight cluster close to but slightly below the tie-line between magnetite and cuprospinel on the Cu vs. Fe3+/(Cu+Fe3+) binary plot (Figure 5f). This means that the total amount of Cu measured in magnetite (0.781–1.065 a.p.f.u.) is not fully attributable to a solid solution in the spinel structure. The distribution of Cu within the profiles shows that profile 4 has the highest Cu content, whereas profile 2 has the lowest (Figure 5g). Otherwise, most data show Cu > 0.858 a.p.f.u.

4.3. Nanoscale Characterization

Copper concentrations measured in magnetite along the seven EPMA profiles vary between 3.3 and 4.45 wt.% CuO (Figure 6a,b). We note that the presence of thin (sub-micron wide) lamellae of delafossite in magnetite correlates with an increased Cu content (e.g., profile 2). Those profiles with the highest Cu content (profiles 1, 2, and 4) were chosen for the extraction of material for nanoscale characterization. Although very rare, some magnetite grains show small areas with patchy Cu enrichment at the boundary to delafossite (Figure 6c,d). One foil for the nanoscale study (FF21-B foil #4) was obtained across such an area (Figure 6e).
The relationships between magnetite and delafossite, as well as the characteristics of bladed delafossite in glass, were assessed in foils extracted from sample FF21-A (Figure 7). Delafossite as rims around two magnetite grains joined together extends at a ~10 μm depth, after which they become separated by a sliver of glass (Figure 7a,b). Denser lamellae of delafossite occur at the tip of other inclusions in magnetite (coarser delafossite and glass; Figure 7c,d). Such lamellae extend to a depth of ~5 μm from the sample surface but terminate at the tip of a buried delafossite inclusion (Figure 7e). Bladed delafossite in glass was extracted from a field adjacent to the magnetite grains shown in Figure 7a, and from the boundary to a ~250 μm-sized grain of silica (Figure 7f–h).
The eight foils studied at the nano scale are shown in Figure 8. Marginal and bladed delafossite was characterized from the foils in sample FF21-A (Figure 8a–d), whereas lamellar delafossite in magnetite was studied from foils in sample FF21-B (Figure 8e–h), and in foil #2 from sample FF21-A (Figure 8b). We note the presence of sub-micron-scale monazite at the boundaries between individual delafossite grains within glass (Figure 8c). The glass, whether representing the host for delafossite or as inclusions in magnetite, is mottled with inclusions of various types (see below). Delafossite lamellae can form denser networks within magnetite (e.g., foil #3 sample FF21-B; Figure 8g) or occur around micron-sized inclusions of glass (Figure 8e). Marginal copper and copper-oxide are present outside the delafossite, forming rims on magnetite (Figure 8f).
Apart from delafossite, several other phases occur as nanoscale inclusions in magnetite (Figure 9). Of these, abundant silica nanoparticles (NPs) with a euhedral, rhombic morphology occur along trails (Figure 9a–d). High-resolution imaging (Figure 9c) indicates these are crystalline, even though they are beam-sensitive and difficult to assess in terms of specific SiO2 polymorphs. Cristobalite (see below) was identified from the large grain in FF21-A foil #7 (Figure 7g,h). The second most abundant inclusion type is glass (Figure 9e–h), which occurs as elongate lenses crosscut by copper (Figure 9e) or as blebs surrounded by delafossite lamellae (Figure 9f–h). Such glass is commonly mottled with copper NPs (Figure 9h), and less commonly with NPs of anhydrite and uraninite (Figure 9i). Filaments of monazite, up to 500 nm in width, are often attached to delafossite lamellae within glass (Figure 9j). EDS STEM spectra for SiO2, anhydrite, uraninite, and monazite are shown in Figure 9k.
Bladed delafossite (up to several hundred nm-wide) hosted by glass typically shows misorientation fabrics as sets of internal lamellae that are readily identifiable on BF STEM images (Figure 10a). Delafossite occurring as lamellae in magnetite displays a wide range of morphologies, variable thickness, and orientations (Figure 10b–j). Sets of <111> lamellae are identified in magnetite from sample FF21-A, foil #2 (Figure 10b). More common, however, are sets of parallel lamellae, 1 µm apart, and tens to a few nm wide, displaying acicular terminations (Figure 10c). Some lamellae show twists and buckling at edges, defects that are often associated with the presence of copper NPs (Figure 10d–f). The entrapment of thin delafossite platelets between lamellae with twisted terminations and acicular delafossite is observed (Figure 10g). Branching between lamellae of variable thicknesses is also observed along the <111> directions in magnetite (Figure 10h,i). For example, the side of a 50 nm-thick lamella is marked by needle-like, 2–3 nm-wide delafossite (Figure 10h,i). In detail, lattice distortion in magnetite is observed around the twists at the terminations of delafossite lamella (Figure 10j).
STEM EDS maps of delafossite as rims and lamellae in magnetite are shown in Figure 11 and Figure 12, respectively. Marginal delafossite is enriched in Ti and Zn but depleted in Co relative to magnetite (Figure 11a,b), concordant with EPMA data (Table 1 and Table 2; Supplementary Materials Table S3). Aluminum shows slight enrichment at the direct contact between the two minerals (profile in Figure 11a), but, otherwise, Al is always higher in magnetite relative to marginal delafossite (Figure 5c,d). STEM EDS maps of delafossite with bent lamellae show that these are, in contrast, clearly enriched in Al relative to the host magnetite (Figure 12a). Enrichment in Al, Zn, and Ti relative to the host magnetite is also observed in parallel sets of delafossite lamellae (Figure 12b). Higher-resolution maps of the branched and twisted delafossite in Figure 10g shows Al, Ti, Zn, and Mn enrichment relative to magnetite, whereas Mg is clearly depleted in delafossite (Figure 12c).
STEM EDS maps of bladed delafossite in glass are shown in Figure 13a. The maps for the delafossite with misorientation lamellae from Figure 10a do not depict any variation among major or minor elements (Figure 13a). Delafossite contains measurable Co, Ti, Mn, and Zn but only traces of Al, which is mostly incorporated within the Si-rich glass. The delafossite margins are marked by the presence of monazite, uraninite, and copper NPs (Figure 13b), indicating a close association between REE, U, and Cu with the crystallization of delafossite within glass.

4.4. Atomic-Resolution Imaging

The relationships between magnetite and delafossite lamellae were further characterized using atomic resolution imaging to better understand the mechanisms by which they were formed, and their relationship with copper NPs (Figure 14 and Figure 15).
HAADF STEM images of straight contacts between the two phases show a perfect alignment between them viewed on the [ 1 1 ¯ 0 ]Mag and [ 0 1 ¯ 1 ]Del zone axes, with a parallel orientation between the (111) planes in both magnetite and delafossite (Figure 14a). The identification of both magnetite and delafossite is confirmed by STEM simulations showing an excellent match with the images. On fast Fourier transform (FFT) patterns, the (111)*Del lattice vector coincides with (111)*Mag, whereas (100)*Del is offset from ( 11 1 ¯ )*Mag (Figure 14b). Separate FFT patterns for the zone axes in each mineral are shown for comparison. The trigonal structure of Pabst [10] was used for indexing and simulations of delafossite.
Another coherent fit between the two structures is observed on the [ 11 2 ¯ ] zone axis in both magnetite and delafossite (Figure 14c,d). As in the previous case, both lattices are aligned along the (111) planes. STEM simulations and FFT patterns from each mineral are shown for comparison. Such coherence between the lattices indicates epitaxial relationships during the growth of delafossite in magnetite and supports formation via exsolution; i.e., delafossite exsolves from Cu-bearing magnetite solid solution.
High-resolution EDS STEM maps show the distribution of Fe and Cu in the two minerals across their mutual boundary (Figure 14e).
Stepwise contacts are typical of delafossite lamellae edges, e.g., as observed between [ 1 1 ¯ 0 ]Mag and [ 0 1 ¯ 1 ]Del (Figure 15a,b). The steps along the boundaries can be marked by displacement defects affecting up to several atomic columns within delafossite (inset in Figure 15b). The defects also induce strain distortion in the magnetite lattice along the mutual boundary.
The highest distortion in magnetite coincides with the formation of discrete copper NPs within the cusps of twisted delafossite lamellae (Figure 15c). Copper NPs occur also in delafossite displaying lattice disorder (Figure 15d).
In FF21-A foil #2, swarms of copper NPs occur within highly distorted magnetite as a continuation of delafossite lamellae (Figure 15e). The crystallographic-controlled nucleation of such copper NPs is observed within magnetite (Figure 15f,g) and likely promoted during the final stages of slag cooling. The FFT pattern and image in Figure 15g confirm these are indeed native copper.
In contrast to the lamellae, marginal delafossite shows a misfit orientation with magnetite (Figure 16). Imaging the contact between [11 3 ¯ ]Del and magnetite close to [100] shows one set of coherent lattice planes (011)Del//(1 1 ¯ 0)Mag (Figure 16a). The FFT patterns in Figure 16b,c show [11 3 ¯ ]Del and magnetite after being tilted on the [100] zone axis. The ~10° angle between the pair of planes with misalignment to each other, i.e., (211)Del and (001)Mag, is shown in Figure 16a and in closer detail on high-resolution images (Figure 16d). The atomic columns along the (001) planes in magnetite comprising either octahedral or tetrahedral Fe are misaligned with the columns of Cu/Fe along the (211) planes in delafossite (Figure 16e).
A cubic variant of cristobalite (Figure 17) is identified from the large grain of silica at the contact with glass hosting delafossite (FF21-B foil#7). Smaller, newly formed silica grains along the contact between delafossite and glass have the same symmetry with the larger grain (Figure 17a,b). Two zone axes were imaged and the corresponding FFT patterns were indexed using the crystal structure of Barth [27] (Figure 17c,d). This silica variety, high cristobalite, has the symmetry of the space group P213 and is stable only in the temperature range 1460–1710 °C [26]. The atom-fill models for the Si lattice combined with simulations of images and electron diffraction confirm this identification (Figure 17e).

5. Discussion

5.1. Phase Associations: Exsolutions versus Solid Solution and Growth Mechanisms

The phase associations in the FF slag differ markedly from those studied in the EF slags [28,29]. Whereas magnetite, copper, and Si-rich glasses are present in both types of slags, delafossite formation is suppressed in the electric furnace where a silicate phase, fayalite (FeSiO4), is formed as one of the main components (42% [29]). Cuprite is a minor component in the FF slags (~3.6 wt.%) and occurs only as (sub)micron-sized inclusions in the blister copper from EF slags. The only silicate in the FF slag is SiO2, with a structure corresponding to high cristobalite (Figure 17). This phase is not entirely formed within the furnace but results from the heating of SiO2 flux that is preserved as undigested pockets observed in some samples (Figure 2b). A high oxygen partial pressure or a high copper oxide concentration in the slag are the conditions considered for the precipitation of delafossite [21]. Whereas such conditions control the formation of delafossite at high temperature in the furnace, in a geological environment, delafossite only forms at low temperature in the oxidation zone of primary Cu ores (http://www.webmineral.com/, accessed on 11 September 2023).
There are also differences in the composition of magnetite from the two types of slags. The EF magnetite is (Fe2+7.84Mg0.03Co0.09)7.96(Fe3+14.89Al0.99)15.88(Si0.08Ti0.07)0.15O32 [28] and FF magnetite is (Fe2+6.89Cu2+0.86Co0.13Mg0.15Si0.02)8.05 (Fe3+15.52Al0.41Ti0.01Cr0.01)15.95O32. The most significant change is the Cu content in the FF magnetite (~1 a.p.f.u.), whereas the other minor components are present in a comparable concentration, except Mg which is an order of magnitude higher in the FF slag. Silicon, although measured in both magnetite types, occurs as silician defects in the EF magnetite [28], whereas, in the FF magnetite, the measured Si concentration is likely attributable only to nanoscale inclusions of cristobalite and glass (Figure 9). Monazite and traces of uraninite are present in both types of slags.
The Cu content in FF magnetite is only partially attributable to the incorporation of this element in the crystal structure (solid solution). Exsolutions of delafossite contribute also to the measured Cu in magnetite. No direct correlation between the amount of measured Cu and delafossite is observed since the micron- to nanoscale study of a magnetite grain shows the highest Cu is from an area with the least lamellae (Figure 6a,b and Figure 8e). However, the nanoscale characterization shows a different partitioning of Al in the magnetite–delafossite pairs when formed from exsolution or as rims around the magnetite grains; i.e., the exsolution concentrates this element in delafossite rather than the host magnetite. This clearly infers the formation of delafossite from two different mechanisms (see below) and further constrains the exsolution process. This finding is in contrast with ideas that there is no solid solution between the two minerals [21], or the interpretation of the delafossite lamellae in magnetite as the result of a replacement [22].
The morphology of exsolution lamellae (Figure 10b–j and Figure 15) suggests fast growth kinetics leading to strain-induced lattice deformation in both magnetite and delafossite associated with defects along the lamellae boundaries, all of which promote the formation of Cu NPs. The observation of misorientation lamellae in delafossite formed in glass outside the magnetite (Figure 10a) is suggestive of dynamic crystallization under locally induced stress in a supercooled system (glass), which in turn controls dynamic crystallization.

5.2. Melt Crystallization

The available Fe-Cu-O diagrams [20] show the fields of phase stability which encompass the main components (magnetite, delafossite, copper, and cuprite) identified in our FF slag characterization. A significant part of the SiO2 phase derives from the quartz added as flux, with an additional 2–3 wt.% SiO2 from silicate minerals in the leached concentrates. The glass contains SiO2 from digested flux, ore quartz and muscovite. The Al and K contents measured in glass, along with Ca, Ba, REE, etc., are also inherited from the ore. No new solid silicate phases are crystallized during flash smelting. Thus, assuming the Si-rich glasses solidify independently and at lower temperatures than either magnetite and delafossite, the main Fe-Cu-oxide components, we can use the temperature (T) versus molar ratio Cu2O/(Cu2O + Fe3O4) diagram to discuss the formation of the phases and assemblages described here in a broadly qualitative way (Figure 18).
The FF slag composition was calculated from the AM data (Figure 2 and Figure 3; Supplementary Materials Table S2) plot between the composition of cuprospinel and delafossite at ~0.45 mol. ratio Cu2O/(Cu2O + Fe3O4) (Figure 18a). This composition is part of the initial melt without accounting for either blister copper-1, which is recovered from the FF melt (Figure 1), or the glasses and SiO2 making up ~25 wt.% of the slag.
Since magnetite would be solid at 1300 ⁰C on the diagram of Shishin et al. [20], we assume a drop in the solvus line (Figure 18a) to account for the effect of silicic components in the melt. This is concordant with the spinel solvus curve experimentally obtained in the system Cu-Fe-O-Si in equilibrium with metallic copper at a low Si concentration and at 1300 °C [30].
For simplicity, we also ignore the effect of PO2 and use the fields defined at PO2 = 10−5 atm [20]. Published studies of PO2 in flash furnace smelting indicate that PO2 could be in the range of 10−7 to 10−4.5 atm [24]. Although such a range of pressure parameters can affect the stability fields by as much as 180 °C (e.g., the tieline between spinel + Cu(liq) + liq. oxide and spinel + Cu(liq) + delafossite drops from 1145 °C at PO2 = 10−5 atm, to 980 °C at PO2 = 10−7 atm [20,24]), the geometry of the stability fields of interest are essentially preserved.
A straight down-temperature cooling path of the FF slag cannot explain the observed associations (Figure 4a,d,e): (i) the Cu-poor assemblage comprising 88.6 wt.% magnetite + 4.5 wt.% delafossite + 6.5 wt.% copper; and (ii) the Cu-rich assemblage: 49.6 wt.% delafossite + 37.1 wt.% copper + 13.3 wt.% cuprite (Figure 18b). The presence of a magnetite-free assemblage implies that the melt must have passed through an immiscibility point after magnetite nucleation but prior to delafossite formation (Figure 18a). The two paths of the crystallization process are illustrated in Figure 19.
The separation of the two liquids can be invoked if we consider an “oiling out” process, a phenomenon dependent upon the cooling rate, supersaturation, and nucleation rate during crystallization (e.g., [31]). Moreover, Coquerel [31] discussed how this kinetic phenomenon can occur spontaneously and trigger the formation of a submerged immiscibility gap in systems undergoing a transient metastable state. In our case, we suggest that the fast nucleation of magnetite induces supersaturation in the host Cu-oxide melt (melt-1) and leads to the formation of a second liquid phase (melt-2) as an emulsion within melt-1 (Figure 19).
The formation of delafossite as thin blades in both sub-systems occurs below 1150 °C, as shown schematically on Figure 19. The delafossite rims on magnetite observed only in the Cu-poor system may result from a peritectic reaction (point A1-1) between solid magnetite and Cu-bearing, liquid oxide (Figure 18a). Comparable textures are shown for Ni-Al alloys undergoing rapid solidification associated with significant liquid supercooling [32]. A TEM study of a peritectic reaction among Ni-Al alloys indicates that the Al and Ni lattices are rotated to one another at the interface to allow directional solidification [33]. The misfit between the marginal delafossite and magnetite could be considered evidence for an analogous growth mechanism of marginal delafossite (Figure 16).
Delafossite rims on magnetite are observed among the microstructures obtained in experiments targeting the ‘freeze-lining’ processes during the direct-to-blister flash smelting of copper [21]. In this case, incongruent melting at the peritectic temperature of delafossite with the molten slag is invoked via the reaction:
Fe3O4(s) + 1½ (Cu2O) + ¼O2(g) = 3CuFeO2(s)
The same delafossite rim on magnetite texture has also been interpreted as the result of a peritectic reaction between magnetite and the Cu component in the liquid in a study of slags produced by flash furnace at Huelva, Spain [22].
The last phase to crystalize is copper at ~1080 °C (point A1-2 on Figure 18a). This is the temperature at which the solidification of the slag in assemblage 1 is complete, with an overall molar Cu2O/(Cu2O + Fe3O4) ratio of ~0.2, although the solidification of the two glasses is not accounted for by the diagram used in Figure 18a. However, the solidification of glass 2 took place prior to the exsolution of delafossite from a magnetite solid solution since the delafossite lamellae show a radial distribution surrounding the glass inclusions in magnetite (Figure 9h).
Delafossite, followed by cuprite and copper, crystallizes from melt-2 along the trajectory defined by the A2-1 to A2-3 points on Figure 18a and schematically shown in Figure 19. The solidified assemblage 2 has a composition of the solidified slag at a ~0.86 molar ratio Cu2O/(Cu2O + Fe3O4). Both cuprospinel and delafossite are within the range of compositions between assemblage 1 and 2, but the above scenario involving melt immiscibility explains why no cuprospinel can be formed even from a slag that is rich in Cu (~0.45 molar ratio Cu2O/(Cu2O + Fe3O4)), consistent with the thermodynamic modeling of Shishin et al. [20].

6. Summary and Implications

The present work shows the following points:
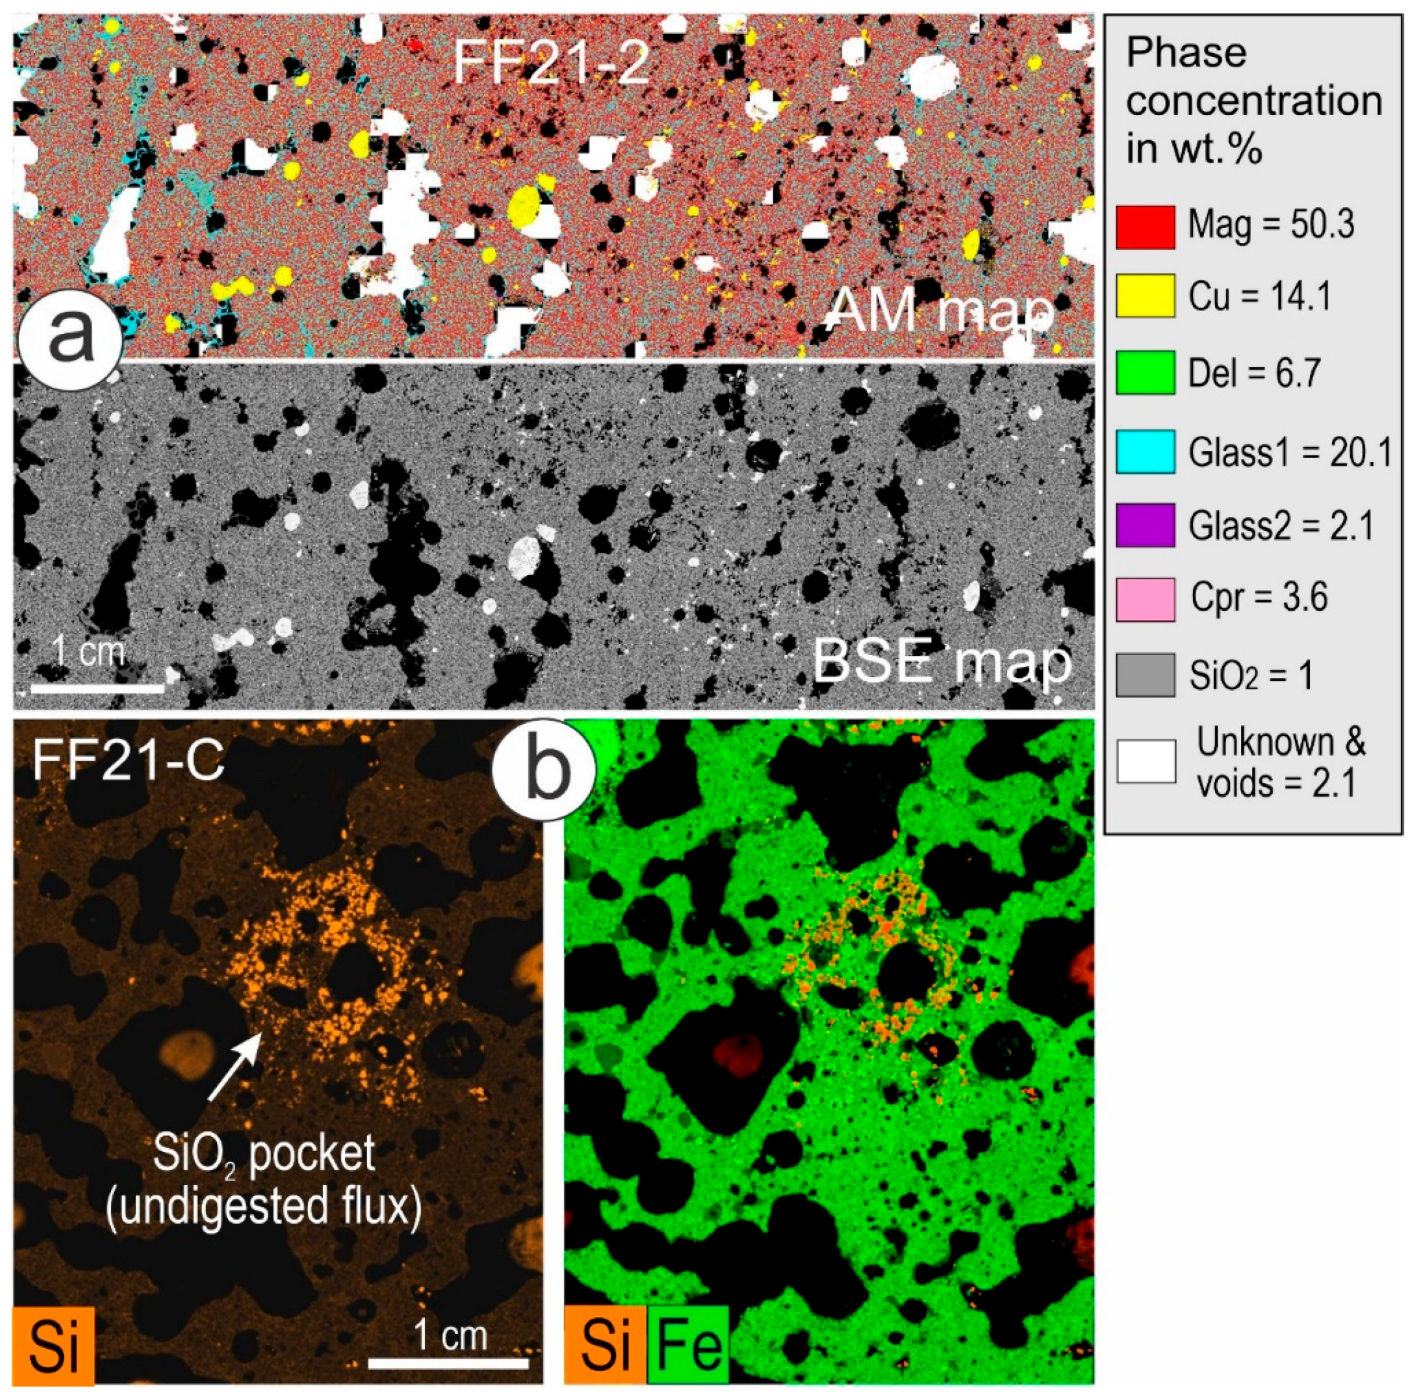
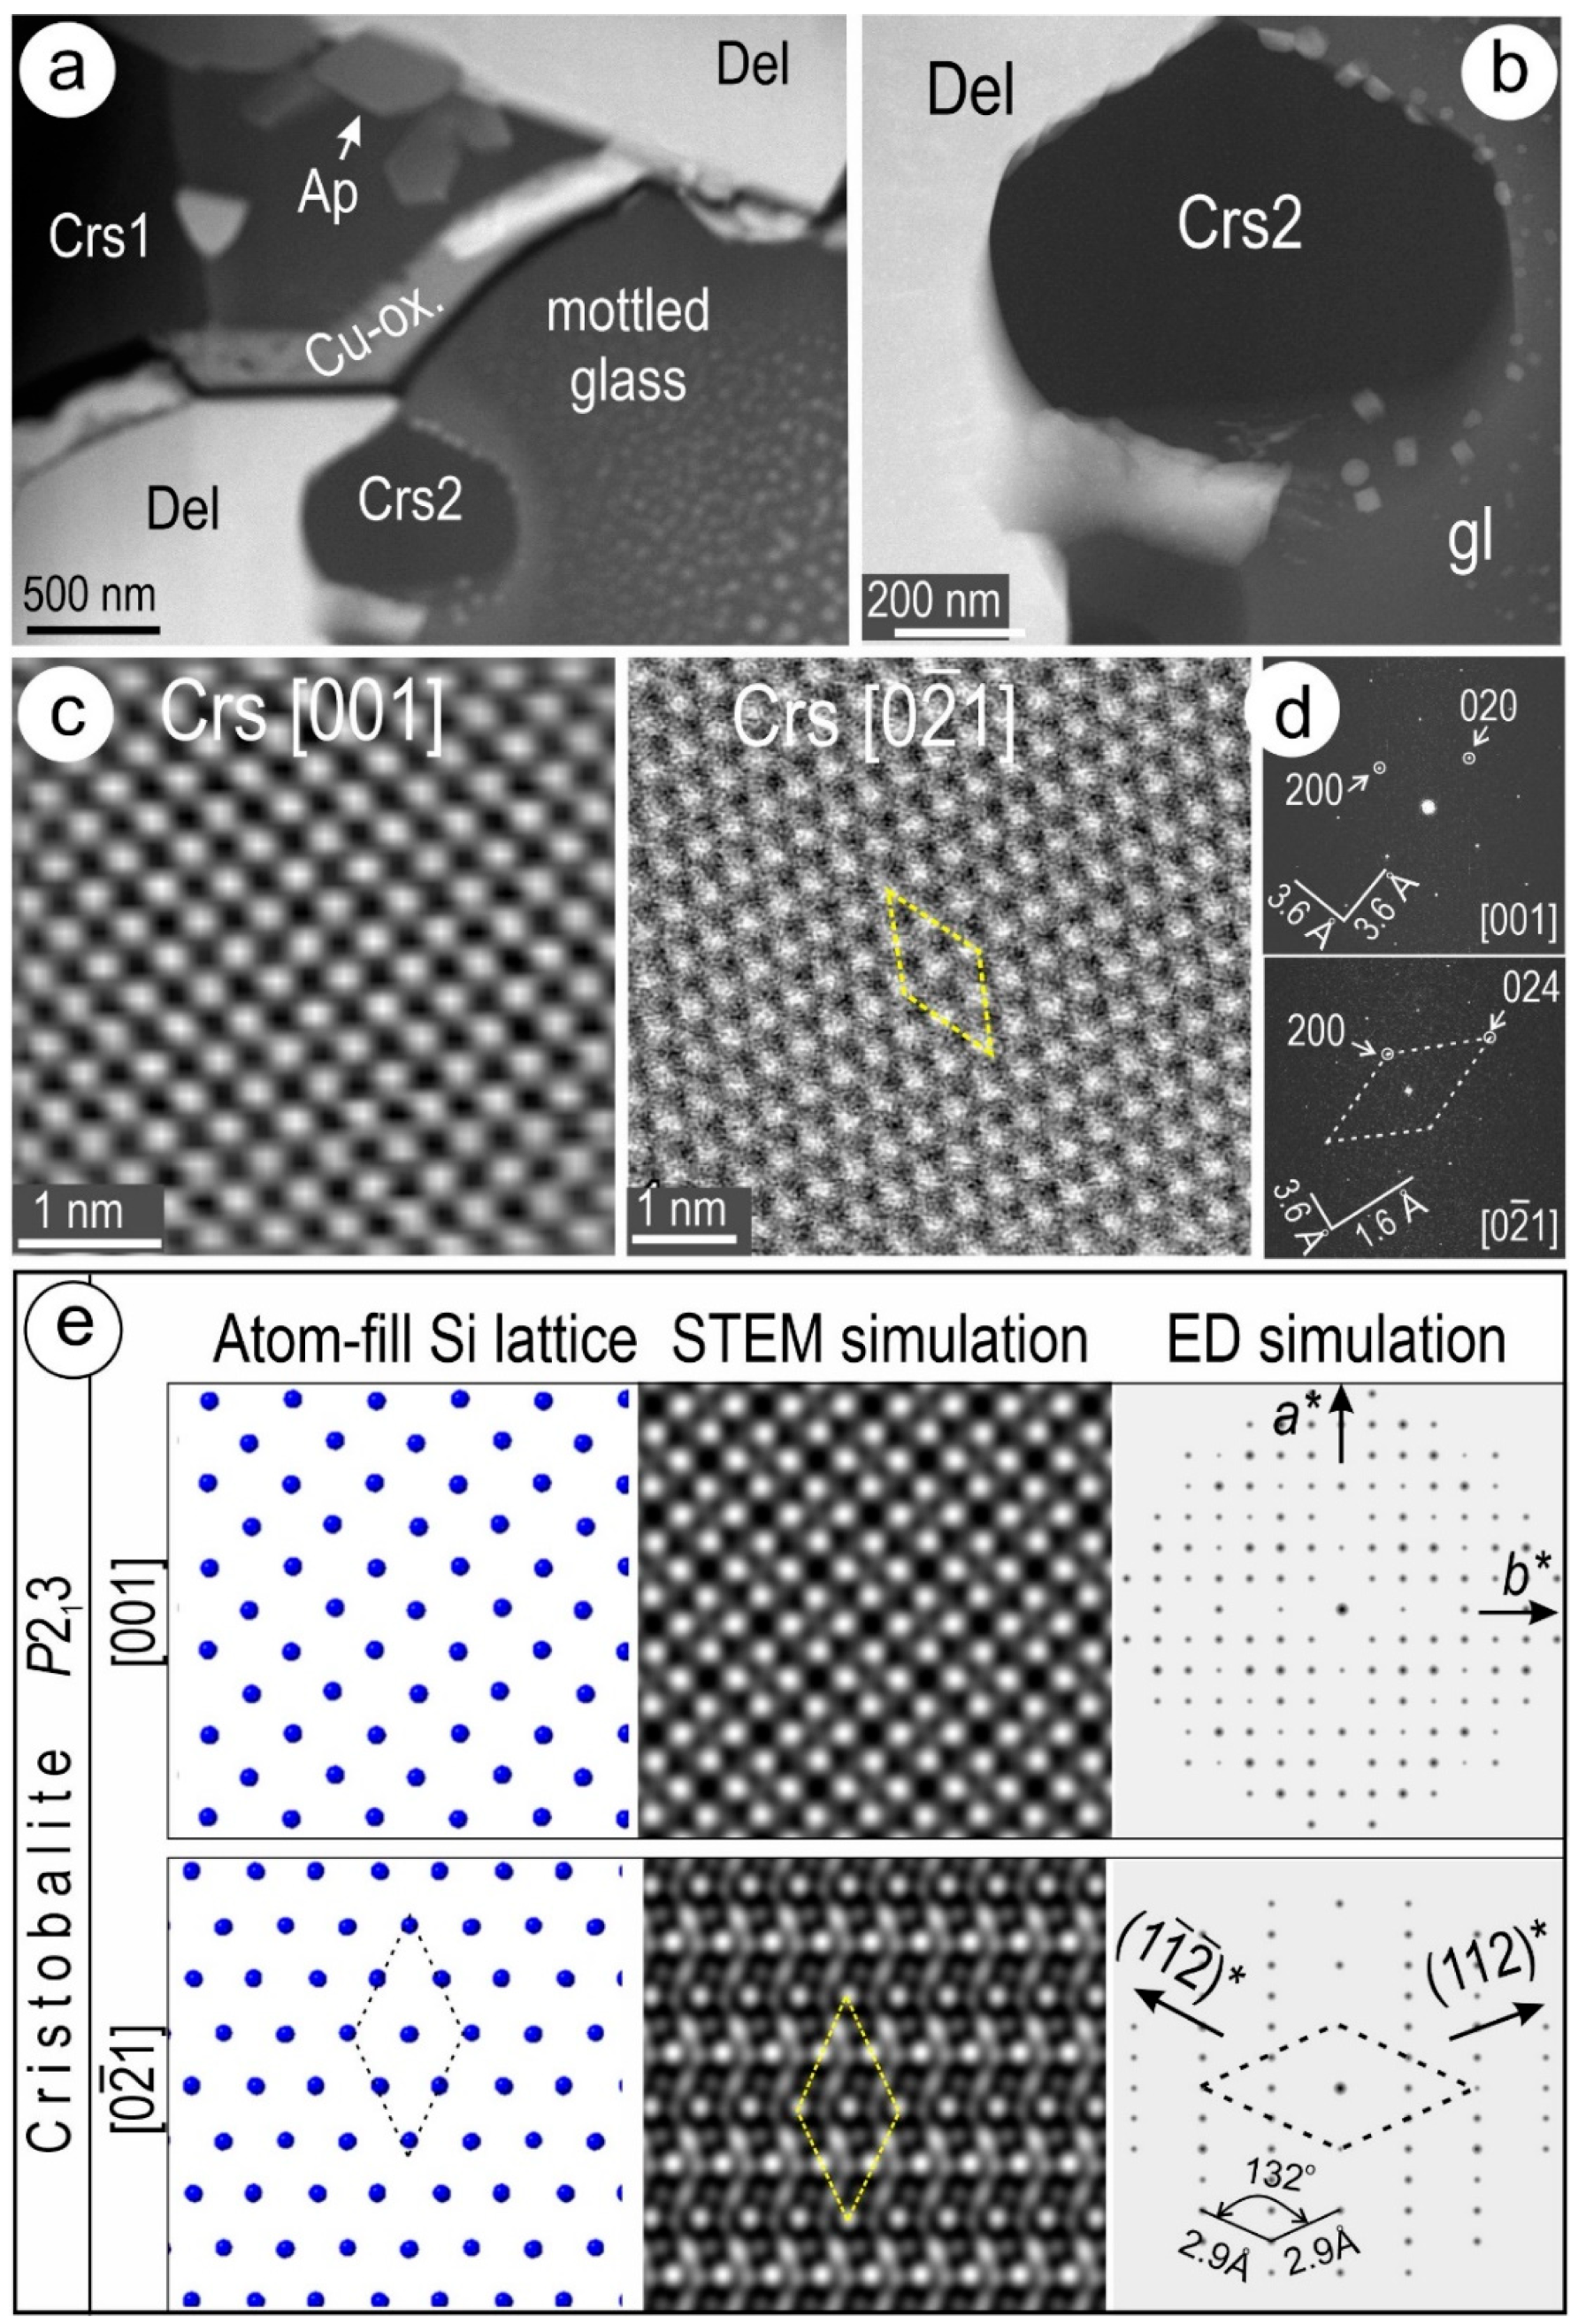
  • A study of flash furnace slags produced during direct-to-blister copper smelting at Olympic Dam shows that Cu is distributed among four crystalline phases that, together, make up ~72.3 wt.% of slag: 48.8 wt.% Cu-bearing magnetite; 8 wt.% delafossite; 12.6 wt.% metallic copper; and 2.9 wt.% cuprite. The remaining ~27.7 wt.% of the slag comprises two types of Si-rich glasses (24 wt.%), minor SiO2 (~1 wt.%), and voids/others (~2.7 wt.%). The SiO2 phase is dominantly from undigested flux, which is partially transformed into high cristobalite. The latter also occurs as NPs within magnetite and fine particles in glass.
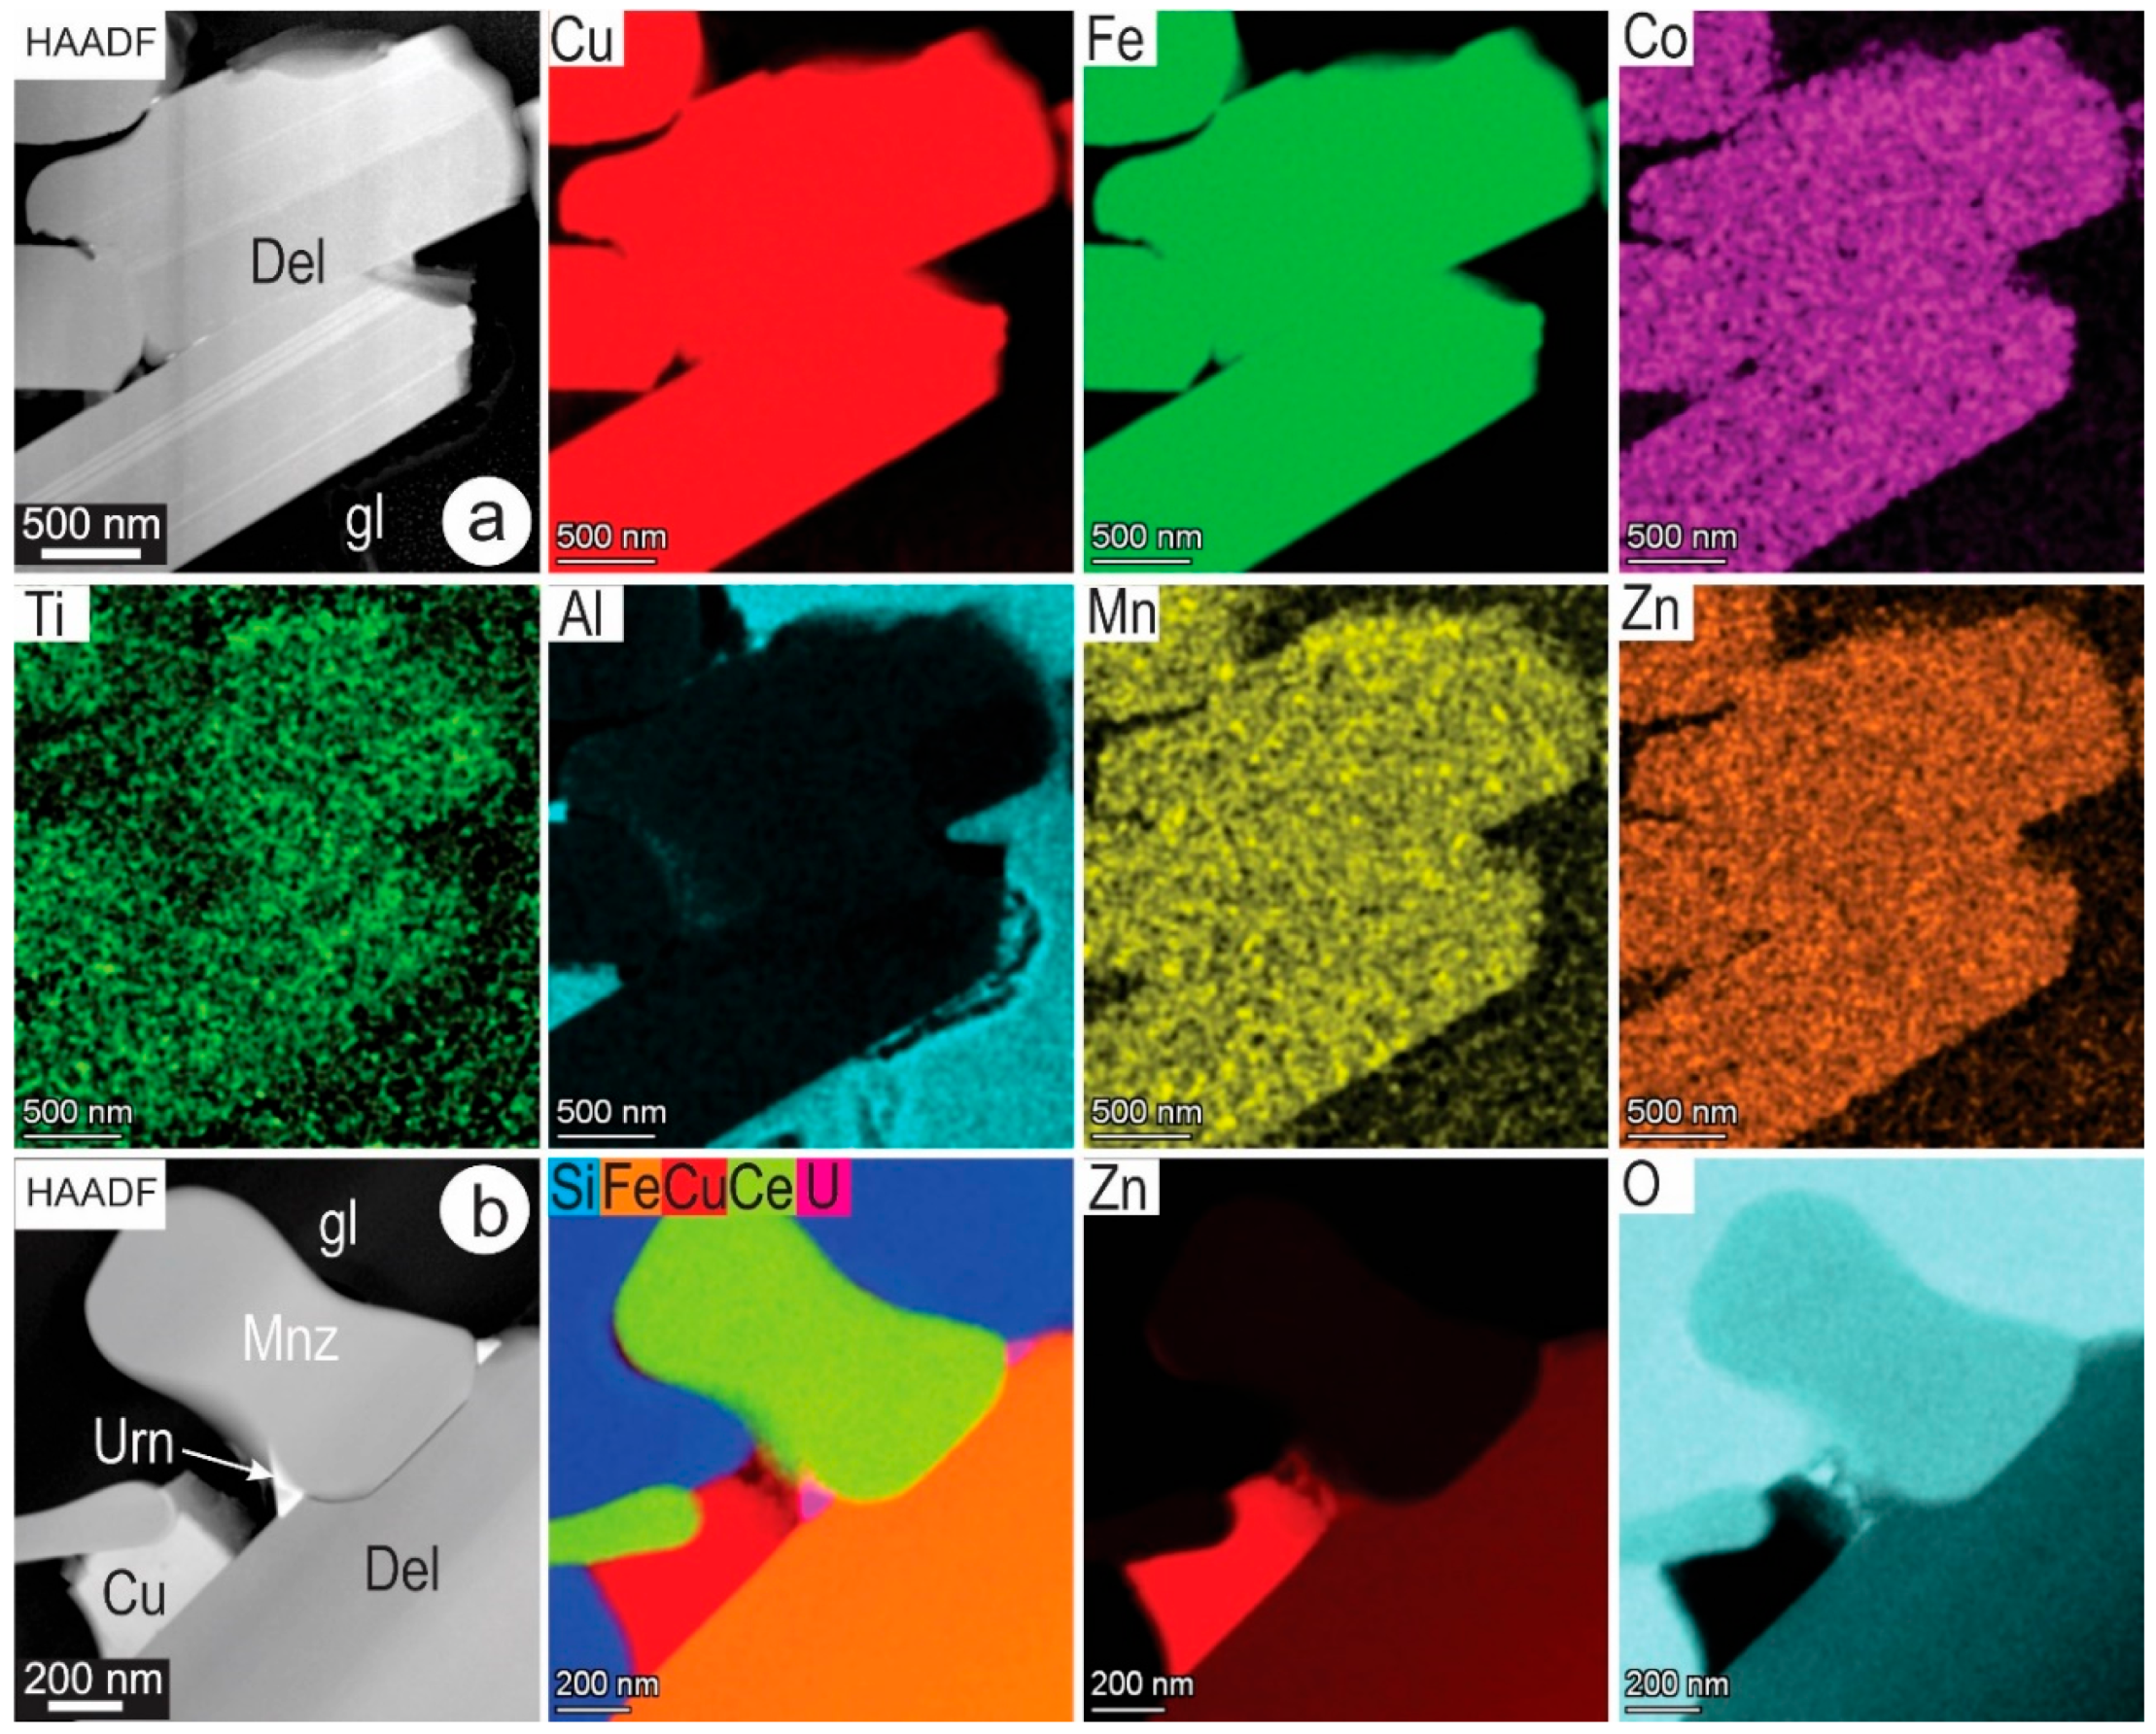
  • Delafossite occurs in two main associations: (i) coexisting with magnetite as rims and lamellar exsolutions, and (ii) as bladed aggregates, associated with cuprite within Si-rich glass.
  • The compositions of magnetite and rim delafossite are: (Fe2+6.89Cu2+0.86Co0.13Mg0.15Si0.02)8.05(Fe3+15.52Al0.41Ti0.01Cr0.01)15.95O32 and (Cu1+0.993Co0.002Mg0.002)0.997(Fe3+0.957Al0.027 Ti0.005Si0.004)0.993O2, respectively. The two Fe-oxides both concentrate the minor elements Al, Mg, Co, and Ti. All except Ti are higher in magnetite. Aluminum can also be enriched in the delafossite exsolutions relative to the host magnetite.
  • A micron- to nanoscale study of magnetite shows that the measured Cu content represents both the solid solution (~6 mol.% cuprospinel endmember) and a contribution from delafossite lamellae. Additionally, copper NPs are identified as a minor contributor.
  • Atomic-resolution HAADF STEM imaging shows epitaxial relationships between delafossite lamellae and the host magnetite. Rapid growth kinetics are interpreted from defects (stepwise contacts and lattice distortion) promoting the formation of copper NPs towards the edges of the lamellae.
  • Dynamic crystallization under locally induced stress in a supercooled system (glass) is recognized from misorientation lamellae in delafossite formed outside magnetite.
  • Such an interpretation is concordant with the crystallization of phases during the cooling of molten FF slag from 1300 °C to <1080 °C. Melt separation through an immiscibility gap below the solvus in the system Cu-Fe-O is suggested to explain the formation of the two distinct delafossite associations: (i) melt-1 from which magnetite + delafossite form; and (ii) melt-2 from which delafossite + cuprite form. The low Cu content in magnetite is evidence for a decrease in the solubility of copper within a spinel solid solution with the prevailing oxygen partial pressure decreasing from log p(O2/bar) = −2 to −5 (at 1250 °C) [20].
  • Delafossite rims on magnetite form at the peritectic temperature (~1150 °C) via a reaction between the magnetite and copper incorporated in the oxide/Si-rich melt. Such a peritectic reaction is also confirmed by the misfit orientation (~10°) between the rim delafossite and magnetite.
The micron- to nanoscale characterization of slags produced by direct-to-blister copper smelting shows the importance of this type of study for accurately interpreting the cooling paths and kinetics in the Cu-Fe-O system. The ‘oiling out’ phenomenon suggested by analogy with Coquerel [31] implies metastable system behavior during fast cooling that cannot be described by conventional thermodynamic models. This hypothesis should be assessed by experimental work combined with the real-time monitoring of melt separation using, for example, high-temperature laser scanning confocal microscopy (e.g., [34,35]).
Constraining the exsolution mechanism of lamellar delafossite from the spinel solid solution is intriguing since cuprospinel, isostructural with magnetite, would be the expected species to form. Both delafossite and cuprospinel are stable in high-oxidizing environments. Their relationships can be explored further by studying the local redox environment (Cu+ and Cu2+ in delafossite and magnetite, respectively), or the control exerted by the <111> parting planes in magnetite for the concentration of Cu in excess to the spinel structure.

Supplementary Materials

The following supporting information can be downloaded at: https://www.mdpi.com/article/10.3390/min13111374/s1, Table S1: Samples and analytical methods; Table S2: Modal mineralogy for two sections, Table S3: Full analytical datasets for magnetite and delafossite.

Author Contributions

H.G., C.L.C. and N.J.C. conceived this research. K.E. contributed samples, advice, and background information. Microscopy and microanalysis were undertaken by H.G. and C.L.C.; A.S. and B.W. contributed their expertise to the nanoscale and microprobe analysis, respectively. Data presentation and interpretation was undertaken by H.G. and C.L.C., assisted by J.Y. The manuscript was written by H.G., C.L.C. and N.J.C., supported by K.E., A.S., B.W. and J.Y. All authors have read and agreed to the published version of the manuscript.

Funding

This is a contribution to the Australian Research Council Linkage Project LP200100156 (Critical Metals from Complex Copper Ores) co-supported by BHP Olympic Dam.

Data Availability Statement

Full datasets can be obtained from the corresponding author upon request.

Acknowledgments

We thank Animesh Basak and Aoife McFadden for their kind assistance with the operation of FIB-SEM and Automated Mineralogy, respectively. We appreciate the constructive comments of three reviewers, which helped us improve the expression of the ideas in this contribution.

Conflicts of Interest

The authors declare no conflict of interest.

References

  1. Biagioni, C.; Pasero, M. The systematics of the spinel-type minerals: An overview. Am. Mineral. 2014, 99, 1254–1264. [Google Scholar]
  2. Nickel, E.H. The new mineral cuprospinel (CuFe2O4) and other spinels from an oxidized ore dump at Baie Verte, Newfoundland. Can. Mineral. 1973, 11, 1003–1007. [Google Scholar]
  3. Pekov, I.V.; Sandalov, F.D.; Koshlyakova, N.N.; Vigasina, M.F.; Polekhovsky, Y.S.; Britvin, S.N.; Turchkova, A.G. Copper in natural oxide spinels: The new mineral thermaerogenite CuAl2O4, cuprospinel and Cu-enriched varieties of other spinel-group members from fumaroles of the Tolbachik Volcano, Kamchatka, Russia. Minerals 2018, 8, 498. [Google Scholar]
  4. Sholeh, A.; Rastad, E.; Huston, D.; Gemmell, J.B.; Taylor, R.D. The Chahnaly low-sulfidation epithermal gold deposit, western Makran volcanic arc, Southeast Iran. Econ. Geol. 2016, 111, 619–639. [Google Scholar]
  5. Verwey, E.J.W.; Heilmann, E.L. Physical properties and cation arrangement of oxides with spinel structures I. Cation arrangement in spinels. J. Chem. Phys. 1947, 15, 174–180. [Google Scholar]
  6. Mexmain, J. Contribution á l’étude du ferrite cuivreux et de ses solutions solides avec le ferrite cuivrique. Ann. Chim. 1971, 6, 297–308. [Google Scholar]
  7. Prince, E.; Treuting, R.G. The structure of tetragonal copper ferrite. Acta Crystallogr. 1956, 9, 1025–1028. [Google Scholar]
  8. Stefanova, V.; Shentov, D.; Mihailova, I.; Iliev, P. Investigation of the phase composition of accretions formed into WHB under flash smelting of copper concentrate. Russ. J. Non Ferr. Metals 2012, 53, 26–32. [Google Scholar]
  9. Hegazy, E.Z.; Abd El-Maksod, I.H.; Ibrahim, A.M.; El-Shafay, S.E.S. New insights about the formation of copper ferrite: In situ X-ray diffraction study. Bull. Natl. Res. Centre 2018, 42, 9. [Google Scholar]
  10. Pabst, A. Crystal structure and density of delafossite. Am. Mineral. 1938, 23, 175–176. [Google Scholar]
  11. Köhler, Β.U.; Jansen, M. Synthesis and crystal structure of 2H—CuAlO2. Z. Krist. Cryst. Mater. 1983, 165, 313–314. [Google Scholar]
  12. Effenberger, H. Structure of hexagonal copper (I) ferrite. Acta Crystallogr. Sect. C Cryst. Struct. Commun. 1991, 47, 2644–2646. [Google Scholar]
  13. Cava, R.J.; Zandbergen, H.W.; Ramirez, A.P.; Takagi, H.; Chen, C.T.; Krajewski, J.J.; Peck, W.F., Jr.; Waszczak, J.V.; Meigs, G.; Roth, R.S.; et al. LaCuO25+x and YCuO2.5+x delafossites: Materials with triangular Cu2+δ planes. J. Solid State Chem. 1993, 104, 437–452. [Google Scholar]
  14. Van Tendeloo, G.; Garlea, O.; Darie, C.; Bougerol-Chaillout, C.; Bordet, P. The fine structure of YCuO2+x delafossite determined by synchrotron powder diffraction and electron microscopy. J. Solid State Chem. 2001, 156, 428–436. [Google Scholar]
  15. Marquardt, M.A.; Ashmore, N.A.; Cann, D.P. Crystal chemistry and electrical properties of the delafossite structure. Thin Solid Films 2006, 496, 146–156. [Google Scholar]
  16. Wolff, N.; Klimm, D.; Siche, D. Thermodynamic investigations on the growth of CuAlO2 delafossite crystals. J. Solid State Chem. 2018, 258, 495–500. [Google Scholar]
  17. Schorne-Pinto, J.; Cassayre, L.; Presmanes, L.; Barnabé, A. Insights on the stability and cationic nonstoichiometry of CuFeO2 delafossite. Inorg. Chem. 2019, 58, 6431–6444. [Google Scholar]
  18. Shishin, D.; Evgueni, J.; Sergei, A.D. Thermodynamic assessment and database for the Cu–Fe–O–S system. Calphad 2015, 50, 144–160. [Google Scholar]
  19. Khvan, A.V.; Fabrichnaya, O.B.; Savinykh, G.; Adam, R.; Seifert, H.J. Thermodynamic assessment of the Cu-Fe-O system. J. Phase Equilibria Diffus. 2011, 32, 498–511. [Google Scholar]
  20. Shishin, D.; Hidayat, T.; Jak, E.; Decterov, S.A. Critical assessment and thermodynamic modeling of the Cu–Fe–O system. Calphad 2013, 41, 160–179. [Google Scholar]
  21. Taskinen, P.; Kaskiala, M.; Miettinen, K.; Jansson, J. Freeze-lining formation and microstructure in a direct-to-blister flash smelting slag. J. Manufact. Sci. Prod. 2013, 13, 77–83. [Google Scholar]
  22. Fernández-Caliani, J.C.; Moreno-Ventas, I.; Bacedoni, M.; Ríos, G. Mineral chemistry and phase equilibrium constraints on the origin of accretions formed during copper flash smelting. Miner. Metall. Proc. 2017, 34, 36–43. [Google Scholar]
  23. BHP Billiton. Olympic Dam Expansion. Draft Environmental Impact Statement 2009. 2. Existing Operation. 2009. Available online: www.bhp.com (accessed on 6 September 2023).
  24. Schlesinger, M.E.; Sole, K.C.; Davenport, W.G.; Alvear Flores, G.R.G. Extractive Metallurgy of Copper, 6th ed.; Elsevier: Amsterdam, The Netherlands, 2022; 593p. [Google Scholar]
  25. Ranasinghe, D.I.; Russell, R.; Muthuraman, R.; Dryga, Z. Process Optimization by Means of Heat and Mass Balance Based Modelling at Olympic Dam. In Proceedings of the Copper 2010, GDMB Gesellschaft für Bergbau, Metallurgie, Rohstoff- und Umwelttechnik and Canadian Institute of Mining, Metallurgy and Petroleum, Hamburg, Germany, 6–10 June 2010; pp. 1063–1078. [Google Scholar]
  26. Ciobanu, C.L.; Cook, N.J.; Utsunomiya, S.; Pring, A.; Green, L. Focussed ion beam–transmission electron microscopy applications in ore mineralogy: Bridging micro- and nanoscale observations. Ore Geol. Rev. 2011, 42, 6–31. [Google Scholar]
  27. Barth, T. The Cristobalite Structures. I. High-Cristobalite. Am. J. Sci. 1932, 23, 350–356. [Google Scholar]
  28. Gezzaz, H.; Ciobanu, C.L.; Cook, N.J.; Ehrig, K.; Slattery, A.D.; Wade, B.P.; McFadden, A. Silician magnetite from quenched slags formed during copper smelting. In Proceedings of the 27th Australian Conference on Microscopy and Microanalysis, Perth, Australia, 29 January–2 February 2023; p. 191. [Google Scholar]
  29. Gezzaz, H.; Ciobanu, C.L.; Slattery, A.; Cook, N.J.; Ehrig, K. Cation inversion in slag magnetite: Energy loss measurements of Fe-L3 edge shift between atom columns. Mater. Char. 2023, 204, 113224. [Google Scholar]
  30. Hidayat, T.; Henao, H.M.; Hayes, P.C.; Jak, E. Phase equilibria studies of Cu-O-Si systems in equilibrium with air and metallic copper and Cu-Me-O-Si systems (Me = Ca, Mg, Al, and Fe) in equilibrium with metallic copper. Metall. Mater. Trans. B 2012, 43, 1290–1299. [Google Scholar]
  31. Coquerel, G. Crystallization of molecular systems from solution: Phase diagrams, supersaturation and other basic concepts. Chem. Soc. Rev. 2014, 43, 2286–2300. [Google Scholar]
  32. Patchett, J.A. The Kinetics of the Peritectic Reactions in Aluminum-Nickel Alloys. Ph.D. Thesis, University of Florida, Gainesville, FL, USA, 1990. [Google Scholar]
  33. Cao, K.; Yang, W.; Zhang, J.; Qu, P.; Liu, C.; Su, H.; Liu, L. Peritectic reaction during directional solidification in a Ru-containing nickel-based single crystal superalloy. J. Alloys Comp. 2021, 870, 159419. [Google Scholar]
  34. Mu, W.; Hedström, P.; Shibata, H.; Jönsson, P.G.; Nakajima, K. High-temperature confocal laser scanning microscopy studies of ferrite formation in inclusion-engineered steels: A review. JOM 2018, 70, 2283–2295. [Google Scholar]
  35. Hauer, L.; Cau, Z.; Skabeev, A.; Vollmer, D.; Pham, J.T. Phase separation in wetting ridges of sliding drops on soft and swollen surfaces. Phys. Rev. Lett. 2023, 130, 058205. [Google Scholar]
Figure 1. Simplified flowsheet showing the direct-to-blister smelting process of leached Cu concentrate at Olympic Dam using flash furnace (FF) and electric furnace (EF). Subsequent processing stages are also schematically shown. Photograph shows a slag sample collected from the flash furnace for the present study. Assay concentrations given for FF and EF slags from Ranasinghe et al. [25].
Minerals 13 01374 g001
Figure 2. (a) Automated Mineralogy (AM) map and corresponding backscattered scanning electron (BSE) map for sample FF21-2. The legend shows modal mineralogy in wt.%. (b) Micro-X-ray fluorescence maps as labelled showing a large pocket of SiO2 representing undigested flux. Abbreviations: Cpr—cuprite, Cu—copper; Del—delafossite, Mag—magnetite.
Minerals 13 01374 g002
Figure 3. Reflected light images (a,b,d) and automated mineralogy (AM) maps (c,e) showing typical phase associations and textures in flash furnace slag from Olympic Dam. (a) Overall texture of FF slag displaying dissemination of µm-sized copper grains throughout a dark groundmass. Note presence of large voids. (b) Slag groundmass comprising magnetite (Mag) with interstitial glass (gl) and pockets of delafossite (Del) + glass. Note variation in the size of copper blebs. (c) Crop from AM map of section FF21-B showing typical proportions of phases in assemblages dominated by magnetite. (d) Delafossite as rim to magnetite and blades within surrounding glass. (e) Crop from AM FF21-B map illustrating the difficulty in analyzing sub-micron phases, including cuprite and rim delafossite.
Minerals 13 01374 g003
Figure 4. BSE images showing characteristic associations of magnetite (Mag) and delafossite (Del). (a) Delafossite as rims around equigranular magnetite and as thin blades within surrounding glass type 1 (gl1). (b,c) Coarser magnetite with inclusions of glass type 2 (gl2) and copper (Cu). Note delafossite also partially replacing magnetite in (b). (d) Eutectic texture in a pocket of glass type 1 with dense delafossite blades and copper blebs. Note the absence of magnetite within such pockets. (e) Eutectic texture of delafossite, cuprite (Cpr), and copper within glass 2. (f) Close-up of glass inclusion in magnetite from (c) showing the same delafossite–glass–copper association as in (d). (g,h) Networks of delafossite lamellae along <111> magnetite. Note these are denser towards magnetite margins rimmed by delafossite (h).
Minerals 13 01374 g004
Figure 5. (a) Binary plots of minor elements in magnetite (Mag): Co vs. Mg; Co vs. Cu; Al vs. Cu; and Mg vs. Al. Note Co is positively correlated with Mg but negatively with Cu. Mg (bd) Ternary Cu-Al-Co and Al-Mg-Co plots for magnetite (b,c) and delafossite (Del) in (d). Both magnetite and delafossite show linear correlation between Co and Mg relative to Al. (e) BSE image of a magnetite aggregate (sample FF21-B) with EPMA spot analysis (visible as dark circles) conducted along seven profiles (P1–7) marked as yellow arrows. (f) Binary plot: Cu2+ (a.p.f.u.) vs. Fe3+/(Cu2++Fe3+) for data along the seven profiles in (e). Note the points cluster close but slightly offset to the tie-line between magnetite and cuprospinel (Cu-spl). (g) Detail from data cluster in (f) showing the spread of analytical points within individual profiles. Other abbreviations: Cu—copper; gl—glass.
Minerals 13 01374 g005
Figure 6. (a) BSE images showing the four magnetite (Mag) grains in Figure 5e with location of foils prepared from sliced extracted (yellow rectangle) along three of the seven EPMA profiles. Delafossite (Del) lamellae arrowed in yellow. (b) Plots of CuO (wt.%) vs. distance along each of the seven profiles. Red overlay shows the CuO interval for the three profiles selected for nanoscale study. (ce) BSE images of magnetite with a small Cu-rich area towards the boundary in sample FF21-B. Location of foil #4 across the Cu-rich magnetite in (e). Other abbreviations: Cu—copper; gl—glass.
Minerals 13 01374 g006
Figure 7. BSE images (a,c,d,g) and secondary electron (SE) images (b,e,f,h) showing locations of foils extracted from sample FF21-A. (a,b) Foil #1 was extracted across delafossite (Del) between two magnetite (Mag) grains. FIB cross-section shows glass partially infilling the boundary between the two grains. (ce) Location of foil #2 extracted across a field of delafossite lamellae in magnetite. Cross-section in (e) shows the extension of lamellar network in depth. Note concentration of lamellae in the vicinity of marginal delafossite exposed at depth. (f) Cross-section showing extension at depth of bladed delafossite in glass (gl) (foil #4, location shown in (a)). (g,h) Top and cross-section showing location of foil (#7) extracted across the contact between delafossite + glass and a coarse SiO2 grain. Other abbreviations: Cu—copper.
Minerals 13 01374 g007
Figure 8. HAADF STEM images showing the eight foils obtained from the two samples as labelled. (a) Delafossite (Del) between two magnetite (Mag) grains. Note protrusion of glass (gl) through the middle of delafossite along the contact. (b) Lamellae of delafossite (arrowed) in magnetite concentrated around the contact with marginal delafossite exposed at depth. (c,d) Bladed delafossite in glass (gl). Sub-micron-sized monazite (Mnz) as filaments attached to delafossite in (c). (eg) Delafossite lamellae in magnetite in foils obtained from profiles shown in Figure 6a. Note scarcity of lamellae in foil #1, with highest CuO measurements relative to denser delafossite fields in foil #3 with lowest CuO measurements (corresponding profiles in Figure 6b). Delafossite marginal to magnetite is mantled by Cu-oxide and copper in (f). (h) Delafossite lamellae (arrowed) in magnetite obtained from location in Figure 6e.
Minerals 13 01374 g008
Figure 9. (ai) HAADF STEM images showing silica (SiO2), glass (gl), and copper inclusions in magnetite (Mag). Note delafossite (Del, arrowed) present as lamellae or marginal rims in magnetite. (a,b) Silica nanoparticles (NPs) along trails crosscutting delafossite lamellae. (c,d) Details of rhomb-shaped silica NPs, attributed to high cristobalite. (e) Glass crosscut by a filament of copper along the contact between rim delafossite and magnetite. (f,g) Mottled glass inclusion in an area with delafossite lamellae (arrowed). (h) Radial delafossite (arrowed) lamellae around a larger, mottled glass inclusion in magnetite. (i) Close-up of NPs comprising uraninite and anhydrite (CaSO4) from glass inclusion in (g). (j) Monazite (Mnz) filament attached to delafossite blade in glass. (k) Spectra for inclusions as labelled from areas numbered on the images in (c,i,j).
Minerals 13 01374 g009
Figure 10. Bright field (BF) STEM images (a,b) and HAADF STEM (cj) showing delafossite (Del) characteristics. (a) Misorientation between lamellae in delafossite seen as strong diffraction contrast in BF-STEM mode. (b) Set of delafossite lamellae along <111>magnetite (Mag). (ce) Variable morphology and thickness of delafossite lamellae in magnetite. (f) Array of copper NPs in magnetite. (gi) Branching of delafossite. Note narrow, few nm-wide lamellae in (i). (j) Distortion of magnetite lattice in the surrounding area of twisted delafossite.
Minerals 13 01374 g010
Figure 11. (a,b) Images and STEM EDS maps #1 and 2 (marked on Figure 8) of contacts between marginal delafossite (Del) and magnetite (Mag) showing distribution of minor/trace elements. In (a), Al profile across the boundary between the two phases shows an increase at their direct contact. Cu—copper; gl—glass.
Minerals 13 01374 g011
Figure 12. (ac) Images and STEM EDS maps #3–5 (marked on Figure 8) of delafossite (Del) lamellae in magnetite (Mag) showing patterns of minor/trace element distribution in the two phases. Note Al partitioning in the delafossite instead of magnetite.
Minerals 13 01374 g012
Figure 13. (a,b) Images and STEM EDS maps #6 and 7 (marked on Figure 8) of bladed delafossite (Del) hosted in glass (gl). There is no compositional variation across the misorientation lamellae in delafossite from (a). Monazite (Mnz), copper (Cu) and uraninite (Urn) along the delafossite margin in (b).
Minerals 13 01374 g013
Figure 14. High-resolution HAADF-STEM images (a,c) and corresponding fast Fourier transform (FFT) patterns (b,d) showing epitaxial, straight contacts between magnetite (Mag) and delafossite (Del) lamellae on two zone axes for each phase as labelled in square brackets. STEM simulations for each phase are shown beneath the images. Separate FFT patterns for magnetite and delafossite are also shown for comparison. Interplanar distances are also marked. In both cases, magnetite and delafossite are coherent along (111) planes. (e) High-resolution image and STEM EDS maps showing the distribution of Cu and Fe at the boundary between [1 1 ¯ 0]Mag and [0 1 ¯ 1]Del. Fe and Cu model for delafossite as overlay on the image.
Minerals 13 01374 g014
Figure 15. High-resolution HAADF-STEM images showing contact defects and disorder (ad) leading to formation of copper NPs (eg) in magnetite (Mag) host to delafossite (Del) lamellae. Orientations as marked in square brackets. Stepwise boundaries along delafossite lamellae (dashed line) in (a) associated with defect points (arrowed) and multiple layer displacements in delafossite (inset) in (b). (c,d) Distortion in delafossite leading to formation of copper NPs (arrowed) along the lamellae. Note lattice disorder in enclosing magnetite. (e,f) Details of Figure 10f along an array of copper NPs in magnetite. FFT pattern as inset in (g) shown for a copper NP.
Minerals 13 01374 g015
Figure 16. Misalignment between magnetite (Mag) and marginal delafossite (Del). (a) Image showing the contact (dashed line) between [11 3 ¯ ]Del and out-of-focus magnetite. Nonetheless, the (011)Mag and (1 1 ¯ 0)Del planes are aligned with one another. The misalignment angle at ~10° between (001)Mag and (211)Del planes is obtained by tilting magnetite to [100] zone axis. FFT patterns for magnetite (after tilting) and delafossite are shown in (b,c). These correspond to atom-resolution images in (d) and atom-fill models in (e) where the pairs of lattice planes mentioned above for the two phases are marked.
Minerals 13 01374 g016
Figure 17. High cristobalite (Crs) identified from the margin of a large grain of silica (Crs1) at the contact with glass hosting delafossite (FF21-B foil#7) in (a) and as small, newly formed grains (Crs2) in (b). (c,d) High-resolution images and corresponding FFT patterns for Crs on zone axes as labelled in square brackets. Indexing using the crystal structure of Barth [27]. (e) Atom-fill models, STEM images, and electron diffraction simulations for the same zone axes as labelled. These show a good fit with corresponding HAADF STEM images and FFT patterns in (c,d).
Minerals 13 01374 g017
Figure 18. (a) Cu2O-Fe3O4 quasi-binary phase diagram at PO2 = 10−5 atm (redrawn after Shishin et al. [20] showing phase equilibria of assemblages 1 and 2 with mol. ratios Cu2O/(Cu2O + Fe3O4) at 0.2 and 0.86, respectively) using AM data. The partitioning wt.% proportions of delafossite (Del) and copper between assemblages 1 and 2 were based on visual observations of % area occupied in both assemblages using BSE imaging. The red dashed line corresponds to an inferred two melt separation upon cooling. Cooling paths for assemblages 1 and 2 marked by red dots. (b) Pie charts illustrating the assumed wt.% proportions of the phases in assemblages 1 and 2. Abbreviations: Sp.ss—spinel solid solution (Cu2+,Fe3+,Fe2+)Tet(Cu2+,Fe3+,Fe2+,v)OctO42−, v = vacancy; Culiq—copper melt, Cus—solid copper metal, Del—delafossite, Liq.oxide—melt oxide (Fe3+,Fe2+,Cu1+,Cu2+,O2−), Cpsl—cuprospinel, Mag—magnetite.
Minerals 13 01374 g018
Figure 19. Schematic of phase crystallization and microstructure development during slag cooling from 1300 °C to room temperature. Cooling trajectories across phase separation fields, i.e., A1-1 to 1-3 and A2-1 to 2-4, for assemblages 1 and 2, respectively, are marked by red circles on diagram in Figure 18a.
Minerals 13 01374 g019
Table 1. Chemical compositions and calculated formulae (atomic per formula unit, a.p.f.u.) for magnetite (EPMA data).
SampleFF21-3BFF21-AFF21-2FF21-BFF21-3AAll Samples
AverageAverageAverageAverageAverageAverageSTDEVMinMax
n = 32n = 23n = 49n = 144n = 22n = 270
SiO20.080.060.040.030.050.050.020.030.08
TiO20.040.060.050.080.040.050.020.040.08
Al2O30.841.661.011.210.861.120.340.841.66
Cr2O30.140.010.070.010.050.060.050.010.14
Fe2O366.4365.5667.1066.8065.9166.360.6365.5667.10
FeO26.2726.5627.0026.5326.2726.530.3026.2727.00
MgO0.390.270.320.320.310.320.040.270.39
CoO0.510.500.530.490.480.500.020.480.53
CuO3.703.763.343.953.533.650.233.343.95
Total98.3998.4599.4699.4397.5098.640.8297.5099.46
Magnetite formula (apfu) based on 32 O atoms
Si0.0240.0180.0110.0100.0150.0160.0060.0100.024
Ti0.0090.0130.0110.0190.0090.0120.0040.0090.019
Al0.3090.6080.3670.4410.3180.4090.1230.3090.608
Cr0.0340.0030.0160.0030.0130.0140.0130.0030.034
Fe3+15.59315.32515.57215.49915.62015.5220.11915.32515.620
Fe2+6.8536.9006.9636.8406.9186.8950.0506.8406.963
Mg0.1820.1240.1490.1470.1440.1490.0210.1240.182
Co0.1270.1250.1320.1220.1220.1260.0040.1220.132
Cu2+0.8710.8820.7770.9190.8400.8580.0530.7770.919
Total24.00024.00024.00024.00024.00024.0000.00024.00024.000
Endmembers (mol. %)
1 Mag87.2486.1488.0886.5488.0787.210.7986.1488.07
1 Cspl6.366.405.596.726.096.230.425.596.72
1 Mfr2.581.772.102.102.042.120.291.772.58
1 Hc1.943.822.302.772.002.570.771.943.82
1 Cofr1.821.781.861.751.741.790.051.741.86
1 Uspl0.060.090.070.120.060.080.030.060.12
1 Endmembers: Mag—magnetite, Cspl—cuprospinel, Mfr—magnesioferrite, Hc—hercynite, Cofr—cobalt ferrite, Uspl—ülvospinel.
Table 2. Chemical compositions and calculated formulae (atomic per formula unit, a.p.f.u.) for delafossite (EPMA).
SampleFF21-3BFF21-AFF21-2FF21-BFF21-3AAll Samples
AverageAverageAverageAverageAverageAverageSTDEVMaxMin
n = 17n = 7n = 9n = 4n = 2n = 39
SiO20.290.210.030.020.010.110.130.010.29
TiO20.230.280.280.210.070.210.090.070.28
Al2O30.821.001.181.040.880.980.140.821.18
Fe2O351.1050.3651.8853.4353.5752.071.4150.3653.57
MgO0.020.020.040.040.010.030.010.010.04
CoO0.100.090.090.120.100.100.010.090.12
Cu2O45.9446.7946.8944.6144.3245.711.2044.3246.89
Total98.5198.75100.4099.4798.9599.220.7598.51100.40
Delafossite formula (apfu) based on 2 O atoms
Si0.0070.0050.0010.0010.0000.0030.0030.0010.007
Ti0.0040.0050.0050.0040.0010.0050.0010.0040.005
Al0.0240.0300.0300.0300.0250.0280.0030.0240.030
Fe3+0.9650.9540.9260.9850.9950.9580.0240.9260.985
Mg0.0020.0010.0020.0030.0010.0020.0010.0010.003
Co0.0020.0020.0020.0020.0020.0020.0000.0020.002
Cu1+0.9690.9901.0920.9200.9190.9930.0720.9201.092
Total1.9661.9822.0571.9441.9451.9910.0481.9452.058
Disclaimer/Publisher’s Note: The statements, opinions and data contained in all publications are solely those of the individual author(s) and contributor(s) and not of MDPI and/or the editor(s). MDPI and/or the editor(s) disclaim responsibility for any injury to people or property resulting from any ideas, methods, instructions or products referred to in the content.

