Article

Automated Mineralogy and Diagnostic Leaching Studies on Bulk Sulfide Flotation Concentrate of a Refractory Gold Ore

1
Department of Geoscience and Petroleum, Faculty of Engineering, Norwegian University of Science and Technology, 7031 Trondheim, Norway
2
Department of Mineral Processing Engineering, Istanbul Technical University, Istanbul, 34469 Maslak, Turkey
3
Maelgwyn Mineral Services Ltd., Ty Maelgwyn, 1A Gower Road, Cathays, Cardiff CF24 4PA, UK
*
Author to whom correspondence should be addressed.
Minerals 2023, 13(10), 1243; https://doi.org/10.3390/min13101243
Submission received: 4 July 2023 / Revised: 12 September 2023 / Accepted: 20 September 2023 / Published: 23 September 2023
(This article belongs to the Special Issue Valuable Metals Recovery by Mineral Processing and Hydrometallurgy)

Abstract

:
Obtaining detailed and precise information from a classified refractory gold ore has been a long-standing challenge in mineral processing and process mineralogy. Although the concept of diagnostic leaching has been extensively addressed in the literature, very little information is available linking this approach with current advanced characterization techniques such as automated mineralogy. The present research study aims to characterize the flotation concentrate of refractory gold ore by combining diagnostic leaching and automated mineralogy to examine its processability. The diagnostic leaching process was applied stepwise at five stages, and the automated mineralogy was performed on different size fractions of the flotation concentrate. The chemical (X-ray fluorescence (XRF), atomic absorption spectroscopy (AAS), and inductively coupled plasma-optical emission spectroscopy (ICP-OES)) and mineralogical (X-ray diffraction (XRD)) analyses of the feed sample confirmed that the ore is a low-grade gold ore with 0.7 g/t Au. Initially, bottle roll tests were carried out to investigate leaching behavior, and the ore’s refractory nature, and gold recoveries of bottle roll tests in different sizes were below 40 wt%; it is classified as a high refractory gold ore as a result of direct cyanide leaching. Bulk sulfide flotation was applied to increase the gold content of the material. Automated mineralogy results demonstrated that most of the gold in the concentrate is present as an invisible gold form, and 63.7 wt% of gold was distributed in pyrite. Diagnostic leaching results showed 39.7 wt% of total gold was leachable using direct cyanide leaching, and around 33 wt% of undissolved gold was located in pyrite and arsenopyrite.

1. Introduction

A sharp reduction in the cut-off grade of gold mines and increasing demand for this element in modern technologies have led metallurgists to deal with refractory gold-type ores more than before. As many different newly opened mineral deposits are typically more polymineralic and complex, the easy-to-treat mineral deposits become rarer. Similarly, processing polymineralic and complex gold ore bodies has become relatively challenging and requires sophisticated solutions [1,2]. The easily accessible free-milling gold deposits gradually decline, and therefore, the interest in refractory gold ores, and the processing of their tailings, increases globally. For such ore bodies, a very good understanding of the ore characteristics is crucial with respect to the selection of an appropriate methodology for downstream processes.
In mineral processing, gold ores are commonly classified as (i) free-milling, (ii) refractory gold, and (iii) complex gold ore types, where the free-milling ore type has high gold recovery (>90%), while the refractory one has a recovery of lower than 90% [3,4,5,6,7] and the gold recovery of the third class is only economically feasible under excessive reagent consumption [8]. There are several properties that lead to the classification of gold ore as a refractory gold ore as given below:
  • Gold is physically locked in the host mineral [3,8];
  • Gold is chemically locked in the form of an alloy with other metals [3,8];
  • Gold is present as sub-microscopic-size invisible gold or a solid solution in sulfide structures [7,8,9,10,11];
  • The ore contains gangue minerals whose properties lead to high consumption of oxygen or cyanide [9];
  • Carbonates and clays present in the ore act as activated carbon (preg-robbing effect) [3,12];
  • The presence of passivation layers on the gold grains [8].
If one or more of these conditions leads to gold recovery below 90%, the ore is classified as refractory gold ore and general conclusion in the literature is that the most important properties that make the ore refractory are the first three bullet points mentioned above [3,4,5,6,7,8,9,10,11]. The ore type specified in the first bullet point can achieve high recovery with ultrafine grinding, but oxidation processes are required for the ore structures identified in the second and third subjects [3,8,9]. Gold defined as invisible gold mentioned in the third bullet point is invisible using conventional optical and electron microscopes, and typically occurs as inclusions in pyrite found together with arsenopyrite [10]. However, it is believed that such statements should be revised and updated based on improvements in technologies utilized for the characterization of such ores. For this reason, the current study applies a supplementary method to the diagnostic leaching test as a commonly used approach for the characterization of gold ores.
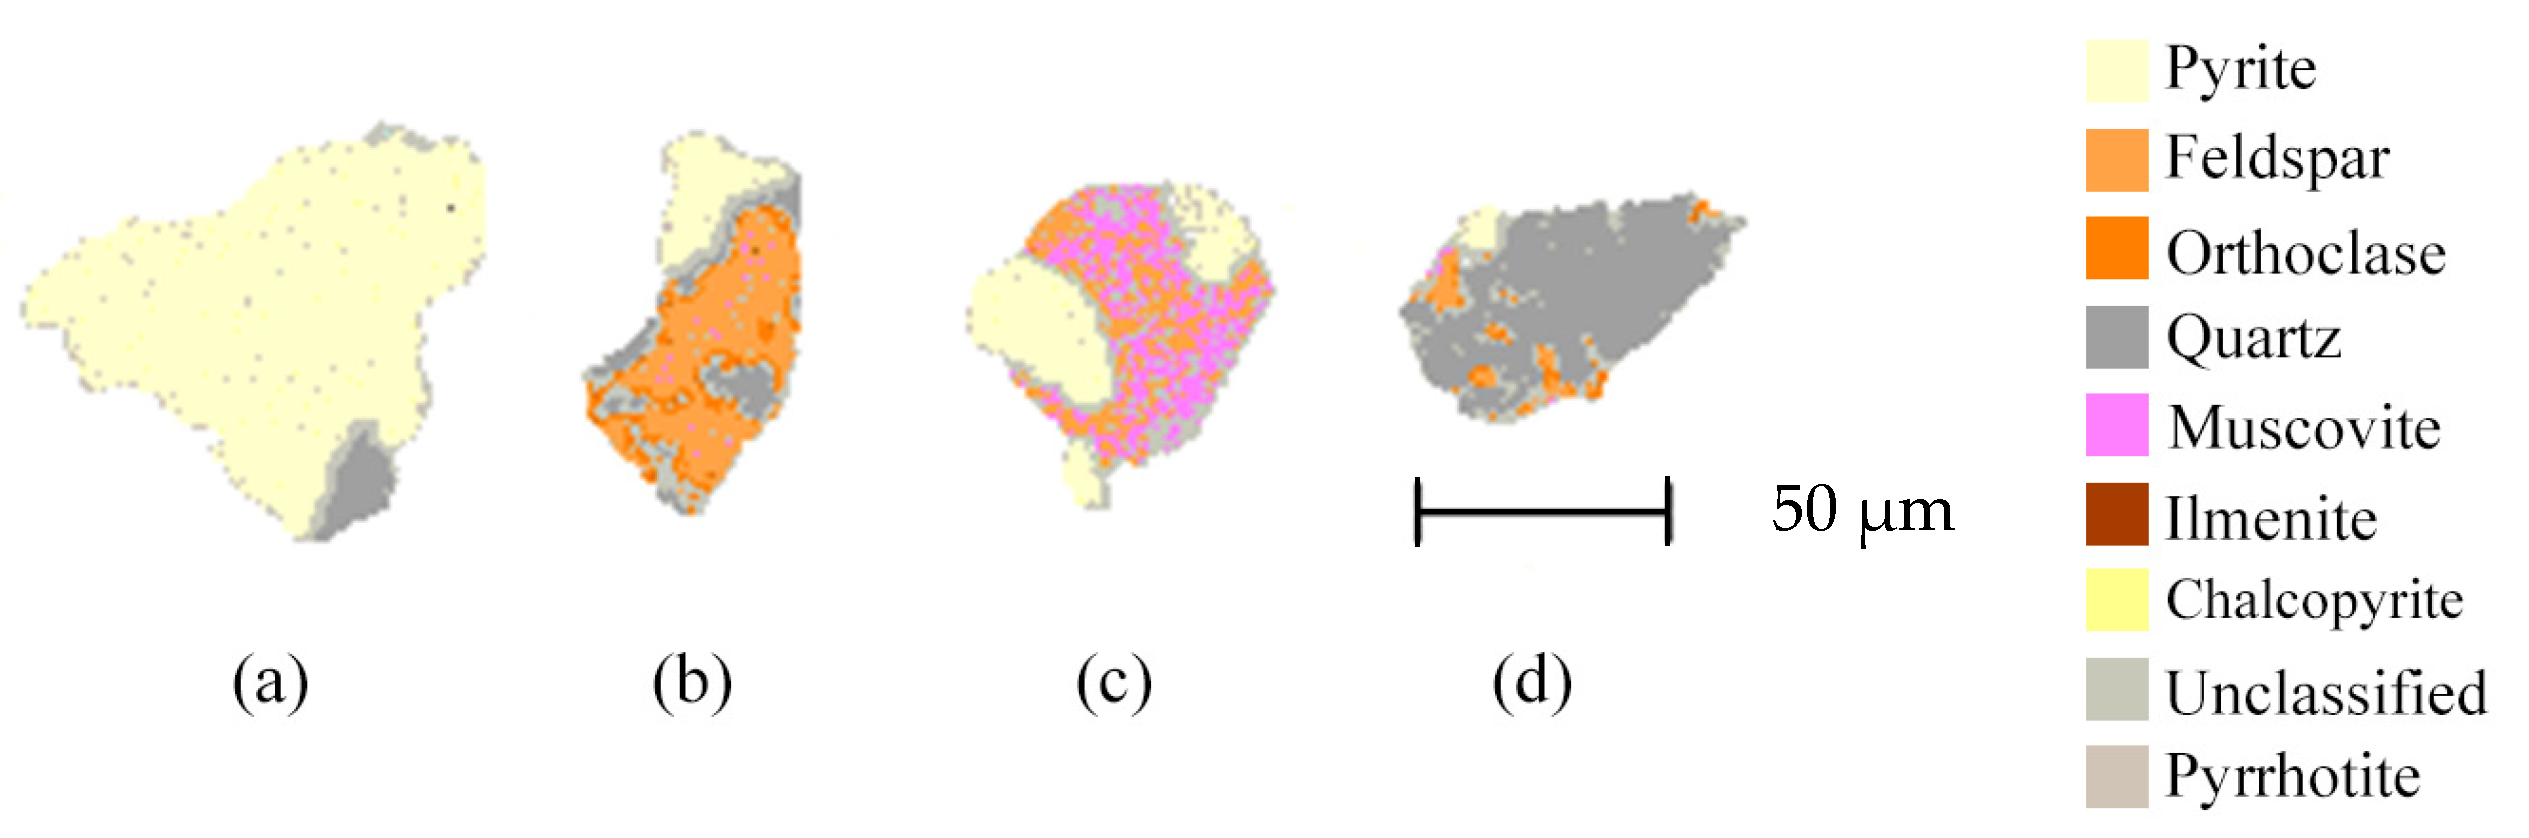
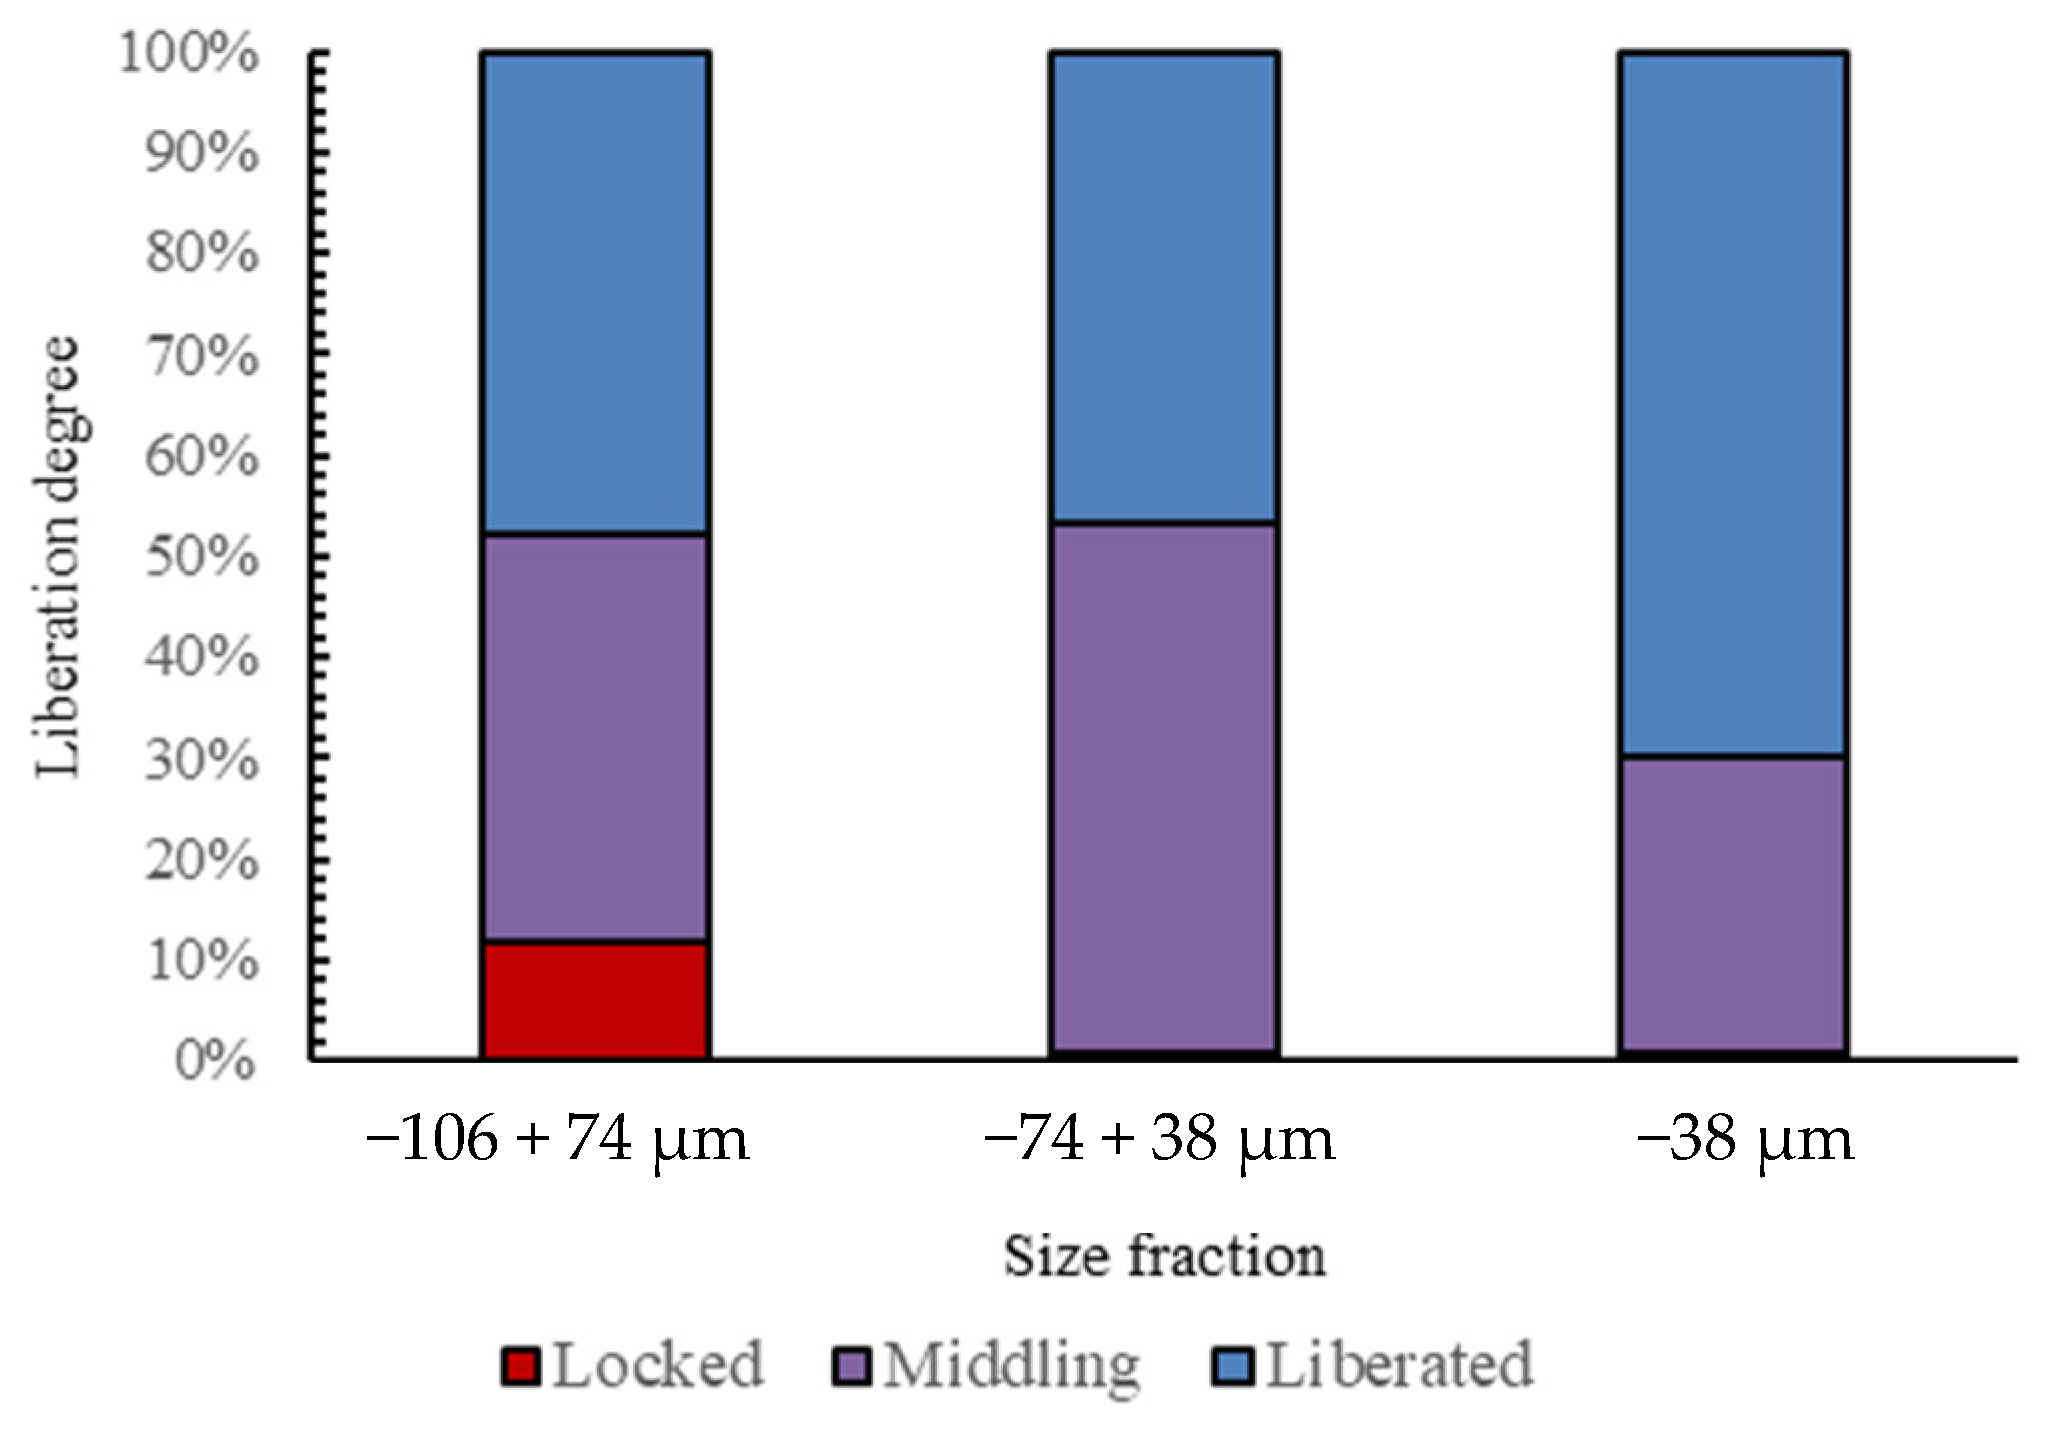
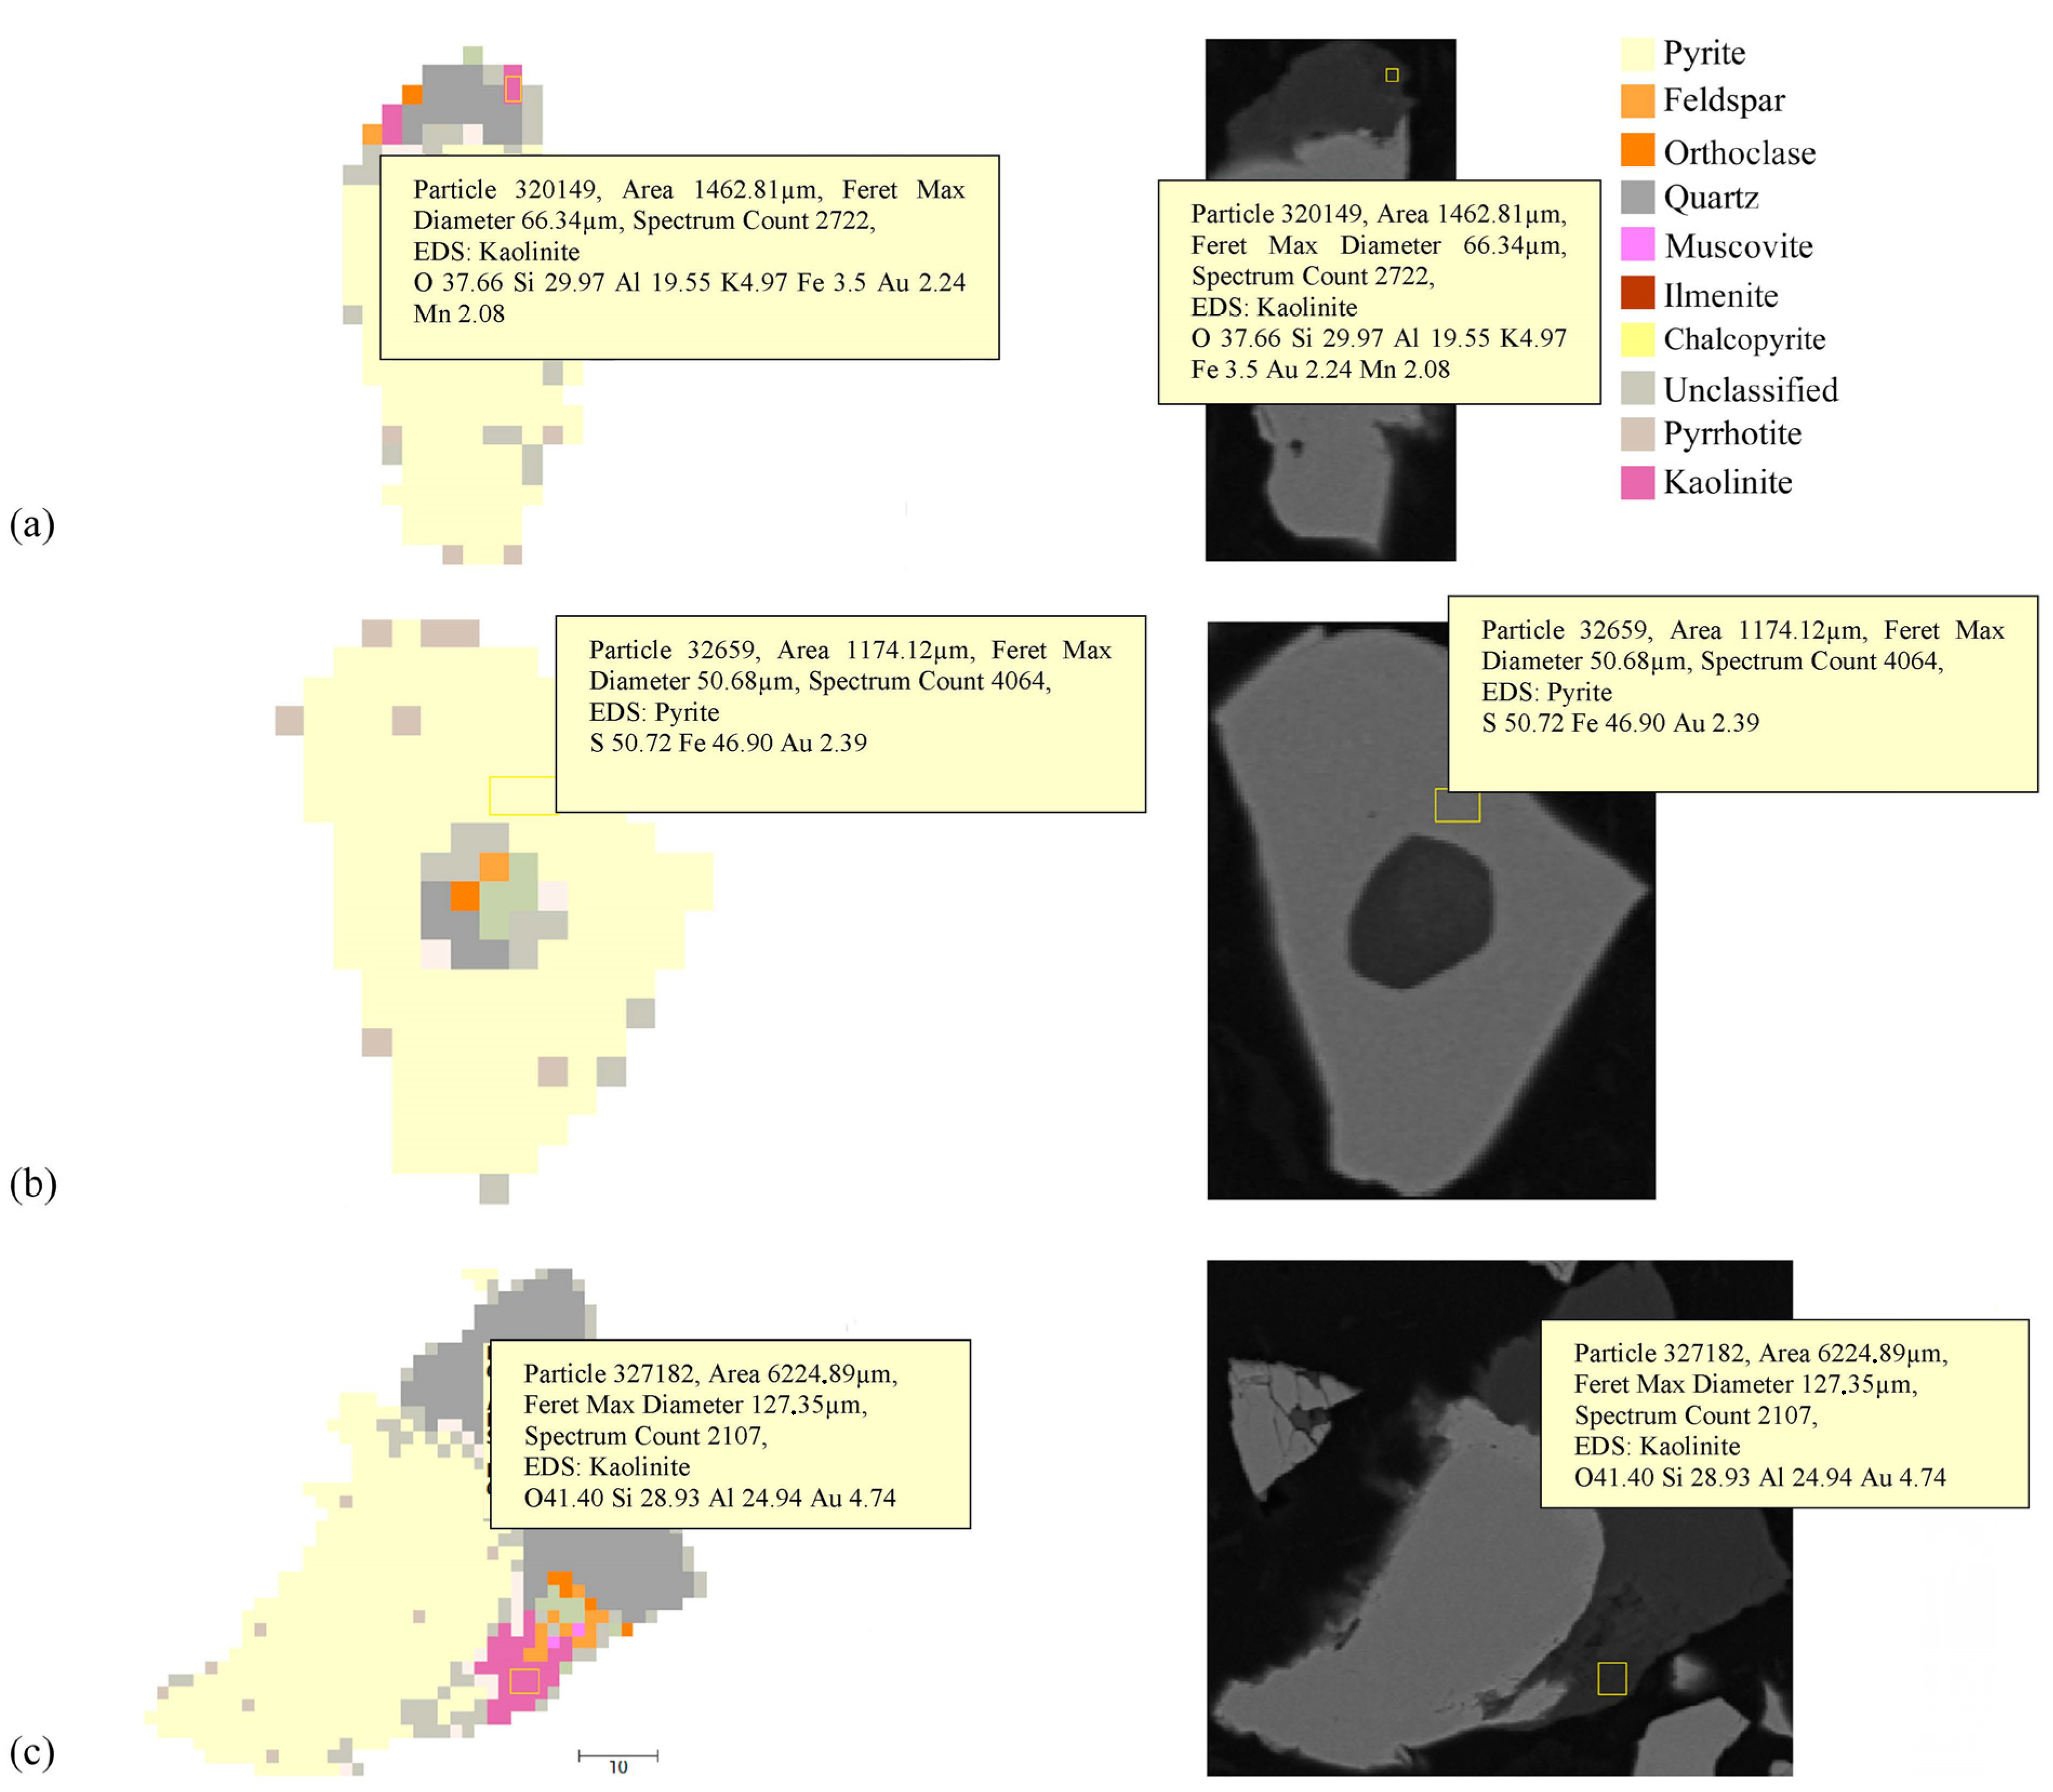
Automated mineralogy has been proven as a key technology for the characterization of primary and secondary raw materials, plant optimization, feasibility study, and process design [13,14,15,16,17,18,19,20,21]. Scanning electron microscopy (SEM) combined with energy dispersive spectrometry (EDS) and specific software [
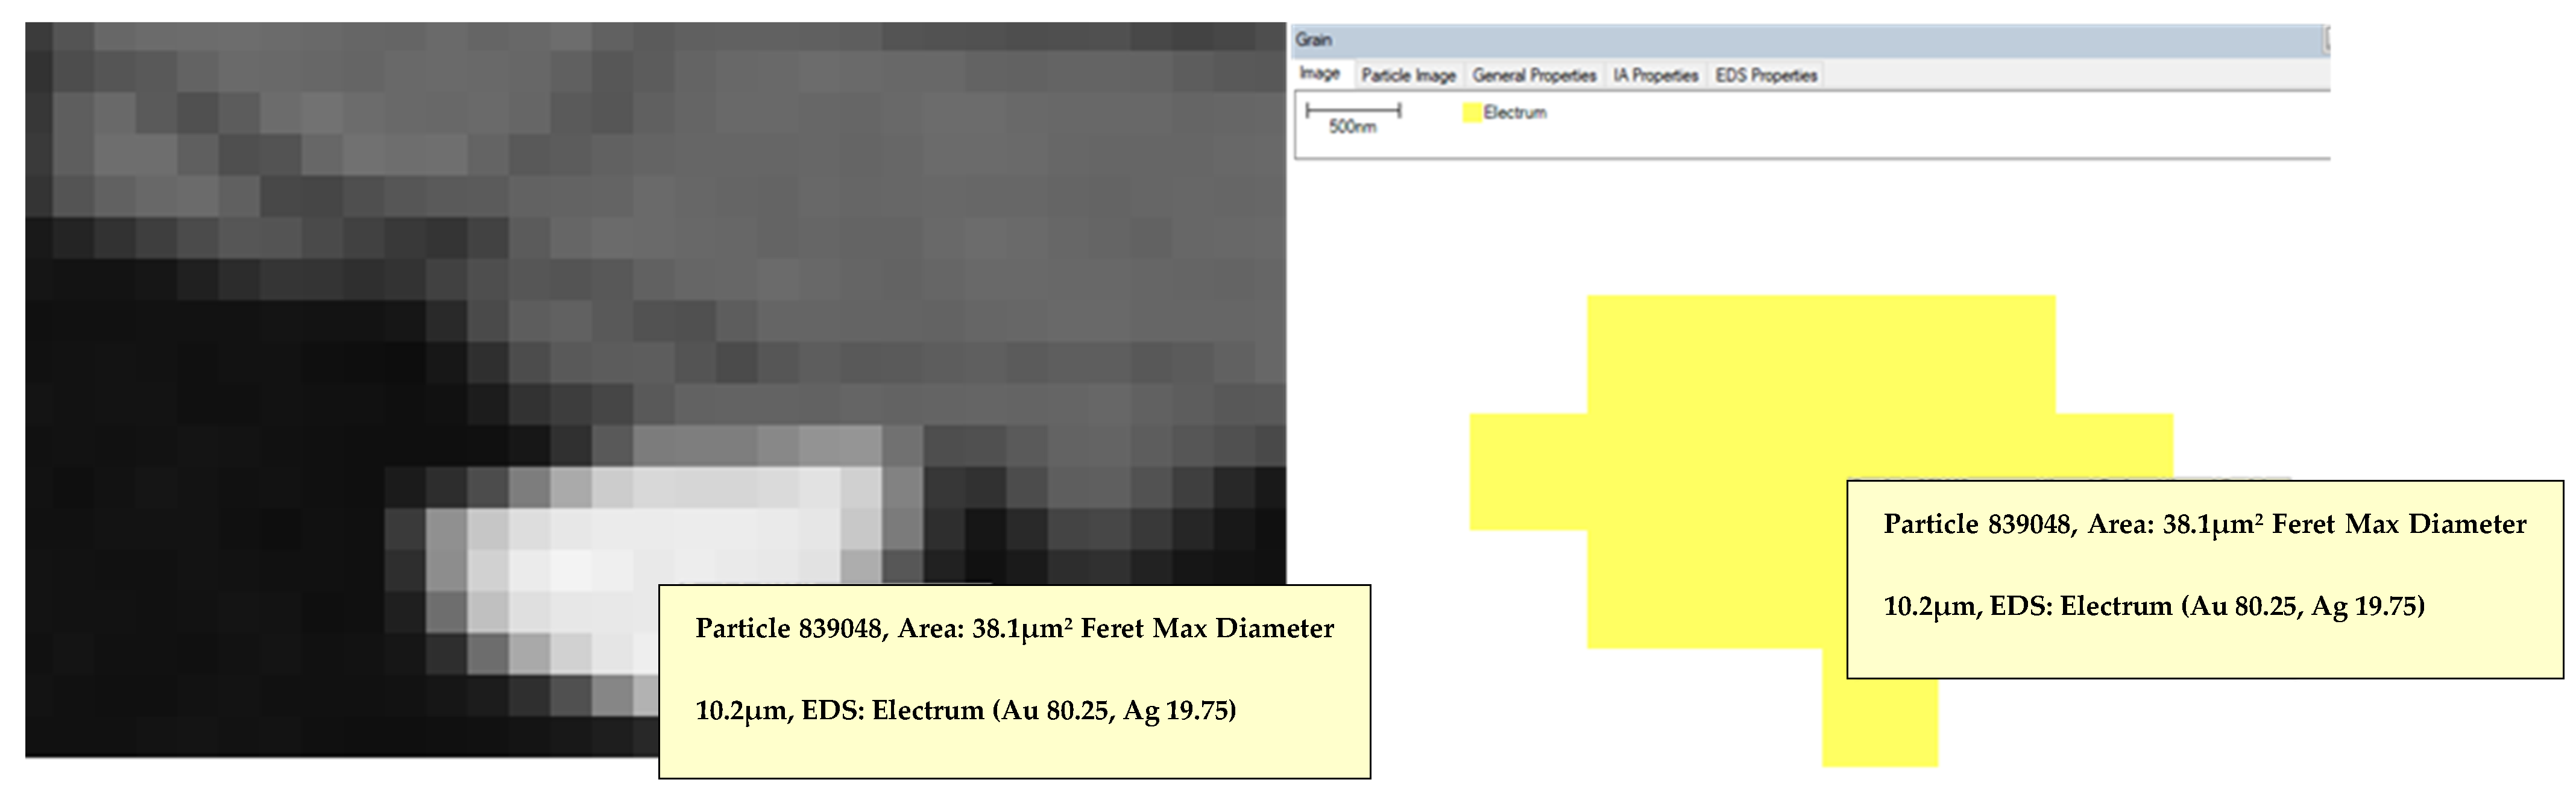
17] has been applied to provide detailed information about ore properties, such as bulk mineralogy, liberation degree, grain and particle size distribution, mineral associations, mineral compositions, and metal deportment. This technology is capable of providing invaluable information on types of gold-bearing minerals, gold exposure, mineral associations of locked gold grains, and assays of invisible gold [22,23]. Although the automated mineralogy method provides detailed information about the ore, it is generally used with other chemical and mineralogical analysis methods. Chryssoulis and Cabri [24] used an elemental analysis for trace elements, which indicate minerals potentially containing gold, as a part of the study, which they defined as “gold mineralogical balance” in addition to diagnostic cyanidation and an electron probe micro-analysis (EPMA). Also, heavy liquid separation (HLS) or gravity separation is generally used to increase the chance of detecting gold before sample preparation for a SEM analysis [19,22,25].
Diagnostic leaching is not an extraction method but has been widely accepted and applied as an alternative analytical approach. Through this, one can investigate gold deportment and its distribution in different mineral matrices. The technique applies sequential leaching based on acidic and oxidative reagents to measure the gold recovery. Diagnostic leaching is a simple and relatively rapid method that enables metallurgists to determine which mineral prevents gold dissolution with the cyanidation process [26]. This information is very essential for process design in gold concentration plants.
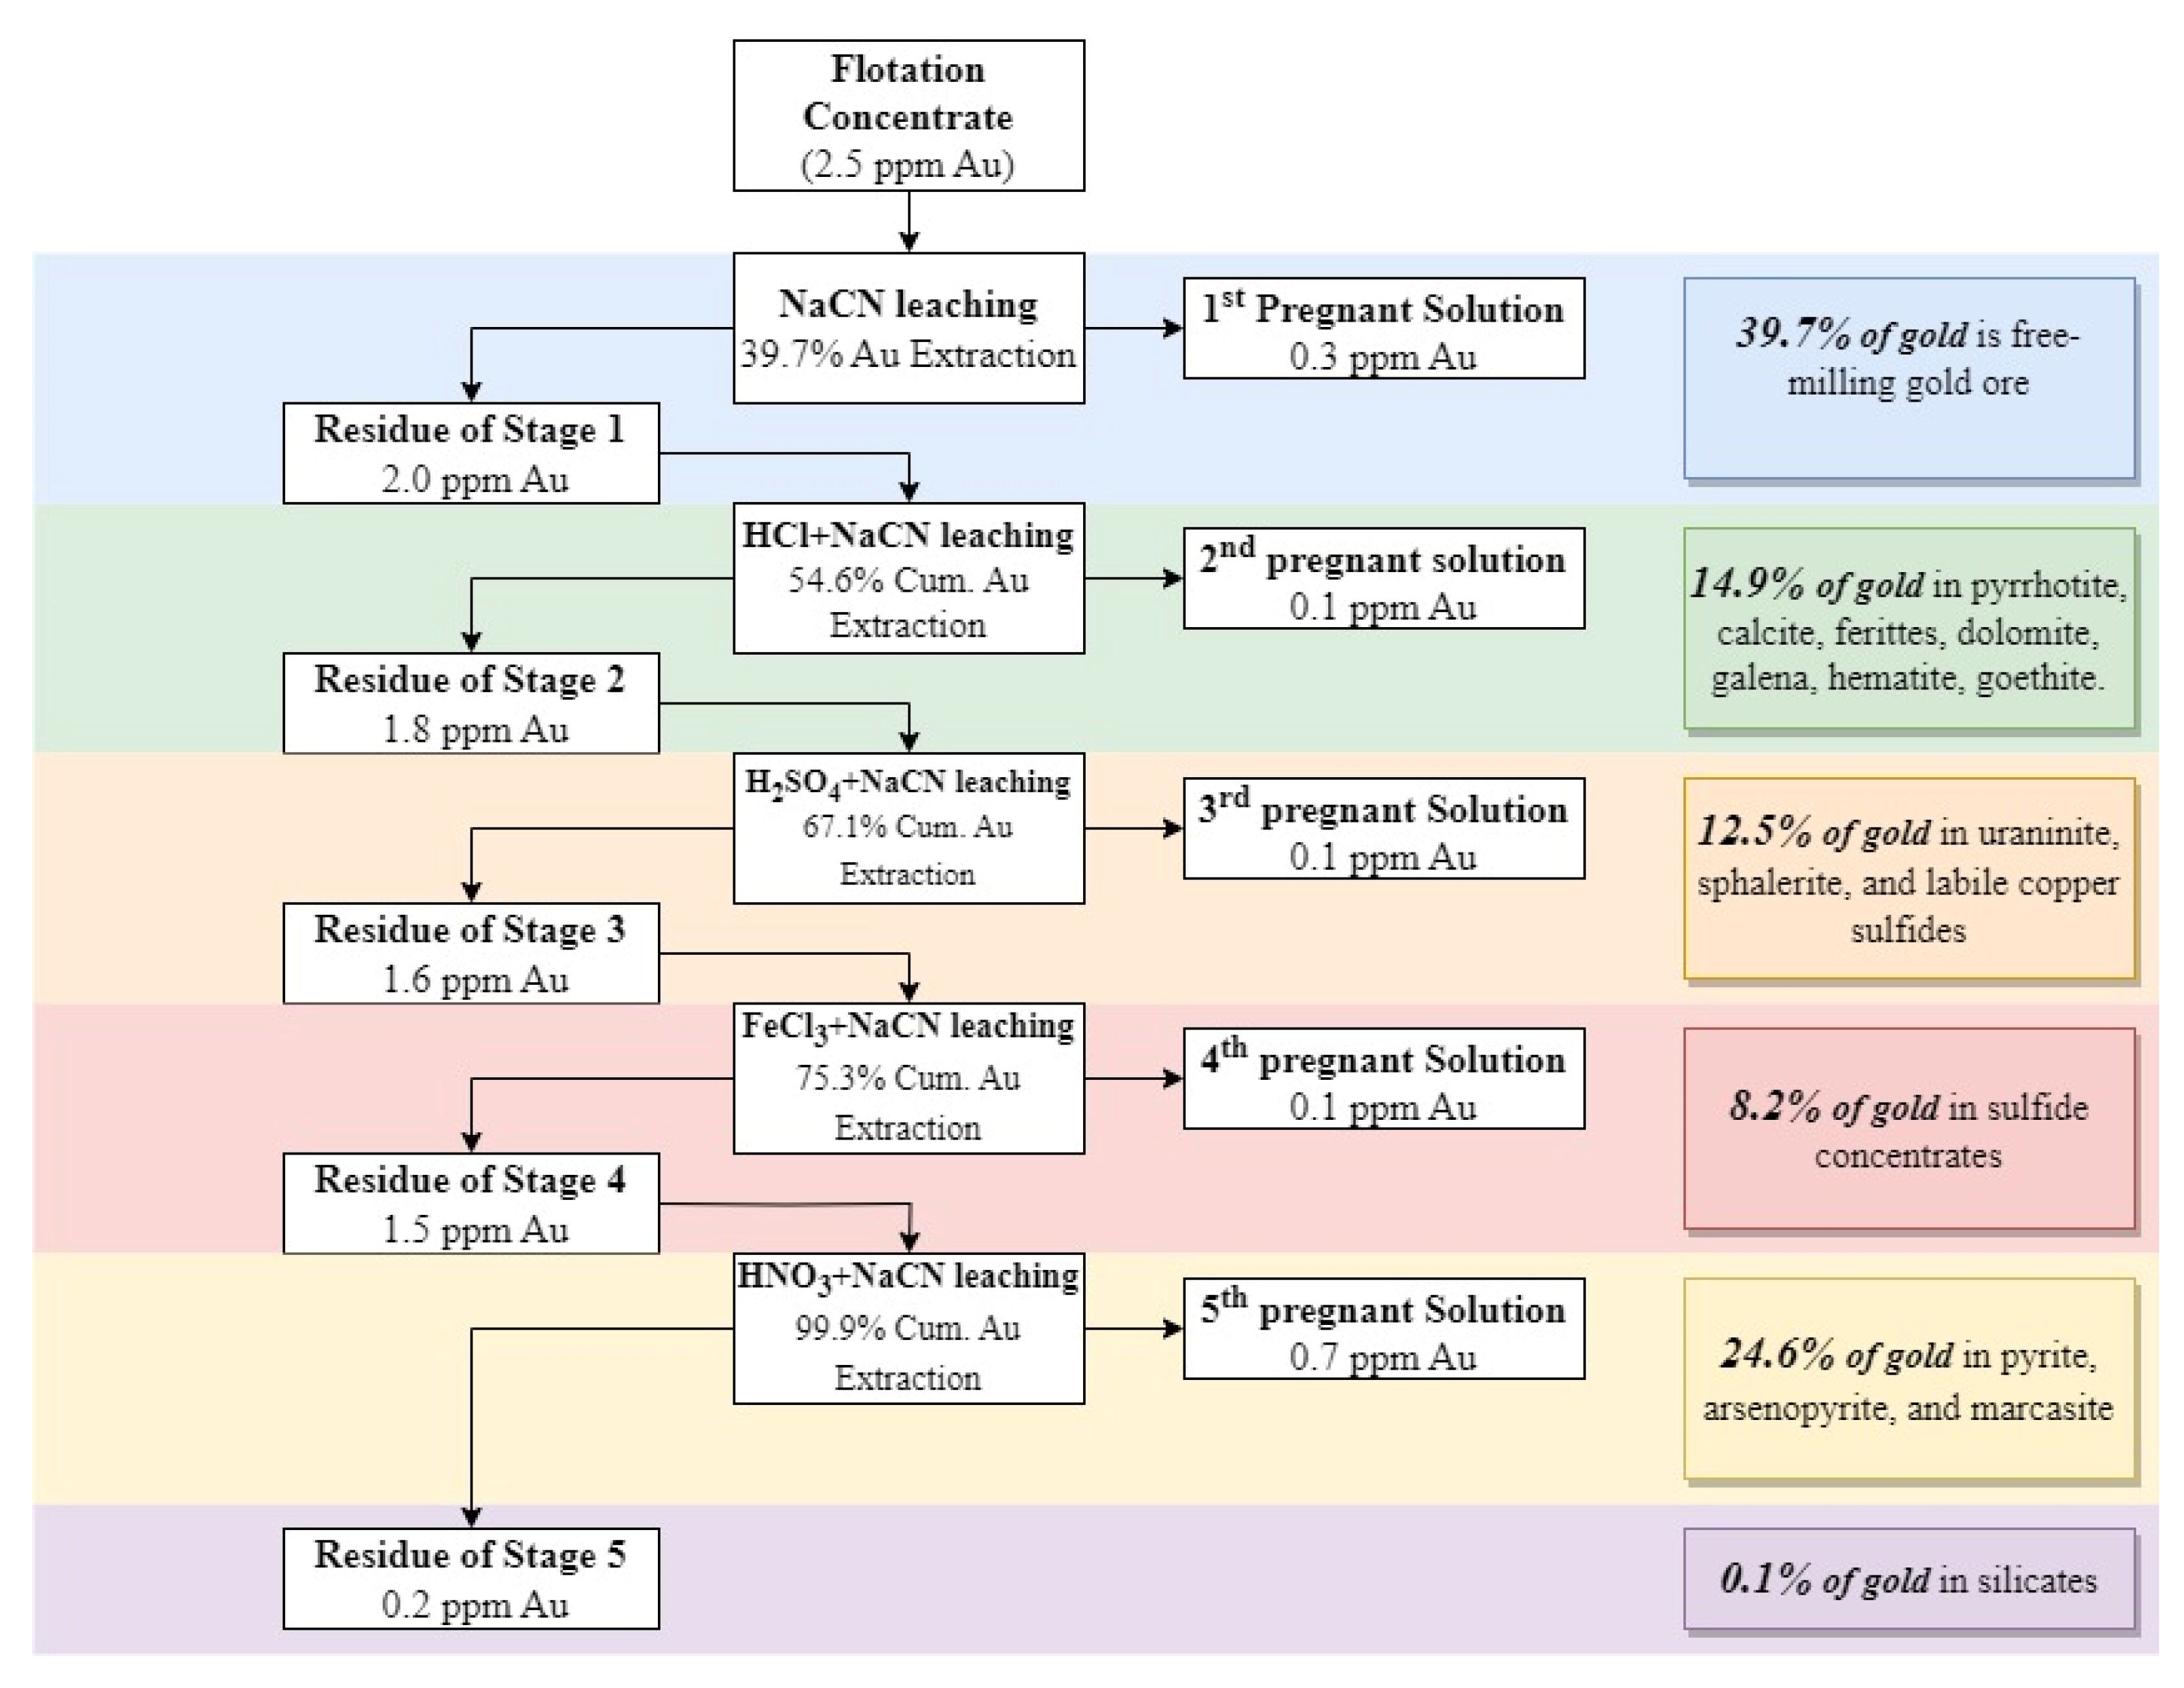
The standard procedure for diagnostic leaching was initially developed by Anglo American Research Laboratories in the 1980s [27]. The main purpose of each leaching stage during the diagnostic leaching test is to apply specific reagents to dissolve selected target minerals, liberate the gold, and then recover it with the cyanide leaching process. The first stage starts with conventional or intensive direct cyanide leaching. All stages, except the first one, occur in two leaching conditions, initially, acid treatment with a selected reagent, followed by cyanide leaching. NaCN leaching is commonly applied to dissolve free gold from destroyed minerals using oxidative/acidic leaching. The initial stage aims to dissolve as much as possible free-milling gold (leachable gold) under conventional or intensive leaching conditions such as high cyanide (CN) concentration, long leaching time, high pH, and high concentration of dissolved oxygen. The undissolved gold, which does not respond to cyanide dissolution in the first stage, is mostly in a refractory structure. This indeed shows that some mineralogical structures prevent interaction between cyanide and gold, and some oxidative reagents are required to provide this interaction. Acidic reagents are used for destroying target minerals in each stage. Lorenzen and Tumilty [27] addressed which reagent should be employed under specific conditions and published a guideline. According to their stepwise description, applied reagents and removed minerals are given in Table 1 [26,28] and chemical dissolution reactions of sphalerite and pyrite with specified reagents have been provided as examples in Equations (1) and (2) [28,29]. Test conditions, including solid rate, leaching time, reagent type, and concentration, can be varied depending on the material and operator as long as the target mineral(s) are entirely destroyed and the gold recovery is maximum for each stage. Also, it is not mandatory to apply all oxidative leaching reagents in Table 1. According to the guidelines, some oxidative leaching can be eliminated [27,28,30,31], and it is suggested to use a minimum number of acidic reagents for more accurate assessment [26,27,28,29,30,31,32,33]. In addition to Table 1, carbon in leach (CIL) can be applied to determine the preg-robbing effect [22]. Although acidic reagents can be selectable, almost all the studies in the literature have used the following three reagents: hydrochloric acid (HCl), sulfuric acid (H2SO4), and nitric acid (HNO3) [26,28,29,30,31,32,33,34,35]. In addition to these common three reagents, hydrofluoric acid (HF) has been used in the last stage to dissolve silicates [25,36,37,38], and in some procedures, the remaining residue was dissolved with the aqua-regia solution instead of HF after HNO3 leaching [34,39] or applied roasting at a high temperature to remove carbonaceous compounds in the residue [40].
ZnS + H2SO4 → ZnSO4 + H2S
2FeS2 + 10HNO3 → 2Fe3+ + 2H+ + 4SO42− + 10NO + 4H2O
The most critical challenge of diagnostic leaching is that the reagent dissolves not only one target mineral but also several associated minerals together with a different portion in one stage [35]. Therefore, combined diagnostic leaching with the mineralogical results allows mineral processors to interpret the ore characteristics more accurately and choose the appropriate processes for ore treatments.
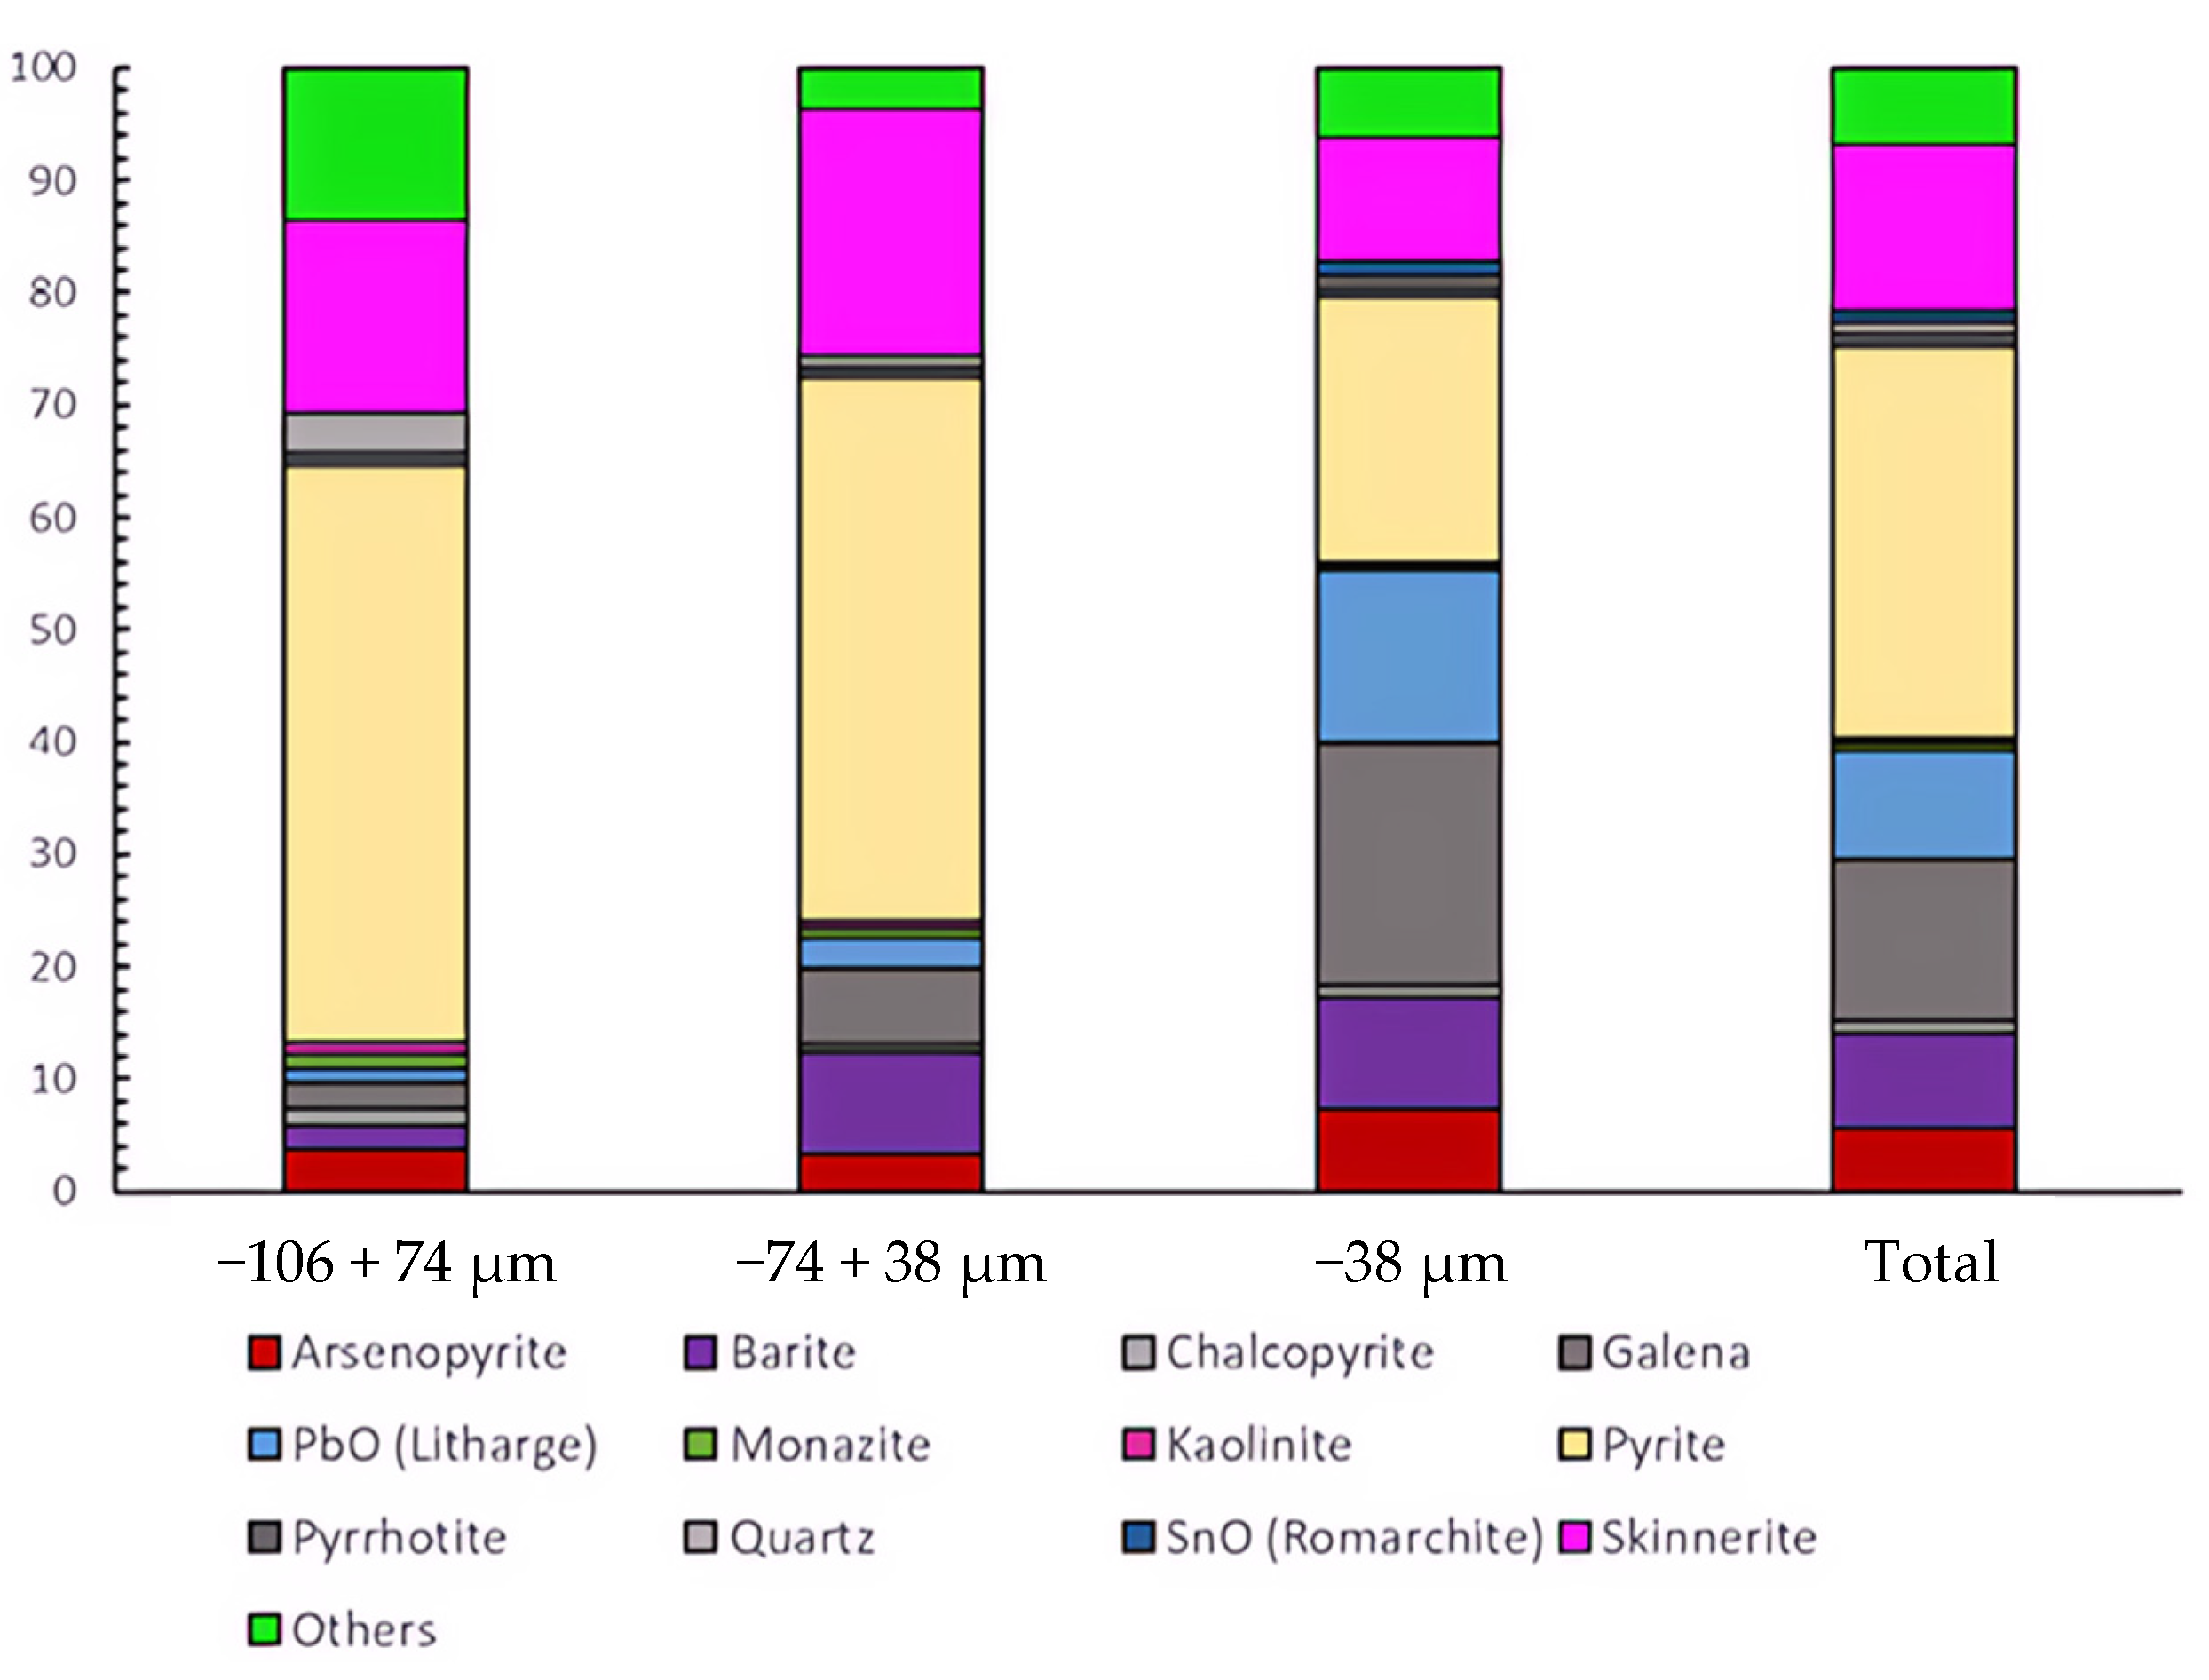
In the literature, as shown in Table 2, studies are conducted using different types of materials and various methods. As seen, most of these studies were mainly focused on the chemical treatments disregarding the mineralogical information that can play a complementary role in an ore characterization. In addition, most of these studies used primary resources such as refractory gold ore or complex gold ore. This is a matter of presentation for the current study. This research initially explains how an ore can be classified as refractory gold ore through experimental activities. It also includes practical studies on increasing the gold content. Furthermore, the research aims to characterize the bulk sulfide flotation concentrate of refractory gold ore using automated mineralogy and diagnostic leaching. To enhance the accuracy of characterization, the results obtained from diagnostic leaching are correlated and compared with automated mineralogy results. Thus, for the first time in the literature, diagnostic leaching and automated mineralogy are applied together to understand the processability of the flotation concentrate of refractory gold.

2. Materials and Methods

2.1. Materials and Sample Preparation

In this study, sample materials were collected from drill cores representing different depths of the sulfur zone of a low-sulfidation epithermal-type Au-Ag mineralization. The deposit studied in this research is located in north-western Turkey. However, the name of the mining company, the procedure of drilling, and details on the location are preserved due to confidentiality.
Each drill core sample was crushed with a lab-scale jaw crusher separately to a d80 of approximately 1.7 mm. The samples were later mixed with a cement mixer to create a final composite. Representative splits of the initial sample were collected with the grid sampling method for wet chemical and mineralogical studies. Gold and silver contents for each sample were analyzed using atomic absorption spectroscopy (AAS, PinAAcle 900f); inductively coupled plasma optical emission spectroscopy (Agilent 511 ICP-OES) and XRF were employed for other elemental compounds in the final composite. The amount of total S and C was determined with an induction furnace/infrared (IR) carbon sulfur analyzer (LECO CS230SH). The XRD analysis showed that detected phases were quartz, kaolinite, illite, pyrite, dolomite, and siderite. Elemental content of the initial material that was the feed of flotation before automated mineralogy and diagnostic leaching is detailed in Section 3.1.
The ore was divided into two parts using a riffle and split into 1 kg bags with Retsch Sample Divider PT100; 1 kg bags were grouped for grinding tests, sieve analyses, flotation, and leaching tests. The grinding optimization test was performed at the different grinding times with Lab Scale ESSA Rod Mill. The material was prepared with dry grinding in three different sizes, as d80 = 45 µm, 73 µm, and 106 µm, for direct cyanide leaching. The rest of the ore was stored to produce sufficient flotation concentrate as a requirement for starting diagnostic leaching tests. All prepared materials were sealed and stored in a fridge below −16 °C.

2.2. Methods

2.2.1. Cyanide Leaching Tests

In the cyanide leaching experiments, conventional bottle roll tests were performed to investigate leaching behaviors and understand the ore’s refractory nature. Experimental tests were performed with 450 g of initial amount material per test in three different particle sizes (i.e., d80 = 45 μm, d80 = 73 µm, and d80 = 106 µm), five different leaching time intervals (i.e., 2, 8, 24, 48, and 72 h), constant solid ratios (45% (w/w)), and an initial cyanide (Merck GmbH, ≥95.0 purity and 49.01 g/mol) concentration of 1000 kg/t at an alkaline medium (pH = 10.5–11.0). The pH, dissolved oxygen (DO) level, and free cyanide consumption into the solution were monitored at certain time intervals (2, 8, 24, and 48 h). If necessary, NaCN and lime were used for cyanidation and pH adjustments, respectively. A pH meter (WTW 315i) was used for its measurements, and a DO-meter (WTW Oxi 3205) was utilized for dissolved oxygen measurements. A silver nitrate (AgNO3) titration mechanism was performed using the Bottle-Top Burette Titrette procedure to determine the free cyanide concentration in the saturated solution. In addition to understanding the refractory nature of the ore, the optimum leaching condition was determined based on the cyanide leaching tests for further applications, such as flotation and diagnostic leaching.

2.2.2. Flotation Tests

Flotation is a well-known method for upgrading sulfide ores with low gold content [41,42,43,44,45,46]. As the gold grade of the ore was very low, it was planned to upgrade the gold content with bulk sulfide flotation. For this purpose, several flotation experiments under different operating conditions were performed. The experimental condition to achieve the highest gold content in concentrate was selected and repeated to produce enough bulk concentrate as feed material for the diagnostic leaching tests; optimizing the flotation process for current material is not the scope of this study. The flotation experiments were performed in a 2.5 L mechanically agitated Denver® flotation machine with 850 g of material (30% w/w solid ratio). The pulp was agitated at a rate of 1400 rpm, pH was adjusted to 8–9 using Ca(OH)2, tap water was used for all experiments, and 25 g/t of thionocarbamate (Solvay AERO® MX980) and 25 g/t of a potassium amyl xanthate (PAX) mixture were added at each stage as collectors. Aeration was regulated at a rate of 2 L/min for 5 min during the flotation with a conditioning time of 3 min in two rougher stages. The concentrate was floated in two stages for 5 min.

2.2.3. Automated Mineralogy Analysis

In this study, the main focus of automated mineralogical analyses (AM) was to locate, identify, and define textural properties of the gold and the different particles carrying gold. Minor focus was given to the overall mineralogical properties of the flotation concentrate. Gold deportment was investigated in terms of liberation/locking and grain sizes of host gold minerals, the mineral association of gold-containing particles, gold distribution using mineral grains, and indicator elements for gold. It is also important to emphasize that the material used for both AM and diagnostic leaching is flotation concentrate produced with the method explained in Section 2.2.2., not the initial material created with mixed drill core samples. It is worth noting that, because of the low concentration of gold, a Knelson centrifugal concentrator was used for preconcentration in order to increase the possibility to detect gold during the analysis.
The material was sieved into three different size fractions, −106 + 74 μm, −74 + 38 μm, and −38 μm, and each fraction was split to an appropriate mass and blended with graphite at a particular portion following the procedure given by Røisi and Aasly [47]. Further, the sample/graphite mix was mixed with epoxy resin (EPO-TEK® 301, Billerica, MA, USA) to produce a regular 25 mm polished section. After curing, each 25 mm section was cut into four cross sections that were re-molded into one 30 mm block per fraction using epoxy resin; 30 mm polished sections were created and carbon-coated before the SEM analyses. Automated mineralogy analyses were conducted at the Norwegian Laboratory for Minerals and Materials Characterisation (MiMaC, Piovene Rocchette, Italy) facility at the Department of Geoscience and Petroleum, NTNU, Norway. A ZEISS Sigma 300 FE SEM was used for BSE imaging, a Bruker XFlash 6–60 EDS detector for EDS analyses, and ZEISS Mineralogic Mining© software for quantitative automated mineralogical analyses. Mapping a full polished section at a small step size would require an unfeasibly long acquisition time. To locate and identify gold and host minerals, a bright phase search (BPS) routine was first applied to the sample by utilizing grey-level thresholding on the backscattered electron (BSE) images to discriminate gold, which has a high atomic mass and accordingly, light grey levels, from other mineral phases with lower atomic masses (low grey levels). Setting the threshold limits to include only these targeted brighter sulfide phases, analysis time is significantly reduced. However, knowing the minerals hosting the bright phases is of great importance, and therefore, as an additional step of enlarging the analyzed area around the grains of interest, the dilation routine was added to the image processing set up. This dilation routine adds a defined number of pixels to the periphery of the selected area. Hence, it enables measurement to be expanded to a rim of the minerals that host the bright phases. To avoid unnecessary measuring of epoxy, thresholding and other arithmetic image processing scripts are applied to exclude epoxy resin and fractures in the analyzed area.
Microscope settings were set to a 20 kV acceleration voltage, 0.009 s dwell time, minimum of 2000 spectrum counts, and 2.5 μm step size/pixel size for the full grain mapping and 0.6 μm for BPS analyses. the degree of liberation of grain was classified as follows: if it is greater than 90%, it is considered “liberated”; if it falls between 30% and 90%, it is categorized as “middling”; and if it is less than 30%, it is classified as “locked”. This classification is based on the mineral liberation determined with the partial perimeter.

2.2.4. Diagnostic Leaching Tests

The XRD analysis of feed material provides important preliminary information to determine the minimum number of stages, select reagents, and design the whole experiment for the diagnostic leaching test. The XRD analysis shows that the studied sample, which was feed of flotation, comprises quartz, kaolinite, illite, pyrite, dolomite, and siderite. Table 1 shows minerals dissolved using which reagents [27,28]. According to Table 1, and the known mineralogical and chemical properties of the run-of-mine (ROM) ore, HCl was selected due to its effectiveness against a wide range of carbonatite minerals, and H2SO4 was beneficiated to dissolve unstable metallic sulfides and specifically labile pyrite. The diagnostic leaching test conditions are given in Table 3. Ferric leaching is not commonly used, but it is suggested when the sample has sulfide concentrates. According to Lorenzen’s guideline, when the sample contains over 10% of any of these minerals—tetrahedrite, galena, sphalerite, or concentrated pyrite—it is recommended to apply a ferric solution (100 g/L FeCl3 + 2 M HCl) before cyanide leaching [28]. Since the material applied in this study was a sulfide flotation concentrate, ferric leaching was added to the leaching sequence. HNO3 was selected as the most critical reagent because the ROM ore contained pyrite and a significant amount of pyrite was floated during the flotation. Therefore, it was estimated that the highest increase in gold extraction should be in the last two stages.
In the first stage of diagnostic leaching, a 24 h cyanide leaching process was carried out with a 5 kg/t NaCN concentration at a pulp with a solid ratio of 45% (w/w) and pH of about 11.5–12.0. The concentration of dissolved oxygen was in the range of 25–30 ppm. The reason for the aggressive leaching condition was to achieve maximum dissolution at room temperature (25 ± 3 °C) within 24 h of leaching time. High cyanide and oxygen concentrations shortened the leaching time and increased the leaching kinetics. The main purpose of diagnostic leaching was not to indicate an optimum condition for the gold extraction, but rather to transfer as much gold as possible to the liquid phase. The dissolved gold of the first stage represents leachable gold (free-milling gold).
All acidic leaching tests were conducted in an IKA LR-2.ST laboratory reactor with a 2 L glass reactor vessel surrounded by a heating bath. A mechanical stirrer was placed in the middle of the vessel at the reactor’s top using a remote controller. All acidic treatments were conducted at 100 rpm, and the temperature was controlled with an IKA HBR-4 heating bath. The reactor setup was located under a laboratory fume hood. After completing the leaching process, the residue was dewatered with a lab-scale press filter, and the sample solution was taken from the pregnant solution for the chemical analysis. The residue cake was dried at 50 °C for 24 h and washed with water two times and dried again at the same condition; it is important to remove all the remained acidic reagents from the cake to avoid a potential reaction between acidic reagents during subsequent leaching. The final dried solid residue was powdered, and the representative samples were taken for chemical analyses. The material that was applied to acidic leaching was a sulfide concentrate. Therefore, it was necessary to be careful of possible gas emissions and overflowing of the pulp during the contact between the acidic leach solution and the material, especially during HNO3 leaching. This attention was important for both work safety and the consistency of test results.

3. Results and Discussions

3.1. Feed Properties

The feed sample analyses using the ICP-OES and LECO showed that the sample contained 0.7 g/t of Au, 1.25 g/t of Ag, and 2.5% of total sulfides, where the detailed chemical composition is given in Table 4. The XRF analysis of the sample indicated the presence of SiO2 as the most abundant phase; kaolinite, illite, pyrite, dolomite, siderite, and other minerals were encountered using a Rigaku X-ray diffractometer (XRD, D/Max-IIIC).

3.2. Cyanide Leaching and Flotation

Chemical (XRF, AAS, and ICP-OES) and mineralogical (XRD) analyses of the feed sample confirmed that the ore is a low-grade gold ore with 0.7 g/t of Au (Table 4). Cyanide leaching tests in different conditions were performed to understand ROM ore’s leaching properties. As Table 5 shows, it was observed that the maximum gold recovery was below 40% as a result of cyanide leaching tests performed in three different particle sizes (d80 = 45, 73, and 106 µm) and up to 72 h. Therefore, the ore was classified as high-refractory gold ore according to La Brooy’s classification [8]. It was observed that both the gold extraction recovery and the cyanide consumption of the ores with d80 sizes of 45 µm and 73 µm were very close to each other, and the gold recovery in tests with a sample d80 of 106 µm was the lowest compared to two other sizes. Table 5 shows that the gold recovery and reagent consumption increased as the particle size became finer. The rise in the recovery in gold extraction after 24 h is relatively low for all three sizes. Therefore, the optimum leaching time was decided as 24 h, and the leaching size 73 µm was chosen as a consequence of the cyanide leaching tests.
After ensuring that the ore is a high-refractory gold ore and contains relatively high S content, bulk sulfide flotation was employed as a pretreatment method in order to increase Au content. It was recognized that 92% of the total sulfide was recovered with the flotation tests with a mass pull (also known as yield defined as concentrate mass divided by the feed mass) of 15.9%. The initial content of S was 2.5% and increased to 18.4%. Gold content, which was 0.7 ppm, increased to 2.5 ppm with a 59% recovery. The application of the flotation is not to optimize the flotation parameters but to increase the Au content of the feed. According to these conditions, the final flotation concentrate, which is the feed of the diagnostic leaching, included the 2.5 ppm Au content. The flotation test results are given in Table 6.

3.3. Automated Mineralogy (AM)

As a result of the automated mineralogy study, a bulk mineralogy, BSE image, colored mineral map, liberation degree for every mineral, trace element analysis for gold, and elemental gold deportment in minerals were obtained. The bulk mineralogical composition of the flotation concentrate (feed material of diagnostic leaching) gathered as a result of the based-on AM analysis is given in Figure 1. According to the results, the most dominant mineral in the sample is pyrite for each size fraction. In addition to pyrite, galena, arsenopyrite, skinnerite, barite, and quartz were encountered in different quantities. Pyrite was found at 51.4 wt% in the −106 + 74 µm, 48 wt% in the −74 + 38 µm, and 28 wt% in the −38 µm size fractions. Overall, pyrite constitutes 34.9 wt% of the total, while the portion of other minerals in the material is as follows: galena, 14.4 wt%; skinnerite, 14.9 wt%; barite, 8.5 wt%; arsenopyrite, 5.6 wt%; and quartz, 1.1 wt%. After comparing the XRD result of ROM ore with flotation concentrate, it was observed that the mineralogy of the materials changed drastically after flotation; sulfides are the most dominant fraction in the concentrate while most of the silicates remained in tailing. Quartz content was around 59 wt% before flotation, and the highest quartz content after flotation was 3.5 wt% in the range of −106 + 74 µm. It was presented that 2.9 wt% of gold is dispersed in quartz; on the other hand, the amount of gold remaining in silicates after diagnostic leaching is below 1 wt%. These two results show that gold is not dispersed within the quartz in a significant portion.
In automated mineralogy using ZEISS Mineralogic, minerals are classified based on energy-dispersive X-ray spectroscopy (EDS) and are quantified based on their chemical composition. Additionally, mineral maps were generated for each sample. In Figure 2, examples of mapped particles are given for pyrite, feldspar, quartz, muscovite, ilmenite, and chalcopyrite grains.
In terms of the mineral liberation analysis (Figure 3), pyrite was chosen as the target mineral for three reasons; the material contains a very limited amount of visible gold, the dominant mineral after flotation is pyrite, and a large portion of the invisible gold that is sub-microscopic-size gold as explained in the Introduction section disseminated as inclusion in pyrite. It was observed that a significant amount of pyrite in the concentrate was liberated based on the liberation definition, which is a partial perimeter explained in Section 2.2.3. Pyrite is free with 47.7 wt%, 46.8 wt%, and 69.8 wt% liberation degrees between −106 + 74 µm, −74 + 38 µm, and −38 µm size fractions, respectively.
As galena has a relatively similar average atomic number to gold, its grains were frequently picked up using the BPS. On the other hand, BPS as an analyzing method worked very well to detect micron-sized grains of bright phases; however, a limited amount of the visible electrum and Au grains was detected (Figure 4). Invisible gold occurring as traces in different mineral grains is given in Figure 5.
Automated mineralogy provides detailed particle and grain maps and tables based on elemental content. It can be determined for a particular mineral in what quantities Au is detected with other elements. This detailed analysis provides an opportunity to make a trace element analysis for gold. After examining the correlation of Au with other elements in the samples, the most detected trace elements along with Au are copper (Cu), aluminum (Al), cobalt (Co), antimony (Sb), tin (Sn), and arsenic (As).
According to the AM results, 63.7 wt%, 3.5 wt%, 2.0 wt%, 5.2 wt%, 10.8 wt%, and 2.9 wt% of the gold are deported in pyrite, galena, arsenopyrite, skinnerite, barite, and quartz (Figure 6); also, an important amount of the gold exists in the form of invisible gold. This result clarifies the cause of the ore’s refractoriness and low gold solubility. Also, a low portion of the gold (1.8 wt%) was locked inside the grouped phases with mixed spectra dominated with Fe and Si that was grouped as an Fe-Sil mix (only a few gold and electrum grains could be detected, and cyanide could still dissolve around 40 wt% of gold in the material after flotation). Although the current investigation did not cover it, Mössbauer spectroscopy can provide additional information about invisible gold using electronic interactions of gold atoms with various materials.

3.4. Diagnostic Leaching

In the first stage of diagnostic leaching, NaCN leaching was completed with 39.7% Au extraction, and the residue of NaCN leaching contained 2.0 ppm of Au. HCl (12 vol%) was applied in the second stage where its residue was leached using the NaCN. Through this stage, 14.9% of total gold was liberated from its host mineral. Since carbonates like dolomite were detected with the XRD analysis of the ROM sample, the presence of such minerals could potentially cause gold extraction of 14.9% at this stage, where the gold extraction increased up to 54.6% at the end of the second stage.
H2SO4 leaching was performed as the third stage, and it was aimed to dissolve labile (unstable) metal-bearing minerals, labile copper sulfides, and pyrite to release gold locked inside these matrices. Cumulative gold extraction increased to 67.1% after this stage, while the gold content in the residue decreased to 1.5 ppm with the NaCN leaching after H2SO4 treatment. This result showed that 12.5% of the gold in this concentrate could not interact with the cyanide due to the presence of minerals like uraninite, sphalerite, and labile metal sulfides.
At the fourth stage of diagnostic leaching, FeCl3 treatment was applied to dissolve pyrite. The critical point of ferric leaching was that the Eh had to be above 500 mV. Hydrogen peroxide (H2O2) was used to increase the Eh of the system, but ferric chloride (iron (III) chloride) treatment was not enough to dissolve pyrite in the concentrate. Only 8.2% of total gold was liberated with FeCl3 and lower than estimates made before the experimental study. As mentioned in Section 2.2.4, HNO3 is the key reagent to dissolve various metal sulfides that tend to be associated with gold, such as pyrite and arsenopyrite, as it was mentioned in Section 2.2.4., because material was a sulfide flotation concentrate. According to the results, the highest mass loss and gold liberation happened during stage five (HNO3 + NaCN leaching), 24.4% of the material left the system, and 24.6% of gold was dissolved and extracted with the last cyanide leaching step. Figure 7 shows the gold extraction of each stage and the Au content of all products. After stage five, the final residue included 0.02 ppm of Au, meaning that silicates and other undissolved entities embedded only 0.02 ppm of total Au. Thus, HF treatment was not required.
The results shown in Figure 7 indicate that 39.7% of the total gold was leachable with direct cyanide leaching. In addition, approximately 14.9% of the gold could not be dissolved with direct cyanide leaching in stage two because it was enclosed inside minerals such as pyrrhotite, calcite, dolomite, hematite, and goethite. Stage three showed that sphalerite and unstable copper sulfides hosted approx. 12% of the gold to prevent dissolution with cyanide. The portion of the gold located in the unstable sulfide concentrates, which was expected to be predominantly pyrite, was approximately 8% based on stage four. The most dominant host mineral was indicated as pyrite, as approximately 25% of the gold was released after HNO3 dissolution of pyrite and arsenopyrite; when considering the AM results based on stage four and stage five, it can be summarized that approximately 33% of the gold was enclosed in the pyrite. One thing that is worth emphasizing is that diagnostic leaching alone does not give accurate results, but shows groups with more than one mineral, based on Table 1. That is why mineralogical characterization is necessary for more accurate results. Otherwise, a metallurgist cannot indicate whether the gold is in pyrite, arsenopyrite, or marcasite, as in stage five.

4. Conclusions

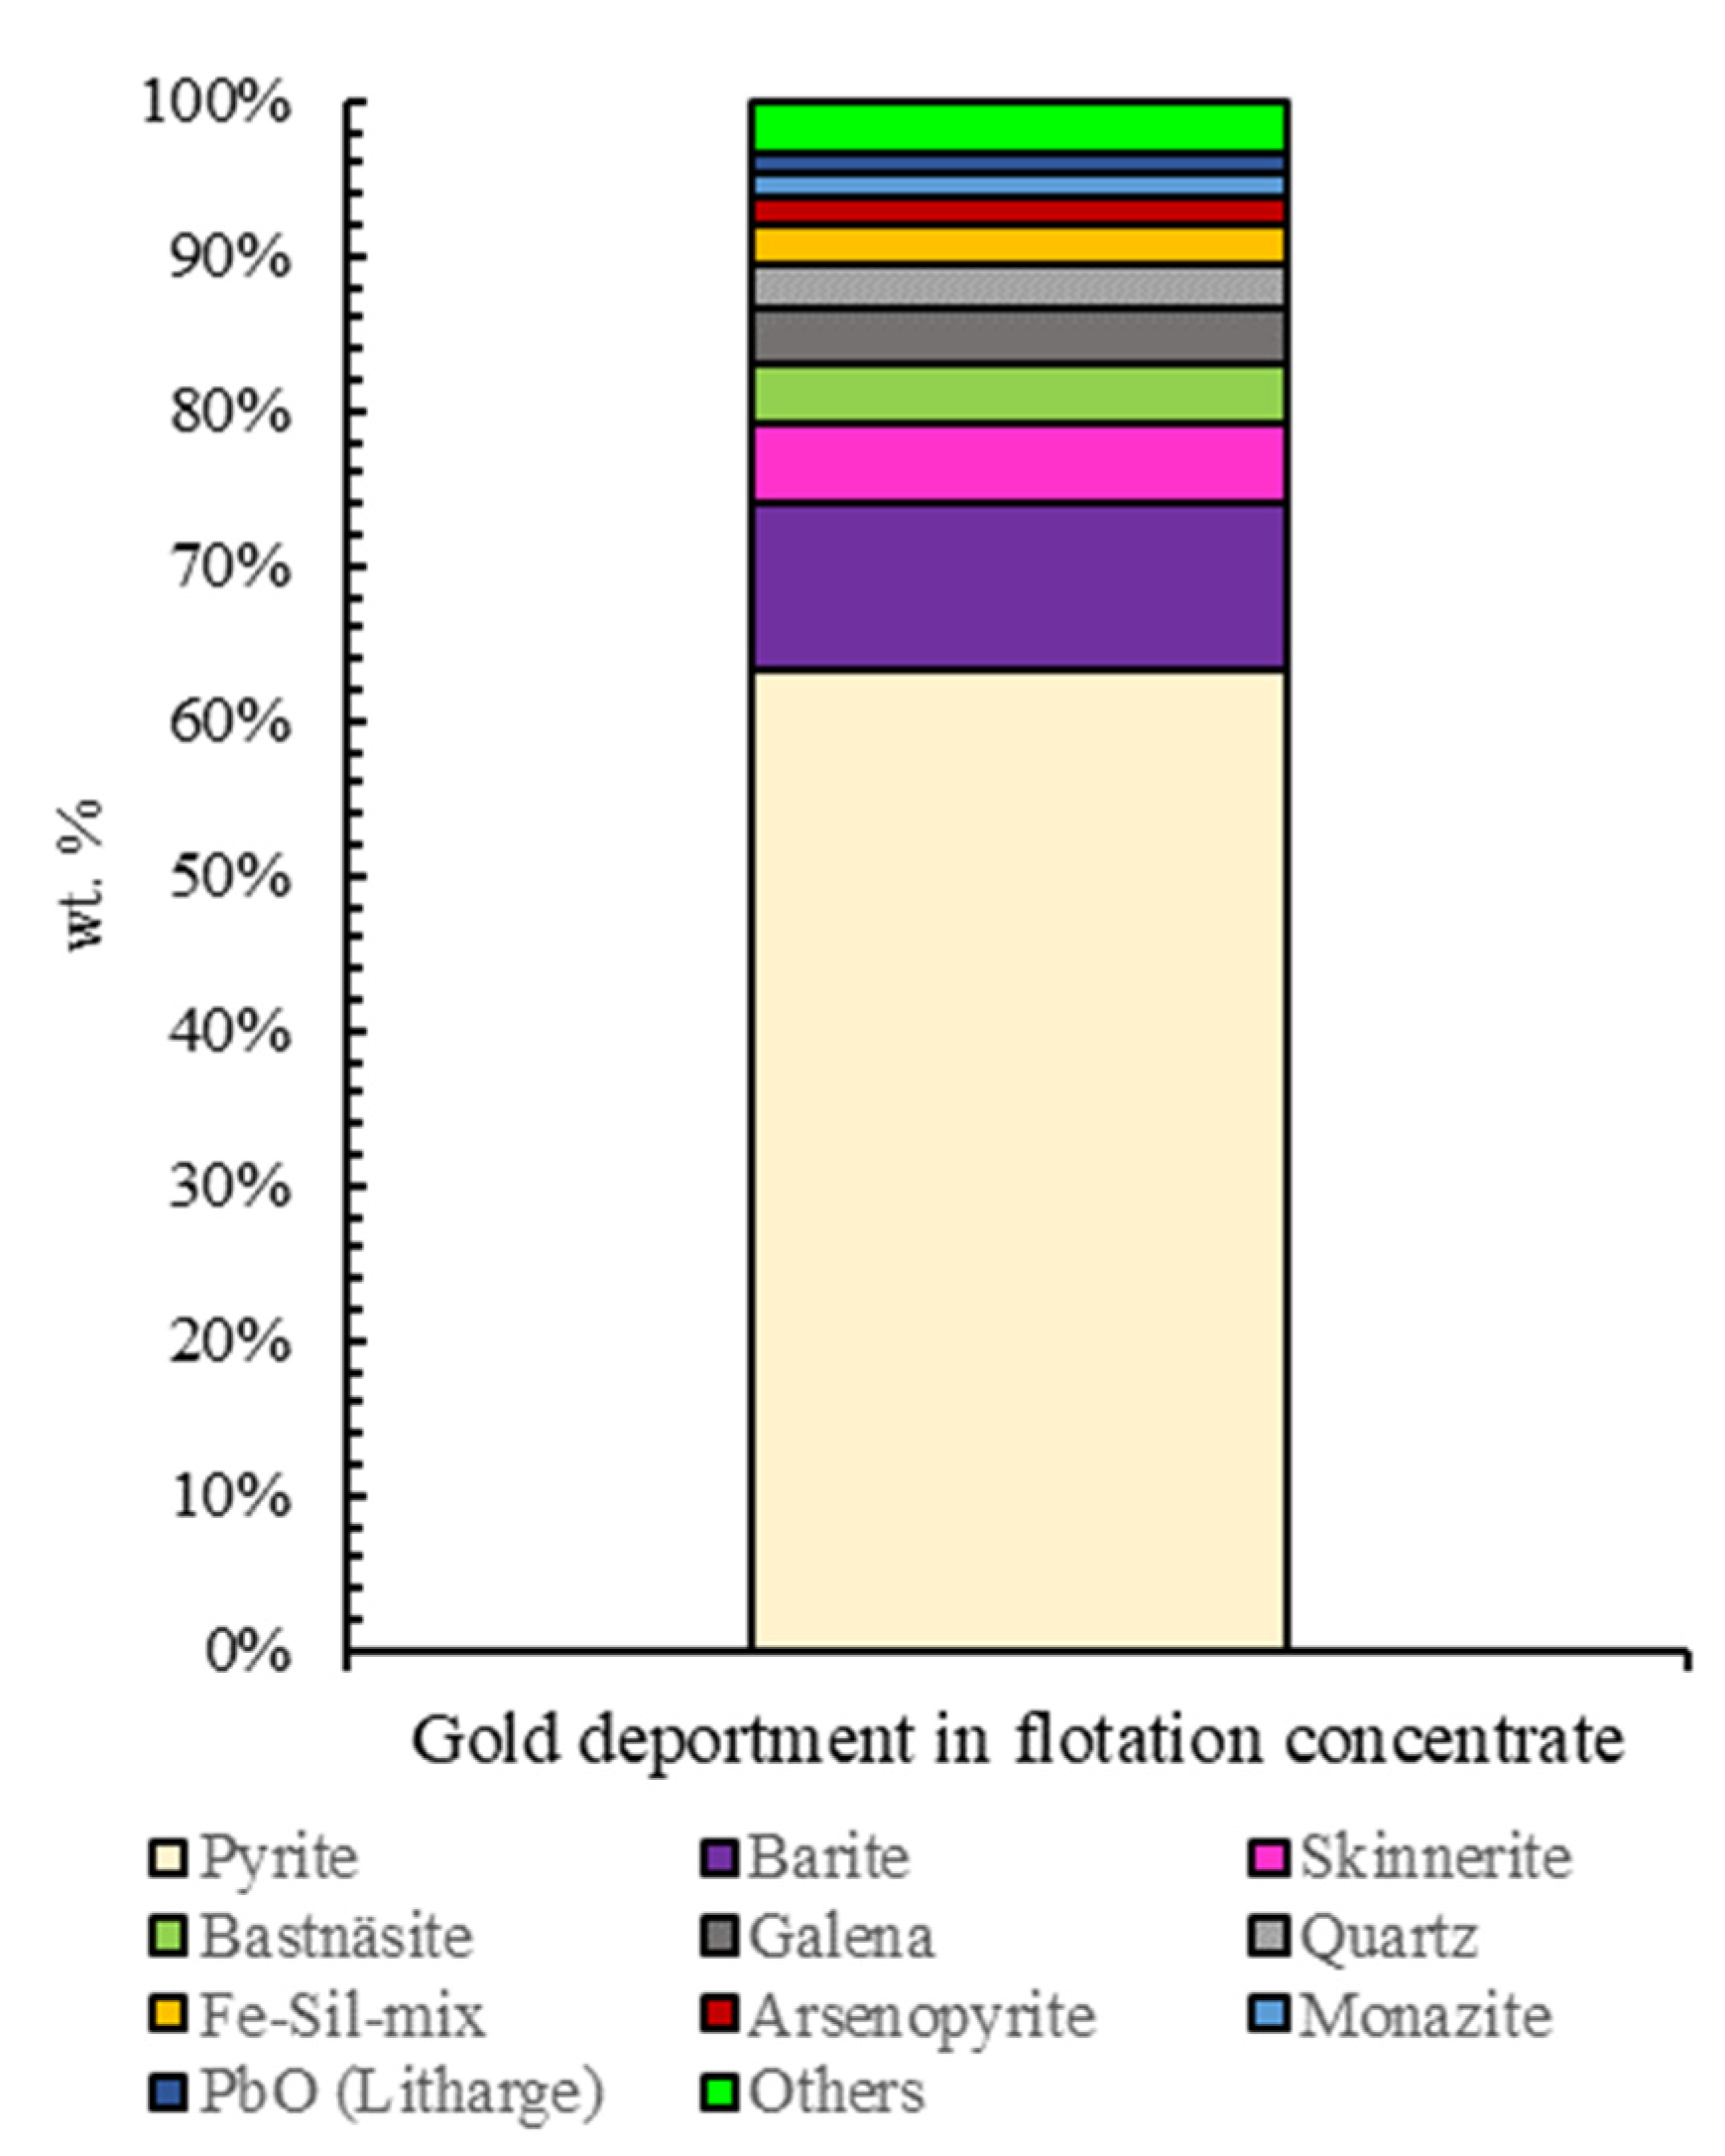
The main purpose of the study was to evaluate flotation concentrate in terms of refractoriness by performing diagnostic leaching and correlating results with automated mineralogy. This study successfully demonstrated that diagnostic leaching could be used as a fast and practical alternative analysis method not only on the ROM ore but also for flotation concentrate. The diagnostic leaching revealed the refractory property of the material with the first stage, which was direct cyanide leaching, and the automated mineralogy explained the reasons for this refractoriness. In the case of Au in S-bearing minerals, flotation was introduced as a very simple and effective method to concentrate Au, but the increase in the Au content in the material did not indicate that the material is easy to process.
Diagnostic leaching should be performed in a particular order, but it was a very flexible method; the mineralogical analysis was the key point for reagent selection in designing diagnostic leaching sequences and conditions. Acidic reagents could dissolve more than one mineral simultaneously; therefore, using only this method can be misleading. Applying advanced and detailed mineralogical studies such as automated mineralogy with diagnostic leaching was found to be useful for gold deportment study. Although diagnostic leaching provides practical and direct indicators of the material’s processability, automated mineralogy provides very detailed information not only about gold deportment but also minerals present in the gangue other than the gold-bearing minerals, and it is able to affect further processing of concentrate.
Since refractory structures of this concentrate were defined with both diagnostic leaching and automated mineralogy, further studies, including pretreatment processes such as pressure oxidation, Nitrox/Redox, or bioleaching, should be examined, and integration between flotation and those pretreatment methods should be investigated in terms of technical and economic aspects as well. Moreover, an alternative reagent to cyanide, meaning a solvent with a lower environmental impact, should be integrated into the diagnostic leaching test procedure.

Author Contributions

Conceptualization, M.K.G. and G.B.; methodology, M.K.G., G.B., S.L. and K.A.; software, M.K.G. and S.L.; validation, G.B., S.L. and K.A.; formal analysis, M.K.G. and A.H.; investigation, M.K.G.; resources, M.K.G.; data curation, M.K.G. and S.L.; writing—original draft preparation, M.K.G. and A.H.; writing—review and editing, M.K.G., G.B., S.L., A.H. and K.A.; visualization, M.K.G.; supervision, G.B. and K.A.; project administration, K.A.; Funding acquisition, K.A. All authors have read and agreed to the published version of the manuscript.

Funding

This project was partially funded by the Norwegian Laboratory for Mineral and Materials Characterisation, MiMaC, with a project number of 269842/F50.

Data Availability Statement

The presented data will be available per request.

Acknowledgments

The Research Council of Norway is acknowledged for the support to the Norwegian Laboratory for Mineral and Materials Characterisation, MiMaC, project number: 269842/F50. The first author thanks Sercan Sevgul, who is a metallurgical superintendent from Koza Gold Cooperation, for his theoretical and technical help. In addition, the first author would like to thank Przemyslaw B. Kowalczuk (Pshem), his PhD supervisor at NTNU, for his constant support of this manuscript. We are truly thankful to Istanbul Technical University and the staff of the Mineral Processing Engineering Department for their continuous assistance.

Conflicts of Interest

The authors declare no conflict of interest.

References

  1. Lakshmanan, V.I.; Gorain, B. Innovations and Breakthroughs in the Gold and Silver Industries; Springer: Cham, Switzerland, 2019; p. 288. ISBN 978-3-030-32551-0. [Google Scholar] [CrossRef]
  2. Hassanzadeh, A.; Safari, M.; Hoang, D.H.; Khoshdast, H.; Albijanic, B.; Kowalczuk, P. Technological assessments on recent developments in fine and coarse particle flotation systems. Miner. Eng. 2022, 180, 107509. [Google Scholar] [CrossRef]
  3. Afenya, P. Treatment of carbonaceous refractory gold ores. Miner. Eng. 1991, 4, 1043–1055. [Google Scholar] [CrossRef]
  4. Akçıl, A.; Çiftçi, H. Pretreatments Applied to Refractory Gold Ores. Sci. Min. J. 2009, 48, 17–30. [Google Scholar]
  5. Asamoah, R.; Amankwah, R.; Addai-Mensah, J. Cyanidation of refractory gold ores: A review. In Proceedings of the 3rd UMaT Biennial International Mining and Mineral Conference, Tarkwa, Ghana, 30 July 2014. [Google Scholar] [CrossRef]
  6. Yüce, A.E. Cevher Hazırlama el Kitabı, 1st ed.; Önal, G., Ateşok, G., Perek, K., Eds.; Yurt Madenciliğini Geliştirme Vakfı: Istanbul, Turkey, 2014; pp. 425–450. [Google Scholar]
  7. Marsden, J.; House, I. The Chemistry of Gold Extraction, 2nd ed.; SME: Denver, CO, USA, 2006; pp. 19–68. [Google Scholar]
  8. La Brooy, S.R.; Linge, H.G.; Walker, G.S. Review of gold extraction from ores. Miner. Eng. 1994, 7, 1213–1241. [Google Scholar] [CrossRef]
  9. Komnitsas, C.; Pooley, F. Mineralogical characteristics and treatment of refractory gold ores. Miner. Eng. 1989, 2, 449–457. [Google Scholar] [CrossRef]
  10. Chen, T.; Cabri, L.; Dutrizac, J. Characterizing gold in refractory sulfide gold ores and residues. JOM 2002, 54, 20–22. [Google Scholar] [CrossRef]
  11. Reich, M.; Kesler, S.E.; Utsunomiya, S.; Palenik, C.S.; Chryssoulis, S.L.; Ewing, R.C. Solubility of gold in arsenian pyrite. Geochim. Cosmochim. Acta 2005, 69, 2781–2796. [Google Scholar] [CrossRef]
  12. Yannopoulos, J.C. (Ed.) Treatment of Refractory Gold Ores. In The Extractive Metallurgy of Gold, 1st ed.; Springer: New York, NY, USA, 1991; pp. 79–110. [Google Scholar] [CrossRef]
  13. Butcher, A.R.; Helms, T.A.; Gottlieb, P.; Bateman, R.; Ellis, S.; Johnson, N.W. Advances in the quantification of gold deportment by QEMSCAN. In Proceedings of the Seventh Mill Operators Conference, Kalgoorlie, Australia, 12–14 October 2000. [Google Scholar]
  14. Baum, W.; Lotter, N.O.; Whittaker, P.J. Process Mineralogy–A New Generation for Ore Characterization and Plant Optimization. In Proceedings of the SME Annual Meeting, Denver, CO, USA, 23–25 February 2004; pp. 23–25. [Google Scholar]
  15. Fandrich, R.; Gladys, O. Modern SEM based quantitative mineralogy. Acta Microsc. 2007, 16, 44–45. [Google Scholar]
  16. Malvik, T. History and growth of modern process mineralogy. Mineralproduksjon 2014, 5, A1–A19. [Google Scholar]
  17. Zhou, J.; Gu, Y. Geometallurgical characterization and automated mineralogy of gold ores. In Gold Ore Processing; Elsevier: Amsterdam, The Netherlands, 2016; pp. 95–111. [Google Scholar]
  18. Fernandes, I.B.; Rudolph, M.; Hassanzadeh, A.; Bachmann, K.; Meskers, C.; Peuker, U.; Reuter, M.A. The Quantification of entropy for multicomponent systems: Application to microwave-assisted comminution. Miner. Eng. 2021, 170, 107016. [Google Scholar] [CrossRef]
  19. Gu, Y. Automated scanning electron microscope based mineral liberation analysis: An introduction to JKMRC/FEI mineral liberation analyser. J. Miner. Mater. Charact. Eng. 2003, 2, 33–41. [Google Scholar] [CrossRef]
  20. Graham, S.D.; Brough, C.; Cropp, A. An introduction to ZEISS mineralogic mining and the correlation of light microscopy with automated mineralogy: A case study using BMS and PGM analysis of samples from a PGE-bearing chromite prospect. In Proceedings of the Precious Metals ‘15, Falmouth, UK, 11–12 May 2015. volume 11. [Google Scholar]
  21. Becker, M. The contribution of applied mineralogy to sustainability in the mine life cycle. Miner. Eng. 2023, 199, 108121. [Google Scholar] [CrossRef]
  22. Coetzee, L.L.; Theron, S.J.; Martin, G.J.; Van der Merwe, J.D.; Stanek, T.A. Modern gold deportments and its application to industry. Miner. Eng. 2011, 24, 565–575. [Google Scholar] [CrossRef]
  23. Petruk, W. Applied Mineralogy in the Mining Industry; Elsevier: Amsterdam, The Netherlands, 2000. [Google Scholar]
  24. Chryssoulis, S.L.; Cabri, L.J. Significance of Gold Mineralogical Balances in Mineral Processing. Trans. Inst. Min. Metall. Sect. A Min. Technol. 1990, 99, C1–C10. [Google Scholar]
  25. Nazari, A.M.; Ghahreman, A.; Bell, S. A comparative study of gold refractoriness by the application of QEMSCAN and diagnostic leach process. Int. J. Miner. Process. 2017, 169, 35–46. [Google Scholar] [CrossRef]
  26. Goodall, W.R.; Scales, P.J.; Ryan, C.G. Applications of PIXE and diagnostic leaching in the characterisation of complex gold ores. Miner. Eng. 2005, 18, 1010–1019. [Google Scholar] [CrossRef]
  27. Lorenzen, L.; Tumilty, J. Diagnostic Leaching as an analytical tool for evaluating the effect of reagents on the performance of a gold plant. Miner. Eng. 1992, 5, 503–512. [Google Scholar] [CrossRef]
  28. Lorenzen, L. Some guidelines to the design of a diagnostic leaching experiment. Miner. Eng. 1995, 8, 247–256. [Google Scholar] [CrossRef]
  29. Celep, O.; Alp, I.; Deveci, H.; Vicil, M. Characterization of refractory behaviour of complex gold/silver ore by diagnostic leaching. Trans. Nonferrous Met. Soc. China 2009, 19, 707–713. [Google Scholar] [CrossRef]
  30. Lorenzen, L.; Van Deventer, J. The mechanism of leaching of gold from refractory ores. Miner. Eng. 1992, 5, 1377–1387. [Google Scholar] [CrossRef]
  31. Tumilty, J.; Sweeney, A.; Lorenzen, L. Diagnostic leaching in the development of flowsheets for new ore deposits. In Proceedings of the Metallurgical Society of the Canadian Institute of Mining and Metallurgy; Elsevier: Amsterdam, The Netherlands, 1987; pp. 157–167. [Google Scholar]
  32. Celep, O.; Yazici, E.Y.; Altinkaya, P.; Deveci, H. Characterization of a refractory arsenical silver ore by mineral liberation analysis (MLA) and diagnostic leaching. Hydrometallurgy 2019, 189, 105106. [Google Scholar] [CrossRef]
  33. Goodall, W.R.; Scales, P.J.; Butcher, A.R. The Use of QEMSCAN and diagnostic leaching in the characterisation of visible gold in complex ores. Miner. Eng. 2005, 18, 877–886. [Google Scholar] [CrossRef]
  34. Teague, A.; Swaminathan, C.; Van Deventer, J. The behaviour of gold bearing minerals during froth flotation as determined by diagnostic leaching. Miner. Eng. 1998, 11, 523–533. [Google Scholar] [CrossRef]
  35. Henley, K.; Clarke, N.; Sauter, P. Evaluation of a diagnostic leaching technique for gold in native gold and gold-silver tellurides. Miner. Eng. 2001, 14, 1–12. [Google Scholar] [CrossRef]
  36. Celep, O.; Alp, I.; Deveci, H. Application of diagnostic leaching technique for refractory gold ores. DPÜ. Fen Bilim. Enstitüsü 2008, 16, 81–90. [Google Scholar]
  37. Bidari, E.; Aazami, M.; Aghazadeh, V. Process Mineralogical Study of the Arsenical Zone from a Carlin-type Gold Deposit. Min. Metall. Explor. 2020, 37, 1307–1315. [Google Scholar] [CrossRef]
  38. Stephen, R.S.; Anuar WN, S.; Ismail, S.; Jabit, N.A. Characterisation and diagnostic leaching of gold-bearing mineral ore, East Coast Peninsular Malaysia. Malays. J. Microsc. 2021, 17, 139–153. [Google Scholar]
  39. Wang, J.; Wang, W.; Dong, K.; Fu, Y.; Xie, F. Research on leaching of carbonaceous gold ore with copper-ammonia-thiosulfate solutions. Miner. Eng. 2019, 137, 232–240. [Google Scholar] [CrossRef]
  40. Eric, O.J. Diagnostic Leaching for Refractory Gold Ores. Available online: https://www.srk.com/en/publications/diagnostic-leaching-for-refractory-gold-ores (accessed on 1 March 2019).
  41. Acarkan, N.; Bulut, G.; Gül, A.; Kangal, O.; Karakaş, F.; Kökkılıç, O.; Önal, G. The effect of collector’s type on gold and silver flotation in a complex ore. Sep. Sci. Technol. 2010, 46, 283–289. [Google Scholar] [CrossRef]
  42. Dunne, R. Flotation of gold and gold-bearing ores. In Gold Ore Processing; Elsevier: Amsterdam, The Netherlands, 2016; pp. 315–338. [Google Scholar] [CrossRef]
  43. Forrest, K.; Yan, D.; Dunne, R. Optimisation of gold recovery by selective gold flotation for copper-gold-pyrite ores. Miner. Eng. 2001, 14, 227–241. [Google Scholar] [CrossRef]
  44. Lu, M.; Sun, Y.; Duan, H.; Xie, D.; Chen, Z.; Wang, J.; Wang, C. A working condition recognition method based on multivariable trend analysis for gold-antimony rougher flotation. Miner. Eng. 2020, 156, 106493. [Google Scholar] [CrossRef]
  45. Teague, A.; Van Deventer, J.; Swaminathan, C. A conceptual model for gold flotation. Miner. Eng. 1999, 12, 1001–1019. [Google Scholar] [CrossRef]
  46. O’Connor, C.; Dunne, R. The flotation of gold bearing ores—A review. Miner. Eng. 1994, 7, 839–849. [Google Scholar] [CrossRef]
  47. Røisi, I.; Aasly, K. The effect of graphite filler in sample preparation for automated mineralogy—A preliminary study. Mineralproduksjon 2018, 8, A1–A23. [Google Scholar]
Disclaimer/Publisher’s Note: The statements, opinions, and data contained in all publications are solely those of the individual author(s) and contributor(s) and not of MDPI and/or the editor(s). MDPI and/or the editor(s) disclaim responsibility for any injury to people or property resulting from any ideas, methods, instructions, or products referred to in the content.
Figure 1. Bulk mineralogy (wt%) of the flotation concentrate (feed of diagnostic leaching).
Minerals 13 01243 g001
Figure 2. Automated mineralogy mineral maps for some particles as examples, (a) disseminated pyrrhotite and chalcopyrite in pyrite, (b) pyrite, quartz, and feldspar association, (c) sericitic alteration of feldspar associated with pyrite, and (d) pyrite and sericitic feldspar associated with quartz.
Minerals 13 01243 g002
Figure 3. The liberation degree of pyrite in the size fraction based on the partial perimeter.
Minerals 13 01243 g003
Figure 4. Detected electrum using BPS.
Minerals 13 01243 g004
Figure 5. Occurrence of invisible gold inside mineral grains; (a) gold in kaolinite hosted using pyrite grain, 10 µm scale; (b) gold-inclusion pyrite, 5 µm scale; (c) invisible gold hosted using kaolinite, 10 µm scale.
Minerals 13 01243 g005
Figure 6. Gold deportment with minerals in the concentrate.
Minerals 13 01243 g006
Figure 7. Results of diagnostic leaching tests in each stage (wt%).
Minerals 13 01243 g007
Table 1. Diagnostic leaching reagents and target materials of these [27,28].
ReagentRemoved Material
Sodium cyanideGold
Sodium carbonateGypsum and arsenates
Hydrochloric acidPyrrhotite, calcite, dolomite, galena, and goethite
Hydrochloric acid/Tin(II) chlorideHematite, calcine, and ferrites
Sulfuric acidUraninite, sphalerite, unstable copper sulfides, unstable base metal sulfides, and unstable pyrite
Iron(III) chlorideSphalerite, galena, unstable sulfides, and tetrahedrite
Nitric acidPyrite, arsenopyrite, and marcasite
Oxalic acidOxide coatings
Hydrofluoric acidSilicates
Acetonitrile elutionLoaded carbons
Table 2. Literature review about studies using various SEM-based analyses and diagnostic leaching.
MaterialMethodReference
Refractory gold oreQEMSCAN and diagnostic leaching[25]
Complex gold orePIXE and diagnostic leaching[26]
Flotation tailingDiagnostic leaching[27]
Roasted calcine sampleDiagnostic leaching[27]
Refractory arsenic–silver oreMLA and diagnostic leaching[32]
Refractory gold–silver oreDiagnostic leaching[29]
Refractory gold oreDiagnostic leaching[30]
Complex gold oreQEMSCAN and diagnostic leaching[33]
Flotation concentrateDiagnostic leaching[34]
Refractory gold–silver oreDiagnostic leaching[36]
Refractory arsenic–gold oreX-ray spectrometer (EDS), electron probe microanalysis (EPMA), and diagnostic leaching[37]
Refractory gold oreDiagnostic leaching[38]
Carbonaceous gold oreDiagnostic leaching[39]
Table 3. Experimental conditions considered for the diagnostic leaching tests.
StageFeed ProductSolid Ratio (%, w/w)Leaching Time (h)ReagentTemperature (°C)pHDO
1st stageFlotationconcentrate4548NaCN 5 kg/t2511.5–12.020–30
2nd stageResidue of the previous leaching3324HCl %12 v/v70-
Residue of the previous leaching4548NaCN 1 kg/t2511.5–12.020–30
3rd stageResidue of the previous leaching3324H2SO4 %48 v/v80-
Residue of the previous leaching4548NaCN 1 kg/t2511.5–12.020–30
4th stageResidue of the previous leaching3324FeCl3 100 mg/L, 2 M HCl95-
Residue of the previous leaching4548NaCN 1 kg/t2511.5–12.020–30
5th stageResidue of the previous leaching3324HNO3 %55 v/v90-
Residue of the previous leaching4548NaCN 1 kg/t2511.5–12.020–30
Table 4. Chemical composition of the final mixed sample using ICP-OES and XRF analyses.
MethodElementUnitContentElementUnitContent
ICP-OESAug/t0.7Fewt%3.4
Agg/t1.2Swt%2.5
Cug/t73.1Cwt%0.4
Asg/t449.8Nig/t93.1
Pbg/t94.5Zng/t95.1
Mog/t13.0Crg/t28.3
Sng/t<10Sbg/t21.6
XRFAl2O3wt%10.8SiO2wt%73.7
K2Owt%2.1SO3wt%2.5
CO2wt%4.8MgOwt%0.8
TiO2wt%0.4Na2Owt%0.2
Table 5. Cyanide leaching results in different leaching size and time.
Leaching Size, d80 (µm)Leaching Time (h)Au Recovery (%)NaCN Consumption (kg/t)
45232.20.28
835.50.69
2437.00.82
4838.60.90
7239.00.98
73235.80.37
835.80.56
2439.20.75
4839.20.86
7239.70.97
106229.80.38
833.40.49
2433.40.54
4836.80.62
7236.80.69
Table 6. Results of flotation experiments.
ProductMass (wt%)Au Content (ppm)Au Recovery (wt%)
Concentrate15.92.559.7
Tailing84.10.340.3
Total100.00.7100.0
Disclaimer/Publisher’s Note: The statements, opinions and data contained in all publications are solely those of the individual author(s) and contributor(s) and not of MDPI and/or the editor(s). MDPI and/or the editor(s) disclaim responsibility for any injury to people or property resulting from any ideas, methods, instructions or products referred to in the content.

