Article

Frequency Response Method for Diffusivity Characterization of Propane in HZSM-5

by
Rebecca Grün
1,
Constantino Grau Turuelo
1,
Sebastian Ehrling
2 and
Cornelia Breitkopf
1,*
1
Chair of Thermodynamics, Technische Universität Dresden, 01069 Dresden, Germany
2
3P Instruments GmbH & Co. KG, Bitterfelder Str. 1-5, 04129 Leipzig, Germany
*
Author to whom correspondence should be addressed.
Minerals 2023, 13(10), 1244; https://doi.org/10.3390/min13101244
Submission received: 3 August 2023 / Revised: 15 September 2023 / Accepted: 18 September 2023 / Published: 23 September 2023

Abstract

:
Transient uptake curves for propane gas in a bed of HZSM-5 using a volumetric frequency response setup (batch system) were obtained. Thereby, a perturbation, such as a change in volume, was applied to the solid/gas system, and the resulting change in pressure was detected. Two cases of mass transfer limitations (bed diffusion control and micropore diffusion control) were compared, and it was concluded that, in the presented case, micropore diffusion is the rate-determining process. The obtained micropore diffusion coefficient for propane in HZSM-5 was, on average, about 1.2 × 10⁻¹⁰ m2 g−1, which is in good agreement with other frequency response studies shown by literature data. The homemade setup and the modeling presented in this work serve as the basis for ongoing numerical simulations.

1. Introduction

Zeolites, with their versatile channel structure and wide potential for functionalization and applications, are among the most relevant and frequently used heterogeneous catalysts and adsorbents in the industry. The optimization of these applications involves achieving a balance between high flow rates and high selectivity. Thereby, transport resistance plays a crucial role. The identification of the rate-determining step in mass transfer processes taking place in a solid/gas system is therefore essential. Macroscopic test methods that deal with the elucidation of diffusion processes and adsorption supply relevant data for process engineering purposes. One of these methods is the frequency response (FR) technique, a transient macroscopic method for studying mass transfer of gases in porous materials by recording the response of a system to a periodically varying concentration (gradient) [1,2,3,4,5,6,7]. The FR technique is based on the study of a system in thermodynamic equilibrium that is periodically slightly perturbed. The response to this perturbation allows the characterization of the system in terms of thermodynamic (e.g., adsorption constants) and kinetic (e.g., diffusion coefficients) properties, including synchronously ongoing processes [8,9,10,11,12]. The change in volume of the system can serve as a perturbation, and the resulting change in pressure over time can be recorded as output. For a complete process characterization, a wide frequency range must be investigated, and the so-called characteristic curves can be calculated. For this purpose, the measurement of the amplitude ratio and the phase shift of input and output for each frequency is necessary. When using a square wave as a perturbation function, a single response curve at a specific frequency can also be used for analyzing mass transfer processes. In these pressure curves, depending on the frequency, a short-term new state of equilibrium occurs after each compression and expansion step of the reactor volume. The course of these curves is distinctly influenced by diffusion as well as adsorption or desorption effects in a characteristic way.
For the validation and calibration of customized FR setups, the use and analysis of known porous materials or solid/gas combinations (e.g., from literature or industrial processes) is a suitable evaluation option. Due to its relevance in the chemical industry [13,14,15,16], where it is employed as a molecular sieve [17] or a carrier material for bifunctional catalysts [18,19,20], as well as due to its interesting pore structure, the zeolite ZSM-5 serves as a convenient material for conducting investigations regarding mass transfer of gases. ZSM-5 is a microporous zeolite with framework type MFI and comprises a three-dimensional framework structure. There are two types of pore channels (straight and sinusoidal channels) that intersect each other. The pore openings consist of 10-rings with a diameter of 5.1 Å to 5.6 Å [21,22].
In this work, propane with a kinetic diameter (4.3 Å), in the order of magnitude of the pore diameter of ZSM-5, was chosen as adsorptive. The selected combination of HZSM-5/propane is used to test the suitability of a custom FR apparatus built according to the principles of Rees [7], and individually adapted to the specific requirements. For this purpose, different FR measurements are carried out under variations in the sample amount. The resulting relevant uptake curves are derived and evaluated using two different models, both accounting for cases of diffusion limitation.
The distinctive feature here is that the sample material was neither dispersed in glass wool nor used as a monolayer; however, arranged as a relatively large bed of particles. One of the reasons to use this arrangement is that the experimental FR method is going to be coupled and tested with further numerical simulation models, in which the porous bed is represented as its own geometrical domain within the volume modulation unit of the FR device [23]. This novel coupling of experiment and simulation in the field of frequency response research offers the possibility to extend the evaluation of FR beyond characteristic curves and uptake curves to numerical simulations with parameter fits, which should provide quantities whose accessibility has previously been unavailable. The study of catalytically active materials in the form of a packed bed in particular is of immense importance for the industrial application of such catalytic systems.

2. Materials and Methods

2.1. Sample Material and Its Characterization

HZSM-5 was obtained from Clariant (trade name HCZP 30, SiO2/Al2O3 molar ratio 25–30). This zeolitic sample material was used in a grain fraction of 315 to 400 µm. The propane used (purity 3.5) was supplied by Messer Industriegase GmbH.
The (loose) bulk density of the HZSM-5 sample was determined using a calibrated measuring cup. Mercury porosimetry (Quantachrome Poremaster 60-GT, Quantrachrome, Boynton Beach, FL, USA) was used to obtain the particle density of the material. Furthermore, for the purpose of characterizing the zeolite sample, the adsorption isotherm of argon was recorded: The sample underwent pretreatment at 573 K under reduced pressure conditions for a duration of 16 h. This pretreatment procedure was employed to eliminate trace gases and any residual water present within the sample’s pores. Following the pretreatment process, the sample was transferred to a 3P micro 200 instrument (3P Instruments GmbH, Odelzhausen, Germany). An argon isotherm was subsequently recorded at a temperature of 87.3 K. Temperature control was achieved by using cryoTune technology.

2.2. Propane Adsorption Isotherm

In order to perform the frequency response measurements, it was necessary to record the isotherm of propane with HZSM-5 at the selected temperature (308 K, sufficiently low to exclude a remarkable reaction on the zeolite [24,25]). This allowed the identification of the linear range of the isotherm. This is an important factor, as the linearity of the isotherms is a necessary condition for the application of the models in the later course. With this information, the measuring pressure range to be applied to the FR can be defined. The isotherm was recorded by a static volumetric method with the instrument Sync 440 A by 3P Instruments GmbH.

2.3. Frequency Response (FR)

The purpose-built apparatus [23] used complies with the volume-swing frequency response (VSFR) method in a batch system. The setup consists of vacuum components made of stainless steel; only the lower part of the sample holder consists of a glass tube (diameter 11 mm), which is permanently sealed to a steel tube. The apparatus is equipped with several valves and pump access points, allowing the separation of different sections, evacuation, or the introduction of sample gases. Each section contains a pressure sensor to detect the pressure of the gas to be metered or the final measuring pressure. In the upper section, the volume modulation unit consists of a plate connected to a steel bellow, allowing the relevant volume of the apparatus to vary during the measurement by moving the disc up and down with a specific frequency. The plate movement is induced by means of alternately magnetized coils under the control of a potentiostat (AUTOLAB PGSTAT302N, software NOVA 2.1.6, METROHM AUTOLAB B.V., Utrecht, The Netherlands) This device also handles the acquisition of the measurement signal. The change in pressure relative to the previously established equilibrium pressure is recorded. This is carried out by means of a differential pressure sensor between the two corresponding sections of the apparatus, namely, on the one hand, a section isolated from the measuring process by valves, and on the other hand, the volume modulation unit. A custom-made heating box with an integrated silicone heating mat and an axial fan ensures a uniform temperature distribution in the sample chamber. A temperature sensor inside this jacket, as well as a sensor protruding into the sample container by means of a vacuum-tight feedthrough assembly, monitor the temperature curve. The value recorded inside the heating box is used as the reference value for the temperature.
Prior to the tests, the zeolitic sample material was calcined for 5 h at 873 K under a flow of synthetic air. After transferring the solid sample into the apparatus, another degassing process was carried out at 383 K for 7 h under vacuum (up to 10−6 kPa). Thereby, HZSM-5 was used as a bed of particles. On top of this bed, a 9 mm layer of spherical nonporous glass beads (approx. 1 g) was placed. After the pretreatment, the adsorptive was introduced into the apparatus, followed by allowing a thermodynamic equilibrium to be established overnight. A perturbation in the form of a square wave was applied in a frequency range of 0.001–2 Hz to the solid/gas combination in equilibrium, and its pressure response was measured over time. The corresponding blank measurements were carried out without a solid sample but with propane and the glass beads in order to exclude mass transfer processes within the device and this glass beads bed. During the measurements, the temperature was kept constant at ±0.2 K. A protective cover made of acrylic glass was placed over the apparatus to protect it from external influences such as air circulation.
For the FR measurements, different amounts of sample material were employed. This amount was determined by means of the corresponding bed depth. The notation used for each sample can be taken from Table 1.

3. Results

3.1. Sample Characterization

The following values were yielded from the density measurements of the HZSM-5 (grain fraction) sample: a bulk density of 0.420 g cm−3 and a particle density of 0.943 g cm−3. This resulted in a bed porosity of 0.55.
The textural properties of HZSM-5 were subjected to further analysis. To this end, an argon isotherm was recorded at a temperature of 87.3 K, as illustrated in Figure 1. The surface area of the material was quantified employing the BET method, yielding a value of 440 m2 g−1. Additionally, the total pore volume was assessed at p/p0 = 0.988, resulting in 0.221 cm3 g−1, based on the application of the Gurvitch rule.

3.2. Propane Adsorption Isotherm

The physisorption test with propane at 308 K resulted in a type I(b) isotherm according to the IUPAC classification [26], as expected for HZSM-5 as a microporous material (see Figure 2). Accordingly, with a pressure in the range of 2.5–3.0 kPa for the FR measurements, the linearity of the isotherms (including volume change during the FR test) can be assumed for the applied models.

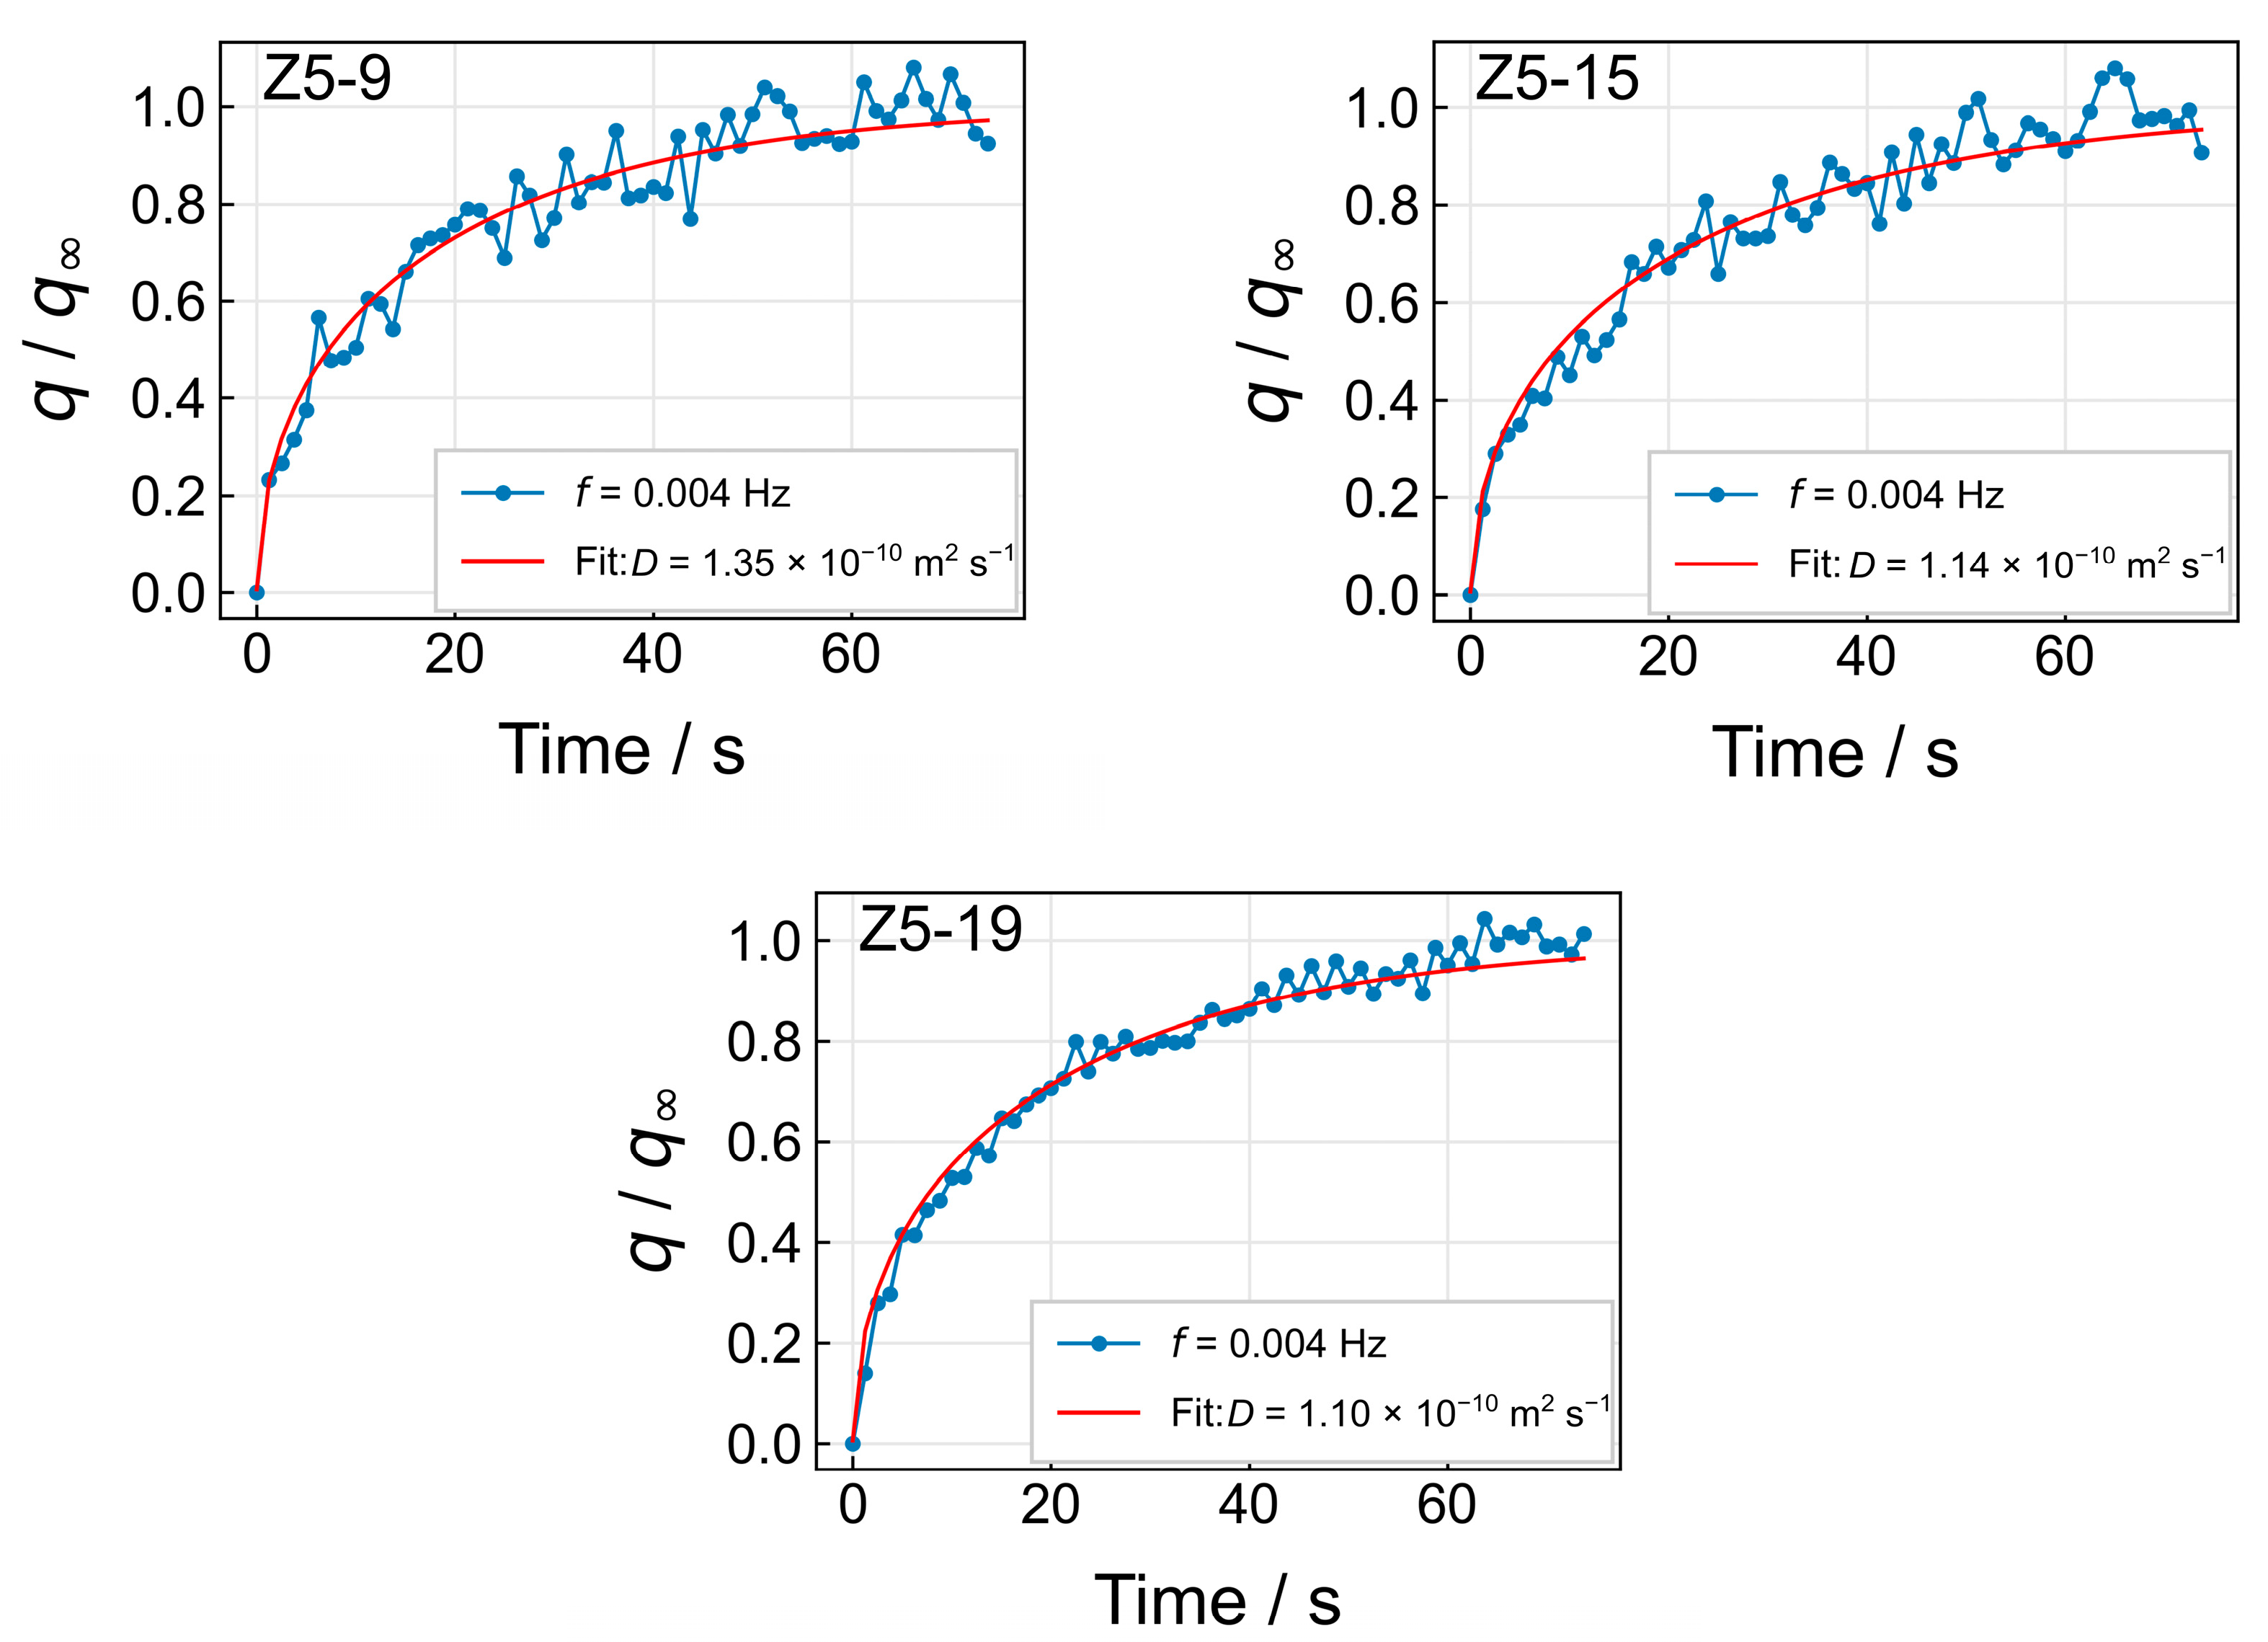
3.3. Uptake Curves from Frequency Response Measurements

A total of 16 single FR measurements in the mentioned frequency range were obtained for each sample. Figure 3 shows exemplary single measurements of sample Z5-19 and the corresponding blank tests at three different frequencies. It illustrates the impact of the input signal, corresponding to the plate position (driven by a square wave function), on both the blank and solid material sample pressure response measurements. Regarding the blank measurement (orange signal in Figure 3), the effect of the input signal on the pressure response can be qualitatively observed as the inverse of the original square wave function of the plate position. Concerning the measurements with solid sample material (blue signal in Figure 3), a deviation from the rectangular wave shown in the blank measurement can be observed. This deviation arises from triggered mass transfer processes in the solid/gas system, leading to a drop in the pressure curve when the pressure increases as a result of volume reduction and, conversely, an increase in pressure when the pressure decreases as a result of volume expansion. The apparent change in the amplitude of the pressure response with increasing frequency is due to the fact that the abrupt pressure change is resolved more clearly with increasing frequency due to a decreasing sampling time.
The FR measurements were used as inputs for the study of sorption uptake curves against time. For this purpose, an “adsorption branch” of the second-to-last pressure oscillation was “cut out”. After that, the corresponding branch of the respective blank test was subtracted, the curve inverted, and normalized. Taking the lowest frequency scan (0.001 Hz) as a base, the complete uptake curve is derived. From this low-frequency measurement, the maximum equilibrium adsorption is determined. However, the sampling time for this single scan is too high to capture the initial pressure/concentration jump; therefore, data points from the scans of other frequencies were added to the curve; see Figure 4.
It can be seen that the curve is linear within the first few (fractional) seconds, which indicates that this is the effect of the relatively fast volume change and thus pressure jump. Therefore, it is assumed that this is not related to mass transfer processes yet [27]. For this reason, the uptake curves of the experiment at a frequency of 0.004 Hz are used to model the diffusion within the sample.
In the present case, when using a bed of microporous zeolite particles of a certain size, different diffusional resistances can arise, such as diffusion into the sample bed, macropore diffusion, and micropore diffusion. The following two limiting cases are considered in the present work: (a) The diffusion within the bed and within the microparticles is so fast that the uptake rate completely depends on the diffusion into the bed of particles (bed diffusion control); (b) the opposite case: intracrystalline diffusion is the rate-determining step of uptake (micropore diffusion control). In order to analyze which option is predominant, the uptake curves of the measurements were evaluated with different models. Both approaches are based on the analytical solutions of Fick’s second law of diffusion for the uptake curves caused by a step change in adsorptive pressure. This formulation is valid under the condition that the adsorption regime lies within the linear part of the equilibrium adsorption isotherm (see Figure 2) and under the assumption that an isothermal system is present. For case (a), the equation of the limiting case of bed diffusion control of a dual diffusion resistance system was applied, Equation (1) [28,29].
m t m = 1 n = 0 2 n + 1 2 2 π 2 exp n + 1 2 2 π 2 D t l 2
m t is the amount adsorbed at time t , m the amount adsorbed in (temporary) equilibrium, D transport diffusion coefficient, and l corresponds to the bed depth of the solid. For the study of case (b), the solution for the uptake curve of uniform spherical particles was used, Equation (2) [28,29].
m t m = 1 6 π 2 n = 1 1 n 2 exp n 2 π 2 D t r 2
with r as the radius of the particles. This was averaged across the grain fraction. For the fits, Equations (1) and (2) were solved up to n = 100 , and the non-linear least squares curve fitting method was applied (with a Python script using SciPy [30]).
In general, when employing these solutions for uptake curves, care must be taken to fit the experimental method. The mentioned models are typically used for the so-called “constant volume/variable pressure” methods [31]. These methods are based on setups in which a reservoir is loaded with gas and, in a second step, connected to another volume that contains the solid sample material. This kind of procedure has an impact on applicable models, and presents additional effects, such as valve effects, that have to be considered. However, the apparatus used in this work employs a version of FR in which pressure or, to be more precise, pressure change correlates directly with the mass of the adsorbed amount. Therefore, the use of these formulas is justified.
Regarding case (a), Figure 5 illustrates the solutions of Equation (1) applied to the individual measurements at f = 0.004 Hz for the samples Z5-9, Z5-15, and Z5-19. It can be observed that the resulting diffusion coefficient (limiting case bed diffusion control) increases with increasing bed depth. Based on the obtained magnitude of diffusion coefficients, no significant bed diffusion limitations are expected in the present systems.
Figure 6, in contrast, shows the solutions of Equation (2) applied to the same individual measurements of all three samples. As it can be seen, the resulting diffusion coefficient (limiting case micropore diffusion control) was found to be three to four orders of magnitude smaller than the bed diffusion coefficients derived from the other model and relatively independent of the bed depth. This is noteworthy, considering that the depth of the solid bed in sample Z5-19 is more than twice as large as in sample Z5-9.
This indicates that micropore diffusion is the rate-determining mass transfer process in the systems studied. This is also plausible considering that the diameters of the mouths of the micropores are of the same order of magnitude as propane as an adsorptive. Hence, the diffusion of propane within the channels of HZSM-5 is expected to be slow, especially compared to intercrystalline and bed diffusion. Under these conditions, thermal effects are expected to be negligible.

4. Discussion

In order to evaluate the obtained diffusion coefficients, various references on the diffusion of propane in ZSM-5 or ZSM-5/silicalite were investigated. The reason for taking into account ZSM-5/silicalite is that it has been shown that the diffusion behavior of paraffines in ZSM-5 and its Si-rich analogue, silicalite, presents very minor differences [29]. Table 2 provides a comparison of several references with their specific devices/systems and models. For details on the models mentioned in the cited references, the original source should be consulted.
Figure 7 illustrates graphically the diffusion coefficients of the references cited in Table 2 at the same or as close to the given temperature as possible. In most cases, different measurement methods or devices cannot be compared one-to-one; however, they can give an overview of the expected order of magnitude of (micropore) diffusion, especially since the selection above is limited to similar macroscopic measurement methods. The average value of 1.2·× 10−10 m2·g−1 obtained in this work is within the range of diffusion coefficients of propane in ZSM-5 described in this literature. When compared with FR methods only [33,34], the value obtained here is in good agreement with the respective diffusion coefficients. This is taken as a basis for the validation of the self-built FR apparatus.
The presented work provides a first step towards the combination of the analytical evaluation of frequency response and numerical simulations. In fact, the latter rely on a defined macroscopic domain of porous sample material, which encounters certain challenges for experimental FR studies. On the way to reconcile experiments and analytical and numerical models, a COMSOL Multiphysics® model for the FR analysis with the specific presented setup was recently developed [36]. The model imitates the behavior of the FR experimental procedure to gain insights into what is locally occurring within the device geometry, such as the gas velocity and pressure distribution, as well as other magnitudes such as the adsorption rate per volume unit in the porous material. In order to perform that, the transport phenomena are solved by means of a computational fluid dynamics (CFD) formulation in the domain with no solid material, whereas a porous media flow is computed in the porous material-gas domain. This model can be used in synergy with the uptake curves, as the model computes the pressure response curves depending on the system parameters (bed porosity, adsorption model, permeability, etc.). The simulation provides pressure response curves that can be directly compared to the uptake curves. The contrary is also possible; an adsorption model can be potentially implemented in the COMSOL simulation with the diffusion data obtained from the uptake curves. Furthermore, the source of deviations between the two evaluation methods can also be checked.

5. Conclusions

Especially when using porous materials such as zeolites in large-scale processes, mass transfer limitations play a central role in process design. Insights into the rate-determining step of the mass transfer processes taking place in solid/gas systems are fundamental for material and process optimization. This work aimed to assess the suitability of the current FR device for analyzing such aspects. To achieve this, FR measurements were performed using the solid/gas combination of HZSM-5/propane while varying bed depths. An overall uptake curve was built to identify the single frequency/scan of interest for the governing mass transfer phenomena. After selecting the frequency of interest, the equations of two mass transfer limitation cases were fitted to the mentioned uptake curve. It was found that the micropore diffusion control model provided more consistent results that remained independent of the bed depth. This resulted in an average diffusion coefficient of 1.2·× 10−10 m2·g−1. Other literature diffusion coefficients of the same investigated system with related measurement procedures were gathered. The comparison of the presented result against diffusion coefficients determined by the VSFR method (as in this work) from the literature revealed good agreement.
In general, it should be noted that heat effects cannot be disregarded when dealing with particle beds, especially for large sample amounts. This consideration is particularly important in systems with high mass transfer rates. In such cases, it is advisable to ensure isothermal experimental conditions if possible; otherwise, non-isothermal adsorption models should be chosen [37,38,39,40,41,42]. However, the isothermal state of the system cannot be proven on the basis of individual uptake curves since the corresponding models have a similar mathematical structure. For this reason, it is particularly necessary to carry out these studies with a suitable series of measurements. Generally, it is recommended to perform comparative tests with systematically varied parameters (sample amount, particle size, sample configuration, etc.). This is planned on a larger scale for future work.

Author Contributions

Conceptualization, R.G., C.G.T. and C.B.; methodology, R.G., C.G.T. and C.B.; software, R.G. and C.G.T.; validation, R.G. and C.G.T.; formal analysis, R.G., C.G.T., S.E. and C.B.; investigation, R.G. and S.E.; resources, R.G., C.G.T. and S.E.; data curation, R.G., C.G.T. and C.B.; writing—original draft preparation, R.G. and C.G.T.; writing—review and editing, R.G., C.G.T., S.E. and C.B.; visualization, R.G.; supervision, C.B.; project administration, C.B. All authors have read and agreed to the published version of the manuscript.

Funding

This research received no external funding.

Data Availability Statement

Data are available from authors upon reasonable request.

Acknowledgments

The zeolitic sample material was kindly provided by Clariant Produkte (Deutschland) GmbH. The authors also wish to thank Gina Malorny.

Conflicts of Interest

The authors declare no conflict of interest.

References

  1. Deisler, P.F.; Wilhelm, R.H. Diffusion in Beds of Porous Solids. Measurement by Frequency Response Techniques. Ind. Eng. Chem. 1953, 45, 1219–1227. [Google Scholar] [CrossRef]
  2. Naphtali, L.M.; Polinski, L.M. A Novel Technique for Characterization of Adsorption Rates on Heterogeneous Surfaces. J. Phys. Chem. 1963, 67, 369–375. [Google Scholar] [CrossRef]
  3. Yasuda, Y. Frequency Response Method for Study of the Kinetic Behavior of a Gas-Surface System. 1. Theoretical Treatment. J. Phys. Chem. 1976, 80, 1867–1869. [Google Scholar] [CrossRef]
  4. Yasuda, Y.; Suzuki, Y.; Fukada, H. Kinetic Details of a Gas/Porous Adsorbent System by the Frequency Response Method. J. Phys. Chem. 1991, 95, 2486–2492. [Google Scholar] [CrossRef]
  5. Rees, L.V.C.; Shen, D. Characterization of Microporous Sorbents by Frequency-Response Methods. Gas Sep. Purif. 1993, 7, 83–89. [Google Scholar] [CrossRef]
  6. Reyes, S.C.; Iglesia, E. Frequency Response Techniques for the Characterization of Porous Catalytic Solids. In Catalysis; Spivey, J.J., Agarwal, S.K., Eds.; Royal Society of Chemistry: Cambridge, UK, 1994; Volume 11, ISBN 978-0-85186-654-3. [Google Scholar]
  7. Song, L.; Rees, L.V.C. Frequency Response Measurements of Diffusion in Microporous Materials. In Adsorption and Diffusion; Karge, H.G., Weitkamp, J., Eds.; Springer: Berlin/Heidelberg, Germany, 2008; Volume 7, ISBN 978-3-540-73965-4. [Google Scholar]
  8. Reyes, S.C.; Sinfelt, J.H.; DeMartin, G.J.; Ernst, R.H.; Iglesia, E. Frequency Modulation Methods for Diffusion and Adsorption Measurements in Porous Solids1. J. Phys. Chem. B 1997, 101, 614–622. [Google Scholar]
  9. Sun, L.M.; Bourdin, V. Measurement of Intracrystalline Diffusion by the Frequency Response Method: Analysis and Interpretation of Bimodal Response Curves. Chem. Eng. Sci. 1993, 48, 3783–3793. [Google Scholar] [CrossRef]
  10. Shen, D.; Rees, L.V.C. Frequency Response Study of Mixture Diffusion of Benzene and Xylene Isomers in Silicalite-1. Stud. Surf. Sci. Catal. 1995, 97, 235–242. [Google Scholar] [CrossRef]
  11. Song, L.; Rees, L.V.C. Adsorption and Transport of n -Hexane in Silicalite-1 by the Frequency Response Technique. J. Chem. Soc. Faraday Trans. 1997, 93, 649–657. [Google Scholar] [CrossRef]
  12. Valyon, J.; Onyestyák, G.; Rees, L.V.C. A Frequency-Response Study of the Diffusion and Sorption Dynamics of Ammonia in Zeolites. Langmuir 2000, 16, 1331–1336. [Google Scholar] [CrossRef]
  13. Ashton, A.G.; Batmanian, S.; Dwyer, J.; Elliott, I.S.; Fitch, F.R. The Catalytic Properties of Modified Pentasil Zeolites. J. Mol. Catal. 1986, 34, 73–83. [Google Scholar] [CrossRef]
  14. Sendoda, Y.; Ono, Y. Effect of the Pretreatment Temperature on the Catalytic Activity of ZSM-5 Zeolites. Zeolites 1988, 8, 101–105. [Google Scholar] [CrossRef]
  15. Degnan, T.F.; Chitnis, G.K.; Schipper, P.H. History of ZSM-5 Fluid Catalytic Cracking Additive Development at Mobil. Microporous Mesoporous Mater. 2000, 35–36, 245–252. [Google Scholar] [CrossRef]
  16. Gao, Y.; Zheng, B.; Wu, G.; Ma, F.; Liu, C. Effect of the Si/Al Ratio on the Performance of Hierarchical ZSM-5 Zeolites for Methanol Aromatization. RSC Adv. 2016, 6, 83581–83588. [Google Scholar] [CrossRef]
  17. Weitkamp, J.; Ernst, S.; Dauns, H.; Gallei, E. Formselektive Katalyse in Zeolithen. Chem. Ing. Tech. 1986, 58, 623–632. [Google Scholar] [CrossRef]
  18. Lukyanov, D.B.; Gnep, N.S.; Guisnet, M.R. Kinetic Modeling of Propane Aromatization Reaction over HZSM-5 and GaHZSM-5. Ind. Eng. Chem. Res. 1995, 34, 516–523. [Google Scholar] [CrossRef]
  19. Raddi de Araujo, L.R.; Schmal, M. The Calcination Effects on Pt/HZSM-5 Catalysts in the Aromatization of Propane. Appl. Catal. Gen. 2000, 203, 275–284. [Google Scholar] [CrossRef]
  20. Li, J.; Hu, C.; Tong, K.; Xiang, H.; Zhu, Z.; Hu, Z. CO2 Atmosphere-Enhanced Methanol Aromatization over the NiO-HZSM-5 Catalyst. RSC Adv. 2014, 4, 44377–44385. [Google Scholar] [CrossRef]
  21. Kokotailo, G.T.; Lawton, S.L.; Olson, D.H.; Meier, W.M. Structure of Synthetic Zeolite ZSM-5. Nature 1978, 272, 437–438. [Google Scholar] [CrossRef]
  22. Baerlocher, C.; McCusker, L.B.; Olson, D.; Meier, W.M. Atlas of Zeolite Framework Types, 6th ed.; Elsevier: Amsterdam, The Netherlands, 2007; ISBN 978-0-444-53064-6. [Google Scholar]
  23. Grün, R.; Pan, F.; Grau Turuelo, C.; Breitkopf, C. Transient Studies of Gas Transport in Porous Solids Using Frequency Response Method—A Conceptual Study. Catal. Today 2023, 417, 113838. [Google Scholar] [CrossRef]
  24. Kitagawa, H.; Sendoda, Y.; Ono, Y. Transformation of Propane into Aromatic Hydrocarbons over ZSM-5 Zeolites. J. Catal. 1986, 101, 12–18. [Google Scholar] [CrossRef]
  25. Luzgin, M.V.; Stepanov, A.G.; Sassi, A.; Sommer, J. Formation of Carboxylic Acids from Small Alkanes in Zeolite H-ZSM-5. Chem. Eur. J. 2000, 6, 2368–2376. [Google Scholar] [CrossRef] [PubMed]
  26. Thommes, M.; Kaneko, K.; Neimark, A.V.; Olivier, J.P.; Rodriguez-Reinoso, F.; Rouquerol, J.; Sing, K.S.W. Physisorption of Gases, with Special Reference to the Evaluation of Surface Area and Pore Size Distribution (IUPAC Technical Report). Pure Appl. Chem. 2015, 87, 1051–1069. [Google Scholar] [CrossRef]
  27. Wang, J.-Y.; Mangano, E.; Brandani, S.; Ruthven, D.M. A Review of Common Practices in Gravimetric and Volumetric Adsorption Kinetic Experiments. Adsorption 2021, 27, 295–318. [Google Scholar] [CrossRef]
  28. Crank, J. The Mathematics of Diffusion, 2nd ed.; Clarendon Press: Oxford, UK, 1975; ISBN 978-0-19-853344-3. [Google Scholar]
  29. Kärger, J.; Ruthven, D.M. Diffusion in Zeolites and Other Microporous Solids; Wiley: New York, NY, USA, 1992; ISBN 978-0-471-50907-3. [Google Scholar]
  30. Virtanen, P.; Gommers, R.; Oliphant, T.E.; Haberland, M.; Reddy, T.; Cournapeau, D.; Burovski, E.; Peterson, P.; Weckesser, W.; Bright, J.; et al. SciPy 1.0: Fundamental Algorithms for Scientific Computing in Python. Nat. Methods 2020, 17, 261–272. [Google Scholar] [CrossRef] [PubMed]
  31. Bülow, M.; Micke, A. Determination of Transport Coefficients in Microporous Solids. Adsorption 1995, 1, 29–48. [Google Scholar] [CrossRef]
  32. Bülow, M.; Schlodder, H.; Rees, L.V.C.; Richards, R.E. Molecular Mobility of Hydrocarbon ZSM5/Silicalite Systems Studied by Sorption Uptake and Frequency Response Methods. Stud. Surf. Sci. Catal. 1986, 28, 579–586. [Google Scholar] [CrossRef]
  33. Van-Den-Begin, N.G.; Rees, L.V.C. Diffusion of Hydrocarbons in Silicalite Using a Frequency-Response Method. In Zeolites: Facts, Figures, Future; Jacobs, P.A., van Santen, R.A., Eds.; Studies in Surface Science and Catalysis; Elsevier Science Publishers B.V.: Amsterdam, The Netherlands, 1989; ISBN 0-444-87466-6. [Google Scholar]
  34. Van-Den-Begin, N.; Rees, L.V.C.; Caro, J.; Bülow, M. Fast Adsorption-Desorption Kinetics of Hydrocarbons in Silicalite-1 by the Single-Step Frequency Response Method. Zeolites 1989, 9, 287–292. [Google Scholar] [CrossRef]
  35. Zhang, C.; Ng, K.L.A.; Yan, L.; Feng, X.; Jiang, B.; Liao, Z.; Wang, J.; Yang, Y. Kinetic Perspective on Methanol to Propylene Process via HZSM-5 Catalyst: Balancing between Reaction and Diffusion. Ind. Eng. Chem. Res. 2022, 61, 2055–2067. [Google Scholar] [CrossRef]
  36. Grau Turuelo, C.; Grün, R.; Breitkopf, C. Simulation of the Frequency Response Analysis of Gas Diffusion in Zeolites by Means of Computational Fluid Dynamics. Minerals 2023, 13, 1238. [Google Scholar]
  37. Ruthven, D.M.; Lee, L.-K. Kinetics of Nonisothermal Sorption: Systems with Bed Diffusion Control. AIChE J. 1981, 27, 654–663. [Google Scholar] [CrossRef]
  38. Haul, R.; Stremming, H. Nonisothermal Sorption Kinetics in Porous Adsorbents. J. Colloid Interface Sci. 1984, 97, 348–355. [Google Scholar] [CrossRef]
  39. Sun, L.M.; Meunier, F.; Kärger, J. On the Heat Effect in Measurements of Sorption Kinetics by the Frequency Response Method. Chem. Eng. Sci. 1993, 48, 715–722. [Google Scholar] [CrossRef]
  40. Sun, L.M.; Meunier, F.; Grenier, P.; Ruthven, D.M. Frequency Response for Nonisothermal Adsorption in Biporous Pellets. Chem. Eng. Sci. 1994, 49, 373–381. [Google Scholar] [CrossRef]
  41. Ahn, H.; Moon, J.-H.; Hyun, S.-H.; Lee, C.-H. Diffusion Mechanism of Carbon Dioxide in Zeolite 4A and CaX Pellets. Adsorption 2004, 10, 111–128. [Google Scholar] [CrossRef]
  42. Möller, A.; Pessoa Guimaraes, A.; Gläser, R.; Staudt, R. Uptake-Curves for the Determination of Diffusion Coefficients and Sorption Equilibria for n-Alkanes on Zeolites. Microporous Mesoporous Mater. 2009, 125, 23–29. [Google Scholar] [CrossRef]
Figure 1. Argon isotherm at 87.3 K (3P micro 200, 3P Instruments GmbH) of HZSM-5. Full symbols show adsorption; empty symbols denote desorption. The lines are solely to guide the eye.
Minerals 13 01244 g001
Figure 2. Isotherm of HZSM-5/propane at 308 K (Sync 440 A, 3P Instruments GmbH) and marked pressure range for the FR measurements.
Minerals 13 01244 g002
Figure 3. FR curves of Z5-19 and blank tests with propane at three different exemplary single frequencies (p = 2540 Pa, T = 308 K).
Minerals 13 01244 g003
Figure 4. Total uptake curve of sample Z5-19 with propane (p = 2540 Pa, T = 308 K).
Minerals 13 01244 g004
Figure 5. Normalized uptake curves from FR tests of the HZSM-5/propane samples with their corresponding fits and diffusion coefficients resulting from Equation (1).
Minerals 13 01244 g005
Figure 6. Normalized uptake curves from FR tests of the HZSM-5/propane samples with their corresponding fits and diffusion coefficients resulting from Equation (2).
Minerals 13 01244 g006
Figure 7. Diffusion coefficients from references cited in Table 2 (Bülow 1986 [32], Van-den-Begin 1989 a [33], Van-den-Begin 1989 b [34] and Zhang 2022 [35]) and the value yielded in this work.
Minerals 13 01244 g007
Table 1. Sample names with their respective measurement parameters and bed depth for each FR measurement.
Sample Namep/PaT/KBed Depth l/mm
Z5-926603089
Z5-15290030815
Z5-19254030819
Table 2. Comparative data for HZSM-5/propane from the literature.
SystemType of Diffusion CoefficientModelReference
“Constant volume/variable pressure”intracrystalline(1) from characteristic FR functions: identical spheres (monodisperse)[32]
“Constant volume/variable pressure”intracrystalline(2) from the uptake curve: statistical moments theory, corrected by the Darken equation[32]
VSFRself-diffusionfrom characteristic FR functions: “diffusion of a single diffusate in an isotropic sphere”, corrected by the Darken equation[33]
Single step VSFRintracrystalline“diffusion by a sphere in a stirred solution of limited volume”, corrected by the Darken equation[34]
Gravimetric, commercialeffectiveEquation (1)[35]
Disclaimer/Publisher’s Note: The statements, opinions and data contained in all publications are solely those of the individual author(s) and contributor(s) and not of MDPI and/or the editor(s). MDPI and/or the editor(s) disclaim responsibility for any injury to people or property resulting from any ideas, methods, instructions or products referred to in the content.

