1. Introduction
Refractory gold ore refers to gold ores with a low leaching rate under conventional leaching conditions, and gold ores with a leaching rate lower than 80% after direct cyanide leaching treatment are generally considered refractory gold ores [
1,
2,
3,
4]. Nowadays, about 60%~70% of the global gold resource reserves belong to refractory gold sources, and the total gold produced from refractory gold ores accounts for roughly 30% of the gold in the world. Microfine disseminated gold ore is one of the main types of refractory gold deposits [
5].
The structures of difficult-to-process gold ores can be divided into three categories: (1) high-sulfur, high-arsenic gold ores (the gold in such ores is dispersed by sulfide ore packages, which are the world’s largest reserves of difficult-to-leach gold ores [
6,
7,
8]); (2) silicate parcels of gold ores (the gold in such ores is dispersed by the vein mineral package [
9,
10]); (3) carbonaceous gold ore (although the gold in such ore is not wrapped by other minerals, in the leaching process, the organic carbon in the slurry competes for the adsorption of gold-containing complexes, also known as the “gold hijacking phenomenon”, which affects the leaching efficiency [
11,
12,
13]). Gold-bearing sulfide ore is the largest class of difficult-to-manage gold ore reserves; the most common form of gold-bearing sulfide ore is gold-bearing pyrite [
5]. Gold is often wrapped by pyrite in the form of fine particles and is not easy to dissociate; in addition, the sulfur element in the ore consumes many gold-leaching chemicals, so that the subsequent leaching rate drops. Therefore, before leaching gold, gold-bearing pyrite pretreatment generally needs to be conducted, through the pretreatment and then opening of the outer layer of fine-grained gold parcels, eliminating the impact of minerals on the leaching chemicals, and improving the efficiency of gold leaching [
9,
14,
15,
16].
The preoxidation treatment methods of refractory gold ore containing sulfur and arsenic can be roughly divided into three categories: roasting oxidation, biological oxidation, and wet chemical oxidation. The roasting oxidation method is the most widely used in industry, but it has the following main drawbacks in the production process: firstly, the roasting process not only has a high cost, but also produces a large amount of sulfur and arsenic oxides, which are discharged into the air and cause serious pollution; secondly, the following cyanide leaching process uses highly toxic cyanide, and the residue of cyanide in the discharged wastewater and tailings also causes toxic pollution issues. The biological oxidation method has the advantages of environmentally friendly production, strong adaptability, and stable and reliable operation of the production process, but it also has the disadvantages of a long oxidation cycle, high requirements for processing equipment, and the need to adjust alkalinity in subsequent cyanide leaching, which directly leads to high production costs. According to different pH values of pulp, chemical oxidation can be roughly divided into alkali and acid pretreatment methods. According to different reaction pressure conditions, it also can be divided into atmospheric pretreatment and hot-pressing pretreatment.
In fact, there are many studies on the chemical oxidation of pyrite, and the studies on oxidation in an acidic environment generally agree that iron is mainly converted to free Fe
2+ and Fe
3+, sulfur is mostly converted to SO
42−, and a small portion of the latter is converted to elemental S. Especially in the process of bio-oxidation, the elemental sulfur that is generated on the wall of the container can be clearly seen [
17,
18]. However, in alkaline environments, the results of studies on the mechanism and products of pyrite oxidation are not consistent. For example, some studies demonstrate the belief that the oxidation products contain elemental sulfur [
19], while others demonstrate the belief that elemental sulfur is only a temporary intermediate in the oxidation process of pyrite, and that there is no elemental sulfur in most medium oxidation products [
20,
21]. In addition, some researchers have suggested that the oxidation product of iron is mainly FeOOH [
22]; however, others have suggested that Fe(OH)
3 is the final stable oxidation product [
23,
24]. The oxidation process of pyrite has also shown that S0 is formed on the surface of pyrite electrodes during acidic oxidation, which inhibits the oxidation of the pyrite to a certain extent, but S0 is eventually further oxidized, and the passivation effect is weakened [
25,
26]. However, alkaline oxidation affects the oxidation rate of pyrite by producing a passivation film, in which the main component of the passivation film is iron hydroxide [
27,
28]. The acid method and hot-pressing method have the disadvantages of high cost, high equipment requirements (acid corrosion resistance), difficult process control (high-pressure danger), immature waste liquid recycling technology, and environmental pollution due to harsh conditions such as pressurization, heating, and acidity. Therefore, they are less often applied in production. However, because of the advantages of low equipment requirements, low production costs, easy process control, and less environmental pollution, the alkaline preoxidation process at room temperature and pressure has become a hot spot of research in recent years and has good development and application prospects.
Many research data on the alkaline oxidation of sulfide ores show that the oxidation sequence of common gold-bearing sulfide ores (arsenopyrite, chalcopyrite, and pyrite, etc.) in an alkaline oxidation system is as follows: arsenopyrite → chalcopyrite → pyrite [
29,
30,
31,
32]. Since pyrite is relatively more difficult to oxidize than the other sulfides, it is of great significance to study the oxidation and dissolution behaviors of pyrite in an alkaline environment. In this paper, the oxidation and passivation of gold-bearing pyrite in alkaline electrolytes were studied using an electrochemical method.
2. Materials and Methods
2.1. Preparation of Massive Pyrite Electrode
Massive pyrite electrodes are mainly used to research the corrosion and passivation processes generated on surface of pyrite. The electrode requires not only high pyrite mineral purity, but also a large crystal size, no crack defects, and a smooth surface finish after grinding. The above-mentioned blocky pyrite is cut and ground into a square sheet with an area of 10 × 10 mm2 and a thickness of 3~5 mm, embedded in a special square electrode casing, the surrounding contact parts are sealed with sealant to ensure that one side of the pyrite electrode is in contact with the electrolyte, and it is ensured that pyrite is in good contact with the electrode copper wire through the electrode casing. To improve the smoothness and freshness of the electrode’s surface, it is polished by using polishing powders of 10, 5, and 1 μm in sequence before electrochemical measurement, then the electrode is cleaned with ultrapure water and acetone, and finally, the electrode is blown dry with argon gas and coated with a film in vacuum for standby.
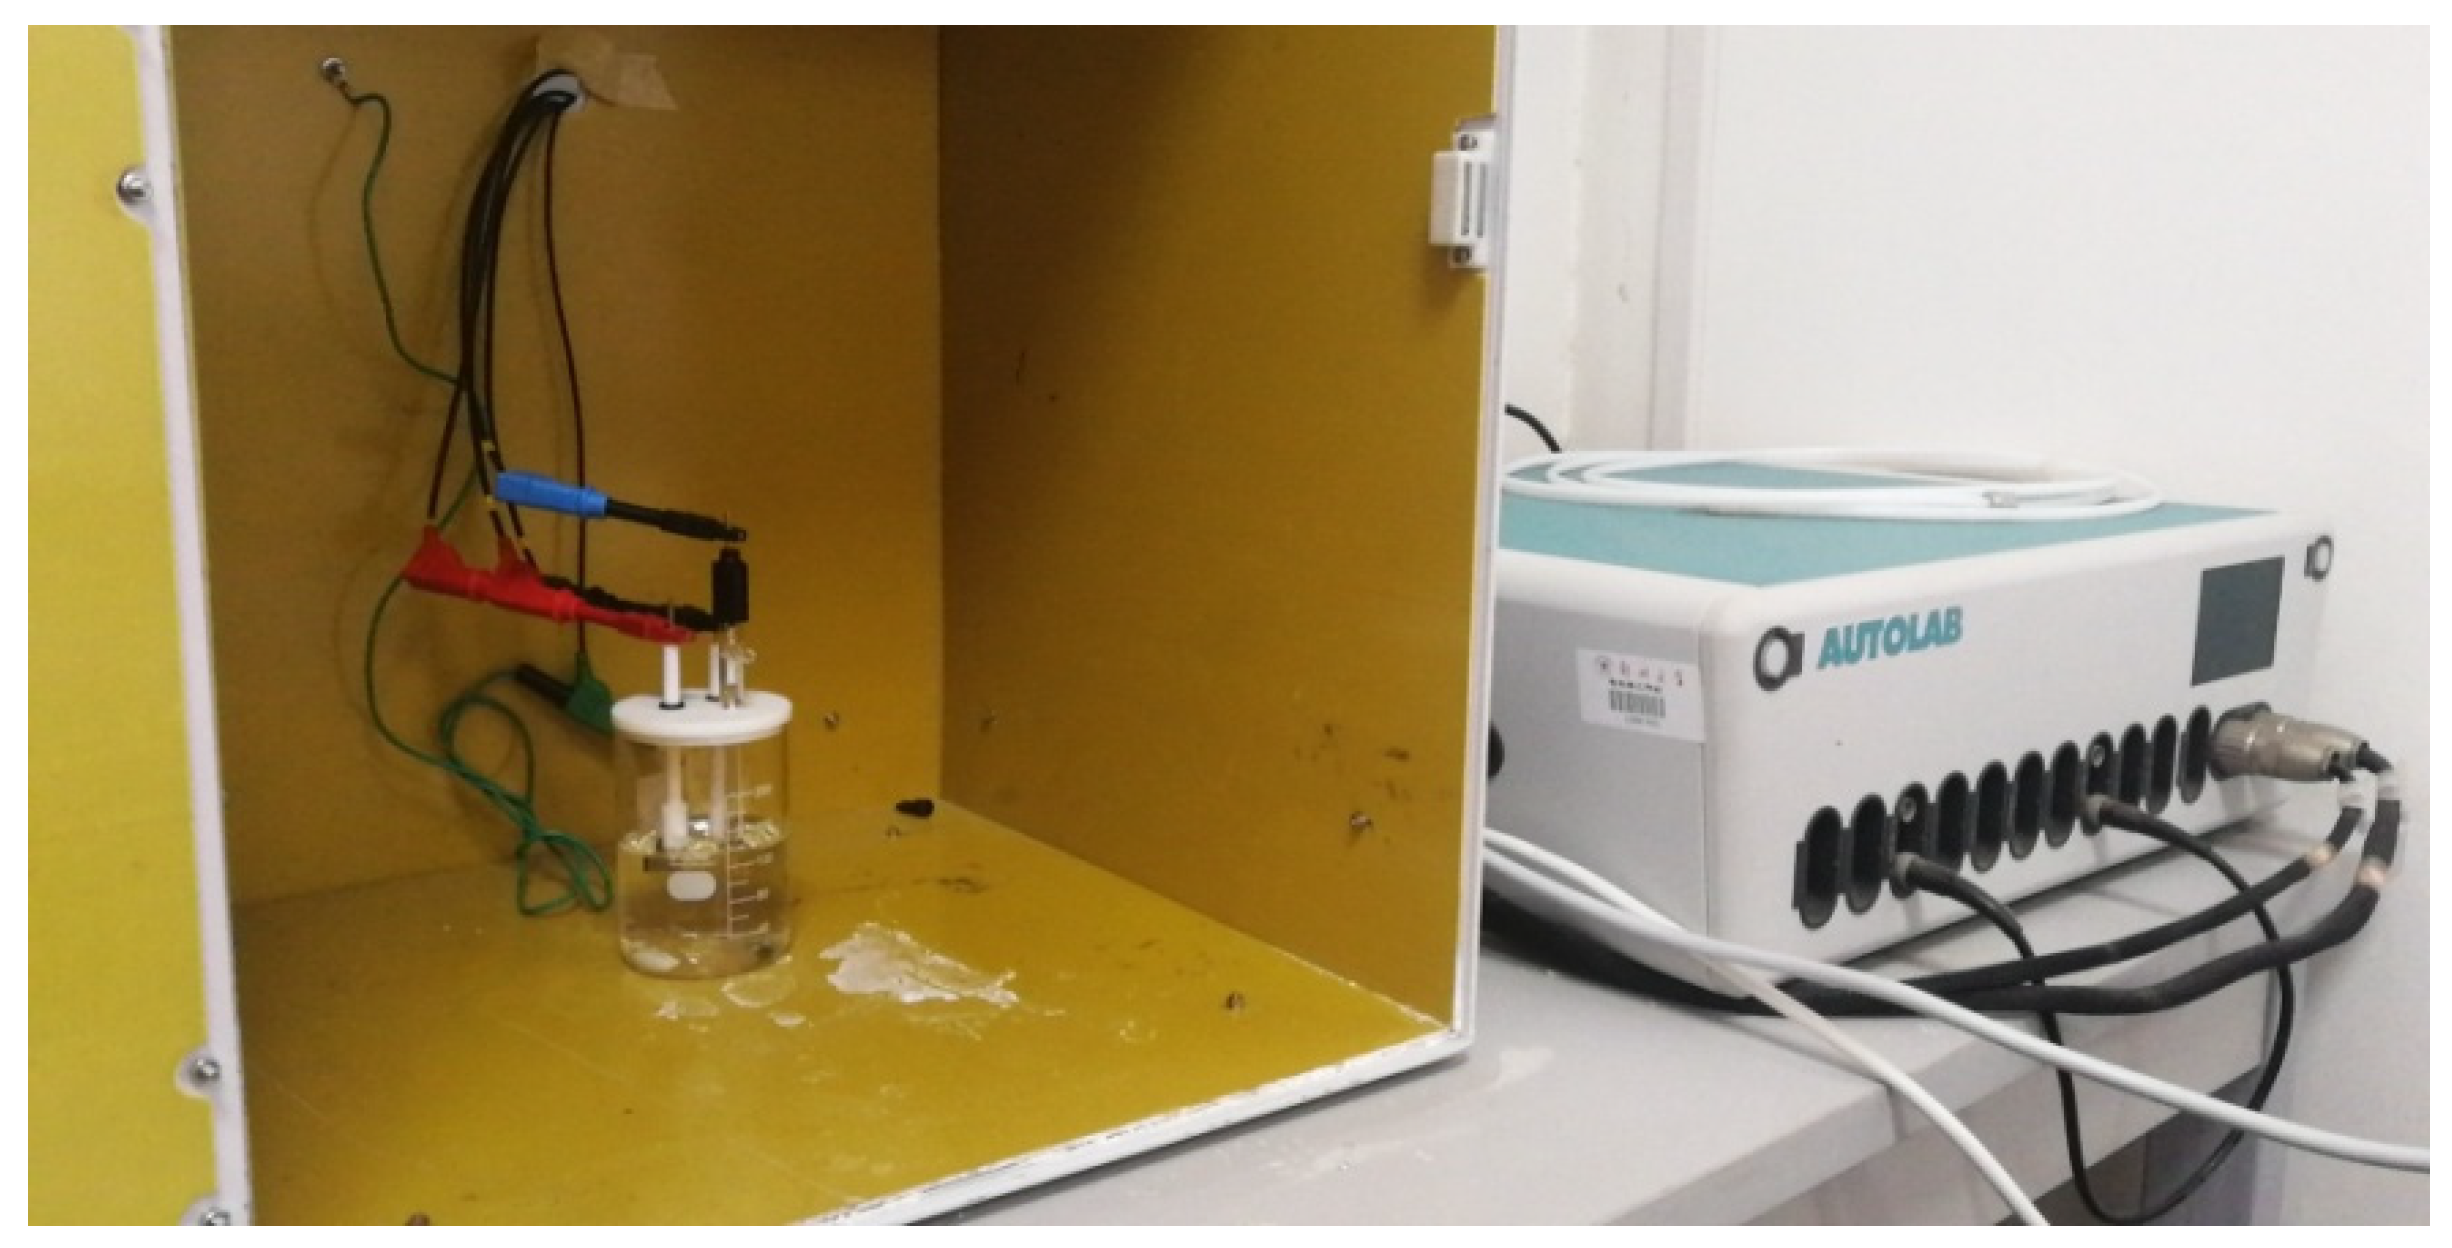
2.2. Electrochemical Device and Supporting Electrolyte
In this experiment, a cylindrical glass reactor with a capacity of 200 mL and an electrolyte of NaOH solution was used as the electrolytic cell for the electrochemical reaction test. During the test, a small amount of inert electrolyte, Na
2SO
4, was also added to increase the conductivity of the electrolyte and lower the liquid contact potential. Electrochemical measurements were performed using a three-electrode system. The working electrode was the previously prepared block pyrite electrode, the counter electrode was a platinum electrode with an area of 1 cm
2, and the reference electrode was the Hg/HgO electrode (filled with 1 M KOH). Unless otherwise stated, all potentials reported in this work are relative to Hg/HgO electrode (0.098 V vs. SHE at room temperature). The Autolab PGSTAT204 (Metrohm, Herisau, Switzerland) electrochemical workstation was used for the electrochemical measurements. The measurement data were automatically collected by a computer. The electrochemical test system (AUTOLAB) used in the tests is shown in
Figure 1.
2.3. Electrochemical Tests
Four different electrochemical testing techniques were used in the experiments, namely cyclic voltammetry (CV), linear scanning voltammetry (LSV), current–time (i-t), and electrochemical impedance spectroscopy (EIS). Before each electrochemical measurement, the working electrode was maintained in the electrolyte for 30 min to ensure stability or reproducibility.
After the working electrode was immersed in electrolyte for 1 h, the open-circuit potential (EOCP) was measured using an electrochemical workstation with a sampling time interval of 1 s for 30 min. In the early stage, the cyclic voltammetry curve with a wide range of potential was first carried out, and then the test range of potential was finally determined by the locations of the oxidation peak and reduction peak. LSV analysis was performed from EOCP to an applied potential of 1.4 V at a scan rate of 0.01 V/s. CV analysis was performed between −2 V and 0.5 V at a scan rate of 0.01 V/s. Tafel polarization curve experiments were carried out in an electrolyte with a pH of 12, a voltage measurement range of −0.5 to 0.4 V, and a scan rate of 0.01 V/s. With a holding time of 10 h, the i-t curves were measured at constant potentials of 0.4 V, 0.6 V, 0.8 V, 1.0 V, and 1.2 V, respectively. EIS curves were recorded in the frequency range of 0.05~105 Hz at potentials of 0.2 V, 0.4 V, 0.6 V, and 0.8 V in the electrolyte with a pH of 12. EIS data were fitted by using the software ZSimpwin 3.60 (2014).
2.4. X-ray Photoelectron Spectroscopy (XPS) Analysis
XPS analysis was performed by using a Thermo Escalab 250XI (Thermo Fisher Scientific, America) spectrometer under ultravacuum conditions (2 × 10⁻⁹ Torr) with an Al-Kα light source (hv = 1486.6 eV), operating voltage of 15 kV, a power of 25 W, and a temperature of 25 °C. The samples were analyzed using full spectrum scanning as well as fine spectrum scanning during the test, and the binding energies of the characteristic peaks of all elements measured were corrected by using C1s(284.6 eV) as a reference.
2.5. Sulfur Ion Analysis
On the basis of reviewing and analyzing the literature, a method for analyzing sulfur-containing ions in the electrolyte was developed through analytical verification:
- (1)
Determination of polysulfide ion concentration
Adjust the electrolyte pH > 9, take 10 mL, add 10% copper chloride solution dropwise until the dark green copper sulfide is completely precipitated, then filter the precipitate and wash it with acetic acid 5 times, dissolve the washed copper sulfide precipitate with 10 mL of nitric acid, then dilute the volume to 100 mL. Finally, the concentration of polysulfide ions is is determined through the converted determination of copper ions concentration.
- (2)
Determination of thiosulfate ion concentration
Take 10 mg of benchmark K2Cr2O7 solution, dissolve in 25 mL of distilled water; add 2 g of potassium iodide and 20 mL of 20% sulfuric acid solution; shake well; place in the dark for 10 min; add 150 mL of distilled water; titrate with the solution containing thiosulfate to be measured; towards the end of the titration, add 2 mL starch indicator solution (10 g/L); continue titration of the solution from blue into a bright green; calculate the thiosulfate concentration.
- (3)
Determination of sulfate and sulfite ion concentration
Ion chromatography was used for the determination of sulfate and sulfite ion concentrations; the specific steps were as follows: dispense 10 mL of the sample and pretreat it with a hydrogen column, then filter it through a 0.45 μm filter membrane, and then inject it into the autosampler for detection.
3. Results
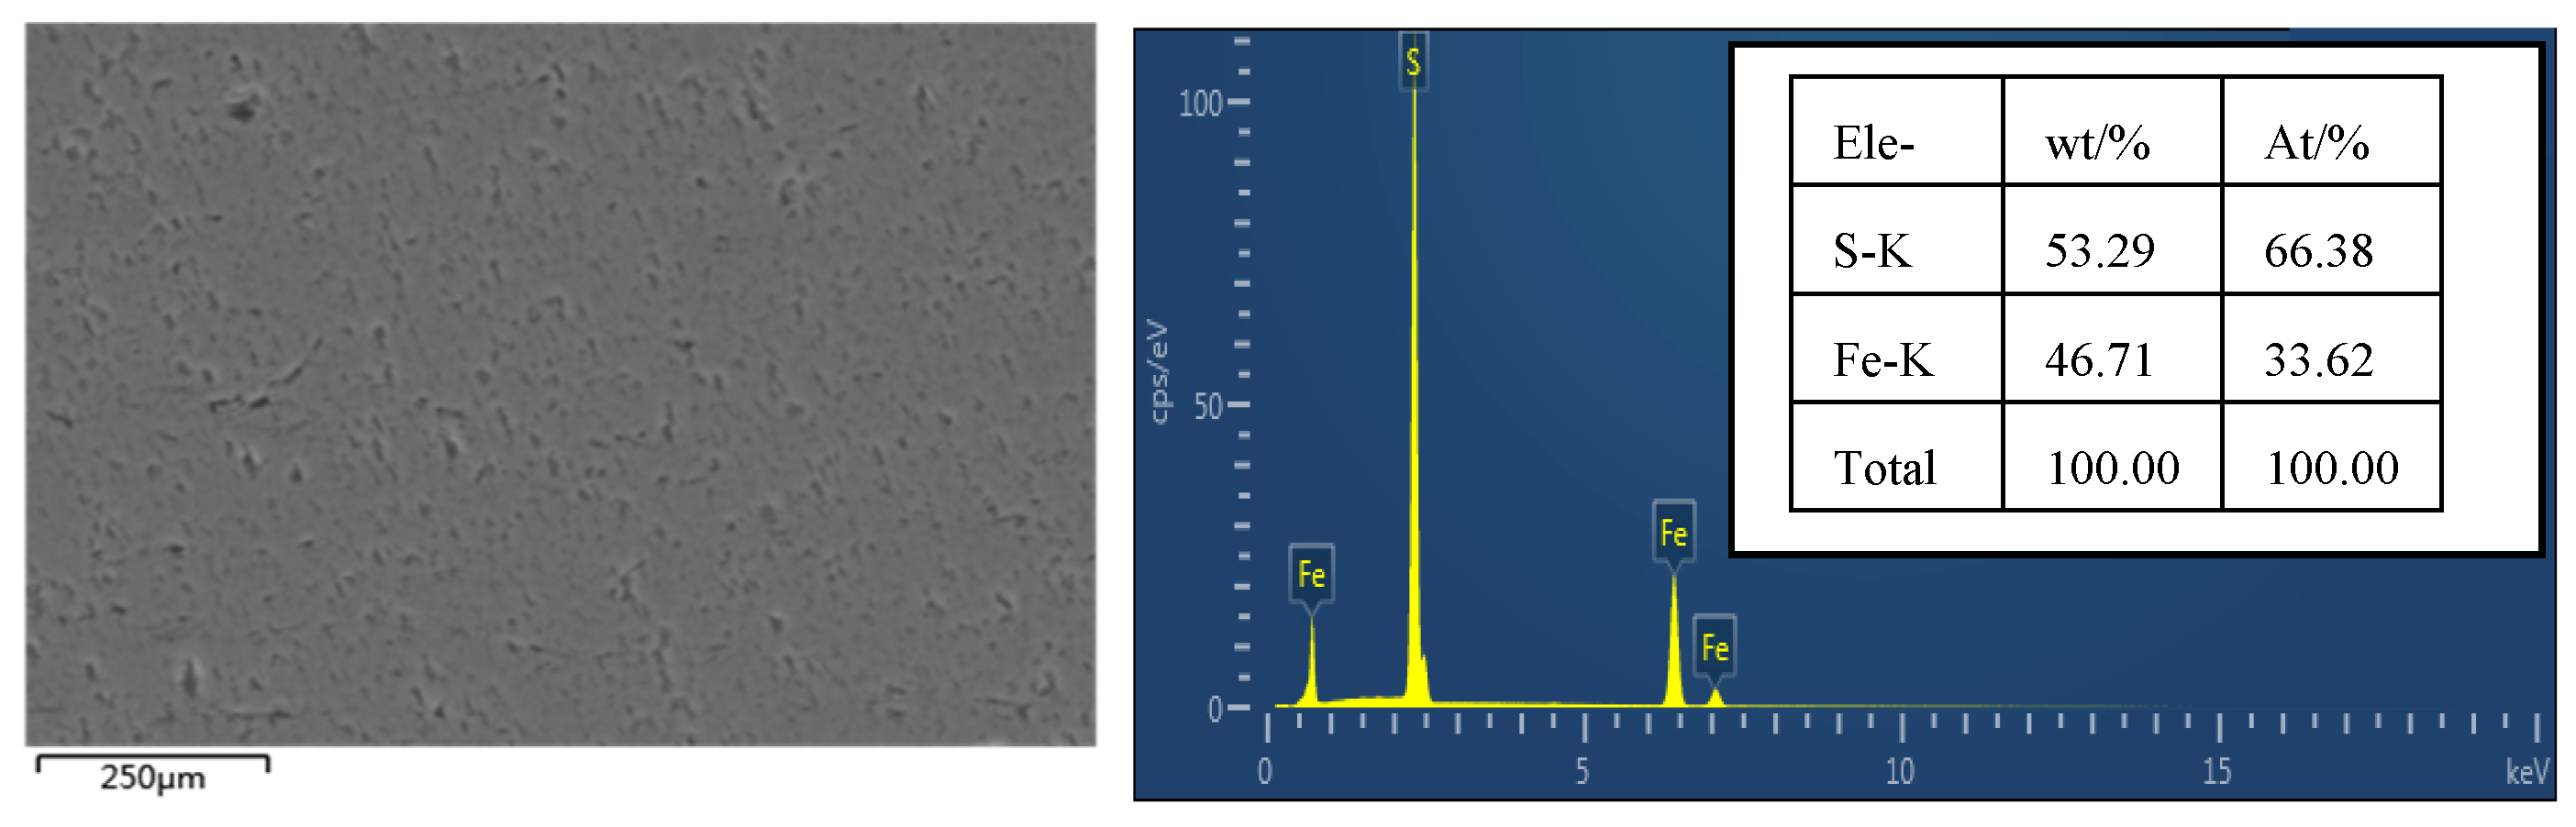
3.1. SEM Analysis of Original Pyrite Electrodes
SEM analysis of the surface of the original pyrite electrode without an oxidation reaction was performed, and the results are shown in
Figure 2. The surface of the pyrite electrode after grinding, polishing, and cleaning treatment is smooth, with occasional shadow spots, which may be caused by some impurities and lattice defects, and the EDS analysis results show that the elemental content of S is 53.29% and the elemental content of Fe is 46.71%, which is basically consistent with the elemental composition of pure pyrite.
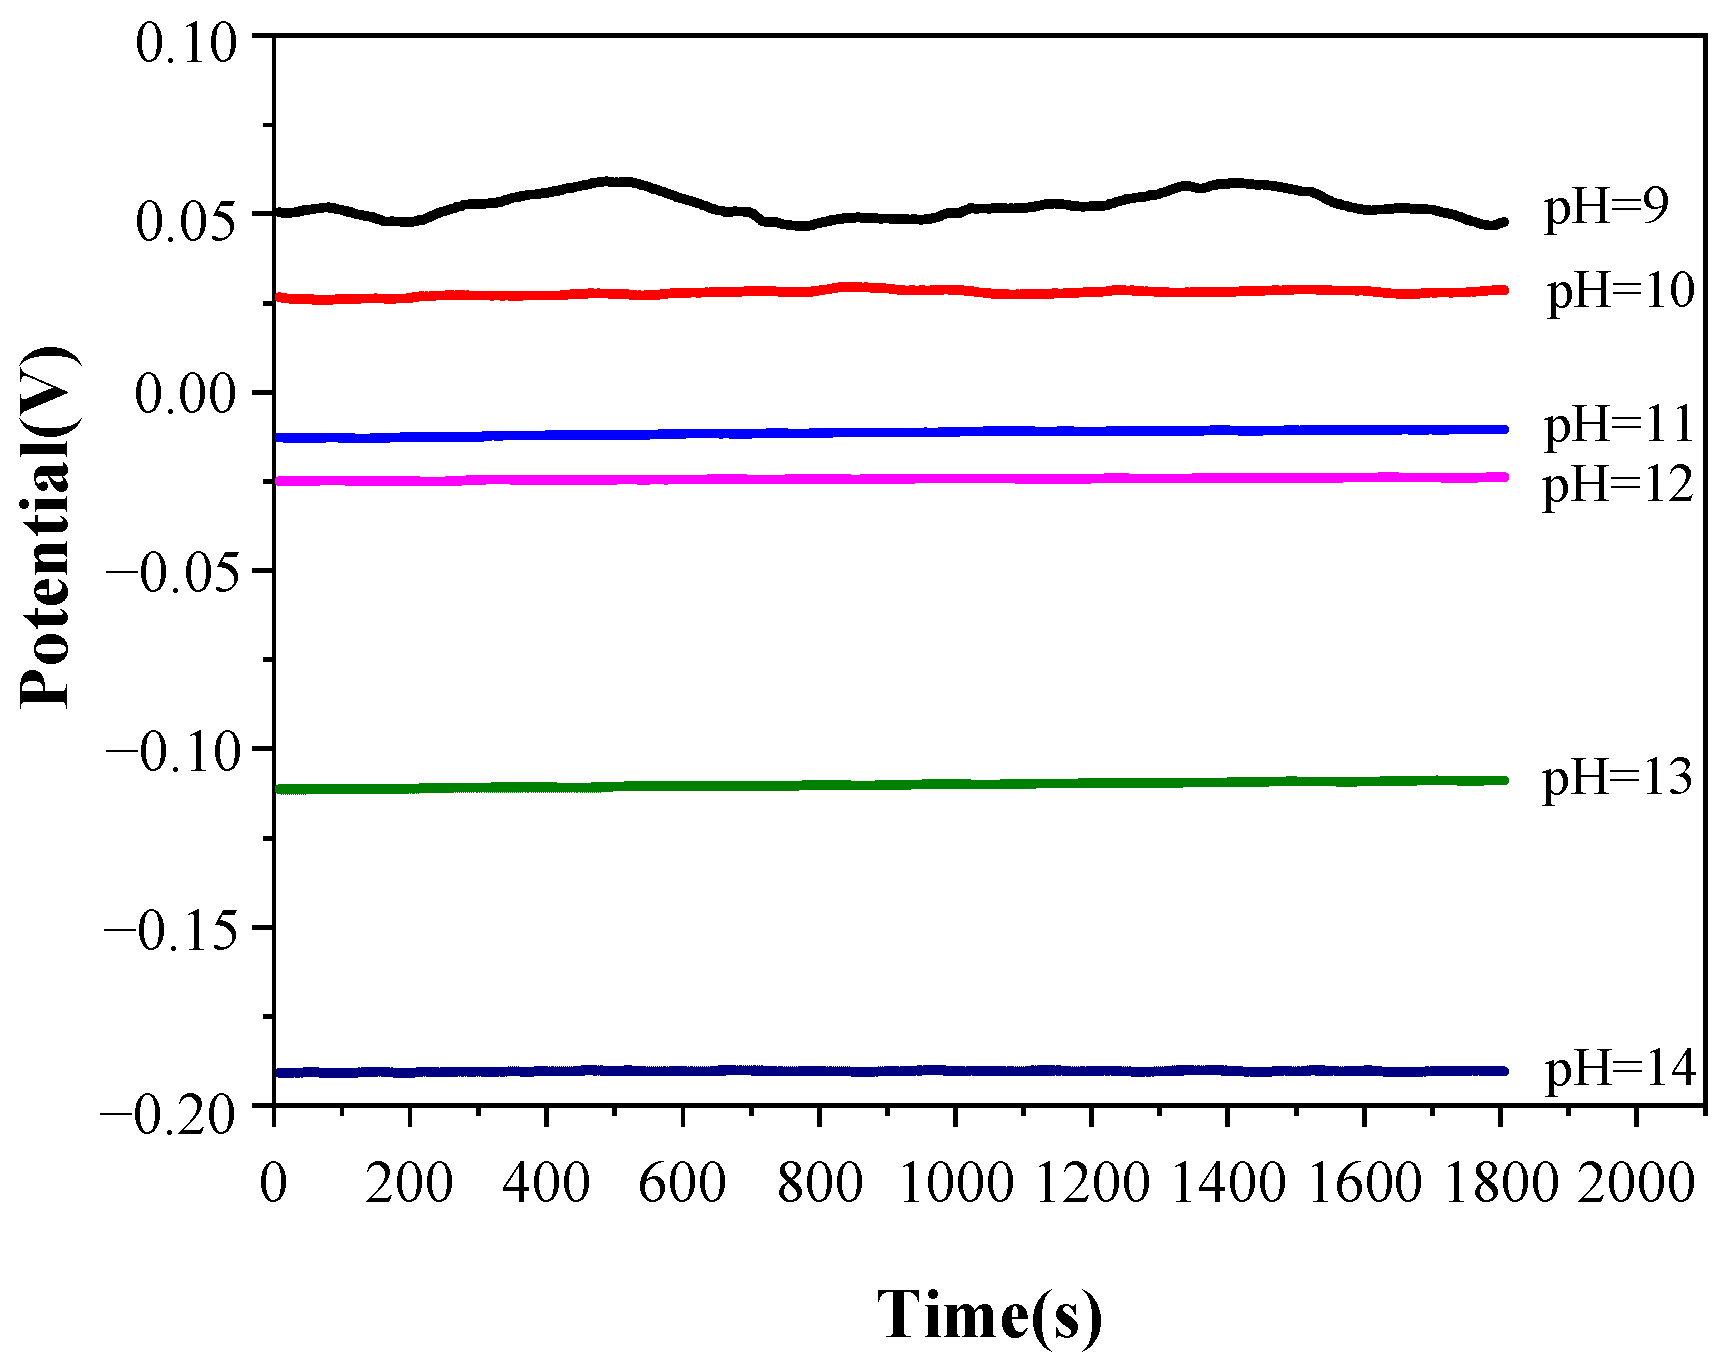
3.2. Open-Circuit Potential (Eocp) Measurement
To confirm the stability of the electrochemical test system, the pyrite electrode was immersed in a constantly stirred electrolyte with a temperature of 25 °C and a pH value ranging from 9 to 14 for 1 h, and then the E
ocp test was carried out. The test results are shown in
Figure 3.
According to
Figure 3, the E
ocp value is relatively unstable when the pH of the electrolyte is 9, which may be due to the weak potential difference fluctuation of the electrolyte caused by agitation, and the potential difference fluctuation cannot be ignored when the concentration of OH
− in the electrolyte is too low. When the pH value of the electrolyte is between 10 and 14, the variation in E
ocp with time is less than 2 mV, which indicates that the electrochemical testing system is relatively stable in this range of pH values. Therefore, the variation in the subsequent electrochemical test data is only caused by the alkaline oxidation reaction of the pyrite electrode. Furthermore, E
ocp decreases with the increase in the pH value in the electrolyte, which may be caused by a spontaneous oxidation reaction between the pyrite and the electrolyte when the electrochemical test system is in the open-circuit state. With the increase in the concentrations of S
x2− and S
2O
32− produced by pyrite oxidation in an electrolyte, the oxidation potential moves in a negative direction continuously.
3.3. Cyclic Voltammetry (CV) Measurement
According to the literature reports [
27,
33,
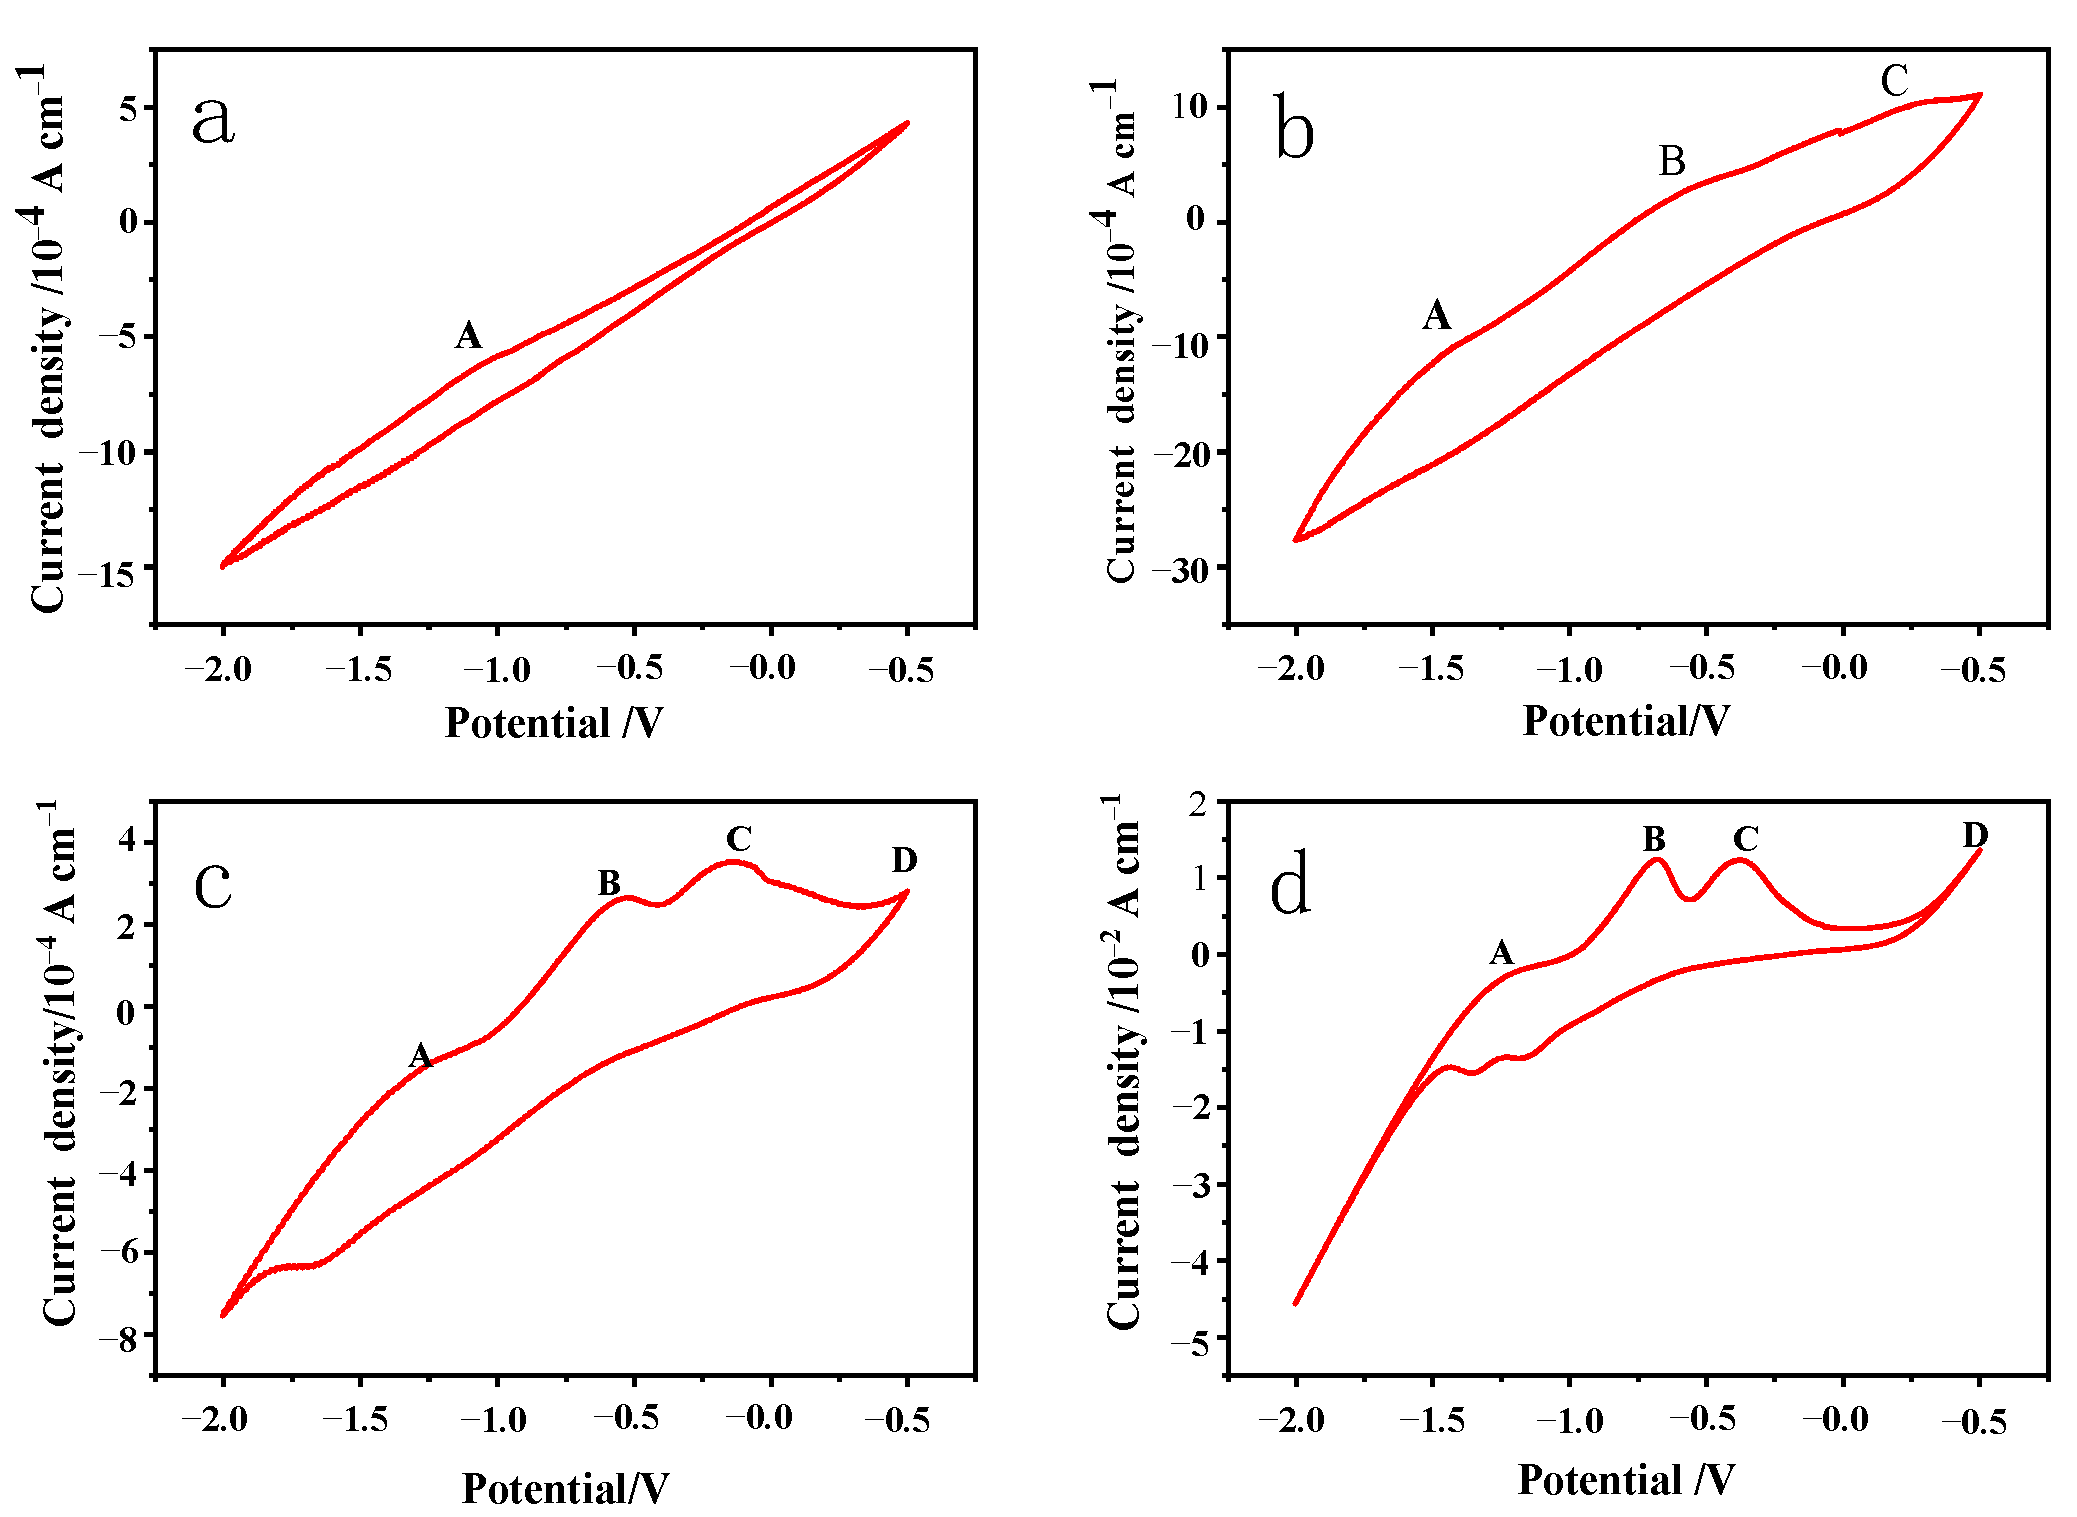
34], the potential interval for pyrite redox is generally between −1 and 1 V. Pre-exploratory tests showed that the oxidation potential tends to be more negative in alkaline environments, so the potential interval was chosen to be between −2 and 0.5 V for the CV tests. CV curves are recorded in
Figure 4 at a scan rate of 0.01 V/s in various pH value electrolytes, with the pH values of the electrolyte being adjusted to 10, 11, 12, and 13 with NaOH, respectively, a scan voltage of −2 V to 0.5 V, and a temperature of 25 °C. The number of scan turns was five, and the fourth scan turn’s results were used for data analysis.
With the increase in the electrolyte pH from 10 to 13, four electrochemical reaction anode peaks, A, B, C, and D, gradually appeared on the CV curves (
Figure 4), and the reaction intensity gradually increased, indicating that the oxidation intensity on the surface of the pyrite electrode was positively correlated with the reaction voltage. The oxidation peaks at B, C, and D were more noticeable, indicating that the strength of oxidation on the surface of the pyrite electrode was likewise positively associated with voltage. Furthermore, when the electrolyte pH increased, the reaction intensity gradually increased, indicating that the higher the pH value, the easier the oxidation reaction.
Because the reaction voltage is low and the oxidation intensity is weak, the chemical reaction (1) appears to take place primarily at the anode peak A, according to the available data [
35,
36]. At this point, the Fe-S bond in FeS
2 is broken to form Fe(OH)
2 and S
M, with Fe
1–xS
2 and S
X2− as the main components of S
M. The pyrite electrode continues to be oxidized as the oxidation voltage increases, and the anodic peak at B can be explained by the reaction shown in Equation (2), which states that Fe(OH)
2 is further oxidized into Fe(OH)
3, and the main components of S
L are S
0 and minor amounts of Fe
1–xS
2 and S
X2−. Furthermore, the anodic peak at C can be explained by the reaction shown in Equation (3), which states that Fe(OH)
2 is further oxidized into Fe(OH)
3, and the main components of S
L are further converted to SO
32−. Interestingly, when the CV curves at the pH values 13 and 14 are scanned at 0.50 V, a clear sharp oxidation peak D appears, owing to pyrite’s high oxidation reaction rate at relatively high voltages. Two chemical reactions occurred on the pyrite electrode at this high voltage: one was the oxidation reaction of the pyrite itself that formed Fe(OH)
3 and SO
42− (Equation (4)), and the other was the process of reoxidation of the surface oxidation product SO
32− formed at a low voltage to form SO
42− (Equation (4)).
The reduction peak of the pyrite bulk electrode is not apparent when scanned from 0.50 V to low potential, and the weak reduction peak can be observed only at pH 12. It is inferred that the reduction of the oxidation product Fe(OH)
3 to Fe
2+ occurs between −1.4 V and −1.6 V when the pH is 13 or 14 (as shown in Equation (6)). There is subsequently a smaller reduction peak, which may indicate that pyrite or its products are directly reduced to form H
2S or ferrous sulfides (Equation (7)). The analysis of the electrolyte composition also reveals that a low concentration of S
2− existed in the electrolyte solution.
3.4. Linear Sweep Voltammetric Curve (LSV) Measurements
According to the literature reports [
27,
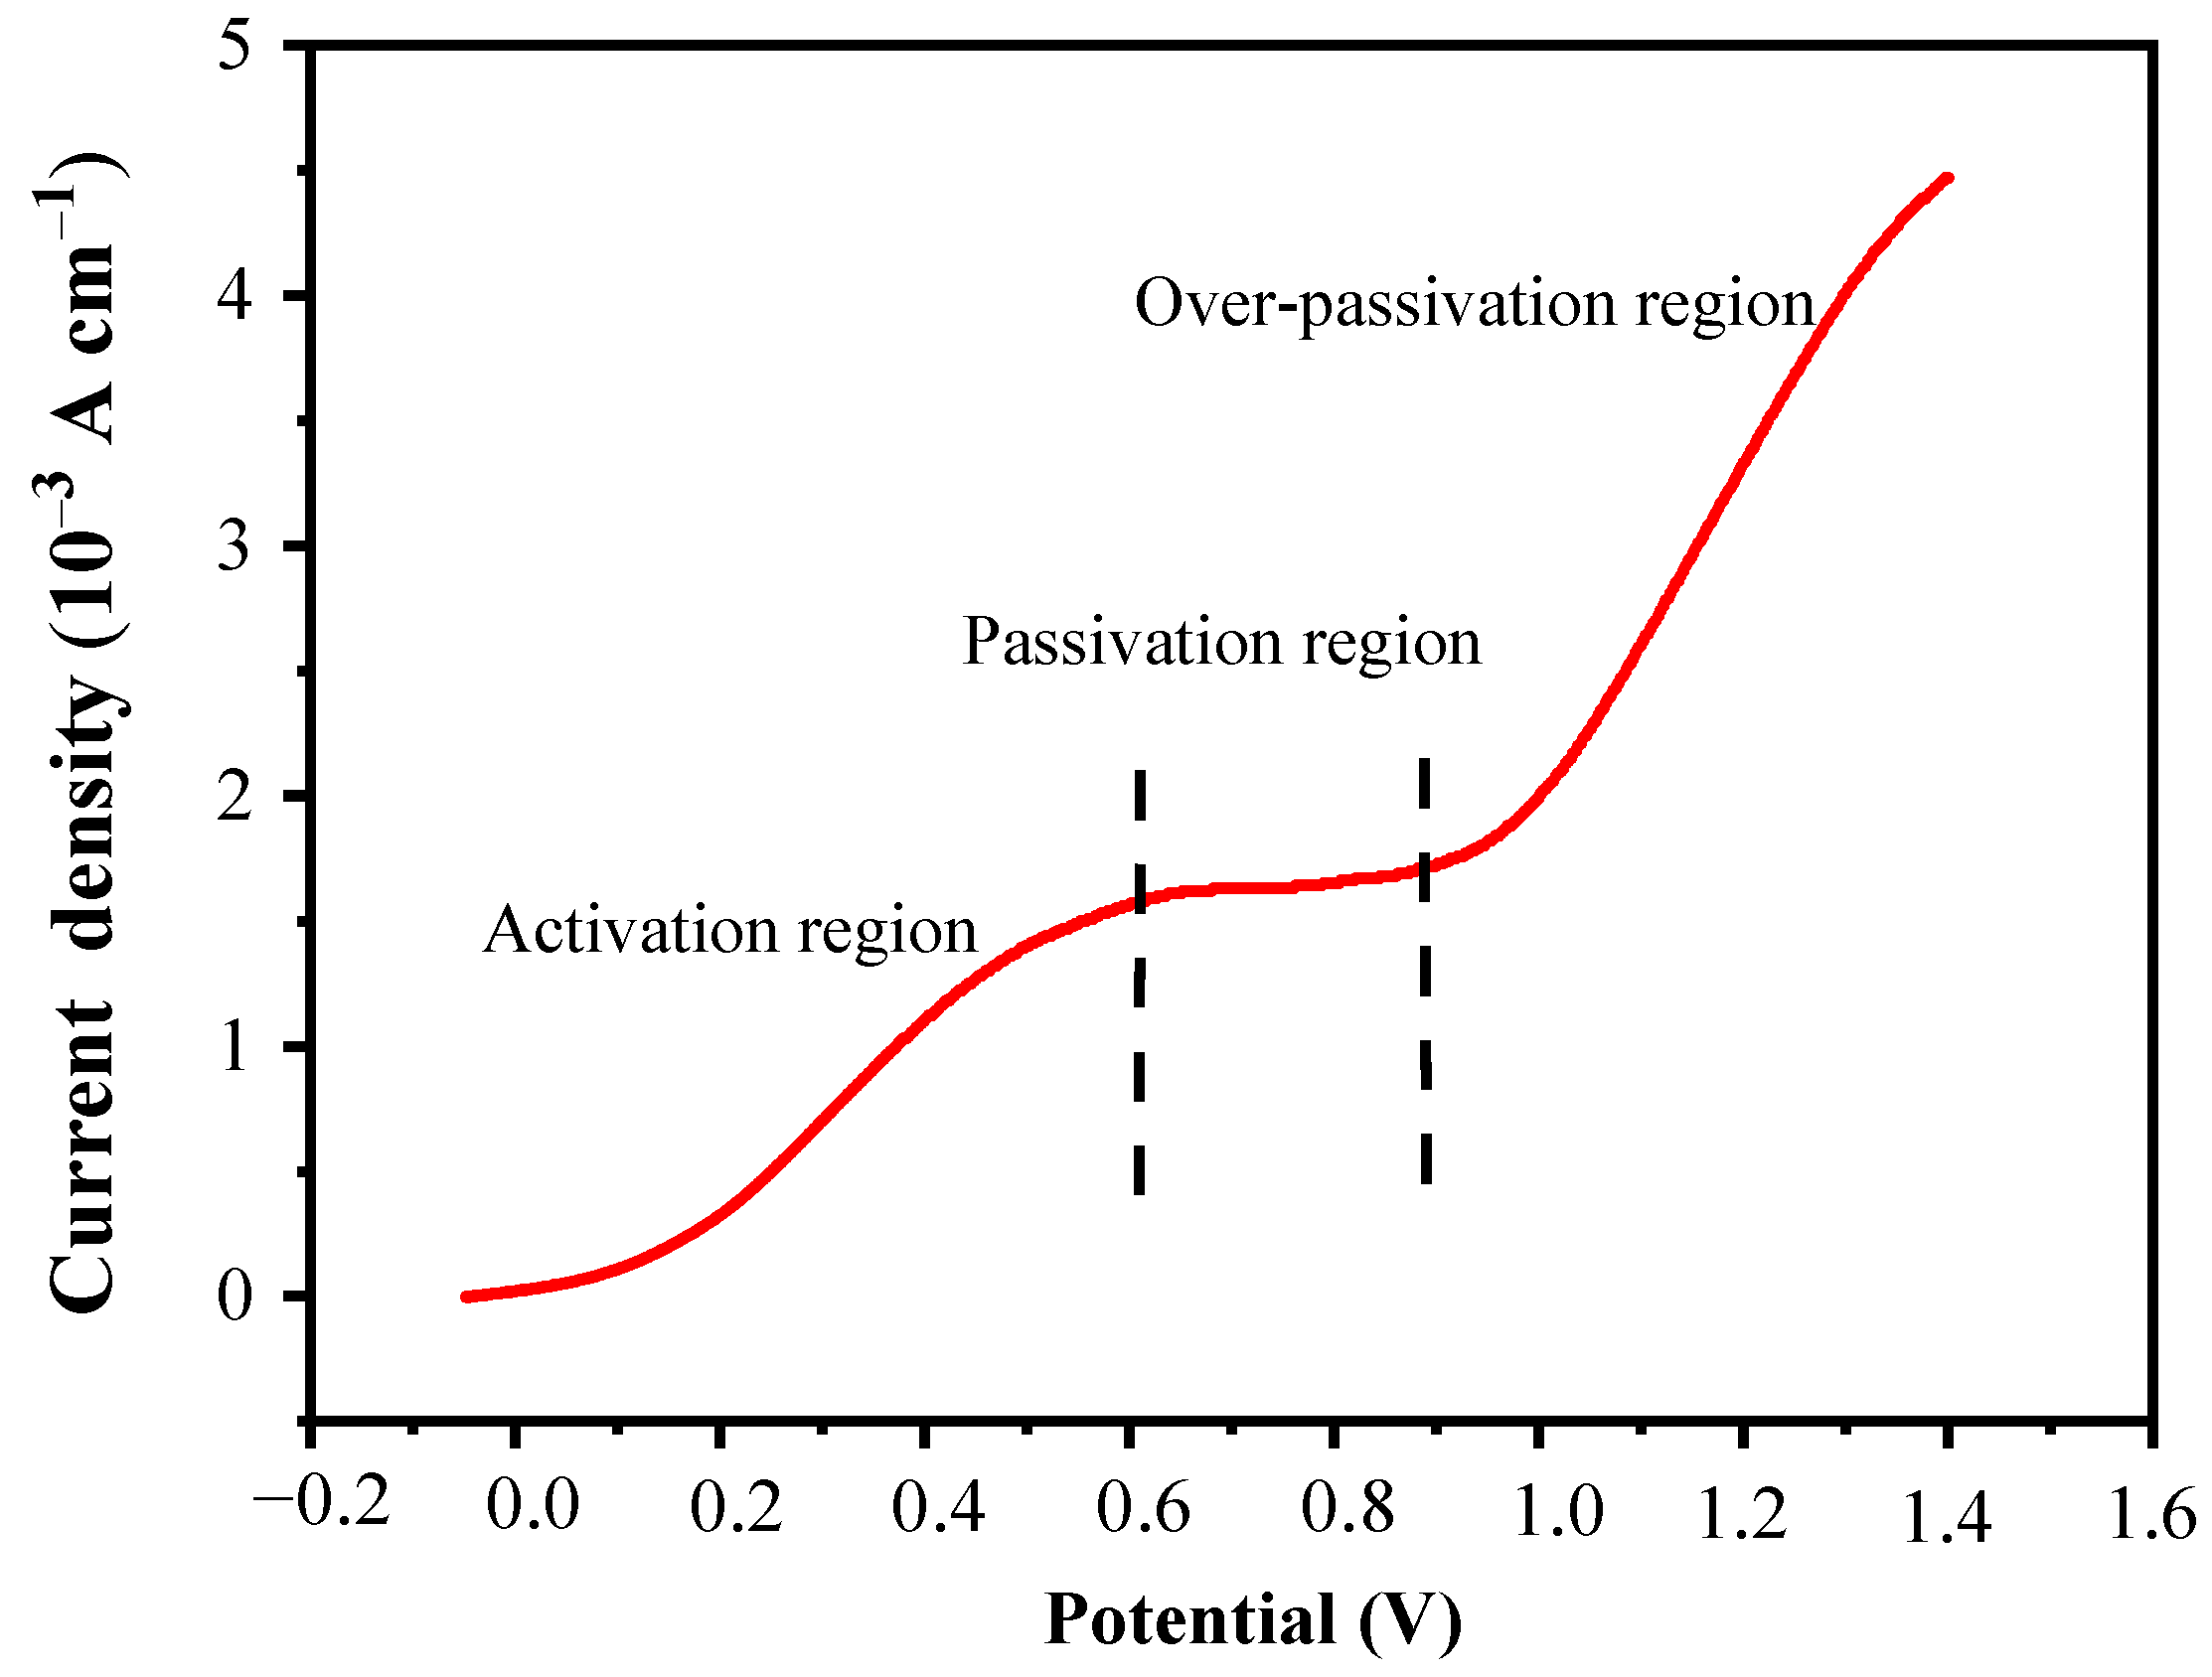
28], the passivation potential interval when pyrite is oxidized is generally between 0.5 and 1 V. Pre-exploratory tests have shown that the oxidation potential tends to be more negative in alkaline environments, so the potential interval was chosen to be between −2 and 0.5 V for the LSV test. The LSV curve test of the pyrite electrode was conducted in an electrolyte at pH 12 and 25 °C. The test voltage was from 0 V to 1.4 V and the scan rate was 0.01 V/s. The test results are shown in
Figure 5.
In this LSV curve, three distinct regions can be divided: the active region, the passive region, and the over-passive region, as shown in
Figure 5. In the active region between 0 and 0.6 V, the current density increases rapidly with the increase in voltage, which is likely due to the oxidative dissolution of pyrite in this voltage range. In the passivation region between 0.6 and 0.9 V, the current density is almost constant, and the response to the voltage increase is not obvious; this may be because the oxidation products of pyrite, such as Fe(OH)
2, Fe(OH)
3, and so on, deposit on the electrode surface to form a passivation layer, which prevents the current density from continuing to increase with the voltage increase. In the over-passivation region of 0.9~1.4 V, the current density increases rapidly again with the increase in voltage. This is likely because when the voltage increases to 0.9 V, the high voltage provides a stronger driving force for the reaction to break down the passivation layer, so the pyrite covered by the passivation layer can continue to be oxidized.
3.5. i-t Curve Measurements
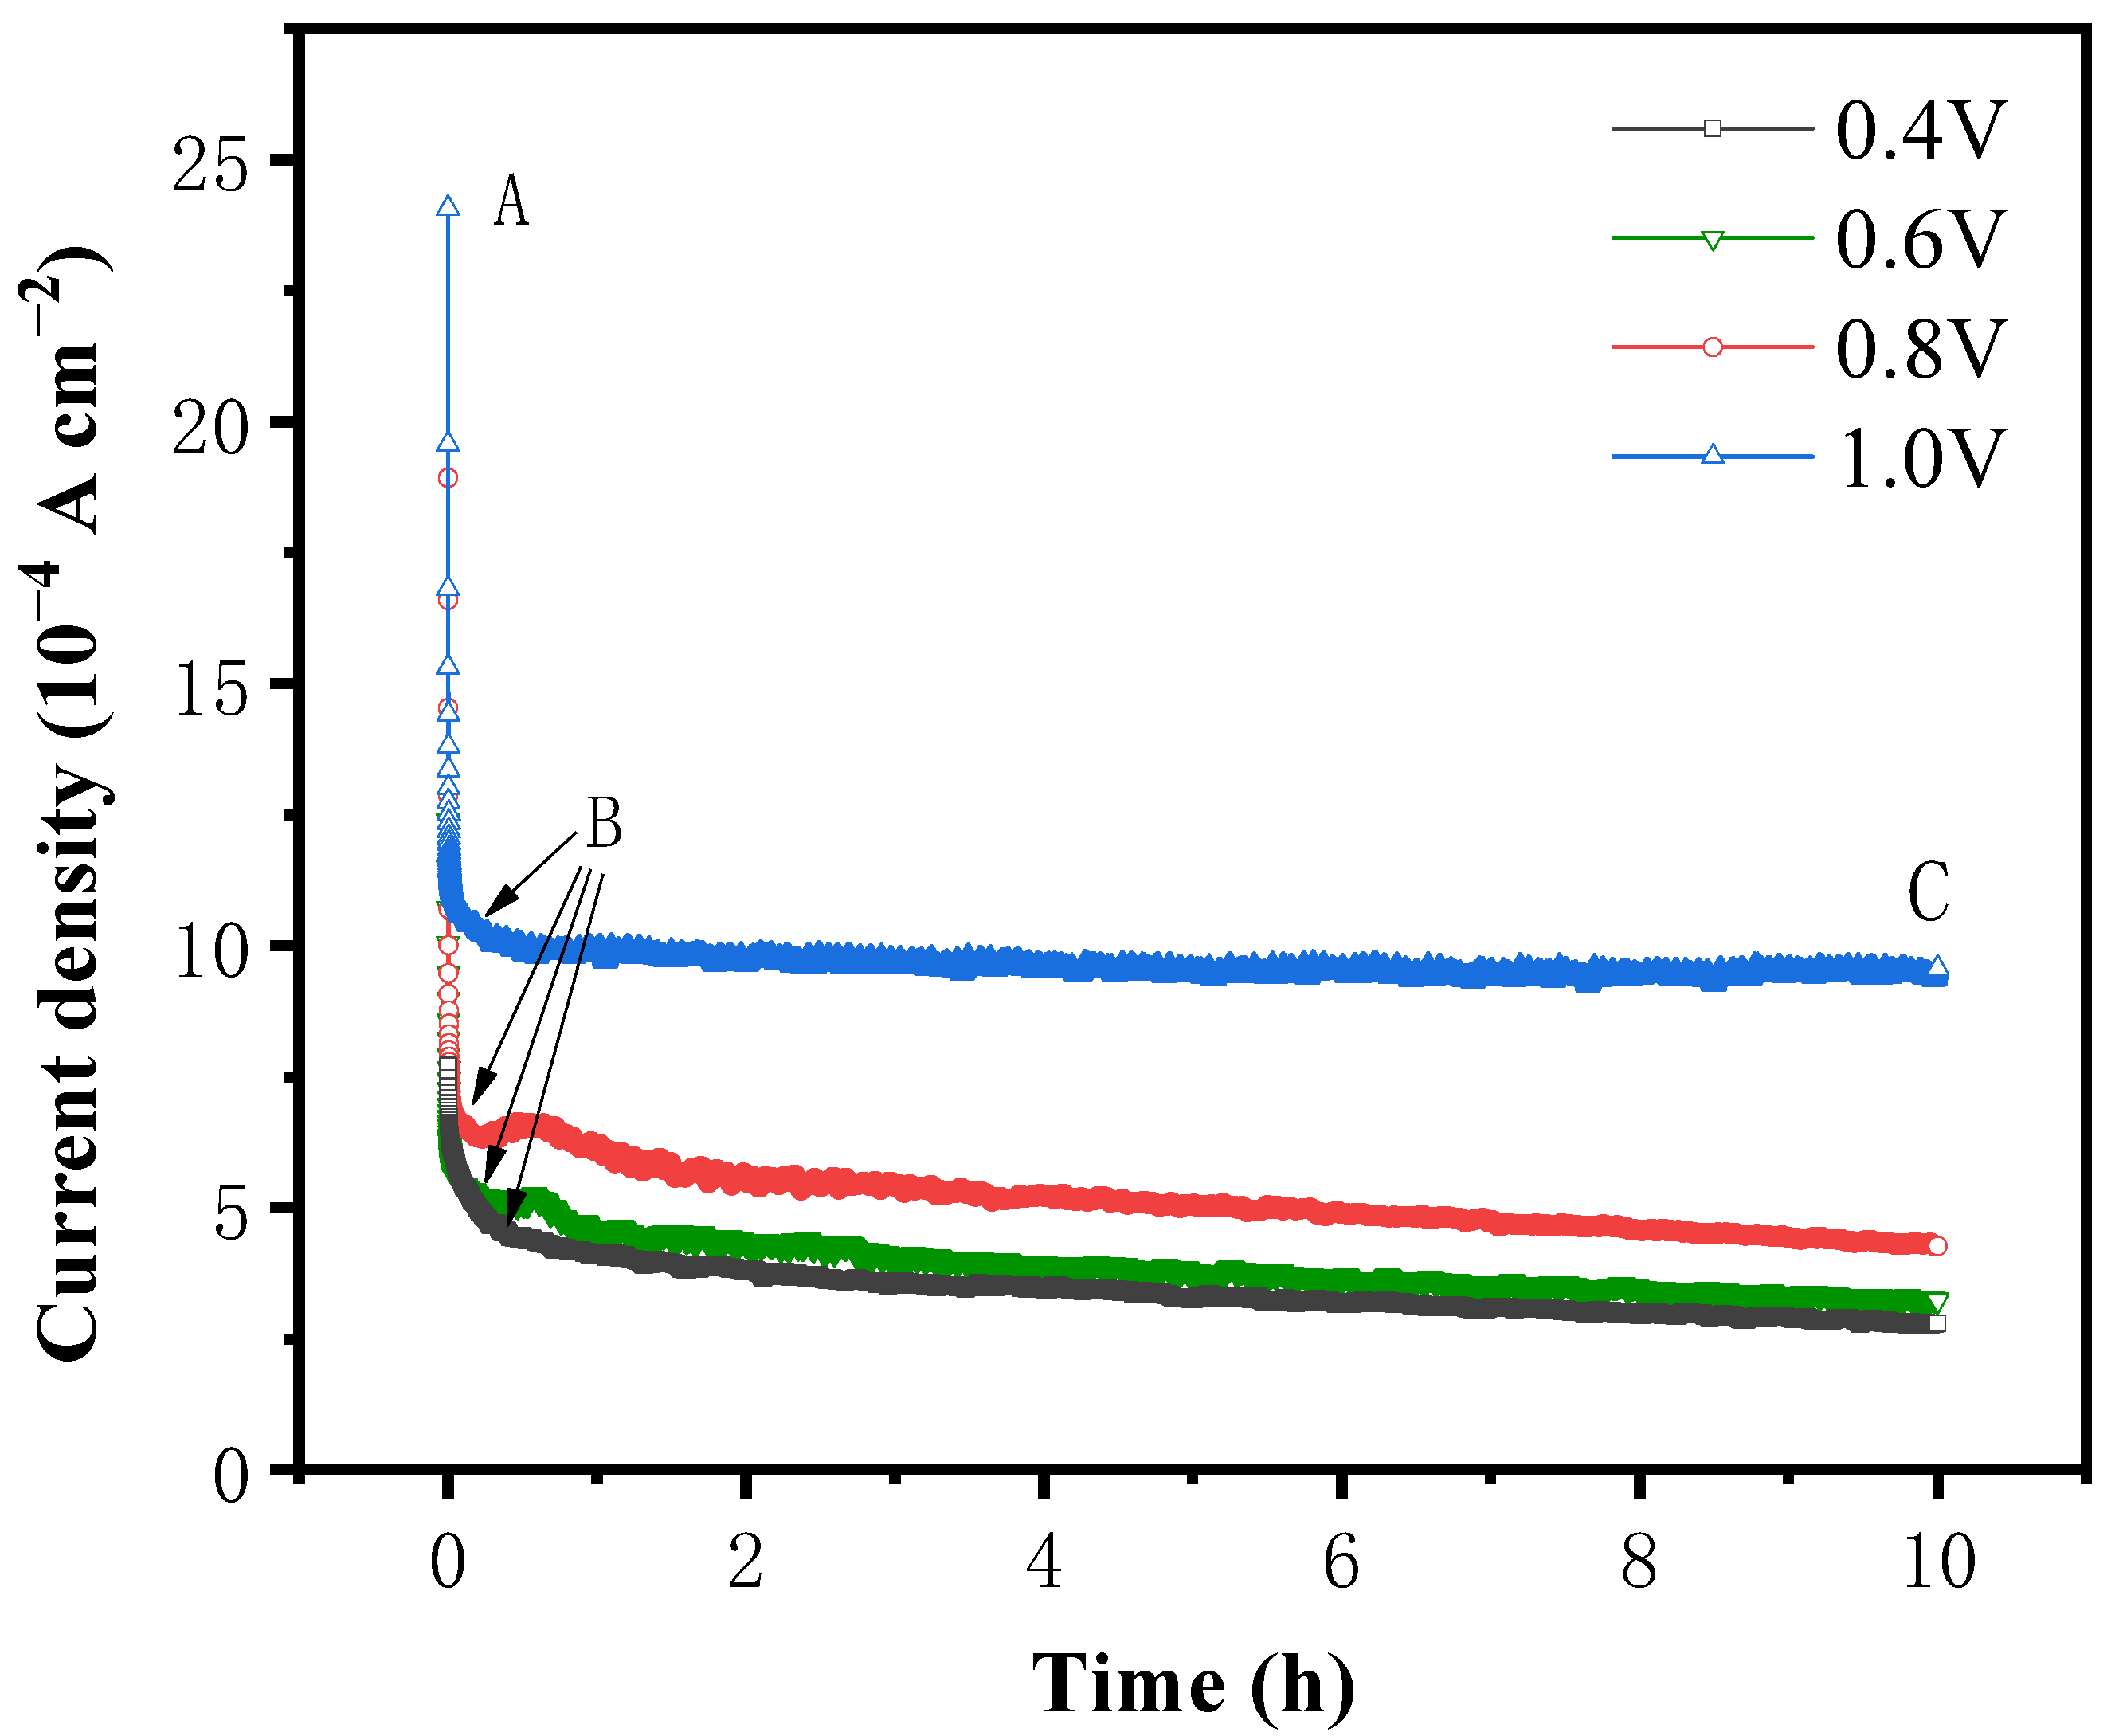
The results of CV and LSV demonstrate that the oxidative dissolution of pyrite occurs over a broad range of voltages. To determine the accumulation of products on the surface of pyrite over time and to observe the oxidative dissolution on the surface of pyrite, an i-t curve test was performed at pH 12 and 25 °C for the pyrite electrode at test voltages of 0.4 V, 0.6 V, 0.8 V, and 1.0 V, respectively. The results are shown in
Figure 6.
As depicted in
Figure 6, at all four potentials, the current densities finally tended to be steady at the lower value after dropping acutely within the first several minutes. The variation in current density with reaction time can be roughly divided into two stages, AB and BC. In the AB stage, the initial current density increases with the rise in the applied potential, while the current density decreases rapidly as the reaction time decreases. In the BC stage, the current density tends to be stable with the increase in the reaction time. In addition, with higher system potential, the relatively stable current density is also higher.
As the electrochemical oxidation reaction occurs on the surface of the pyrite electrode under the action of the applied potential, the reaction products rapidly accumulate on the surface of the pyrite and form a passivation layer, which hinders the reaction to a certain extent, resulting in a rapid decrease in current density in the AB stage. In addition, the increase in voltage accelerates the decrease in current density in the AB stage because the higher the voltage, the faster the oxidation and dissolution rates of pyrite, the faster the formation of the passivation layer on the surface of pyrite per unit time, and the greater the degree of hindrance to the reaction.
When the potential was between 0.4 V and 0.8 V, the current density in the BC stage increased slightly with an increase in voltage and decreased with time. This may be because the passivation layer formed in the AB stage failed to completely prevent the oxidation reaction from proceeding, resulting in the accumulation of the passivation layer with the extension of the reaction time and the gradual deepening of the impeded reaction, so that the current density showed a gradual decrease with time. When the potential reaches 1.0 V, the current density in the BC stage basically does not change with time, indicating that the oxidation reaction is faster in the AB stage under high potential conditions, and the passivation layer can quickly reach the thickness that prevents the reaction from proceeding, which in turn makes the reaction rate in the BC stage extremely slow. The hindering effect of the passivation layer on the reaction also remains stable, and the current density also tends to be stable.
3.6. Electrochemical Impedance Spectroscopy Analysis
Electrochemical impedance spectroscopy is an important electrochemical measurement technique that obtains information about the properties of the electrode surface by applying a sine wave signal between the electrode and the electrolyte interface and measuring its impedance response. The principle of the technique is based on circuit theory, and the reaction mechanism and charge transfer kinetics of the electrode surface can be inferred by analyzing the change in impedance with frequency. The principle of electrochemical impedance spectroscopy is based on the equivalent circuit model; that is, the system between the electrode and the electrolyte interface is equivalent to the resistance, capacitance, and inductance components in a circuit. When a sine wave signal is applied to the circuit, the impedance response depends on the characteristics of the individual components and their interactions with each other. By analyzing the response signal, information about the surface properties of the electrode can be derived, such as the thickness of the surface film, the charge transfer coefficient, and the ion diffusion coefficient.
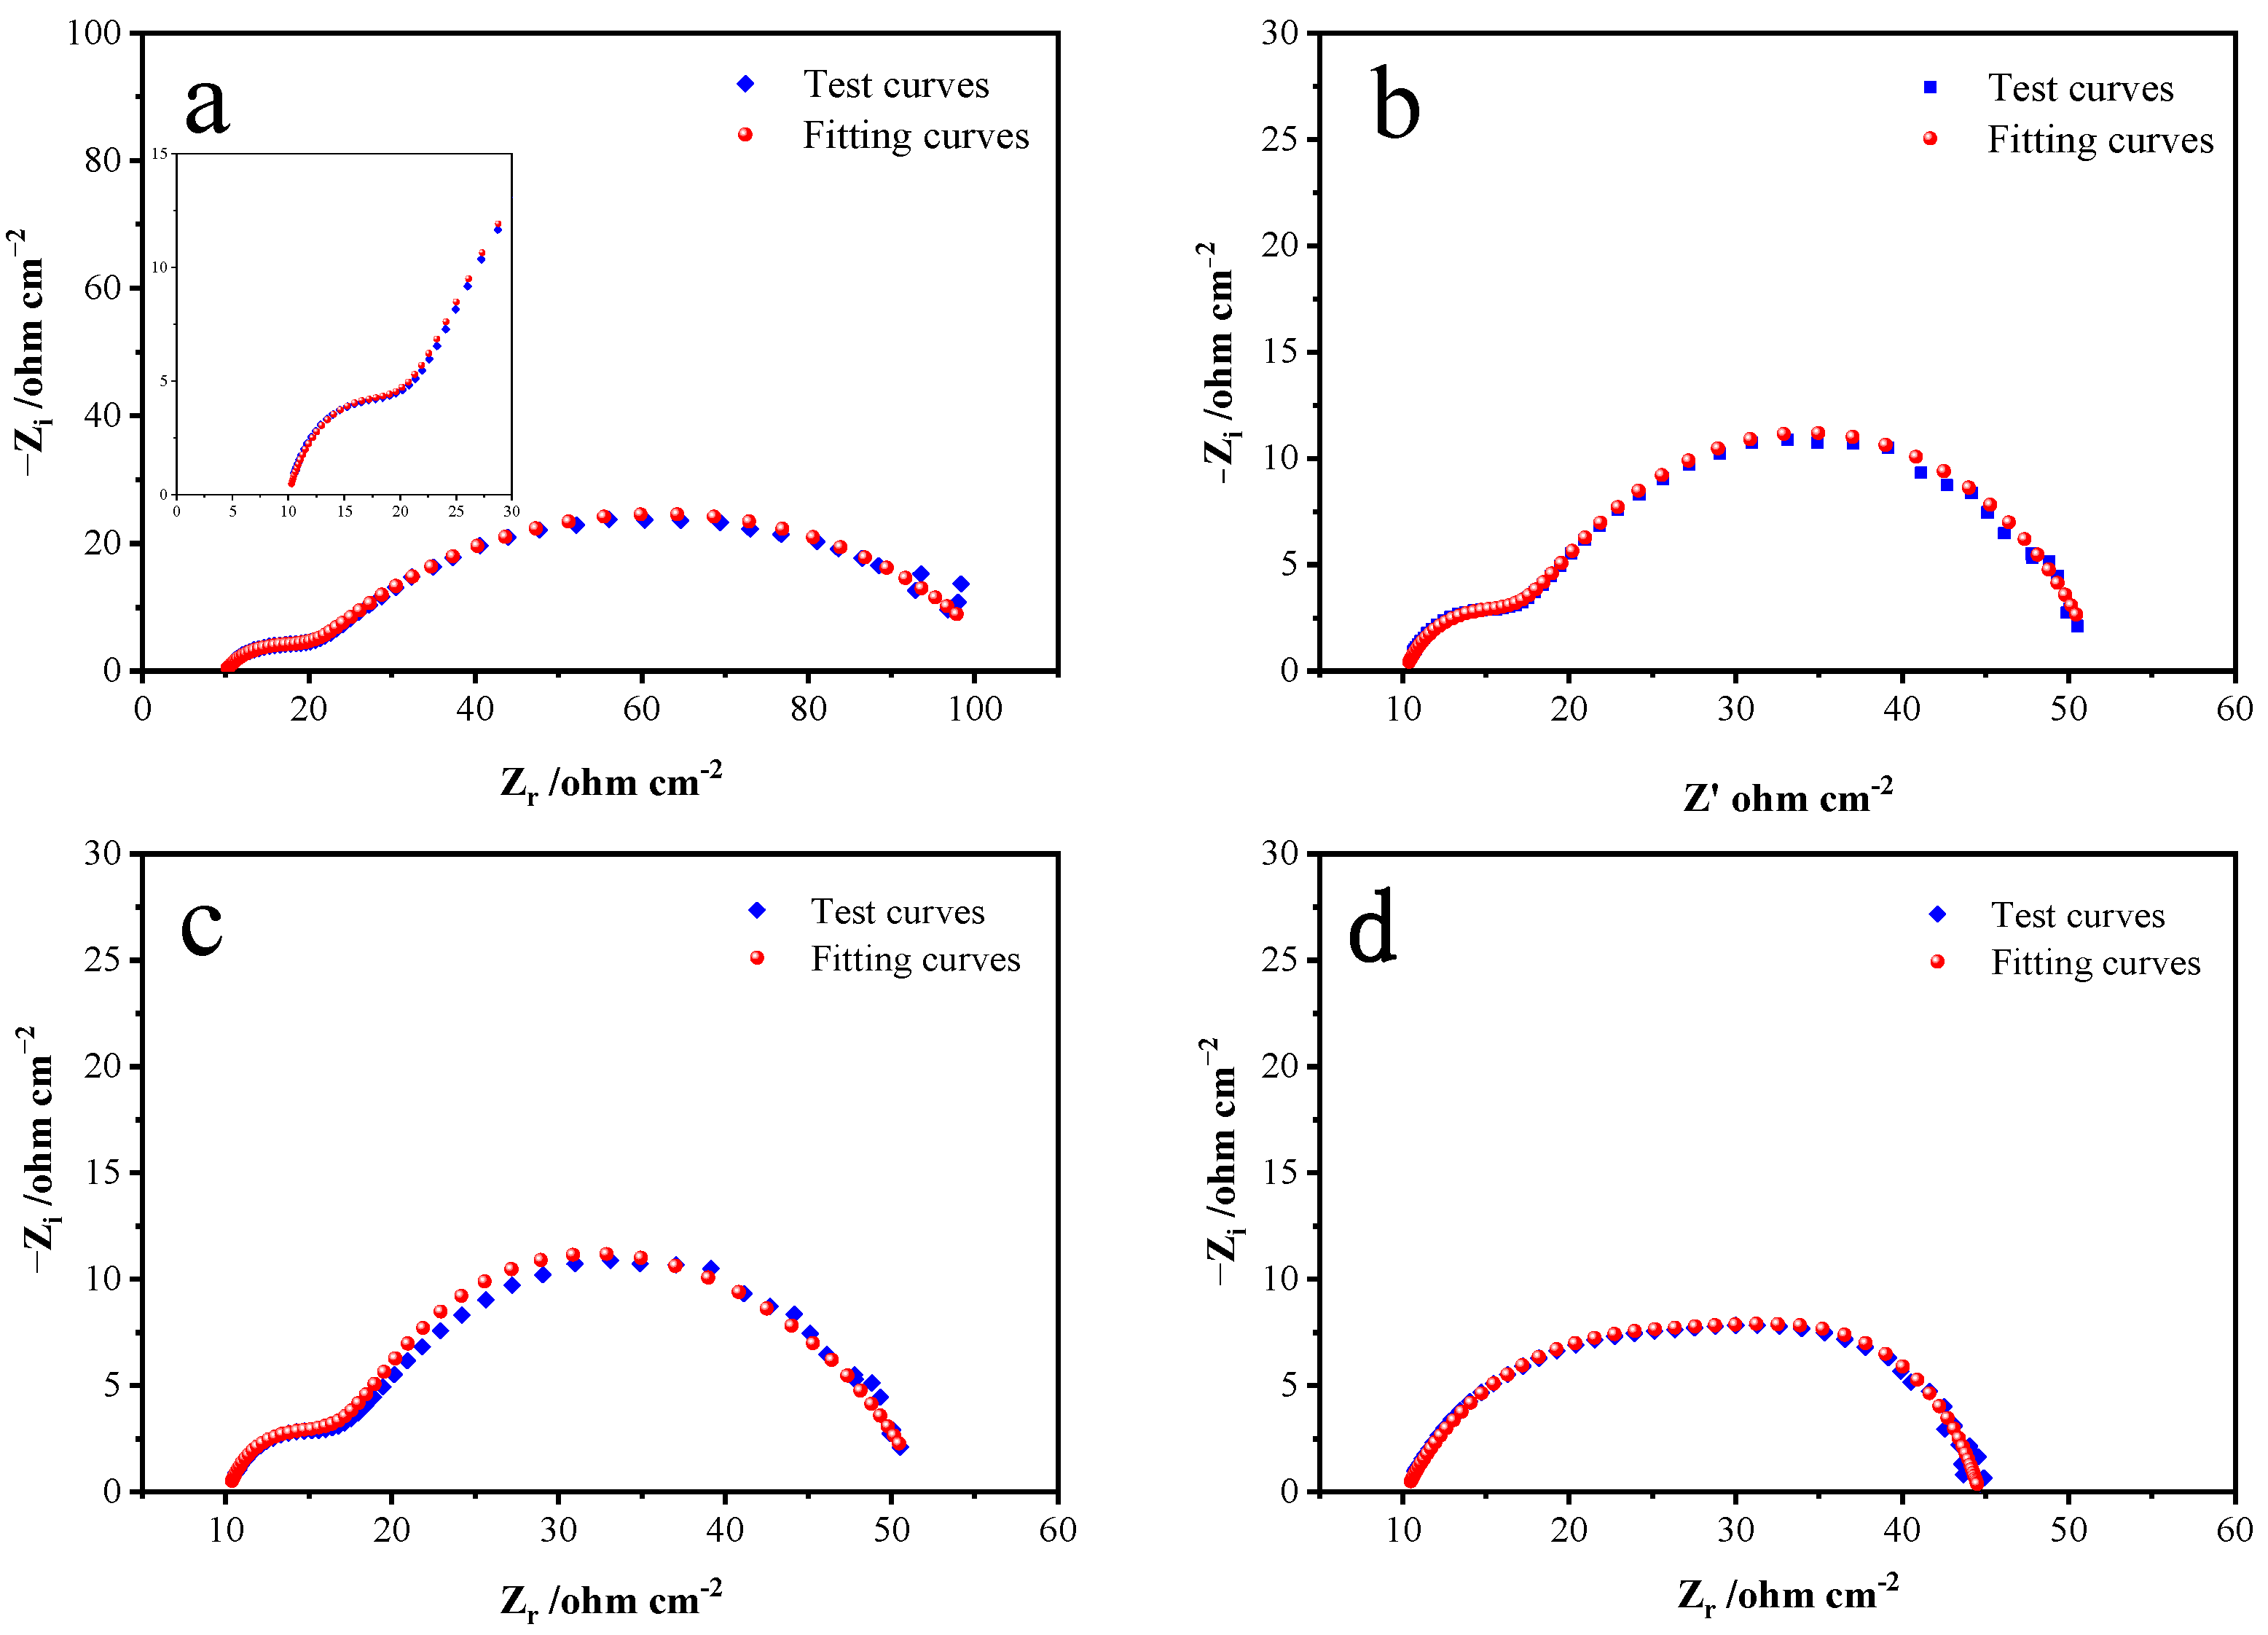
An EIS test was conducted at a pH level of 12 and a temperature of 25 °C. The frequency scanning range was 0.01~1 × 10
5 Hz, and the amplitude was 5 mV. The fitted Nyquist plots by the equivalent circuits at specific potentials of 0.5, 0.6, 0.7, and 0.8 V in the alkaline electrolyte are respectively shown in
Figure 7. The fitting parameters of the equivalent circuits simulated from the EIS are shown in
Table 1.
As can be seen from
Figure 7, a small semicircular arc and a large one appear successively in the high-frequency region and the middle-frequency region. The small semicircular arc in the high-frequency region corresponds to capacitance related to the electrode–solution interface, and the large semicircular arc in the middle-frequency region is generated by the Heimholtz double capacitance layers on the pyrite electrode surface. According to
Figure 5 and
Figure 6, when the system potential is between 0.2 and 0.6 V, the pyrite electrode is in an activation zone during the alkaline oxidative dissolution process, the reaction products have not yet formed a stable passivation layer on the electrode surface, and the electrochemical reaction is active, which means that the passivation layer is not enough to hinder the chemical oxidation reaction and the electrode reaction rate is primarily controlled by the electrochemical reaction. The deviation of the small semicircular arc in
Figure 7 from the standard semicircular state is due to the polarization of the electrode surface as the frequency decreases, and the chemical reaction caused by the polarization also results in another larger arc until the S
0 and Fe(OH)
3 generated during the chemical reaction adsorb on the electrode surface to form a passivation layer, and as the passivation layer thickens, it finally leads the chemical reaction to stop, and the real and imaginary parts are basically no longer changeable. For the same reason, there is no Warburg impedance characteristic slope line with a representation of the diffusion process in the impedance diagram’s low- and middle-frequency regions. As the potential continues to rise to 0.8 V, the distinction between the small and large semicircular arcs becomes no longer obvious; this is because the chemical reaction process accelerates at higher potentials, obscuring the surface polarization of the electrode.
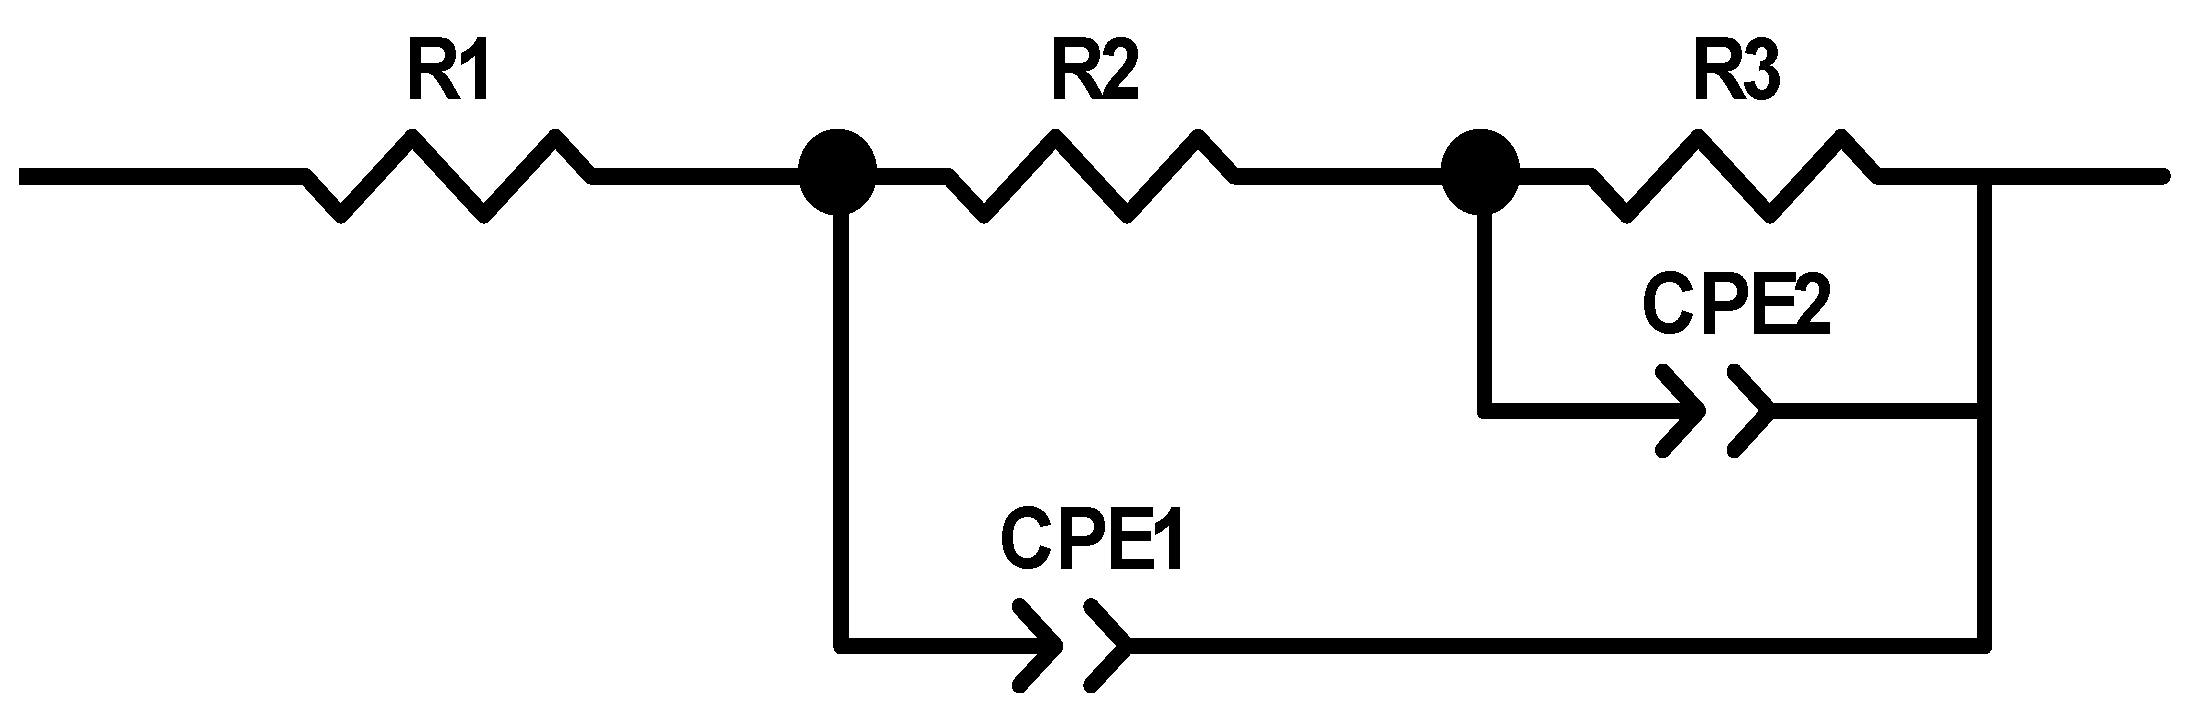
Figure 8 presents the equivalent circuit models used to fit the measured EIS data, where R1 represents the solution resistance, R2 represents the interface polarization resistance, capacitance is represented by CPE1, and R3 represents the charge transfer resistance. Based on the test and fitted curves in
Figure 7, the fitted data match with the experimental data closely when this circuit is used, which indicates that the equivalent circuit model can reflect the dynamical behaviors of the bulk pyrite electrode more accurately during the alkaline oxidation process.
Table 1 lists the parameter values of the equivalent circuit model (
Figure 8) at different potentials. The charge transfer resistance R
3 decreases from 82.04 cm
−2 to 9.163 cm
−2 as the system’s reaction voltage rises from 0.2 V to 0.8 V. As the reaction voltage increases, R3 decreases, the charge transfer rate during the reaction increases, and the alkaline oxidative dissolution reaction of pyrite occurs more rapidly. As shown in
Figure 7, the rate rises while the radius of the semicircular arc falls. The constant phase element dispersion index (CPE
2-T), which reflects how far the corresponding capacitance deviates from the ideal capacitance, is typically used. According to
Table 1, the CPE
2-T gradually rises as the voltage rises. This may be because as the voltage rises, the electrode surface’s reaction rate rises and more S
0 and Fe(OH)
3 accumulate on the electrode surface, which causes the electrode surface’s roughness to rise and, in turn, raises the CPE
2-T.
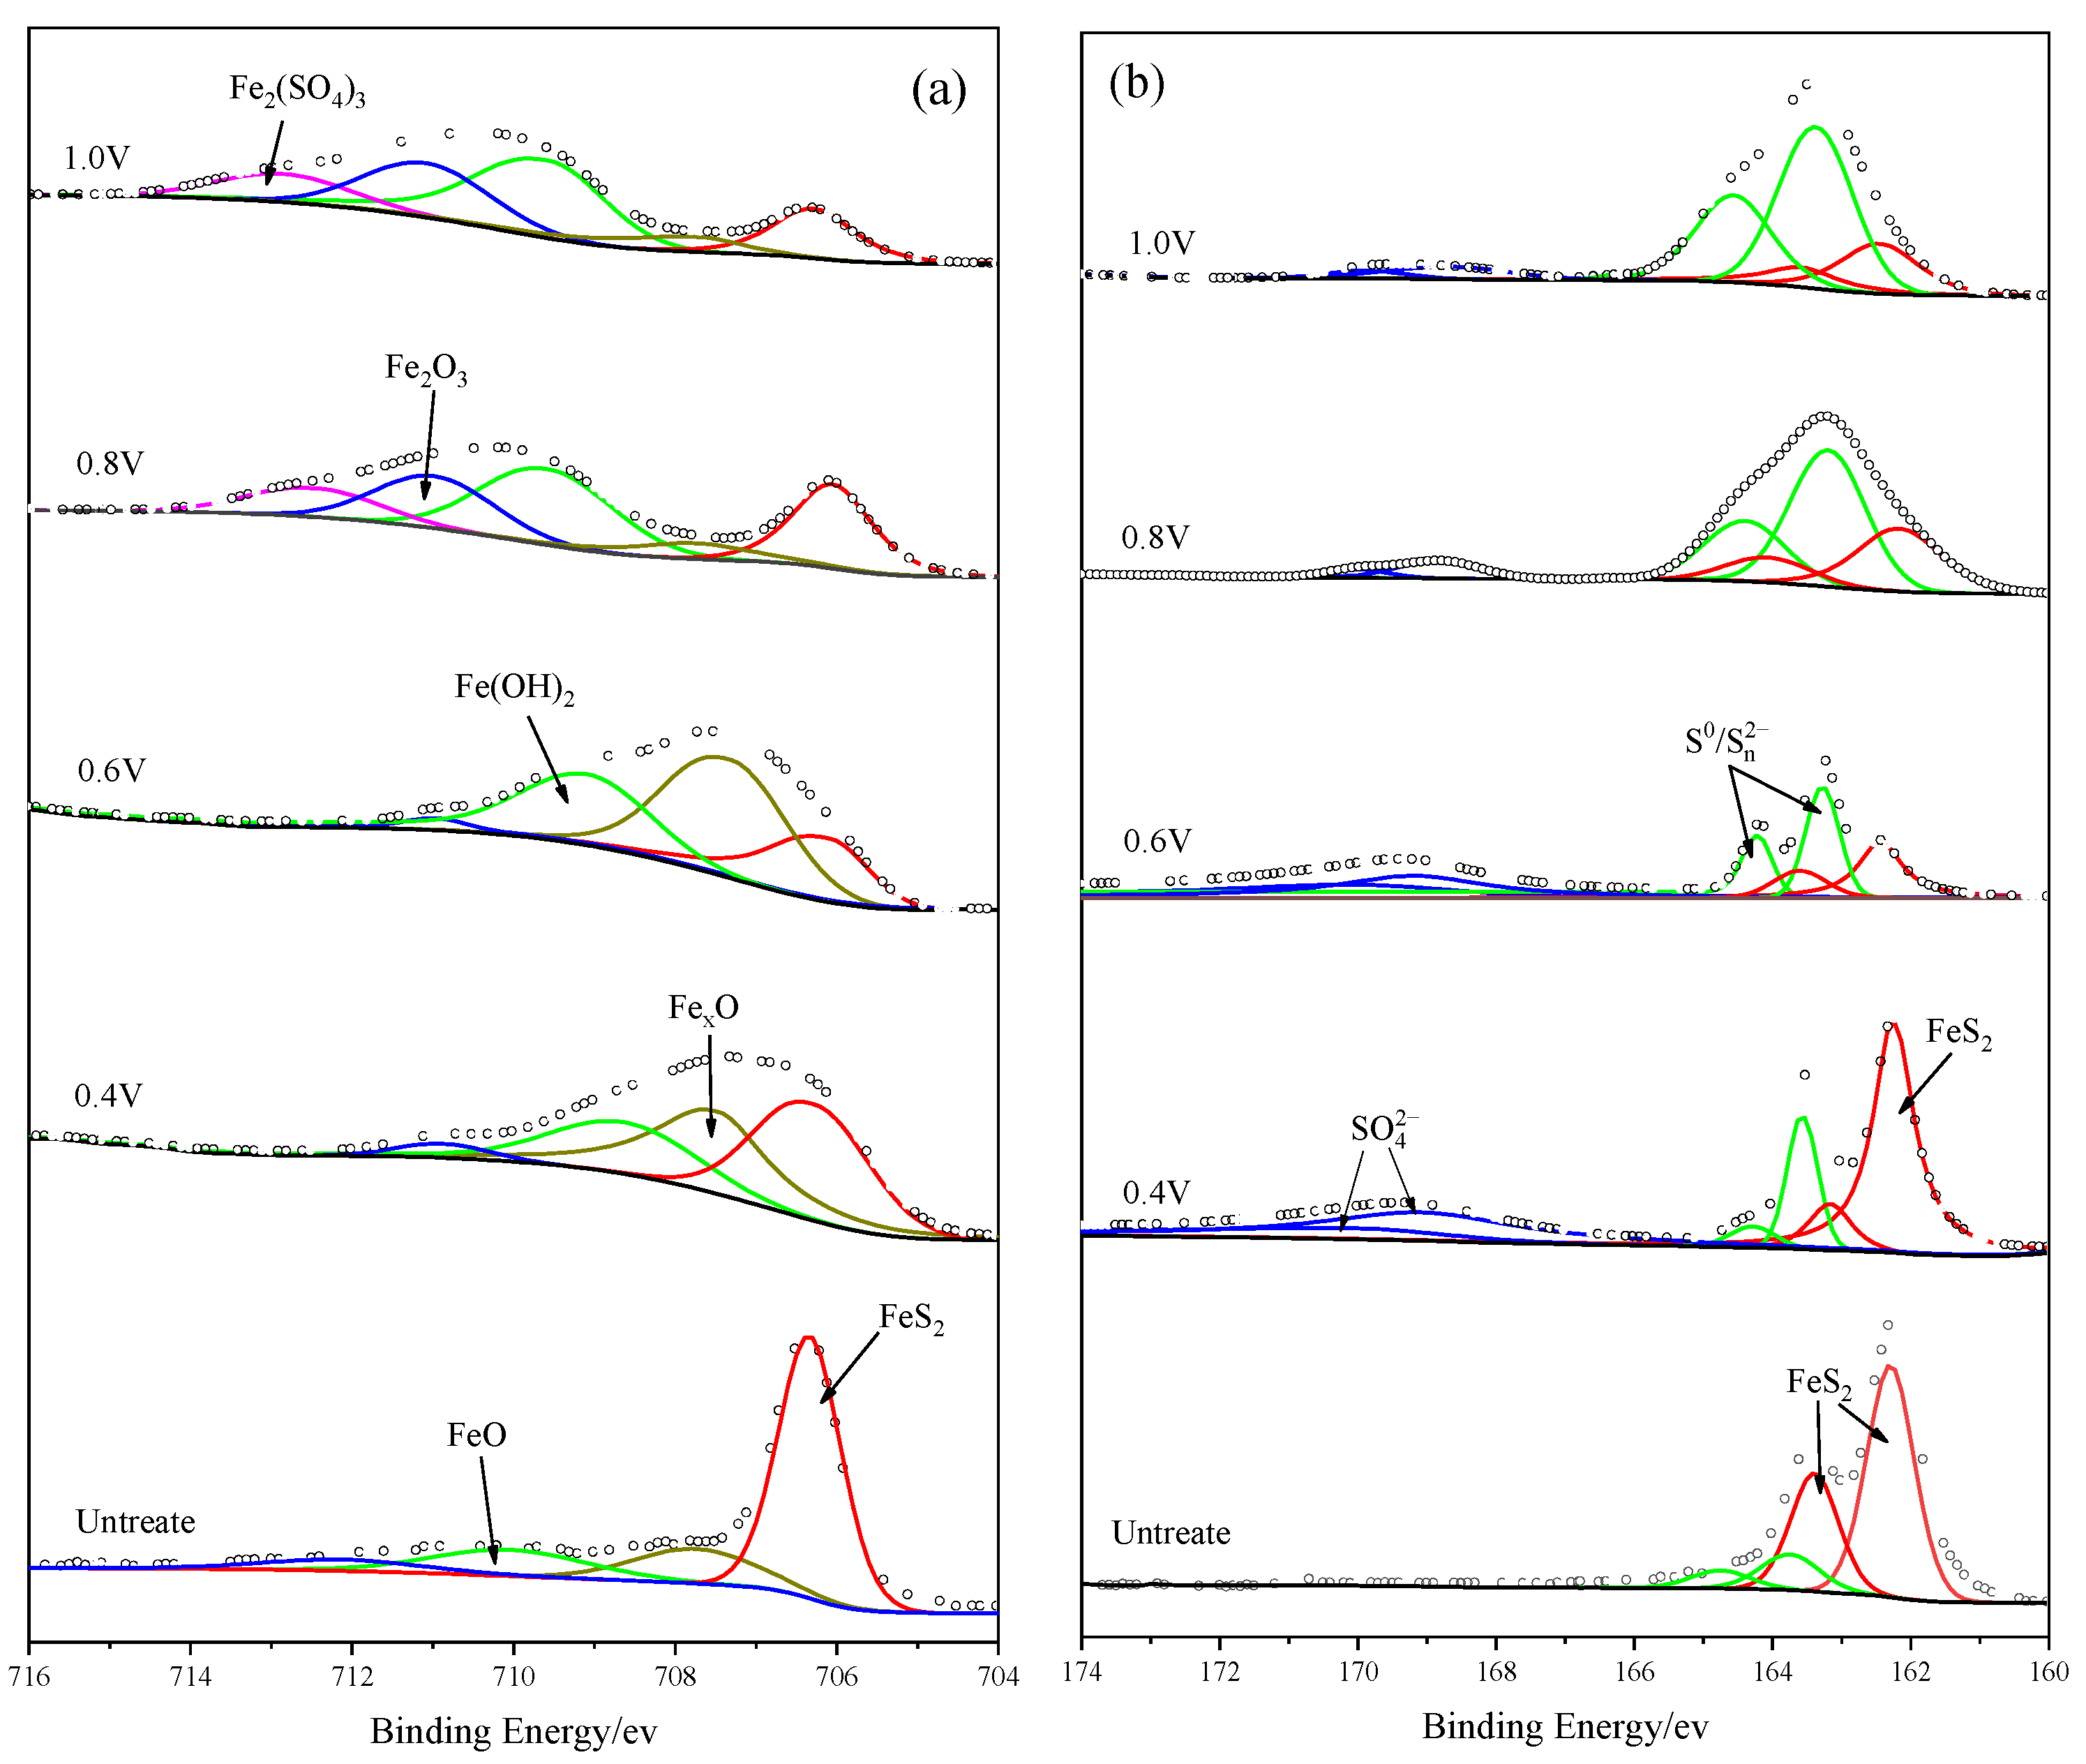
3.7. XPS Analysis
The XPS technique was applied to identify the iron and sulfur oxidation products on the bulk pyrite electrode surface after 10 h of the i-t curve test at potentials of 0.4 V, 0.6 V, 0.8 V, and 1.0 V. The measured and fitted plots are shown in
Figure 9 and the fitting parameters are present in
Table 2.
The Fe
2p3/2 spectra of unreacted and anodic-reacted pyrite electrodes are shown in
Figure 9a; five characteristic peaks appeared at 706.3 eV, 707.82 eV, 710.0 eV, 710.8 eV, and 713.12 eV for different reaction voltages. The peak with a binding energy of 706.3 eV was considered to correspond to FeS
2 [
37,
38,
39]. The peak at 707.82 eV corresponded to Fe
XO with an iron valence between 0 and +2, which gradually transforms to divalent or trivalent iron as the oxidation potential increases. The peaks at 710.0 eV and 710.8 eV corresponded to FeO/Fe(OH)
2 and Fe
2O
3/FeOOH, respectively [
40,
41,
42]. It is possible that both iron oxides and hydroxides existed on the surface of the pyrite electrode because of the alkaline oxidation environment and the ultravacuum environment during XPS detection. Iron hydroxides may be partially dehydrated to become iron oxides under super vacuum conditions. Another peak at 713.12 eV corresponded to Fe
2(SO
4)
3 [
43], which was difficult to detect at low oxidation potentials because of its solubility. When the oxidation potential increased, a large amount of Fe
2(SO
4)
3 products did not diffuse into the solution in time and produced a small amount of deposition on the electrode surface, which was then detected. In conclusion, these stronger peaks at strong oxidation potentials indicated the presence of a large amount of Fe(III) in the forms of Fe(OH)
3, FeOOH, Fe
2O
3, or Fe
2(SO
4)
3 on the surface of the pyrite electrode due to electrochemical polarization, which was consistent with the conclusions of the discussed electrochemical measurements.
Figure 9b shows S
2p spectra of the pyrite electrode before and after the oxidation reaction. The dominant peak at the binding energy of 162.2 eV corresponded to FeS
2 [
37,
38,
44]. The intensity of the oxidation reaction increased with increasing voltage, and the thickness of the passivation layer, which resulted from the accumulation of adhesion products on the surface of the pyrite electrode, increased rapidly; therefore, the intensity of the FeS
2 characteristic peak decreased gradually. The peak at 163.8 eV was supposed to be S
0 or S
X2− [
39,
45,
46,
47], and the faint peak at 168.42 eV was considered to be SO
42− [
38,
43,
48], and these may be the final oxidation products of S in pyrite.
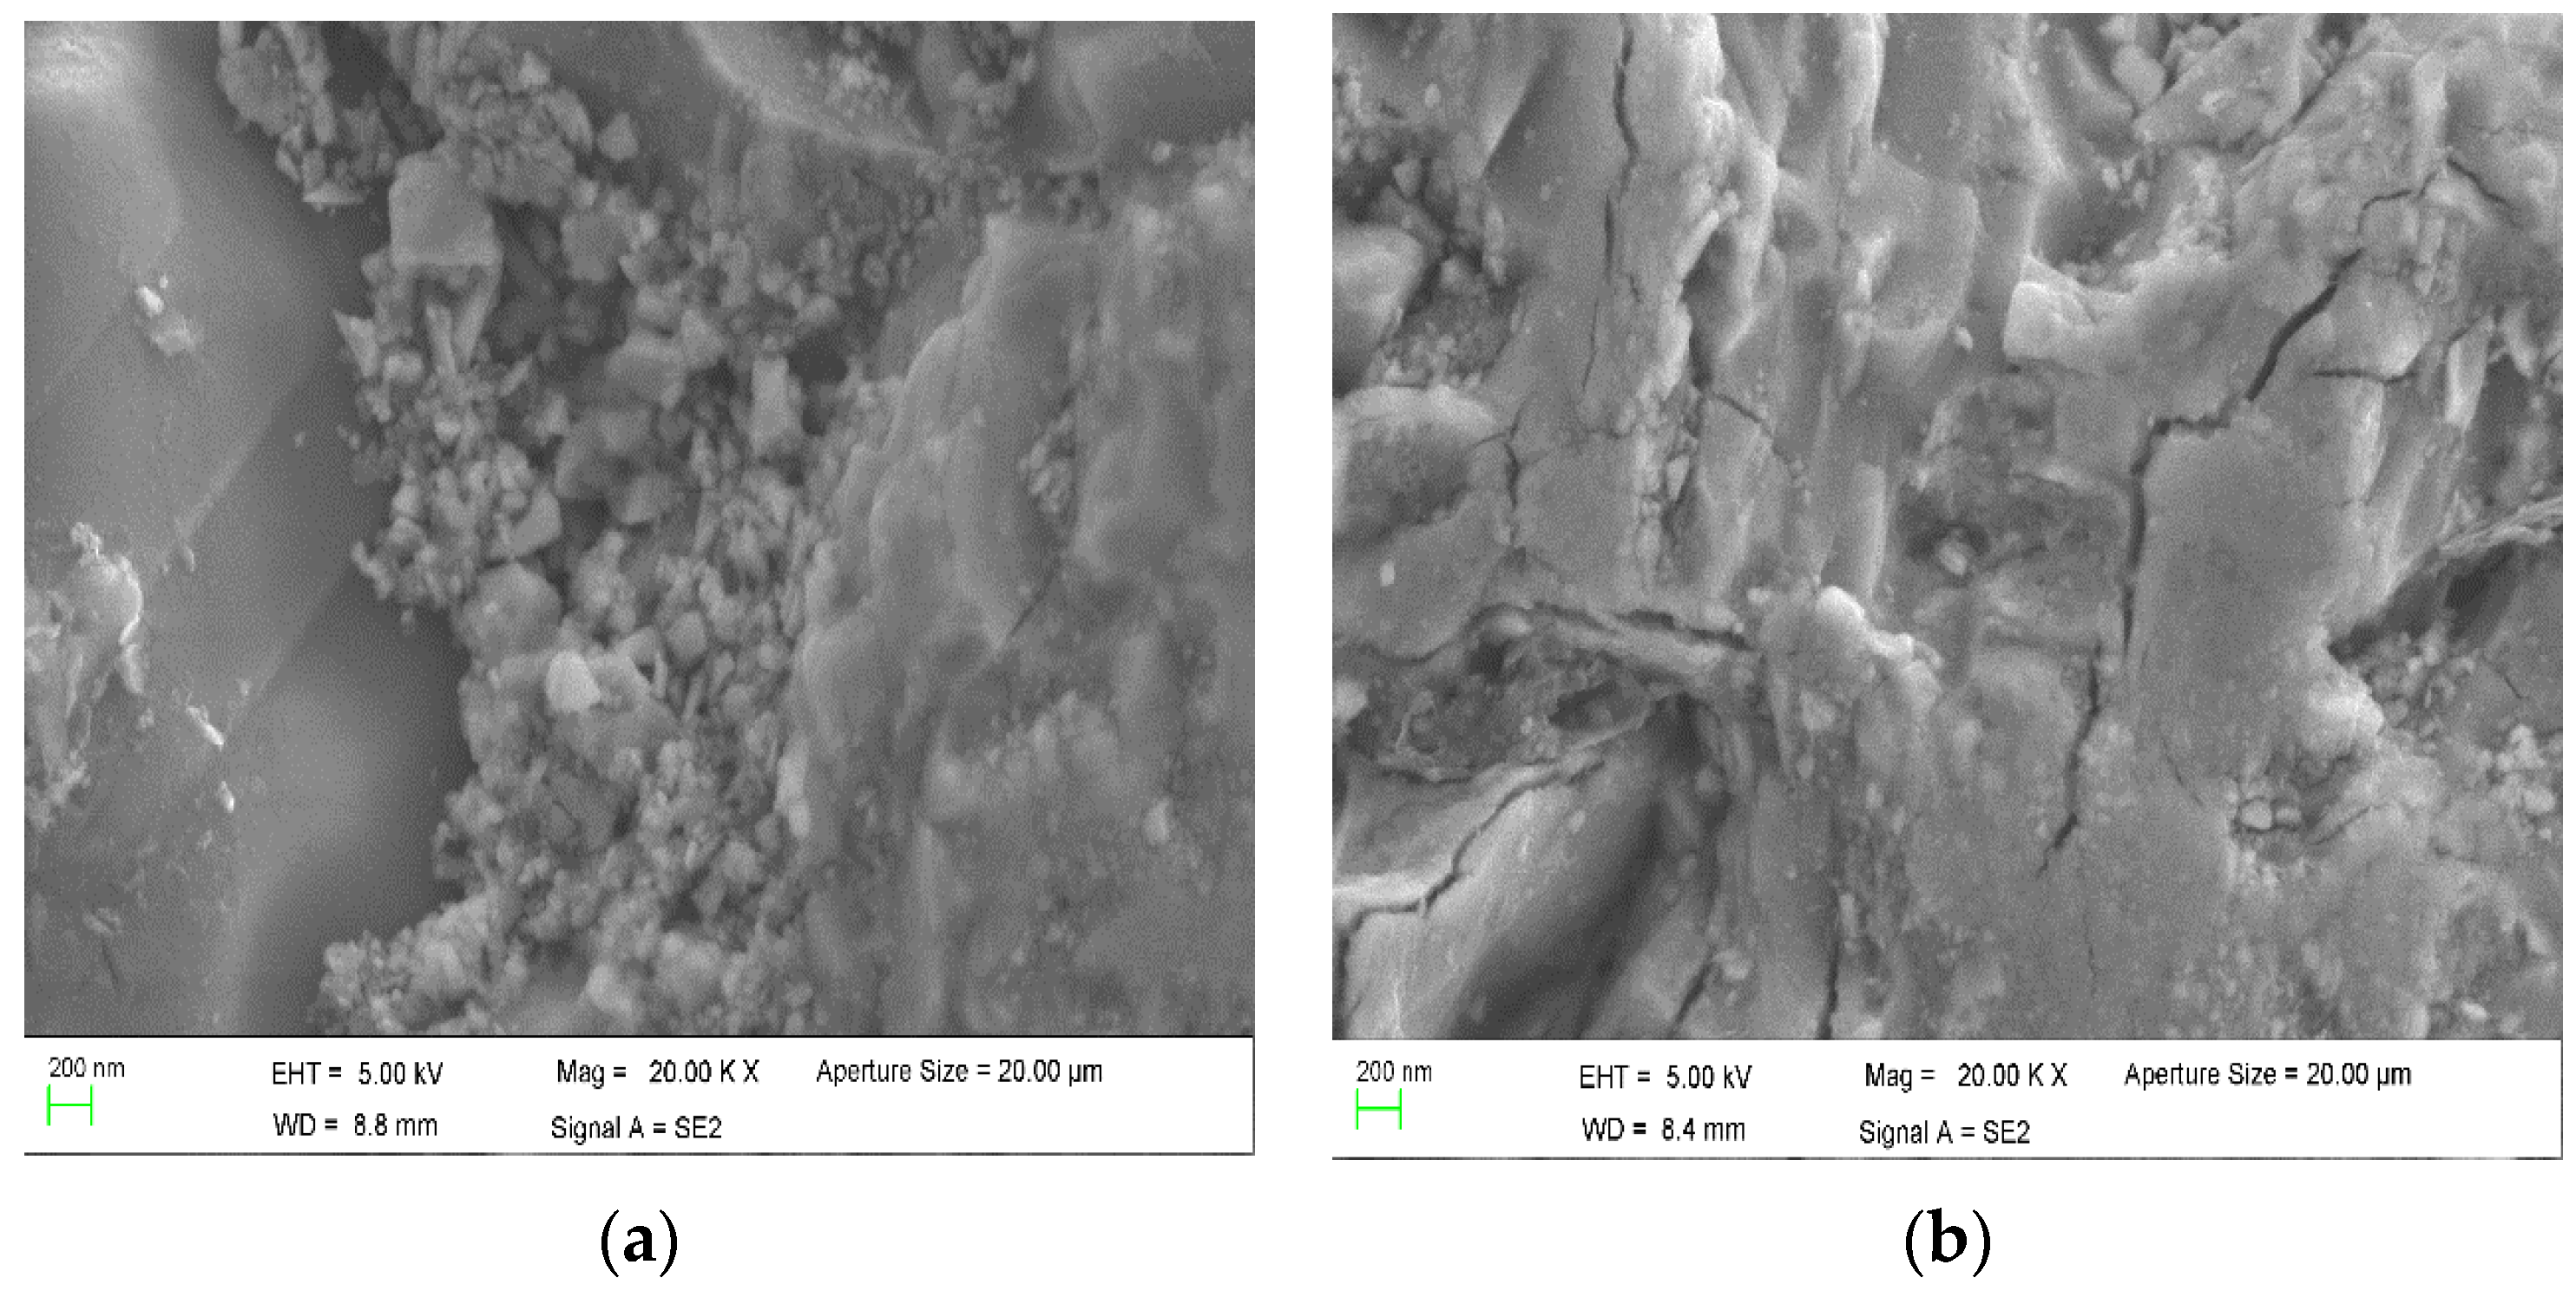
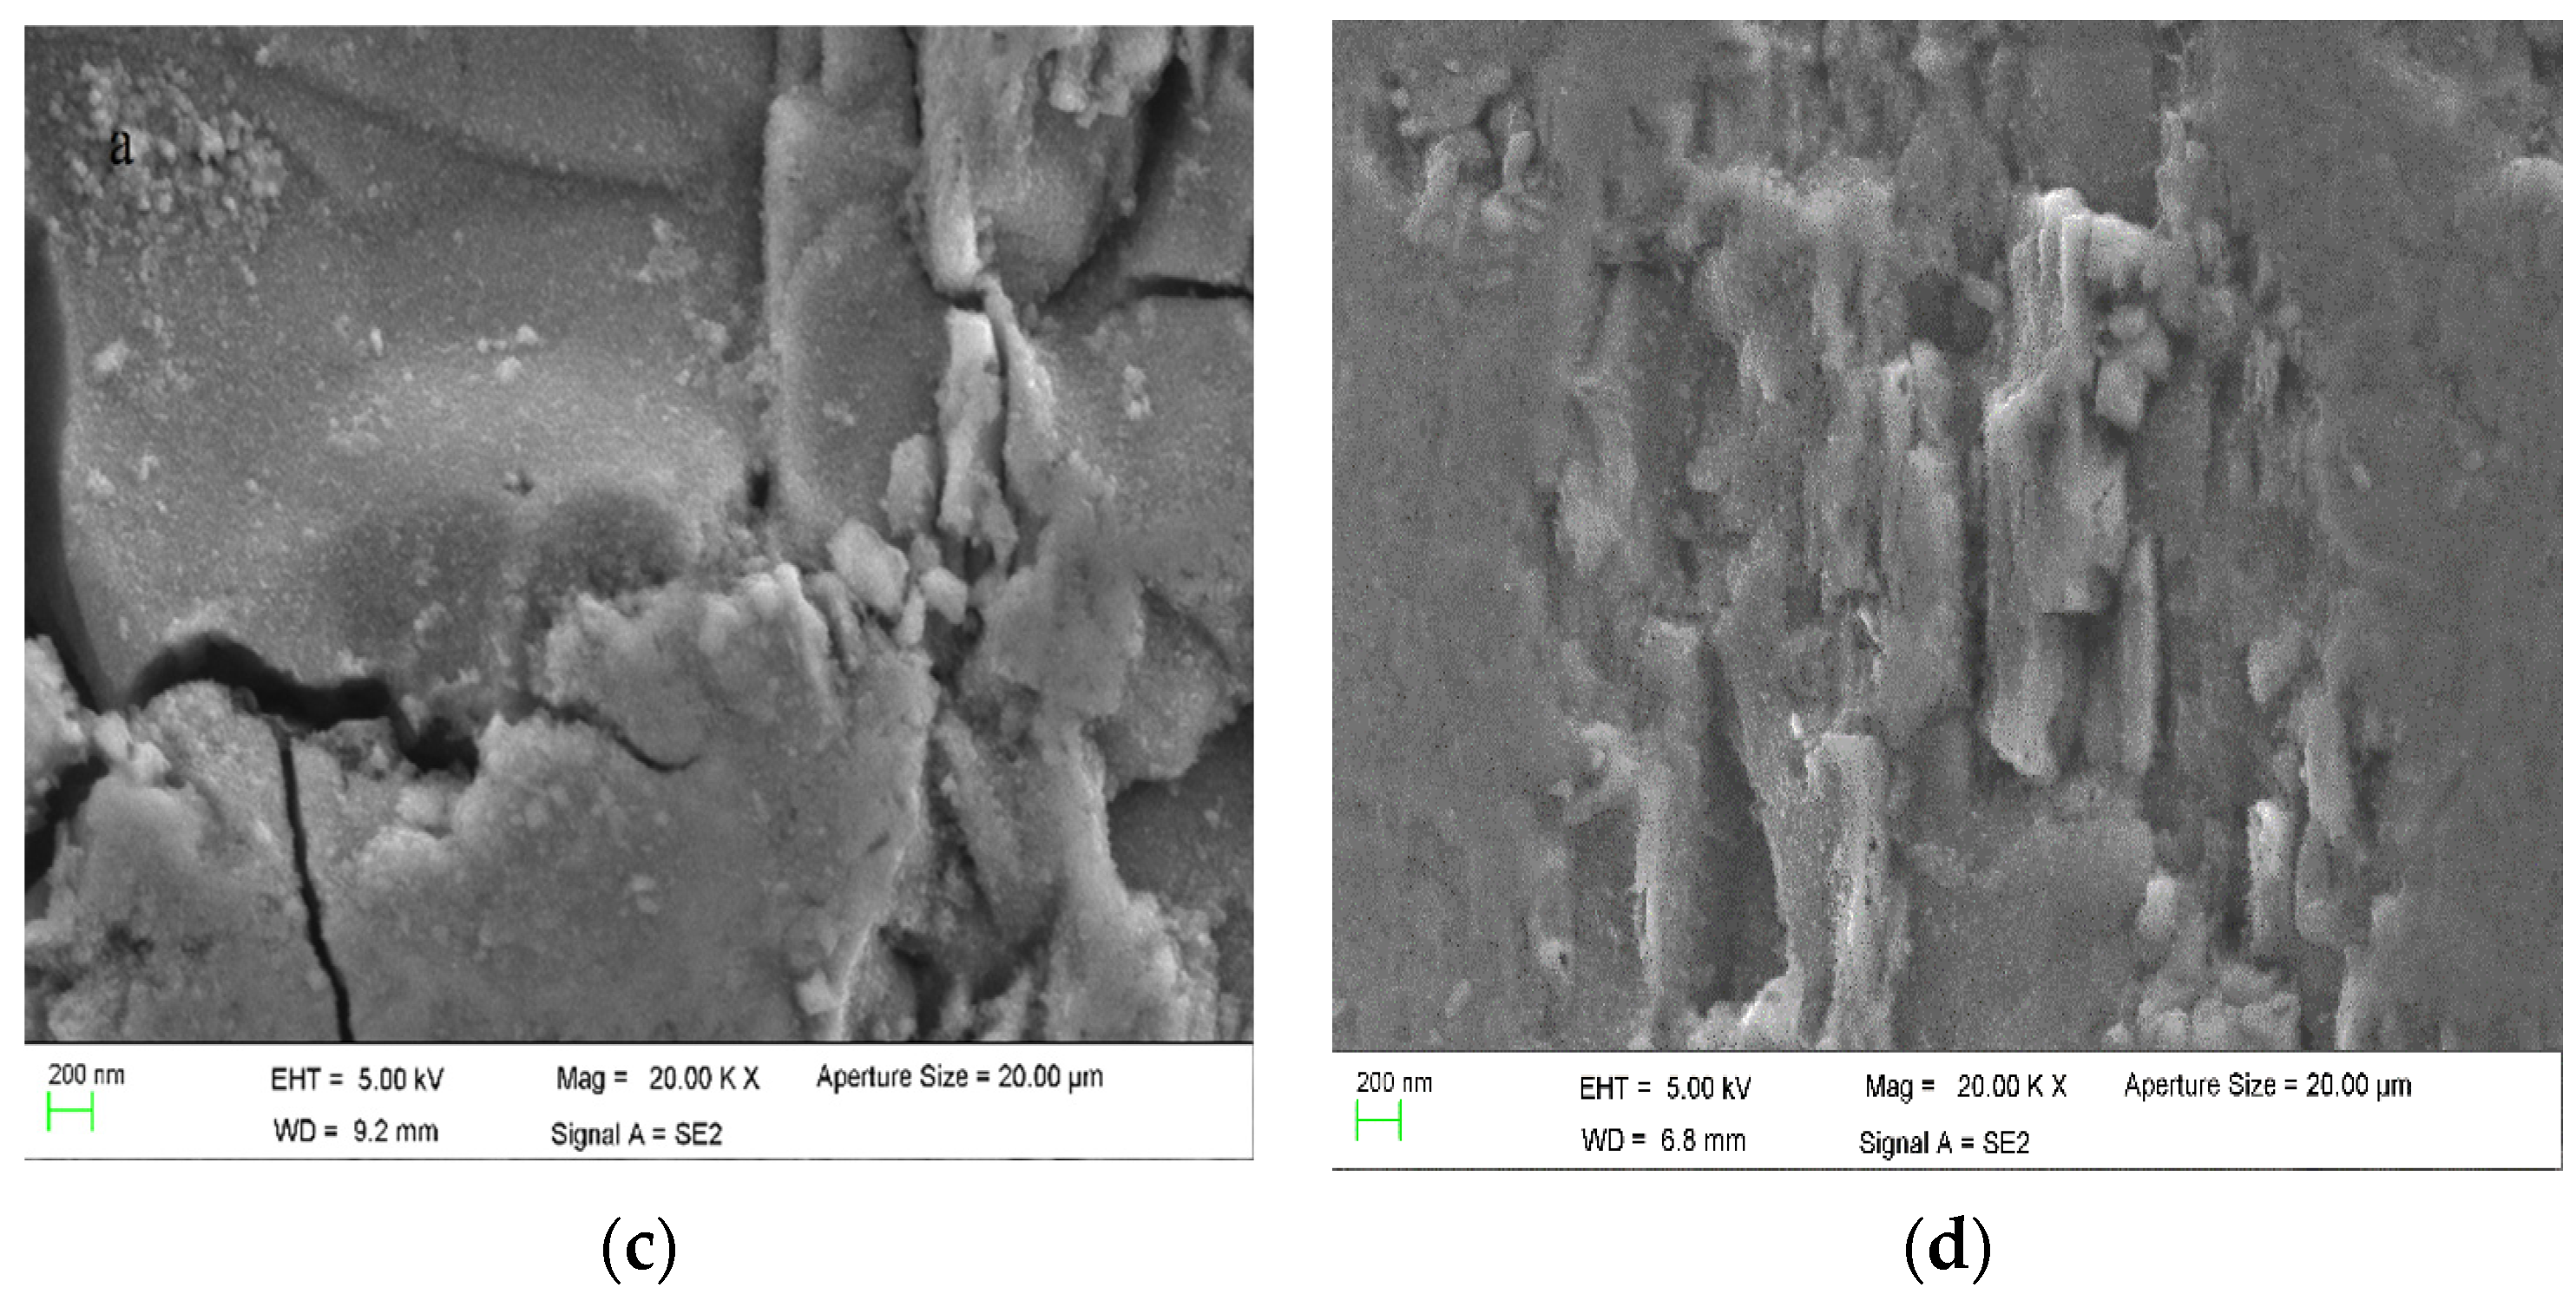
3.8. SEM and EDS Analysis
To observe the passivation layer formed on the surface of the pyrite electrode, the bulk pyrite electrode was subjected to chronoamperometry measurements at 0.8 V with various reaction times of 10 min, 20 min, 30 min, 40 min, 50 min, 60 min, 120 min, 180 min, and 240 min in an alkaline electrolyte of pH 12 and 25 °C. The tested pyrite electrodes were subsequently analyzed using SEM and EDS, and the results are shown in
Figure 10 and
Figure 11.
When the reaction time was 10 min, the oxidation–dissolution reaction occurred primarily on the surface, and a small amount of oxidation product accumulation could be seen on the electrode surface, which was not completely covered. It is evident from
Figure 10a that there were only a few slight corrosion pits on the surface of the pyrite electrode and no obvious passivation layer was formed. For the reaction time of 60 min, the passivation layer formed by the oxidation products completely covered the electrode surface and contained microcracks (
Figure 10b). For the reaction time of 120 min, the reaction products continued to accumulate on the surface, the passivation layer appeared as blocky aggregates, the blocky crack traces deepened, and the blocky area grew, indicating that the passivation degree increased (
Figure 10c). When the pyrite electrode continued to react for 240 min, the surface cracks on the passivation layer were filled with new reaction products, the oxidation reaction of the pyrite electrode basically stopped, and the accumulation of the passivation layer slowed or ceased (
Figure 10d).
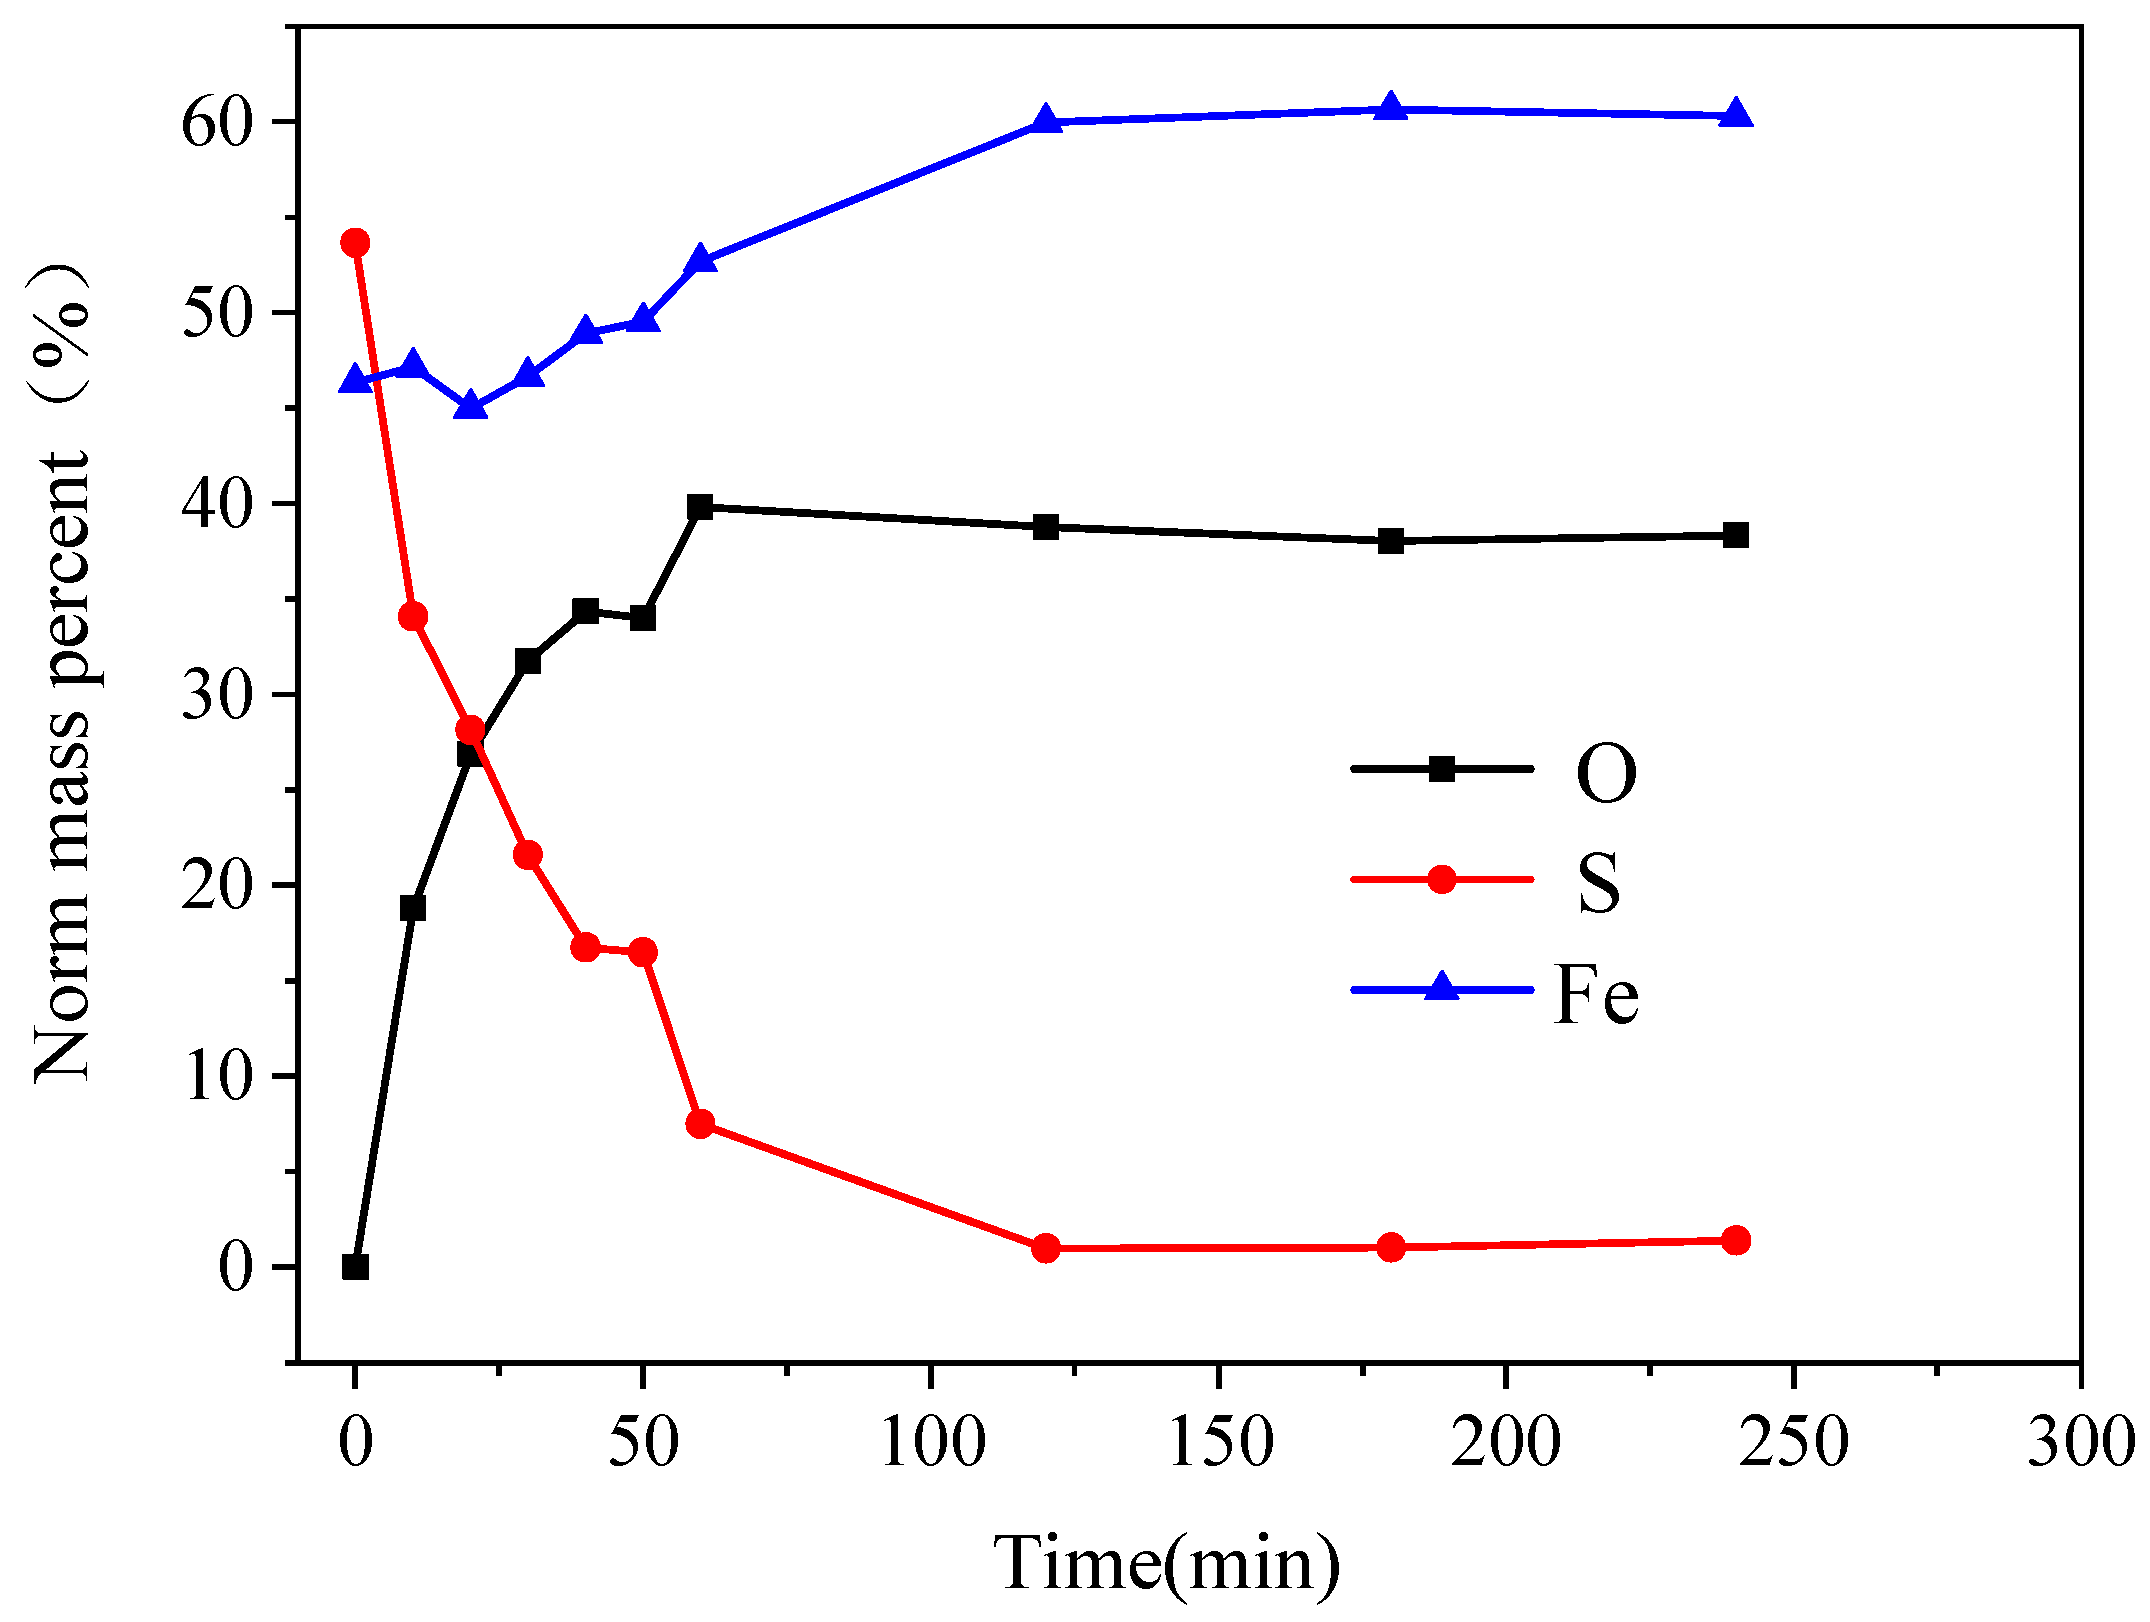
As shown in
Figure 11, the content of O and Fe elements in the oxidation products on the surface of the pyrite electrode increases as the reaction time increases, while the content of S elements decreases. In 0–60 min, the elemental content of S decreased rapidly from 53.66% to 7.55%, the elemental content of O increased rapidly from 0% to 39.81%, and the elemental content of Fe first decreased slightly and then increased gradually. The changes in the O, S, and Fe elemental contents on the surface of the pyrite electrode slowed after 60 min and stabilized after 120 min. During the electrochemical oxidation and decomposition of the pyrite, the S element mainly entered the electrolyte in the form of ions, which did not deposit on the electrode surface easily, so the S element content decreased rapidly. A small portion of Fe elements entered the solution in the form of soluble Fe(OH)
+ after being oxidized, so the Fe content decreased initially. However, because the electrolyte was strongly alkaline, Fe(OH)
+ continued to react with OH
− as its concentration increased, the passivation layer was gradually formed on the electrode surface as Fe(OH)
3, and as the passivation layer gradually thickened over time, its composition tended to remain stable.
3.9. Ion Content Change Pattern in Electrolyte
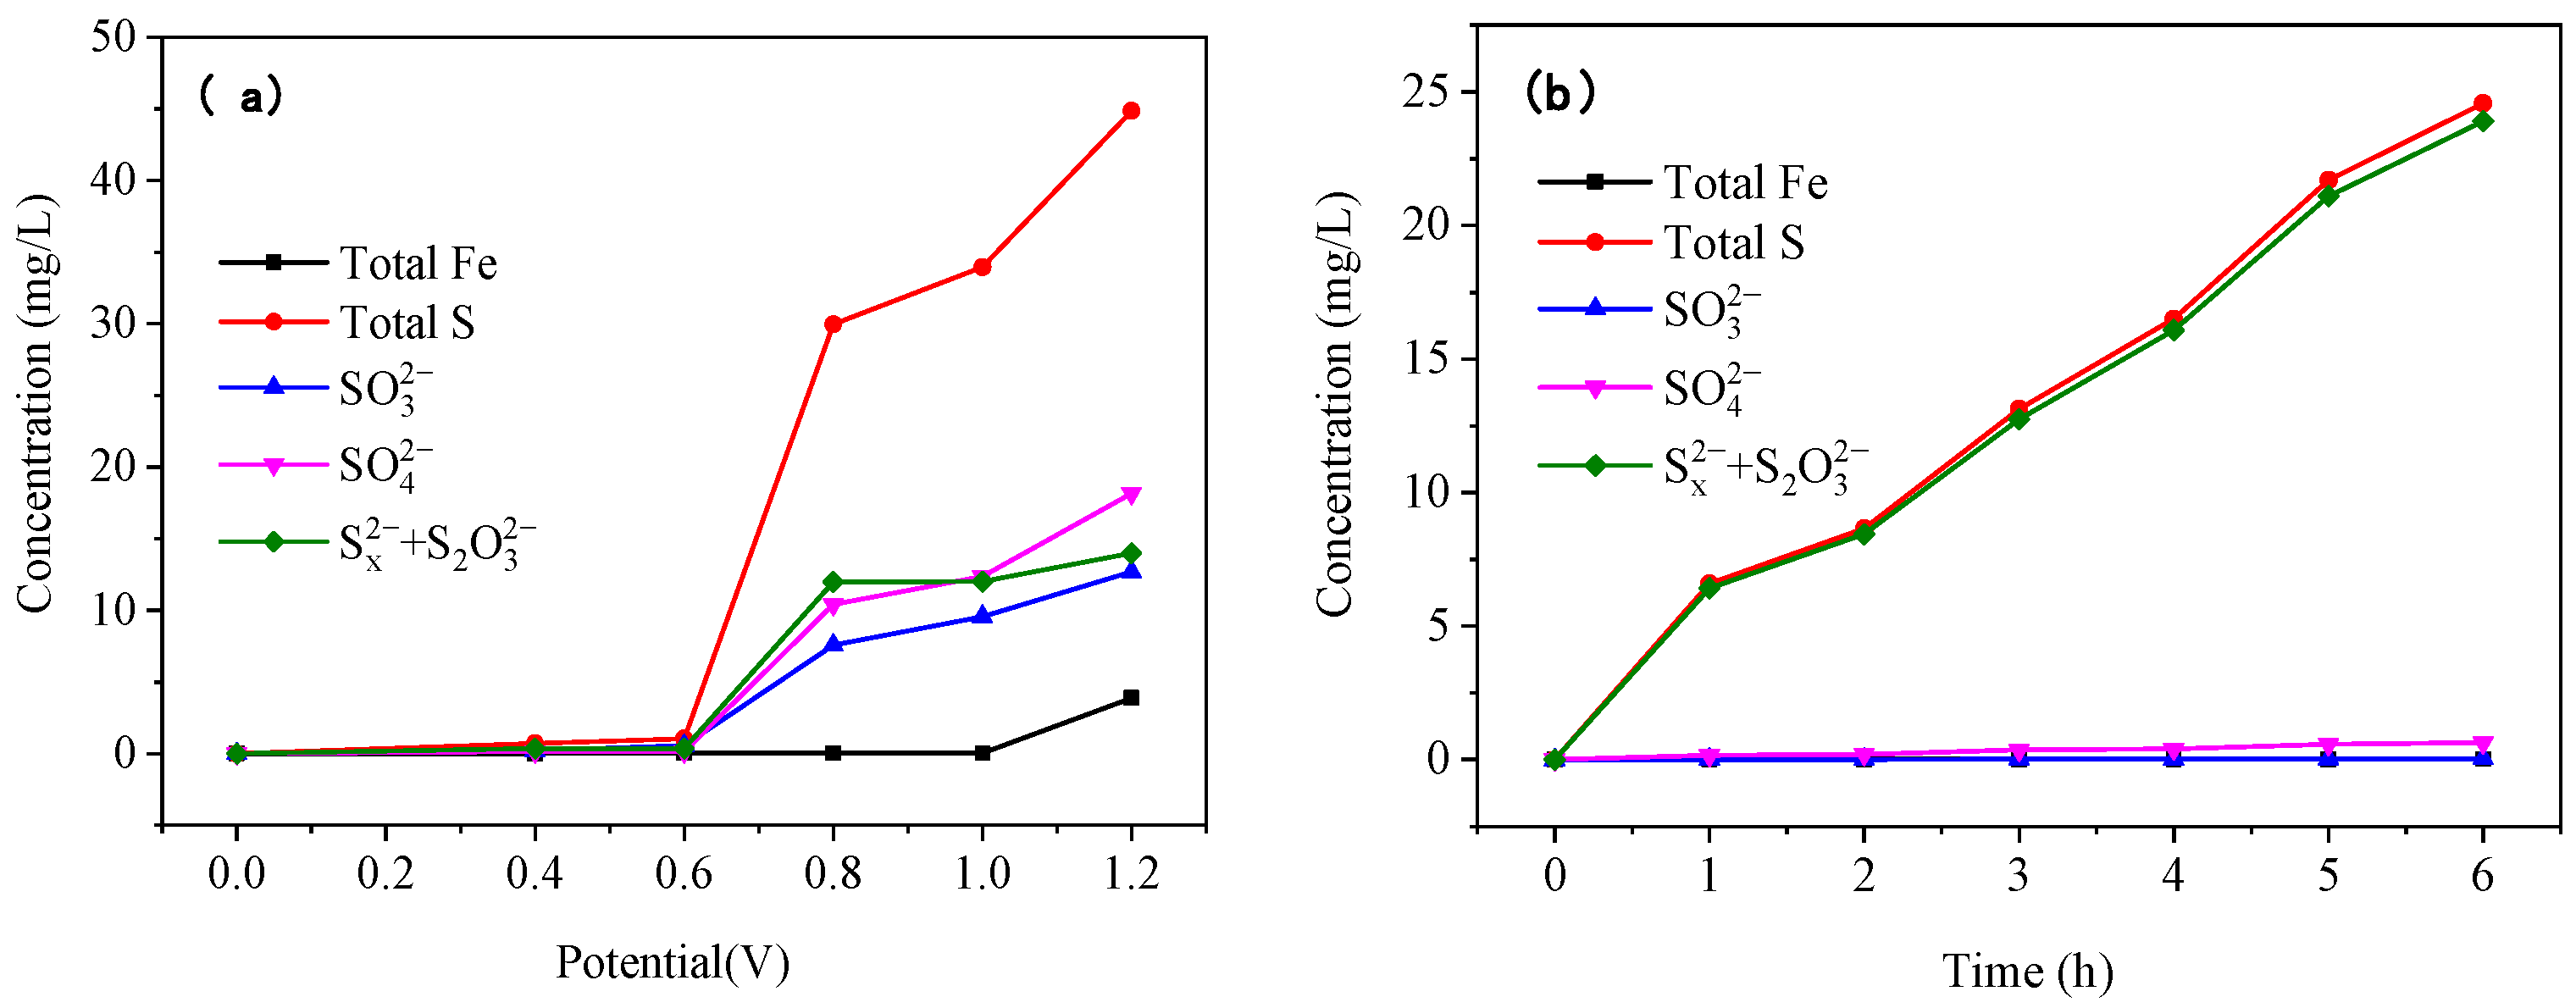
The oxidation reaction of the pyrite electrode was carried out in an alkaline electrolyte at pH 12 and 25 °C at different voltages and times, and the reacted electrolyte was analyzed for its ionic composition; the results are shown in
Figure 12.
As the reaction voltage increased, the S content in the electrolytes increased significantly, while the Fe content increased only slightly (
Figure 12a). This is because the S element enters the electrolyte in the ionic state when the pyrite is oxidized and dissolved, whereas it is difficult for the Fe element to exist in the strong alkaline electrolyte in the form of ions. The contents of SO
32−, SO
42−, and (S
x2− + S
2O
32−) ions increased significantly as the reaction voltage rose, with the increase in (S
x2− + S
2O
32−) being greater than those in SO
32− and SO
42−. During the oxidative dissolution of the pyrite, the S element was oxidized and converted to S
x2− and S
2O
32− before being further oxidized to SO
32− and SO
42−, resulting in a greater increase in S
x2− and S
2O
32− than in SO
32− and SO
42−. Moreover, since S
x2− and S
2O
32− were in the unstable intermediate states, increasing the reaction voltage could accelerate the conversion of (S
x2− + S
2O
32−) to SO
32− and SO
42−, as evidenced by the increase in SO
32− and SO
42− concentration with increasing voltage.
The content of S in the electrolyte increased significantly as the reaction time increased, while the content of Fe remained essentially unchanged (
Figure 12b). This is because the Fe ions produced by oxidation in the strong alkaline electrolyte quickly formed iron hydroxide, which was deposited on the surface of the pyrite electrode; therefore, the ionic iron content in the electrolyte was very low. With an increase in reaction time, the content of SO
32− and SO
42− was low and did not change significantly, whereas the content of (S
x2− +S
2O
32−) was high, indicating that under suitable alkaline oxidation conditions, S
x2− and S
2O
32− produced by the pyrite oxidation reaction can exist steadily in the solution, which is the basis for gold leaching by using pyrite’s own oxidation products.
4. Conclusions
In this paper, the oxidation process of pyrite in an alkaline electrolyte was studied using the electrochemical testing technique, and the oxidation products of a pyrite electrode in an alkaline electrolyte were characterized by combining various analytical testing methods, such as XPS and SEM. The conclusions of this study are as follows.
- (1)
The electrochemical oxidative dissolution of pyrite occurs preferably in an alkaline environment with a pH of around 12, and an appropriate oxidation potential is above 0.8 V. These parameters are still of reference significance in the preoxidation treatment process of sulfide ores with chemical oxidants.
- (2)
During the alkaline oxidative dissolution of pyrite, some elemental S enters the electrolyte as Sx2−, S2O32−, SO32−, and SO42− ions, and a small amount of the element S is adsorbed on the electrode surface as S0 to form the passivation layer. As the main component of the passivation layer, Fe is essentially adsorbed on the electrode surface as Fe(OH)2, Fe2O3, and Fe2(SO4)3.
- (3)
When the oxidation potential was between 0 and 0.6 V, the increase in reaction voltage had no significant effect on the change in ion concentration in the electrolyte. Low potential polarization could result in the formation of a sulfur-rich passivation film on the surface of the pyrite electrode, which caused the reaction to slow down or stop. When the voltage was greater than 0.6 V, as the potential increased, the inert oxidation products dissolved, the oxidation process continued, and the concentrations of soluble ions in the electrolyte began to rise rapidly. As the reaction time prolonged, the S element was first converted into Sx2− and S2O32−, and then further oxidized into SO32− and SO42−, whereas Sx2− and S2O32− could remain stable in the solution for a longer time. Therefore, the content of Sx2− and S2O32− in the electrolyte increased rapidly with the prolongation in the reaction time, whereas the content of SO32− and SO42− changed little.
- (4)
Comprehensively, the results of this paper—the change rule of the pyrite surface composition and the ionic composition in the solution during alkaline electrochemical oxidation—are expressed in
Table 3.
In conclusion, SX2− and S2O32− generated by the alkaline oxidation of pyrite can stably exist in the solution, which provides a new idea for the one-step gold extraction process of “oxidative pretreatment-gold leaching” for microfine-grained leaching type difficult-to-treat gold-bearing sulfide ores, i.e., to leach gold by making full use of the sulfur in the gold-bearing sulfide minerals to directly generate polysulfides and thiosulfates with oxidizing and coordinating abilities in the alkaline system. This technology has the advantages of being environmentally friendly and having a short process and a low cost, and has good prospects for industrial application. The authors will continue conducting research on the simultaneous dissolution of gold and sulfur to finish the whole technological process of one-step gold extraction, so that this work can be put into practice as soon as possible.


