Article

Extraction of Gallium from Brown Corundum Dust by Roasting—Acid Leaching Process

1
The State Key Laboratory of Refractories and Metallurgy, Wuhan University of Science and Technology, Wuhan 430081, China
2
Key Laboratory for Ferrous Metallurgy and Resource Utilization of Ministry of Education, Wuhan University of Science and Technology, Wuhan 430081, China
3
Department of Chemical and Metallurgical Engineering, School of Chemical Engineering, Aalto University, Kemistintie 1F, P.O. Box 16100, FI-00076 Aalto, Finland
*
Author to whom correspondence should be addressed.
Minerals 2023, 13(7), 900; https://doi.org/10.3390/min13070900
Submission received: 14 June 2023 / Revised: 28 June 2023 / Accepted: 29 June 2023 / Published: 1 July 2023
(This article belongs to the Special Issue Valuable Metals Recovery by Mineral Processing and Hydrometallurgy)

Abstract

:
Brown corundum dust is a solid waste produced during the preparation of brown corundum with bauxite as the raw material. The dust has a relatively high gallium content; therefore, it is of great value to recover the gallium from this kind of dust. In this paper, a range of analysis and characterization methods, including XRD, XRF, SEM-EDS, and EPMA, were used to determine the occurrence of gallium. It was found that gallium was mainly present in the potassium-rich phase, wrapped by amorphous silicate and the corundum phase. Roasting activation followed by an acid leaching process was proposed to extract gallium from brown corundum dust. An investigation was carried out on the effects of roasting temperature, roasting time, and additive dosage on the recovery of gallium and the evolution of the phase composition of the dust. The results show that the roasting activation of sodium carbonate was better than that of calcium oxide. After roasting at 1073 K for 40 min with a sodium carbonate dosage of 0.5 (mass ratio of sodium carbonate to dust), the phase composition changed completely to mainly consist of sodium silicate, sodium aluminosilicate, and potassium aluminosilicate. In that case, around 93% of Ga could be recovered from the roasted dust through H2SO4 (4.6 mol/L) leaching for 90 min. The leaching process was described well by the kinetic equation of k3t = 1/(1 − α)1/3 − 1, with an apparent activation energy of 16.81 kJ/mol, suggesting that the leaching rate was limited by the transfer of leaching agent across the contacting interface of the dust particles.

1. Introduction

Gallium is a critical element widely applied in the chemical industry, in polymerization, dehydration, and catalysis, for instance [1,2]. Gallium and gallium-based compounds are commonly used as an important semiconductor component material due to their superior electronic and optical properties, and gallium is also required in the preparation of solar cells [3,4,5]. In addition, gallium plays a pivotal role in some medical treatments [6,7]. For instance, gallium nitrate has a good therapeutic effect in the treatment of urothelial tumors, radioactive gallium can be used to detect and locate malignant tumor cells, and alloys of gallium with indium, silver, and tin are utilized as tooth filling material.
The content of gallium in the Earth’s crust is about 15 ppm, and the reserves are relatively high compared with molybdenum, tungsten, antimony, mercury, and arsenic [8]. However, the gallium mineral concentration is not enough to become the main mineral of an ore body, so it is difficult for gallium to form ore deposits [9], and it usually enters other minerals. Therefore, at present, gallium is usually recovered and extracted from secondary resources or obtained as a by-product during the aluminum oxide production process [10,11]. Commonly, the secondary resources for extracting gallium include red mud [12,13], fly ash [14,15], electronic waste [16,17], phosphorus flue dust [18,19], and zinc refinery residues [20,21].
Brown corundum is produced through electric arc furnace smelting with bauxite, anthracite, and iron filings as raw materials. It contains 95%–97% Al2O3 and a small amount of Fe, Si, Ti, etc., and is brownish black in color. It is commonly used as a refractory castable, sandblasting material, abrasive material, filtration medium, or functional filler. In the brown corundum production process, a lot of flue dust is generated, in which the content of gallium oxide is as high as 0.13%–0.16% [22]. Therefore, recovering gallium from this kind of brown corundum dust not only improves the gallium resource utilization efficiency but also creates economic benefits for the brown corundum industry. Up to now, there have been only a few studies on the extraction of gallium from brown corundum dust. Ding and his team [23] recovered gallium through microwave-assisted acid leaching and achieved a recovery of 82.56% when they conducted an experiment under the conditions of 25 wt.% H2SO4, temperature of 90 °C, leaching time of 50 min, solid-liquid ratio of 1:5 (g/mL), and stirring speed of 200 rpm, with an ultrasonic power of 900 W. Wen et al. [24] used a two-stage alkaline leaching, including 120 min of concentrated alkali leaching and 30 min of dilute alkali leaching, to recover gallium from corundum dust, and a recovery of 93% was achieved. In addition, that research team also treated the corundum dust with a mixture of sulfuric acid and hydrogen fluoride. Under leaching conditions of a solid–liquid ratio of 1:5 (g/mL), 80 °C, 4 h, 1.5 mol/L H2SO4, and 6.4 mol/L HF, the gallium leaching rate was able to reach up to 91% [25]. However, attention should be paid to the reasonable disposal and treatment of the fluorine-containing wastewater produced by this method, and the high corrosiveness of hydrofluoric acid should also be considered.
In this paper, based on the chemical and phase composition and the morphology of the corundum dust, a process of roasting activation followed by acid leaching was used to extract gallium. We studied the effects of the roasting parameters on the recovery of Ga and the phase evolution of the roasted dust, including temperature time, additive dosage, and leaching factors consisting of acid concentration, leaching temperature, leaching time, and stirring rate. The mechanism of gallium extraction and the kinetics of the acid leaching process were also investigated.

2. Experimental

2.1. Brown Corundum Dust

The raw material used in the experiments was collected from a brown corundum plant in Guizhou province, China. The chemical composition of the dust was analyzed by an X-ray Fluorescence Spectrometer (XRF, Rigaku/ZSXPrimus IV, Thermo Fisher Scientific, Waltham, MA, USA), and the results are listed in Table 1, where the contents of the main elements, including Si, K, Al, S, Fe, and the target element of Ga, were further detected by inductively coupled plasma optical emission spectrometry (ICP-OES, Agilent 5110, Agilent Technologies Inc., Santa Clara, CA, USA) and inductively coupled plasma mass spectrometry (ICP-MS, Agilent 7800, Agilent Technologies Inc., Santa Clara, CA, USA). Additionally, the carbon and nitrogen contents were determined using an oxygen–nitrogen–hydrogen analyzer (ONH836, Leco, San Jose, CA, USA) and a carbon and sulfur analyzer (HX-HW88, Nanjing Huaxin Analytical Instrument Manufacturing Co. Ltd., Nanjing, China), respectively.
As shown in Table 1, the main components in the dust were SiO2, K2O, and Al2O3, and these three components accounted for around 82% in total. The total iron content calculated by Fe2O3 was 3.542%, of which 0.22% of Fe existed in the form of metallic iron, which was determined by chemical titration. The content of Ga was 0.085%, far beyond the content range of 0.003%–0.0087% of a typical bauxite [26].
The phase composition of the brown corundum dust was analyzed by X-ray diffraction (XRD, X’Pert Pro MPD, PAnalytical B.V., Almelo, Netherlands; HighScore (Plus) V3.X database, PDF 2021), and the pattern is shown in Figure 1. The main crystal phases in the raw material were corundum (Al2O3) and β-potassium sulfate (K8S4O16, reference code 96-120-0012). Elements of K and S mainly existed in the form of potassium sulfate. As shown in Table 1, the content of silicon was the highest, but no characteristic peaks of silicon-containing phases were found, indicating that the silicon elements were mainly present as amorphous silicate. The peaks referring to gallium-containing minerals did not appear in this pattern. This was due to the low content of gallium in the raw material and its dispersed distribution in the amorphous silicate phase.
A small amount of dust, acrylic powder (Anfu Weiyi Metallographic Equipment Co., Ltd., Jian, China), and curing agent (Anfu Weiyi Metallographic Equipment Co., Ltd., Jian, China) were placed in a beaker and then mixed evenly. The mass ratio of the added acrylic powder and curing agent was 10:8. The mixture was transferred to a mold and allowed to stand for more than half an hour until the sample was completely cured. The mounted sample was polished with a polishing machine until there were no obvious scratches on the polished surface when viewed under a light. The polished surface was used for SEM and EDS (scanning electron microscope–energy dispersive spectrometer, Nova 400 NanoSEM, FEI Company, Hillsboro, OR, USA; HKL Channel 5 EBSD, Oxford Instruments, Oxford, UK; INCA IE 350 PentaFET X-3 EDS, Oxford Instruments, Oxford, UK) analysis to determine the morphology and distribution of the main elements of the brown corundum dust. The results are shown in Figure 2 and Table 2.
According to the chemical and phase composition, as well as the EDS analysis results listed in Table 2, points 1 and 2 in Figure 2 are spherical potassium aluminosilicate. Point 3 refers to monatomic silicon. Points 4 and 6 correspond to corundum with irregular shape. Points 5, 7, and 8 are flaky calcium sulfate and potassium sulfate. Points 9 and 10 have high iron content and are composed of iron oxides. The black area covering the particles is the embedding resin. To sum up, the potassium mainly existed in potassium sulfate, the silicon was present in the form of amorphous silicate, and the occurrence of aluminum included corundum and aluminosilicate. No gallium was detected by EDS due to its low content and relatively dispersed distribution. Hence, an EPMA (Electron Probe X-ray micro analyzer, EPMA-8050G, Shimadzu-Kratos, Kyoto, Japan) was used to verify the existence of gallium, and the results are illustrated in Figure 3.
As shown in Figure 3, gallium occurred densely with sodium and potassium together, whereas the areas where they existed also contained high amounts of aluminum, oxygen, and silicon. According to the color of the area where gallium occurred, the gallium content ranged from 0.118% to 0.196%, which is higher than the average gallium content of 0.085% listed in Table 1, indicating that gallium was enriched to some extent. It is speculated that gallium occurred in the form of a sodium–gallium compound and potassium–gallium compound, wrapped by the amorphous silicate and corundum.

2.2. Reagents and Apparatus

The reagents used for the experiments, including anhydrous Na2CO3 (analytical reagent, abbreviated as AR), sulfuric acid (AR), hydrochloric acid (AR), titanium trichloride (AR), thiourea (AR), toluene, and methyl isobutyl ketone (AR), were purchased from Sinopharm Chemical Reagent Co. of China. Gallium standard solution (GSBG62026-90, 10% HCl, 1000 μg/mL) was used to measure the concentration of gallium in the leaching solution by means of a spectrophotometer. All of the leaching experiments and spectrophotometer detection were conducted using deionized water with an RO effluent conductivity of 2–10 μS/cm. The instruments included a vertical tube furnace (BLMT-1700 °C, Boleymant Test Electric Furnace Co., Ltd., Wuhan, China), as shown in Figure 4a, a heat-collecting thermostatic water bath equipped with magnetic stirrer (DF-101S, Gongyi Yuhua Instruments Co., Ltd., Gongyi, China), as shown in Figure 4b, an electronic balance (FA2004, Shanghai Shangping Instruments Co., Ltd., Shanghai, China), a vacuum drying oven (DZF-6050, Gongyi Yuhua Instruments Co., Ltd.), and a sample mill (XQM-100, Wuhan Prospecting Plant, Wuhan, China).

2.3. Operational Procedure

The brown corundum dust was mixed with the roasting additive at a determined mass ratio. The mixture was put in a corundum crucible (ϕ75 mm × H27 mm), and then the crucible was placed in the thermostatic area of the vertical tube furnace calibrated by a standard couple. The bottom end of the tube was sealed during roasting and a hole was left in the upper lid of the furnace tube to allow carbon dioxide and sulfur dioxide to flow out. After roasting for a period, the crucible was gradually pulled to the cold end of the furnace and taken out to be cooled in air. Because a certain degree of sintering happened to the sample during the roasting, the roasted sample was ground in a pulverizer (YP-200-1, Nanchang Yongping Laboratory Equipment Co., Ltd., Nanchang, China) for 15 s to ensure that the particles passed a 200-mesh sieve (74 μm). Then the ground sample was leached with diluted sulfuric acid in a three-neck flask, which was heated by the thermostatic water bath. When the leaching was complete, the slurry was filtered. The filtrate and leaching residue were collected to determine the recovery of gallium. The concentration of gallium was measured by the rhodamine B spectrophotometry method (Chinese GB/T 20127.5-2006).

3. Results and Discussion

3.1. Effect of Roasting

3.1.1. Roasting Temperature

Since the gallium component was embedded in the amorphous silicate and corundum in the dust, CaO and Na2CO
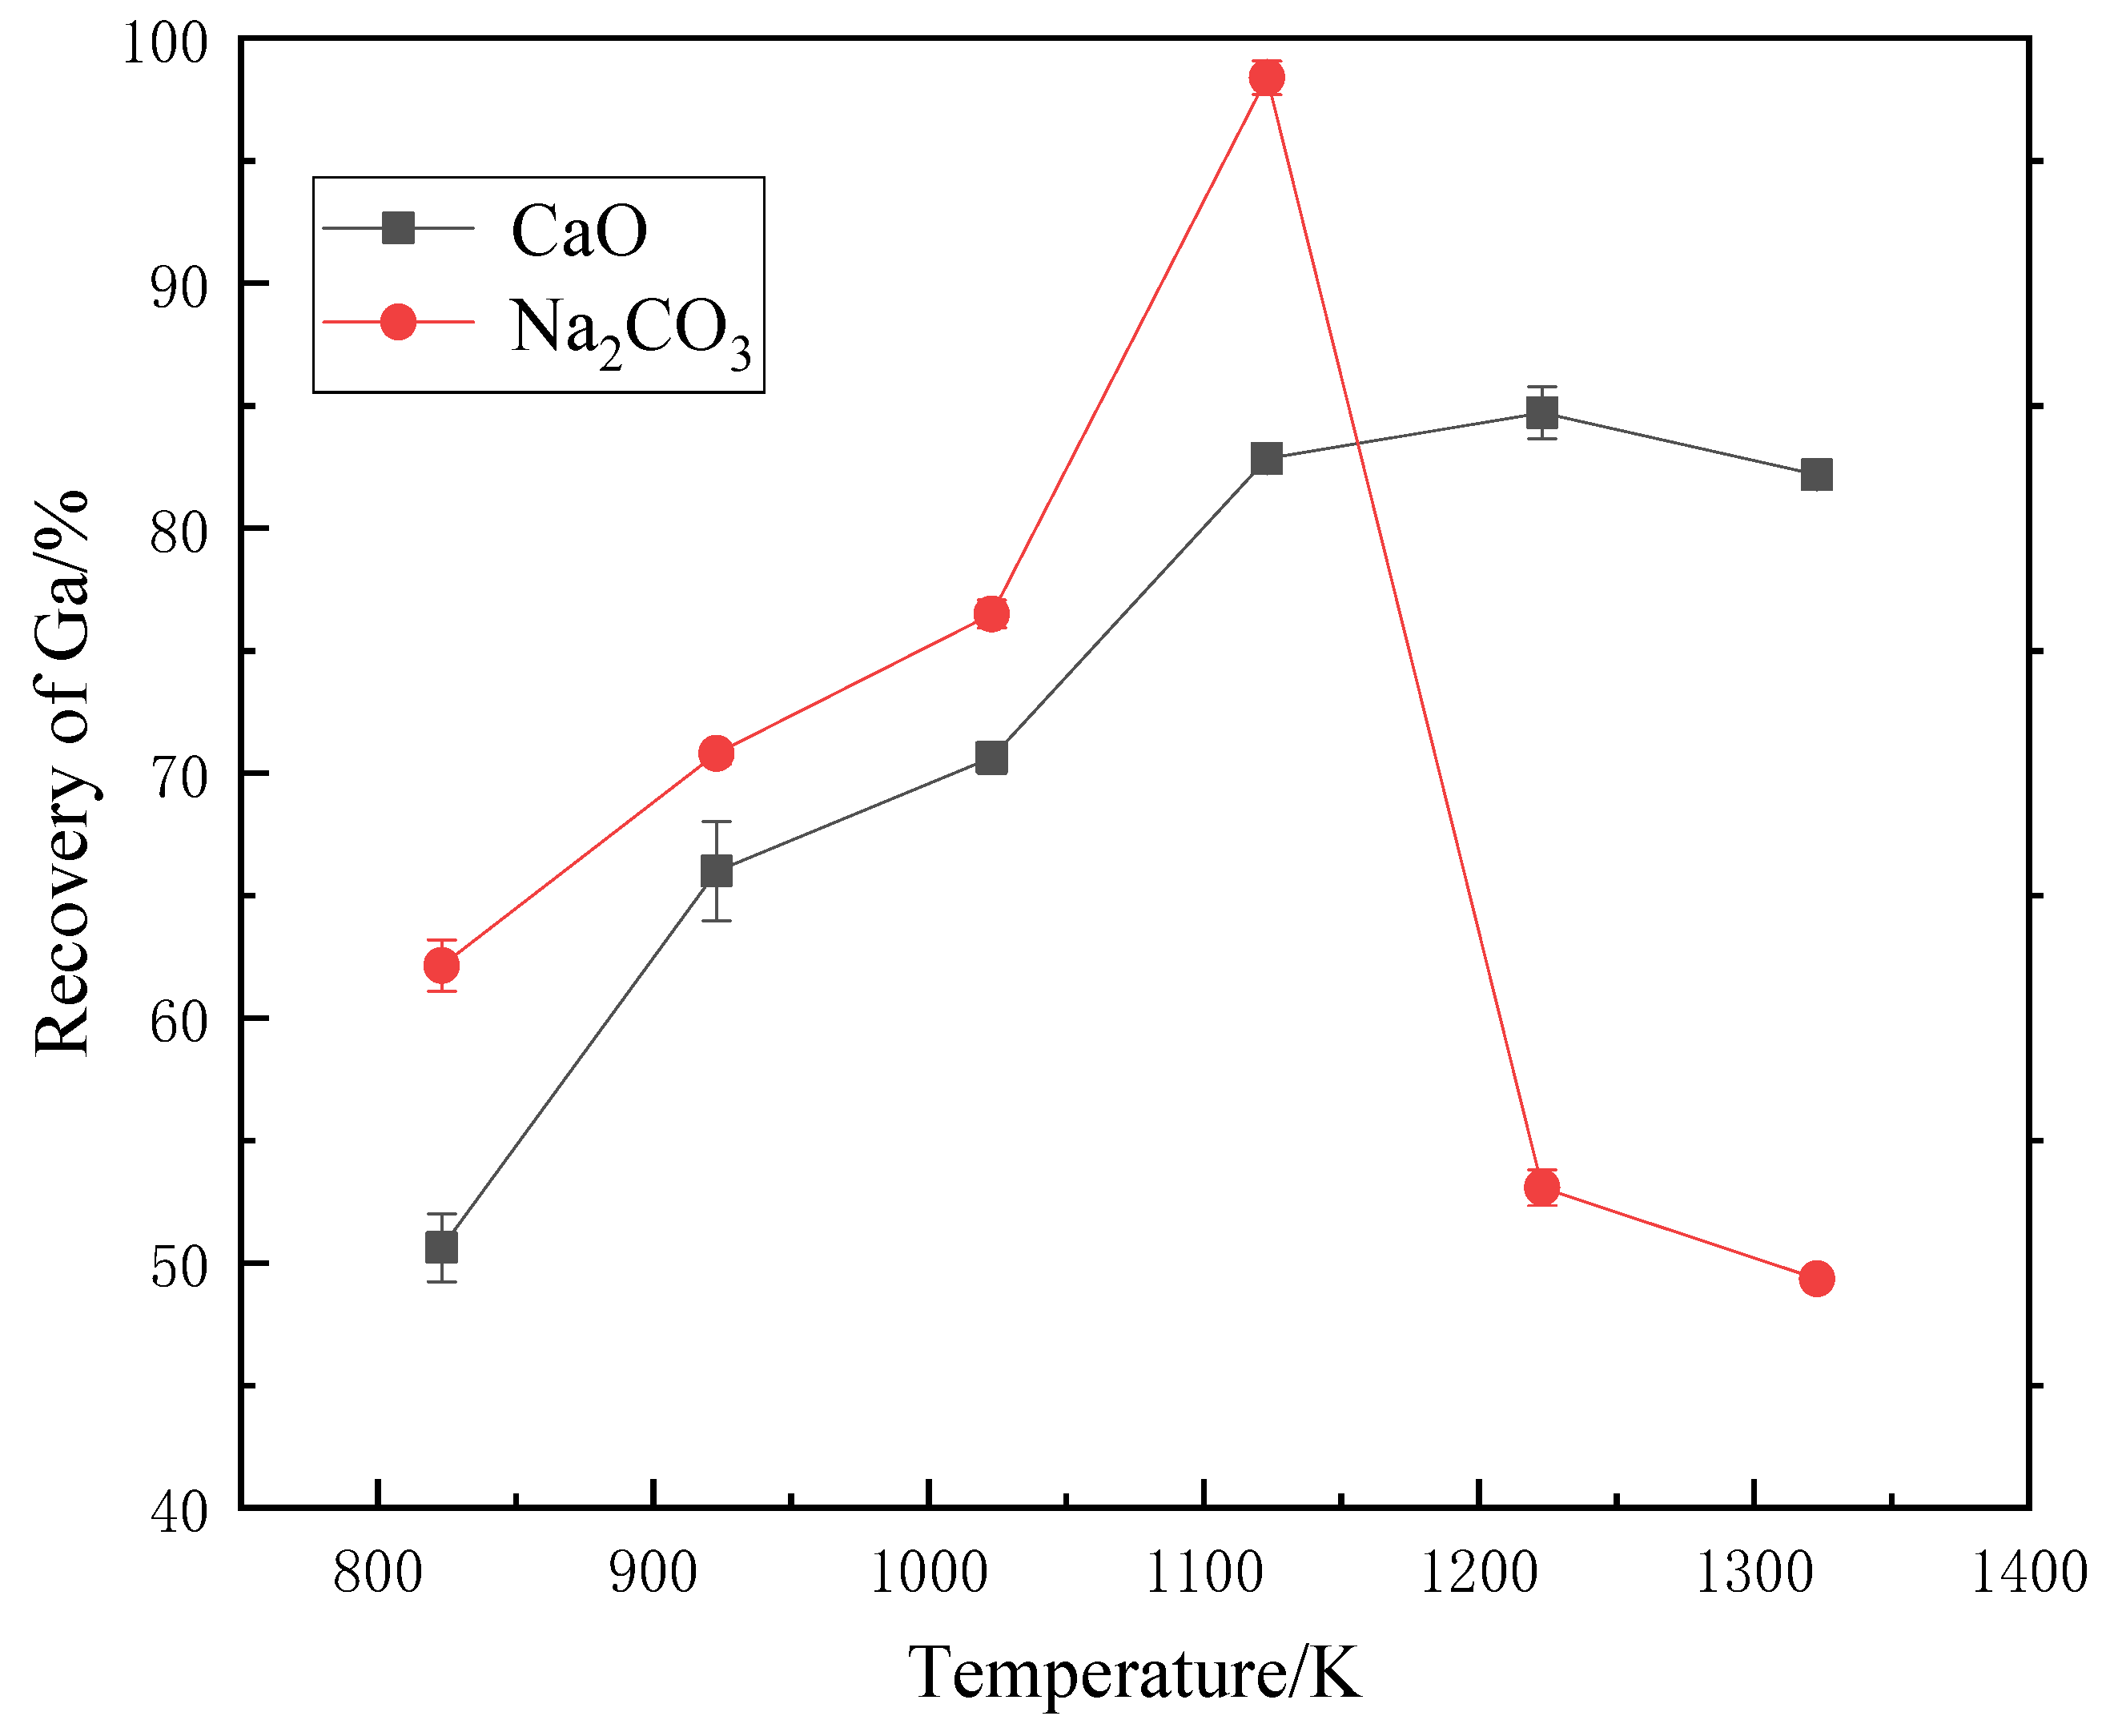
3 were used as roasting additives, with the aim of reacting with the silicates and improving the acid solubility of the gallium-containing components. The effect of roasting temperature on the recovery of gallium is shown in Figure 5. The recovery of gallium first increased and then decreased sharply with the increase in roasting temperature from 823 K to 1323 K, with the maximum at 1123 K. It is known that the melting point of Na2CO3 is around 1124 K and most sodium salts soften or melt below 1273 K. Hence, when the temperature was over 1123 K, the liquid sodium salt phase was produced. In fact, we found that the samples were obviously sintered, and the sintering phenomenon became more serious as the temperature increased from 1123 K to 1223 K. These lower-melting substances, especially the silicates, surrounding other higher-melting phases that contain gallium, made gallium difficult to extract by acid leaching. Additionally, these lower-melting substances could have filled pores within and between the sample particles, hindering the internal transfer of the leaching agent. Hence, the sintering was not beneficial to the subsequent leaching process. As displayed by the curve, the recovery of gallium declined rapidly from more than 98% to less than 55% in this temperature range. Compared with sodium carbonate, calcium oxide exhibited lower activation efficiency, and the corresponding recovery of gallium was lowered by 5%–12% at temperatures ranging from 823 K to 1123 K. However, unlike the trend in gallium recovery in sodium carbonate roasting, the recovery of gallium did not decrease but rather tended to level off when the roasting temperature was raised from 1123 K to 1323 K, and a maximum of 82.83% recovery was achieved. This was attributed to the higher melting point of calcium salts. In addition, no obvious sintering occurred during roasting within the chosen temperature range.
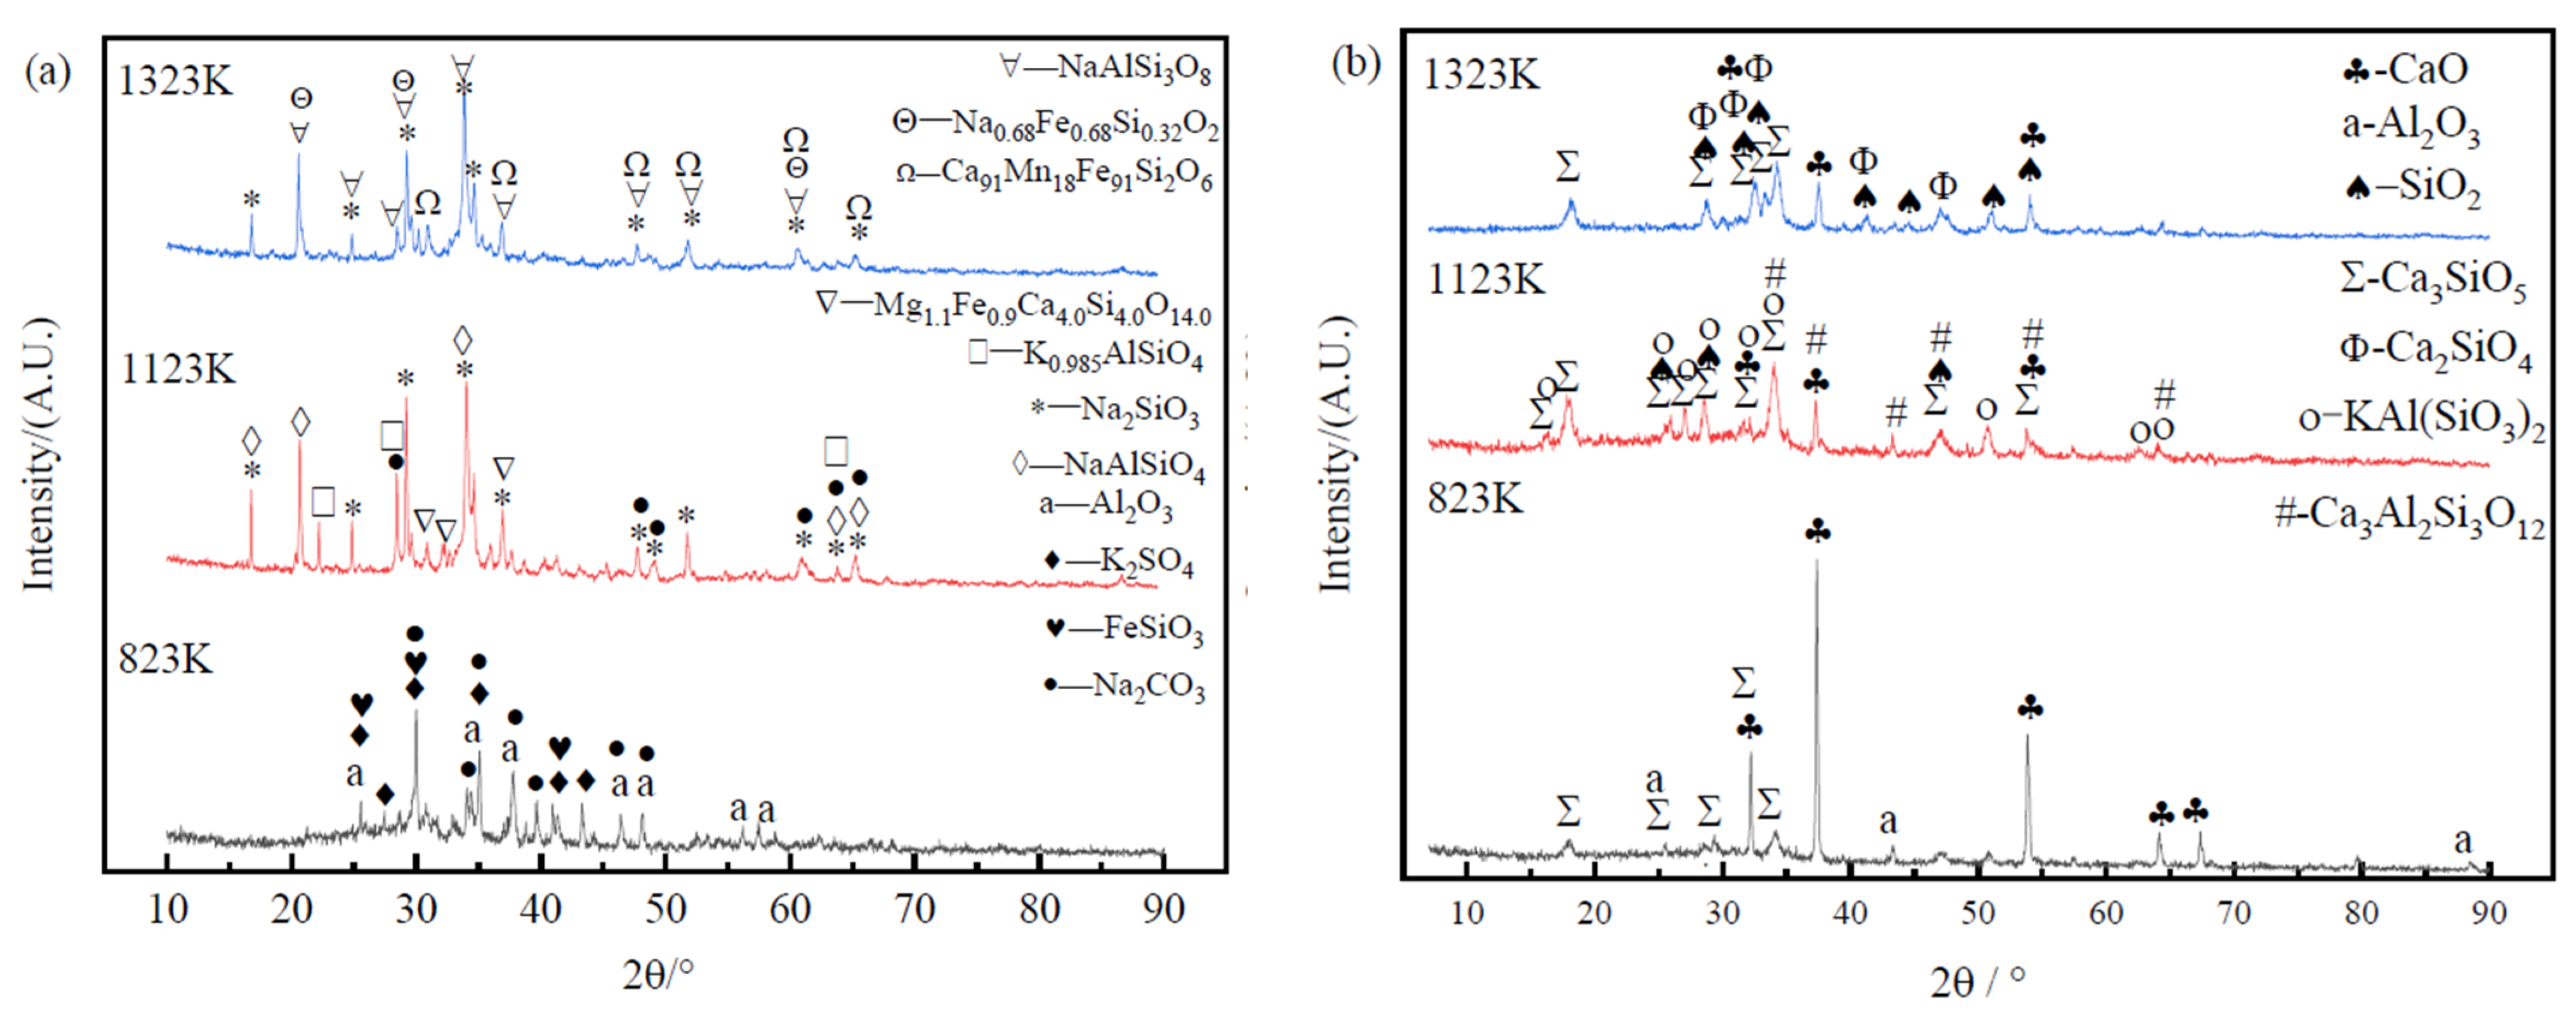
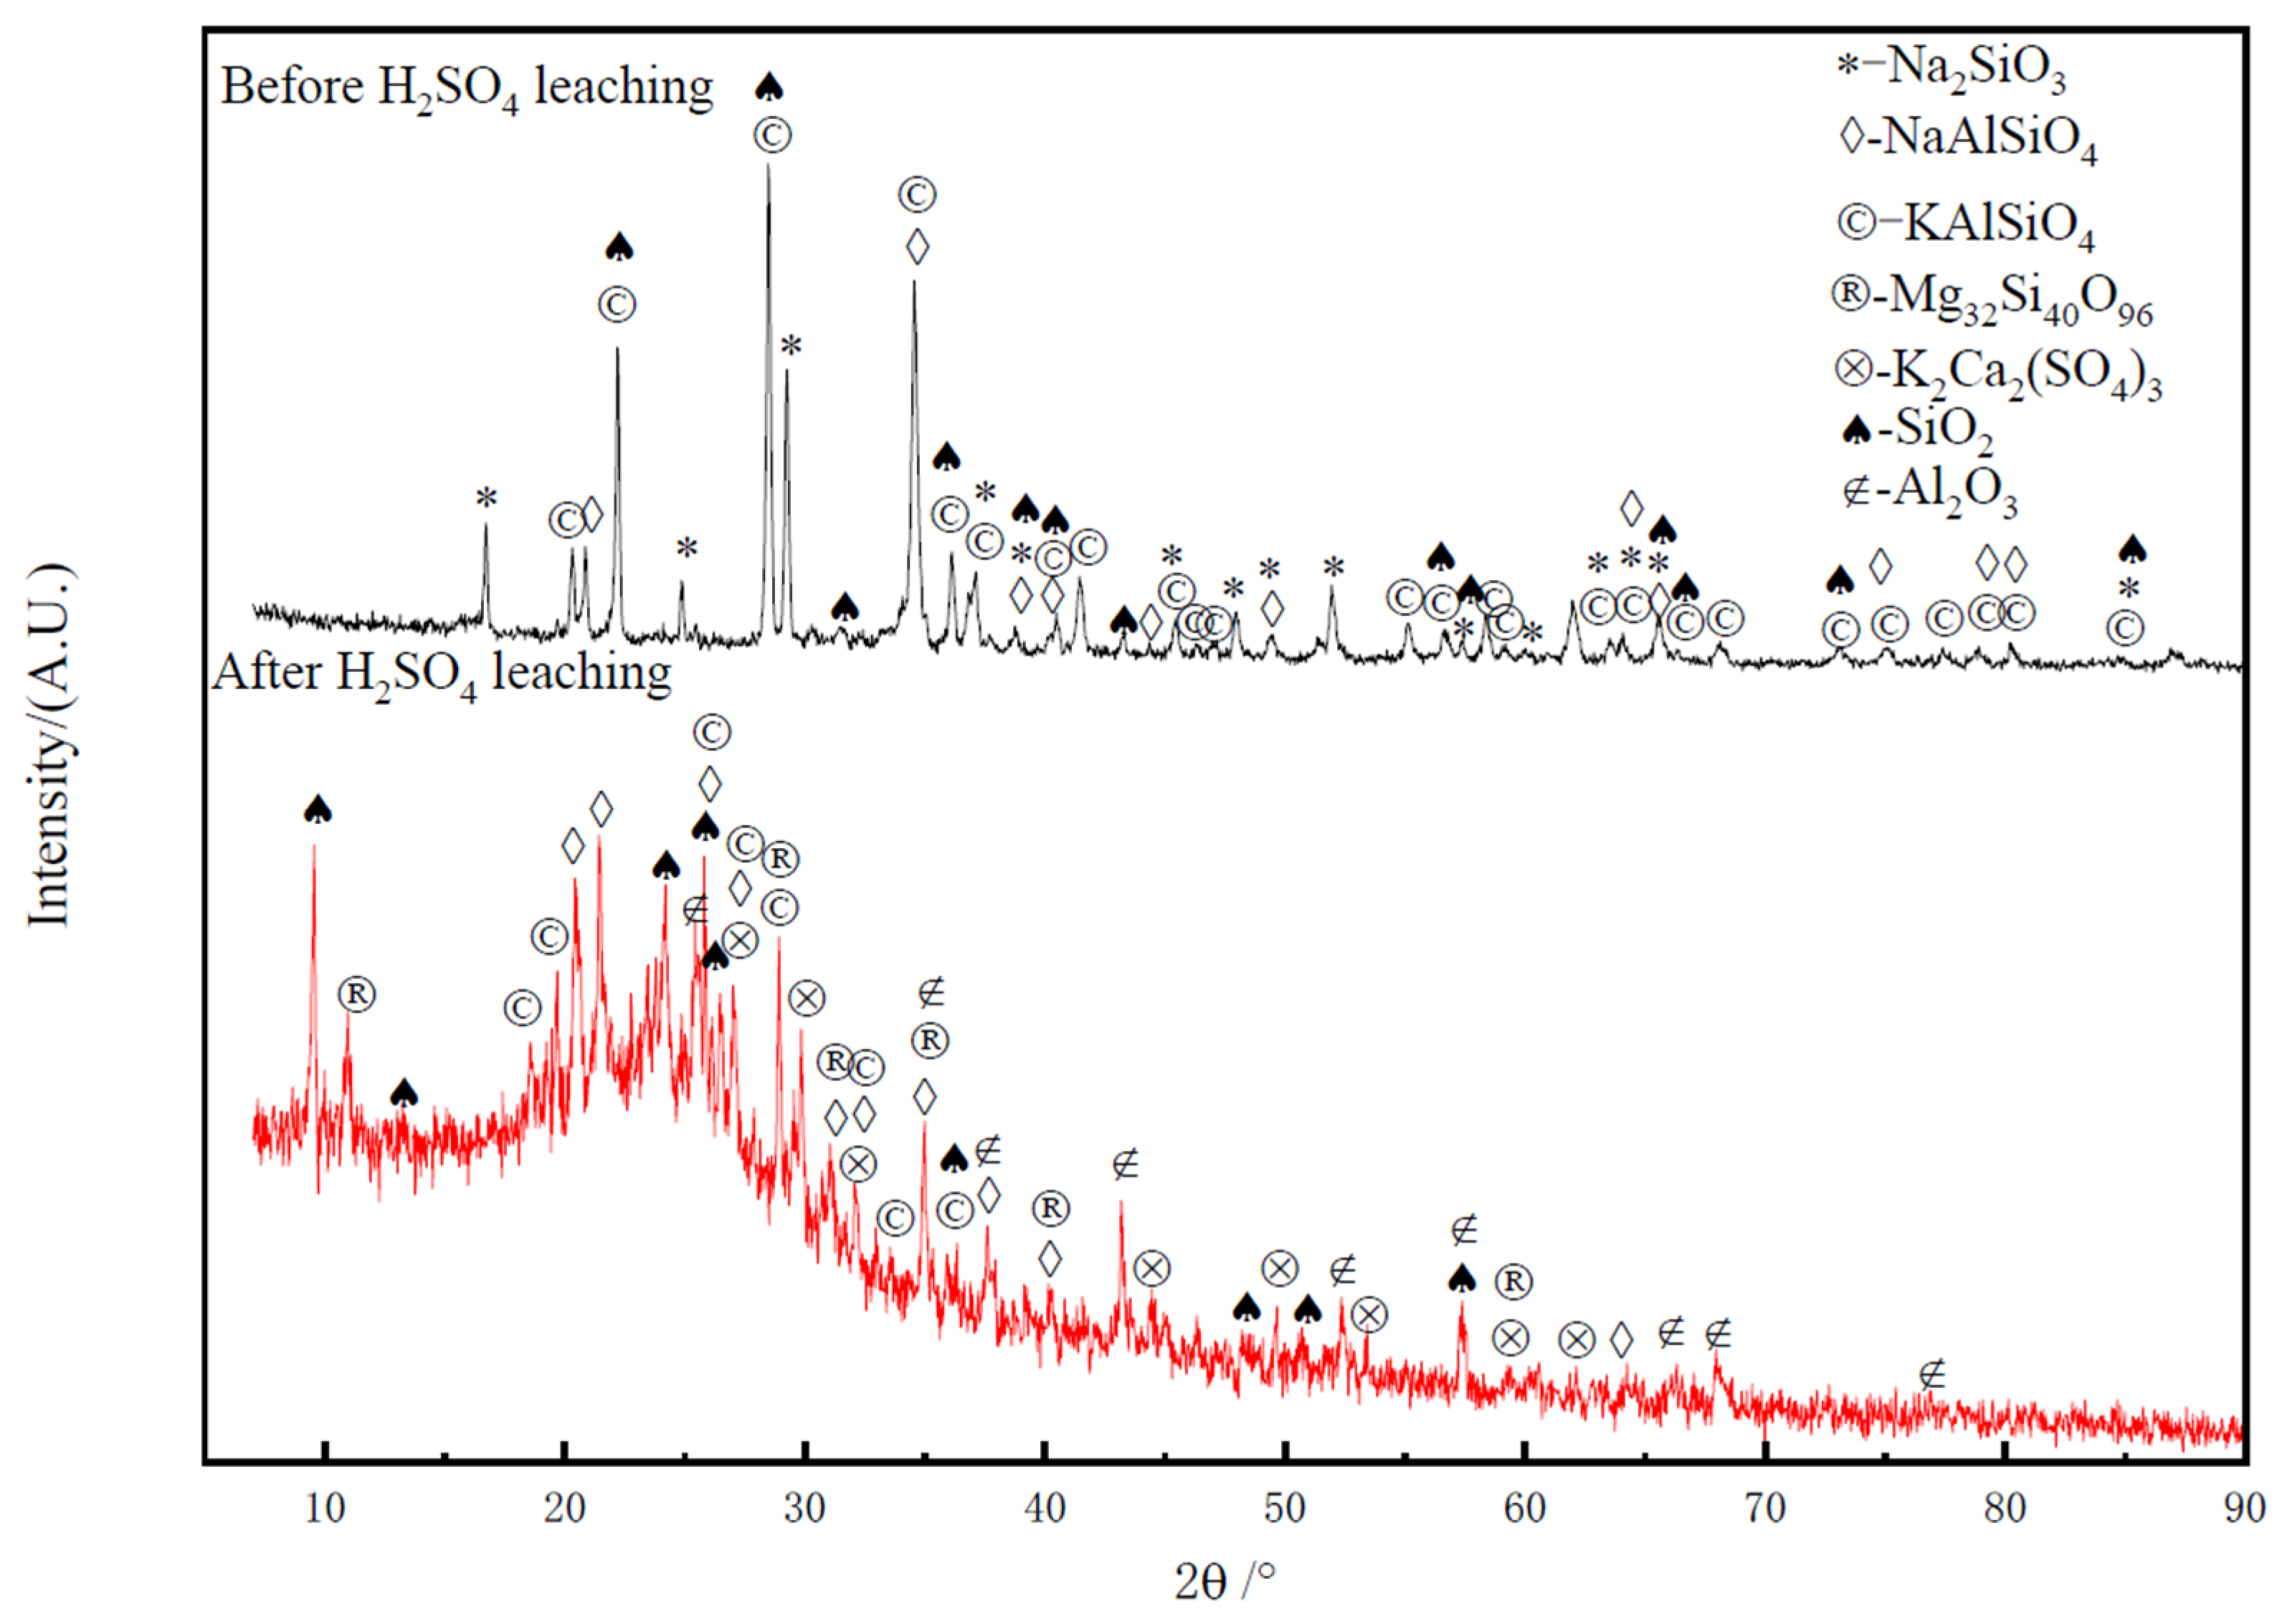
Figure 6a,b display the XRD patterns of samples roasted at 823 K, 1123 K, and 1323 K. As shown in Figure 6a, after roasting at 823 K for 2 h, the corundum and potassium sulfate were still present, and peaks for the sodium carbonate additive appeared, indicating that sodium carbonate was stable at this temperature and that the reactions between the additive and the dust were not sufficient. When roasted at 1123 K, most of the amorphous silicates and corundum in the original brown corundum dust reacted with sodium carbonate and formed new silicates (Na2SiO3 and Mg1.1Fe0.9Ca4Si4O14) and aluminosilicates (NaAlSiO4, K0.985AlSiO4). The characteristic peaks of Na2CO3 were still found, showing that there may have been an excess of the roasting additive. When increasing the temperature to 1323 K, the sodium carbonate disappeared and more sodium elements participated in the formation of silicates, such as Na2SiO3, NaAlSi3O8 (albite), and Na0.68Fe0.68Si0.32O2. Compared with the XRD patterns for 1123 K, no peaks related to the potassium components were observed.
When CaO was used as the roasting activation additive, after roasting at 823 K for 2 h some corundum still existed, as shown in Figure 6b. The characteristic peak intensity of calcium oxide was strong, suggesting that there was plenty of unreacted calcium oxide in the roasted sample. However, obviously, reactions between the additive and the dust had started and Ca3SiO5 was produced. After raising the temperature to 1123 K, the peak strength of calcium oxide decreased significantly, indicating that more calcium oxide took part in the reactions. Apart from Ca3SiO5, aluminosilicate (KAl(SiO3)2, Ca3Al2Si3O12) and SiO2 were generated. When the roasting temperature reached 1323 K, as in the sodium carbonate roasting, no peaks in the potassium-containing phase were found. The phase composition of the roasted sample changed at this temperature and included Ca3SiO5, Ca2SiO4, SiO2, and excess CaO. However, as illustrated in Figure 5, the recovery of gallium was not improved further when the temperature rose from 1123 K to 1323 K.

3.1.2. Additive Dosage

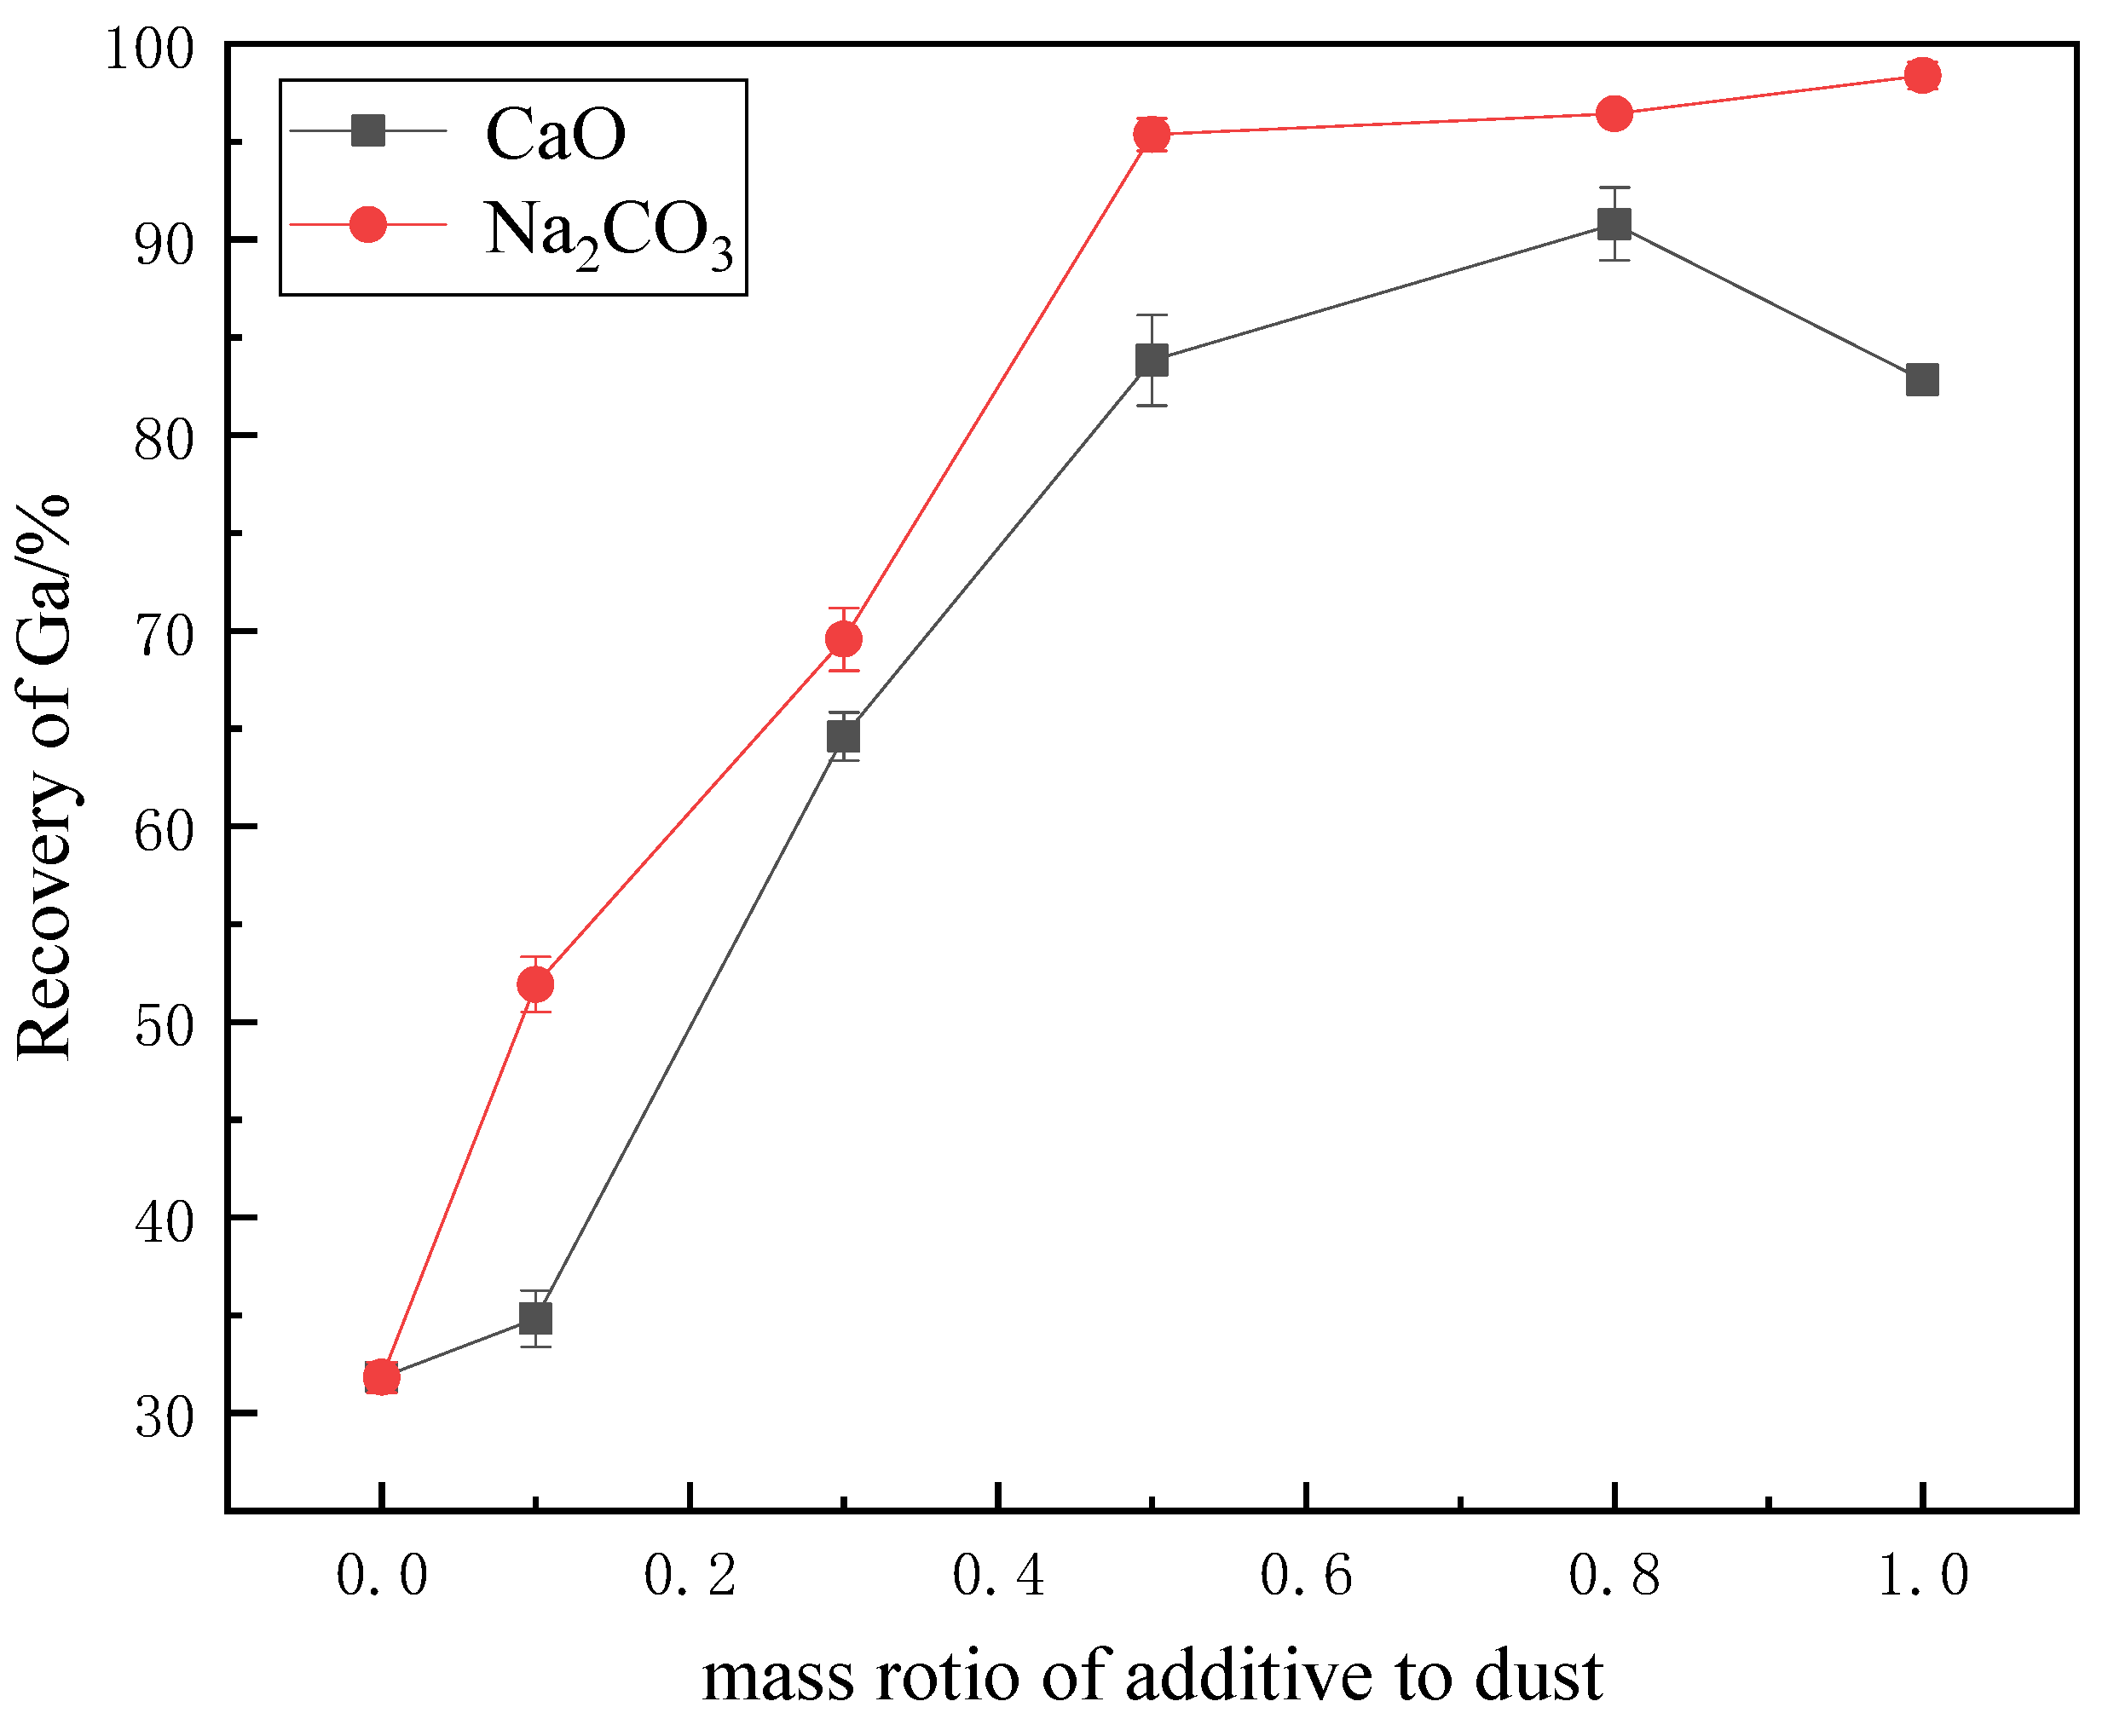
As mentioned above, an excess of additive was found in the roasted sample when the mass ratio of additive to dust was 1.0. Figure 7 shows the change in gallium recovery against the additive dosage. The recovery of gallium increased with an increasing amount of Na2CO3, and it tended to level off when the mass ratio was over 0.5. This was lower than the theoretical stoichiometric value (0.72) for transforming all the amorphous silicate into sodium silicate (Na2SiO3) but within the stoichiometric value range from NaAlSiO4 to Na2SiO3. When CaO was used as additive, the recovery of gallium increased when increasing the additive dosage and the highest recovery occurred at a mass ratio of 0.8, which was close to the theoretical value of 0.76 for CaO and SiO2, forming Ca2SiO4. This is in agreement with the XRD analysis, namely, that Ca2SiO4 was more stable than Ca3SiO5. When the mass ratio was increased to 1.0, the extraction percentage of gallium decreased. This may have resulted from the decrease in the leaching kinetic rate caused by the solid layer of Ca2SO4 produced by the reaction between the excess CaO and H2SO4.
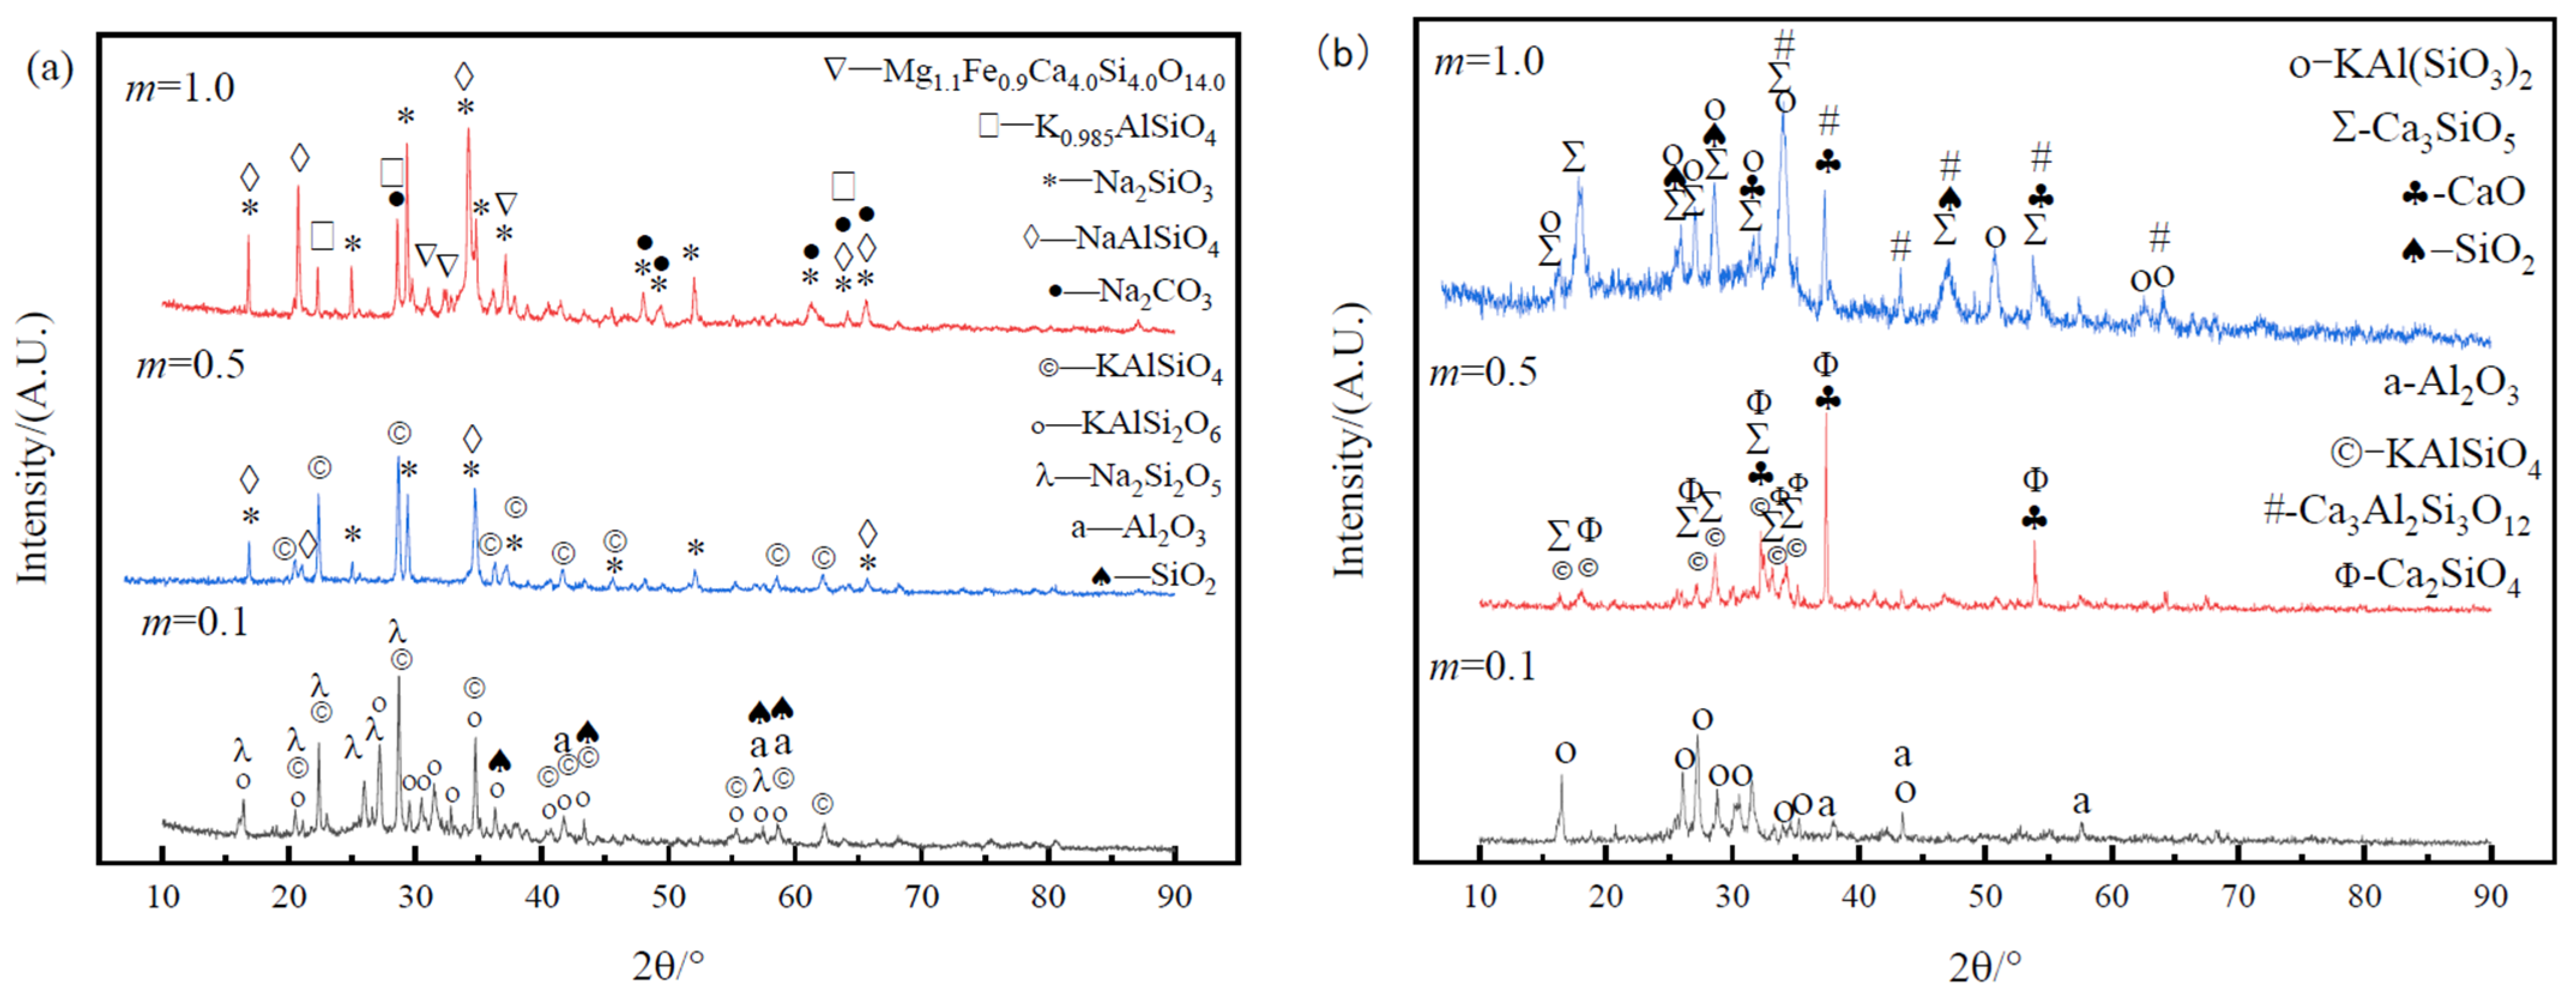
Figure 8 shows the XRD patterns of roasted products with different dosages of additives. When the mass ratio was 0.1, there was some unreacted corundum (Al2O3) in the roasted dust, and Na2Si2O5, SiO2, and some potassium aluminosilicate salts (KAlSiO4, KAlSi2O6) were produced. As the dosage of Na2CO3 was increased to 0.5, the characteristic peaks of Al2O3 and SiO5 disappeared and the occurrence of sodium silicate changed from Na2Si2O5 to Na2SiO3 because more sodium participated in the reactions. Some potassium elements were replaced with the sodium, and then sodium aluminosilicate (NaAlSiO4) was formed. When the mass ratio of additive to dust equaled 1.0, clearly there was an excess of sodium carbonate and its characteristic peaks appeared in the roasted dust. The phase composition of the dust was thoroughly changed. The original amorphous silicate and corundum were completely invisible and new silicates (Na2SiO3 and Mg1.1Fe0.9Ca4.0Si4.0O14.0) and aluminosilicates (NaAlSiO4 and K0.985AlSiO4) were generated.
Similarly, when the CaO additive was insufficient, there was no calcium silicate found, as shown in Figure 8b, and the main silicate phase was potassium aluminosilicate (KAl(SiO3)2). When increasing the mass ratio to 0.5, the extent of the reaction between the dust and activation additive became greater; dicalcium silicate (Ca2SiO3) and tricalcium silicate (Ca3SiO5) coexisted. By further raising the dosage of CaO, the dicalcium silicate was converted into tricalcium silicate. Additionally, calcium aluminosilicate (Ca3Al2Si3O12) appeared. Although the characteristic peaks of calcium oxide appeared in both patterns of additive mass ratios of 0.5 and 1.0, the reason for the mass ratio of 0.5 was attributed to reaction kinetic limitation; consequently, the reactions between the additive and the dust were insufficient. The remaining calcium oxide in the sample with a mass ratio of 1.0 predominantly resulted from dosing more of the additive than was required for the reactions.
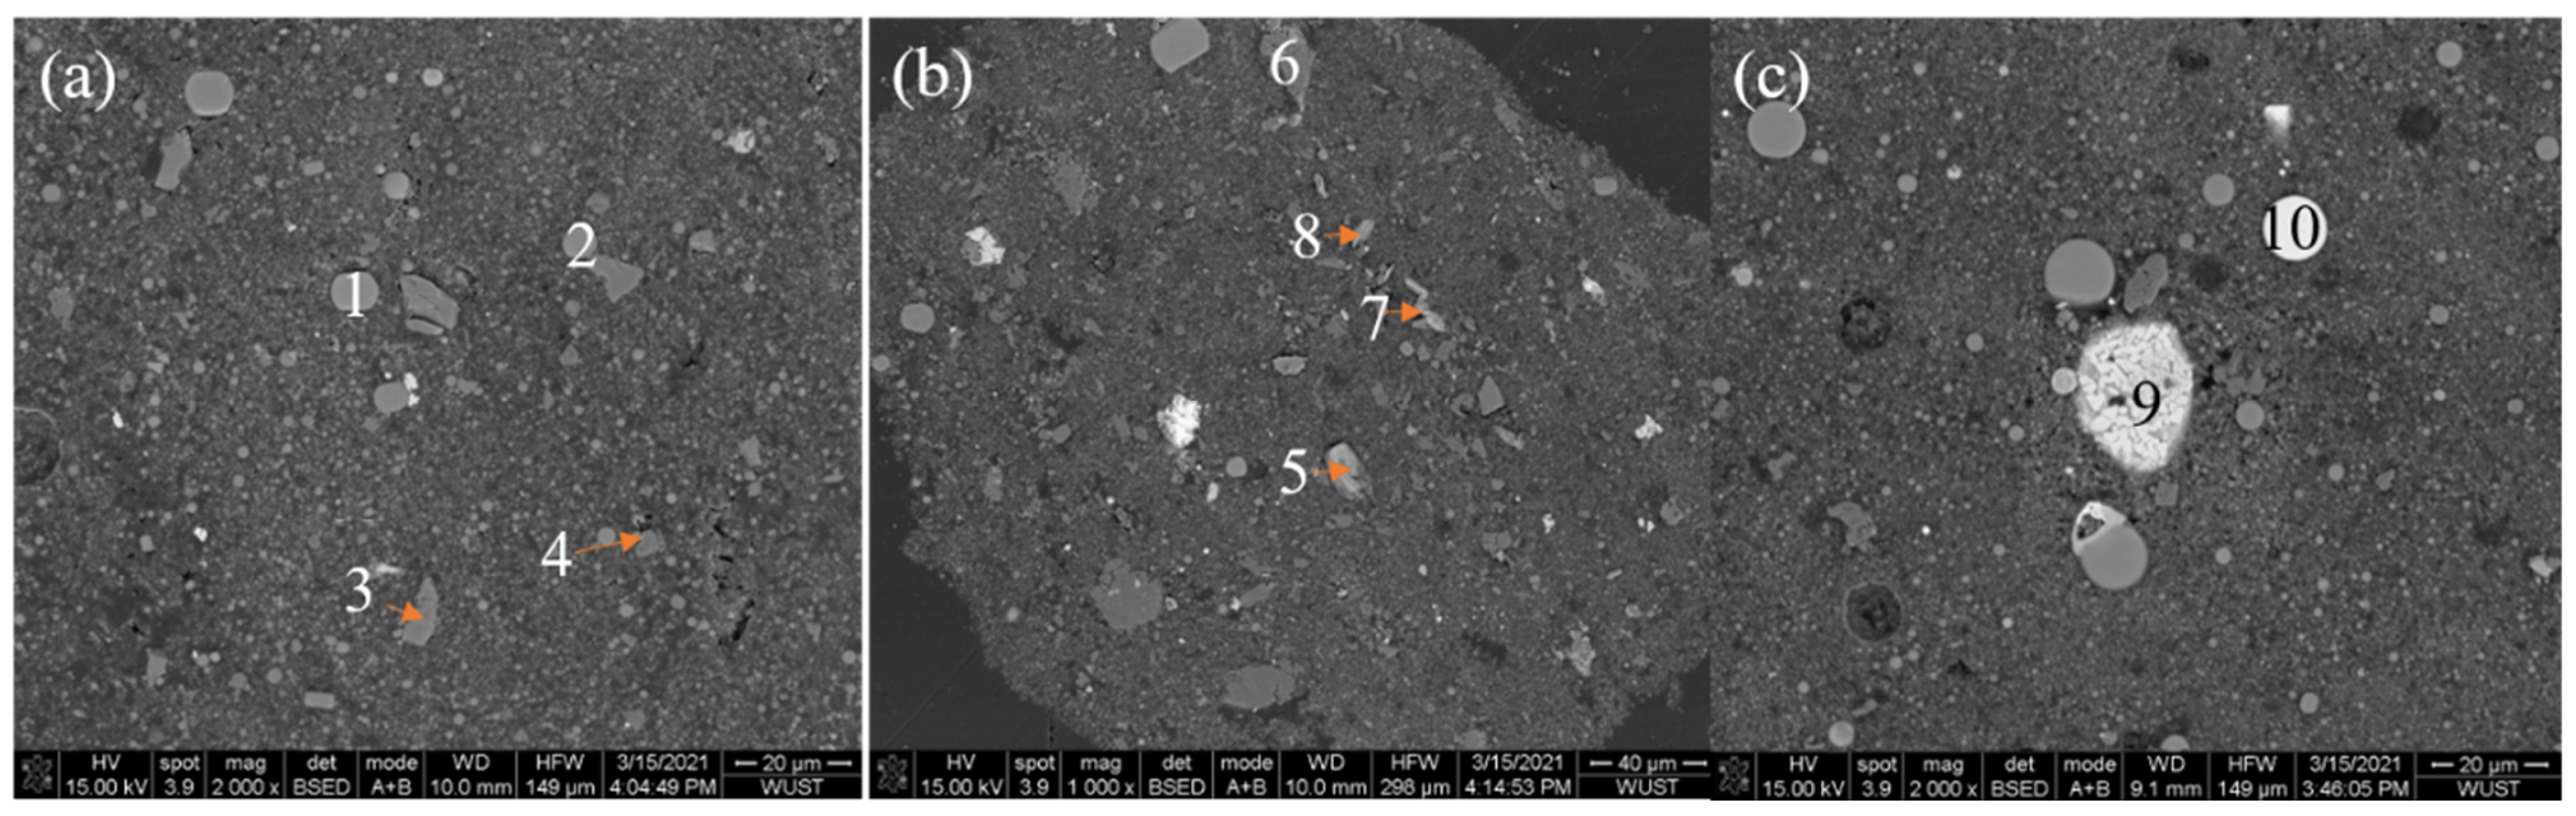
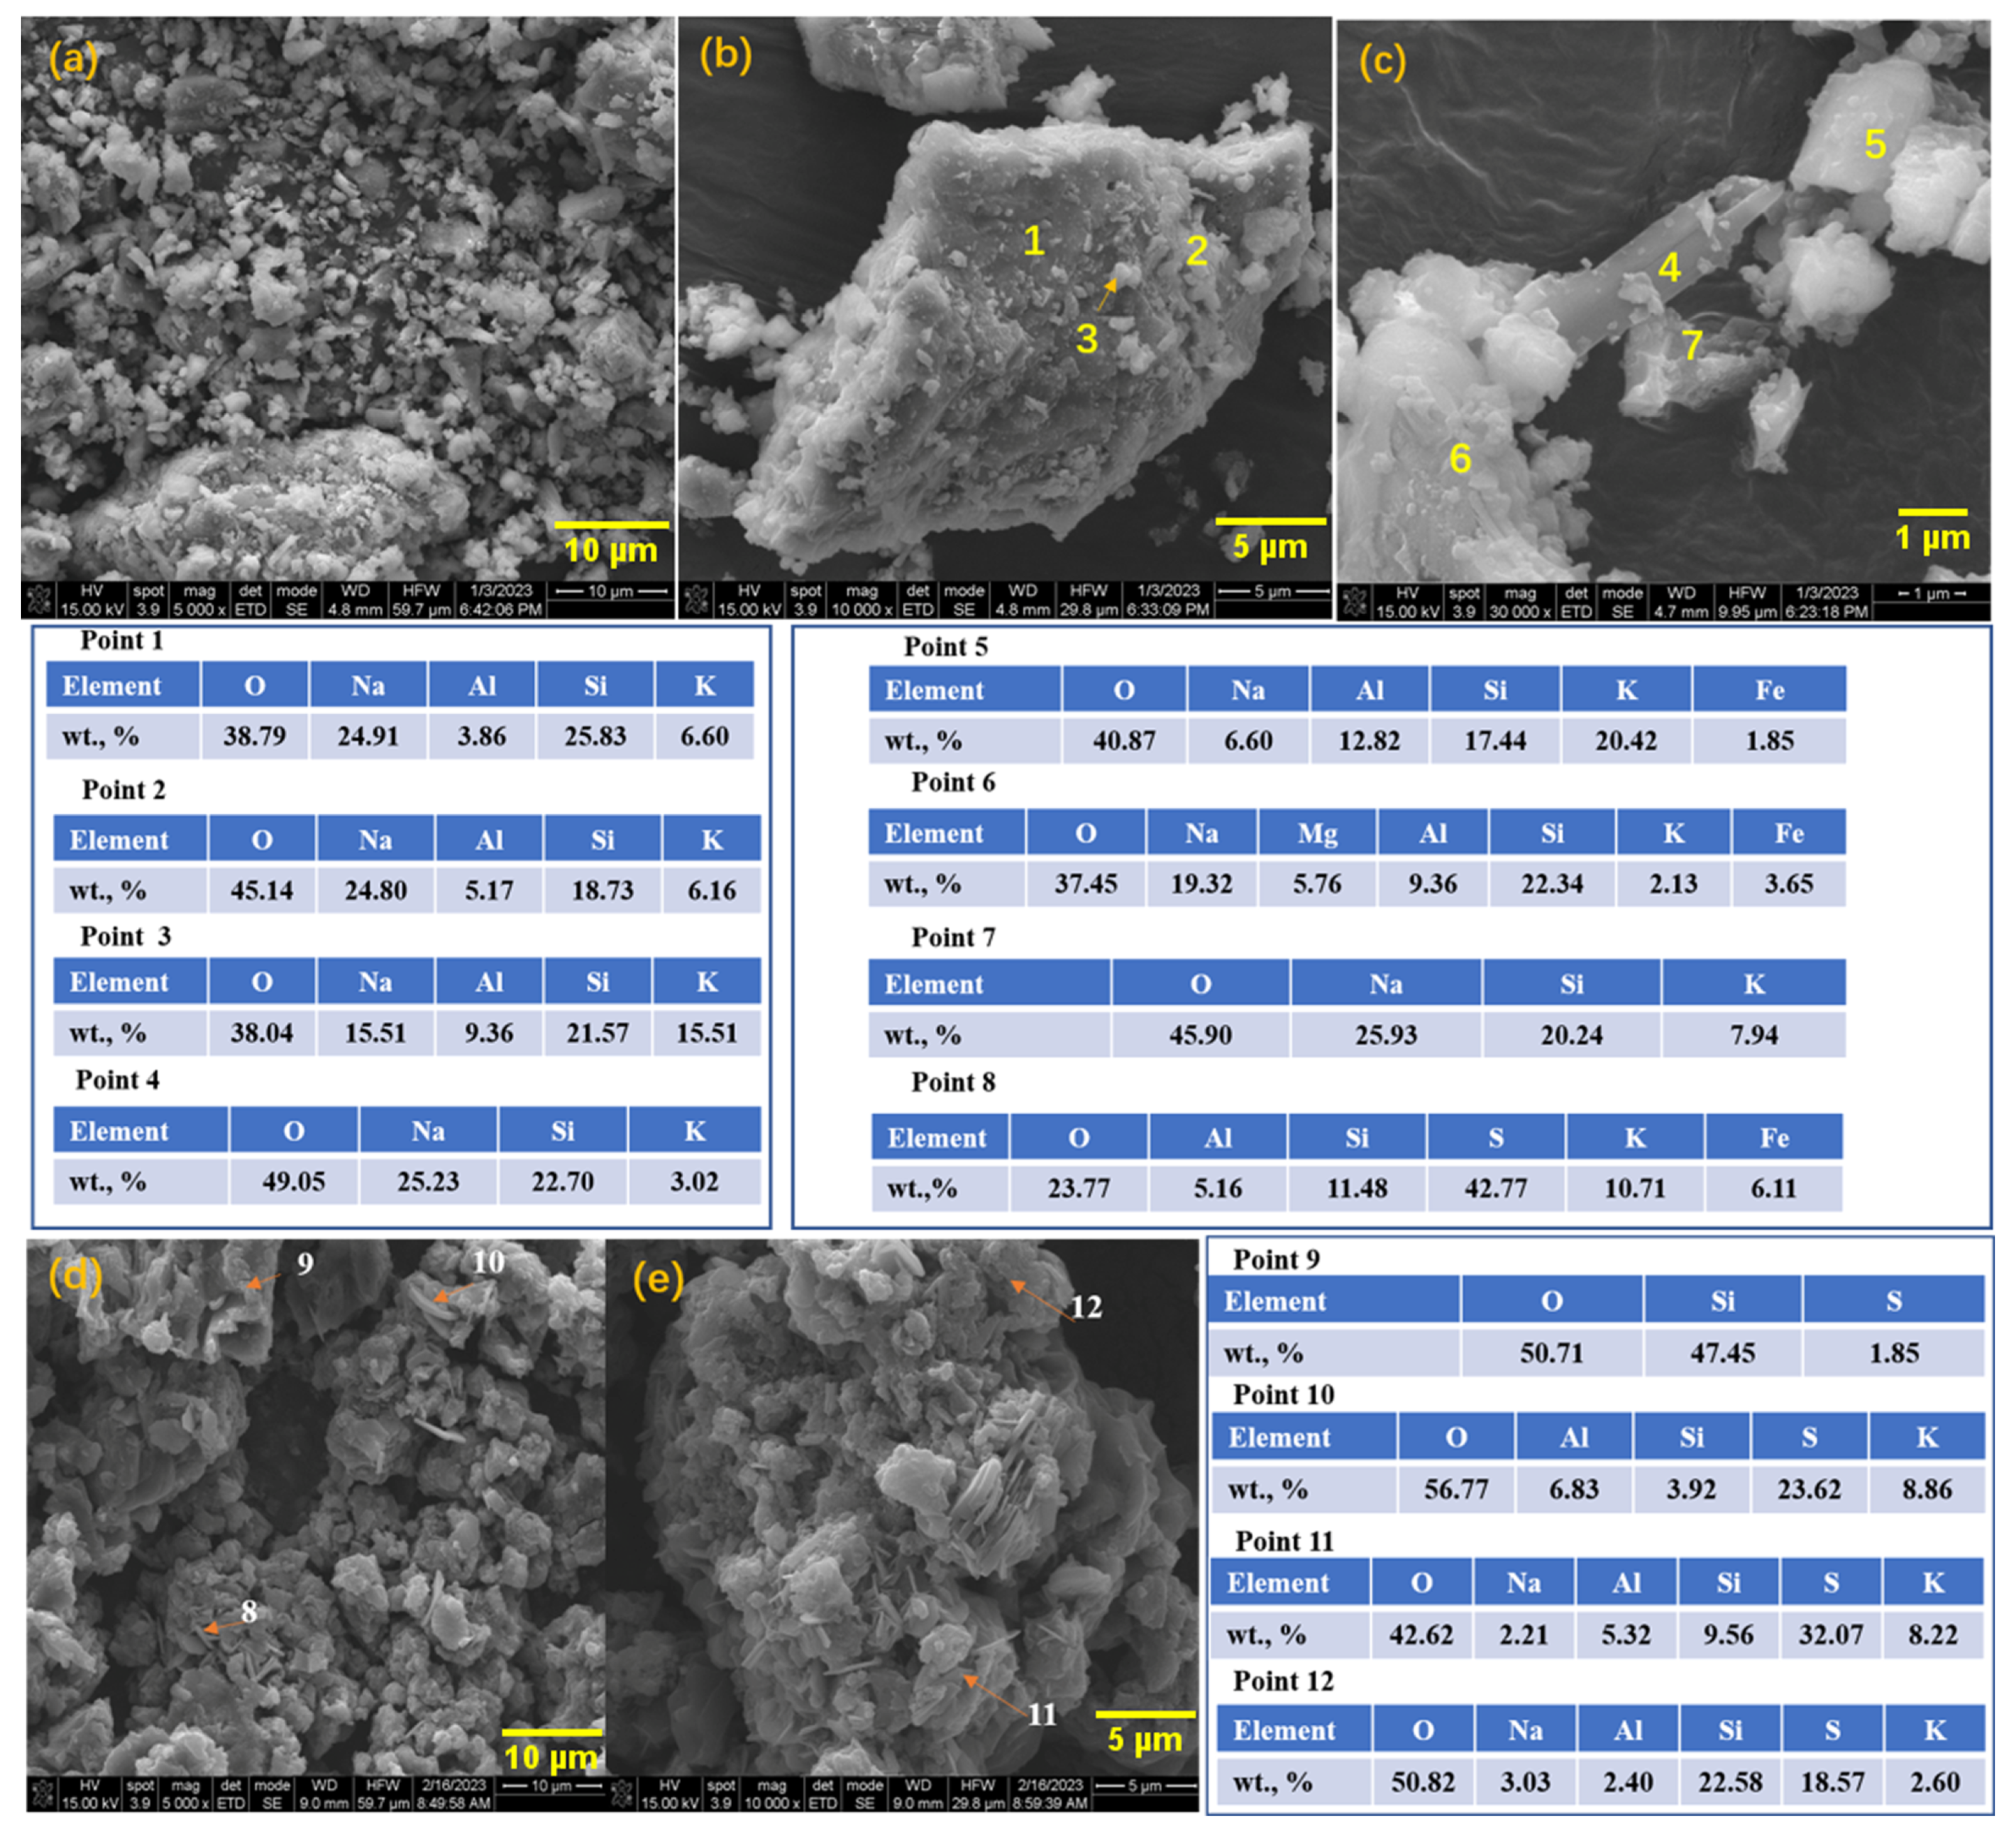
The effect of additive dosage on activation roasting was further studied by SEM–EDS, and the results for roasted dust with a mass ratio (Na2CO3/dust) of 0.1 and 1.0 are shown in Figure 9 and Table 3.
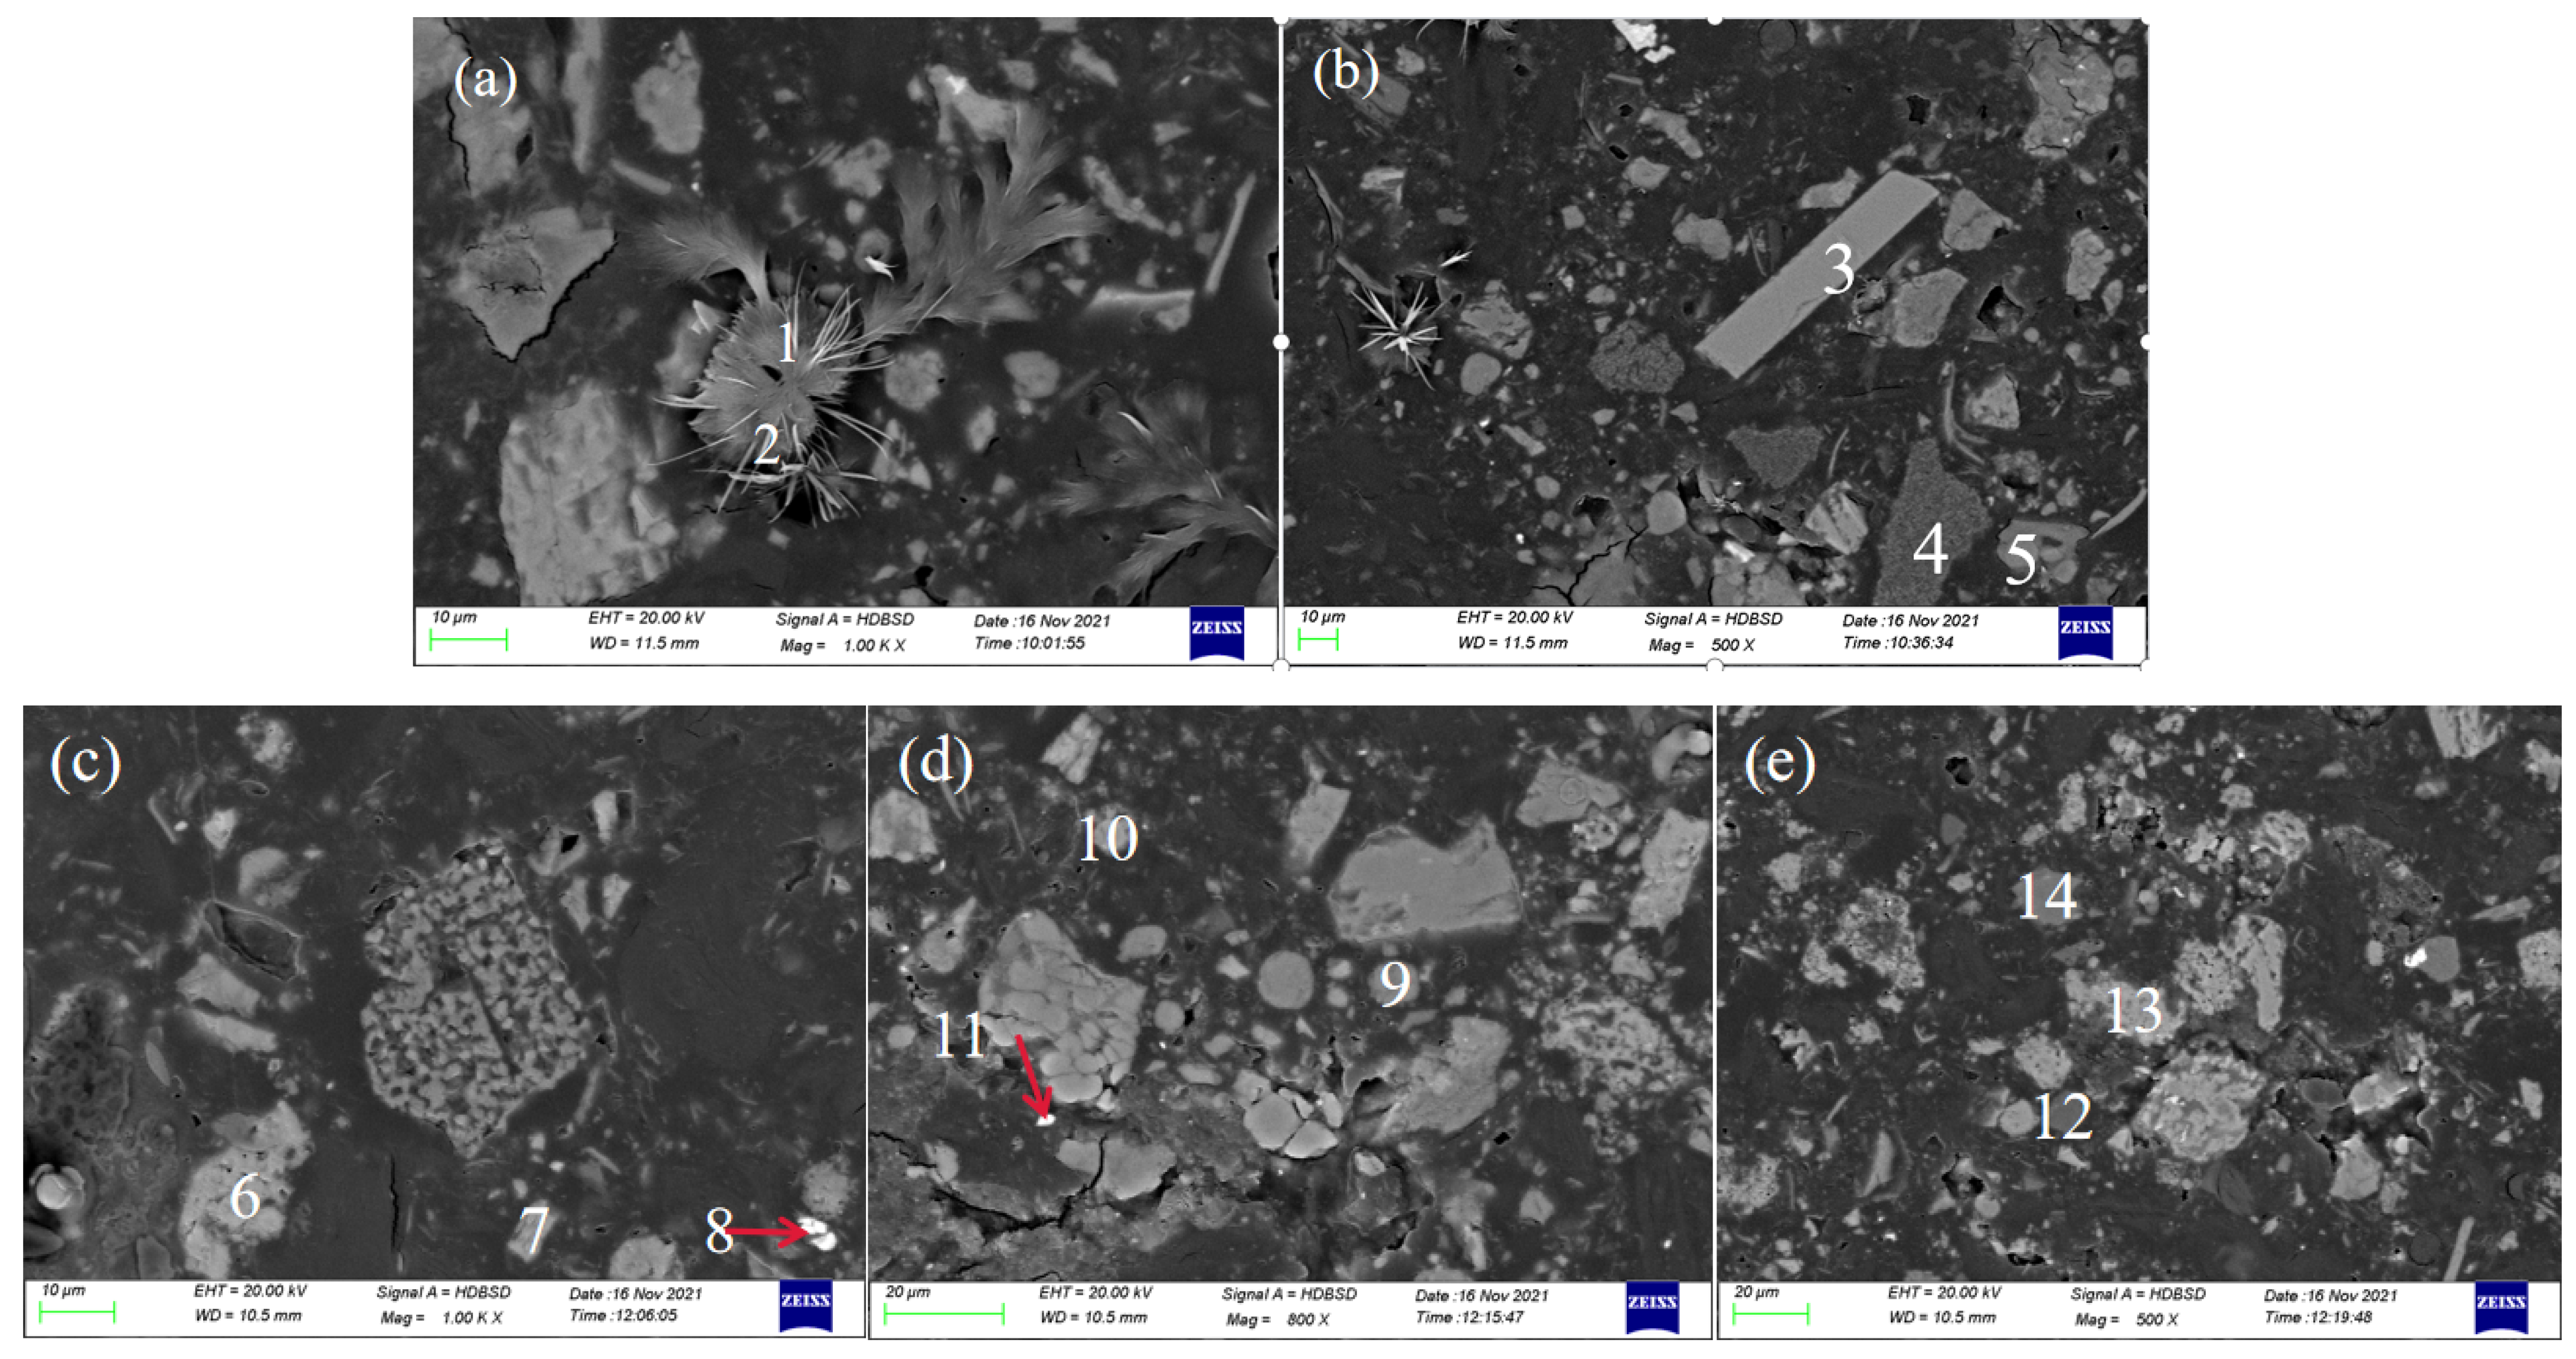
By comparing the images in Figure 9, it can be seen that there was a surplus of sodium carbonate when the additive was added at a mass ratio of 1.0. Multiple feather-like and needle-like substances appeared in the roasted sample. Based on the chemical composition in Table 3, we speculated that these were sodium oxide (point 1) and sodium carbonate (point 2). This is in agreement with the XRD analysis shown in Figure 8a. Although the thermodynamic calculation results show that sodium carbonate was stable at this roasting temperature and at a pressure of 1 atm, the decomposition of sodium carbonate occurred due to the far lower partial pressure of the produced CO2 gas, which promoted the decomposition reaction [27]. Besides, the thermodynamic calculations were based on a simplification of the reactants contained in the dust. In fact, the components involved in the reaction were complex in the real reaction system and some substance may have accelerated the decomposition of sodium carbonate. Point 3 is calcium aluminosilicate, point 4 contains magnesium oxide, and points 5 and 9 consist of sodium aluminosilicate. Points 6, 10, and 13 in Figure 9c–e are potassium aluminosilicates. Point 7 is composed of calcium aluminosilicate. Point 8 indicates iron oxide. Points 11 and 12 are mainly composed of magnesium oxide, calcium oxide, and sodium oxide. Point 14 is silicon oxide. These results are consistent with the XRD patterns. The simple oxides (MgO, CaO, FeO) were present in the roasted dust with low dosages of Na2CO3, meaning that the amorphous silicate was not completely activated with roasting, and these oxides did not transfer to the silicates.
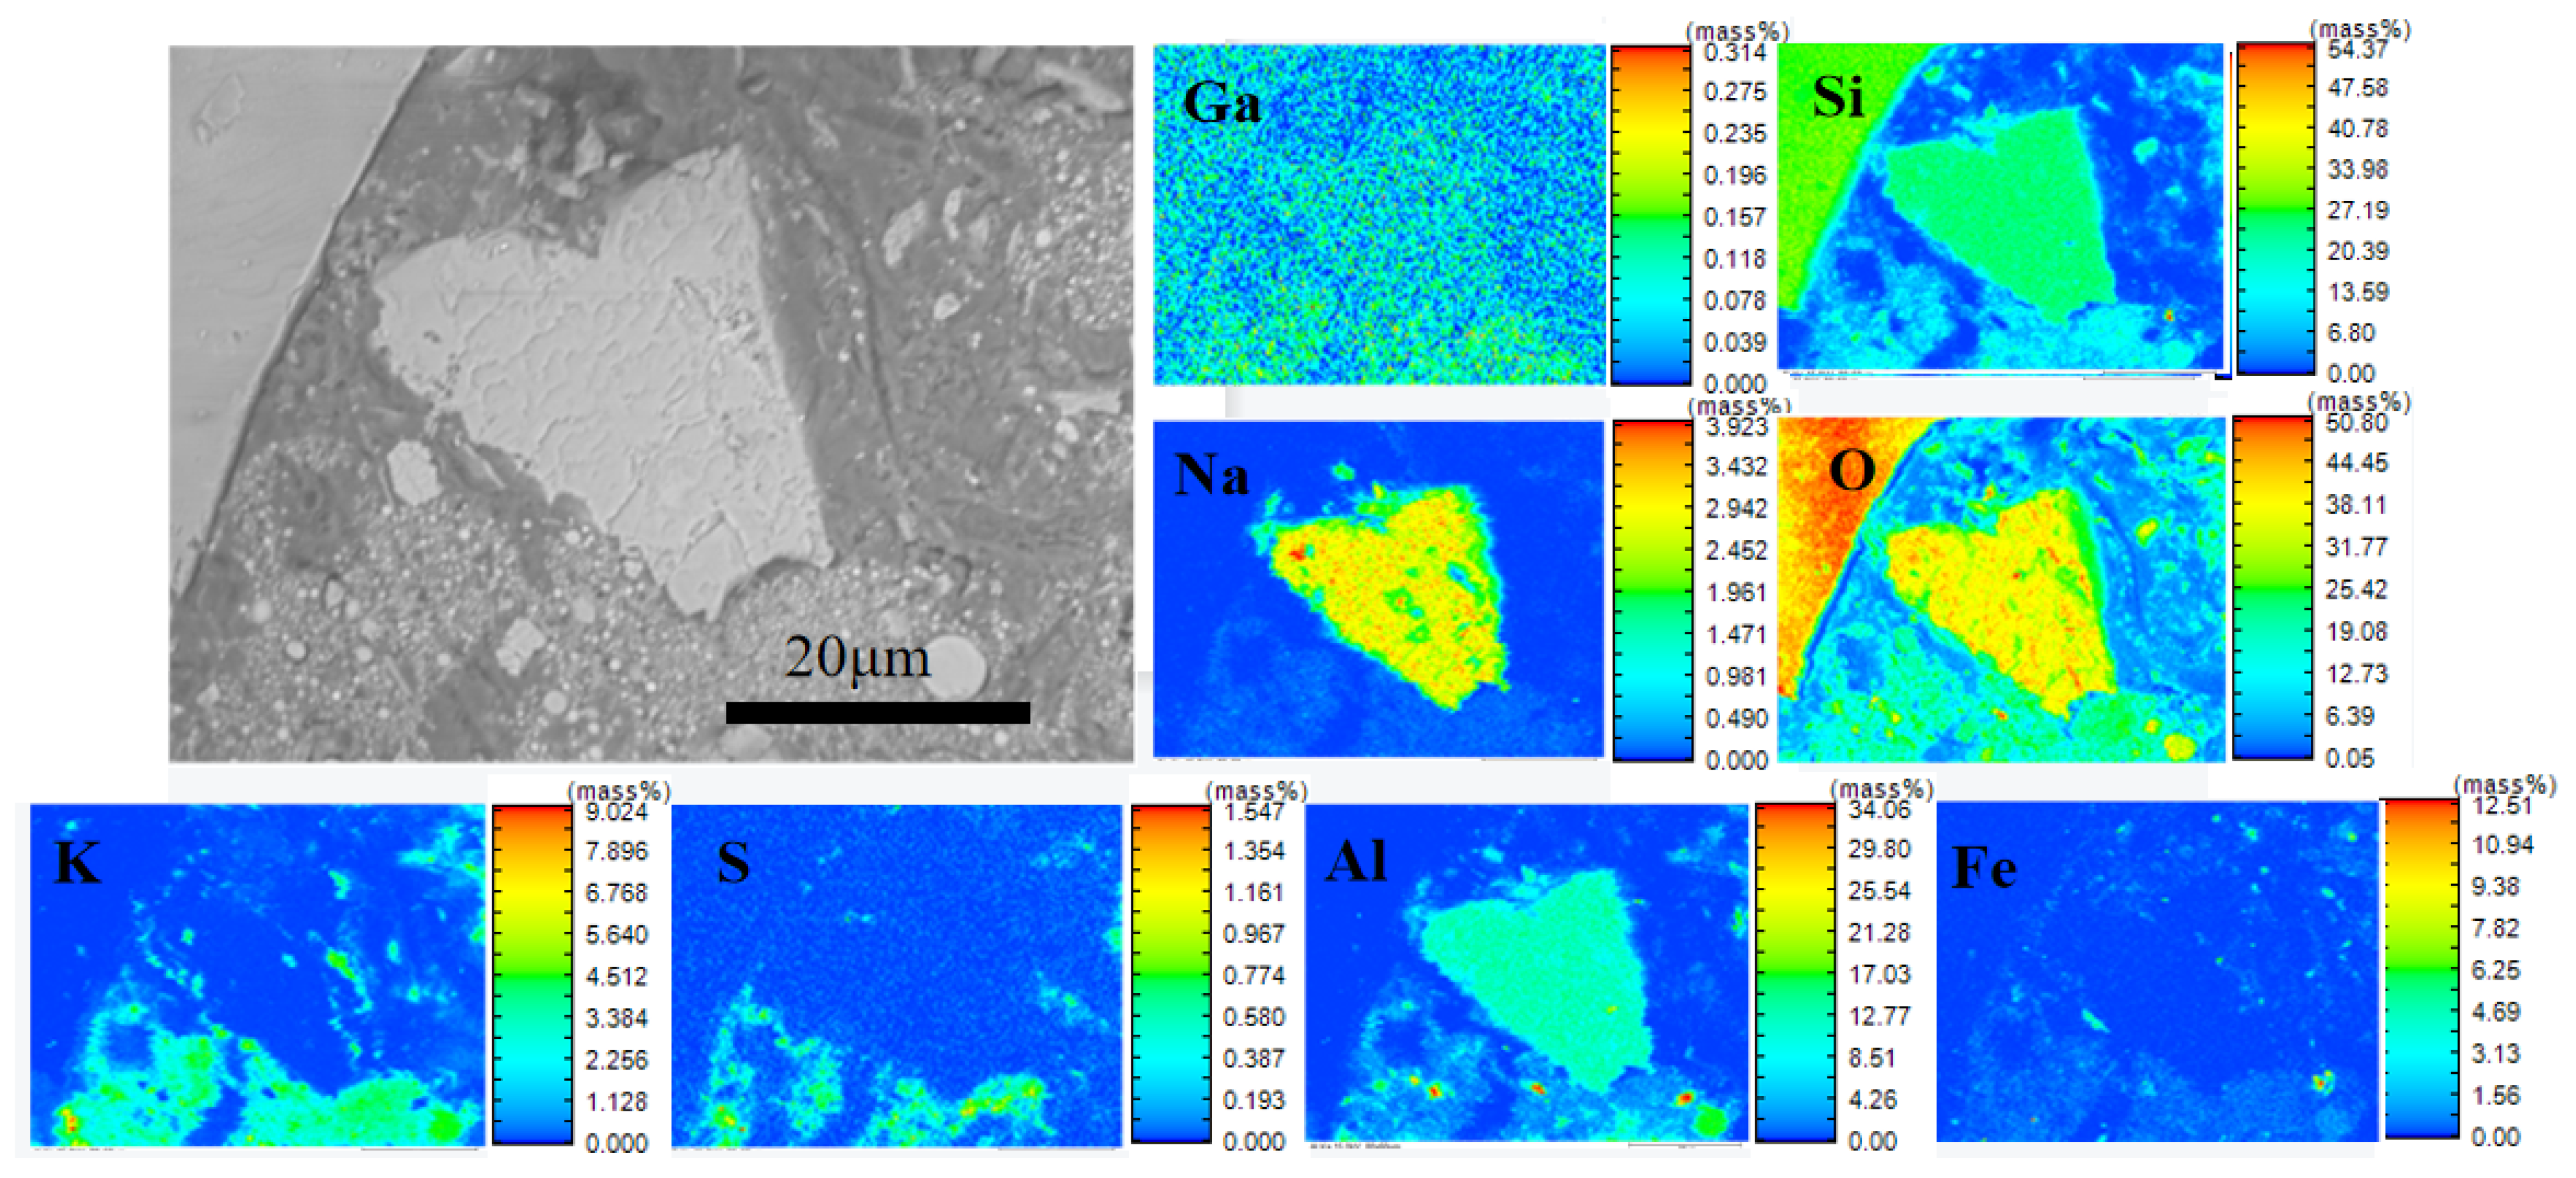
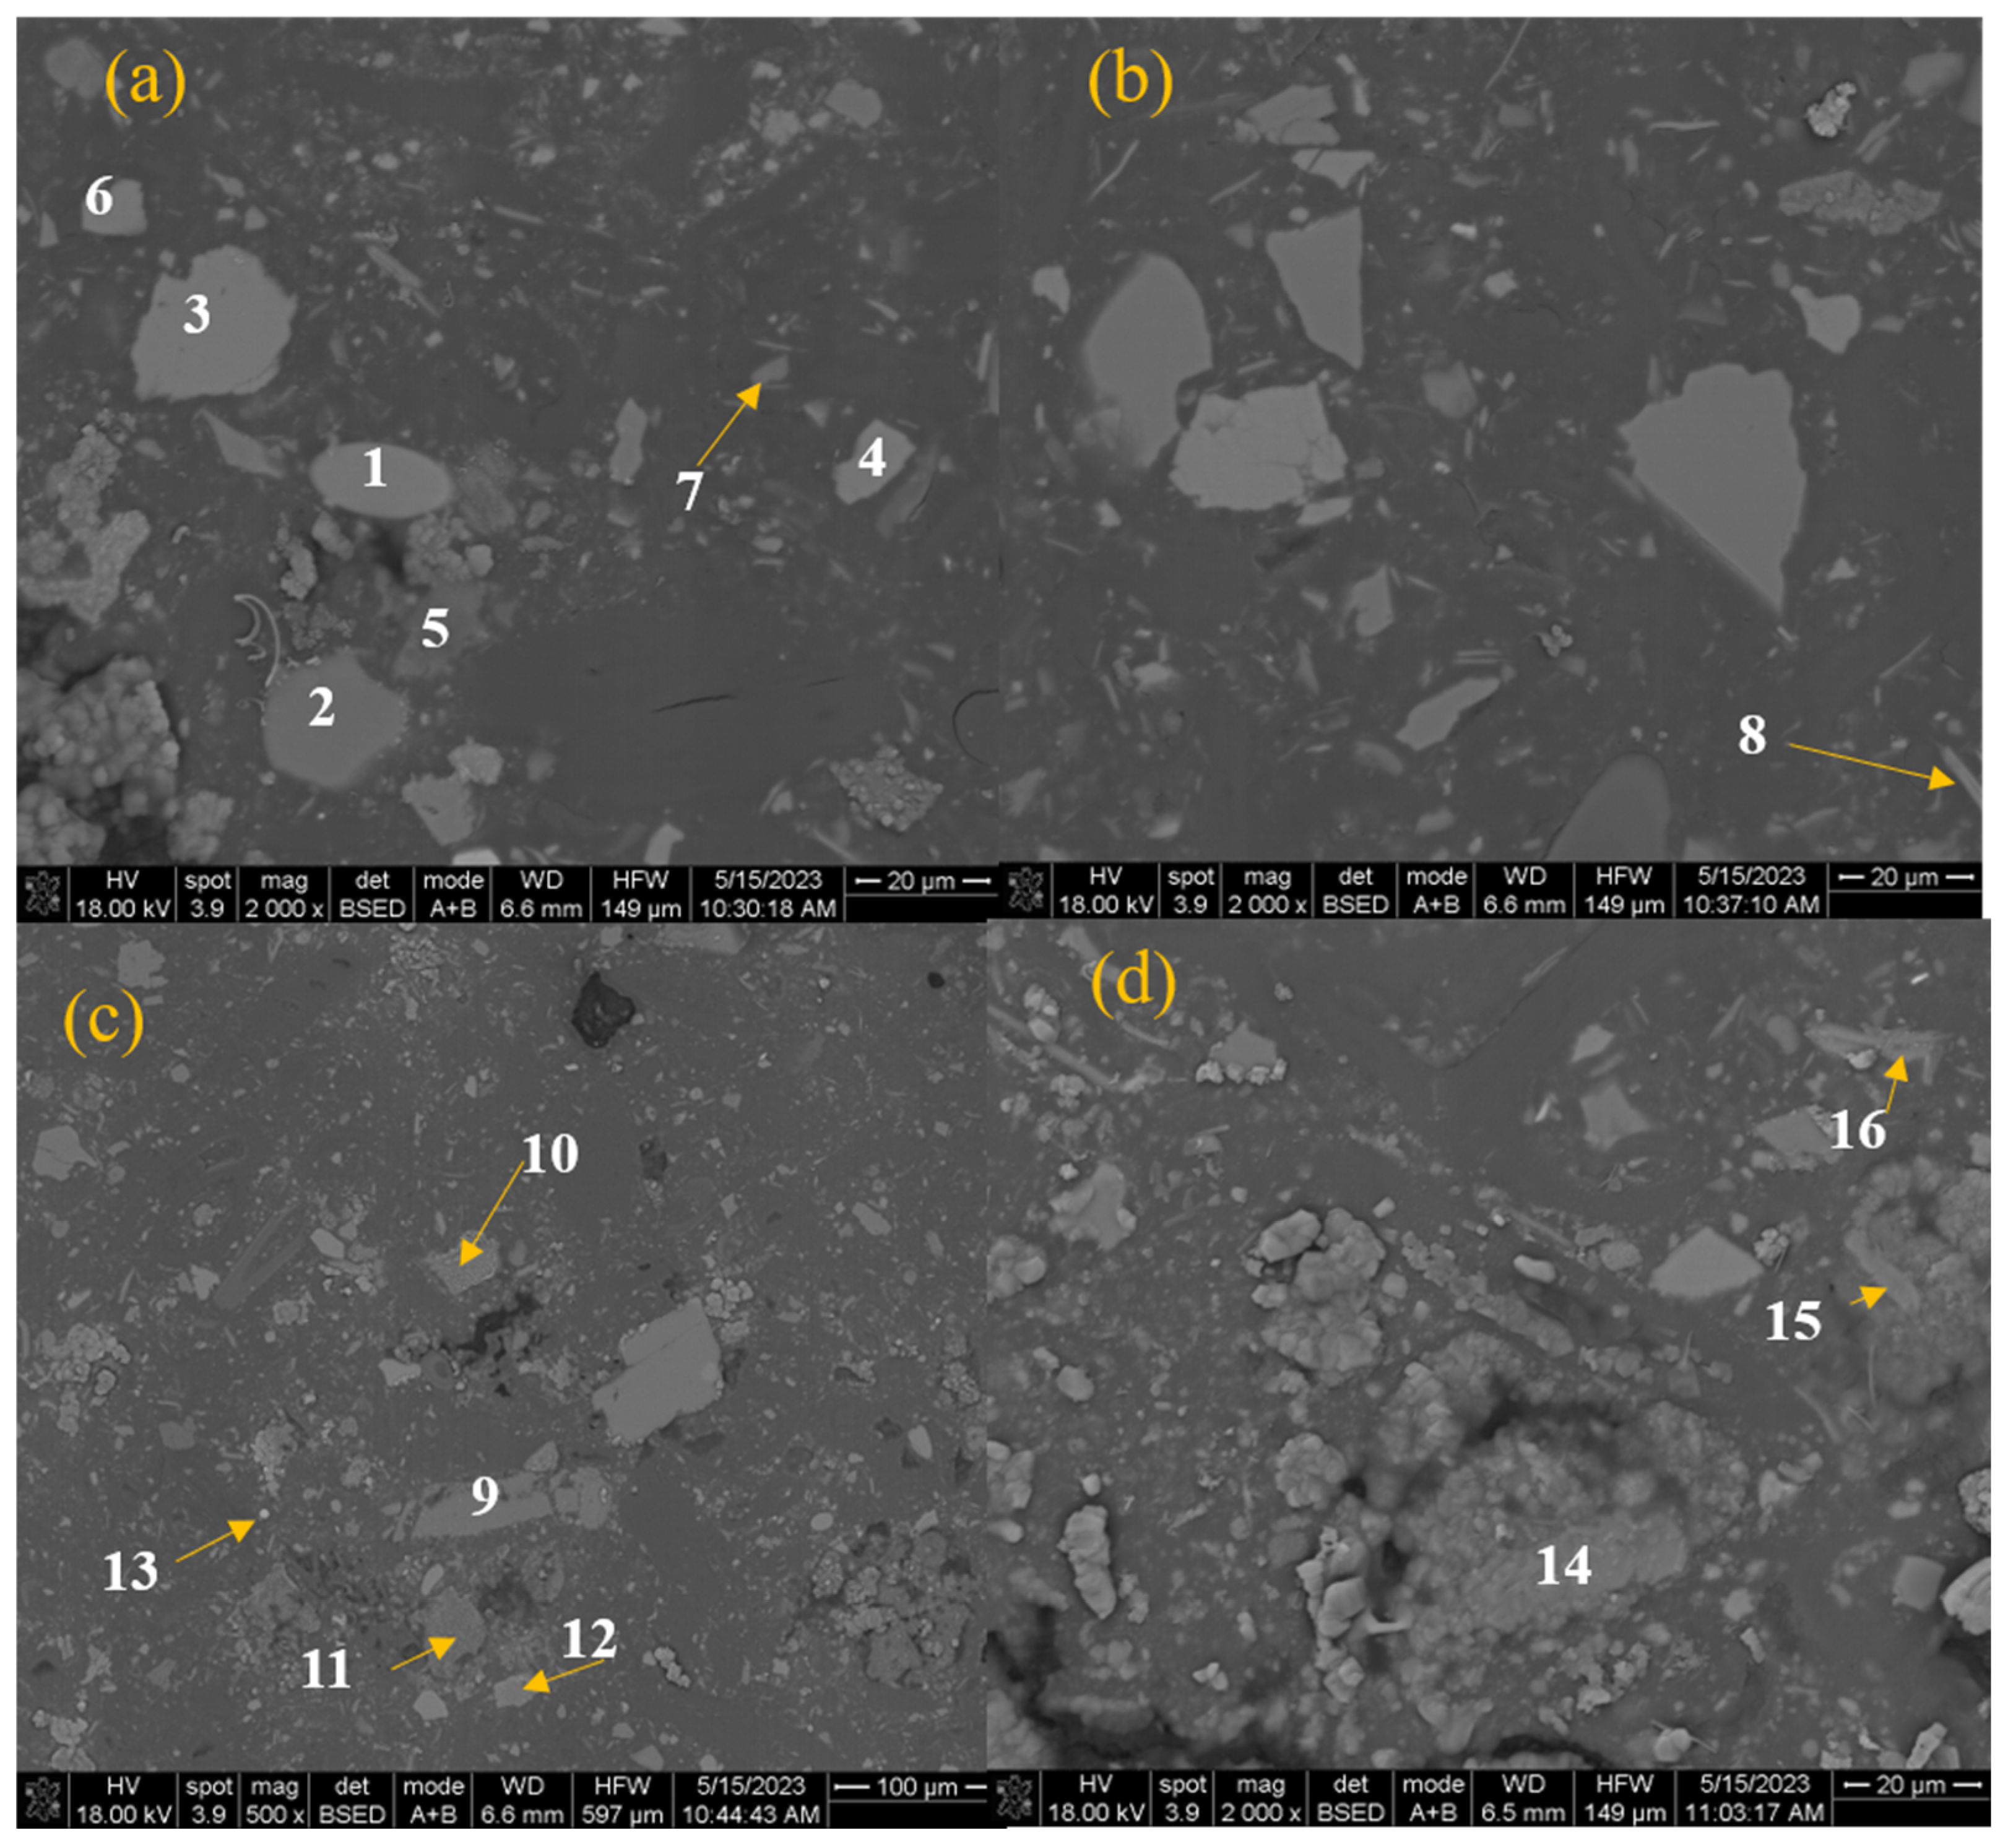
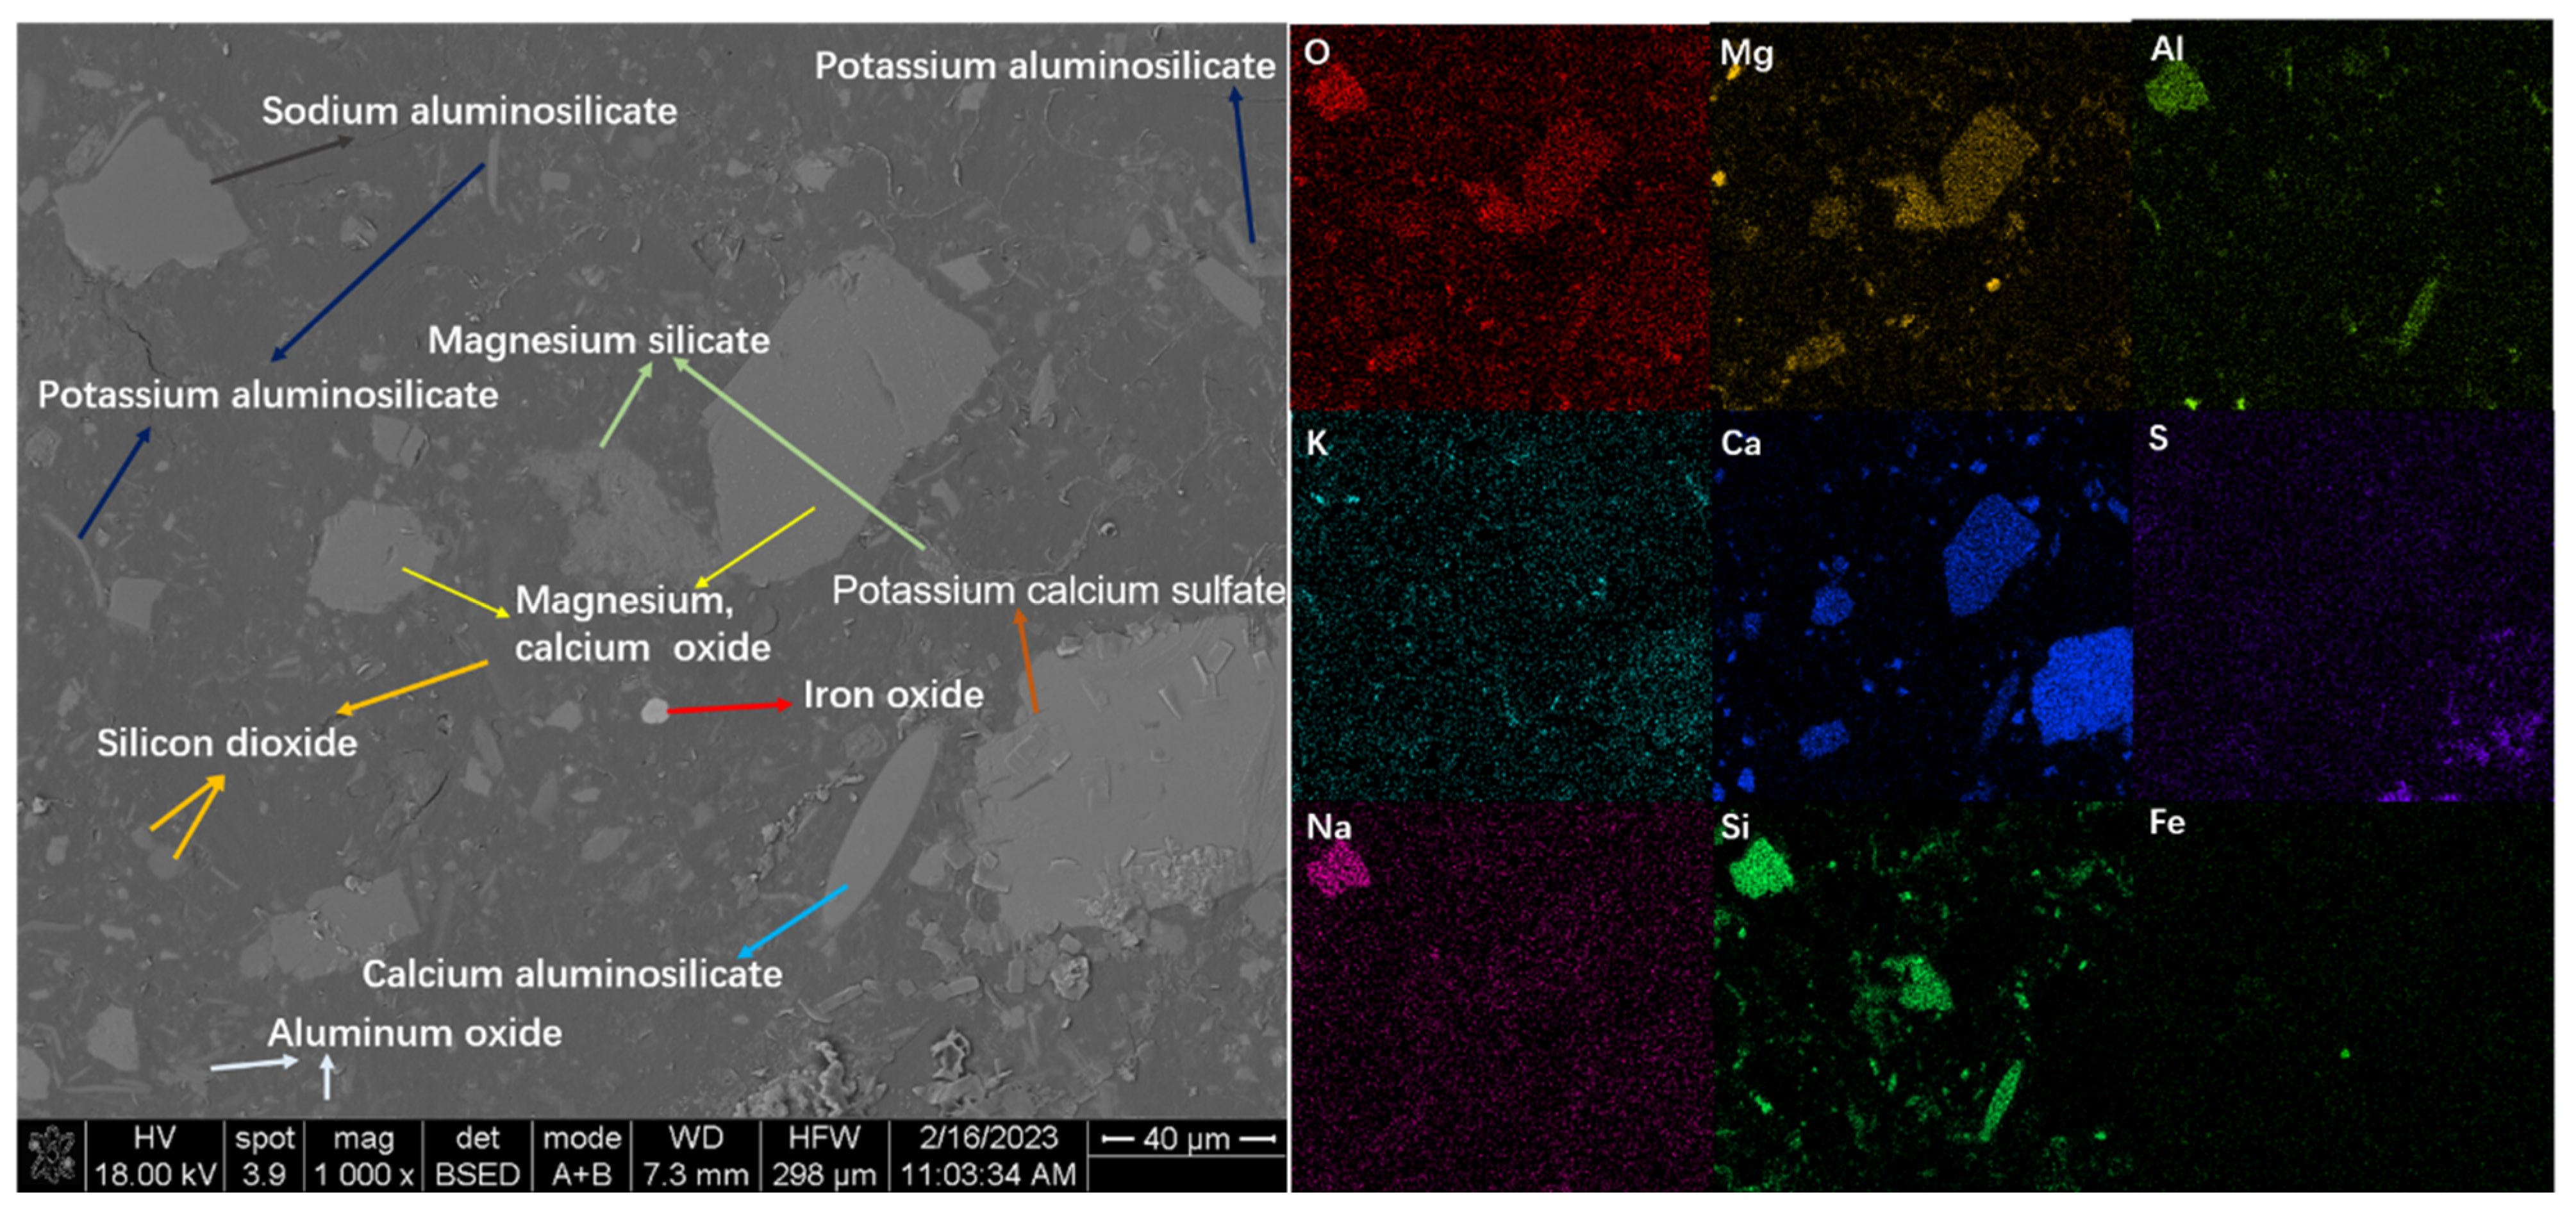
The BSE–EDS analysis for the dust roasted with CaO as the additive are shown in Figure 10 and Table 4. Although the maximum recovery of gallium occurred at a CaO dosage of 0.8, as displayed in Figure 7, the surplus CaO additive was detected in the roasted samples (points 3, 4, and 6 in Figure 10). Calcium aluminosilicate (point 1), potassium aluminosilicate (points 8, 16), calcium silicate (point 12), and silicon dioxide (points 2, 7, and 9) were generated after roasting activation, which is consistent with the XRD analytical results in Figure 8b. The metallic iron and ferrous iron were oxidized as ferric oxide (point 13). Points 5 and 11 in Figure 10a,c had high contents of silicon and sulfur, suggesting that the potassium sulfates were not completely decomposed and that some of them transformed into aluminosilicates.

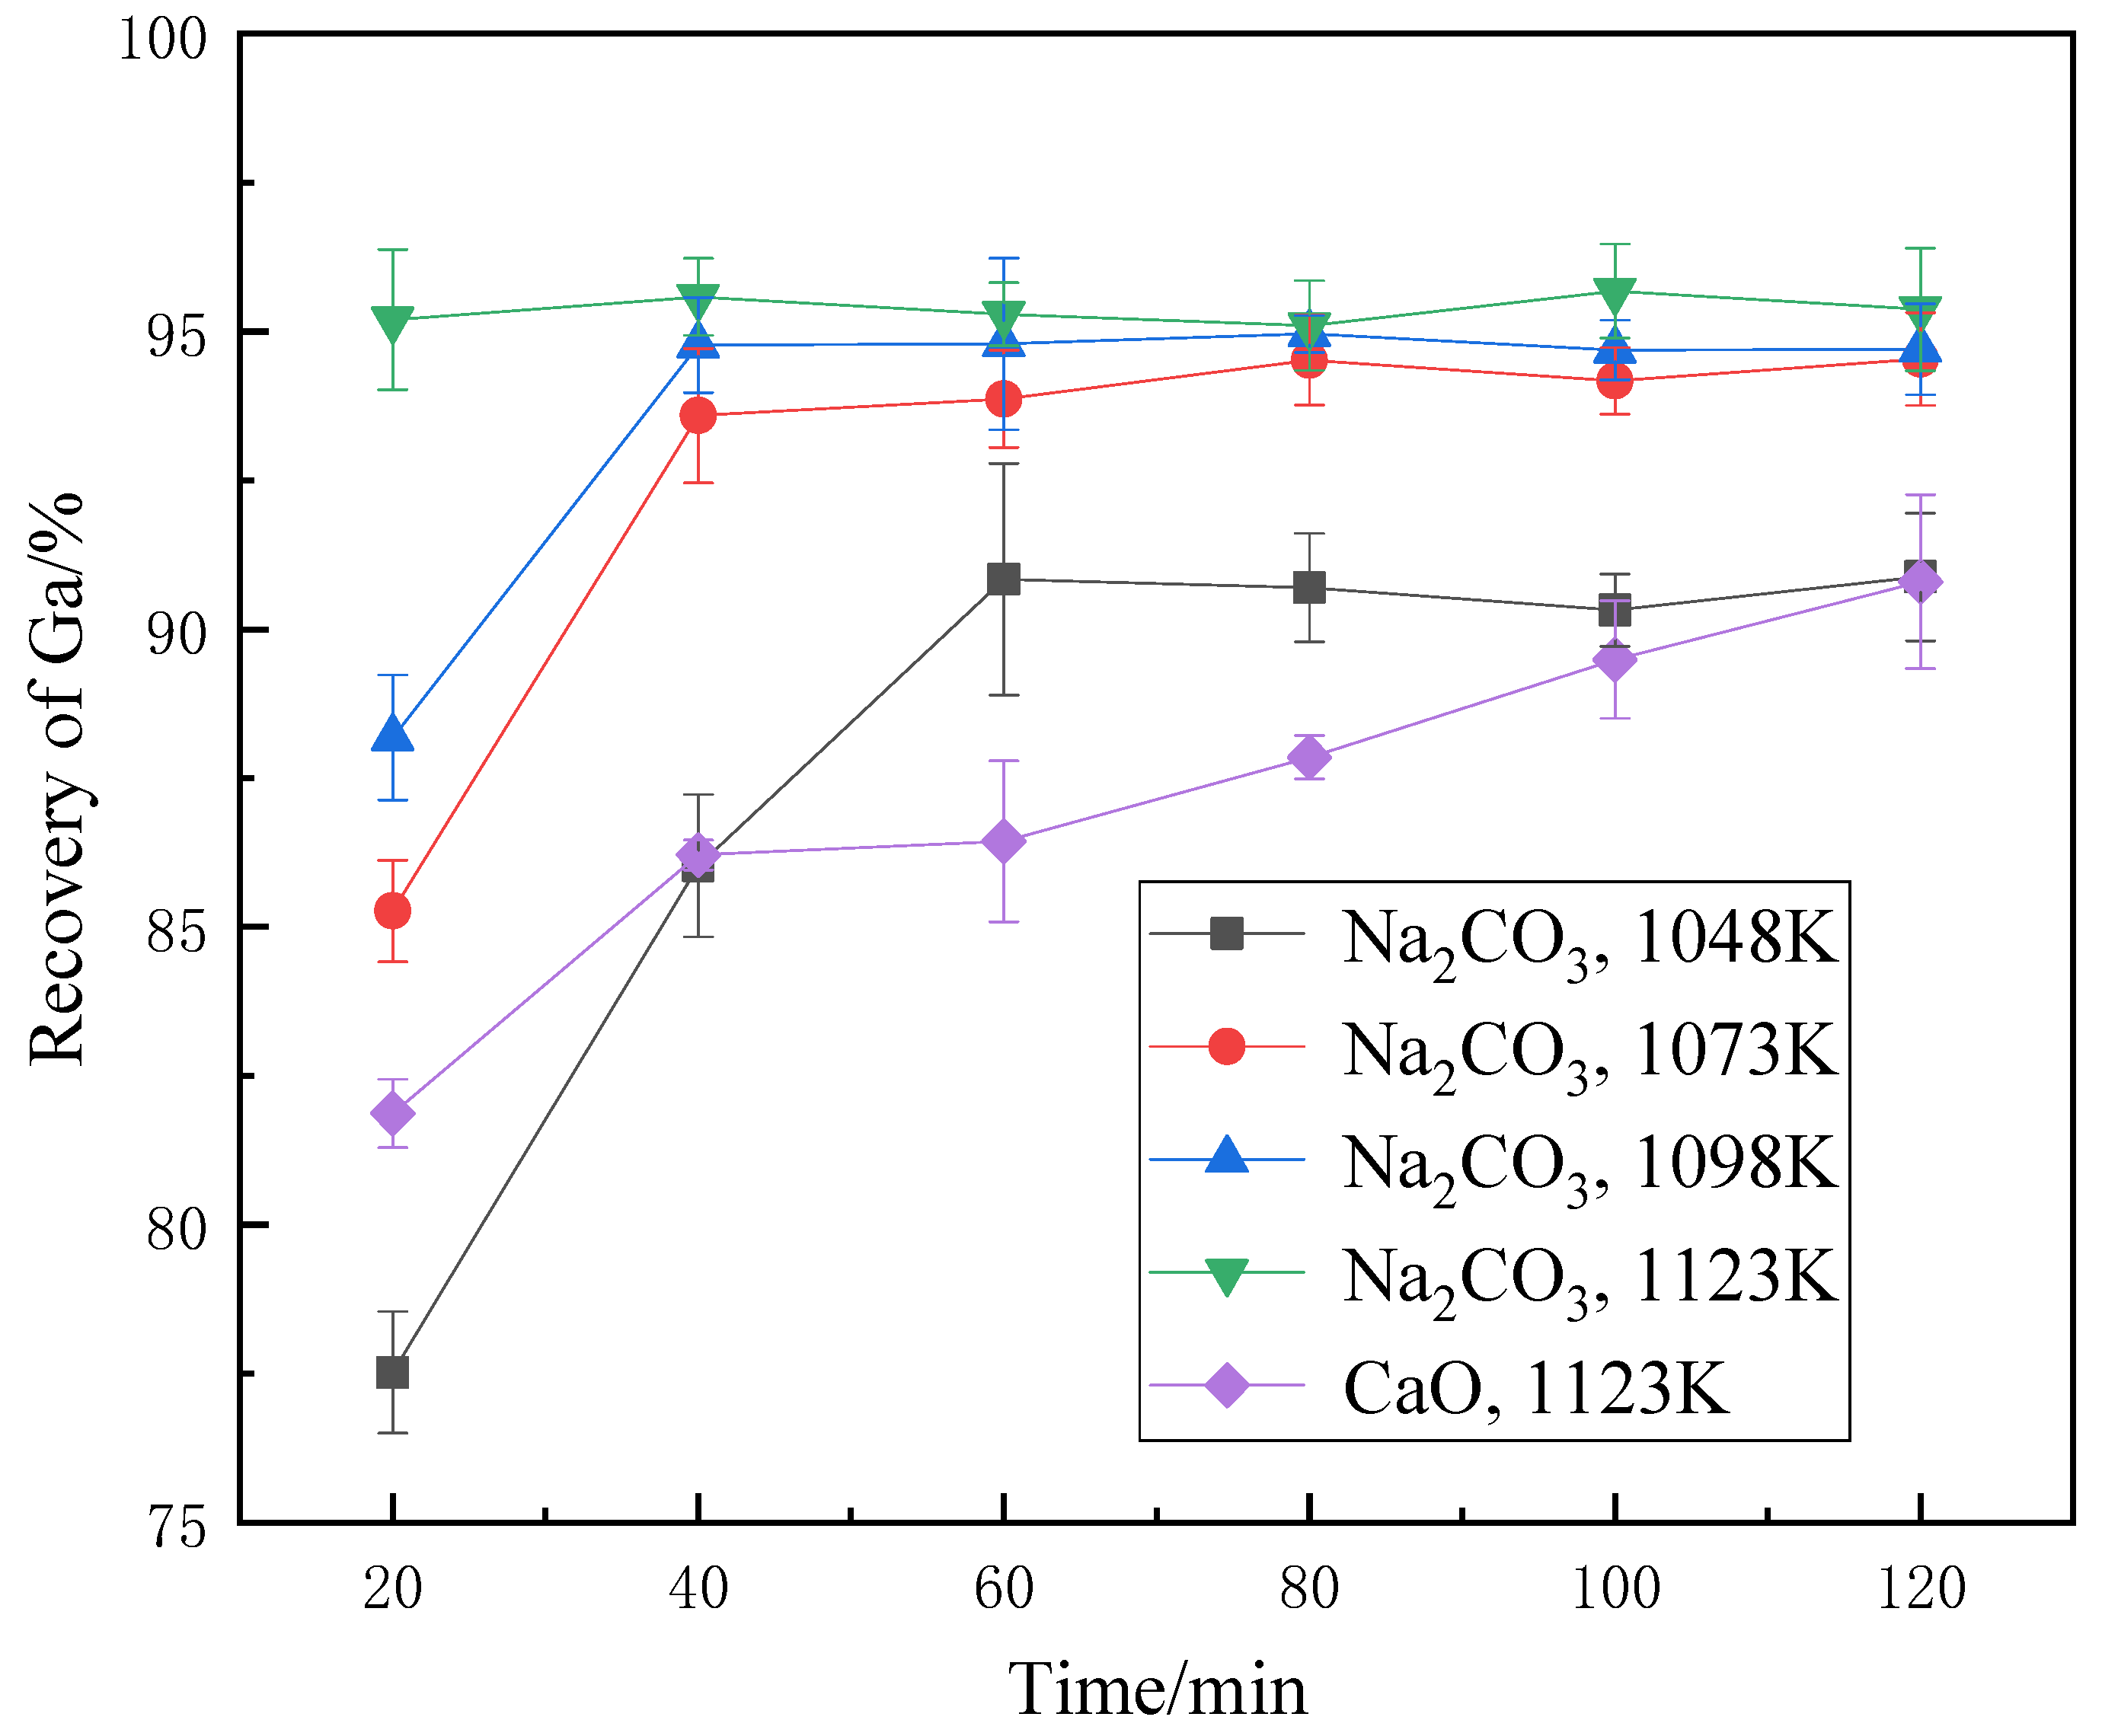
3.1.3. Roasting Time

Figure 11 shows that when the additive was sodium carbonate, there was no significant change in gallium recovery within the time range from 40 min to 120 min at temperatures over 1098 K; the recoveries were higher than 93%. In particular, at the higher temperature of 1123 K, the activation reactions reached equilibrium within 20 min. For the CaO additive, the gallium extraction percentage increased with the extended time and a recovery of 90.8% was reached after 120 min. The continuously increasing trend in recovery demonstrates that calcium oxide reacted more slowly with the dust than sodium carbonate did. This further proves that the remaining unreacted calcium oxide existed in the dust after roasting for 120 min with the additive mass ratio of 0.5. Overall, in comparison with calcium oxide roasting, a higher recovery of gallium was obtained with sodium carbonate roasting at a lower temperature, a lower dosage, and within a shorter roasting time. Hence, sodium carbonate performed better than calcium oxide in the activation of raw brown corundum dust.
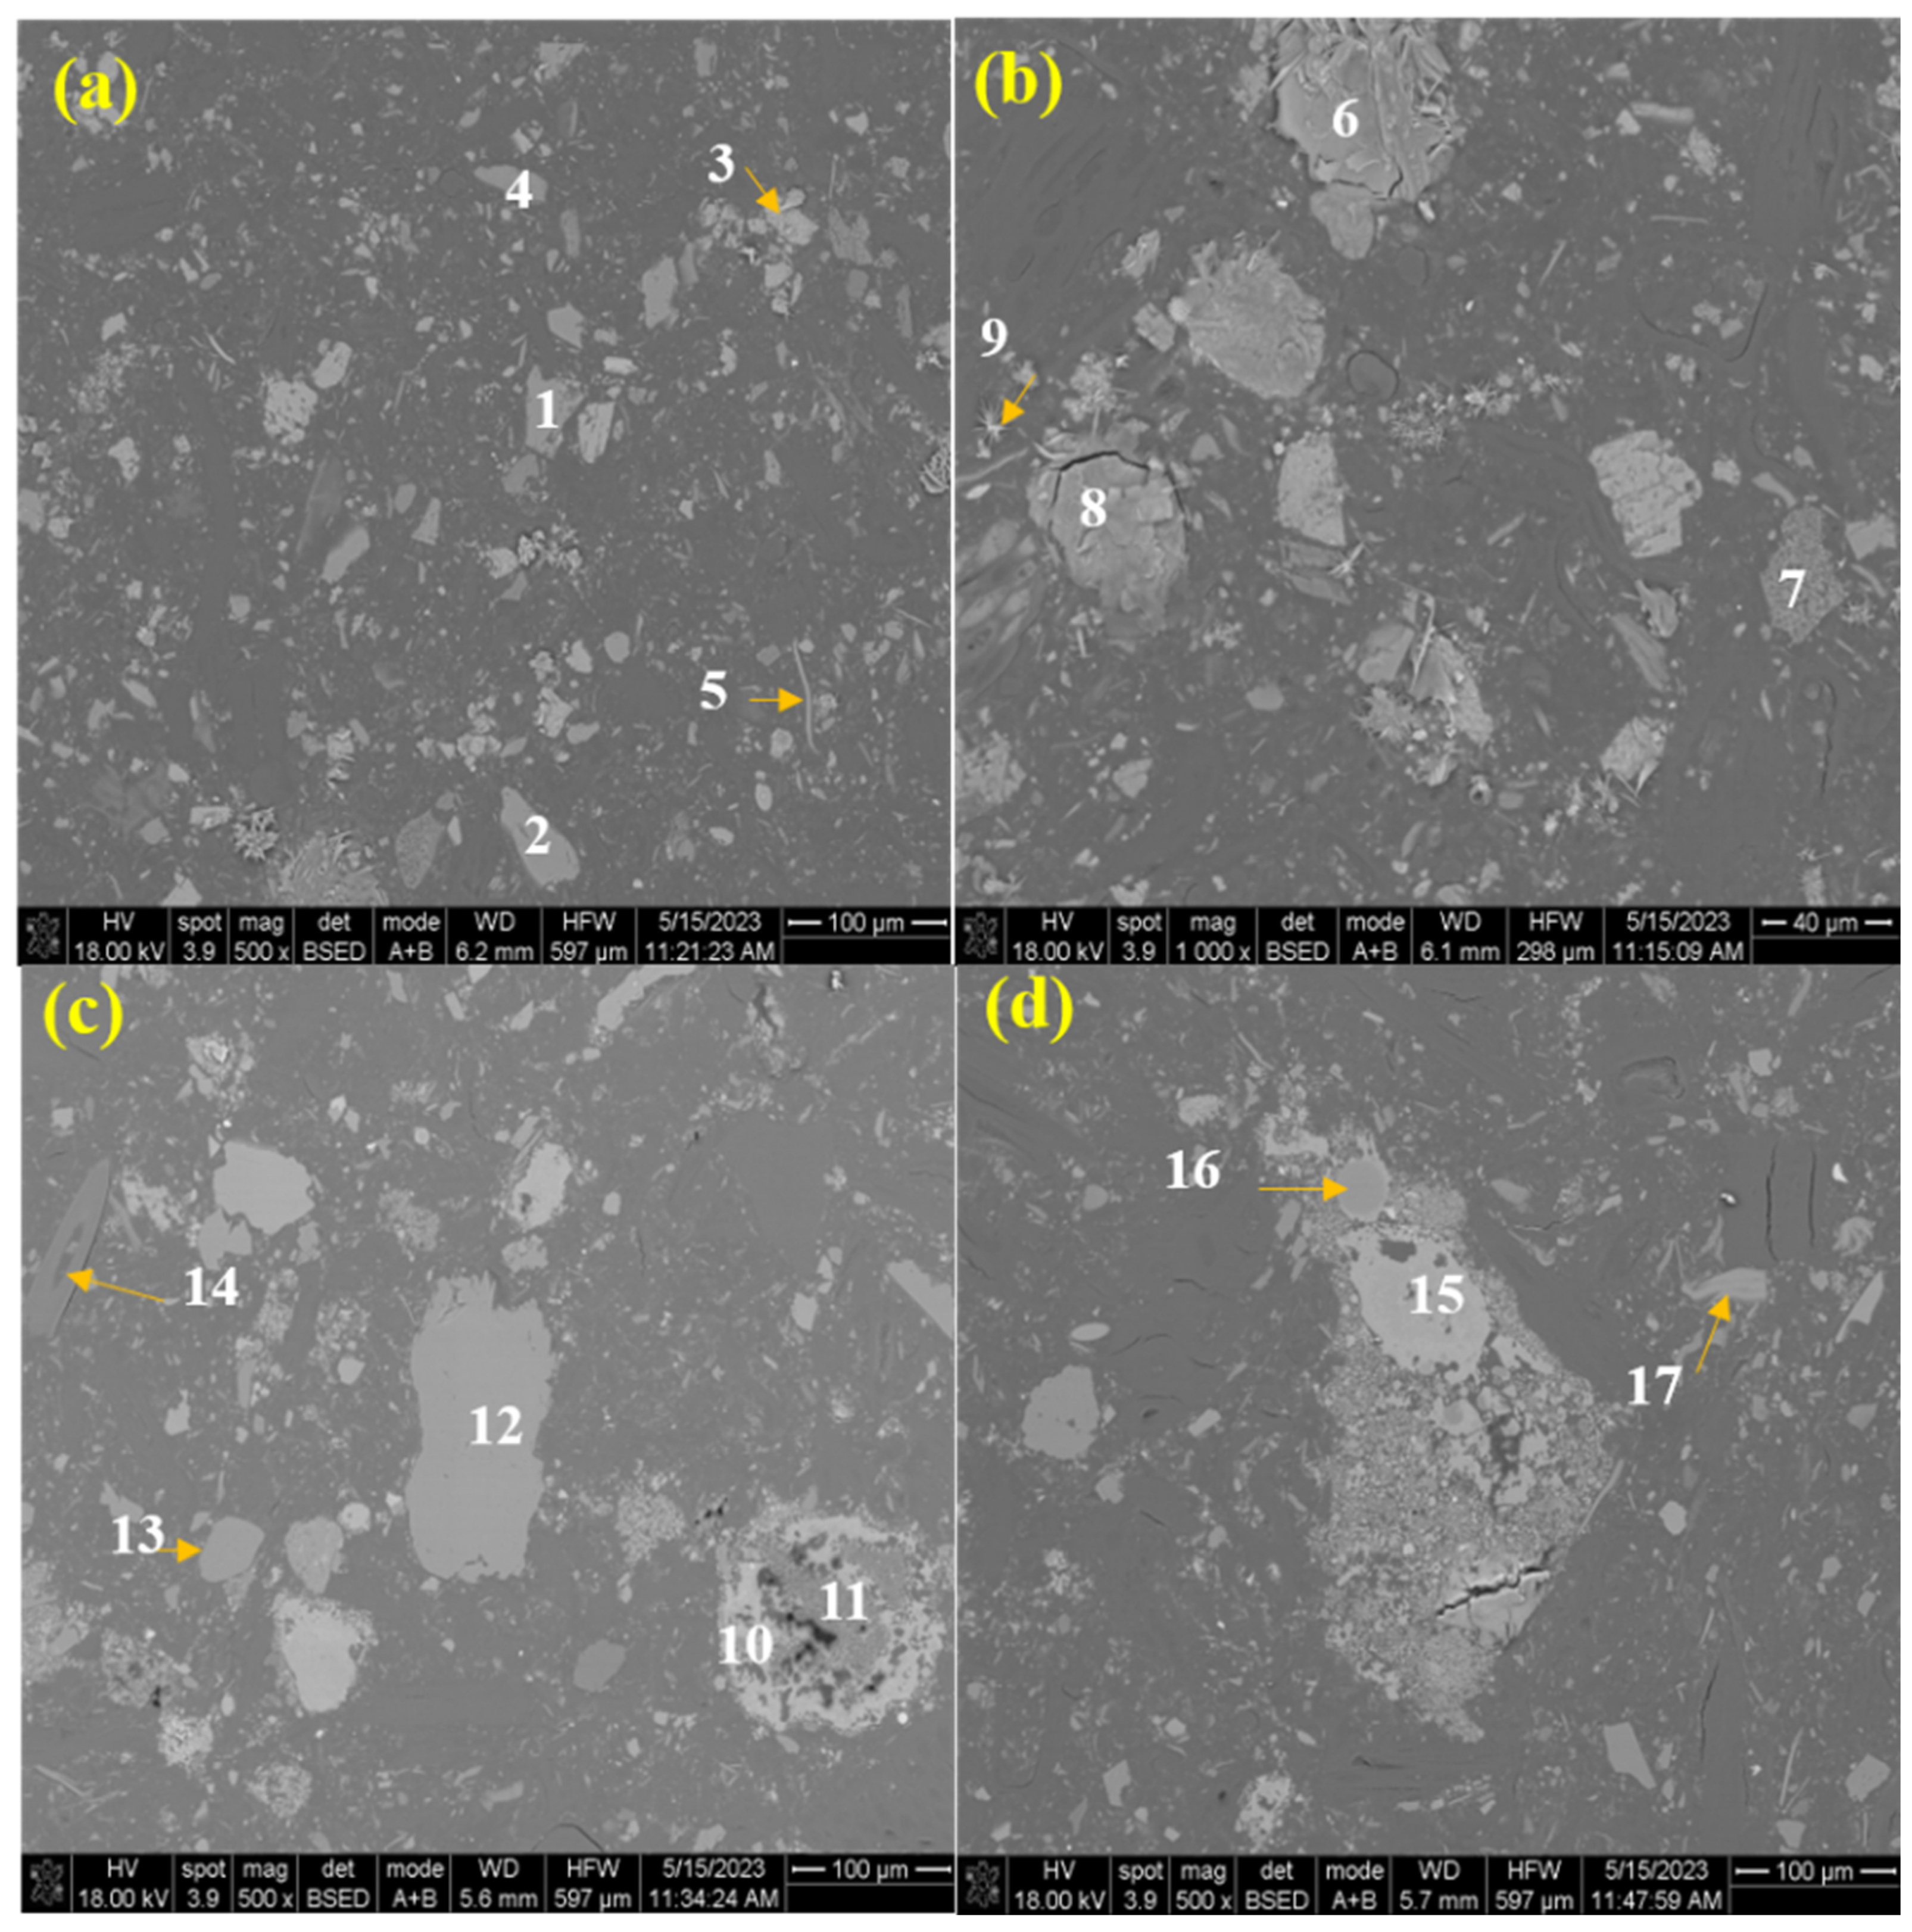
Figure 12 presents the BSE images of the brown corundum dust roasted at 1123 K and 1073 K. The EDS analysis results for different points marked in Figure 12 are shown in Table 5. The unreacted sodium carbonate additive (point 9), with a feathery shape, still appeared in Figure 12b after roasting for 120 min with the additive dosage of 0.5. Evidently, the original potassium sulfate, corundum, and amorphous silicate were converted into sodium silicate (points 6 and 8), sodium aluminosilicate (point 3), and potassium aluminosilicate (point 5) after reacting with the sodium carbonate. The magnesium oxide and calcium oxide (points 1 and 7) were relatively stable and only a certain amount of them was transformed into silicates (point 4), although free silicon oxide (point 2) was present at the same time. Furthermore, other elements, such as iron, titanium, manganese, and phosphorus, mainly occurred in aluminosilicates. Compared with the sample roasted at 1123 K, the sample roasted at 1073 K for 40 min was also effectively activated. Many of the potassium aluminosilicates (points 10, 11, 15, and 17) were included in Figure 12c,d, and some of the magnesium oxide was converted into the magnesium silicate (point 13). However, the corundum was not completely reacted, and the phase with high aluminum and oxygen content was discovered in the roasted dust (Figure 12d, point 16). In general, after roasting at 1073 K for 40 min, the reactions between the additive and the dust proceeded to a high degree, which explains why the recovery of gallium was as high as 93.11%.

3.2. Effect of Acid Leaching

3.2.1. Leaching Parameters

After roasting activation with sodium carbonate, the phase composition of the dust was restructured. The amorphous silicate and corundum were transformed into sodium silicate and aluminosilicates. The potassium sulfate was decomposed and potassium participated in the formation of potassium aluminosilicate. The gallium-containing components encapsulated in these original phases could then be extracted by leaching. In our previous study, different leaching methods, including acid leaching, alkaline leaching, and water leaching, were compared; the results showed that acid leaching performed with the highest efficiency in gallium extraction, whereas the dissolution percentage of silicon was kept as low as 0.31% [27].
Leaching experiments were carried out upon the brown corundum dust roasted at 1073 K for 40 min with a mass ratio of additive to dust of 0.5 to investigate the influence of the acid leaching parameters on the extraction efficiency of gallium.
As shown in Figure 13, the leaching time, temperature, and concentration of sulfuric acid all had a great effect on the recovery of gallium. When the leaching time was extended from 30 to 90 min, the recovery increased sharply by around 14%, and at least 90 min leaching were required to obtain a recovery higher than 93%. As for the leaching temperature, clearly, as displayed in Figure 13b, a higher leaching temperature was beneficial for extracting gallium from the roasted dust and the recovery increased from 68.78% to 93.11% as the temperature increased from 298 K to 373 K. Although the phase composition of the dust was changed after roasting, it still required a relatively high concentration of sulfuric acid to obtain satisfactory recovery of gallium. Due to the high content of silicon in the sample, only about 30% of Ga was extracted when 1 mol/L H2SO4 was used for leaching. A significant growth trend in the recovery appeared as the acid concentration increased, until the concentration reached 4.6 mol/L. Meanwhile, a suitable stirring speed had to be maintained to make the leaching agent and roasted dust particles come into contact thoroughly and to overcome the resistance of external diffusion. Figure 13d shows that a recovery of 93.11% was achieved at a stirring rate of 800 rpm using the laboratory leaching apparatus.

3.2.2. Characterization of Samples before and after Leaching

In order to further determine the mechanism of sulfuric acid leaching, the samples were characterized by XRD and SEM–EDS before and after leaching.
As seen in Figure 14, after acid leaching, sulfate (K2Ca2(SO4)3) was generated. Aluminosilicates, including sodium aluminosilicate and potassium aluminosilicate, did not react with acid completely, and some of them remained in the residue. Amorphous silicon-containing components were produced during the acid leaching process, which was proven by the wide and flat peak appearing within 2 θ ranging from 20° to 30°.
Figure 15 presents the EDS mapping analysis of the leaching residue. The potassium concentration was low and appeared in a dispersed manner. Previously, we found that around 70% of potassium was dissolved into the acid solution [27]. The remaining potassium mainly co-existed with elements of silicon and aluminum. Based on the analysis of the XRD pattern of the leaching residue, it was deduced that the remaining potassium was present in the form of potassium aluminosilicate. Additionally, some unreacted sodium aluminosilicate and calcium aluminosilicate were left in the leaching residue. This indicates that the aluminosilicates were less likely than sodium silicate to react with sulfuric acid. Silicon dioxide was produced by the reactions of sodium silicate and the aluminosilicate with sulfuric acid and remained in the residue due to its low acid solubility. Additionally, potassium calcium sulfate and magnesium silicate were found in the residue. These results are in good agreement with the XRD analysis.
The morphology of the dust before and after leaching is displayed in Figure 16. As shown in Figure 16a, the roasted dust particles were extremely uneven and clearly agglomerated. Based on the chemical composition analysis, it is known that these particles were mainly composed of silicates and aluminosilicates with different sodium and potassium contents. Other elements, such as Mg and Fe, also transferred into the aluminosilicates. After acid leaching, the particles were still agglomerated. Numerous sheet-like sulfates (points 8, 10, and 11) and irregular-shaped silicon dioxides (point 9) were distributed on the surface of the agglomerated particles.

3.2.3. Leaching Kinetics

The extraction of gallium from the roasted dust by means of sulfate acid leaching was a liquid–solid multiphase reaction process. During the leaching process, the following reactions occurred.
Na2SiO3 + 2H+ = 2Na+ + H2SiO3
NaAlSiO4 + 4H+ = Na+ + Al3+ + H2SiO3 + H2O
KAlSiO4 + 4H+ = K+ + Al3+ + H2SiO3 + H2O
After the silicates and aluminosilicates reacted with sulfuric acid, gallium was then released and transferred into the solution. Our previous study [27] found that the leaching rates of K and Al were 71.33% and 48.42%, respectively, when 98.38% of Ga was recovered with the acid leaching, suggesting that only part of the potassium aluminosilicate was dissolved by sulfuric acid leaching and, at the same time, some aluminum present as the corundum did not participate in the leaching reaction.
The common liquid–solid reaction models include the unreacted nuclear shrinkage model and the uniform model. The results of leaching experiments showed that this leaching process did not conform to the characteristics of the uniform model, and therefore the unreacted nuclear shrinkage model was chosen for studying the leaching process. This model has been widely used in the field of hydrometallurgy to simulate the leaching reaction process. Based on the relationships between the stirring speed and the extraction efficiency of gallium, as shown in Figure 13d, it was deduced that the leaching rate is not controlled by external diffusion when the agitation rate is kept over 480 rpm. Three kinetic equations were selected to determine the limiting step in this leaching process.
When the reaction rate is controlled by internal diffusion (Ginstling–Braunstein):
k1t = 1 − 2α/3 − (1 − α)2/3
When the reaction rate is controlled by a chemical reaction (interface):
k2t = 1 − (1 − α)1/3
When the leaching process is controlled by the transfer across the contacting interface, the reaction rate is related to the contacting area of the sphere [28]. The kinetics of the leaching process conform to:
k3t = 1/(1 − α)1/3 − 1
where α is the recovery of gallium (%); k1, k2, and k3 are the rate constants; and t represents the leaching time (min).
In order to determine the controlling steps of the sulfuric acid leaching process and the corresponding kinetic parameters, the variation in gallium recovery with leaching time at 298 K, 313 K, 333 K, and 353 K were obtained, as illustrated in Figure 17. The data were fitted with the three equations above, and the linear correlation coefficient (R2) for fitting the lines is given in Table 6.
As listed in Table 6, the linear correlation coefficients for lines fitted with k3t = 1/(1 − α)1/3 − 1 were closest to 1.0, indicating that this kinetic equation describes the leaching process best. The rate constants (k3) at different temperatures were obtained based on the slopes of the straight lines in Figure 18. lnk against 1/T was plotted as displayed in Figure 19. According to the Arrhenius equation (lnk = −Ea/(RT + lnA)), the apparent activation energy (Ea) and the pre-exponential factor (A) were calculated as 16.81 kJ/mol and 7.34 min−1 based on the slope and the intercept of the straight line.

4. Conclusions

In this paper, a process route involving roasting activation and sulfuric acid leaching was first proposed to treat brown corundum dust and then successfully extract gallium from this kind of dust.
The main phases contained in brown corundum dust are potassium sulfate, corundum, and amorphous silicate. Gallium is dispersed in the potassium-rich phase, which is surrounded by corundum and amorphous silicate. The distribution characteristics of gallium explain why direct water leaching and conventional acid leaching cannot achieve satisfactory gallium recovery [27]. Other enhanced acid leaching methods and concentrated alkali leaching [23,24,25] may destroy the corundum and amorphous silicate phases and recover gallium from the dust. The roasting activation proposed in this study effectively changed the phase composition and distribution. After roasting, the corundum and amorphous silicate were converted into acid-soluble phases.
Both sodium carbonate roasting and calcium oxide roasting can activate brown corundum dust and thus make gallium extraction feasible by sulfuric acid leaching. In comparison with calcium oxide roasting, sodium carbonate roasting performs better in activation efficiency through transforming the corundum and amorphous silicate into sodium silicate and aluminosilicate salts. Further, it requires a lower roasting temperature and a lower dosage. After the brown corundum dust was roasted at 1073 K for 40 min with a sodium carbonate dosage of 0.5, over 93 % of gallium was recovered by 4.6 mol/L H2SO4 leaching at 353 K for 90 min.
During the leaching process, aluminosilicates react with sulfuric acid and produce silicic acid, which remains in the leaching residue. Hence, compared with direct concentrated alkali leaching, the silicon dissolution of this proposed process route is as low as 0.31% [24,27]. This is another advantage of this process. Since silicon dioxide accounts for 40.82 wt.% of the raw dust, if a high percentage of silicon enters the gallium-containing solution, it will have a major adverse effect on the subsequent purification and sedimentation separation of the solution.
Based on the characterization results of the leaching residue, it was found that almost all of the sodium silicate reacted with sulfuric acid, whereas aluminosilicates were less likely to react with sulfuric acid, and some of them remained in the leaching residues. Silicon dioxide and sulfate were distributed on the surface of the leaching tailing particles but did not form a dense product layer. The leaching kinetics agreed well with the equation of kt = 1/(1 − α)1/3 − 1 with an apparent activation energy of 16.81 kJ/mol. This suggests that the leaching process is controlled by transfer across the contacting interface of the reactive particles and is closely related to the specific surface area of the diffusion interface. The measures to overcome this diffusion resistance and increase the leaching kinetic rate merit further investigation.

Author Contributions

Conceptualization, J.Z.; data curation, Y.C. and X.H.; formal analysis, J.Z. and Y.C.; funding acquisition, J.Z.; investigation, Y.C. and C.G.; project administration, J.Z.; software, X.H.; supervision, J.Z.; writing—original draft, J.Z. and Y.C.; writing—review and editing, A.J. All authors have read and agreed to the published version of the manuscript.

Funding

This research was funded by the Hubei Provincial Key Technologies R & D Program (2022BCA058), the China Scholarship Council (202008420104), and the National Natural Science Foundation of China (51804230).

Data Availability Statement

They will be available on request.

Acknowledgments

We would like to thank Guohong Zhang and Wei Yuan at the Analytical & Testing Center of Wuhan University of Science and Technology for their help with EPMA analysis.

Conflicts of Interest

The authors declare no conflict of interest.

References

  1. Tang, S.Y.; Tabor, C.; Kalantar-Zadeh, K.; Dickey, M.D. Gallium liquid metal: The devil’s elixir. Annu. Rev. Mater. Res. 2021, 51, 381–408. [Google Scholar] [CrossRef]
  2. Harvey, A.; Backes, C.; Gholamvand, Z.; Hanlon, D.; Mcateer, D.; Nerl, H.; Mcguire, E.; Seral-Ascaso, A.; Ramasse, Q.; Mcevoy, N.; et al. Preparation of gallium sulfide nanosheets by liquid exfoliation and their application as hydrogen evolution catalysts. Chem. Mater. 2015, 27, 3483–3493. [Google Scholar] [CrossRef]
  3. Chelvanathan, P.; Hossain, M.I.; Amin, N. Performance analysis of copper–indium–gallium–diselenide (CIGS) solar cells with various buffer layers by SCAPS. Curr. Appl. Phys. 2010, 10, S387–S391. [Google Scholar] [CrossRef]
  4. Hedayati, M.; Olyaee, S.; Ghorashi, S.M.B. The effect of adsorbent layer thickness and gallium concentration on the efficiency of a dual-junction copper indium gallium diselenide solar cell. J. Electron. Mater. 2020, 49, 1454–1461. [Google Scholar] [CrossRef]
  5. Nishinaka, K.; Terakado, O.; Tani, H.; Hirasawa, M. Pyrometallurgical recovery of gallium from GaN semiconductor through chlorination process utilizing ammonium chloride. Mater. Trans. 2017, 58, 688–691. [Google Scholar] [CrossRef] [Green Version]
  6. Sigel, A.; Sigel, H.; Freisinger, E.; Sigel, R.K.O. (Eds.) Metallo-Drugs: Development and Action of Anticancer Agents; De Gruyter: Berlin, Germany, 2018; ISBN 9783110470734. [Google Scholar]
  7. Lee, B.F.; Chiu, N.T.; Chang, J.K.; Liu, G.C.; Yu, H.S. Technetium-99m(V)-DMSA and gallium-67 in the assessment of bone and joint infection. J. Nucl. Med. 1998, 39, 2128–2131. [Google Scholar]
  8. Zhao, C.; Qin, S.; Yang, Y.; Li, Y.; Lin, M. Concentration of gallium in the permo-carboniferous coals of China. Energy Explor. Exploit. 2009, 27, 333–343. [Google Scholar] [CrossRef] [Green Version]
  9. Naumov, A.V. Status and prospects of world gallium production and the gallium market. Metallurgist 2013, 57, 367–371. [Google Scholar] [CrossRef]
  10. Redlinger, M.; Eggert, R.; Woodhouse, M. Evaluating the availability of gallium, indium, and tellurium from recycled photovoltaic modules. Sol. Energy Mater. Sol. Cells 2015, 138, 58–71. [Google Scholar] [CrossRef] [Green Version]
  11. Xu, K.; Deng, T.; Liu, J.; Peng, W. Study on the recovery of gallium from phosphorus flue dust by leaching with spent sulfuric acid solution and precipitation. Hydrometallurgy 2007, 86, 172–177. [Google Scholar] [CrossRef]
  12. Lu, F.; Xiao, T.; Lin, J.; Li, A.; Long, Q.; Huang, F.; Xiao, L.; Li, X.; Wang, J.; Xiao, Q.; et al. Recovery of gallium from Bayer red mud through acidic-leaching-ion-exchange process under normal atmospheric pressure. Hydrometallurgy 2018, 175, 124–132. [Google Scholar] [CrossRef]
  13. Xue, B.; Wei, B.; Ruan, L.; Li, F.; Jiang, Y.; Tian, W.; Su, B.; Zhou, L. The influencing factor study on the extraction of gallium from red mud. Hydrometallurgy 2019, 186, 91–97. [Google Scholar] [CrossRef]
  14. Huang, J.; Wang, Y.; Zhou, G.; Gu, Y. Exploring a promising technology for the extraction of gallium from coal fly ash. Int. J. Coal Prep. Util. 2022, 42, 1712–1723. [Google Scholar] [CrossRef]
  15. Huang, J.; Wang, Y.; Zhou, G.; Gu, Y. Investigation on the effect of roasting and leaching parameters on recovery of gallium from solid waste coal fly ash. Metals 2019, 9, 1251. [Google Scholar] [CrossRef] [Green Version]
  16. Zhou, J.; Zhu, N.; Liu, H.; Wu, P.; Zhang, X.; Zhong, Z. Recovery of gallium from waste light emitting diodes by oxalic acidic leaching. Resour. Conserv. Recycl. 2019, 146, 366–372. [Google Scholar] [CrossRef]
  17. Chen, W.-S.; Hsu, L.-L.; Wang, L.-P. Recycling the GaN waste from LED industry by pressurized leaching method. Metals 2018, 8, 861. [Google Scholar] [CrossRef] [Green Version]
  18. Ji, W.; Xie, K.; Huang, H.; Chen, H. Recovery of gallium from yellow phosphorus flue dust by vacuum carbothermal reduction. J. Clean. Prod. 2021, 284, 124706. [Google Scholar] [CrossRef]
  19. Ji, W.; Xie, K.; Yan, S. Separation and recovery of heavy metals zinc and lead from phosphorus flue dust by vacuum metallurgy. J. Environ. Manag. 2021, 294, 113001. [Google Scholar] [CrossRef]
  20. Liu, F.; Liu, Z.; Li, Y.; Wilson, B.P.; Lundström, M. Recovery and separation of gallium (III) and germanium (IV) from zinc refinery residues: Part I: Leaching and iron (III) removal. Hydrometallurgy 2017, 169, 564–570. [Google Scholar] [CrossRef] [Green Version]
  21. Rao, S.; Liu, Z.; Wang, D.; Cao, H.; Zhu, W.; Zhang, K.; Tao, J. Hydrometallurgical process for recovery of Zn, Pb, Ga and Ge from Zn refinery residues. Trans. Nonferrous Met. Soc. China 2021, 31, 555–564. [Google Scholar] [CrossRef]
  22. Zhai, X.J.; Lv, Z.J. (Eds.) Gallium Metallurgy; Metallurgical Industry Press: Beijing, China, 2010; ISBN 978-7-5024-5200-1. [Google Scholar]
  23. Ding, W.; Bao, S.; Zhang, Y.; Xiao, J. Mechanism and kinetics study on ultrasound assisted leaching of gallium and zinc from corundum flue dust. Miner. Eng. 2022, 183, 107624. [Google Scholar] [CrossRef]
  24. Wen, K.; Jiang, F.; Zhou, X.; Sun, Z. Recovery of gallium from corundum flue dust by two-stage alkali leaching, carbonation, acid leaching and solvent extraction process. Metals 2018, 8, 545. [Google Scholar] [CrossRef] [Green Version]
  25. Wen, K.; Jiang, F.; Zhou, X.; Sun, Z. Leaching of gallium from corundum flue dust using mixed acid solution. Trans. Nonferrous Met. Soc. China 2018, 28, 1862–1868. [Google Scholar] [CrossRef]
  26. Lu, A.L.; Jia, Y.H. Research on comprehensive utilization of bauxite in China. Conserv. Util. Miner. Resour. 2010, 30, 49–51. (In Chinese) [Google Scholar] [CrossRef]
  27. Chang, Y.W.; Zhang, J.H.; Hui, X.J.; Liang, Y. Study on efficient extraction of gallium from brown corundum soot. Chin. J. Process. Eng. 2023, 23, 460–471. [Google Scholar] [CrossRef]
  28. Dickinson, C.F.; Heal, G.R. Solid-liquid diffusion-controlled rate equations. Thermochim. Acta 1999, 340–341, 89–103. [Google Scholar] [CrossRef]
Figure 1. X-ray diffraction pattern of brown corundum dust.
Minerals 13 00900 g001
Figure 2. Backscattered electron image (BSE) of brown corundum dust: (a) ×2000; (b) ×1000; (c) ×2000.
Minerals 13 00900 g002
Figure 3. Elemental distribution of brown corundum dust detected by EPMA.
Minerals 13 00900 g003
Figure 4. Instrument diagram for the roasting and leaching: (a) vertical tube furnace; (b) heat-collecting thermostatic water bath.
Minerals 13 00900 g004
Figure 5. Effect of roasting temperature (roasting time 2 h, additive mass/dust mass = 1.0, acid leaching time 3 h, leaching temperature 353 K, L/S (mL/g) = 10, stirring rate 800 rpm, C(H2SO4) = 25 vol.%).
Minerals 13 00900 g005
Figure 6. XRD patterns of samples roasted at different temperatures with (a) Na2CO3 and (b) CaO as additives.
Minerals 13 00900 g006
Figure 7. Effect of additive dosage (roasting time 2 h, roasting temperature 1123 K, acid leaching time 3 h, acid leaching temperature 353 K, L/S (mL/g) = 10, stirring rate 800 rpm, C(H2SO4) = 25 vol.%).
Minerals 13 00900 g007
Figure 8. XRD patterns of samples roasted with different dosages of (a) Na2CO3 and (b) CaO.
Minerals 13 00900 g008
Figure 9. BSE images for the dust roasted with different dosages of Na2CO3: (a) m = 1, ×1000; (b) m = 1, ×500; (c) m = 0.1, ×1000; (d) m = 0.1, ×800; (e) m = 0.1, ×800.
Minerals 13 00900 g009
Figure 10. BSE images for different areas (ad) of dust roasted with CaO dosage (mass ratio of CaO to dust) of 0.8.
Minerals 13 00900 g010
Figure 11. Variation in recovery of gallium in terms of roasting time (Na2CO3 dosage of 0.5, CaO dosage of 0.8, acid leaching time 3 h, acid leaching temperature 353 K, L/S (mL/g) = 10, stirring rate 800 rpm, C(H2SO4) = 25 vol.%).
Minerals 13 00900 g011
Figure 12. BSE images for the dust roasted with Na2CO3 dosage of 0.5: (a,b) roasted at 1123 K for 120 min; (c,d) roasted at 1073 K for 40 min.
Minerals 13 00900 g012
Figure 13. Effect of leaching parameters on the recovery of gallium: (a) leaching time (353 K, 800 rpm, C(H2SO4) = 4.6 mol/L, L/S (mL/g) = 10); (b) leaching temperature (90 min, 800 rpm, C(H2SO4) = 4.6 mol/L, L/S (mL/g) = 10 g/mL); (c) sulfuric acid concentration (90 min, 353 K, 800 rpm, L/S (mL/g) = 10); (d) stirring rate (90 min, 353 K, C(H2SO4) = 4.6 mol/L, L/S (mL/g) = 10).
Minerals 13 00900 g013
Figure 14. XRD patterns for roasted dust and leaching residue.
Minerals 13 00900 g014
Figure 15. BSE and EDS mapping images of leaching residue.
Minerals 13 00900 g015
Figure 16. SEM images of the dust (ac) before leaching and after (d,e) leaching.
Minerals 13 00900 g016
Figure 17. Variation of gallium recovery at different leaching temperatures with leaching time.
Minerals 13 00900 g017
Figure 18. Plot of 1/(1 − α)1/3 − 1 versus t for data obtained at different temperatures.
Minerals 13 00900 g018
Figure 19. Plot of lnk against 1/T.
Minerals 13 00900 g019
Table 1. Chemical composition of brown corundum dust (wt.%).
SiO2K2OAl2O3SO3Fe2O3MgOMnOP2O5Na2OTiO2PbOF
40.8217.723.393.0853.5420.8700.7570.7120.5330.4910.4150.345
ZnOCaOCuOGa2O3ClCr2O3SnO2ZrO2Rb2OAs2O3SrOBi2O
0.1530.1500.1470.1140.0840.0320.0280.0270.0260.0220.0120.012
V2O5ThO2Nb2O5NiOGeO2La2O3Y2O3Co2O4LOICN
0.0070.0060.0050.0040.0040.0040.0030.0025.9400.3500.081
Table 2. Chemical composition of each point in Figure 2.
PointElement/wt.%
OSiKAlFeTiMnCaS
129.5930.0318.1915.085.801.31---
233.4526.1317.6218.812.131.010.85--
38.3389.501.45----0.72-
442.64--57.36-----
545.031.8217.83----15.8119.50
636.951.150.5456.151.170.75-3.28-
750.061.6717.24----13.0517.98
846.448.7015.754.41---10.6814.02
928.430.780.5112.5955.800.551.33--
1026.981.280.341.5569.86----
Table 3. Chemical compositions of different points obtained by EDS analysis in Figure 9 (wt.%).
PointONaMgCSiKAlFeTiCaZn
150.541.7--4.21.81.8----
248.126.6-25.3-------
334.21.1--33.4-9.0--20.12.2
432.1-66.6-0.3--1.0---
536.817.7--22.65.314.32.80.5--
635.42.4--23.222.814.81.4---
736.9---25.5-15.3--22.3-
820.2-4.6-5.7-3.366.2---
938.912.8--21.85.517.63.4---
1037.1---1510.737.2----
1146.39.512.3----1.2-30.7-
1238.9-61.1--------
13313.9--27.523.314.3----
1443.81.1--54.60.5-----
Table 4. Chemical compositions of different points obtained by EDS analysis in Figure 10 (wt.%).
PointONaMgSiKAlFeTiCaS
138.67--33.23-8.15--19.95-
242.23--57.77------
346.28-------53.72-
444.65-------55.35-
549.04-2.7916.752.104.571.53--23.22
645.69-------54.31-
745.96-0.9953.04------
835.60-1.1428.9110.8717.864.730.90--
942.981.23-51.061.03----3.69
1039.96-29.9530.09------
1141.5412.001.378.992.482.55---31.07
1243.13-4.3032.48-----14.295.80
1323.67--9.21-6.2060.93---
1431.14--2.05-66.82----
1538.77--2.28-54.891.87--2.20
1638.88-4.0121.6410.0014.433.65-0.906.48
Table 5. Chemical compositions of different points in Figure 12 (wt.%).
PointONaMgSiKAlFeTiCaSPMnC
147.32-17.94-----34.74----
244.46--55.54---------
341.7019.42-15.3111.066.081.710.59--4.12--
441.26-20.2138.53---------
535.58-16.9925.8410.569.342.71------
640.0731.59-22.945.41--------
730.31-68.14---1.55------
838.0421.27-34.724.35--1.62-----
942.9921.71-1.040.60----3.27--30.39
1028.56--32.2425.818.702.06-1.24--1.39-
1133.89--25.6228.3112.19-------
1246.95-18.03-----35.02----
1336.39-30.6030.96--2.05------
1448.37--51.63---------
1530.47-0.6028.3027.679.812.04-1.12----
1633.50-1.886.814.4550.031.410.80---1.12-
1734.40-0.7629.4211.0818.634.571.13-----
Table 6. Correlation coefficients (R2) for lines fitted with the three kinetic models.
Temperature/KCorrelation Coefficient (R2)
k1t = 1 − 2α/3 − (1 − α)2/3k2t = 1 − (1 − α)1/3k3t = 1/(1 − α)1/3 − 1
2980.963350.991820.99683
3130.986120.98340.99712
3330.995620.973850.99768
3530.996760.969360.9979
Disclaimer/Publisher’s Note: The statements, opinions and data contained in all publications are solely those of the individual author(s) and contributor(s) and not of MDPI and/or the editor(s). MDPI and/or the editor(s) disclaim responsibility for any injury to people or property resulting from any ideas, methods, instructions or products referred to in the content.

