Article

Justification for Criteria for Evaluating Activation and Destruction Processes of Complex Ores

by
Tatiana Aleksandrova
,
Nadezhda Nikolaeva
*,
Anastasia Afanasova
,
Artyem Romashev
and
Valentin Kuznetsov
Department of Mineral Processing, Saint Petersburg Mining University, 199106 St. Petersburg, Russia
*
Author to whom correspondence should be addressed.
Minerals 2023, 13(5), 684; https://doi.org/10.3390/min13050684
Submission received: 7 March 2023 / Revised: 12 May 2023 / Accepted: 13 May 2023 / Published: 17 May 2023
(This article belongs to the Special Issue Valuable Metals Recovery by Mineral Processing and Hydrometallurgy)

Abstract

:
The mining industry is faced with the problem of depletion of reserves of easily beneficiated minerals containing valuable metals. The characteristic features of the ores involved in processing are fine dissemination; low content of valuable components; and similar physical, chemical, surface, and technological properties of minerals, among others. Under such conditions, increasing the efficiency of mineral processing becomes of primary importance. Creating highly efficient, environmentally safe technologies on the basis of deep study of the material, chemical, and mineralogical composition, as well as using and developing methods and techniques for testing mineral materials at successive stages of raw material transformation, enable to solve such problems. Criteria for assessing the flow of technological processes are presented in the article. A complex criterion is substantiated and proposed for quantitative assessment of the degree of physical and energy impact at the stages of ore preparation and flotation enrichment of mineral raw materials. The criterion is calculated on the basis of activation energy data calculated by differential and integral kinetic methods. In addition, an empirical indicator was introduced into the complex criterion, which allows increasing the accuracy of the calculated criterion. This criterion not only allows to estimate the degree of influence from the position of averaged estimation on the full interval of degrees of transformation from 0 to 1, but also gives the possibility to consider the required number of degrees of transformation; for example, if it is necessary to make estimations on narrow temperature intervals. The calculation of empirical parameters for the obtained criterion is carried out before and after the application of physical–energetic methods of influence using thermal analysis.

1. Introduction

At the moment, the mineral resource sector both in Russia and in the world has to address a wide range of global challenges, including declining quality of mineral raw materials, fine dissemination of valuable component in ores, their specific structural–textural features, separable minerals’ properties semblance, arduous mining, and geological conditions of occurrence, among others [1,2,3,4,5]. Moreover, among the negative factors, undoubtedly, is the exhaustibility of the mineral raw material base [6,7,8,9]. These problems stipulate the demand for the depth amplification of mineral processing technologies; search extension for the non-traditional sources of valuable components (such sources include black shales, refractory sulfide carbon-bearing ores, and so on, containing various precious and rare metals); and the need to develop and improve apparatuses, methods, and technologies of mineral processing [10,11,12,13,14].
Resolving these problems is possible only based on an integrated approach with the use of methods of activation and destruction at the successive stages of transformation of minerals (comminution, beneficiation, and processing). An important aspect of various mineral processing intensification operations is the stage of reducing the size of the material to the required values. Fracture mechanisms and patterns are largely determined by the attributes of the internal structure of the materials, their strength properties, deformation conditions, as well as the physical and chemical properties of the main compounds. All these factors form many variants of material states during deformation and fracture results [15,16]. However, the common element of fracture patterns is the cyclic nature of occurring microprocesses for any coarseness. First, the initiation of microcracks in the material array occurs at the points of the internal forces of the lowest adhesion values. When more energy is applied, the cracks grow and accumulate until the critical energy value is reached, at which point the structure of the piece breaks down and new lumps are formed. These processes are then repeated for finer grains. As the coarseness of the material decreases through the process, the amount of energy required increases as its value is proportional to the surface area formed. Many studies show that only a small part of the energy is used directly to reduce the grain size. Most of it, under the influence of dissipation phenomena, is spent on reversible plastic deformation of the material and subsequently transferred into heat. Thus, during ore preparation operations, the applied energy must overcome the energy barrier of plastic and elastic deformations [17,18,19].
The appearance of the “energy barrier” is caused by the uncompensated bonds of the crystal lattice surface, which, when the bonds are destroyed, begin to rearrange themselves to eliminate the lattice alteration. In other cases, they are just deformed and, when the applied force is removed, they tend to return to the previous state. Because of this phenomenon, formed microcracks are liquidated at the nucleation stage. To lower the energy barrier, it is necessary to apply chemical bonding energy, which is equal to the work required to remove the “bonding elements” from each other at a certain distance [20]. A possible way to lower the energy barrier of plastic deformation for ore preparation processes is the use of unstrengthening reagents. The principle of action of such reagents is based on lowering the durability through the adsorption phenomenon, discovered by P.A. Rebinder. The presence of a surface-active medium significantly lowers the strength of intermolecular bonds on the surface by reducing its free energy [21,22,23,24]. The adsorbed release agent occupies these bonds, which prevents them from participating in the rearrangement processes [25,26,27,28].
The research into activation and destruction processes of mineral components at different stages of raw material processing is complicated by the need to quantify the applied impact. A promising method for such evaluation is thermal analysis, which includes a group of analyses such as thermogravimetry, mass spectroscopy, derivatography, and so on.
With the application of thermal analysis methods, it is possible to investigate the organic component, to develop decarbonisation methods, and to evaluate the fuel capacity of energy raw materials, among others. Quantification based on thermogravimetric data is carried out by calculating the activation energy and other parameters such as the pre-exponential factor and the order of the reaction.
There are several methods for calculating activation energy, but all of them are based on the Arrhenius equation [29]:
k(T) = Aexp (−E𝑎/RT)
where T is temperature, A is the pre-exponential factor for the thermal reaction, R is the gas constant, and E𝑎 is the activation energy.
Table 1 shows the three main methods and equations for calculating the activation energy.
T m is the sample temperature at which the pick differential thermal analysis deflection occurs, β is the heating rate, g x is the kinetic model function expressed using the fractional reaction, f x is the kinetic model, d x d T is the rate of conversion, and x is the conversion degree.
However, the calculation of activation energy only often does not allow the impact on ore to be fully assessed and classified according to the degree of impact, which makes it an urgent task to develop a criterion to quantify the degree of impact on ore.
Analysis of the scientific and technical state in the field of processing of mineral resources of different genesis has established the need to develop fundamental knowledge; methodological approaches; and methods of evaluation related to the preparation of minerals for beneficiation, concentration, and processing. Thus, the objective of this work was to develop criteria characterizing the efficiency of overcoming the energy barrier during grinding of complex ores of compound material composition as well as justification of methods for the assessment of destruction and activation mechanisms during flotation.

2. Materials and Methods

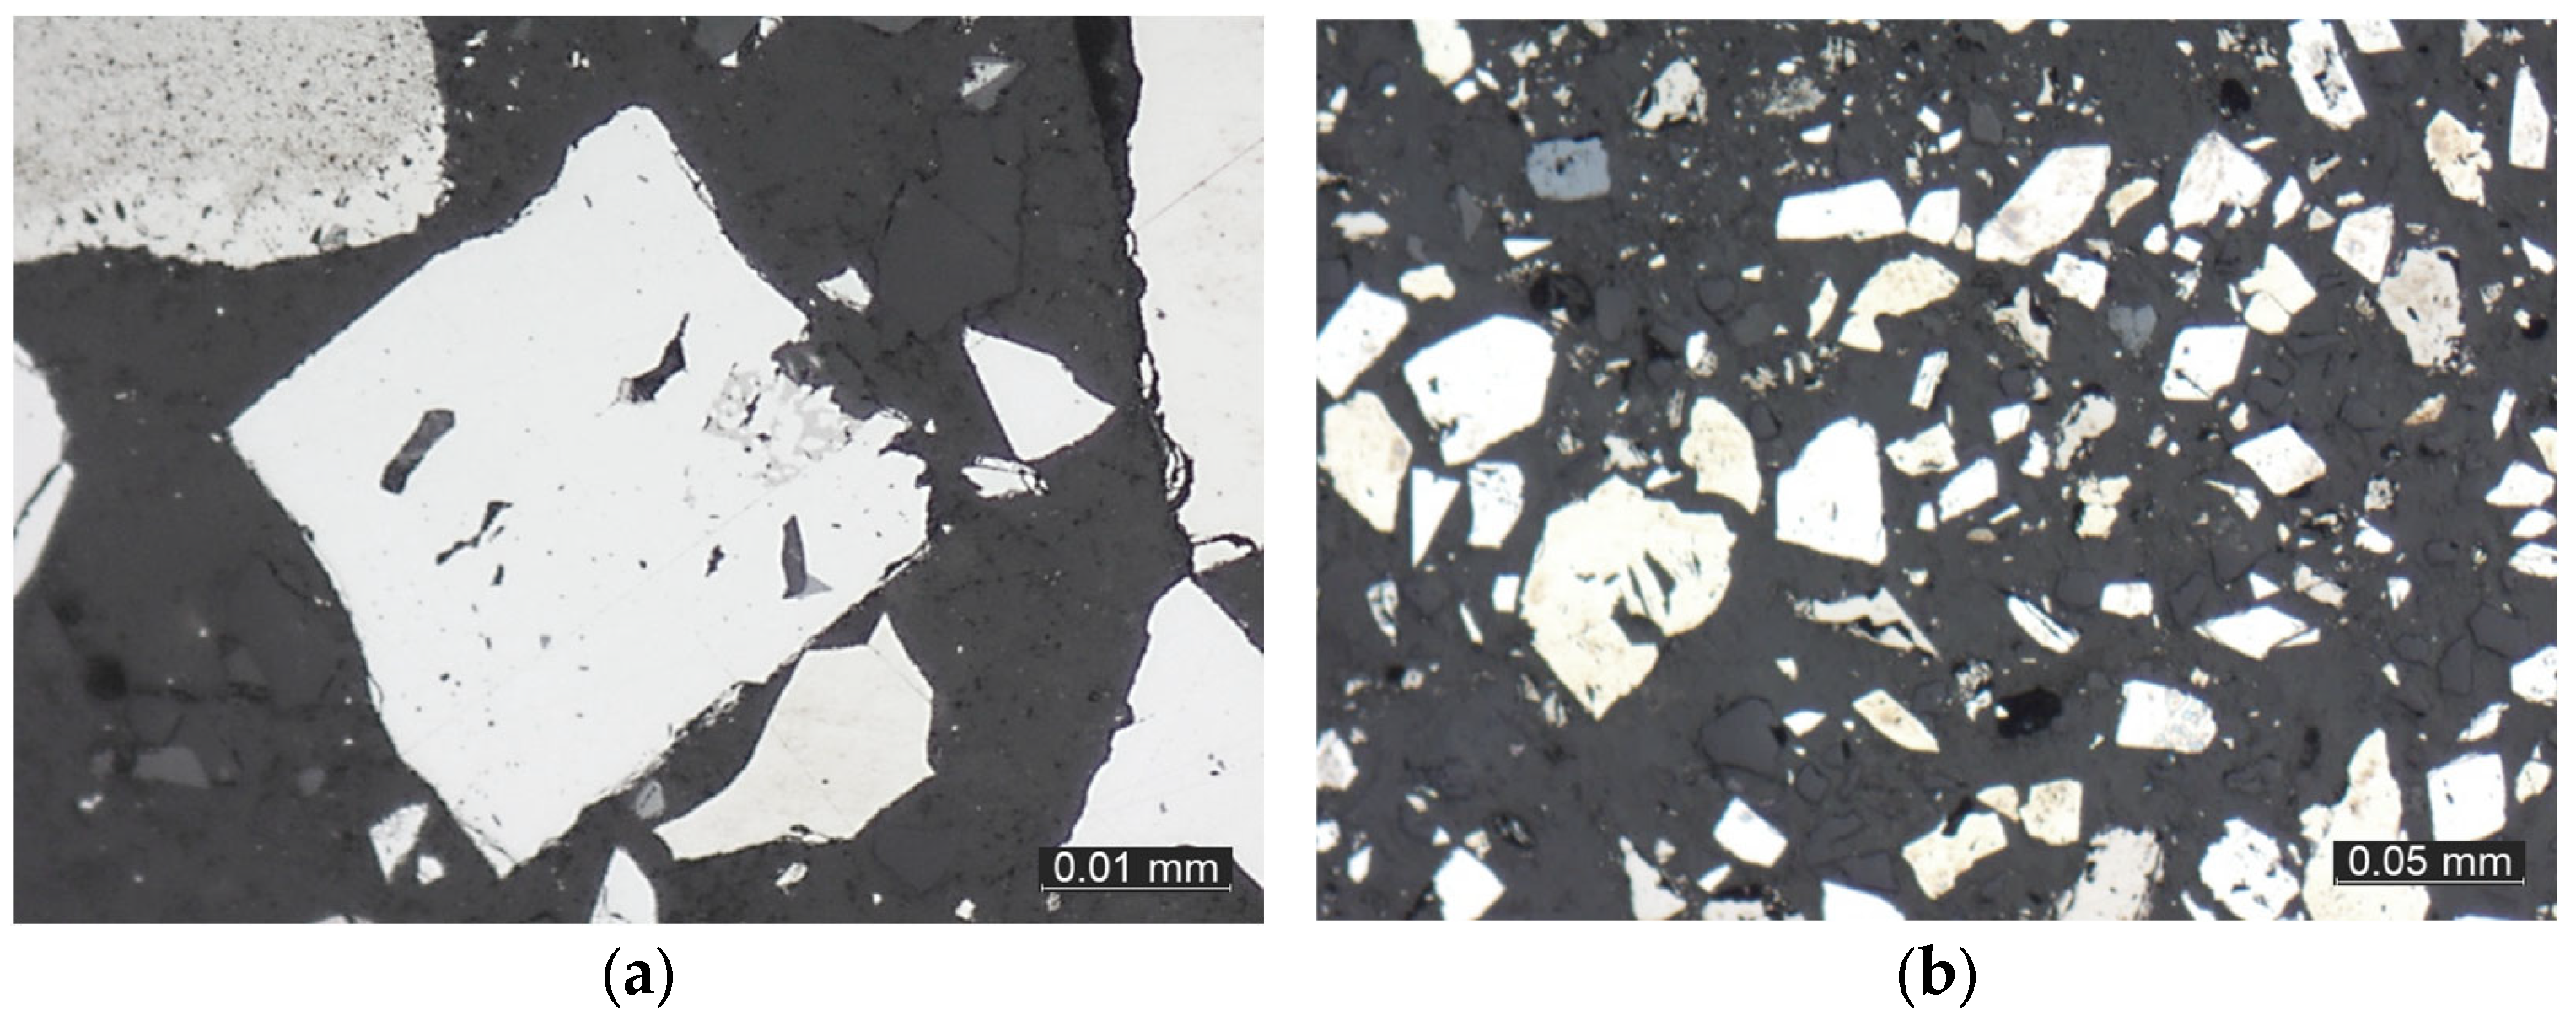
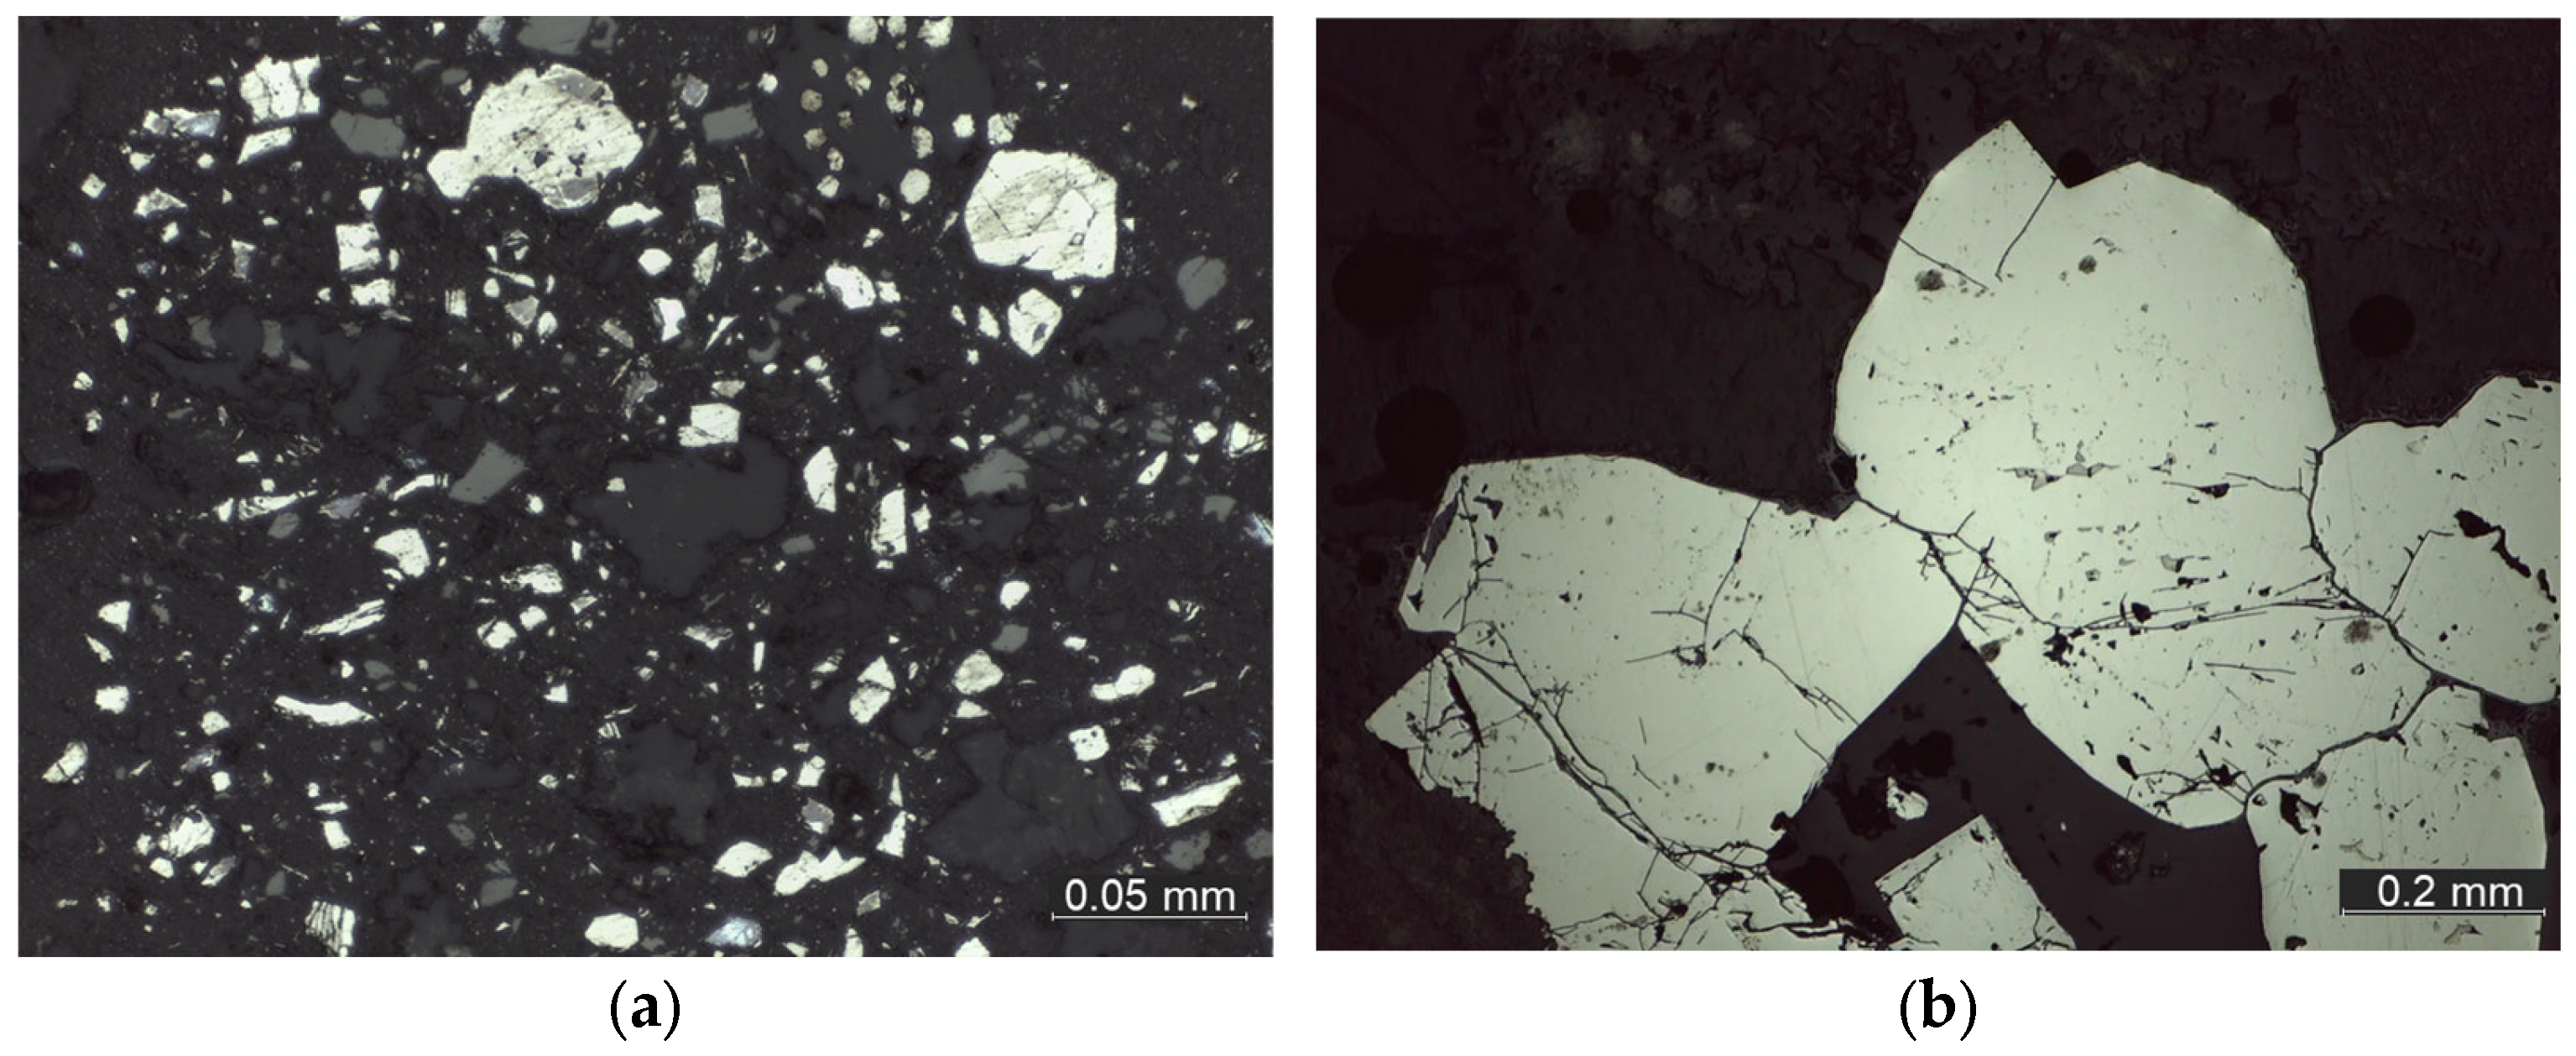
2.1. Characteristics of Ores

Gold-bearing sulfide (GSOs) and carbonaceous gold-bearing (CGOs) ores were selected as the objects of the present study. The objects were selected on the principle of the presence of noble and nonferrous metals and their fine dissemination.
The main ore minerals of the GSO sample were pyrite and arsenopyrite. Their content in the sample ranged from 2.0% to 2.6%. The sulfide minerals were overwhelmingly thinly disseminated in the host rock massif. Large sulfide particles were detected separately (Figure 1). Quartz is the main host mineral and is often present in intergrowths with muscovite. Grains of various sizes can be part of technogenic quartz–sericite aggregates. The gold in the ore is in the native state and in submicroscopic form (mainly in arsenopyrite). The particle size varies from less than 1 µm to 0.4 mm. Chemical composition of the sample: SiO2—46.46%, Fe2O3—17.87%, CaO—17.11%, K2O—6.41%, Al2O3—5.52%, TiO2—1.87%, As—0.67%, Au—4.61 g/t, Ag—0.37 g/t, Ctot—0.5%, Stot—1.26%.
Gold-bearing sulfide ore is generally characterized by the presence of hard-to-recover grains; accordingly, in order to increase the efficiency of valuable metals’ recovery, it is necessary to choose an optimal and energy-efficient disintegration scheme at the stage of ore preparation.
Carbonaceous gold-bearing ores (CGOs) (Figure 2) can be classified as refractory because of the large amount of carbon.
Chemical composition of the sample: SiO2—56.11%, Al2O3—23.2%, Fe2O3—4.12%, K2O—3.03%, CaO—1.91%, MgO—1.13%, TiO2—0.63%, Na2O—0.584%, P2O5—0.199%, MnO—0.061%, As—0.45%, Au—5.99 g/t, Ag—0.29 g/t, Ctot—2.65% (including Corg—1.52), Stot—1.59%. Pyritohedron habitus pyrite and needle arsenopyrite are gold-bearing. In both sulfides, gold is present in microscopic and submicroscopic forms. To increase the extraction of noble metals in the processing of this type of ore, it is imperative to reduce the negative impact of carbon at the stage of flotation by using activation techniques at the successive stages of the technological treatment of ores.

2.2. Research Methodology

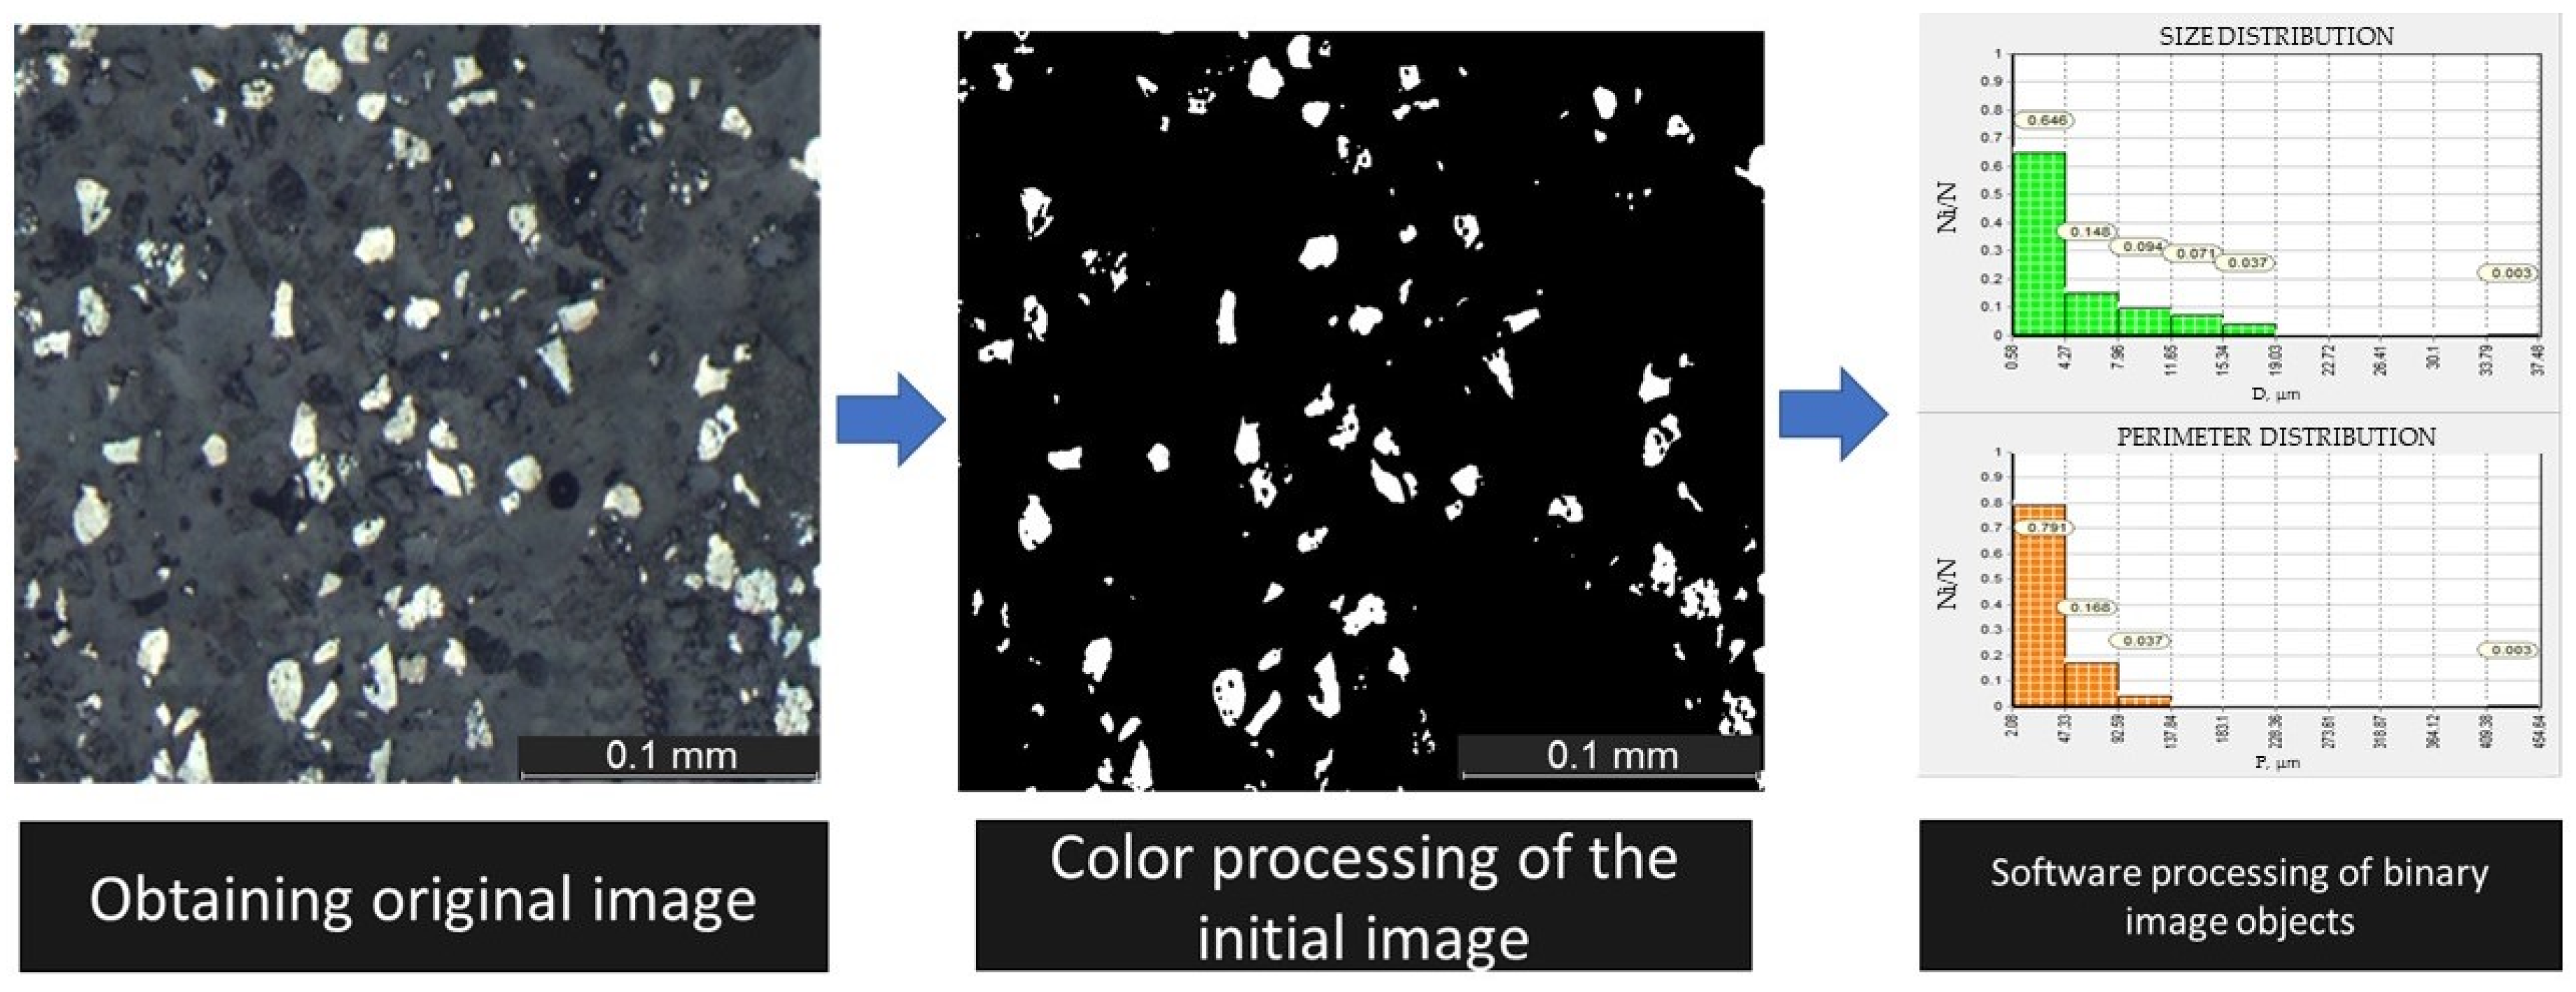
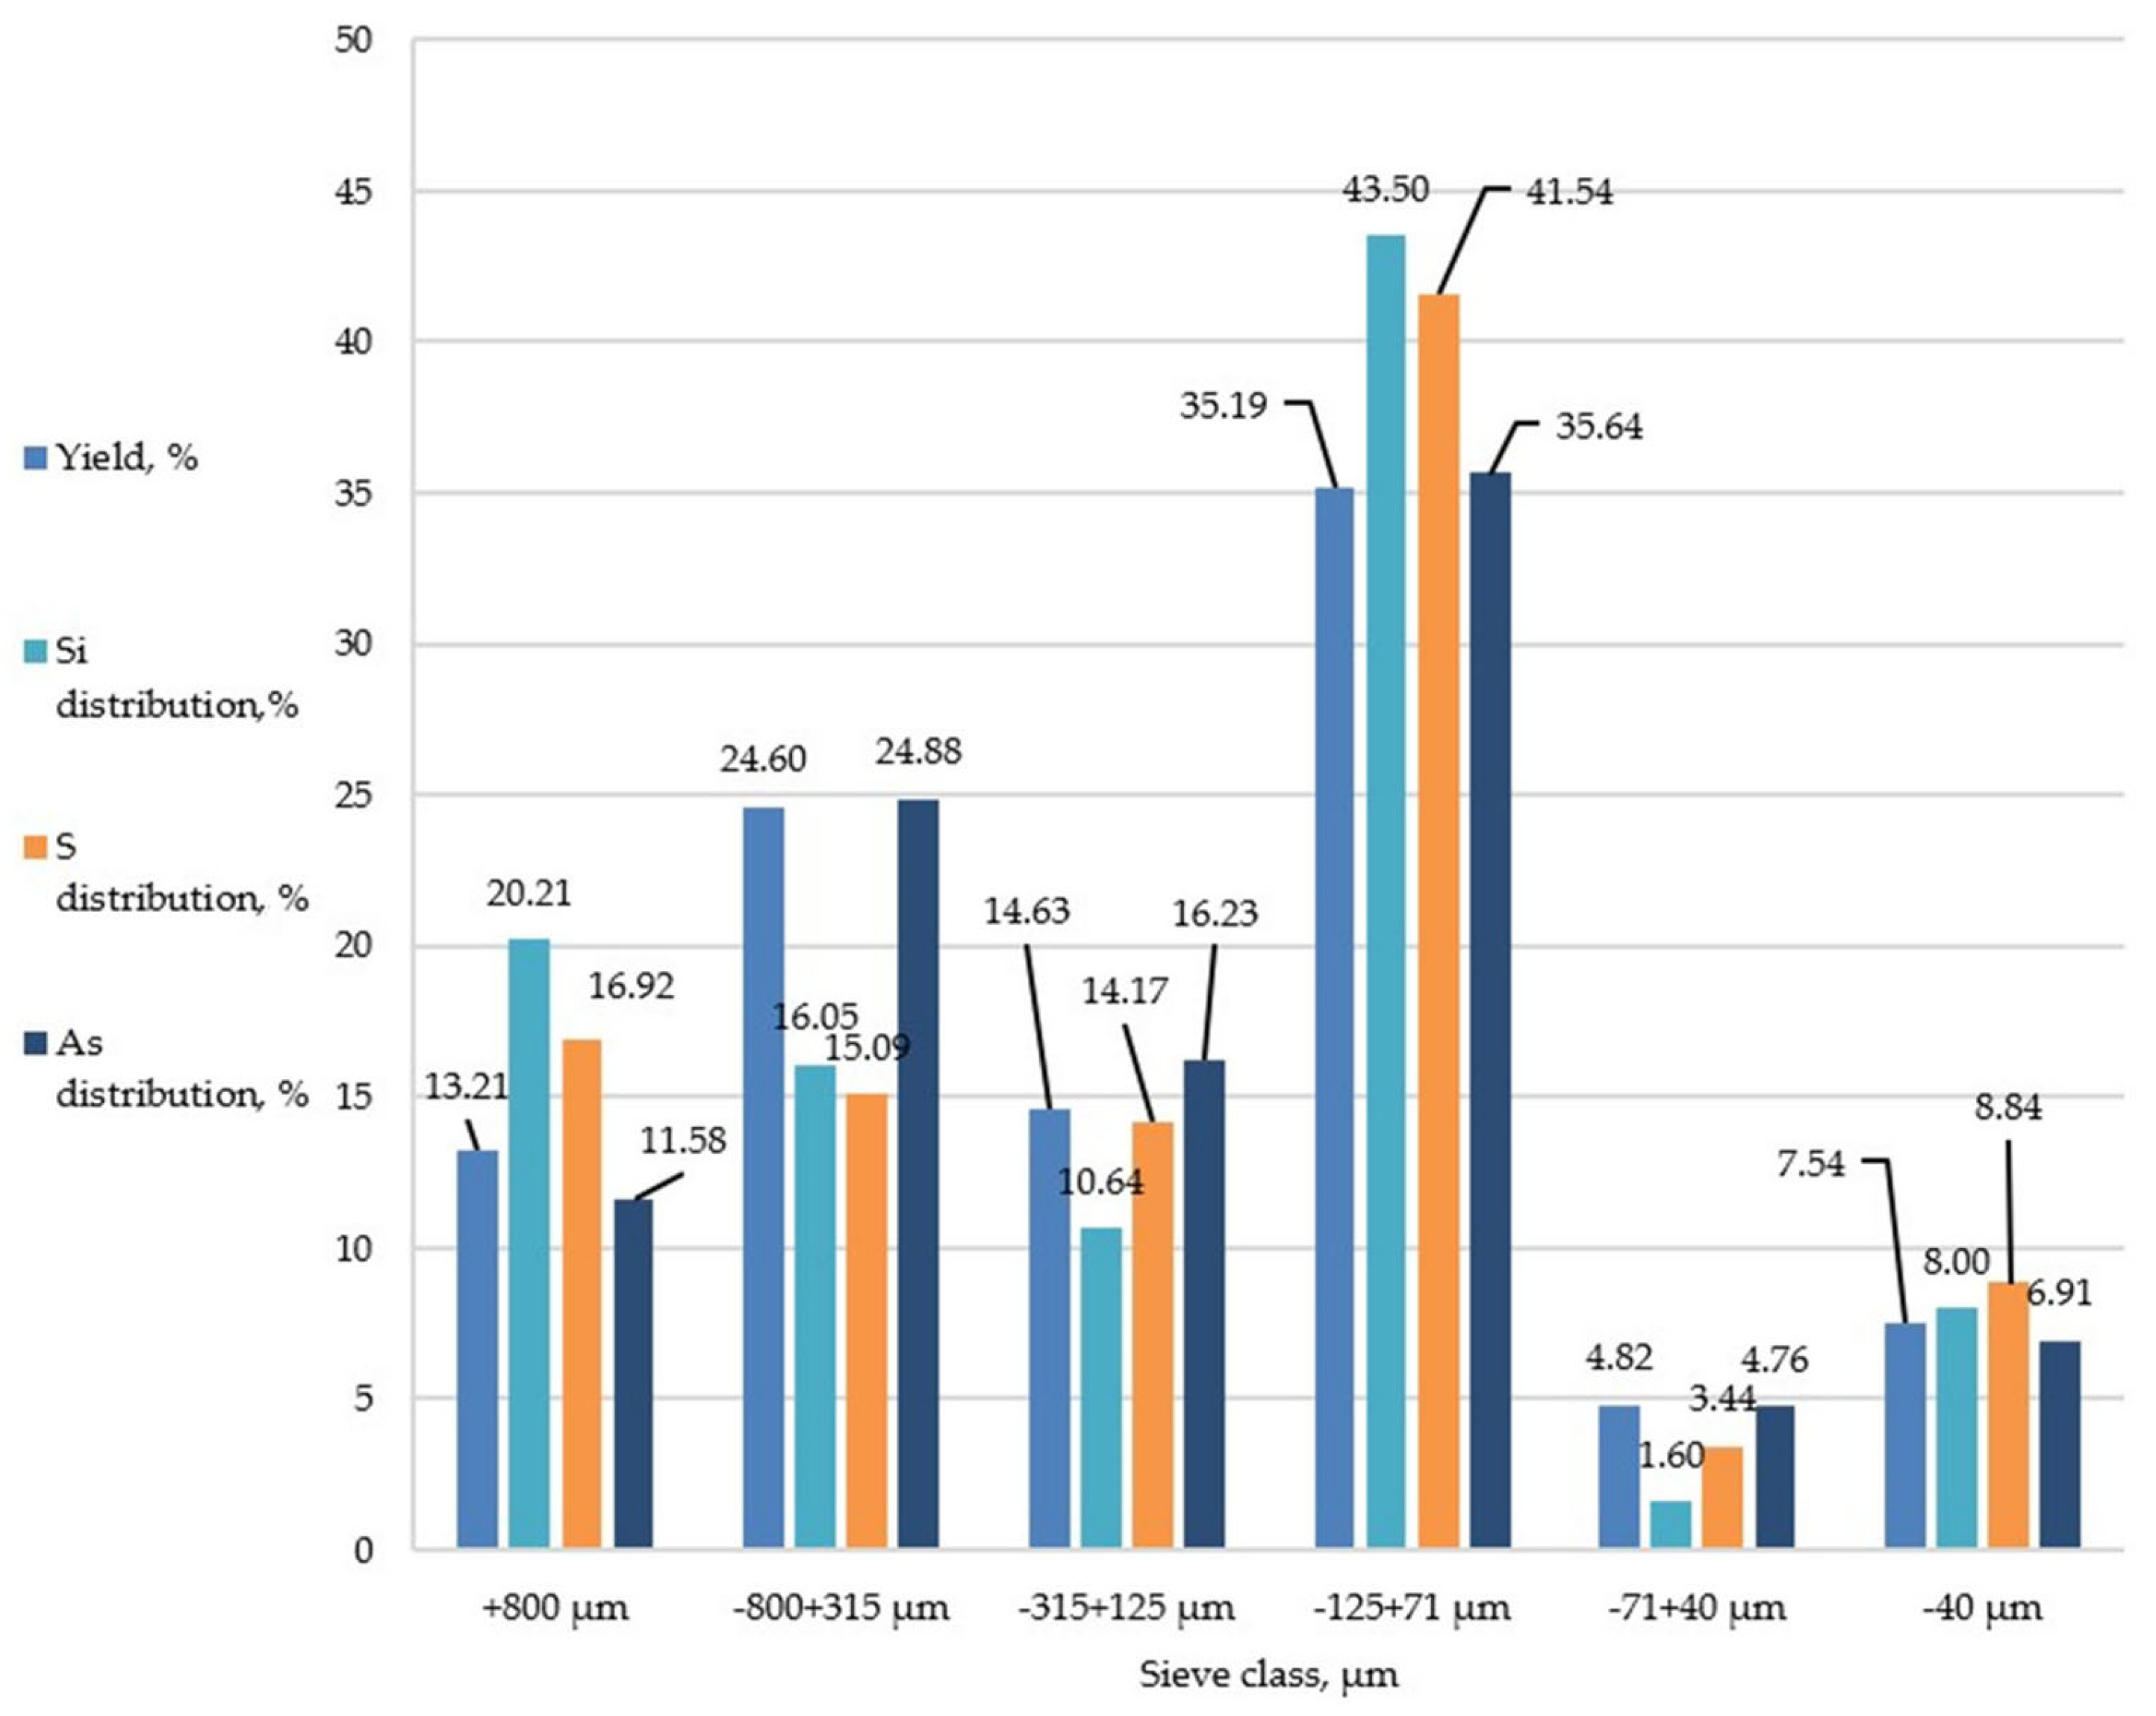
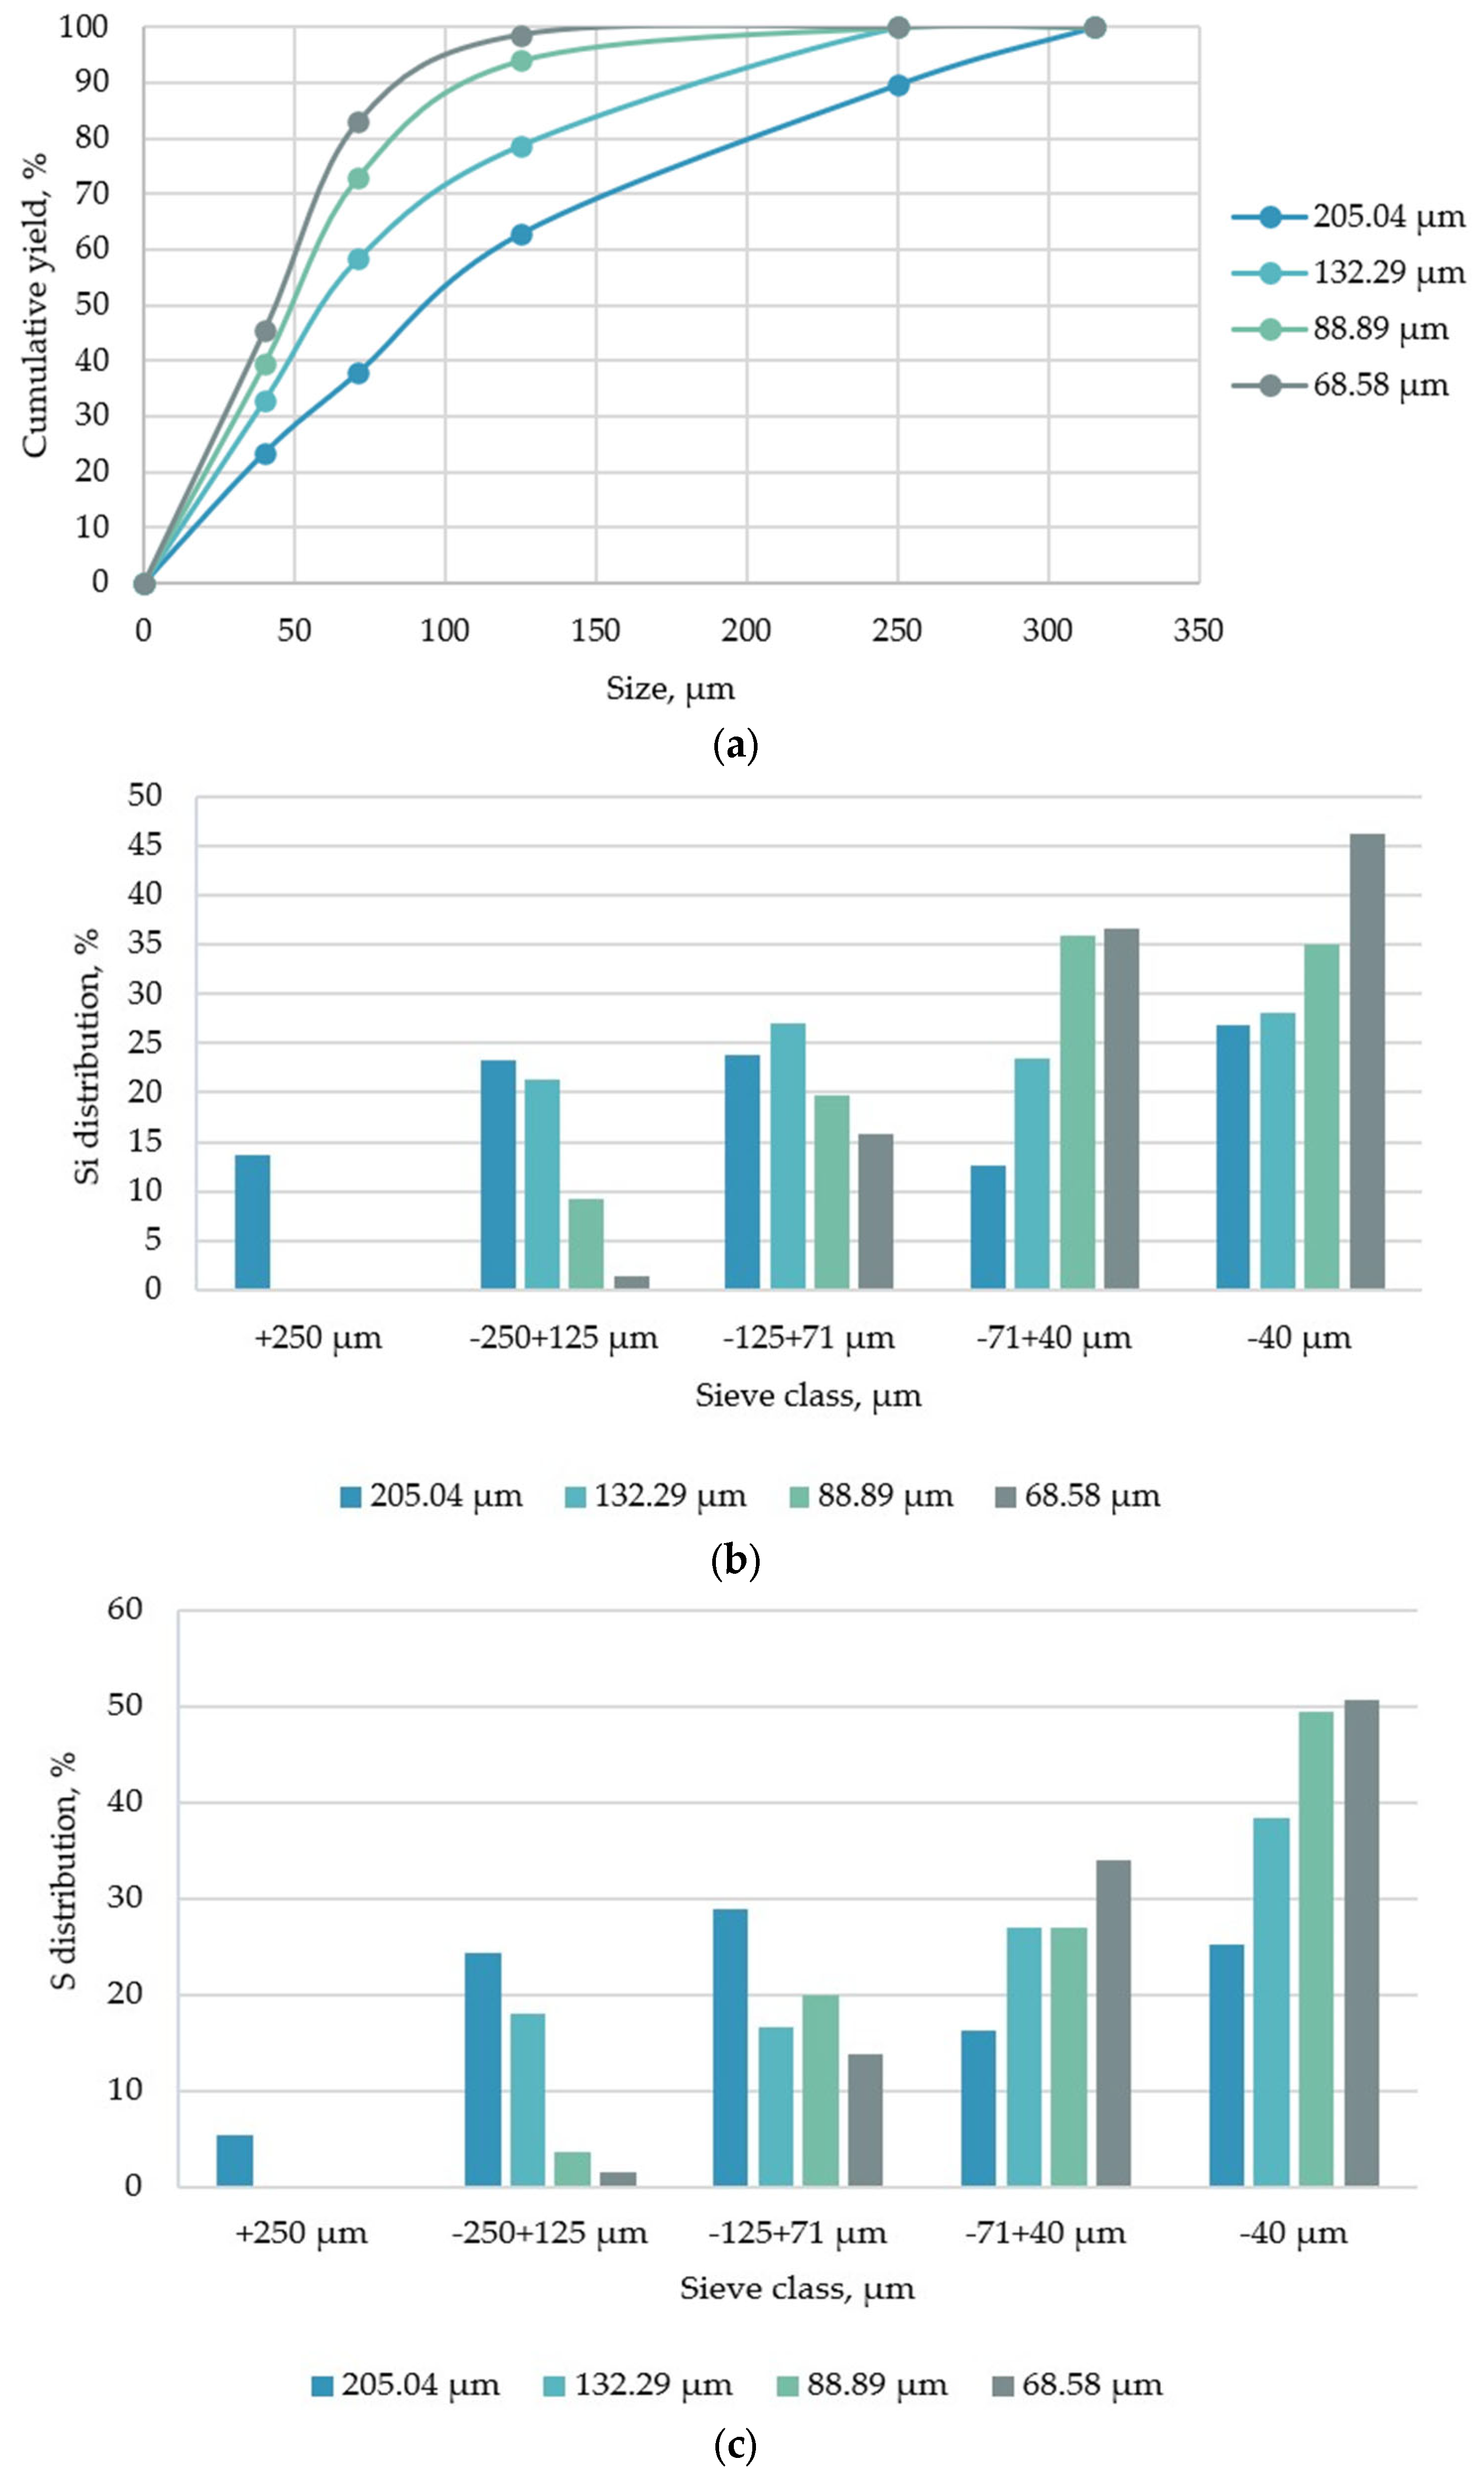
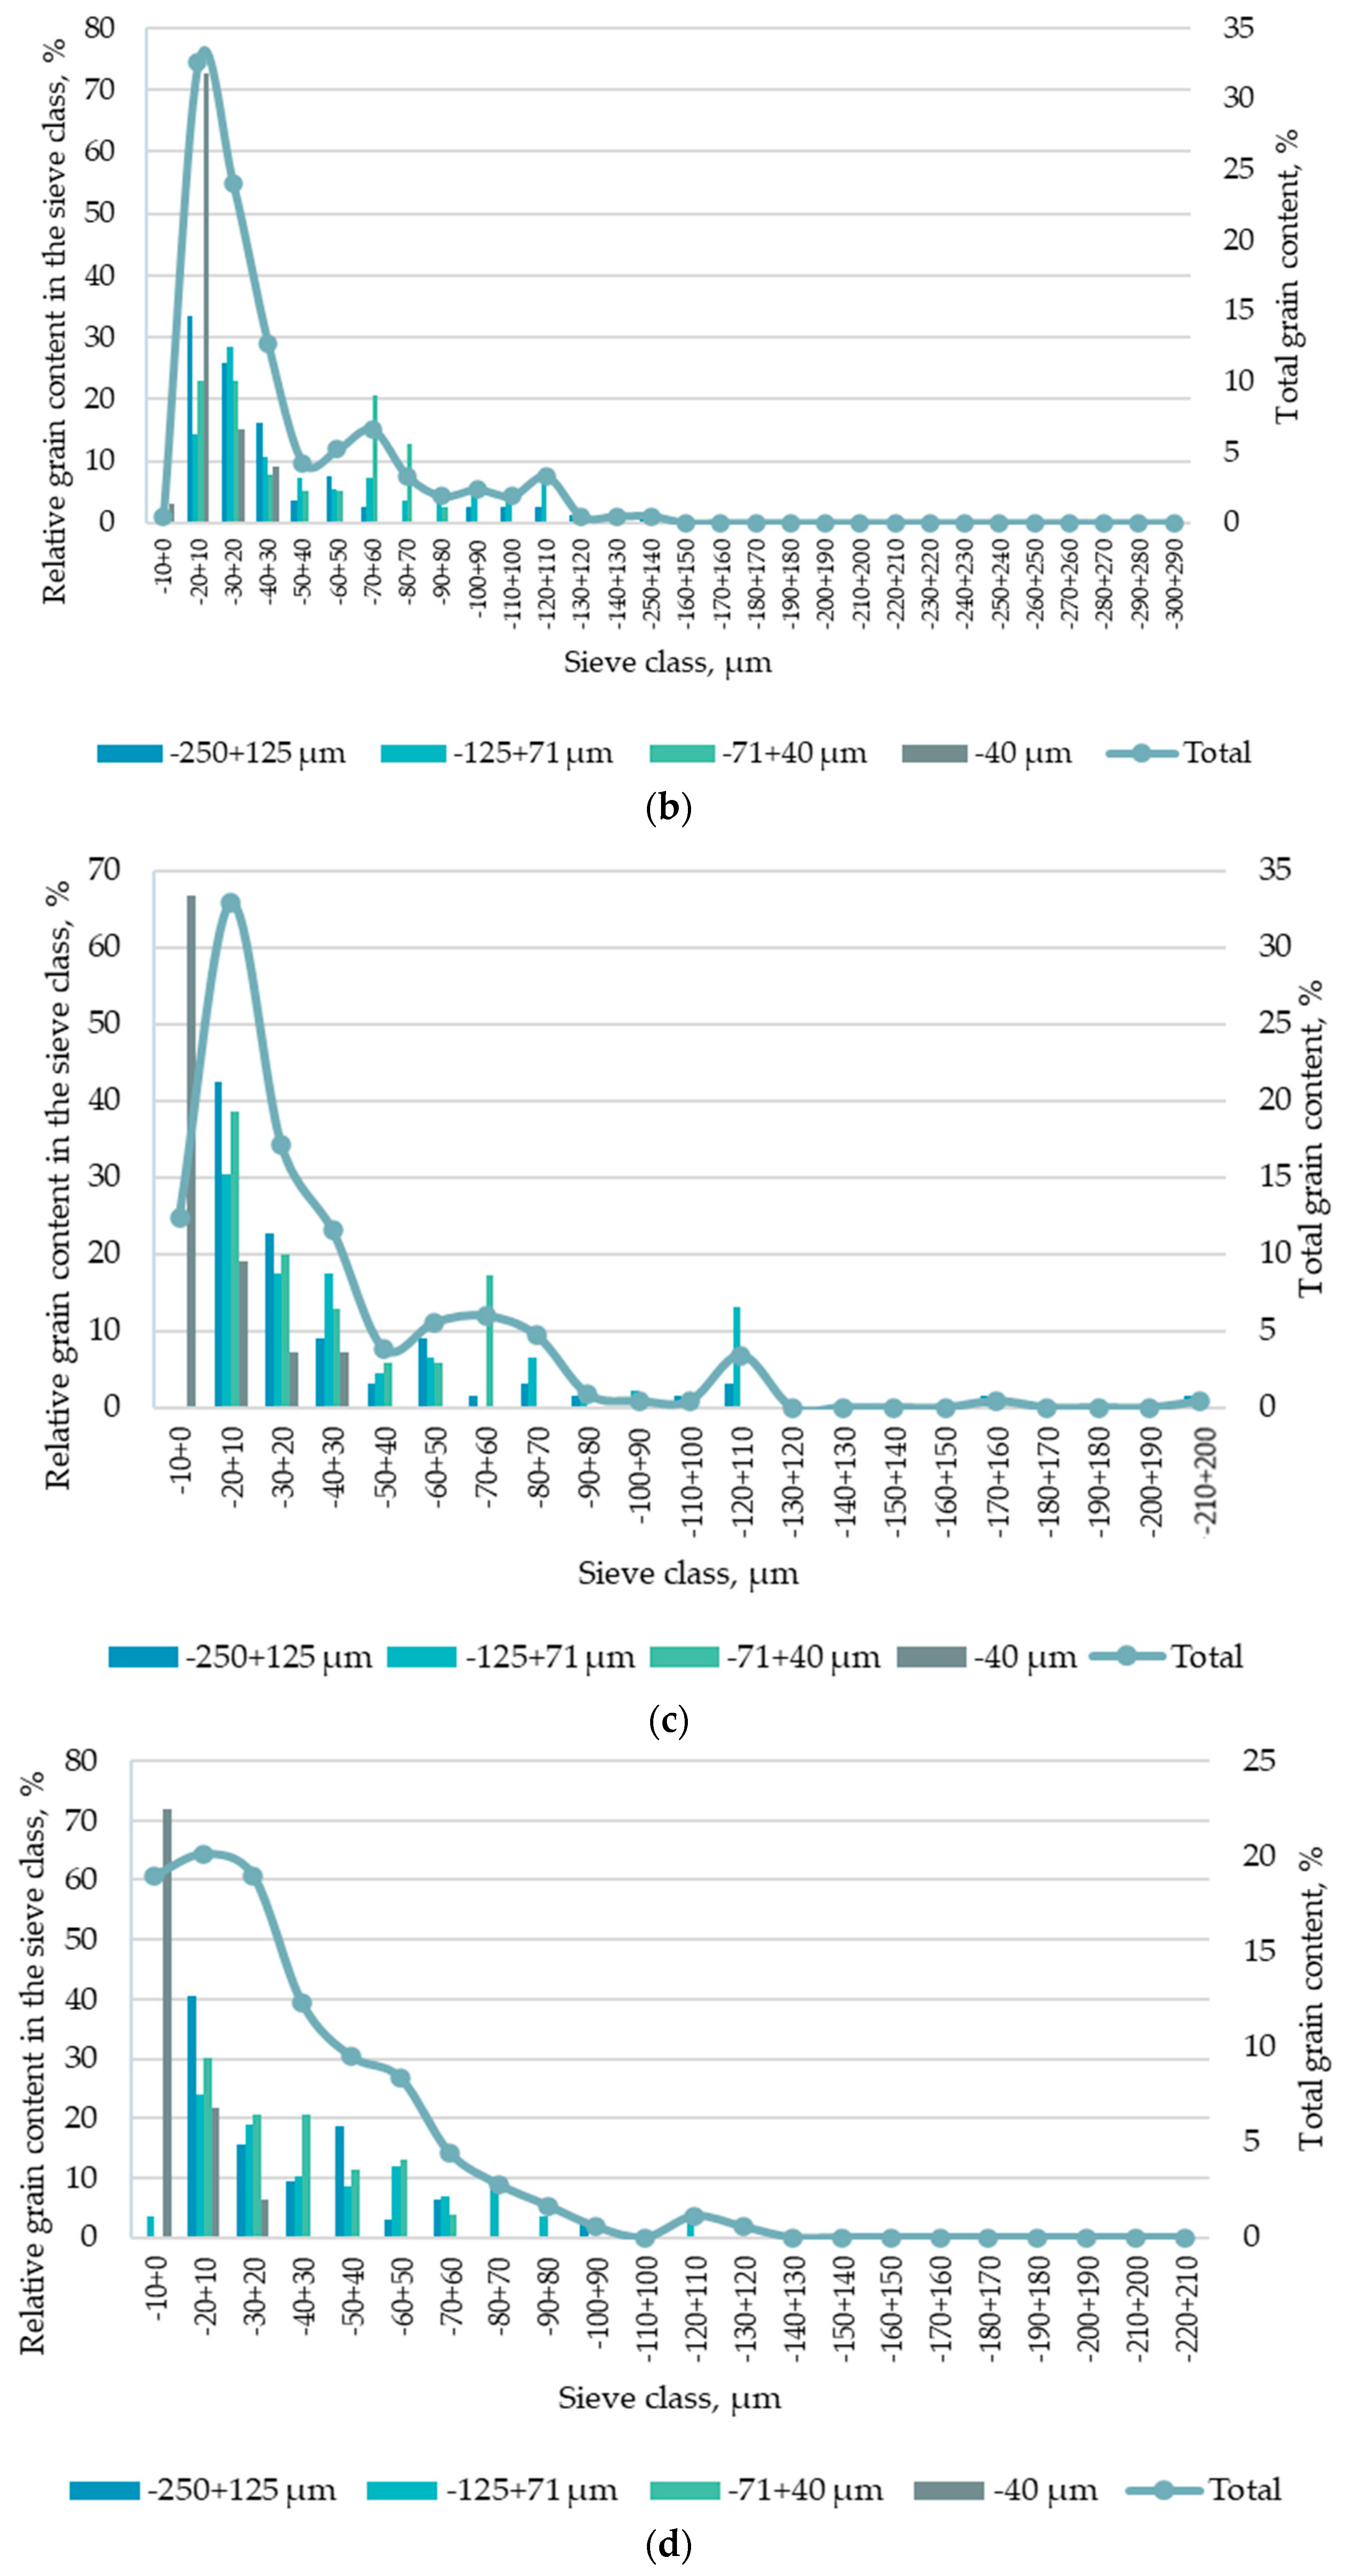
2.2.1. Grinding and Sieve Analysis

To study the effect of mechanical activation and to develop the criteria characterizing the efficiency of overcoming the energy barrier in the process of minerals’ comminution processes, experimental studies of grinding GSO in a ball mill were carried out. The diameter of the mill’s work volume was 118 mm and the length was 125 mm. The particle size of the initial material is −2000 + 0 microns. The initial material weight for each crushing cycle was 250 g and the weight of the ball loading was 2.94 kg. The size of 0.071 mm was accepted as the control sieve. Grinding was carried out in an aqueous medium (L/S = 1:1 by mass). After each grinding, a sieve analysis was carried out using a standard set of sieves. The study of grinding process intensification was carried out with the use of grinding intensifier reagents. The effect of potassium permanganate, sodium carbonate, and aqueous alkaline solution of sodium silicate on the yield of control class and distribution of components in size classes of milled products was studied. The consumption rate of each reagent in a series of experiments was 100 g/t. The specific surface of the ground products was measured using a laser particle analyzer Microsizer 201C (VA Instalt, St. Petersburg, Russia).
The analysis of the form of mineral assemblages was carried out using an Axio Imager A2m optical polarization microscope (Zeiss, Jena, Germany). The luster contrast of ore minerals allowed the software analysis of images (DG Analyzer 1.5 program). The image obtained with a microscope was converted into black and white gamma. Inclusions of ore minerals represented white areas. The program calculated geometric parameters of these areas and downloaded the result as values of equivalent diameters of each area. Filling of the enclosed areas was used to eliminate false detections. The representativeness of the results was ensured by processing five images of different areas of the sample and joint mathematical processing of selected objects (Figure 3).

2.2.2. Flotation Experiments

Flotation experiments were carried out with the use of a pneumomechanical flotation machine Flotation Bench Test Machine (Laarmann Group B.V., Roermond, The Netherlands) with a chamber volume of 1.5 l. Experiments to obtain flotation concentrates included the following: grinding the sample to a size of 60% of the −71 μm class and carrying out flotation. The reagent suite of flotation included the following: media regulator (sodium carbonate) with a dosage of 400 g/t; carbon depressor (dextrine) with a dosage of 100 g/t; activator of sulfide minerals (copper sulfate) with a dosage of 300 g/t; collectors (butyl potassium xanthate and sodium-dibutyl dithiophosphate) with a dosage of 175 and 25 g/t, respectively; and frother with a dosage of 50 g/t.
The elemental composition of the sample was studied using an EDX 7000 X-ray fluorescence energy dispersive analyzer (Shimadzu Corporation, Kyoto, Japan) according to calibration curves. The organic carbon content of the sample was investigated using a TOC-L organic carbon analyzer (Shimadzu Corporation, Kyoto, Japan). The elemental composition and organic carbon content were measured at least three times to minimize the error and reproducibility of the results.

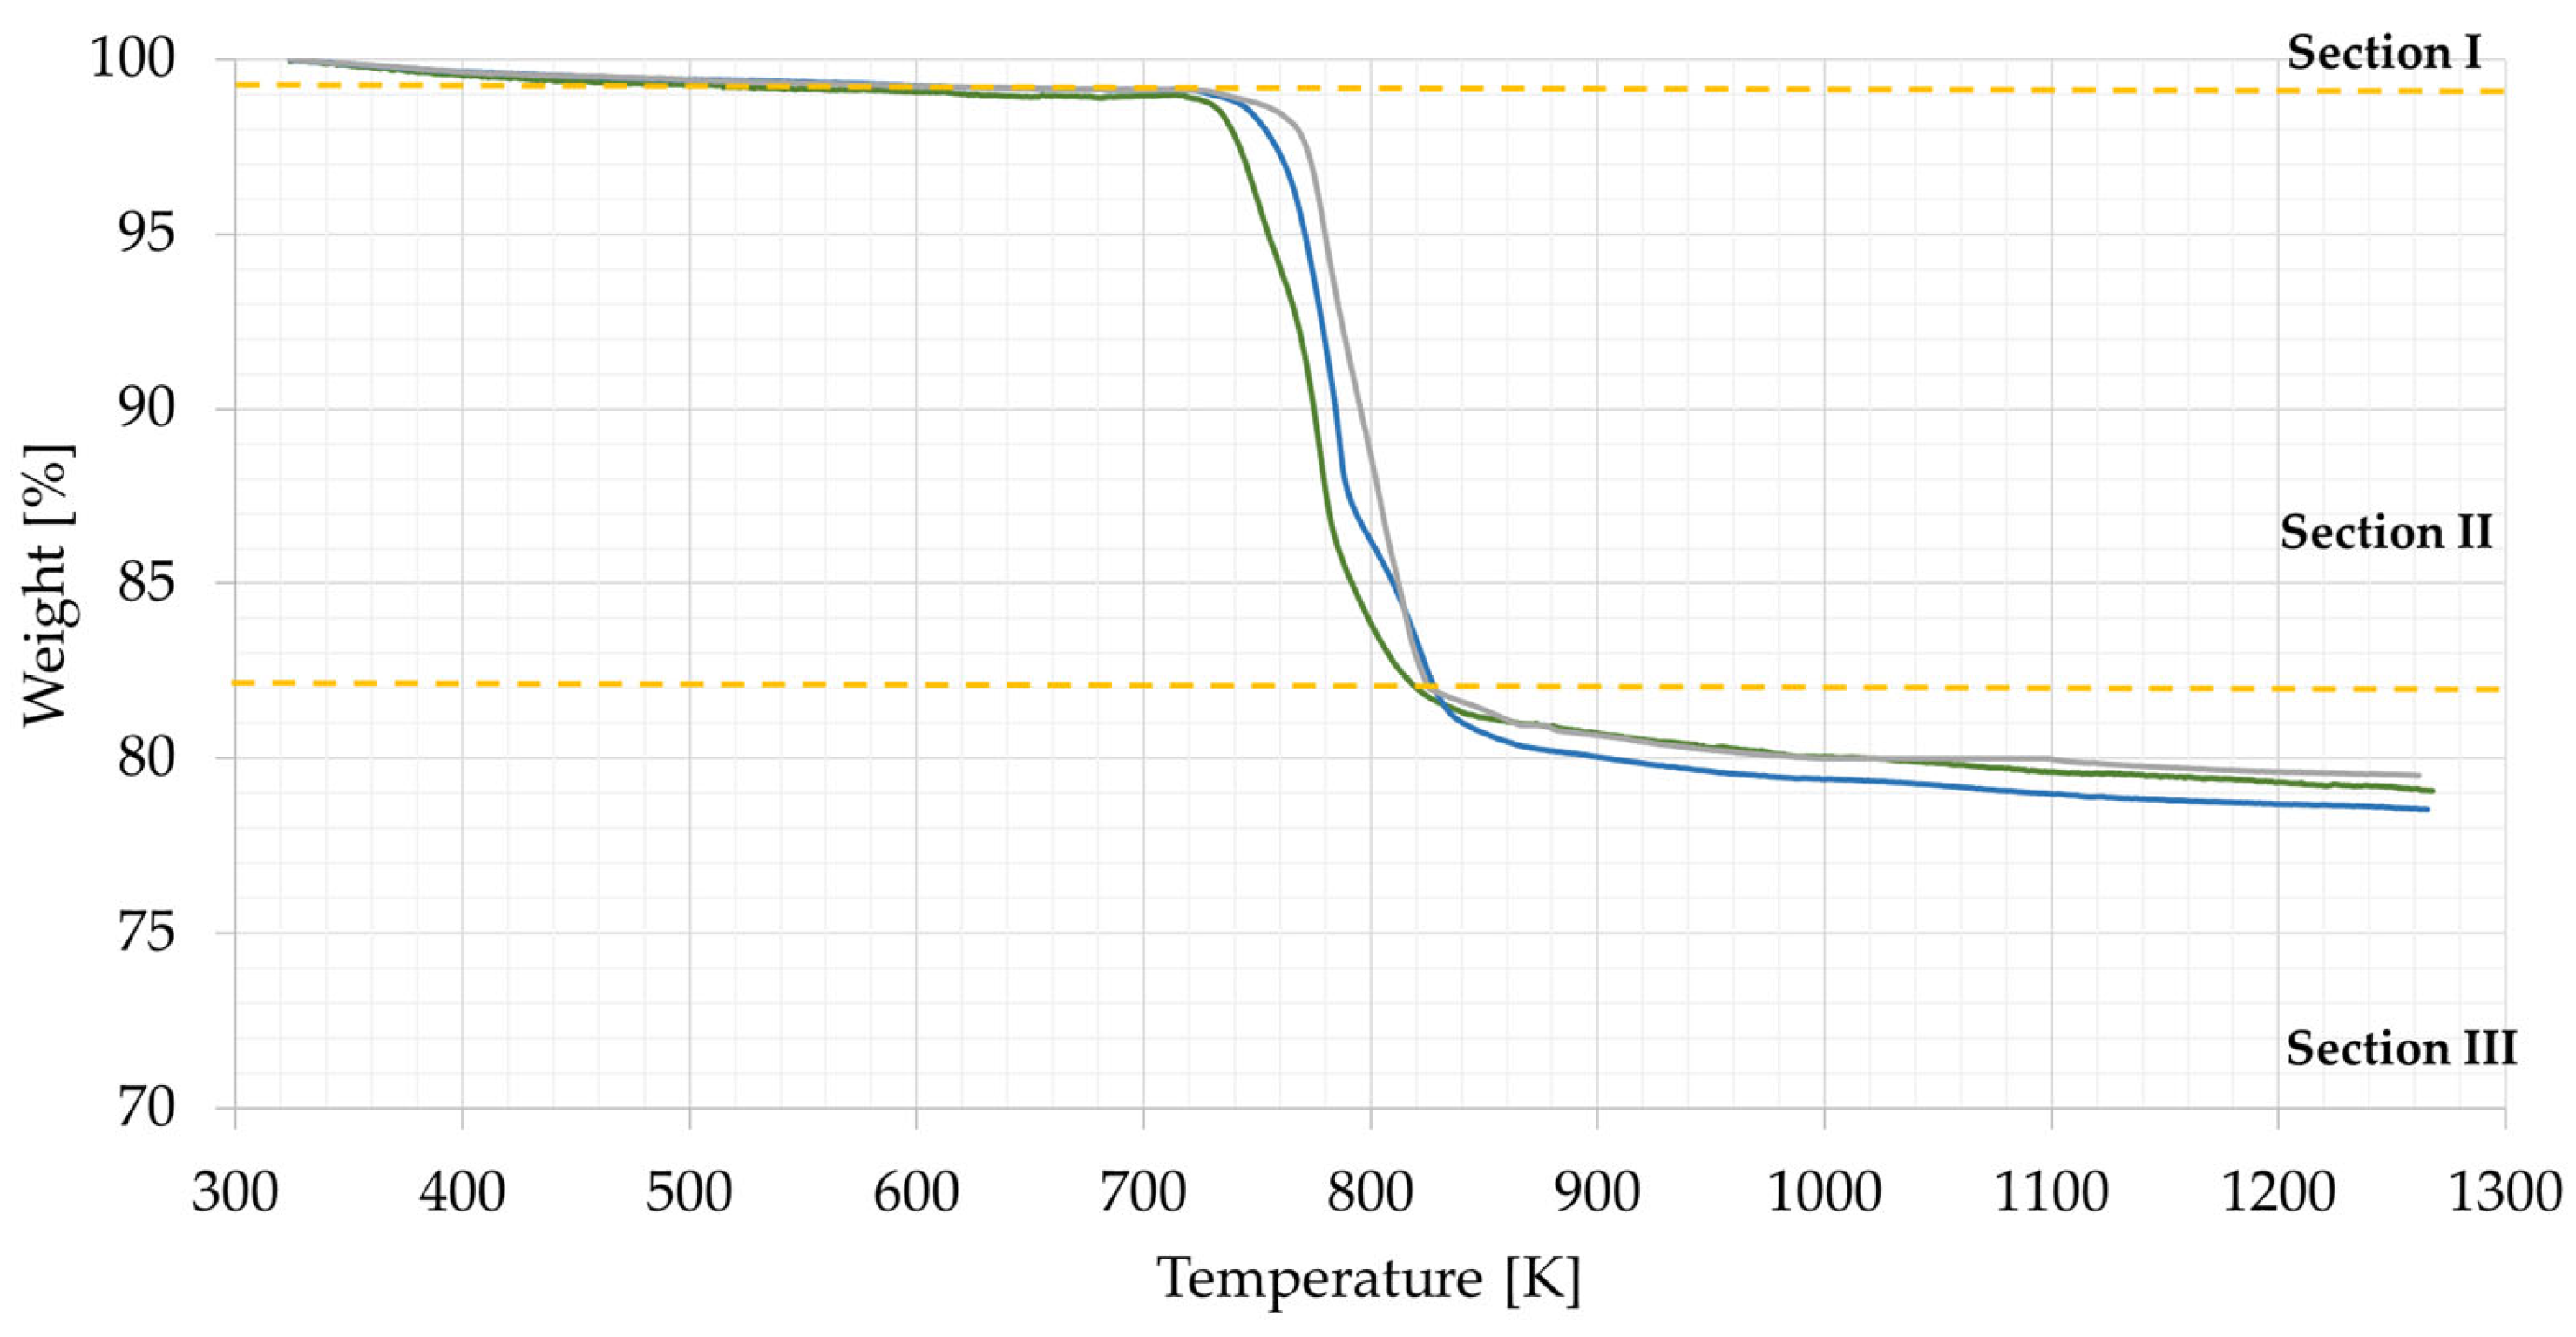
2.2.3. Thermogravimetric Analysis Methodology and Calculation of Activation Energy

Differential thermal analysis and thermogravimetric analyses (DTA-TG) were carried out at three heating rates of 5, 10, and 20 K/min in a nitrogen atmosphere using an SDT Q600 thermal analyzer. Representative samples with a mass of 5 g were taken for investigation. The resulting samples were rubbed down to a particle size of −20 µm and heated to 1250 K. After the measurements, DTA-TG curves were obtained. The TGA curve data were used to calculate the activation energy by systematising the mass loss of the samples as a function of temperature. From these data, the conversion rates were calculated. The degree of transformation was calculated using the following formula:
x = m 0 m i m 0 m f ,
where m0—mass of the sample at the initial moment of time, g; mi—current mass, g; and mf—sample mass at the end of analysis, g.
The activation energy was calculated by the Ozawa–Flynn–Wall method and the Friedman method. To calculate the activation energy by the Friedmann method, the logarithm of the conversion rate lnβ(dx/dT) was plotted as a function of the inverse temperature 1000/T. The tangent of the obtained dependence allows the calculation of the activation energy. The equation is provided in Table 1.
The following formula is used to calculate the activation energy according to the Friedman method:
E a = 0.95 · α · R
where R—universal gas constant and α—tangent of the slope of the straight line for the chosen degree of conversion at the three heating rates.
The interval cut off on the ordinate axis represents the pre-exponential factor lnA.
In order to calculate the activation energy by the OFW method, the logarithm of the heating rate log10β at three values was plotted as a function of the inverse temperature 1000/T. The tangent of the resulting slope allows the value of the activation energy to be calculated. The equation is provided in Table 1.
The following formula is used to calculate the activation energy according to the OFW method:
E a = 2.19 · α · R
where R—universal gas constant and α—tangent of the slope of the straight line for the chosen degree of conversion at the three heating rates.

3. Result and Discussion

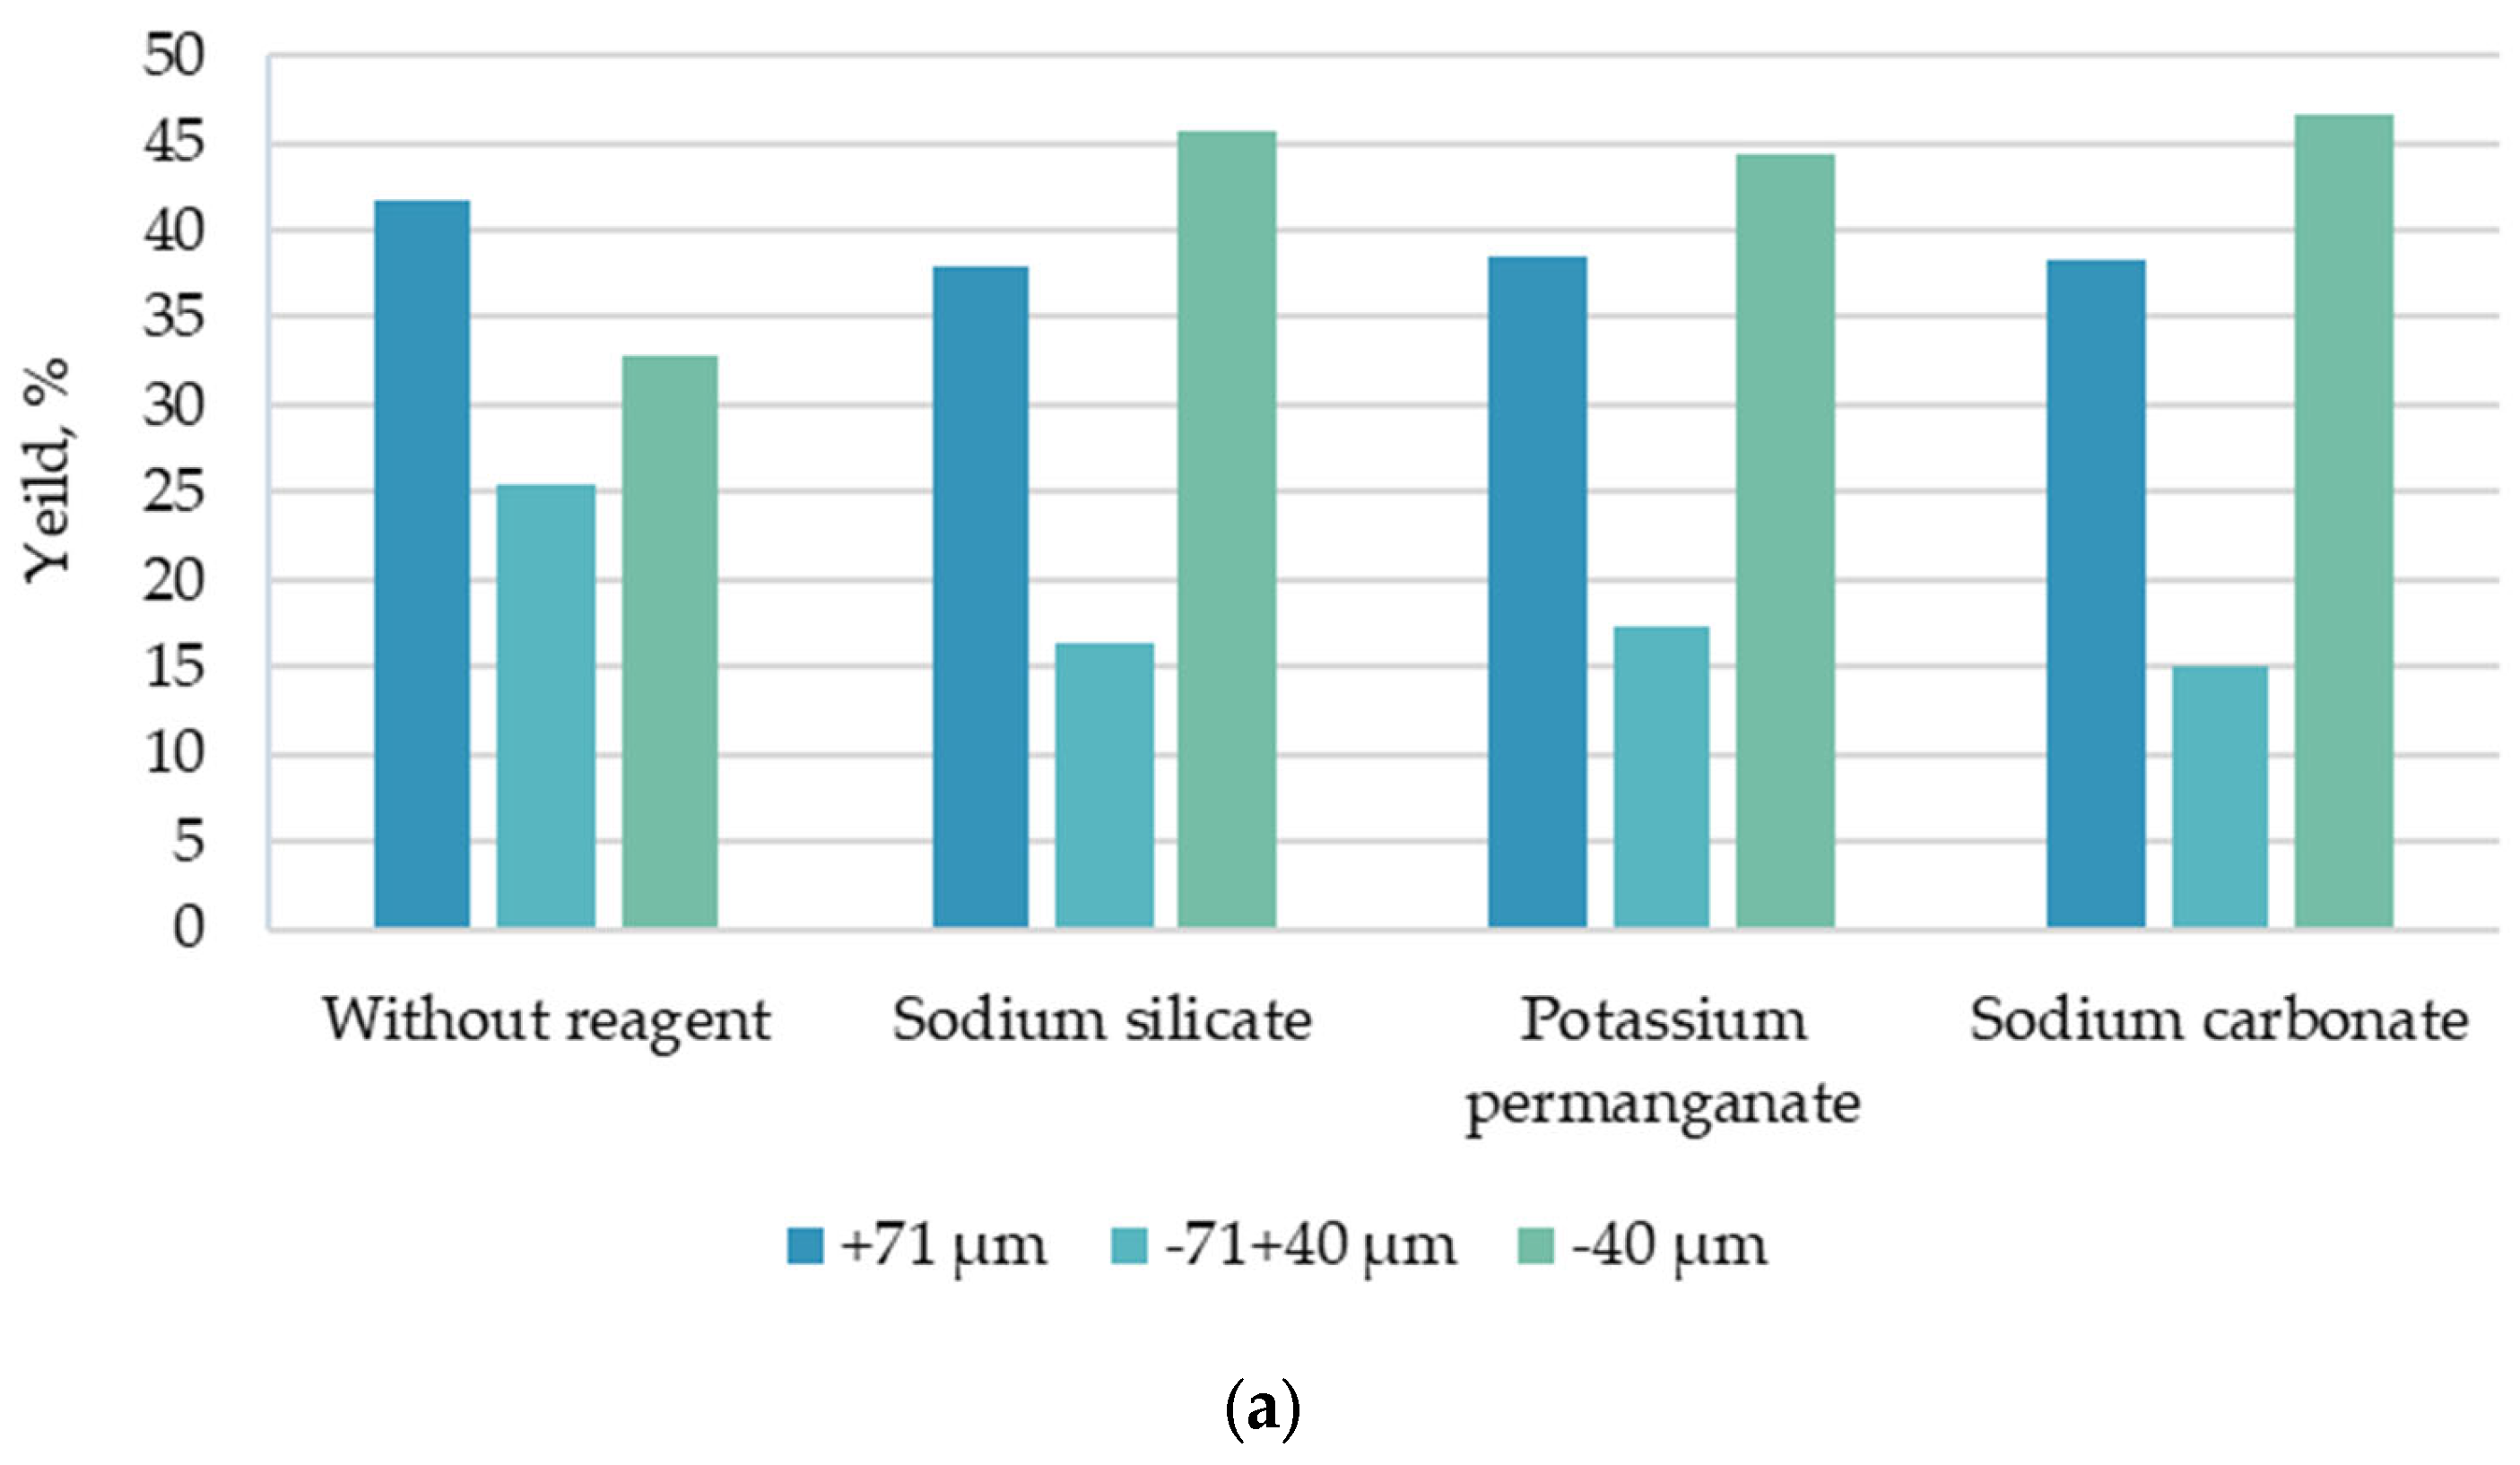
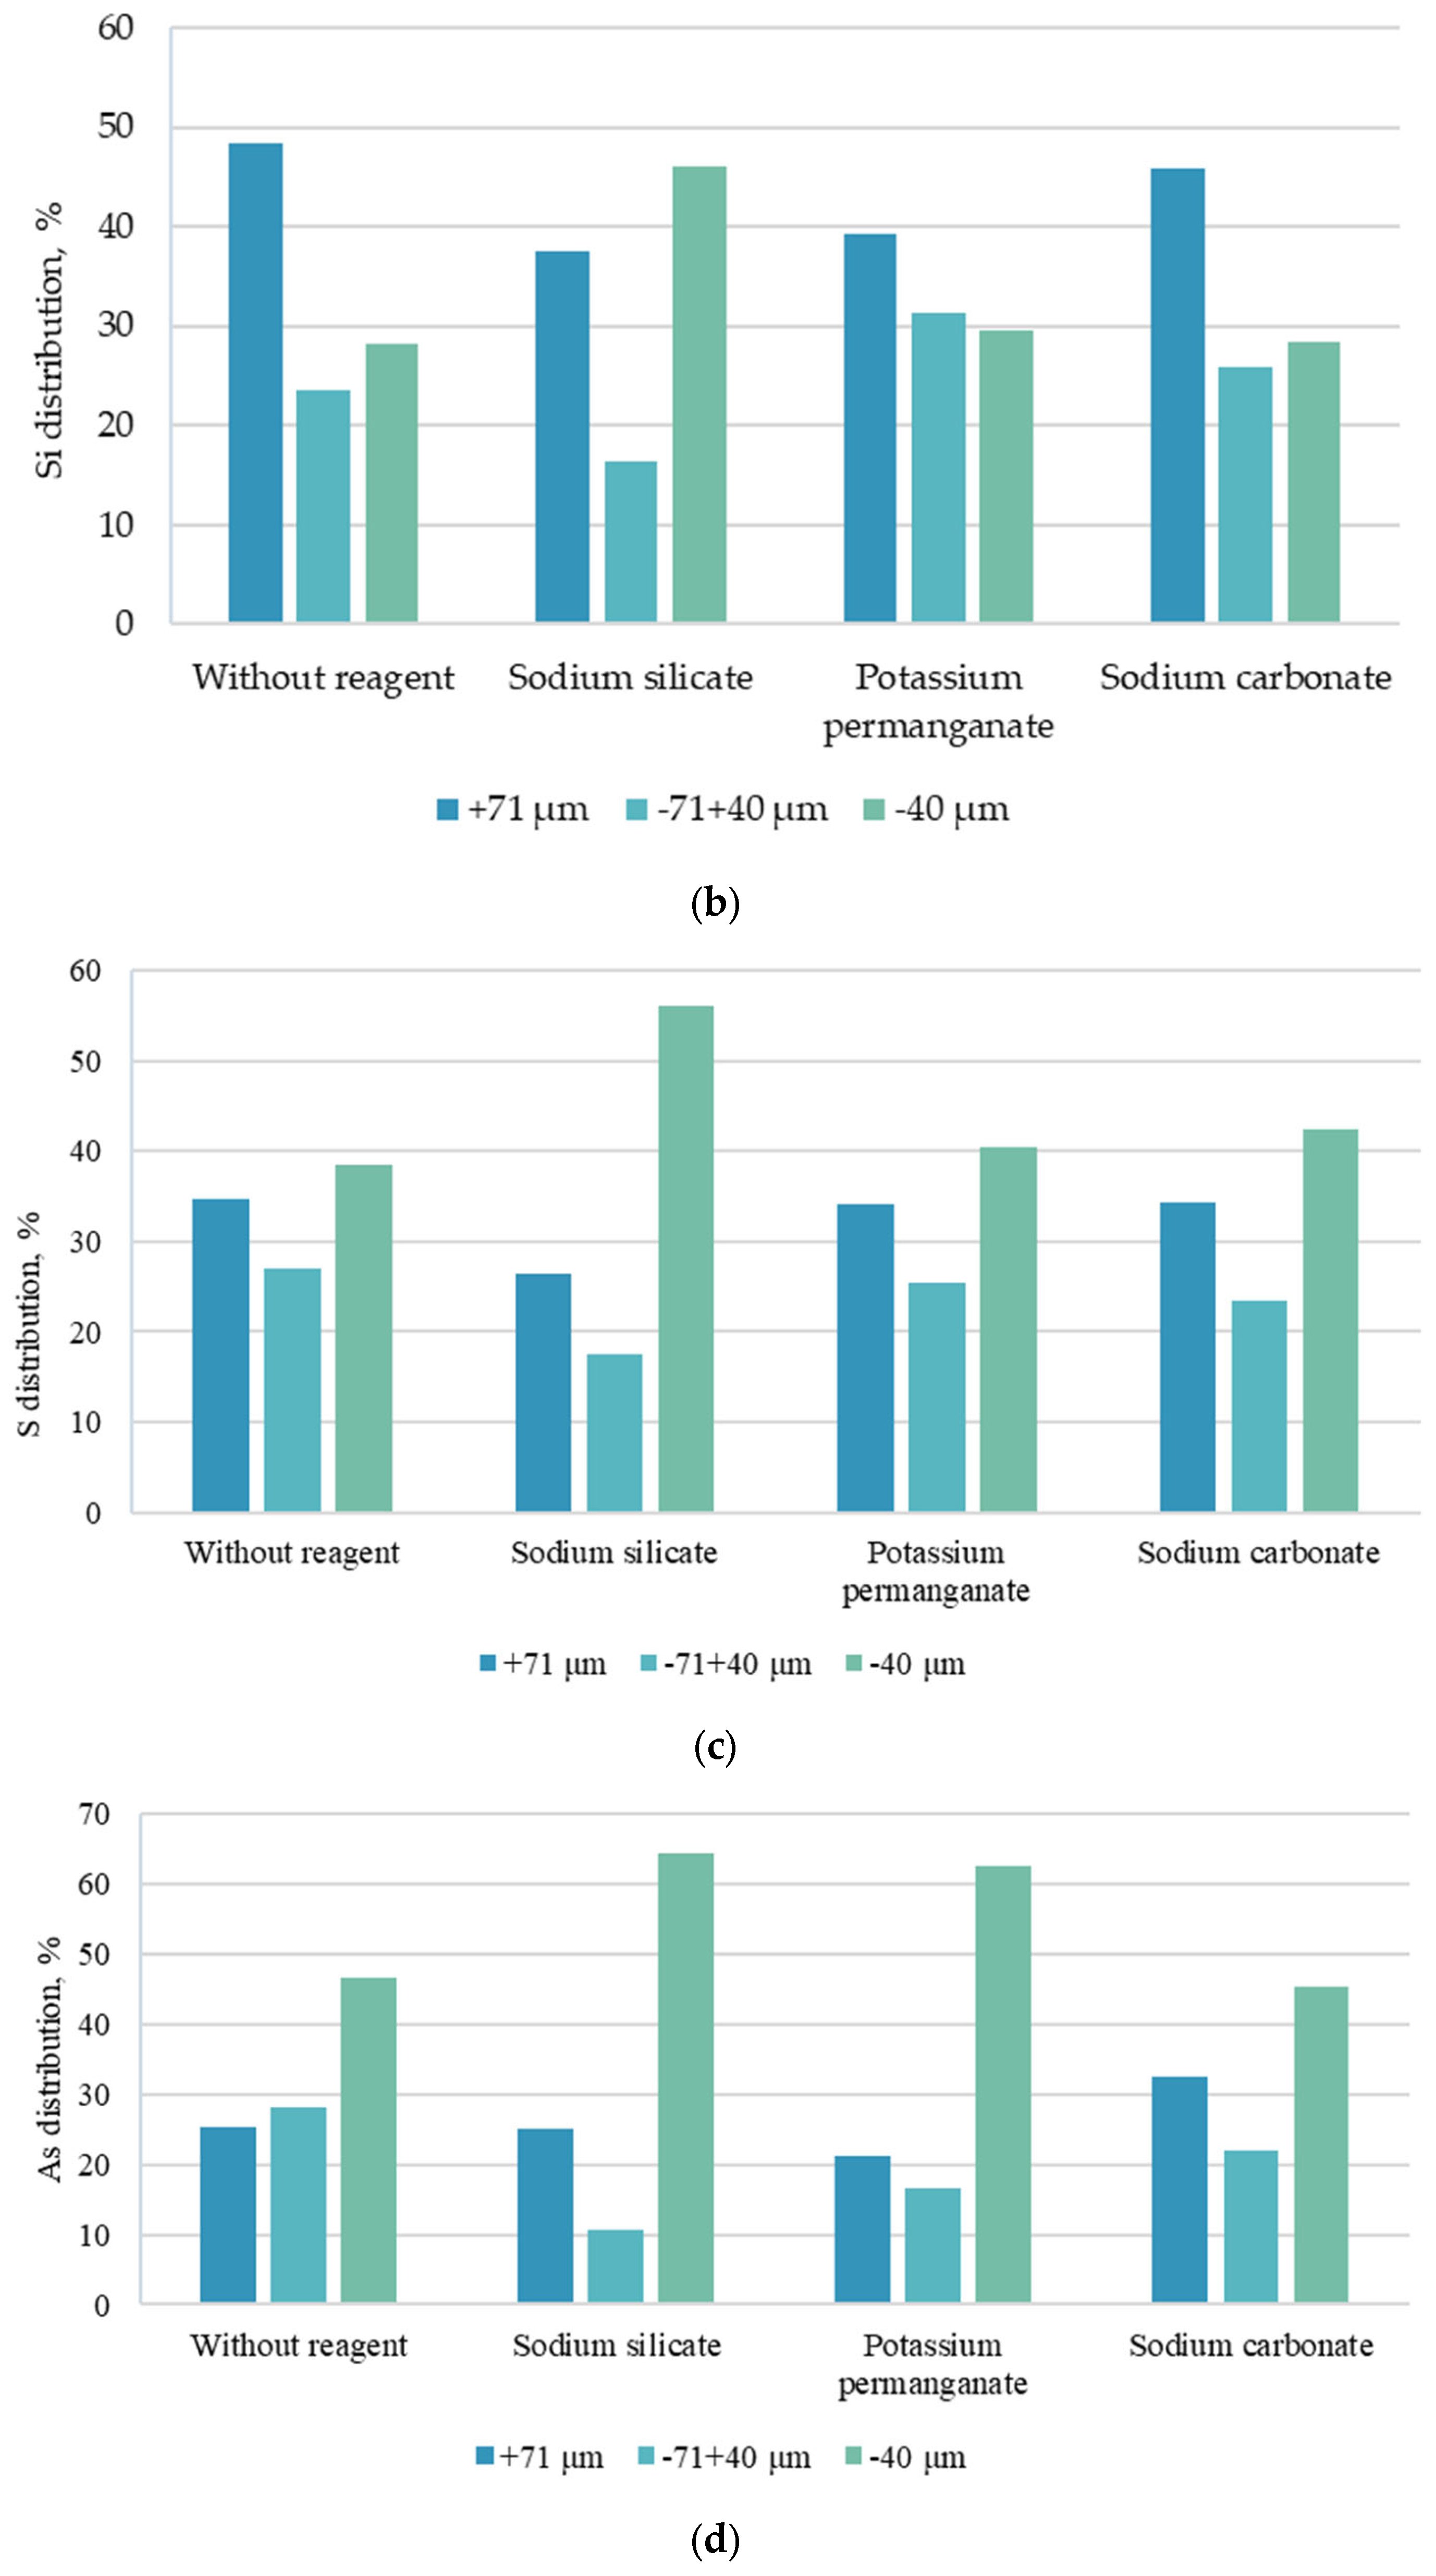
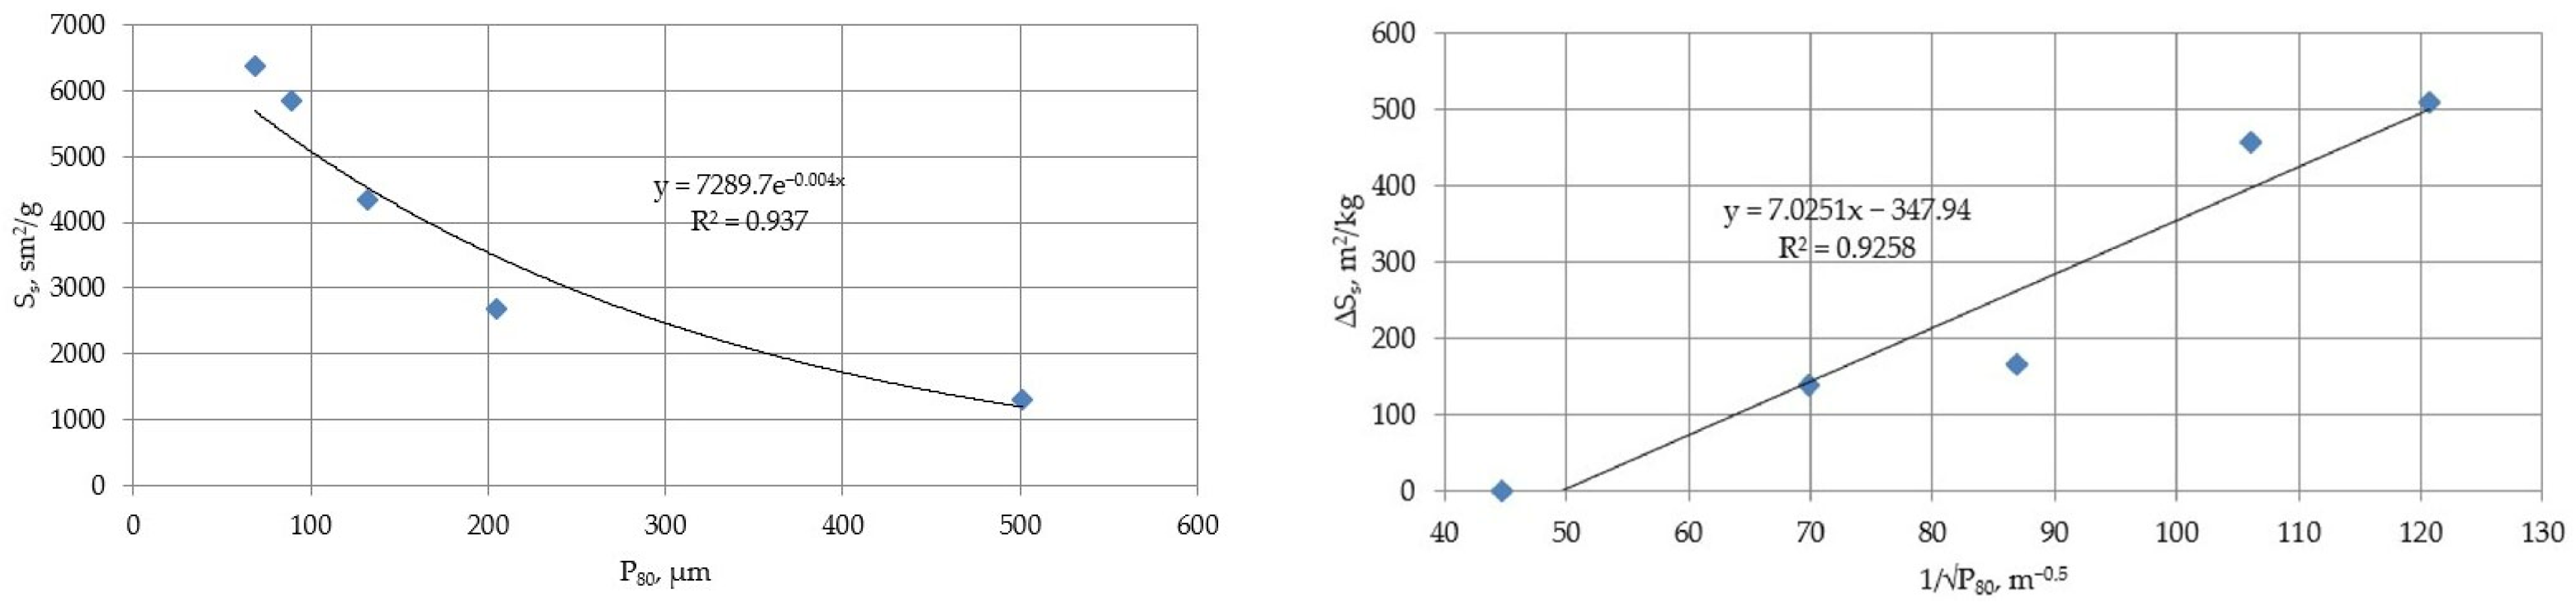
3.1. Studies to Substantiate the Energy Parameter of Fracture Efficiency and Assess the Effect of Intensifiers on the Grinding Process

To formulate a parameter of the efficiency of overcoming the energy barrier of internal traction forces, a generalized energy–size ratio was taken as the basis:
d E d l = k l n
where E—energy spent on grinding of a certain mass of material, J/kg; l—grain size, (m); k—empirical coefficient of proportionality, characterizing the durability of the material; and its dimensionality depends on the value of the exponent n. When n = 1, the ratio is an expression of the Kirpitchev–Kick law; when n = 1.5, the ratio is an expression of the law of F. Bond; and when n = 2, the ratio is an expression of the law of P. Rittinger [27].
By integrating the expression (5) for the case n ≠ 1 in limits from l i —finite particle size, m, to l 0 —values of the initial particle size, m, we obtain the following:
E = k n 1 1 l i n 1 1 l 0 n 1
Based on the Gibbs–Helmholtz equation for the surface free energy, the increase in the formed surface will be proportional to the energy expended for the destruction of a certain mass of material [28]. The energies expended to reduce the coarseness and form a new surface are equivalent:
σ Δ S i = k n 1 1 l i n 1 1 l 0 n 1
where σ —the value of specific surface free energy, (J/m2); Δ S —the increase in specific surface area; m2/kg.
Let us introduce K σ = k/σ, the parameter of the energy barrier overcoming of the internal bonding forces’ efficiency during the fracture of mineral aggregates. This relationship relates the specific free surface energy of minerals (σ) to the empirical material fracture resistance coefficient (k). The dimensionality of the index at n = 2 in the SI system is [m2.5/kg]. From the point of view of evaluating the effect of intensifying grinding methods, the higher the value of this coefficient, the more effective the effect of the method. For the case of ball milling, we can take n = 1.5 according to F. Bond’s law. Substituting the parameter P80 instead of l, we obtain the expression for K σ :
K σ = 0.5 Δ S i 1 P 80 i 1 P 80 0
Using the proposed parameter, it is possible to quantitatively estimate different methods of grinding process intensification while maximizing the yield of the control class.
In order to confirm the possibility of using this parameter to assess the efficiency of comminution under real grinding conditions, experimental studies were carried out. The results of the analysis of the distribution of the main components in the initial sample by sieve classes are shown in Figure 4.
Based on the analysis of the obtained data, it was found that the highest values of component distribution are in the −125 + 71 μm class, which is also characterized by the highest yield value. This is probably because of the presence of the richest clusters of sulfide minerals in this class. The second class with the highest values of silicon and sulfur distribution is the +800 μm class, which is probably associated with the high content of closed aggregates.
Based on previous studies, it was found that the sample is characterized by high hardness, so it was established that the required time for grinding is 30 minutes [34]. Graphical interpretation of particle size distribution and distribution of components into particle size classes depending on the size of the grinded product is shown in Figure 5.
On the basis of data analysis (Figure 5), it was found that the highest values of partial distributions of components associated with sulfide minerals, with the parameter P80 value being less than 132.29 μm, correspond to the class −40 μm. For the product with P80 = 205.04 μm, the maximum values of sulfur and arsenic distributions correspond to classes −125 + 71 μm and −250 + 125 μm, respectively. Such redistribution of components is probably related to the peculiarities of sulfide minerals and the host rock minerals’ liberation.
Optical and microscopic investigations of grinded products were carried out to analyze changes in geometric characteristics of sulfide mineral inclusions. Graphic interpretation of the obtained results is shown in Figure 6.
In Figure 6, there are clearly expressed peaks of grain size of −20 + 10 μm at the value of parameter P80 = 205.04 μm. This grain size class of sulfide minerals is dominant by the relative content in all product size classes. For values P80 = 132.29 μm and 88.89 μm, there are also peaks of sulfide mineral grains of the size class −20 + 10 μm. The highest relative grain content is characteristic of the −40 μm class. At P80 = 68.58 μm, there is no clearly expressed peak, and there is a gradual increase in the sulfide mineral grain content up to its maximum at −20 + 10 μm. When grinding the sample from the value of P80 = 205.04 μm to 132.29 μm, an increase in the absolute content of −70 + 60 μm grains was observed. When grinding the sample from the value of P80 = 132.29 μm to 88.89 μm, an increase in the absolute content of grains of adjacent grain size classes was observed: −60 + 50 μm and −80 + 70 μm.
Redistribution of −20 + 10 μm grains at P80 = 132.29 μm between sample size classes and a significant decrease in the relative grain content in the size classes above 40 μm is probably associated with the large mineral aggregates’ destruction and liberation of ore minerals at this size. The peak of absolute content of ore mineral grains of −70 + 60 μm in the size class is possibly connected to the increase in the share of sulfide grains in the size class −71 + 40 μm. Subsequent grinding leads to an increase in the content of −10 μm grains and their redistribution into the general size class of the −40 μm sample, which is probably due to the grinding of already revealed sulfide minerals.
The maximum values of absolute grain sizes of −20 + 10 μm and their high relative content for all size classes of the sample are probably due to the fact that this size coincides with the prevailing size of ore minerals’ dissemination. The smaller peaks of absolute sulfide mineral grain contents of −70 + 60 μm and −120 + 110 μm in size with a subsequent decrease in the value of their excesses during milling confirm the conclusion about the dissolution of ore minerals’ large aggregates and their lower grinding rate, which leads to their accumulation in the above classes. Further transition of ore minerals into fine size classes with the destruction of large aggregates is undesirable, as it will have a negative effect on further enrichment operations.
Thus, the value of P80 = 132.29 μm, which corresponds to the yield of the −71 μm class = 58.35%, was accepted for further research. Under grinding conditions, which allowed to achieve the given coarseness, a series of experiments to study the effect of grinding intensifiers on the redistribution of components by size classes and change in the specific surface were carried out.
Interpretation of the analysis of components’ distribution by size classes in the grinding products when using different intensifier results is shown in Figure 7.
The analysis of the data presented in Figure 6 shows that the sodium silicate application resulted in the growth of the −40 μm class, which was 12.77% compared with the grinding without reagents. The application of sodium silicate resulted in the largest increases in sulfur and arsenic of 17.96%, 17.72%, and 17.68% in the −40 μm class. When sodium carbonate was used, the increase in the −40 μm class was 13.76% as compared with milling without the use of reagents. The increments of distribution values in the −40 μm class of silicon, sulfur, and arsenic were 0.16%, 3.95%, and 6.83%, respectively. The application of potassium permanganate resulted in an increase in the −40 μm class of 11.40% compared with the milling without the reagents. The increments in distribution values of silicon, sulfur, and arsenic in the −40 μm class were 1.34%, 2.01%, and 15.86%, respectively.
To determine the Kσ value, a series of experimental measurements of the specific surface area for grinding products of different particle sizes were carried out. The Kσ value was determined as a value of the angular coefficient of the straight line constructed with coordinates 1/√P80, ΔSs. Graphical interpretation of the obtained results is shown in Figure 8.
Based on the analysis of the data obtained, K σ = 3.513 m2.5/kg. The calculation of K σ for cases of application of unstrengthening reagents during grinding was carried out according to Formula (8). The results of the calculations are summarized in Table 2.
Based on the data analysis in the table, it was found that the highest value of Kσ corresponds to grinding with the use of sodium silicate. The increase in the parameter was 1.663 m2.5/kg. When potassium permanganate and sodium carbonate were used, an increase in the value of the energy parameter, Kσ, was also recorded. However, the parameters increased by 0.217 m2.5/kg and 0.052 m2.5/kg, respectively.
For the comparative assessment of the applied intensification methods, the specific parameter Kσ can be used:
K σ = K σ i K σ 0 K σ 0
The zero value Kσ0 corresponds to the case of grinding without reagent.

3.2. Activation Energy Calculation for Crushed Ore and Flotation Concentrates as an Example

As a result of this research, the possibility of quantifying the activation energy on the example of comminuted ore and flotation concentrates was substantiated:
-
quantification of activation energy on comminuted ore;
-
quantifying the energy for flotation concentrates;
-
assessment of the application of impacts based on thermogravimetric analysis using the developed criterion.

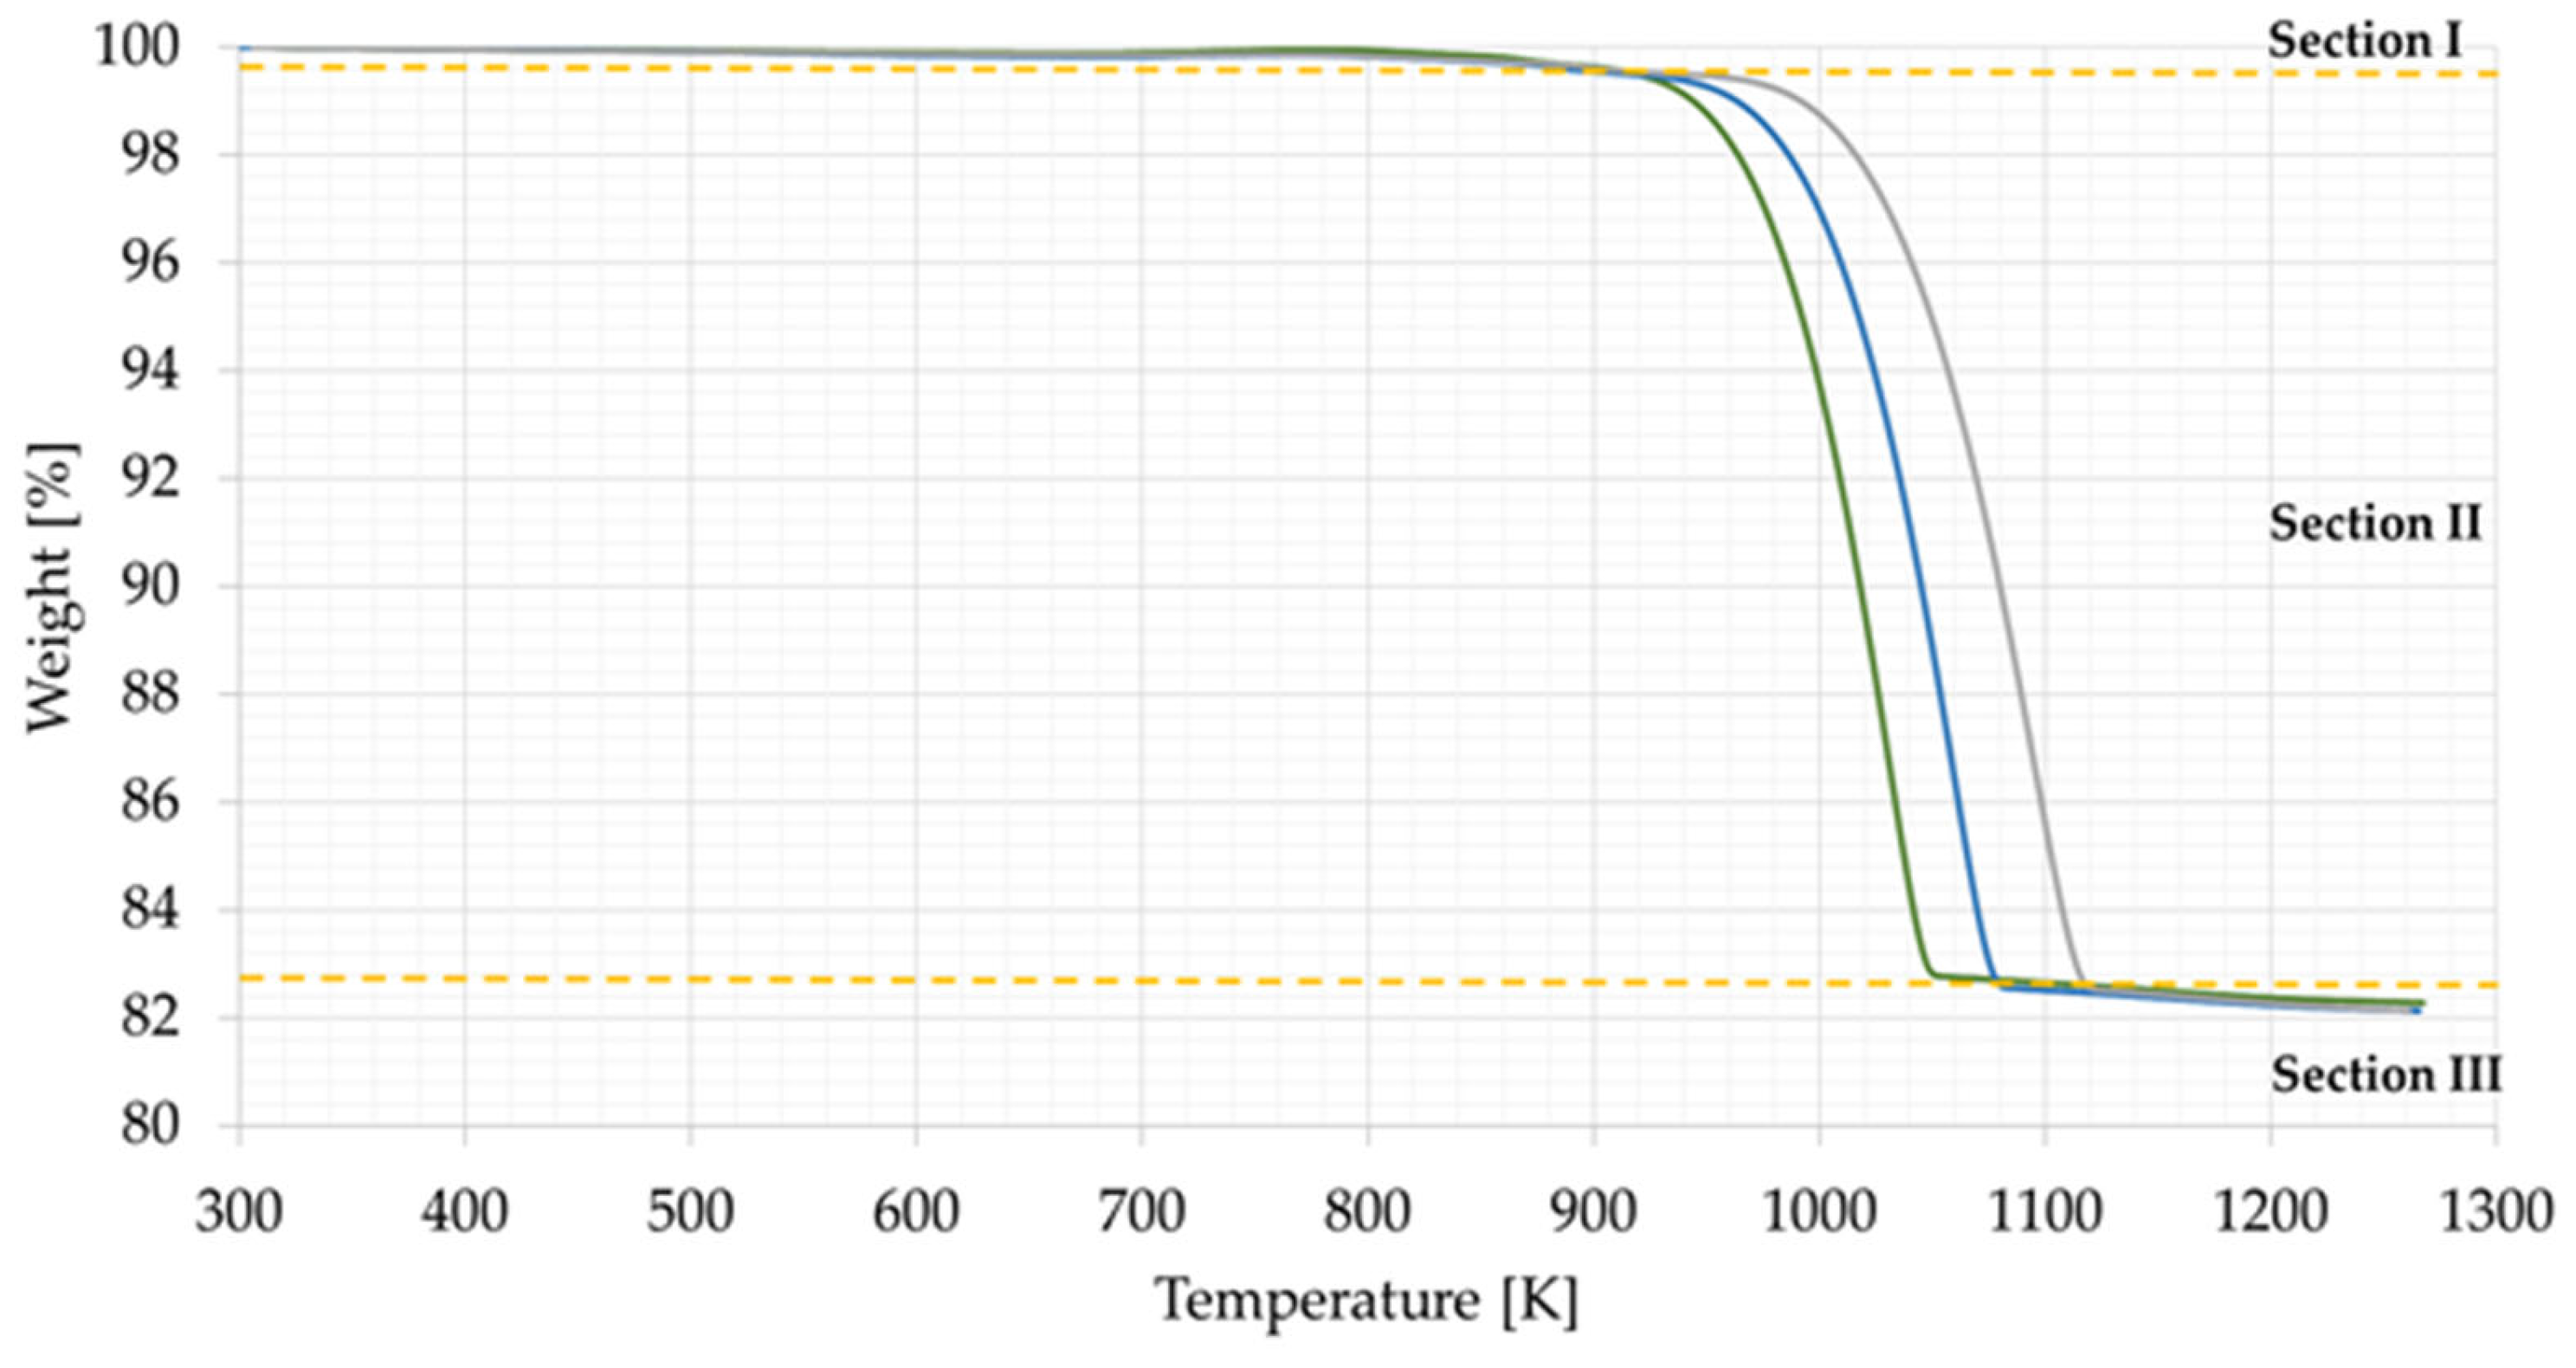
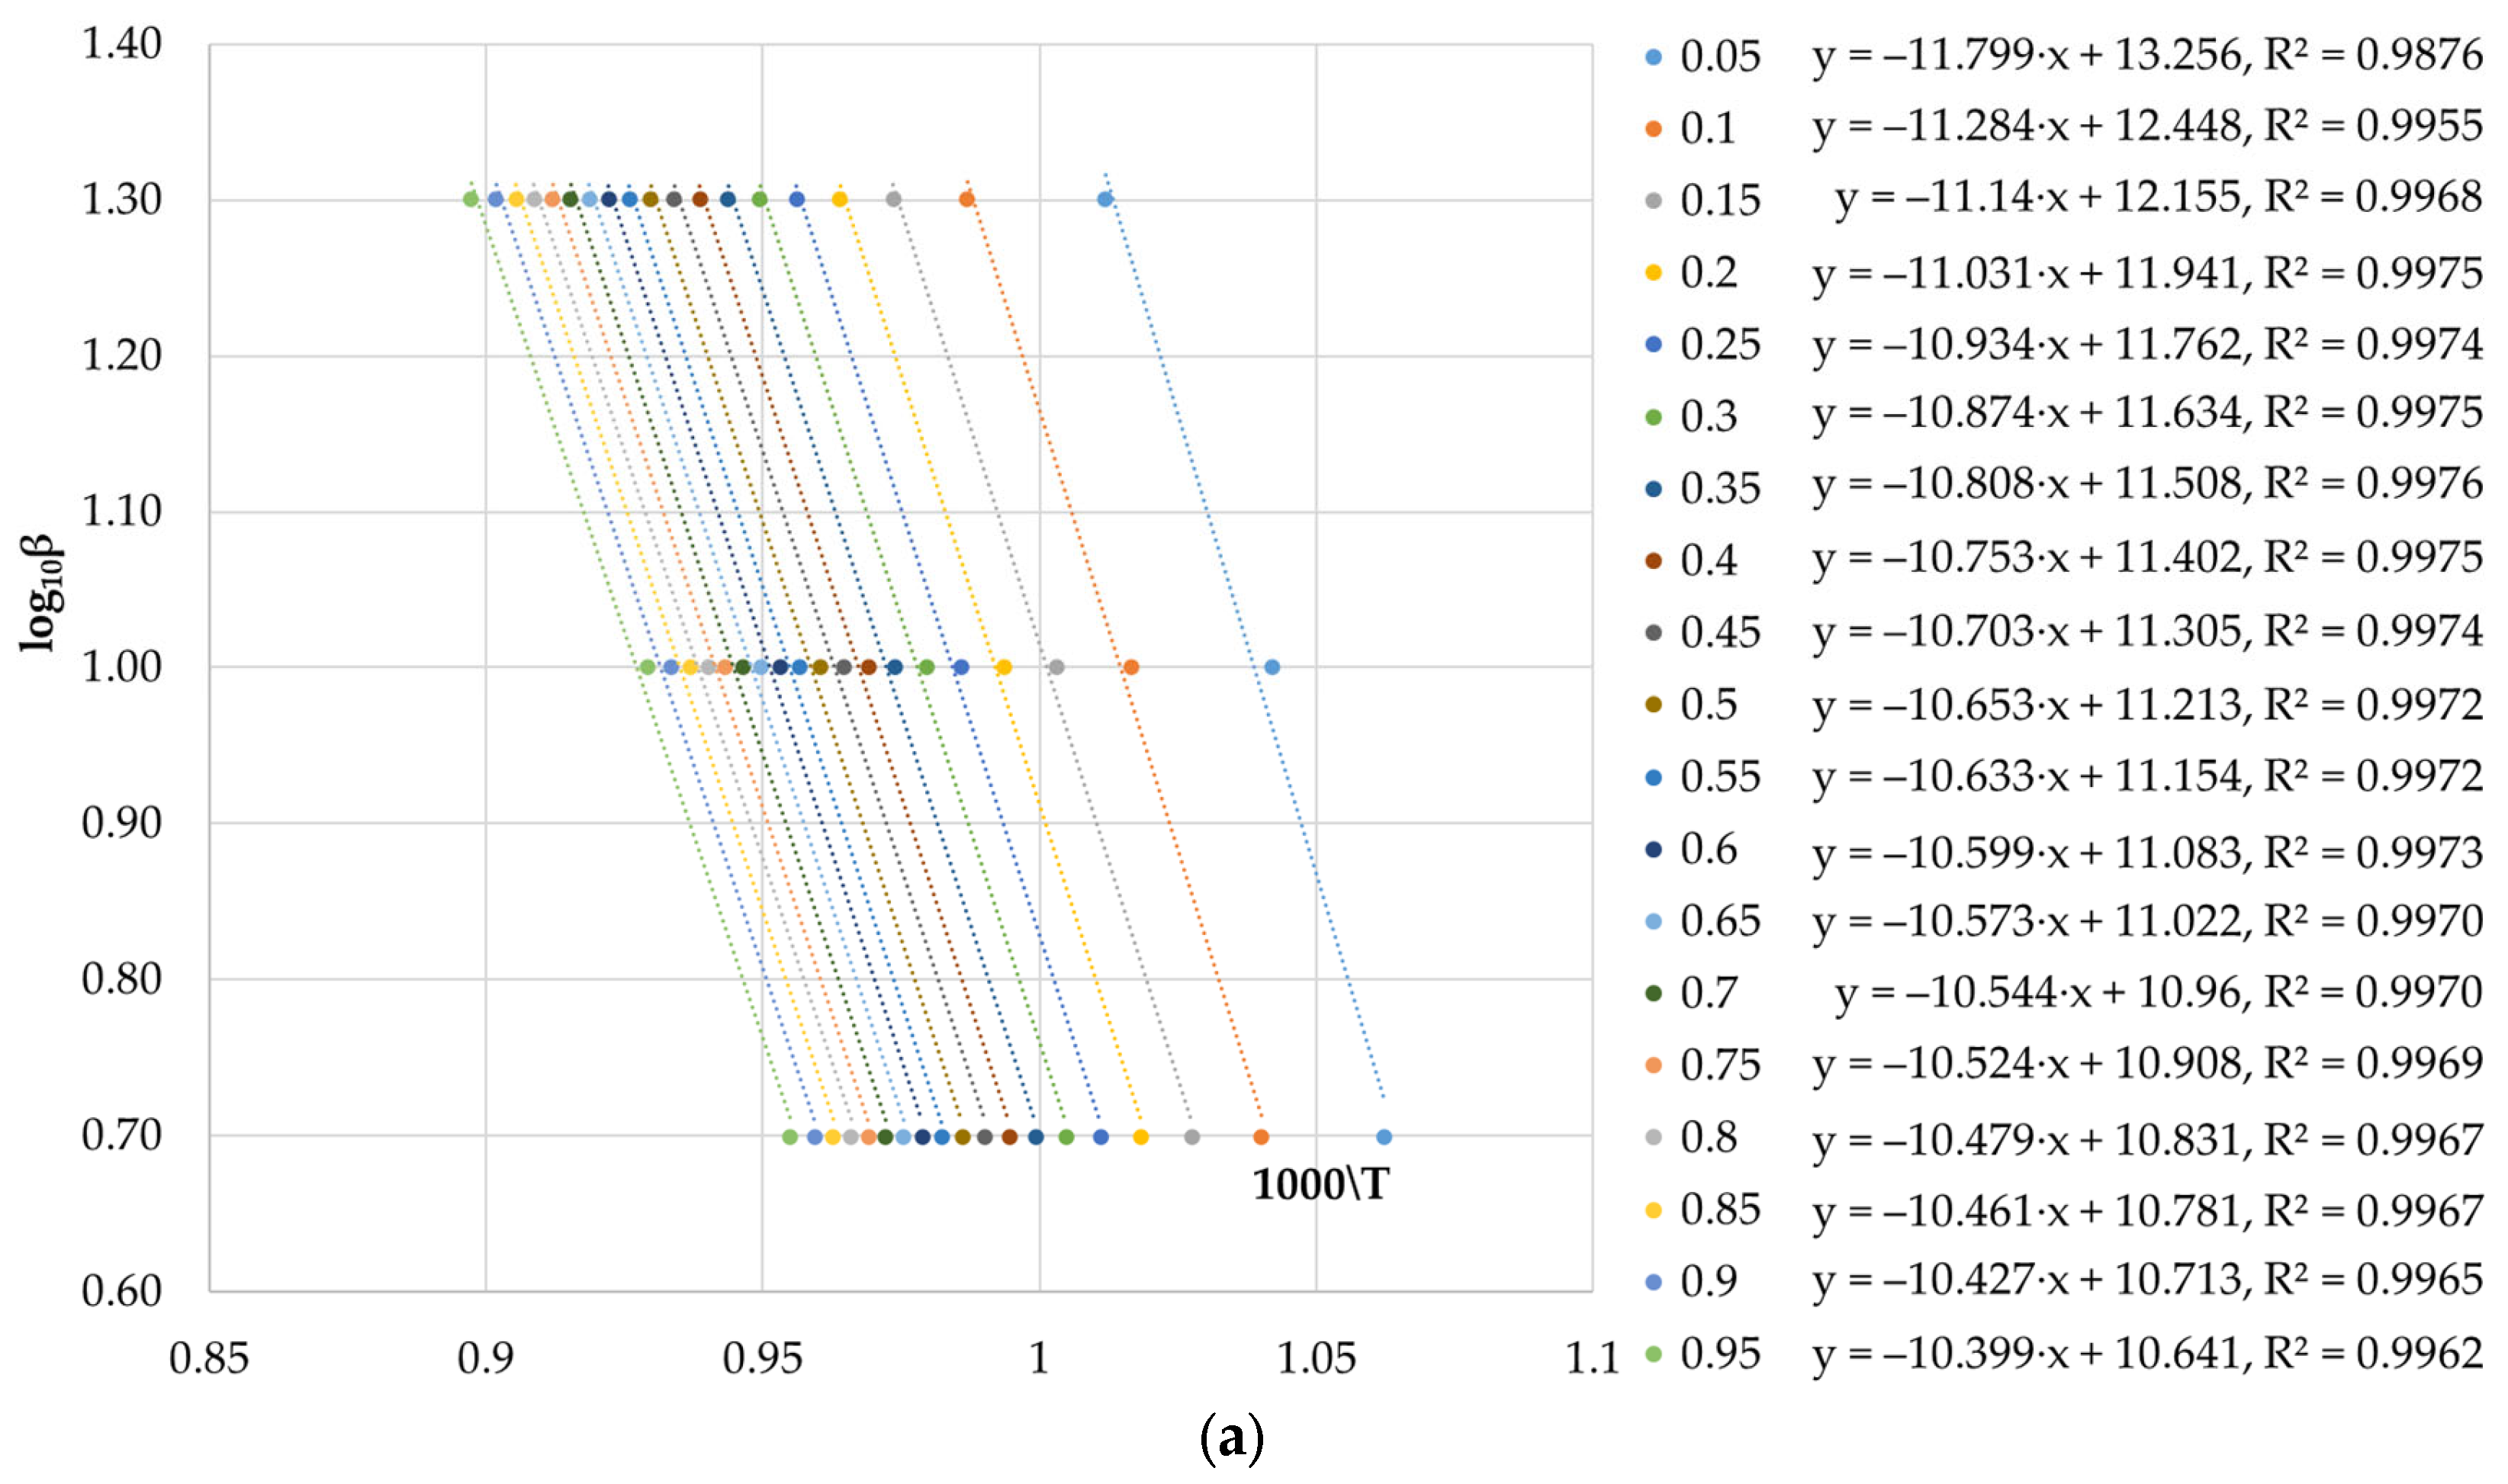
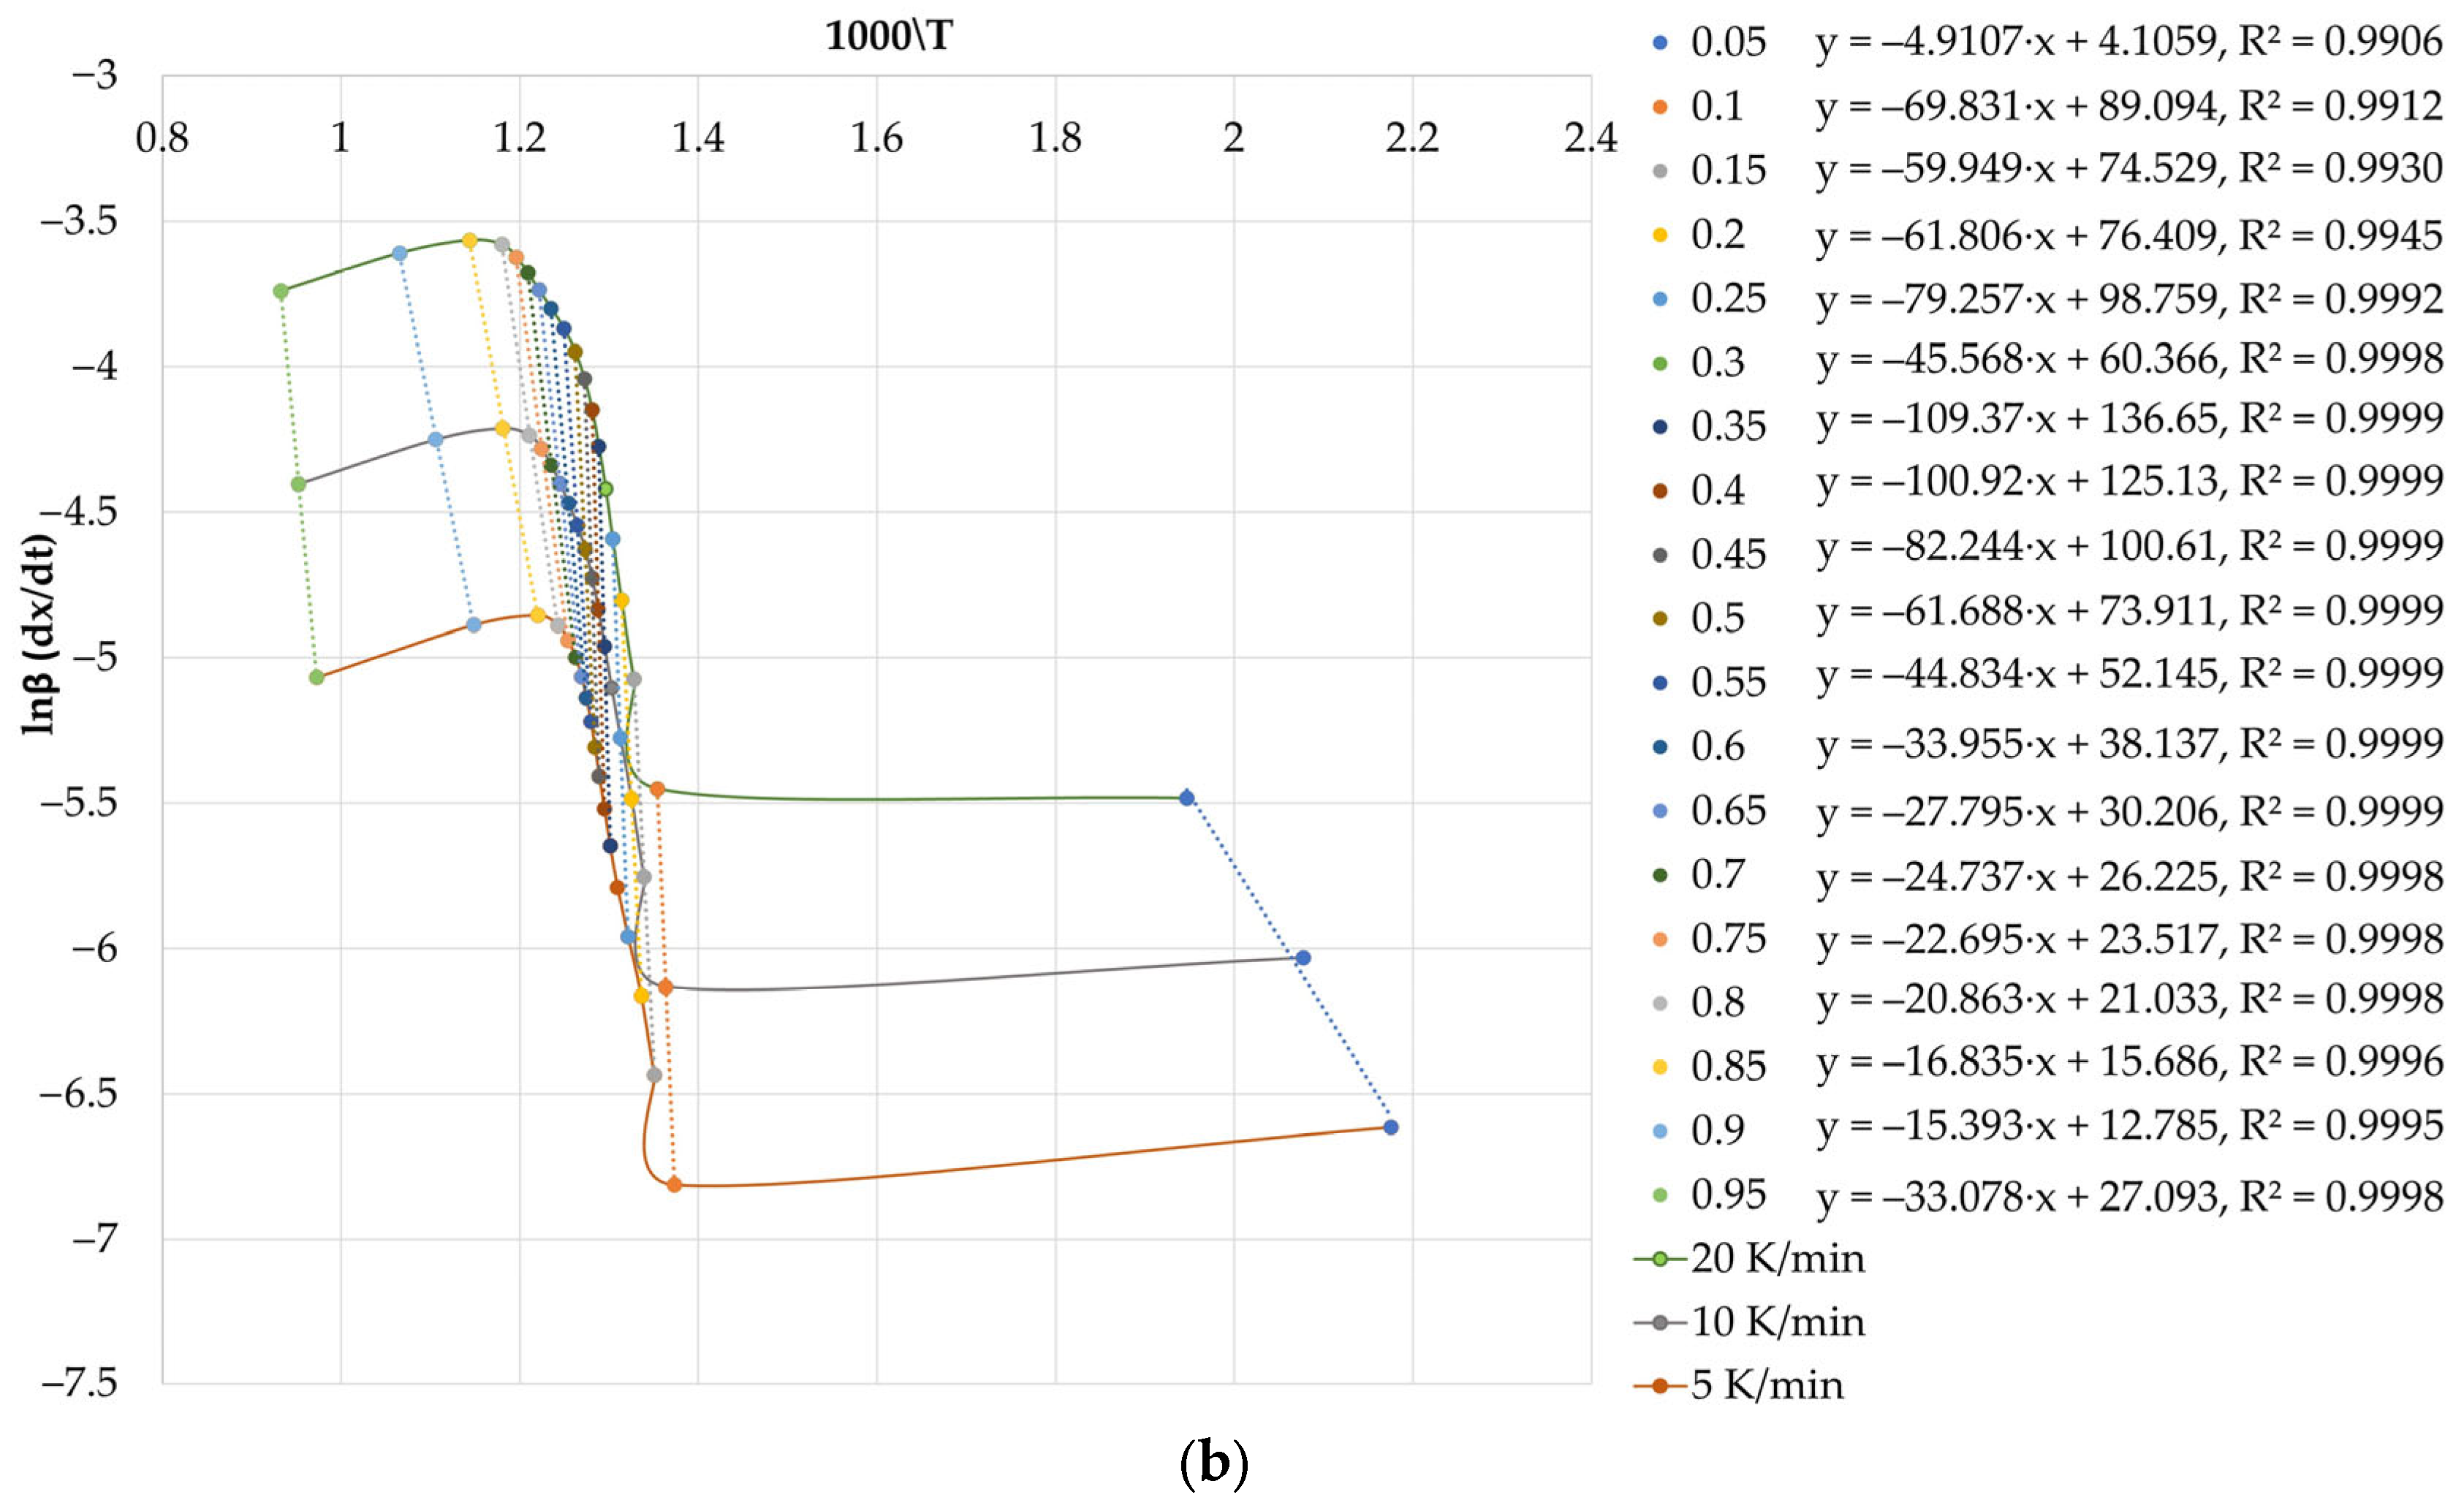
3.2.1. Quantification Based on Thermogravimetric Analysis by Calculating the Activation Energy on Comminuted Ore

A thermogravimetric analysis was carried out on comminuted carbonaceous ore samples at three heating rates (5, 10, and 20 K/min). The results are shown in Figure 9.
The analysis of the data presented in Figure 1 shows that, for these samples, three weight-loss sections are observed for the 5 K/min heating rate: the first one—low mass loss (less than 1%) up to 934 K, the second one—intensive mass loss (about 16%) in the temperature range 934–1048 K, and the third one—low mass loss (less than 1%) above 1048 K. For heating rates of 10 K/min and 20 K/min, the boundary between the second and third region lies at 1076 K and 1115 K, respectively. The values of the degree of transformation are <0.05 for the first section, 0.05–0.95 for the second section, and >0.95 for the third section for all heating rates. The main mass loss occurs in section 2, for which the calculations of the activation energy were carried out.
Graphical data for calculating the activation energy using the Friedman method and the OFW method for conversion rates from 0.05 to 0.95 are shown in Figure 10.
The activation energy and the pre-exponential factor of the two methods were calculated from the dataset (Table 3).
Analysis of the data presented in Table 3 shows that, for the initial samples in section 2, where an intensive loss of mass occurs, the value of activation energy decreases with the increasing degree of conversion. The average value of activation energy for ground ore samples is 187.77 kJ/mol according to the Friedman method and 196.05 kJ/mol according to the OFW method. The discrepancy between the average values of activation energy calculated by the two methods as well as for the values of activation energy obtained at different degrees of conversion does not exceed 5%, which shows a high convergence of the results.

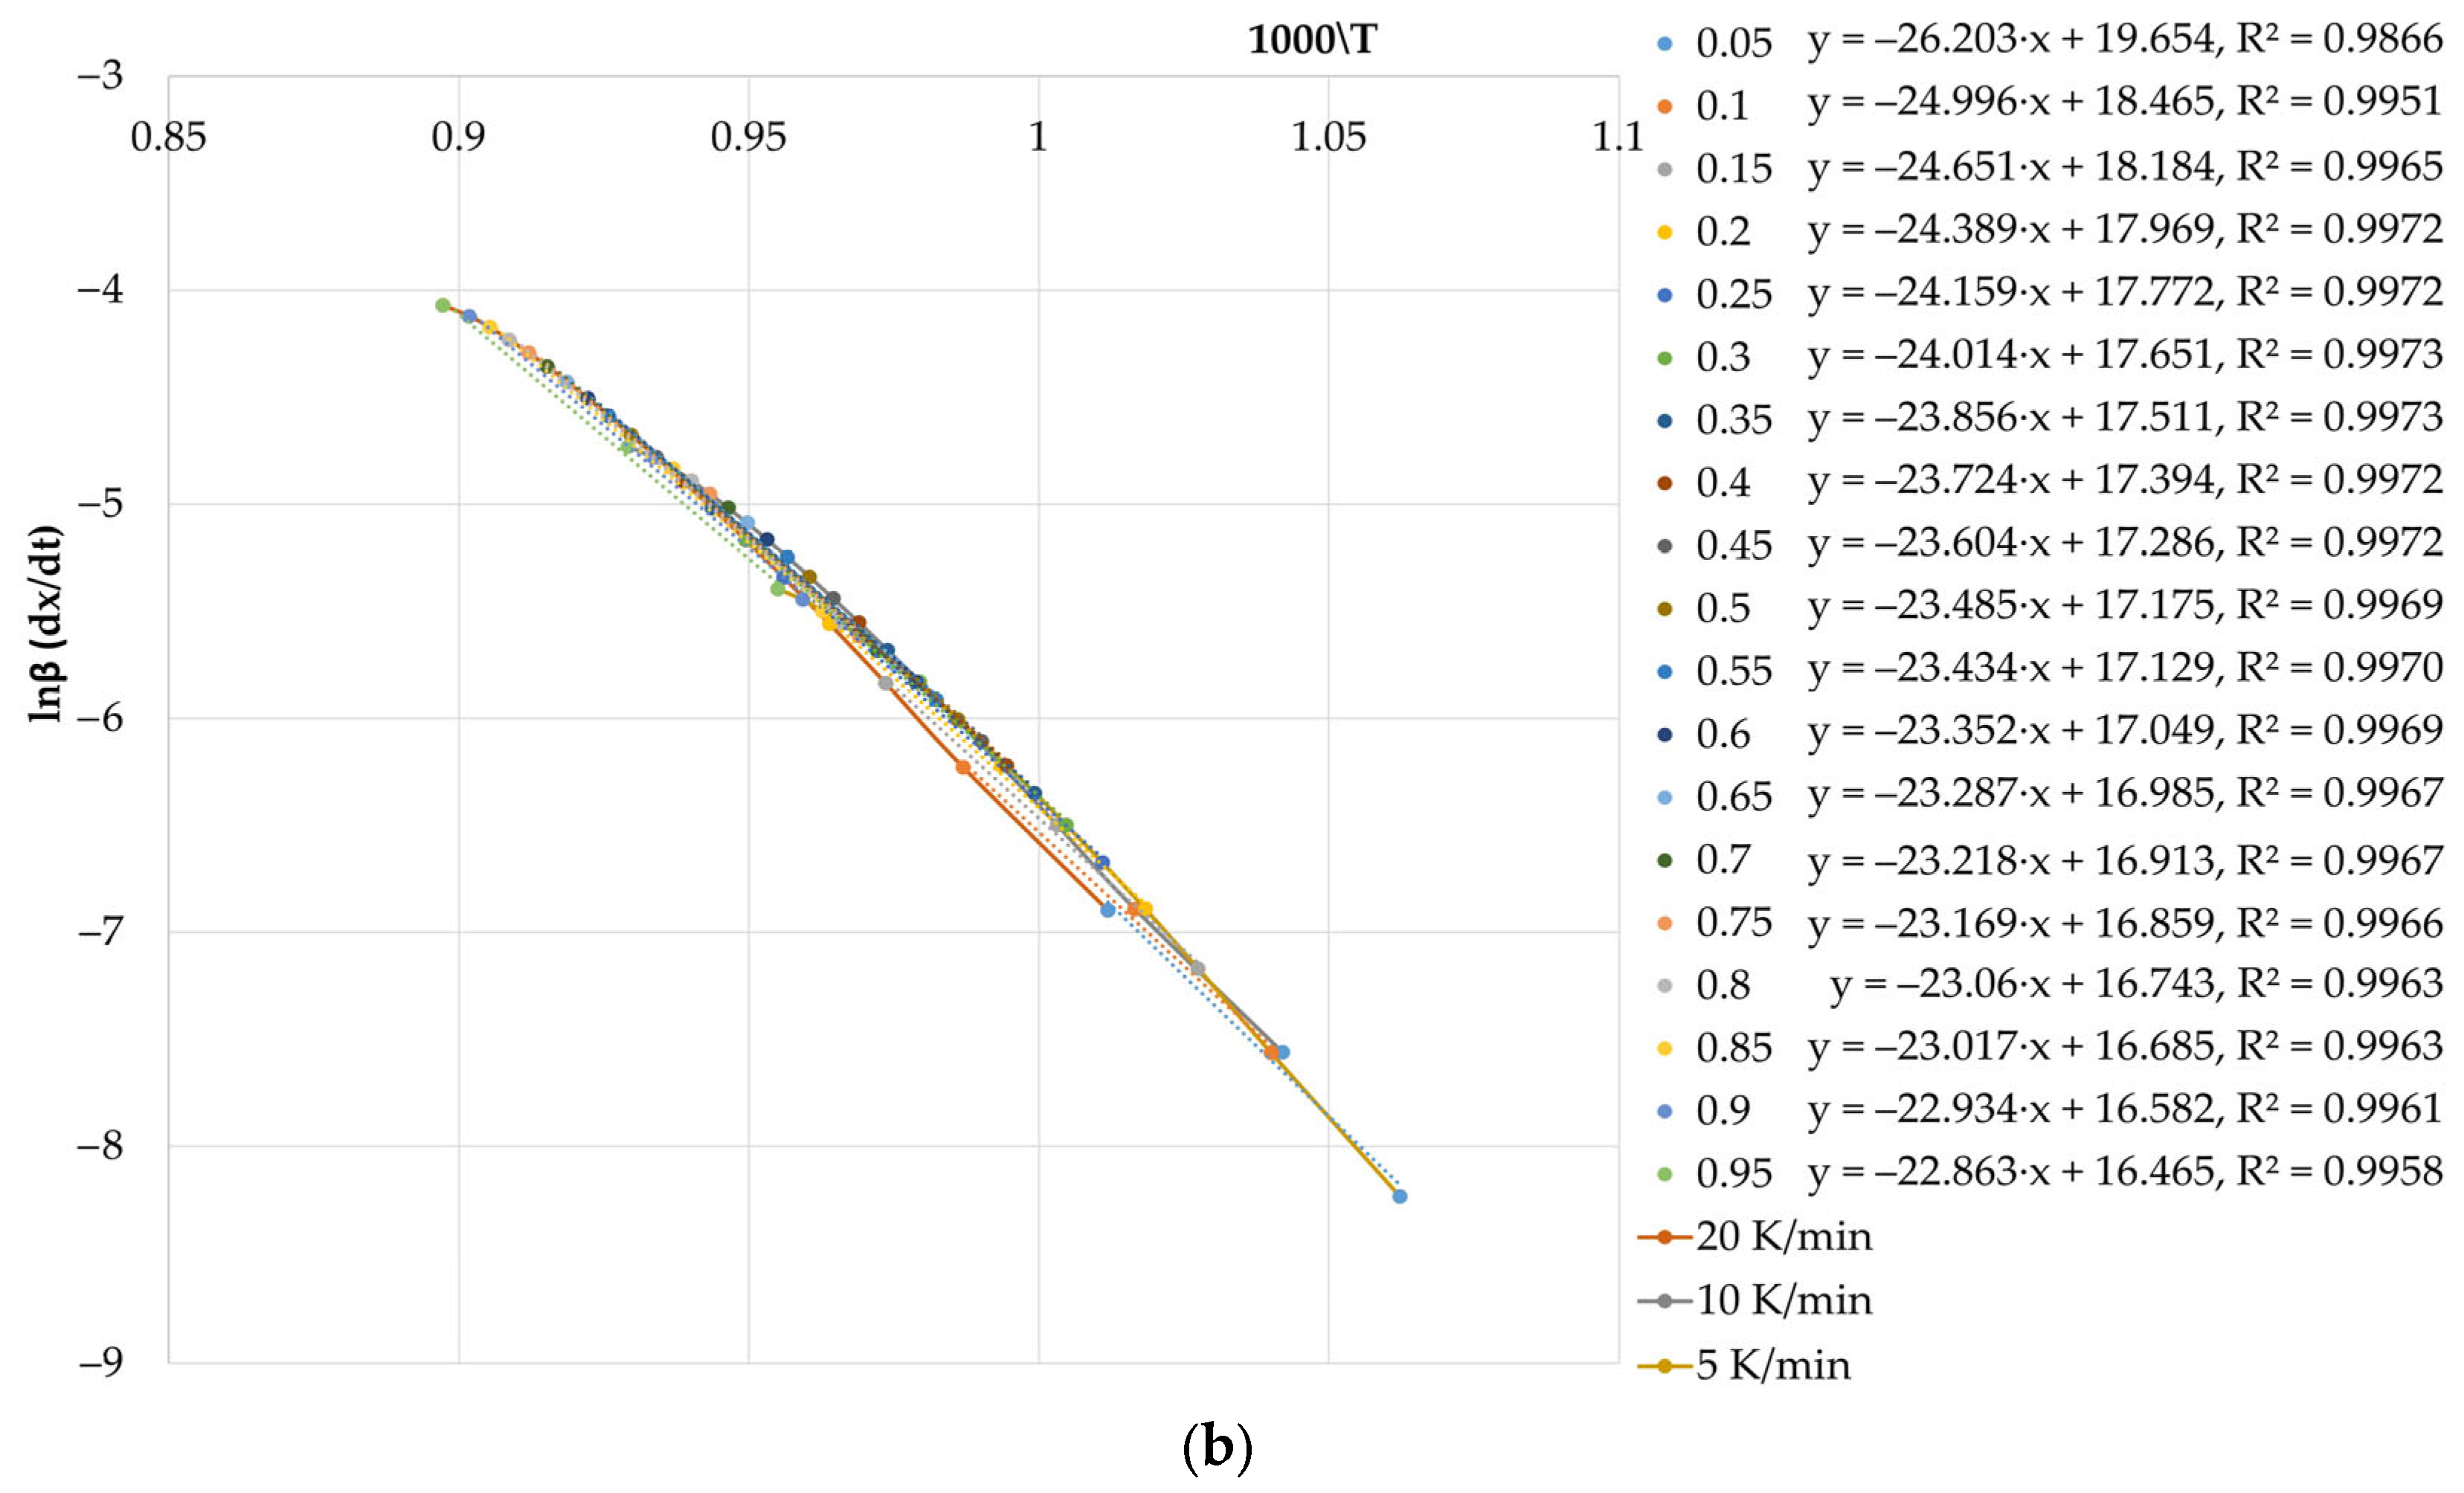
3.2.2. Quantification of the Application of Effects Based on Thermogravimetric Analysis by Calculating the Activation Energy using Sulphide Flotation Concentrates

Flotation concentrate samples were investigated using thermogravimetric analysis at three heating rates (5, 10, and 20 K/min). The results are shown in Figure 11.
The interpretation of the results in Figure 12 allows to determine that, for flotation concentrates, it is possible to divide a thermogravimetric curve into three areas: the first—low mass loss (less than 1% up to a temperature of 738 K); the second—intensive mass loss in a range of temperatures from 738 K to 820 K; and the third—low mass loss at temperatures over 820 K. The values of the degree of transformation are <0.10 for the first section, 0.10–0.70 for the second section, and ≥0.70 for the third section for all heating rates. The values of activation energy for the heating rates were calculated, and the graphical data for calculating the activation energy by the Friedman method and the OFW method for conversion degrees from 0.05 to 0.95 are presented in Figure 12.
The activation energy and the pre-exponential factor of the two methods were calculated from the dataset (Table 4).
The interpretation of the data obtained in Table 2 shows that the average value of the activation energy for section 2 was 559.83 kJ/mol using the OFW method and 550.17 kJ/mol using the Friedman method. For section 3, the average activation energy was 178.01 kJ/mol and 168.19 kJ/mol using the OFW method and the Friedman method, respectively.
The discrepancy between the average activation energies calculated by the two methods as well as for the activation energies calculated at different conversion rates does not exceed 5%, which shows a high convergence of the results.

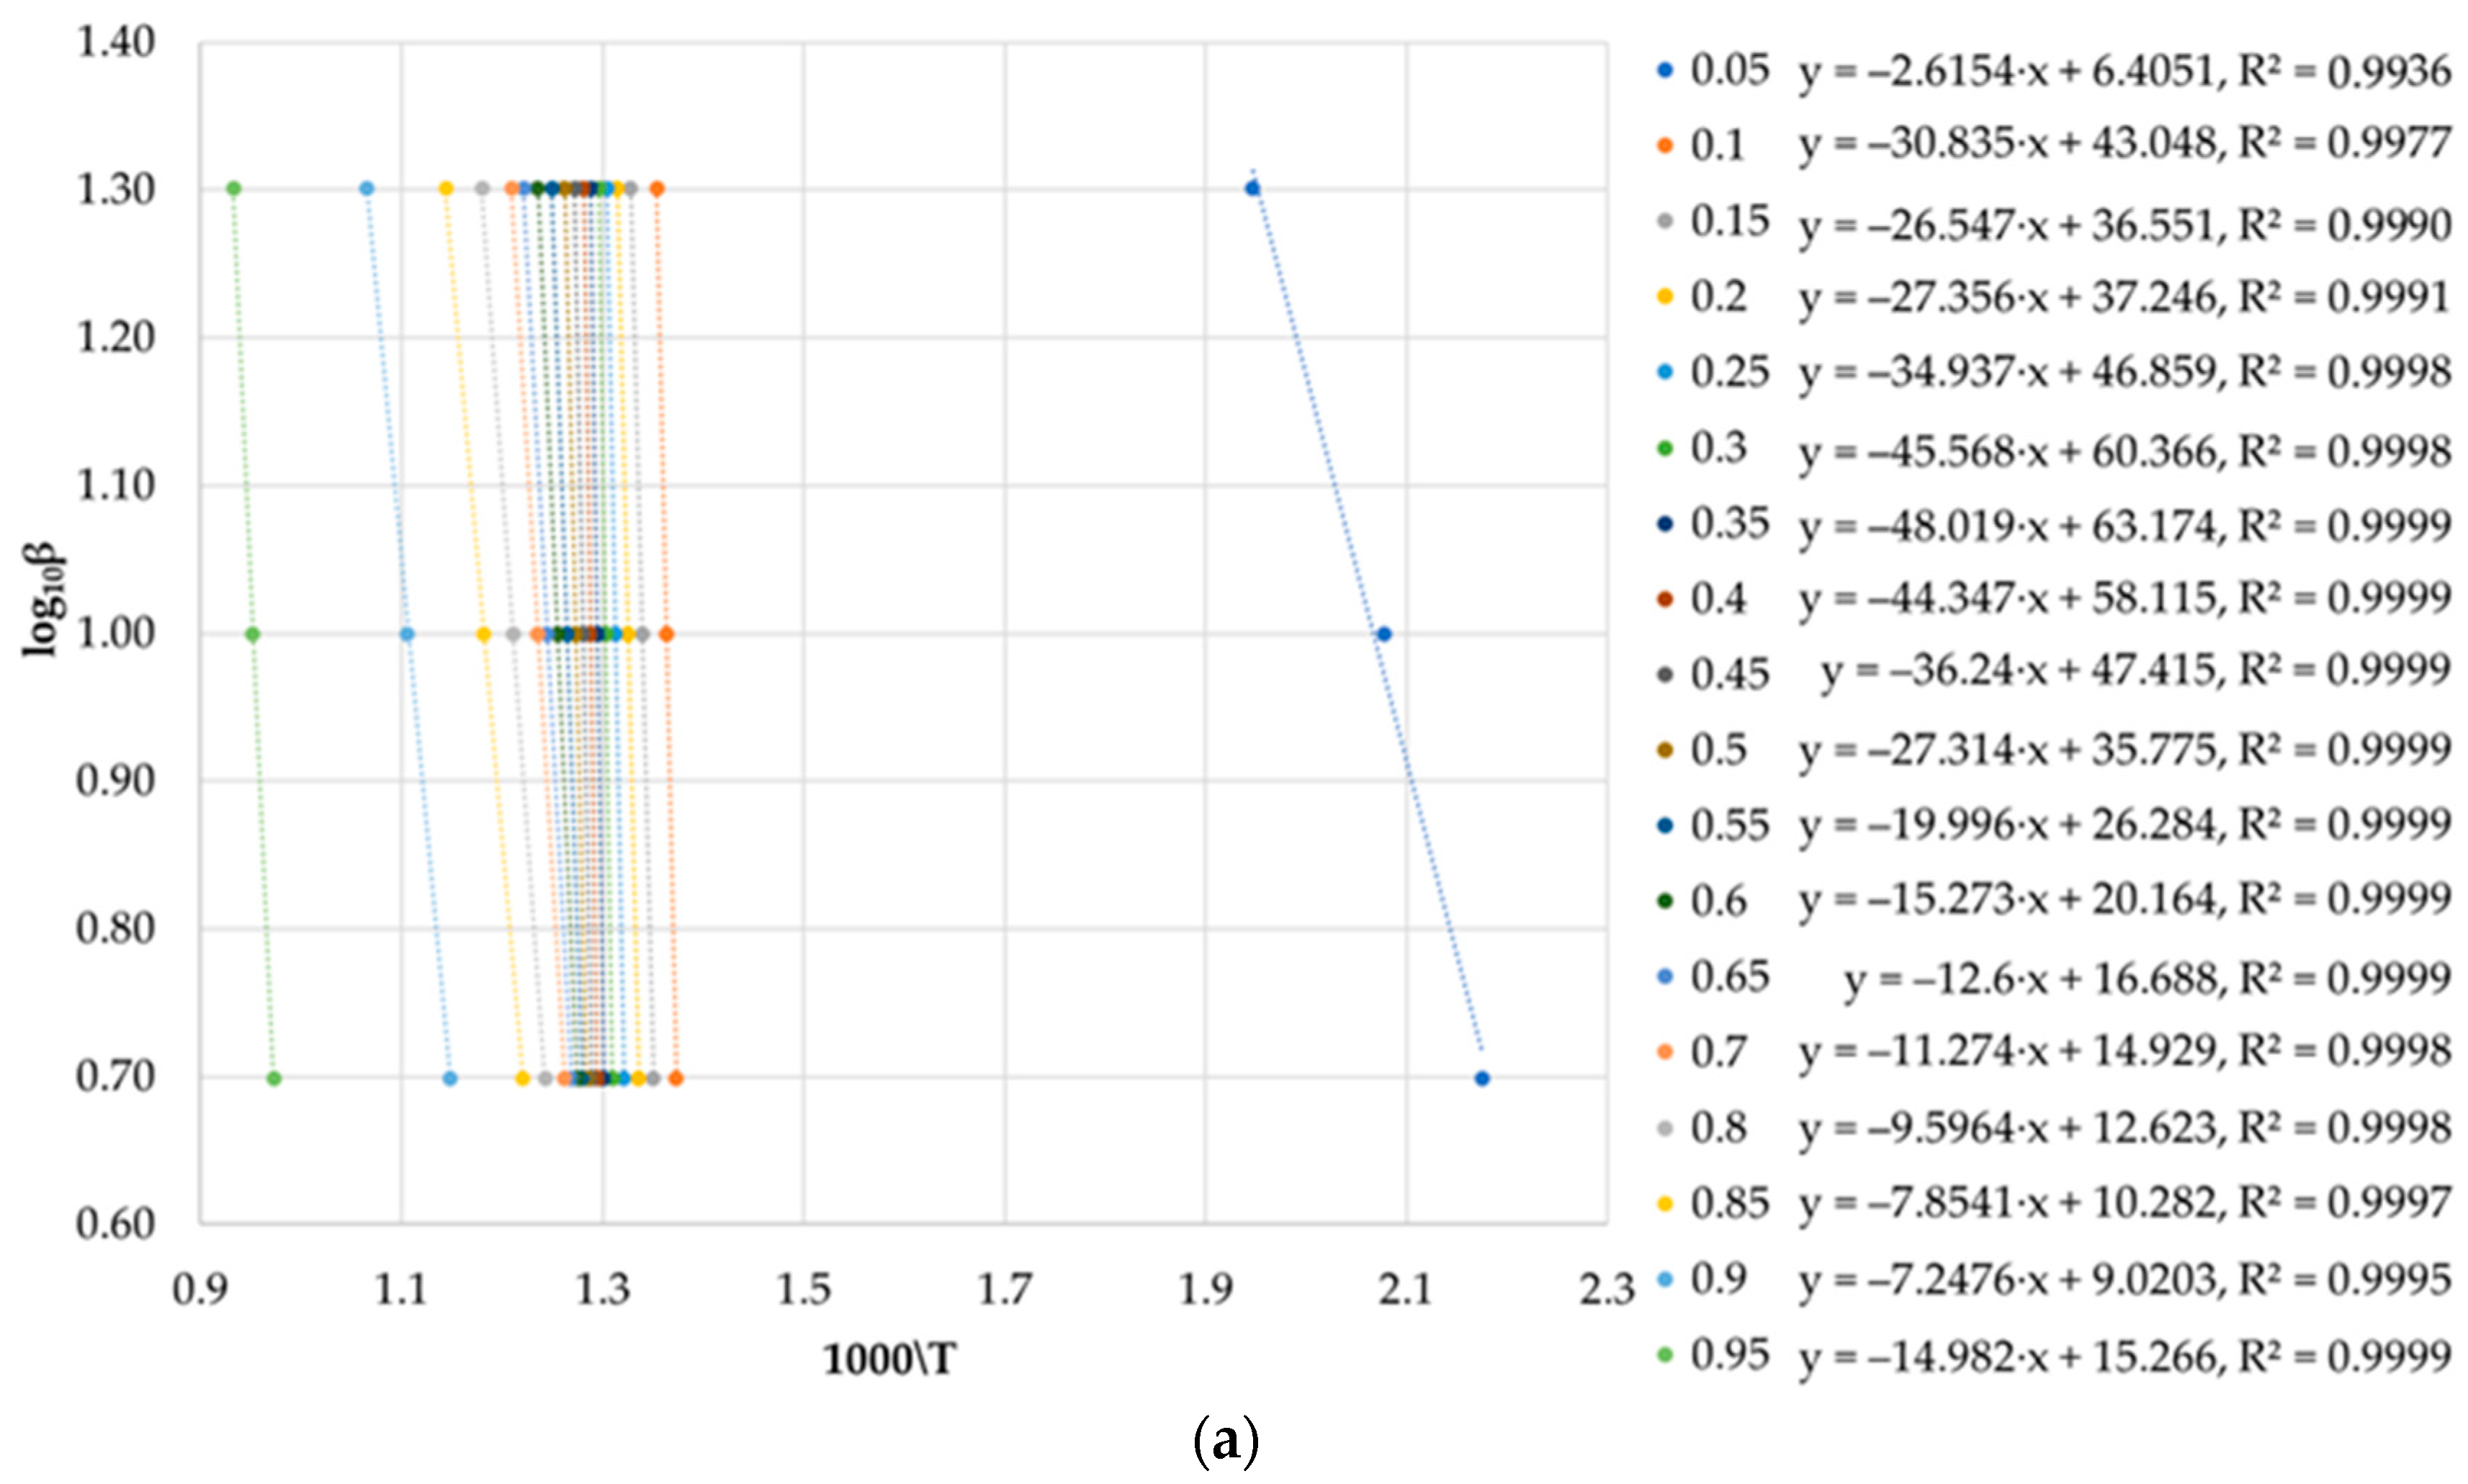
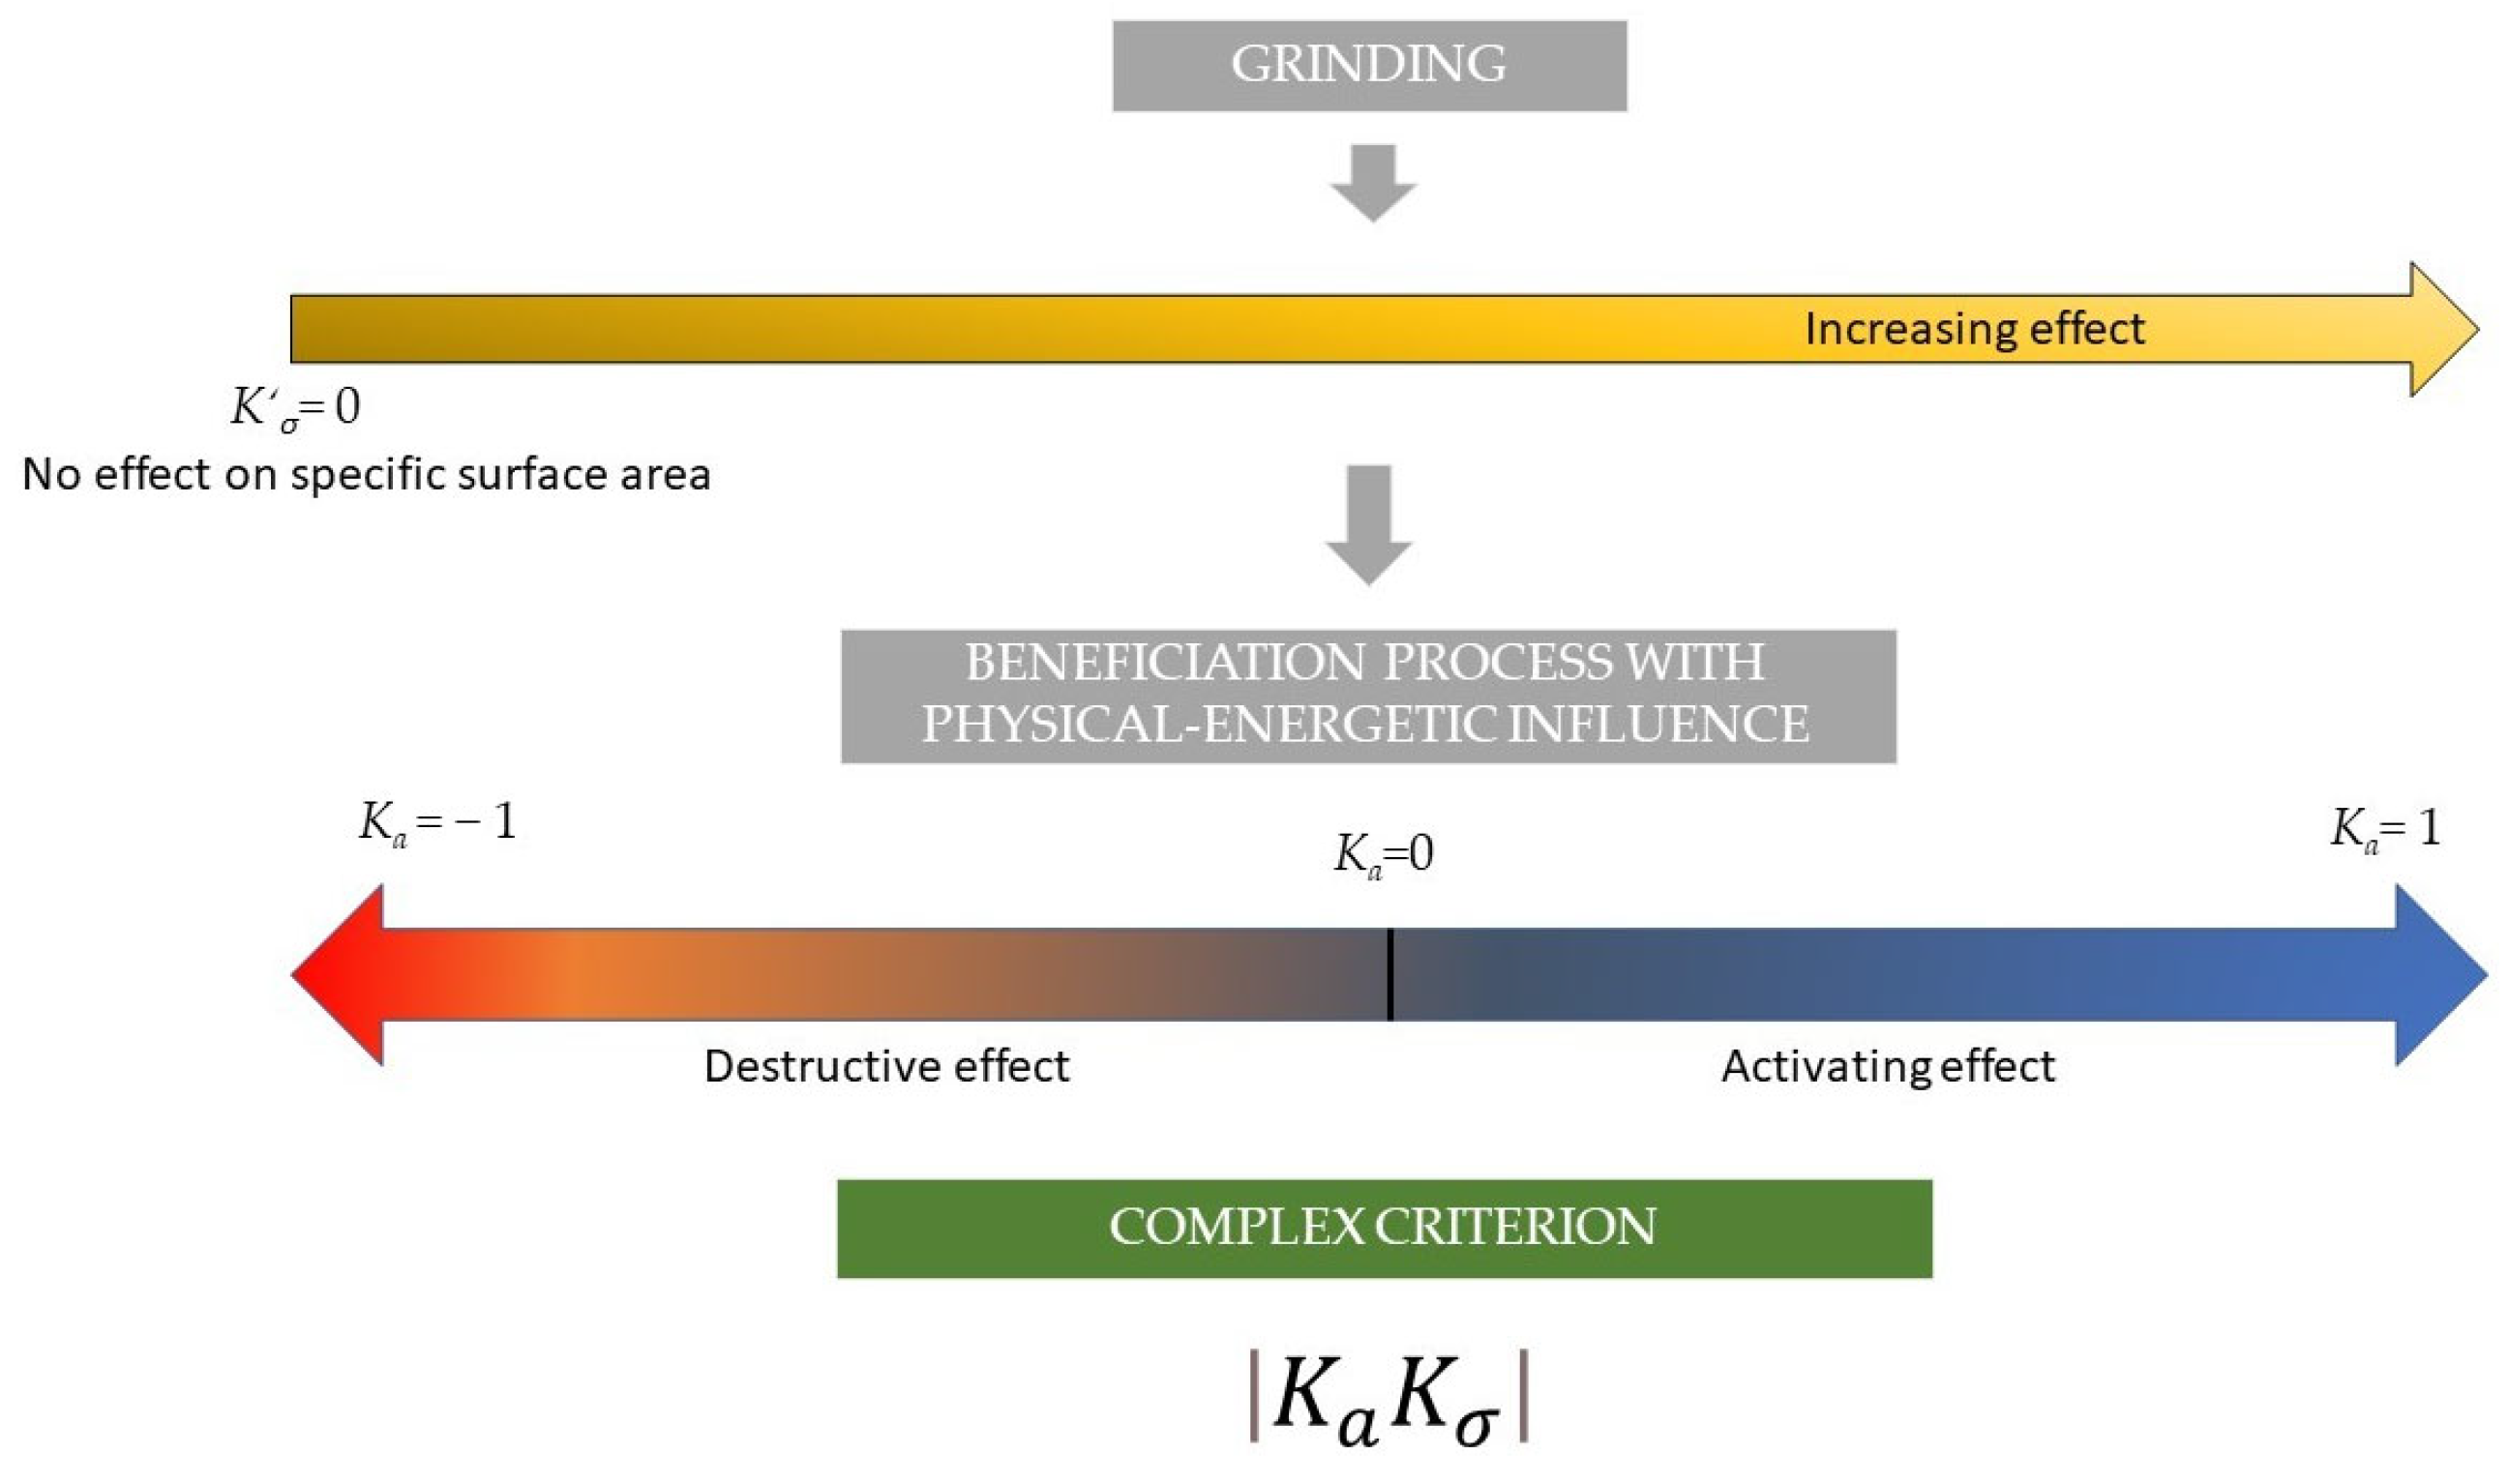
3.2.3. Evaluation of the Application of Impacts Based on Thermogravimetric Data Using the Developed Criterion

For quantitative estimation of the degree of physical–energetic influence on the samples, a complex criterion was developed; its calculation was carried out on the basis of activation energy data, calculated by the differential and integral kinetic methods, for degrees of transformation corresponding to the stage of intensive mass loss, i.e., chemical reaction of destruction at various heating rates.
K α = A 1 + n a i = 1 n a E α i a n b i = 1 n b E α i b 2 1
where Ka—comprehensive criterion for assessing the effectiveness of physical and energy impacts; i = 1 n a E α i a —the value of activation energy after the physical and energetic action, calculated using the differential method for degrees of transformation with order number i from the beginning of the chemical destruction reaction, kJ/mol; i = 1 n b E α i b —the value of activation energy before the physical and energetic impact, calculated using the differential method for degrees of transformation with row number i from the beginning of the chemical destruction reaction, kJ/mol; nb and na—the number of degree of transformation values evaluated before and after the physical and energetic impact, respectively; and A—a coefficient depending on the type of action (activation/destruction), which is chosen on the basis of the following ratios:
at       i = 1 n a E α i a n a   >   i = 1 n b E α i b n b   A = 1
at   i = 1 n a E α i a n a   <   i = 1 n b E α i b n b   A = 0
at   i = 1 n a E α i a n a = i = 1 n b E α i b n b   A = 0.5
The range of the criterion is −1 to 1, where Ka = 1 corresponds to the maximum theoretically possible activating effect, Ka = −1 corresponds to the maximum theoretically possible destructive effect, and Ka = 0 corresponds to no effect.
This criterion not only allows to estimate the degree of effect from the position of an average evaluation over the whole selected range of degrees of reaction, but also makes it possible to consider the required number of degrees of reaction n, e.g., when it is necessary to evaluate the reaction over narrow temperature intervals.
The data presented in Table 3 and Table 4, as well as data for the corresponding raw materials obtained earlier in [34], were used to calculate the criteria values.
Criteria were calculated for the data obtained, which allowed a quantitative assessment of the destruction and activation processes:
-
for samples of comminuted ore, the criterion is Ka = −0.73, which corresponds to the value of the proposed criterion for the destruction effect;
-
for samples of flotation concentrates, the criterion is Ka = 0.54, which corresponds to the value of the proposed criterion for the activation effect.
According to the term introduced by Arrhenius, the activation energy indicates the minimum amount of energy that must be applied to the system in order for a reaction to occur. The destructive effect of comminution on samples based on the calculated criterion shows that, by reducing the particle size and increasing the specific surface area of the particles, comminution helps to reduce the value of the energy needed to change the system. This is in accordance with Section 3.1, which calculates the Kσ coefficient at the comminution stage using sulphide ore reagents.
From the perspective of the activation effect of flotation, this is due to the reduced recovery of the carbonaceous component in the concentrate and the extraction of ore mineralization (sulfide minerals) in the flotation concentrate during the flotation process, increasing the energy of the system, which increases the energy needed to communicate the reaction and further processing to the system. The resulting criterion values will allow the quantification of the degree of impact on the ore for different physical and energy impact methods.
Analysis of the presented results allows to substantiate a possibility of application of the thermogravimetric investigation of samples for a quantitative estimation of the influence of ore and enrichment products by the calculation of activation energy and the suggested criterion.
To assess the overall effect of applied intensification solutions on the whole grinding beneficiation stage, the module of the Ka and Kσ multiplication can be used (Figure 13).
Increasing the value of Kσ corresponds to more specific surface area available after the grinding, and Ka shows how this affects the performance of the intensification on the beneficiation stage. The increasing module of the multiplication shows the growing efficiency of the applied intensification method complex. The obtained value can be used to characterize the impact of proposed intensification technologies on the whole beneficiation process and, in the case of various proposed solutions, choose the most prospective one.

4. Conclusions

This paper presents the results of experimental and theoretical studies to substantiate and develop criteria that characterize the efficiency of overcoming the energy barrier of internal cohesion forces during grinding of complex ores of compound material composition, as well as the substantiation of methods of evaluation of decomposition and activation during flotation. Sulfide and carbonaceous gold-bearing ores were selected as objects of research on the basis of the presence of noble and rare metals and their fine dissemination.
As a result of the studies, a criterion for evaluating the efficiency of overcoming the energy barrier of internal forces (Kσ) was proposed as the ratio of the empirical coefficient of proportionality of the specific fracture energy and the relative value of reduction of the characteristic grain size to the value of free surface energy. The highest value of Kσ is established for the case of sodium silicate application.
The highest values of the distribution of components in the −40 micrometer class as well as the highest value of specific surface when using sodium silicate are probably caused by the adsorptive decrease in the strength of silicate mineral aggregates due to the selective sorption of sodium silicate molecules on them. Adsorption of these compounds leads to a decrease in free energy of the newly formed mineral surface and, as a result, decreases the strength of internal bonds and facilitates deformation. Because ore minerals are embedded in an array of silicate minerals, the destruction of the latter also leads to their transition into fine sieve classes. The mechanism of action of potassium permanganate consists of the interaction with minerals prone to oxidation. Oxidation products are sorbed on the surface of minerals and create points of local decrease in the surface energy, which leads to an increase in the rate of grinding of these minerals and their selective transition into finer size classes. It is likely that high ratios of arsenic growth in the −40 micrometer class to sulfur and silicon growth when potassium permanganate is used are caused by this fact.
As a result of the research carried out, the possibility of quantitative estimation of the influence of physical and energy impacts on ore and products based on the interpretation of the results of thermogravimetric research by the calculation of values of activation energy was substantiated. The calculations were executed using two methods: the Friedman method and the OFW method. The results obtained have high convergence (error less than 5%). The developed criterion enables to quantitatively estimate the degree of impact on ore and concentration and define the character of impact by the coefficient value. Thus, the coefficient value for ore activation is 0.54, while for destruction, the coefficient is −0.73.

Author Contributions

T.A.—conceived and designed the experiments, and analyzed the data; N.N. and A.R.—implementation and processing of the analysis results; A.A. and V.K.—performed the experiments. All authors have read and agreed to the published version of the manuscript.

Funding

This work was carried out within the grant of the Russian Science Foundation (Project N 23-47-00109).

Data Availability Statement

Not applicable.

Conflicts of Interest

The authors declare no conflict of interest.

References

  1. Chanturiya, V.A. Scientific substantiation and development of innovative processes for the extraction of zirconium and rare earth elements in the deep and comprehensive treatment of eudialyte concentrate. J. Min. Inst. 2022, 256, 505–516. [Google Scholar] [CrossRef]
  2. Litvinenko, V.S. Digital economy as a factor in the technological development of the mineral sector. Nat. Resour. Res. 2020, 29, 1521–1541. [Google Scholar] [CrossRef]
  3. Litvinenko, V.S.; Sergeev, I.B. Innovations as a Factor in the Development of the Natural Resources Sector. Stud. Russ. Econ. Dev. 2019, 30, 637–645. [Google Scholar] [CrossRef]
  4. Panayotova, M.; Panayotov, V. Studies on zinc recovery from technogenic waste. E3S Web Conf. 2021, 295, 03008. [Google Scholar] [CrossRef]
  5. Sohn, H.Y. Nonferrous Metals: Production and History. In Reference Module in Materials Science and Materials Engineering; Elsevier: Amsterdam, The Netherlands, 2017; ISBN 9780128035818. [Google Scholar]
  6. Espinoza, R.D.; Rojo, J. Towards sustainable mining (Part I): Valuing investment opportunities in the mining sector. Resour. Policy 2017, 52, 7–18. [Google Scholar] [CrossRef]
  7. Litvinenko, V.S.; Petrov, E.I.; Vasilevskaya, D.V.; Yakovenko, A.V.; Naumov, I.A.; Ratnikov, M.A. Assessment of the Role of the State in the Management of Mineral Resources. J. Min. Inst. 2022, 259, 95–111. [Google Scholar] [CrossRef]
  8. Romasheva, N.V.; Babenko, M.A.; Nikolaichuk, L.A. Sustainable development of the Russian Arctic region: Environmental problems and ways to solve them. MIAB. Min. Inf. Anal. Bull. 2022, 10, 78–87. [Google Scholar] [CrossRef]
  9. Panayotova, M.; Panayotov, V. Application of membrane processes in mining and mineral processing. E3S Web Conf. 2021, 280, 08016. [Google Scholar] [CrossRef]
  10. Duryagina, A.M.; Talovina, I.V.; Lieberwirth, H.; Ilalova, R.K. Morphometric Parameters of Sulphide Ores as a Basis for Selective Ore Dressing. J. Min. Inst. 2022, 256, 527–538. [Google Scholar] [CrossRef]
  11. Koteleva, N.; Kuznetsov, V.; Vasilyeva, N. A Simulator for Educating the Digital Technologies Skills in Industry. Part One. Dynamic Simulation of Technological Processes. Appl. Sci. 2021, 11, 10885. [Google Scholar] [CrossRef]
  12. Aleksandrova, T.N.; Aleksandrov, A.V.; Nikolaeva, N.V.; Romashev, A.O. Noble and Rare Metals in Caustobioliths and Prospects of Their Recovery. J. Min. Sci. 2015, 51, 1254–1261. [Google Scholar] [CrossRef]
  13. Litvinenko, V.S.; Tsvetkov, P.S.; Molodtsov, K.V. The Social and Market Mechanism of Sustainable Development of Public Companies in the Mineral Resource Sector. Eurasian Min. 2020, 2020, 36–41. [Google Scholar] [CrossRef]
  14. Dzhevaga, N.; Lobacheva, O. Reduction in Technogenic Burden on the Environment by Flotation Recovery of Rare Earth Elements from Diluted Industrial Solutions. Appl. Sci. 2021, 11, 7452. [Google Scholar] [CrossRef]
  15. Lieberwirth, H.; Kühnel, L. Particle size effects on selectivity in confined bed comminution. Minerals 2021, 11, 342. [Google Scholar] [CrossRef]
  16. Popov, O.; Talovina, I.; Lieberwirth, H.; Duryagina, A. Quantitative Microstructural Analysis and X-Ray Computed Tomography of Ores and Rocks—Comparison of Results. Minerals 2020, 10, 129. [Google Scholar] [CrossRef]
  17. Kanda, Y.; Kotake, N. Comminution energy and evaluation in fine grinding. In Handbook of Powder Technology; Elsevier: Amsterdam, The Netherlands, 2007; Volume 12, pp. 529–550. [Google Scholar]
  18. Austin, L.G.; Klimpel, R.R. The theory of grinding operations. Ind. Eng. Chem. 1964, 56, 18–29. [Google Scholar] [CrossRef]
  19. Lieberwirth, H.; Hillmann, P.; Hesse, M. Dynamics in double roll crushers. Miner. Eng. 2017, 103–104, 60–66. [Google Scholar] [CrossRef]
  20. Hesse, M.; Popov, O.; Lieberwirth, H. Increasing efficiency by selective comminution. Miner. Eng. 2017, 103–104, 112–126. [Google Scholar] [CrossRef]
  21. Boyko, V.F.; Litvinova, N.M.; Melnikova, T.N. Selection of surfactant consumption during ore grinding of the Mnogovershinnoe deposit. Obogashchenie Rud. 2004, 6, 3–5. [Google Scholar]
  22. Boyko, V.F.; Melnikova, T.N. Natural-Technogenic Free-Dispersed Systems. Origin. Evolution; Khabarovsk State Technical University: Khabarovsk, Russia, 2005; ISBN 5-7389-0366-8. [Google Scholar]
  23. Litvintsev, V.S.; Melnikova, T.N.; Yatlukova, N.G.; Litvinova, N.M. Mechanical activation in ore dressing processes. Gorny Zhurnal 2006, 6, 95–96. [Google Scholar]
  24. Melnikova, T.N.; Yatlukova, N.G.; Litvinova, N.M. To a question of optimization of grinding of ores. Obogashchenie Rud. 2006, 4, 5–7. [Google Scholar]
  25. Khopunov, E.A. The role of surface-active substances in ore destruction under volumetric deformation. Izvestia Vuzov./Min. J. 2017, 2, 93–99. [Google Scholar]
  26. Golini, D.; Jacobs, S.D. Transition between brittle and ductile mode in loose abrasive grinding. In Advanced Optical Manufacturing and Testing; SPIE: Bellingham, DC, USA, 1990; Volume 1333, pp. 80–91. [Google Scholar]
  27. Tikhonov, O.N. Energy-averaged particle mixture coarseness and its use in Bond, Rittinger and Kick-Kirpichev formulas. Obogashchenie Rud. 2008, 4, 13–18. [Google Scholar]
  28. Ip, S.W.; Toguri, J.M. The equivalency of surface tension, surface energy and surface free energy. J. Mater. Sci. 1994, 29, 688–692. [Google Scholar] [CrossRef]
  29. Menzinger, M.; Wolfgang, R. The meaning and use of the Arrhenius activation energy. Angew. Chem. Int. Ed. Engl. 1969, 8, 438–444. [Google Scholar] [CrossRef]
  30. Kissinger, H.E. Reaction Kinetics in Differential Thermal Analysis. Anal. Chem. 1957, 29, 1702–1706. [Google Scholar] [CrossRef]
  31. Ozawa, T. Kinetic analysis of derivative curves in thermal analysis. J. Therm. Anal. 1970, 2, 301–324. [Google Scholar] [CrossRef]
  32. Flynn, J.H.; Wall, L.A. A Quick, Direct Method for the Determination of Activation Energy from Thermogravimetric Data. Polym. Lett. 1966, 4, 323–328. [Google Scholar] [CrossRef]
  33. Friedman, H.L. Kinetics of thermal degradation of char-forming plastics from thermogravimetry. Application to a phenolic plastic. J. Polym. Sci. Part C Polym. Symp. 1964, 6, 183–195. [Google Scholar] [CrossRef]
  34. Alexandrova, T.N.; Nikolaeva, N.V.; Romashev, A.O.; Afanasova, A.V. Low-Dimensional Structures of Noble and Rare Metals in Carbonaceous Rocks and Methods of Their Recovery Using Energy Impacts Based on Big Data; Publishing and Printing Association of Higher Education Institutions: Saint-Petersburg, Russia, 2021; 154p, ISBN 978-5-91155-133-9. [Google Scholar]
Figure 1. Microphotograph of the gold-bearing sulfide ore initial sample: (a) a pyrite crystal and (b) general view.
Minerals 13 00684 g001
Figure 2. Microphotograph of the carbonaceous gold-bearing ore initial sample: (a) general view and (b) a pyrite crystal.
Minerals 13 00684 g002
Figure 3. Algorithm of optical and microscopic studies of the grinding operation products.
Minerals 13 00684 g003
Figure 4. Distribution of the sample’s main components by sieve classes.
Minerals 13 00684 g004
Figure 5. Characteristics of the granulometric and component composition depending on the parameter P80: (a) cumulative yield values, %; (b) Si distribution values; (c) S distribution values; and (d) As distribution values.
Minerals 13 00684 g005aMinerals 13 00684 g005b
Figure 6. Distribution of sulfide aggregates by size classes: (a) P80 = 205.04 μm, (b) P80 = 132.29 μm, (c) P80 = 88.89 μm, and (d) P80 = 68.58 μm.
Minerals 13 00684 g006aMinerals 13 00684 g006b
Figure 7. Values of the sieve classes’ yields and distribution of silica, sulfur, and arsenic by sieve classes depending on the use of different intensifiers for grinding: (a) yield values, (b) Si distribution values, (c) S distribution values, and (d) As distribution values.
Minerals 13 00684 g007aMinerals 13 00684 g007b
Figure 8. Diagram of the dependence of the values of the derivative function of the increment of the specific surface area on the parameter P80.
Minerals 13 00684 g008
Figure 9. Results of thermogravimetric investigation of comminuted samples at three heating rates (green 5 K/min, blue 10 K/min, grey 20 K/min, yellow—splitting into sections).
Minerals 13 00684 g009
Figure 10. Calculation results for the activation energy for three heating rates for comminuted ore samples: (a) using the OFW method and (b) using the Friedman method.
Minerals 13 00684 g010aMinerals 13 00684 g010b
Figure 11. Results of the thermogravimetric investigation of flotation sulphide concentrates at three heating rates (green 5 K/min, blue 10 K/min, grey 20 K/min, yellow—separation into sections).
Minerals 13 00684 g011
Figure 12. Calculation results for activation energy for three heating rates for flotation concentrate samples: (a) using the OFW method and (b) using the Friedman method.
Minerals 13 00684 g012aMinerals 13 00684 g012b
Figure 13. Algorithm of intensification solution assessment.
Minerals 13 00684 g013
Table 1. Methods and equations for calculating activation energy.
MethodEquationReference
Kissinger ln β T m 2 = ln A R E a E a R T m [30]
Ozawa–Flynn–Wall (OFW) log β = 0.4567 E a R T 2.315 + log A E a R log g x [31,32]
Friedman ln β d x d T = ln A f x E a R T m [33]
Table 2. Values of P80, Ss, ΔSs, and Kσ for grinding cases with the use of grinding intensifiers.
No.Experiment’s ConditionsP80, µmSs, sm2/gΔSs, sm2/gKσ, m2.5/kg
1Initial probe501.451295.54--
2Grinding without reagent132.294342.783047.243.513
3Grinding with sodium silicate127.315847.804552.265.176
4Grinding with potassium permanganate128.174553.503257.963.730
5Grinding with sodium carbonate127.914415.763120.223.565
Table 3. Activation energy calculation results for comminuted carbon sulphide ore samples for section 2.
No.xEa, kJ/mol (OFW Method)Ea, kJ/mol (Fiedman Method)lnA
10.05214.79207.0819.654
20.10205.43197.5418.465
30.15202.80194.8118.184
40.20200.81192.7517.969
50.25199.05190.9317.772
60.30197.96189.7917.651
70.35196.75188.5317.511
80.40195.75187.4917.394
90.45194.84186.5417.286
100.50193.93185.6017.175
110.55193.57185.2017.129
120.60192.94184.5517.049
130.65192.47184.0416.985
140.70191.95183.5016.913
150.75191.59183.1116.859
160.80190.76182.2416.743
170.85190.44181.9016.685
180.90189.82181.2516.582
190.95189.30180.6916.465
Table 4. Activation energy calculation results for crushed carbon sulphide ore samples for sections 2 and 3.
No.xEa, kJ/mol (OFW Method)Ea, kJ/mol (Fiedman Method)lnA
Section 2
10.10561.33551.8843.05
20.15483.27473.7836.55
30.20498.00488.4637.25
40.25636.00626.3746.86
50.30829.54819.8060.37
60.35874.16864.3763.17
70.40807.32797.5458.11
80.45659.73649.9847.41
90.50497.24487.5335.78
100.55364.02354.3326.28
110.60278.04268.3520.16
120.65229.37219.6616.69
Section 3
130.70205.23195.5014.93
140.75189.13179.3613.73
150.80174.70164.8812.62
160.85142.98133.0510.28
170.90131.94121.659.02
180.95272.74261.4215.27
Disclaimer/Publisher’s Note: The statements, opinions and data contained in all publications are solely those of the individual author(s) and contributor(s) and not of MDPI and/or the editor(s). MDPI and/or the editor(s) disclaim responsibility for any injury to people or property resulting from any ideas, methods, instructions or products referred to in the content.

