1. Introduction
Geologically, talc occurs in rocks that coexist with other associated minerals such as chlorite, dolomite, magnesite, amphibole, biotite, olivine, pyroxene, quartz, and serpentine [
1,
2]. Talc deposits differ according to the parent rock from which they are derived. Each ore has its own geological signature formed many millions of years ago. Its formation is related to the transformation of existing mineral species under the effect of hydrothermal fluids that carry one or more of the necessary components (MgO, SiO
2 and H
2O) to form talc. Plate tectonics play a very important role in the genesis of talc deposit, since they allow hydrothermal fluids to penetrate the rock and facilitate reactions in it. The size and shape of a talc deposit depend on the intensity of hydrothermal activity, while the pressures and deformations that occur during and after transformation determine its characteristics.
Talc is a layered silicate (phyllosilicate) and its ideal unit structure is Mg
3Si
4O
10(OH)
2. The theoretical chemical composition of this mineral contains 63.37% SiO
2, 31.80% MgO, and 4.75% H
2O. It presents a stacked structure where sheets are arranged with a variable degree of disorder, so they can slide easily, giving talc its characteristic softness. Talc sheets have two types of surfaces: “face” and “edge”. The first ones contain the basal planes as a consequence of sheets sliding and they have siloxane groups (–Si–O–Si–). Face surfaces are electrically neutral, energetically weak, nonpolar in water, and hydrophobic [
3,
4,
5,
6]. The edge surfaces are formed by breaking from the milling and they contain silanol (SiOH) and magnesiol (MgOH) groups, making them polar and hydrophilic. These surfaces are more energetic than the faces, therefore, they are susceptible to undergo hydrolysis and form relatively strong hydrogen bonds with water molecules and polar substances [
7,
8,
9]. Talc sheets have an elementary structure that consists of an octahedral layer chemically bonded to two tetrahedral layers by oxygen atoms. The interlaminar distance is 9.4 Å, including the two tetrahedral layers attached to the octahedral one and the separation of adjacent sheets by van der Waals forces [
10].
Four categories of talc ore can be distinguished depending on the parent rock from which mineral is formed [
11]: (a) derived from magnesium carbonates which is generally pure and white, (b) derived from serpentines that is always grey but can be upgraded, (c) derived from alumino–silicate rocks which generally contains chlorite, and (d) derived from magnesium sedimentary deposits. These categories include a wide variety of deposits that differ in mineralogical composition (type and proportion of associated minerals), color (measured in terms of brightness or whiteness), and crystalline morphology. Considering morphological aspects, talc can be classified as either microcrystalline (particle length:thickness = 10:1) or macrocrystalline (particle length:thickness = 35:1) [
12]. Mineralogical composition, color and crystalline morphology govern the specific nature of each grade of commercial talc, as well as its industrial applications. Particularly, Argentine has talc deposits in the Mendoza and San Juan provinces, in the foothills of the Andes, and their formation has been assigned to the Upper Paleozoic–Lower Triassic [
13,
14,
15]. Due to their genesis, talc presents specific characteristics and properties. The aim of this work is to study these properties by different and complementary techniques such as petrographical, mineralogical, morphological, geochemical, and physicochemical analysis in order to determine its potential uses.
2. Materials and Methods
Different representative rock samples were extracted from a talc deposit located in the province of San Juan, which has been circumscribed to the Sierra de Pie de Palo. This orographic subsystem belongs to the Sierras Pampeanas of central–western Argentine. A geological map of this system is reported in Rapela et al. [
16]. Talc deposit is 20 km long and 7 km wide. There are bodies of serpentines which are arranged accordingly with veins in lenticular layers hosted in serpentinite bodies or in contact with the bedrock, micacites, and quartzites. Although these bodies have very variable thicknesses, talc veins have an average width of 1 m [
17]. All extracted rock samples were crushed, ground for 5 min by means of a micronizing miller, then sieved, and the powder fraction selected (<20 μm). This allows the obtaining of a homogeneous and representative material to perform the analysis.
Talc samples were characterized by complementary and independent techniques to perform a petrographical, mineralogical, morphological, geochemical, and physicochemical analysis.
The petrographic study by polarized light microscopy (PLM) was carried out on three thin sections of six representative samples extracted from the talc rock. To perform this analysis an Olympus SZ-Pt trinocular stereomicroscope and an Olympus B2-UMA trinocular petrographic microscope (Olympus, Tokyo, Japan) were used. Both of them are equipped with a built-in video camera, a digital capture system, and software for image processing.
Bulk mineralogy was determined on talc powder by X-ray diffraction (XRD) using a Rigaku D Max III-C X-ray diffractometer (Rigaku, Tokyo, Japan) set at 35 kV and 15 mA, with CuKα radiation (wavelength of 1.54060 Å) and a graphite monochromator in the secondary diffracted beam to remove CuKβ radiation. Diffractograms were produced ranging 2θ from 3° to 60°, with 0.04° in 2θ increments and a counting time of 1 s per increment, using a slit width of 0.6°. The sample was mounted in a dimpled glass, and then a glass slide was used to press the material and remove the exceeding material. Identification of minerals was performed by means of JADE software (version 7, ICDD, Newton Square, PA, USA) using the values in counts per second.
Morphological and microchemical analyses were carried out by scanning electron microscopy (SEM) using a JEOL JSM 35 CF microscope (JEOL Ltd., Tokyo, Japan) with an energy dispersive X-ray spectrometer (EDAX 2000, Mahwah, NJ, USA). Before the SEM analysis, samples were coated with a thin gold layer (~30 Å thick) using an argon plasma metallizer (sputter coater PELCO 91000, Fresno, CA, USA) in order to make the sample conductive. This analysis was performed on talc rock and powder.
Talc particle size was measured using a Sedigraph® 5100 from Micromeritics, Norcross, GA, USA. All samples were dispersed with a 0.1% solution of sodium diphosphate. Samples of 10 g dry talc were dispersed in 100 cm3 of the diphosphate solution with a high-speed blender for 15 min at 15,000 min−1 followed by ultrasonication for 10 min in a 130 W ultrasonic bath.
The sheet stacking sequence and order in talc particles were analyzed by transmission electron microscopy (TEM) using a JEOL 100 CX microscope operating at 100 kV. To prepare samples, talc particles were previously embedded in an epoxy resin. Then, thin sections (approximately 600 Å) from the embedded samples were studied by using a Leica ultramicrotome in a perpendicular direction to the particle basal plane. Microscopical observations were performed on these thin sections.
The chemical composition of talc samples was determined with an X-ray fluorescence (XRF) spectrometer (PANalytical Magi’X, Malvern, UK) with a rhodium anode, FLi 200, LiF220, Ge, PX1, PX4, PE analyzer crystals, and flow and scintillation detectors. This analysis was performed under vacuum conditions. The semiquantitative analysis was performed using IQ+ software (version 3.05(3.346.3), PANalytical B.V., Almelo, The Netherlands) integrated with the spectrometer which contains a wide database of patterns and correction coefficients library. The detection limit of this technique is 1 ppm.
Fourier transform-infrared (FTIR) spectra of powdered samples were recorded using a Nicolet 520 FT-IR spectrophotometer (model 520, Thermo Fisher Scientific, Madison, WI, USA) with a DTGS detector. Samples were mixed with spectroscopic grade potassium bromide (KBr) in a ratio of 1:99 (talc:KBr) in an agate mortar. Then, the mixture was placed in a hydraulic press and compressed to produce pellets for recording the spectra. The infrared spectrum range was 400–4000 cm–1, using 32 scans and a resolution of 4 cm−1 under nitrogen atmosphere.
Thermogravimetric analysis (TGA) was carried out with a TA Instrument equipment (model Discovery Series). Samples of finely ground talc (<20 μm) powder were heated in the temperature range of 30–1000 °C with a heating rate of 10 °C min–1 in a nitrogen atmosphere.
Color properties of talc samples were determined using a Hunterlab UltraScan XE (Reston, VA, USA) colorimeter on a thin disk of compressed powder.
L*,
a*, and
b* values were measured under the standard illuminant D65 by using the CIELAB (Commission Internationale de l´Eclairage
L*
a*
b*) system. The colorimeter was calibrated to the perfect white diffuser by a ceramic plate. The whiteness index (
WI) values were calculated by taking the values of the CIELab scale (
L*,
a*,
b*) and the Hunter equation [
18], modified by Stensby [
19]:
3. Results and Discussion
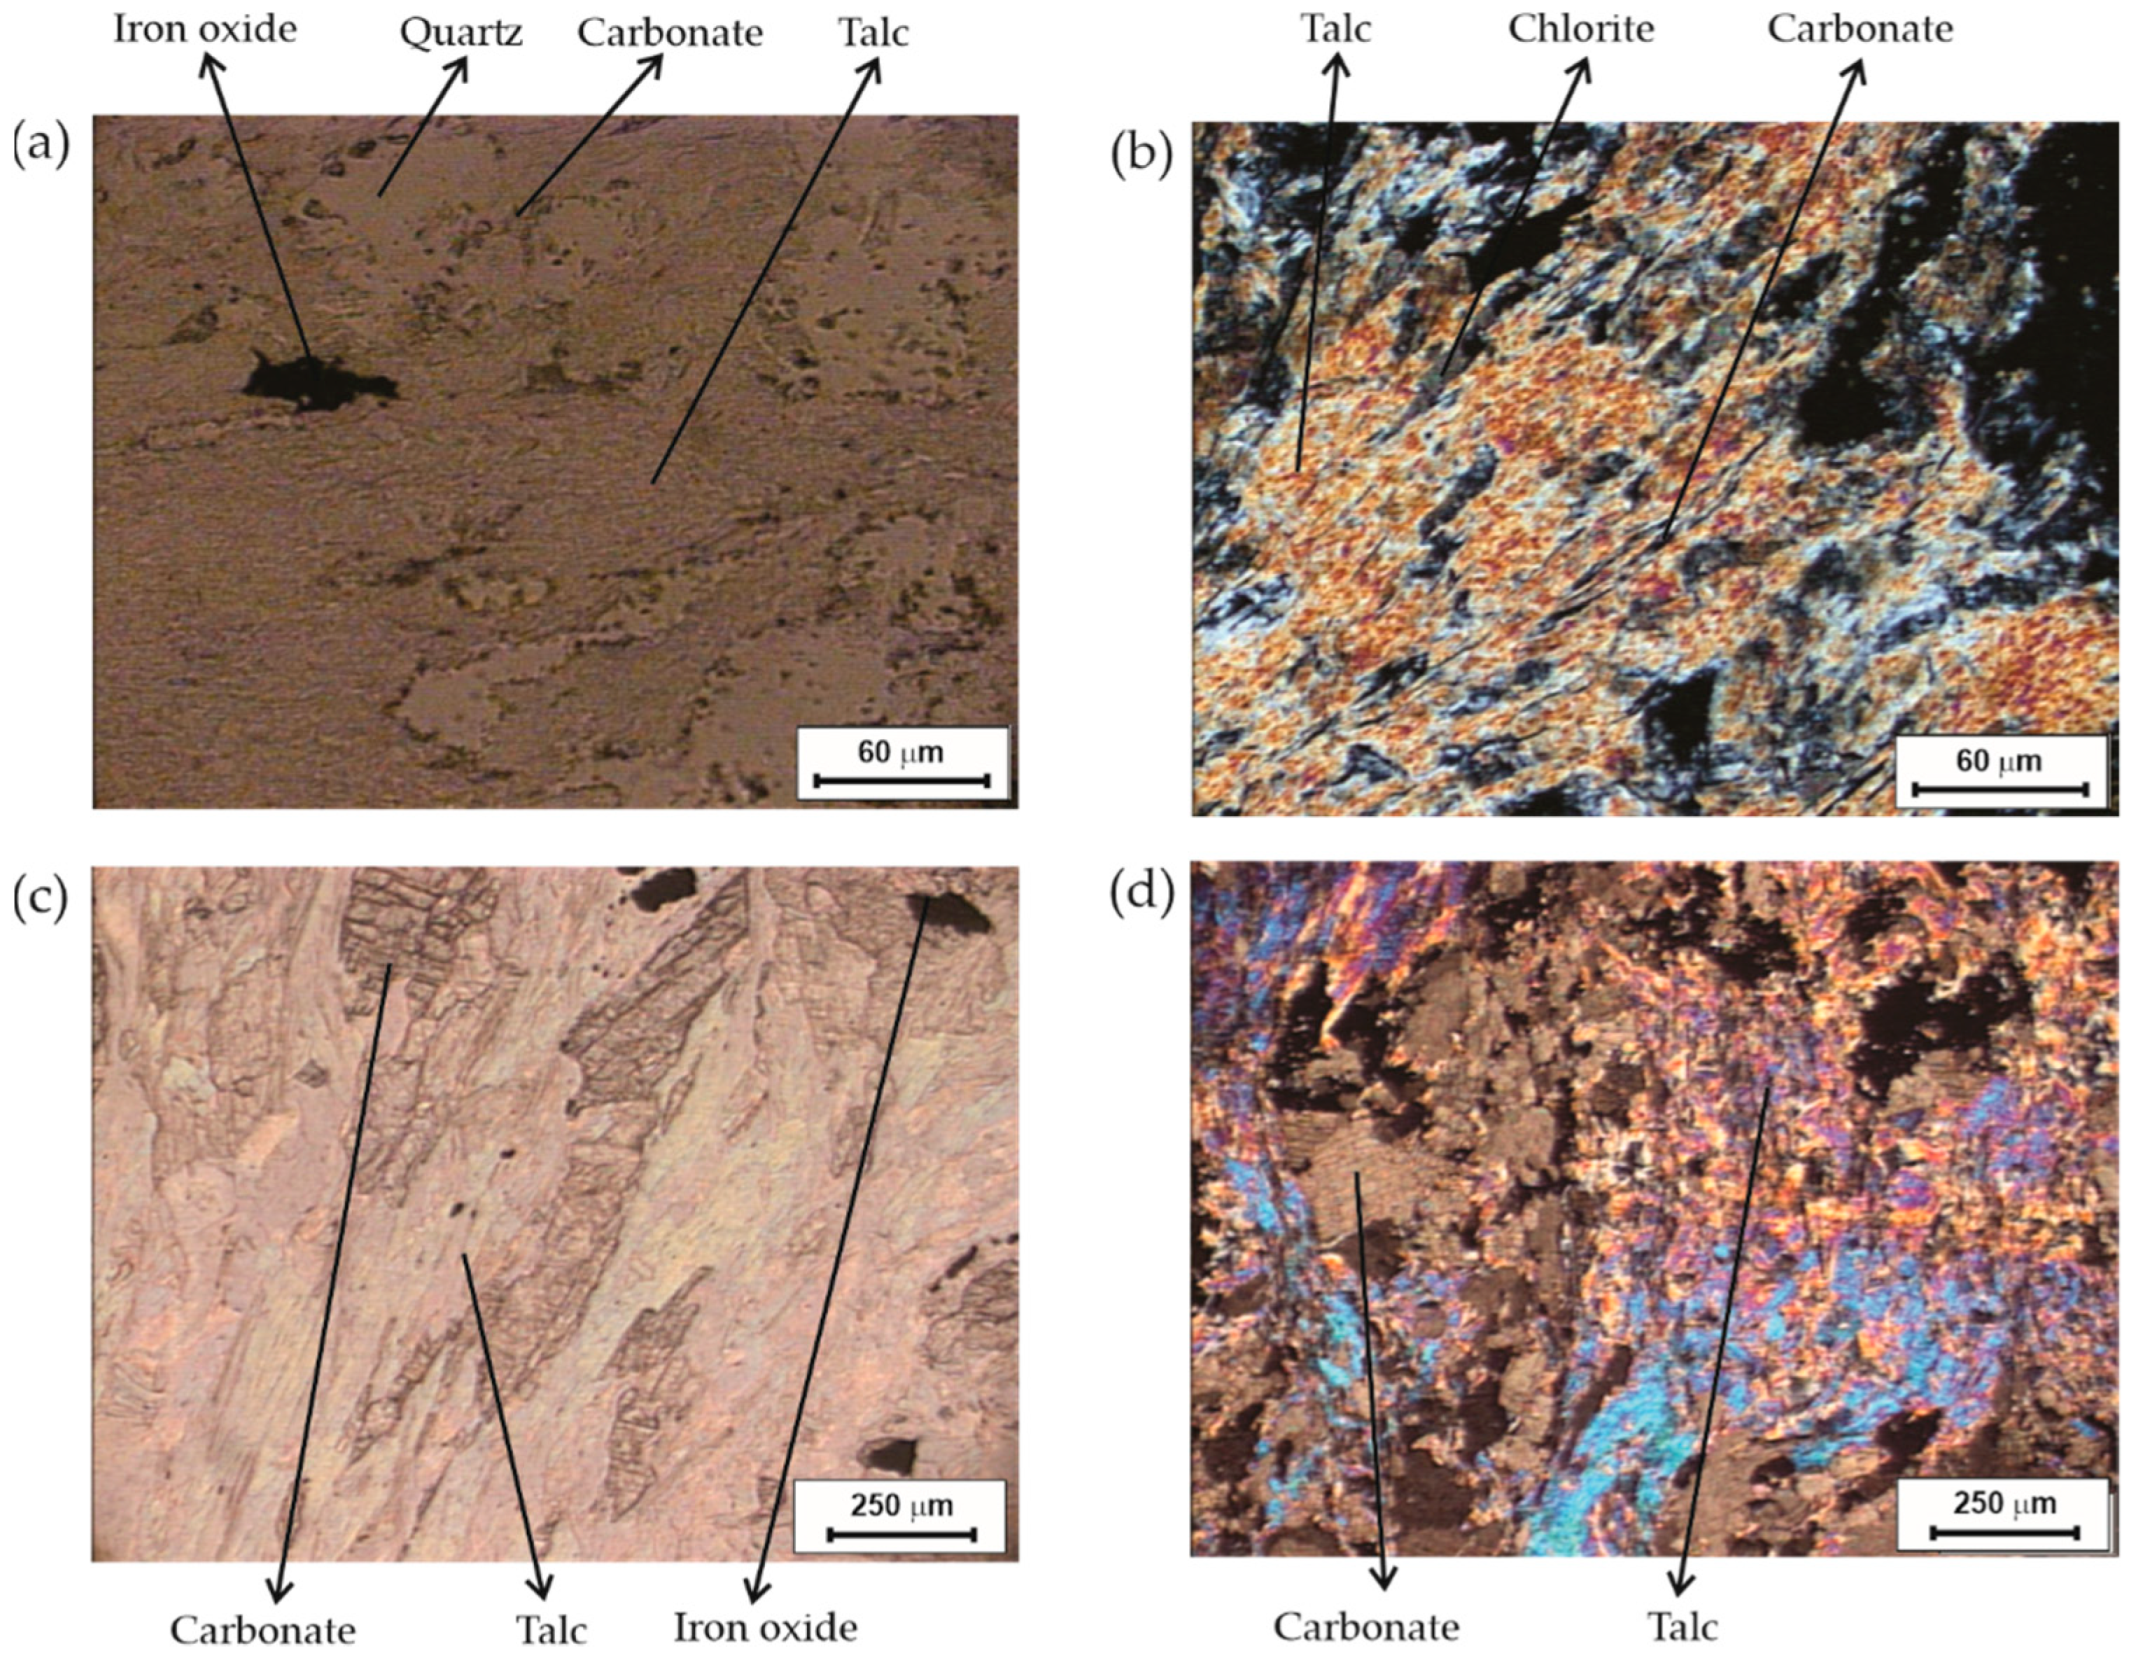
A detailed petrographic analysis of talc rock was performed to identify and describe microscopic characteristics.
Figure 1 includes photographs that show optical properties of talc thin sections observed under plane-polarized light and crossed polars. A coarse granulometry and the presence of carbonates can be observed in
Figure 1a. Moreover, a dark spot associated with iron oxide presence can be distinguished. Isolated grains with a smooth appearance can be seen distributed within the thin section and they can be related to relics of quartz. The shape of these relics proceeds from the erosion by the forming fluids. With the aid of cross polars, carbonates are seen in the form of veins and a magnesium-rich chlorite is detected in bluish–gray areas (
Figure 1b). Particularly, using polarized light, carbonates are clearly distinguished since they present cleavage lines (
Figure 1c). Chlorites and talc are minerals frequently associated as interlaminates in domains one or various layers thick since they occur as a result of hydrothermal alteration [
20,
21]. Moreover, dark spots are distinguished, and the larger ones are probably holes in the rock cut (
Figure 1b). From the petrographical analysis, it can be inferred that the original rock was a carbonite schist, more specifically a calcitic one, so the original carbonate was calcite. Considering this limestone rock and an excess of Mg in the surrounding environment, a substitution by ionic exchange of calcium for magnesium could have led to dolomite formation. This transformation was probably accompanied with a decrease in volume, making crystals grow without a particular direction, as can be seen in the micrographs. Magnesium still in excess could be responsible of magnesite formation in the presence of calcite. Regarding talc formation, it would be associated with an even greater excess of available Mg after the previous transformation.
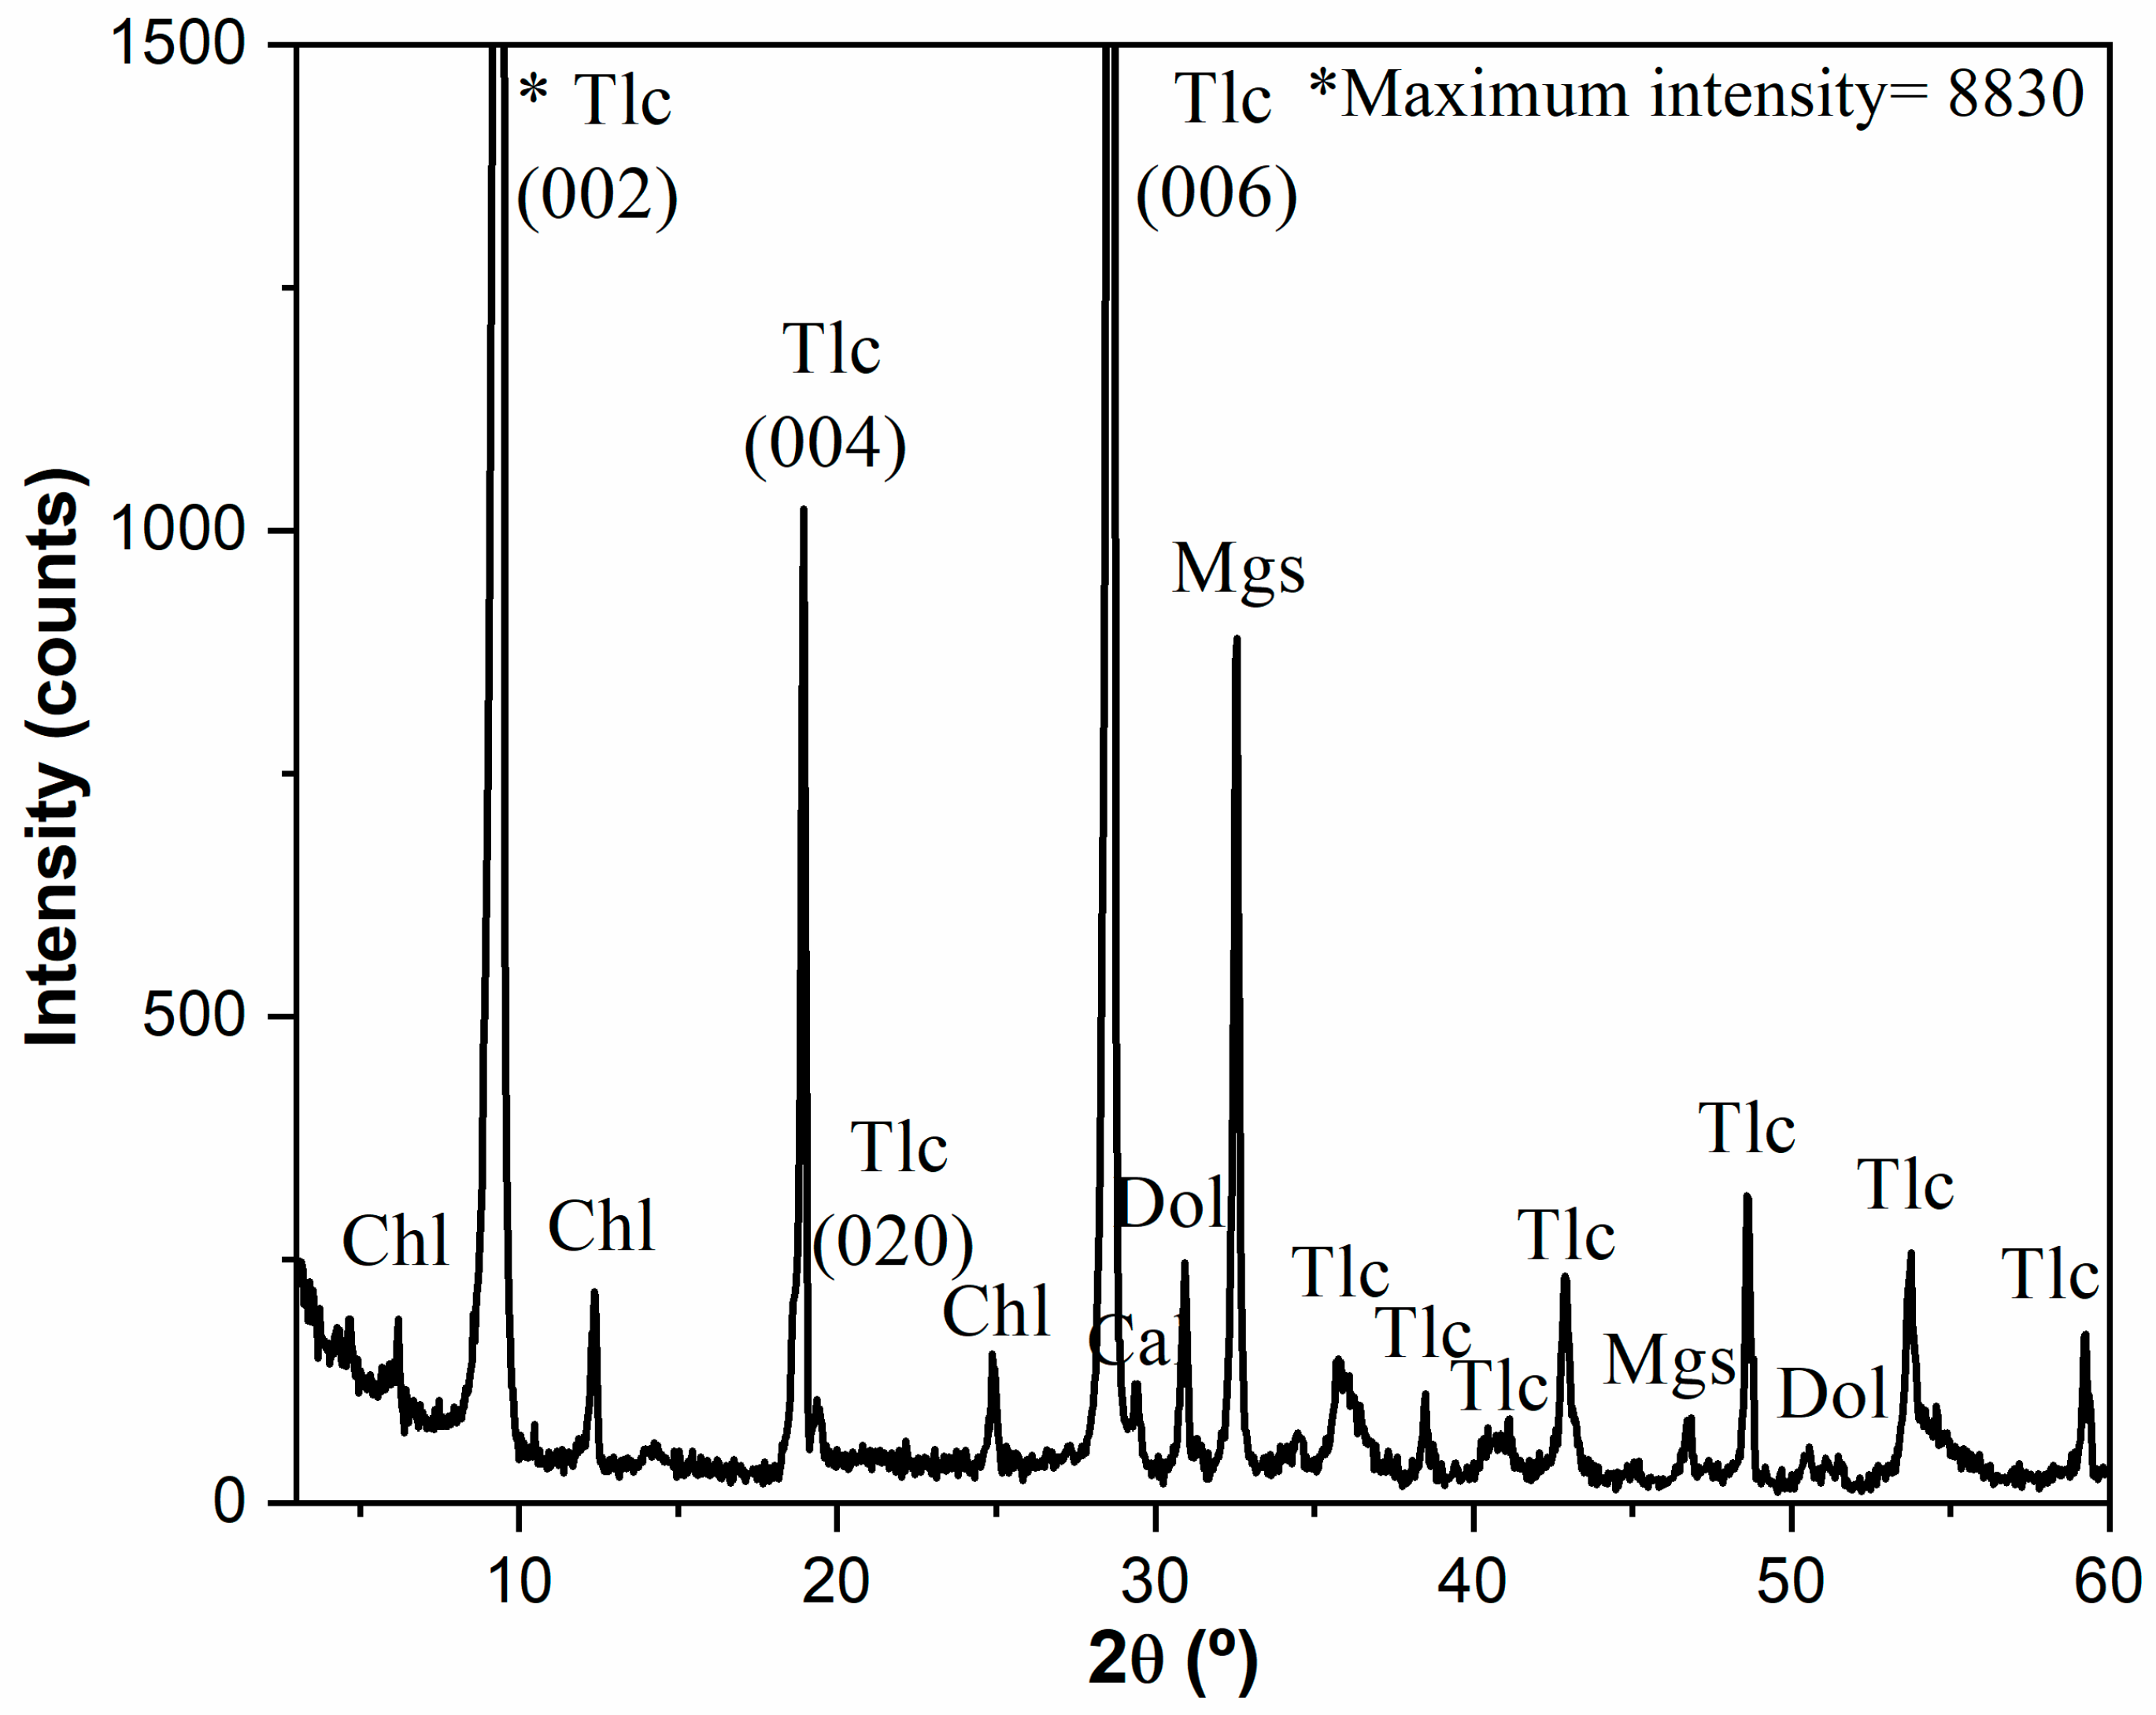
XRD analysis confirms that samples contain talc with associated minerals, as it was previously detected by optical microscopy.
Figure 2 presents the diffractogram of powdered talc which includes the peak assignment to the corresponding minerals. The characteristic peaks of talc are associated to
d values of 9.44, 4.69 and 3.12 Å, which were assigned to the basal planes (002), (004) and (006), respectively (JCPDS 19-770). The associated minerals detected were chlorite (14.33, 7.16 and 3.56 Å, JCPDS 16-362) and carbonates such as calcite (3.03 Å, JCPDS 5-586), dolomite (2.89 and 1.80 Å, JCPDS 36-426), and magnesite (2.75 and 1.7 Å, JCPDS 8-479). It is important to mention that magnesite is found in a higher proportion than the other carbonates. Moreover, considering the maximum intensity detected (included in
Figure 2), talc samples have a high crystallinity.
To analyze talc crystalline morphology, a morphological index (
M) proposed by Holland and Murtagh [
23] was calculated from XRD data. To determine if a talc sample is macro or microcrystalline, they proposed an expression in terms of the intensity of (004) and (020) corresponding to
d values of 4.69 and 4.61 Å, respectively, as follows:
where
Ix is the intensity of the (004) reflection and
Iy is the intensity of (020).
According to this morphological index, values close to 1 indicate a macrocrystalline character, meanwhile if they are close to 0 it corresponds to a microcrystalline morphology. For this talc sample, the value of M is 0.79, revealing a high macrocrystalline character.
Another microstructural feature of talc particles is the crystallite size which is a measure of the size of coherent diffraction domains. This value does not match with particle size due to polycrystalline aggregates. Crystallite size can be determined from XRD data by using the Scherrer equation [
24] which is obtained from Bragg’s law:
where
D(hkl) is the average crystallite size measured perpendicular to the family of planes (hkl),
K is Scherrer’s constant with a value of 0.9,
λ is the wavelength of the incident radiation x,
FWHM is the width of the peak evaluated at half intensity and
θ is the angle of maximum intensity of the peak in radians. Since the (002) reflection is one of the most intense for talc [
25], the analysis of crystalline size was performed considering this signal. The obtained value for the studied talc sample is 123 nm, which is three times higher than the reported value for ground talc [
26]. The diffractogram of Argentinean talc not only reveals a high crystallinity, but also the presence of large crystals.
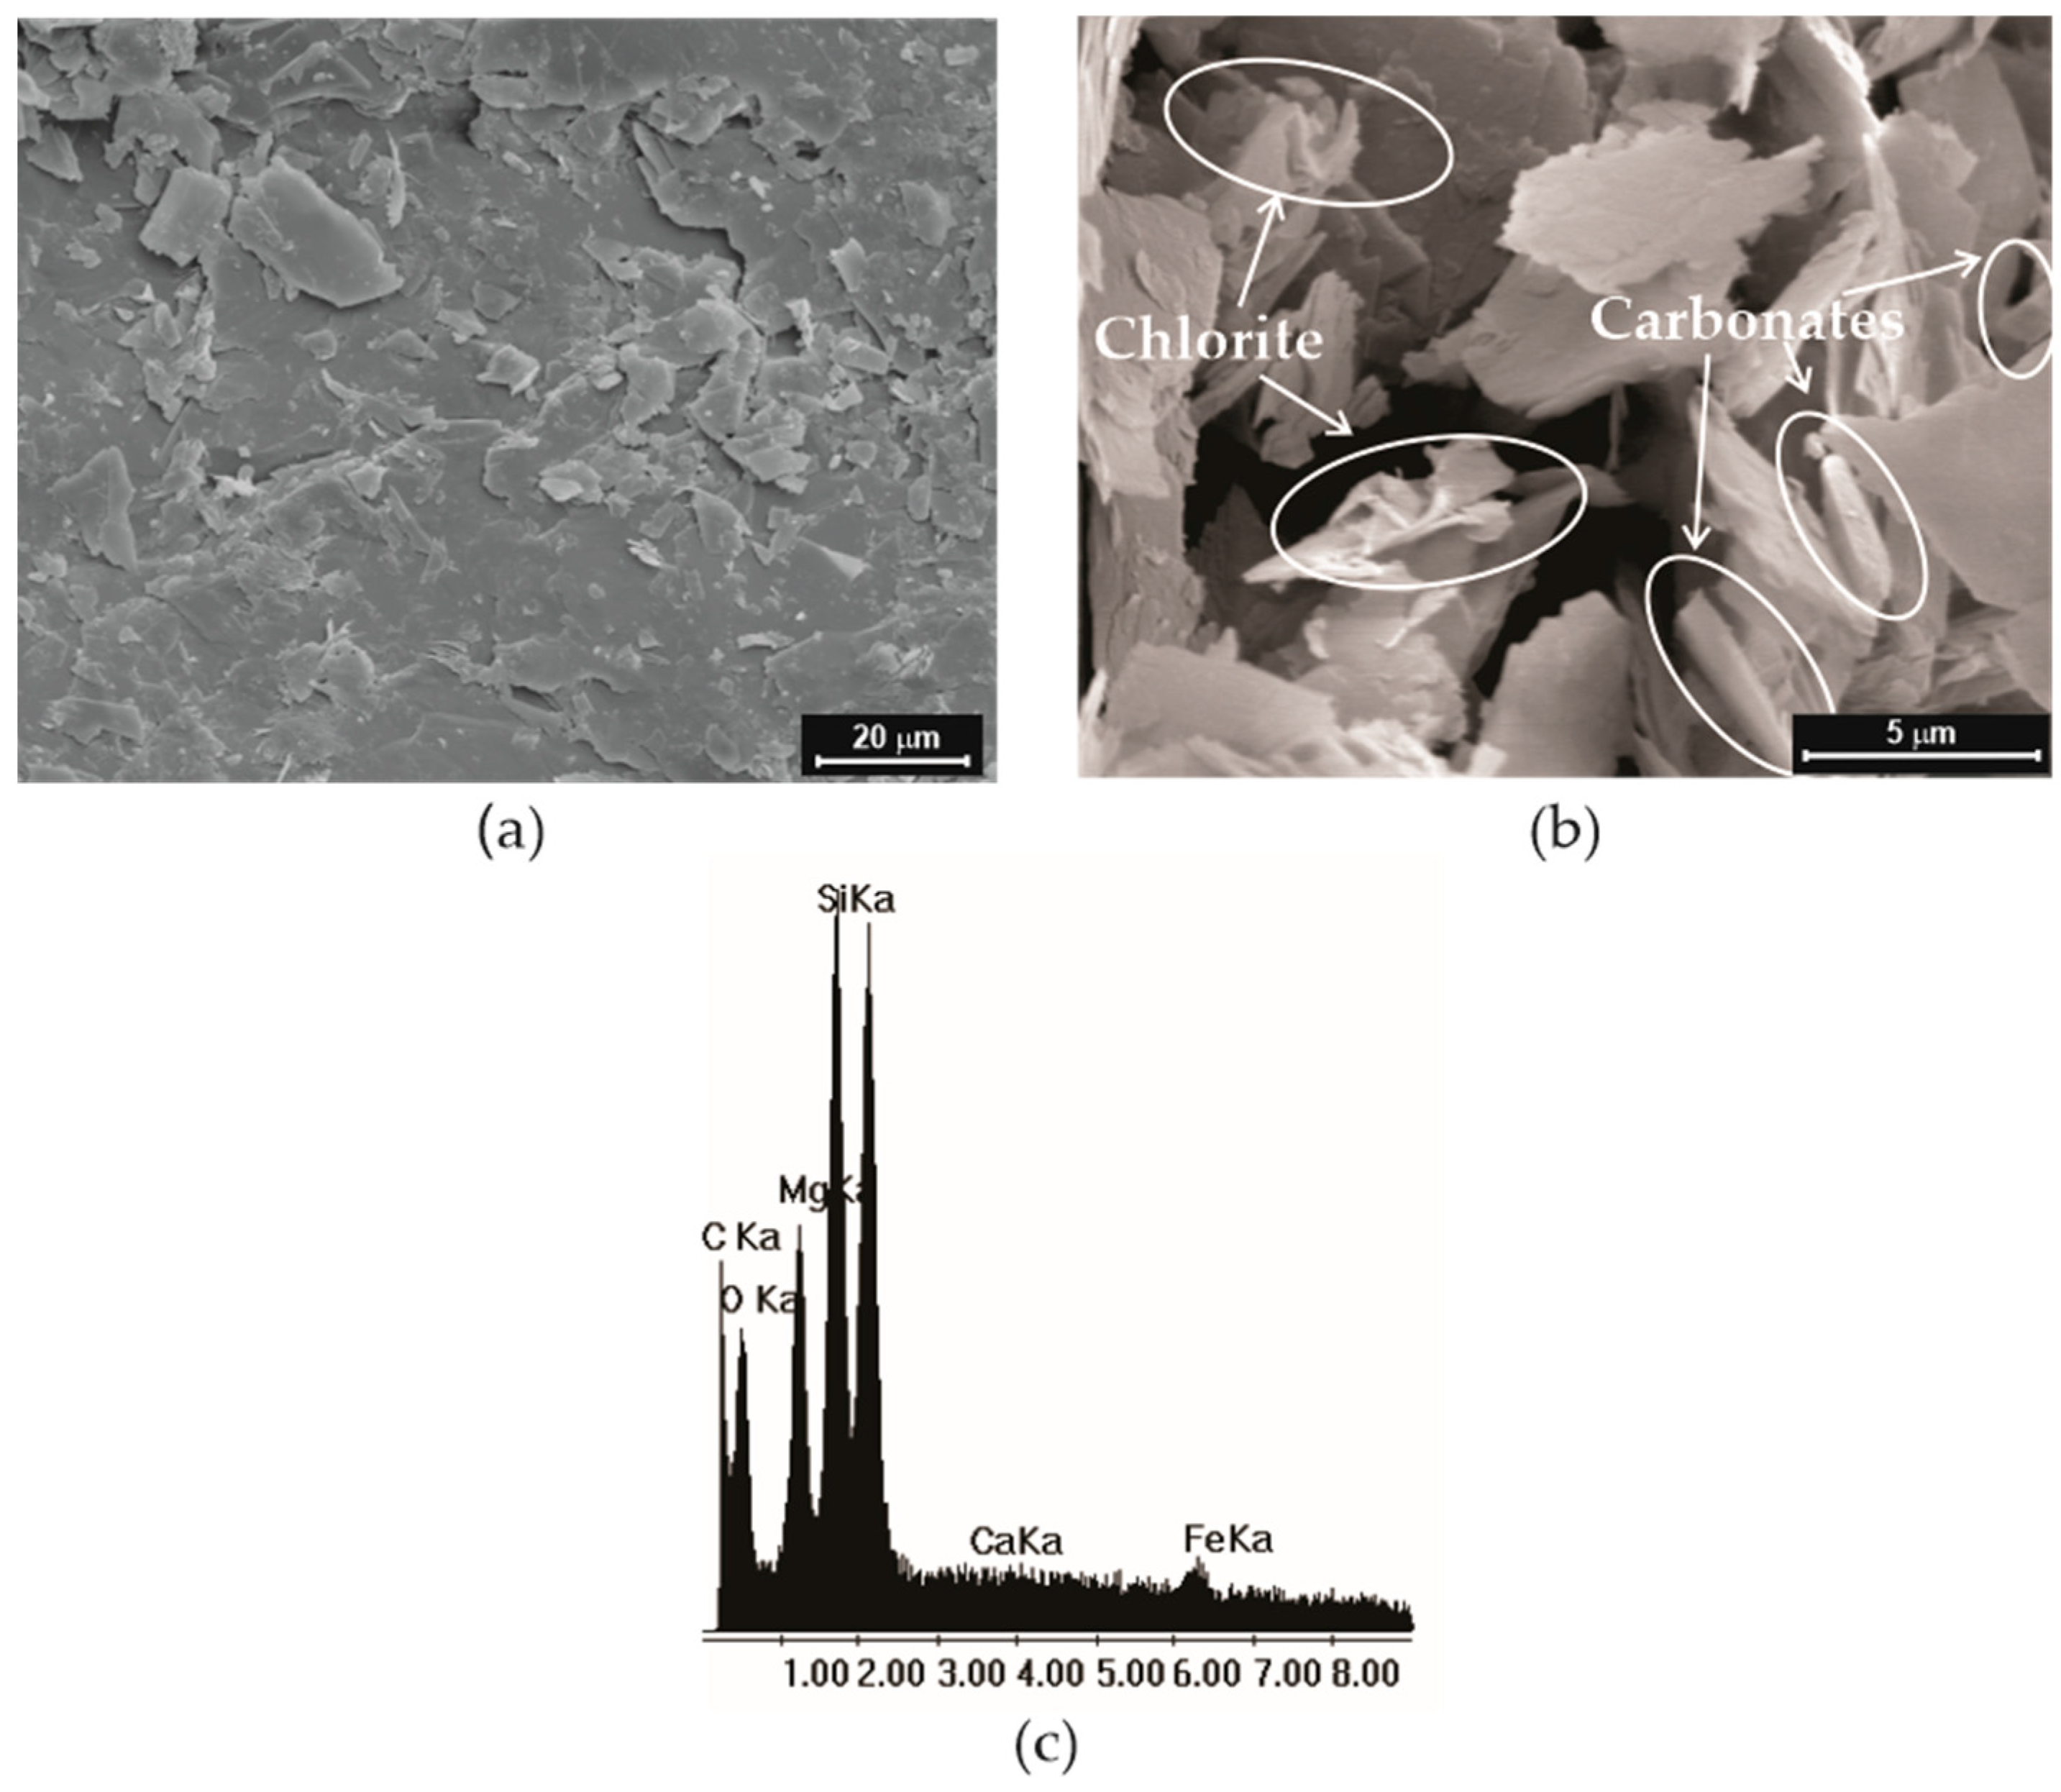
Morphological study of talc allows the obtaining of information about shape, size and particle size distribution. SEM micrographs of the rock surface and finely ground powder (<20 μm) were obtained from the same talc ore. A planar habit is observed in
Figure 3a, which mainly corresponds to talc and it appears as plates, and flakes with differently sized and layered crystals.
Milled talc presents particles with prismatic shapes and clear surfaces with defined and abrupt edges (
Figure 3b). These features are characteristics of macrocrystalline talc [
27]. This morphology is consistent with talc genesis, analogous to that of those minerals from Vermont (Canada), which are macrocrystalline [
28]. Associated minerals are randomly distributed in powdered talc as a consequence of the grinding and the mixing during the processing. Carbonates are distinguished by present trigonal geometry and rhombohedral cleavage. Dolomite and calcite are recognized by rhombohedral shapes, while magnesite exhibits anhedral shapes with rhombohedral edges. Chlorite mainly occurs in the form of curved flakes with angular borders. The presence of these associated minerals is also confirmed by the EDX spectra included in
Figure 3c. Besides the talc constituent elements such Si, Mg, and O, Ca, Fe, and C are detected, coming from carbonates and chlorite.
Concerning particle size, talc presents a wide monomodal distribution. The obtained values of D10, D50 and D90 by sedigraphy are 2.10 ± 0.54 μm; 5.93 ± 2.52 μm and 11.24 ± 1.56, respectively. D50 values was also assessed by using SEM. This determination was performed considering more than 100 particles on micrographs and registering the maximum length of face surfaces. Data processing was carried out with an Analysis PROTM software (version 3.0, Soft Imaging System GmbH, Münster, Germany) package. The result of this complementary measurement was 5.86 ± 3.59 μm, in agreement with the sedigraphy value.
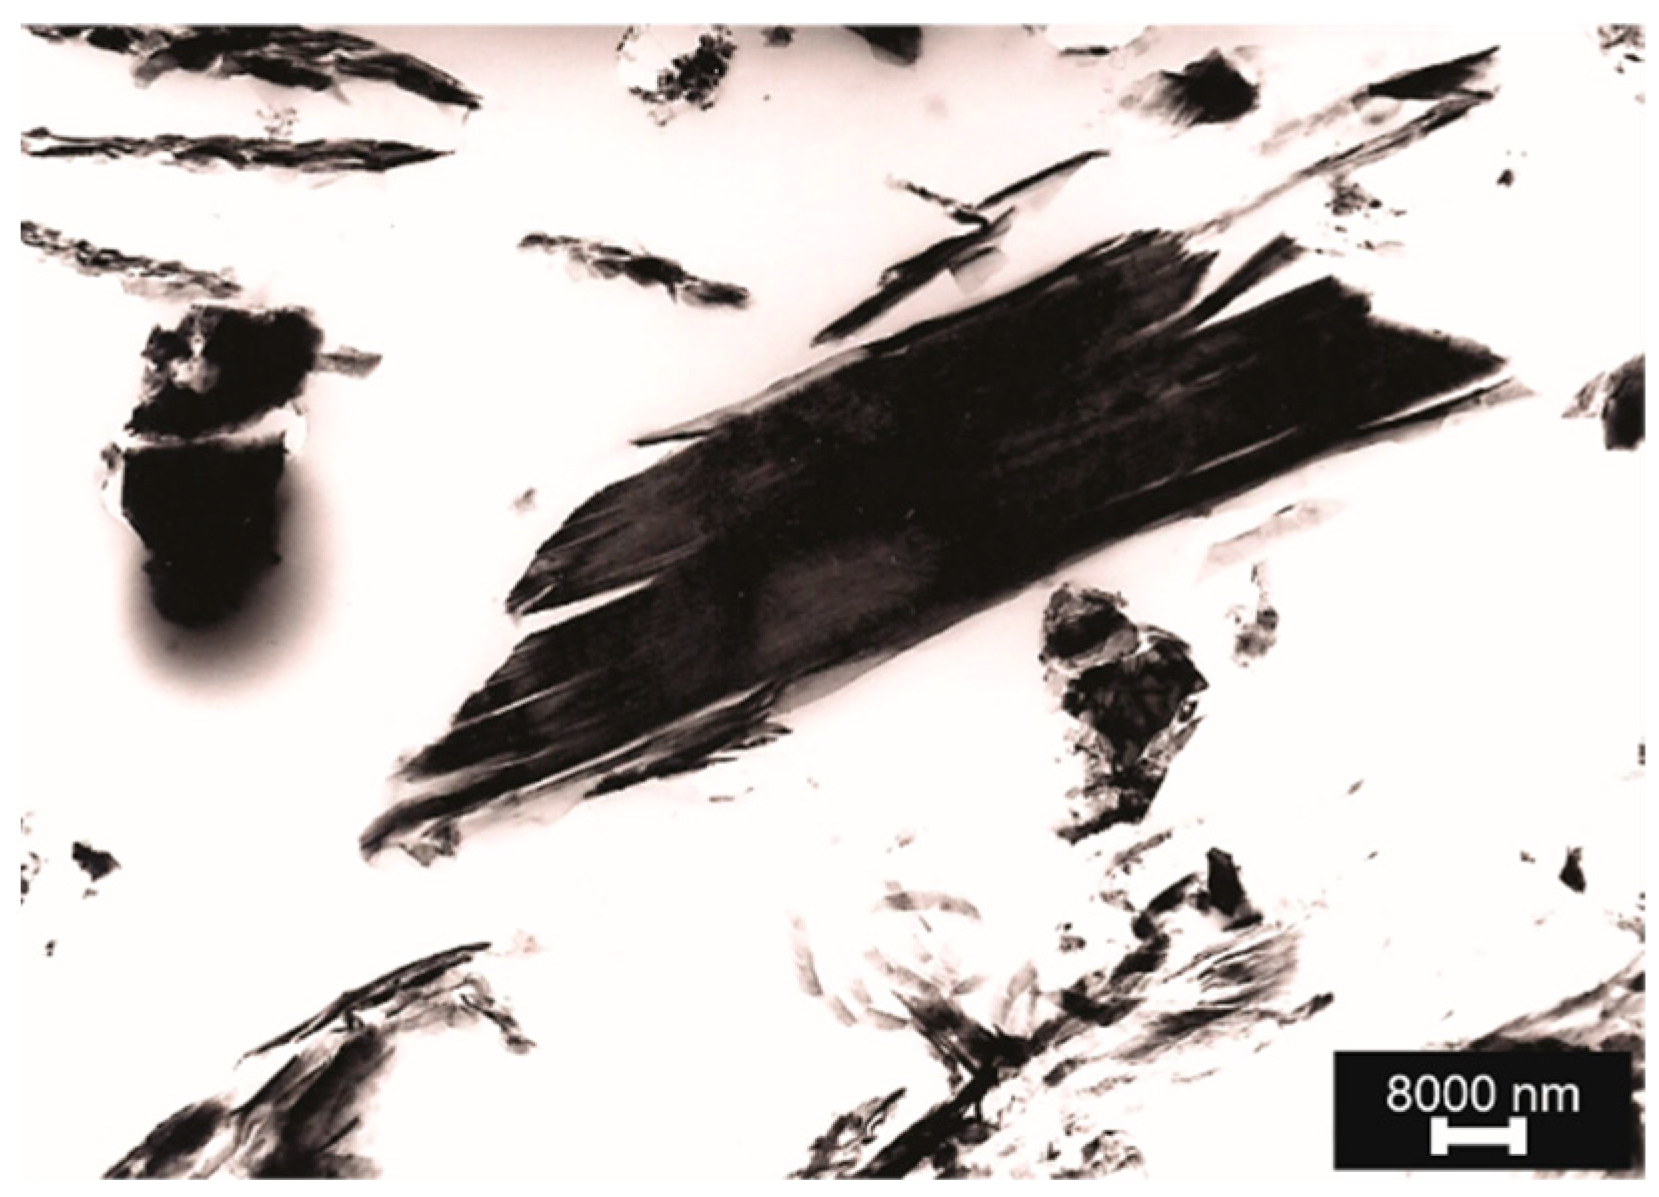
Figure 4 shows the TEM micrograph of finely ground talc (<20 μm). It can be observed that each particle is constituted by several individual sheets stacked one on top of the other. The mean thickness of talc particles is 0.266 ± 0.173 μm. This value was obtained by measuring approximately 500 particles.
The results of chemical analyses are presented in
Table 1. The macrocrystalline talc under study has a lower SiO
2 content than the most talcs (higher than 50 wt%). This value proceeds from the presence of associated minerals and it is related to the place where talc has been extracted [
29]. Moreover, this sample has a MgO content lower than a rock entirely composed of talc (31.80 wt%). According to these results, this talc presents a Si/Mg ratio of 2.74, while the theoretical value obtained from the stoichiometric formula is 1.97. Thus, there are two possible ways for the origin: talc-forming fluids extracted Mg
2+ from the rock or they supplied Si
4+ to it. From the microscopic analysis some SiO
2 relics are present (
Figure 1a), so that the origin of this talc was probably a rock rich in Mg
2+ as dunite, previously reported by Fernandez Lima [
30], and the fluids captured Si
4+ from SiO
2 relics.
The value for aluminum oxide (Al
2O
3) relates to the chlorite content in the sample, meanwhile the percentage of CaO reveals the presence of calcite. The low SiO
2 content and high amount of CaO and Al
2O
3 confirm the previous results obtained by OM and XRD. The presence of manganese oxide (MnO) in talc is possible since this element can substitute magnesium in octahedral sites within the talc structure. Chidester et al. [
31] reported a similar MnO percentage to that determined for argentinean talc in samples from the United States. Iron content is an effective parameter in the use of talc since it affects its color and brightness [
32]. Its percentage, origin (i.e., from crystal structure or from other iron-bearing minerals), and valence forms are important. For this talc sample the Fe
2O
3 content is 1.2 wt%. This value is not unusual in talc, which can be associated with substitutions of Fe in the octahedral site for Mg (as chlorite) or the presence as oxides itself [
33].
Loss on ignition (LOI) for this talc sample, which indicates the weight percent of the sample that was volatilized in the furnace, is also included in
Table 1. This value is high since it is related to the presence of carbonates and other clay minerals such chlorite, as it was reported by Pi-Puig, Animas-Torices and Solé [
34].
From the obtained results by XRF and XRD it can be inferred that the studied talc sample is composed approximately of 80 wt% talc. Several authors demonstrate that talc purity can be upgraded by removing associated minerals and iron oxides through acid leaching [
35,
36,
37,
38].
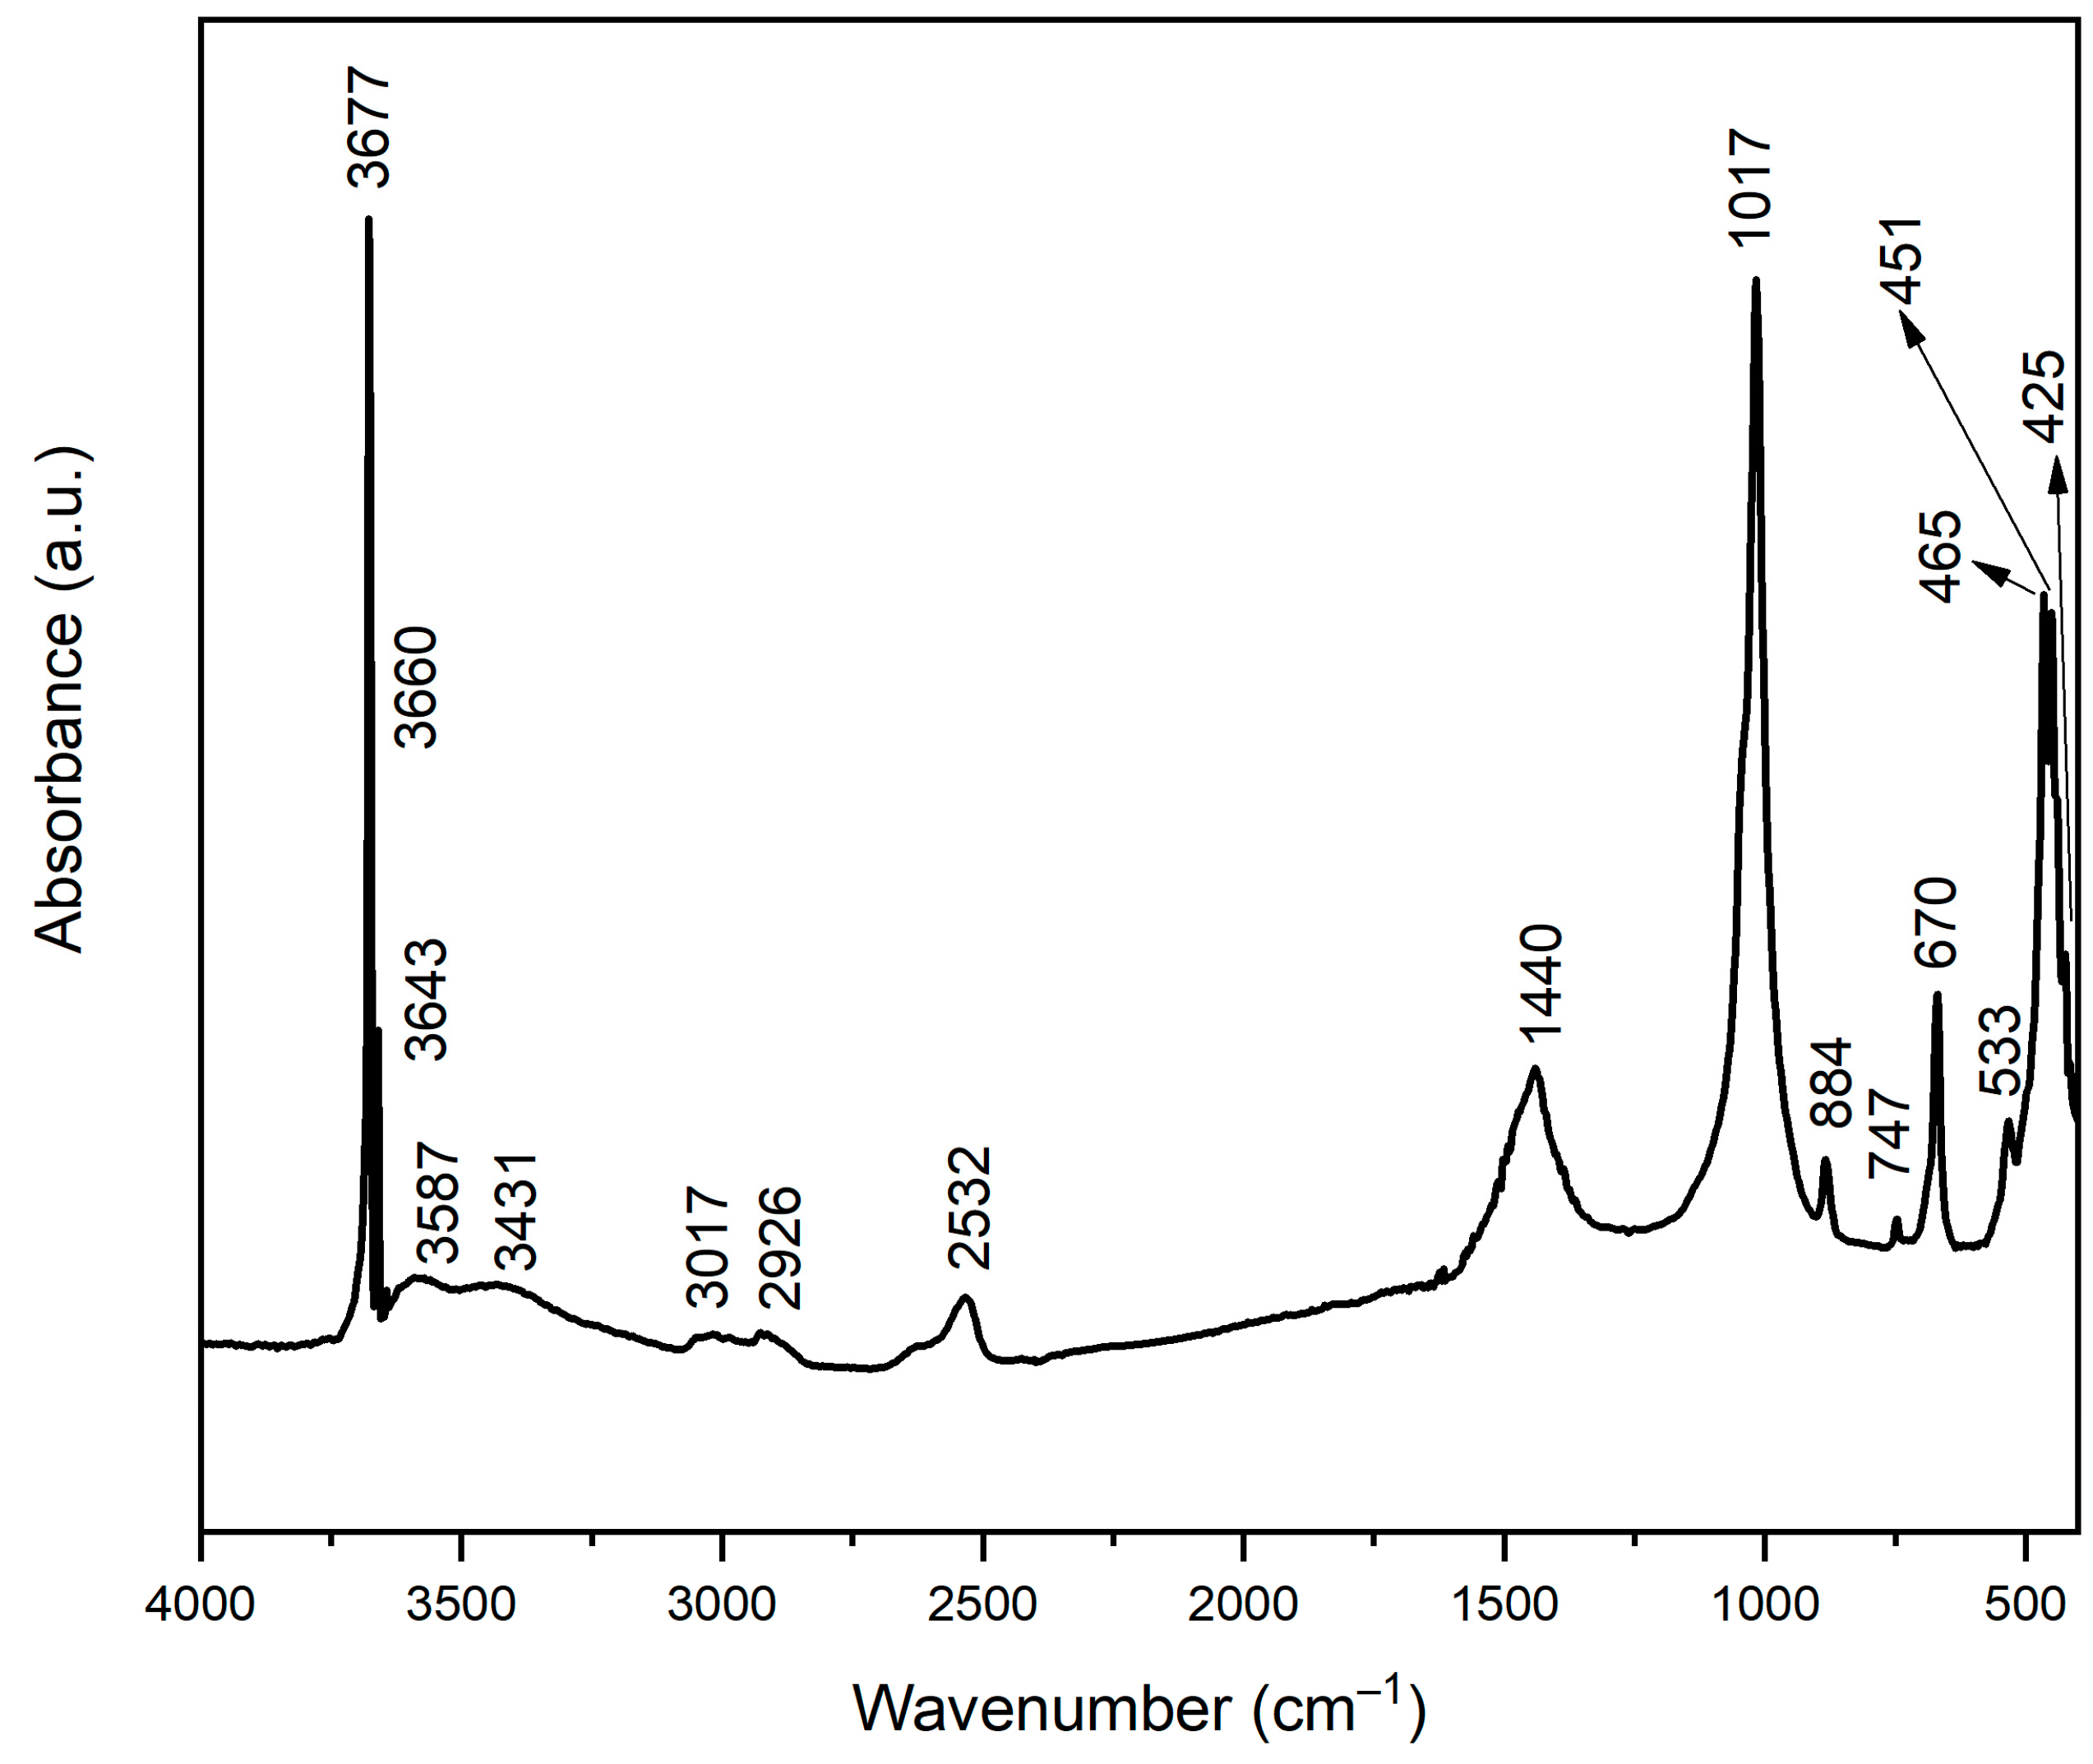
Figure 5 shows the FTIR spectra of talc which includes the band assignment to the corresponding minerals. In the -OH stretching region (3400–3800 cm
−1), three bands can be detected. The signal at 3677 cm
−1 corresponds to the interactions of Mg
3-OH where all the -OH groups present identical surroundings, bound to three octahedral cations (Mg
2+) as their nearest neighbors. The high frequency of this vibration is characteristic of a strong -OH bond with little or no hydrogen bonding. Bands at 3660 and 3643 cm
−1 are related to the partial replacement of Mg
2+ by Fe
2+/Fe
3+ and they correspond to possible combinations of the two different cations within the octahedral sites [
39]. Considering that the wavenumber of -OH stretching is affected by the nature of the cations (electronegativity, atomic mass, size, etc.) and by the total charge in the octahedral sheet, the replacement by Fe
2+/Fe
3+ lowers the band vibrational frequency with respect to the corresponding Mg
3-OH. In this sense, the band at 3660 cm
−1 is associated with Mg
2Fe-OH and at 3643 cm
−1 is related to MgFe
2-OH. In the region 400–1300 cm
−1, the spectrum shows well-defined absorption talc bands. At 1017 cm
−1 the stretching vibration of Si-O-Si bonds is detected, meanwhile the deformation of -OH is observed at 670 cm
−1. In addition, there are bands at 533 and 451 cm
−1 which are associated with Si-O-Mg vibration, at 465 cm
−1 to Mg-O and at 425 cm
−1 to Si-O. Besides talc bands, this sample contains associated minerals such as chlorite (3687 and 3431 cm
−1), calcite and dolomite (2926, 2532, 1440 and 884 cm
−1), and magnesite (1440, 884 and 747 cm
−1).
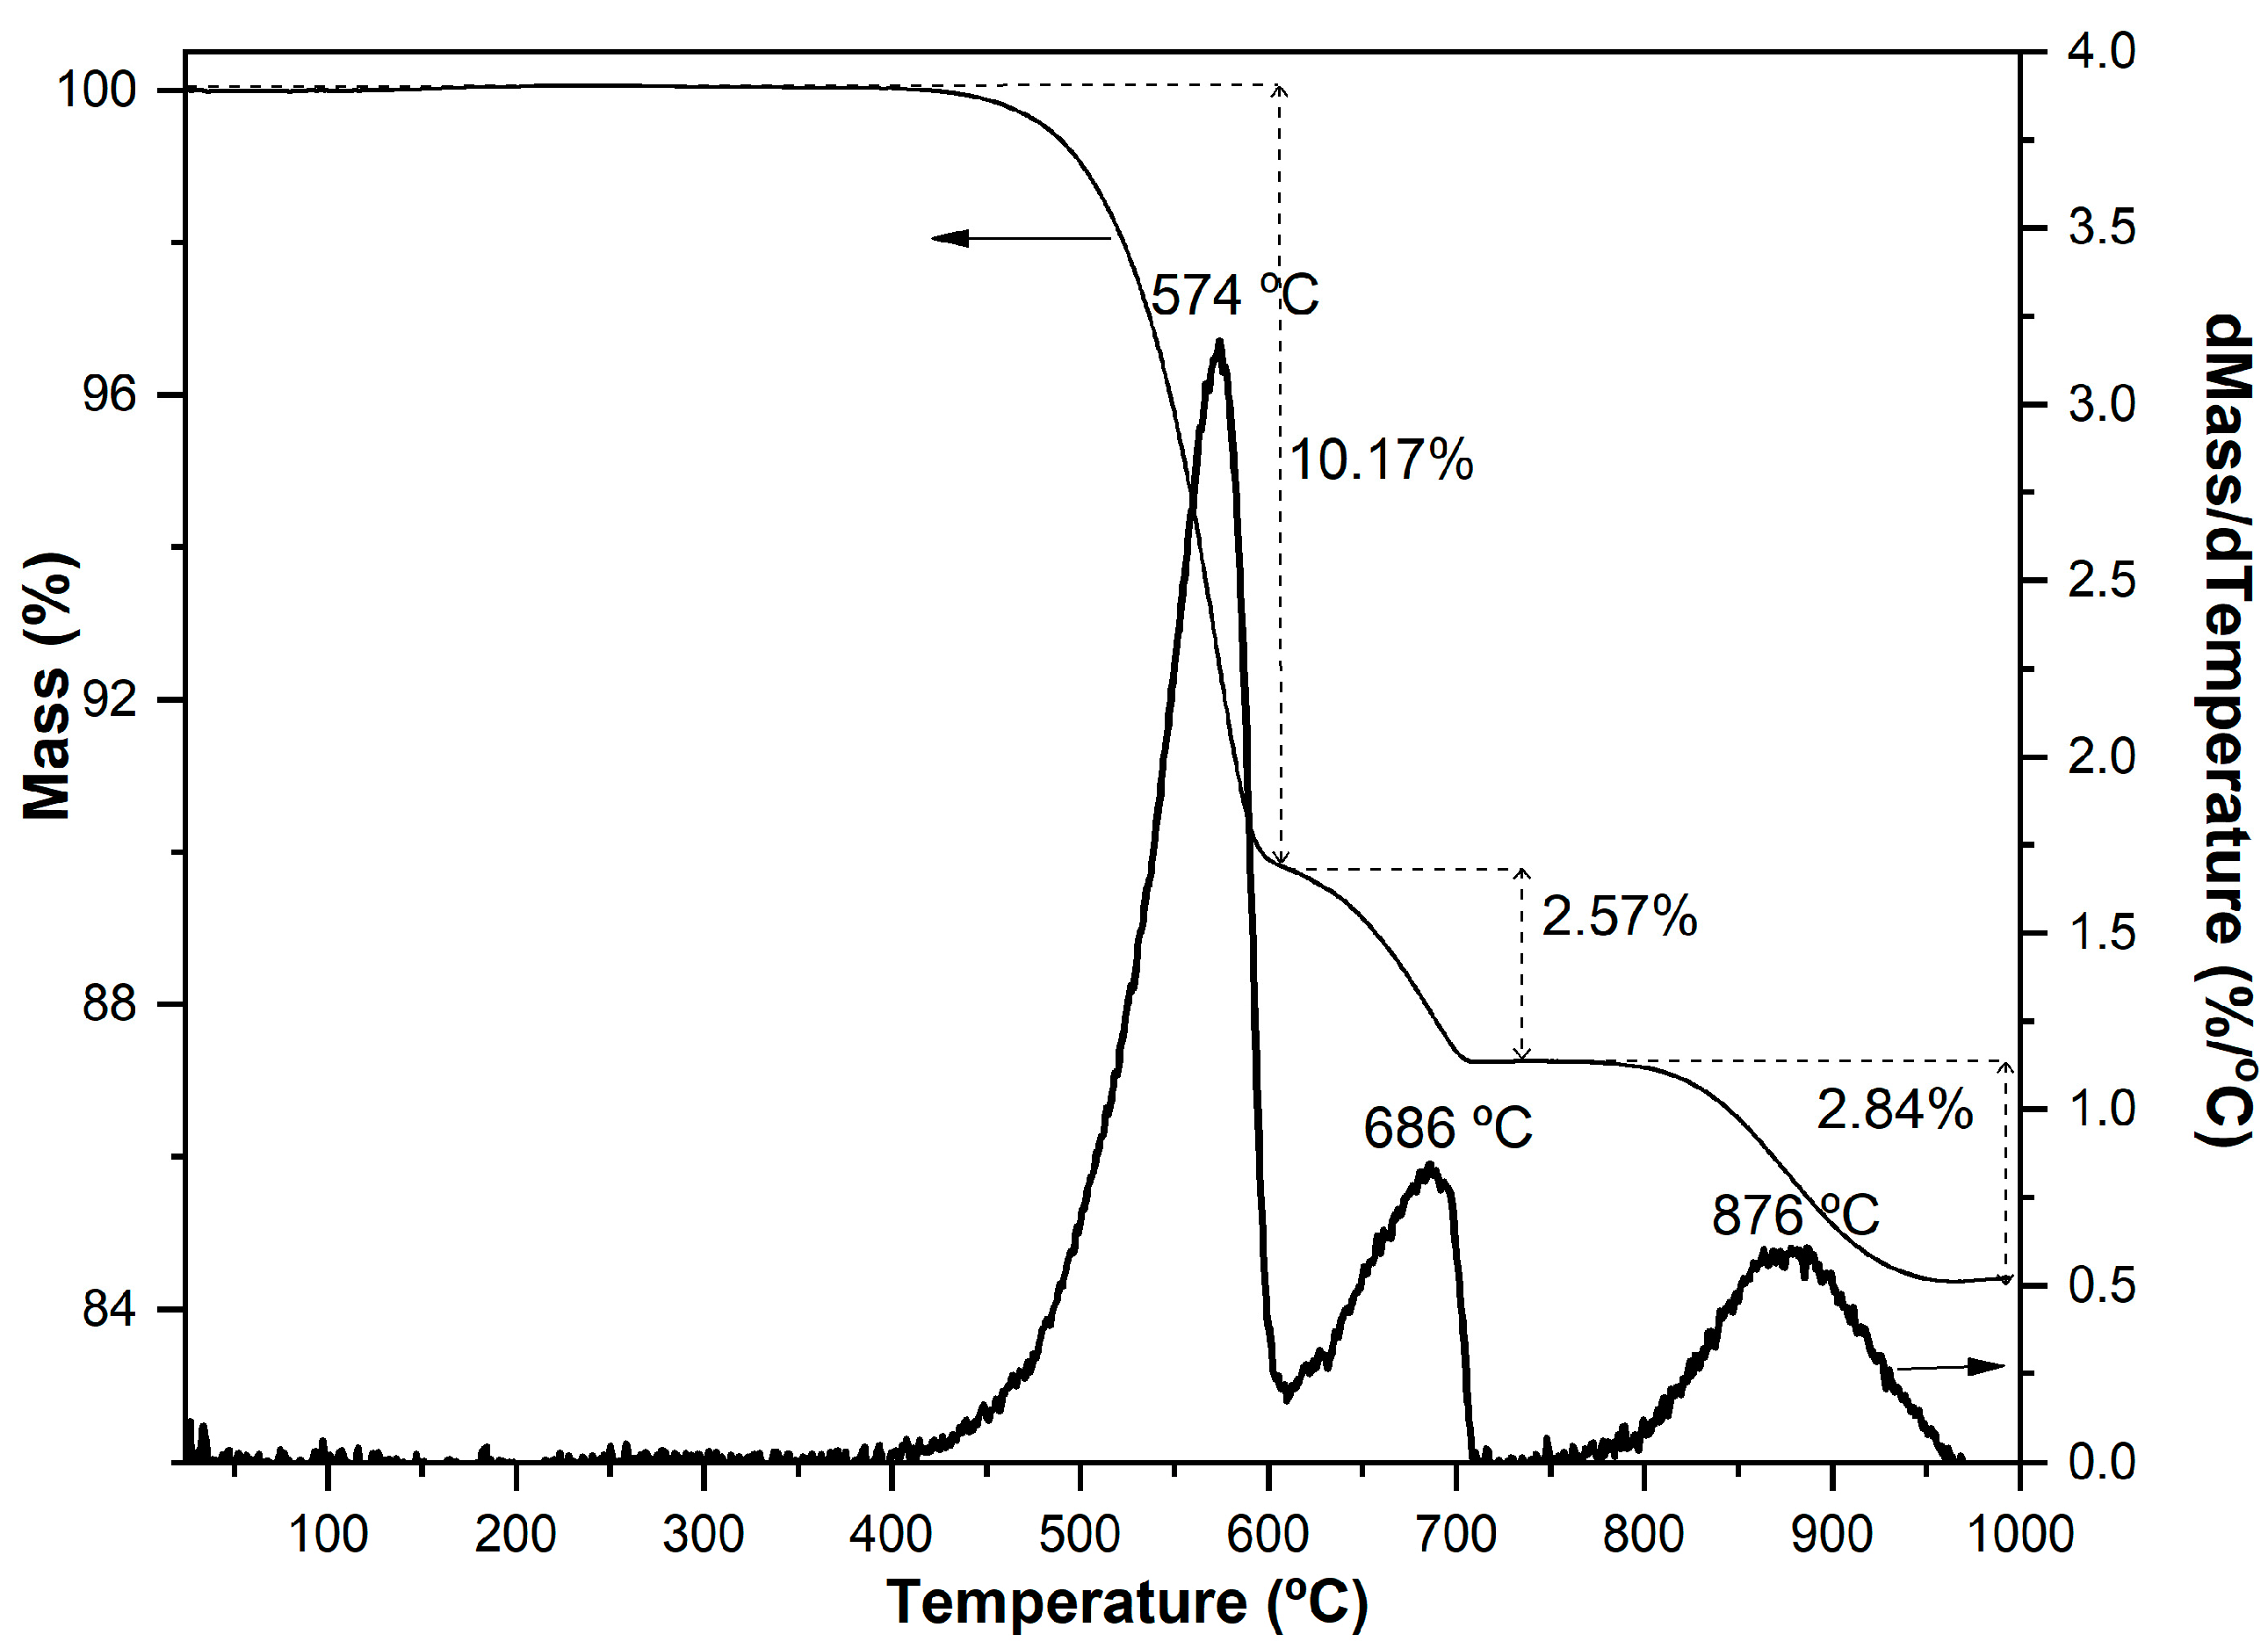
TG and DTG curves of talc are shown in
Figure 6 where mass loss and degradation temperature are included for each event. It can be observed that the sample suffers three mass losses up to 1000 °C. This sample does not contain physically adsorbed water since its mass is constant up to 150 °C. The first and most important mass loss (10.17%) begins at 400 °C and corresponds to the thermal decomposition of chlorite (dehydroxylation reaction) [
40]. At 600 °C, magnesite starts to decompose thermally. From 800 °C several thermal decompositions occur and the corresponding mass loss is overlapped. In this sense, talc begins to decompose into enstatite (MgSiO
3) and silica minerals (SiO
2) [
41], but also dolomite and calcite start to be decomposed [
42]. The total mass loss corresponds to 15.58%, which is very similar to the LOI value obtained by the chemical analysis (
Table 1), as expected.
Color is one of the most important properties for evaluating talc commercial value. It is associated with the extent of light reflection–diffusion on the mineral surface, which depends on grain size, grain shape, and particle roughness, as well as chemical composition [
28,
32,
43,
44,
45,
46]. Color parameters for the studied talc in the CIELAB (Commission Internationale de l´Eclairage
L*
a*
b*) system are
L* = 82.76,
a* = −1.50, and
b* = 5.38; where
L* ranges from 100 (white) to 0 (black),
a* from −
a* (green) to +
a* (red), and
b* from −
b* (blue) to +
b* (yellow). These results reveal a green chromatic component and a slight yellowing, confirming the observations made with the naked eye. The color of the studied talc could be attributed to the presence of associated minerals such as chlorite or traces of Fe oxides [
40,
47,
48]. It has been reported that chlorite contains chromophore elements in its structure [
49,
50,
51,
52] and it is responsible for the greenish and yellowish colors in commercial talc. The presence of magnesium carbonates such as magnesite and dolomite could induce a darkening by lowering the
L* value. Concerning the calcium carbonate influence on color parameters, it was reported that it has a less total effect than the other carbonates [
48]. The whiteness index (
WI) value for this talc is 62.12, which impedes its commercialization as a high-priced mineral (
WI higher than 91%) for paper, cosmetics, and ceramic applications.
Although some features of this talc sample restrict its use in the aforementioned applications, it can be employed as a very efficient filler for plastics. Talc particles can be suitable for most traditional processes of plastic products such as extrusion blow molding, injection molding, extrusion molding and compression molding, among others, without having to upgrade or change the equipment or the production technology. At the beginning, talc particles were mixed with polymers to reduce costs, but later it was demonstrated that there were other advantages related to material performance. In this sense, talc particles influence mechanical, thermal, optical, and barrier properties of polymers [
53,
54]. Regardless of its crystalline morphology, talc acts as a nucleating agent since its basal surfaces offer active sites to nucleate polymer crystals [
55]. This allows improving the productivity as talc particles accelerate the cooling rate of plastic compounds. Particularly, macrocrystalline talc has a higher surface than the microcrystalline one where thicker crystals can be epitaxially grown. The induction of these specific crystals with distinctive mechanical properties is different from those induced by other mineral particles, even for microcrystalline talc [
56]. In addition, it promotes a high polymer chain orientation as a consequence of particle preferential spatial distribution during processing. Macrocrystalline talc improves light barrier properties since particle orientation in polymer matrices blocks the light transmission. The enhancement of gas barrier properties is given by the tortuous path that particles offer to gas diffusion, but also by the crystals that they induce and the hydrophobic character of its basal surfaces. Concerning the color parameters of this talc sample, this is not a critical aspect for plastic products since different pigments can be incorporated during the manufacturing. Moreover, it was demonstrated that associated minerals such as iron impurities could act as promoters of polymer degradation. In this way, this talc sample is a good environmentally friendly alternative as a pro-degradant additive for polymer degradation due to its low cost and sustainability, since it does not contain heavy metals [
57]. On the other hand, an integrated purification process was proposed in order to remove mainly the iron oxides [
58]. When this process is applied in a macrocrystalline talc, a purified mineral is obtained, conserving its morphological characteristics (i.e., macrocrystalline character).


