
Isomorphism and Mutual Transformations of S-Bearing Components in Feldspathoids with Microporous Structures
 , , ,
, , ,  , ,
, ,
Abstract
:1. Introduction
2. Materials and Methods
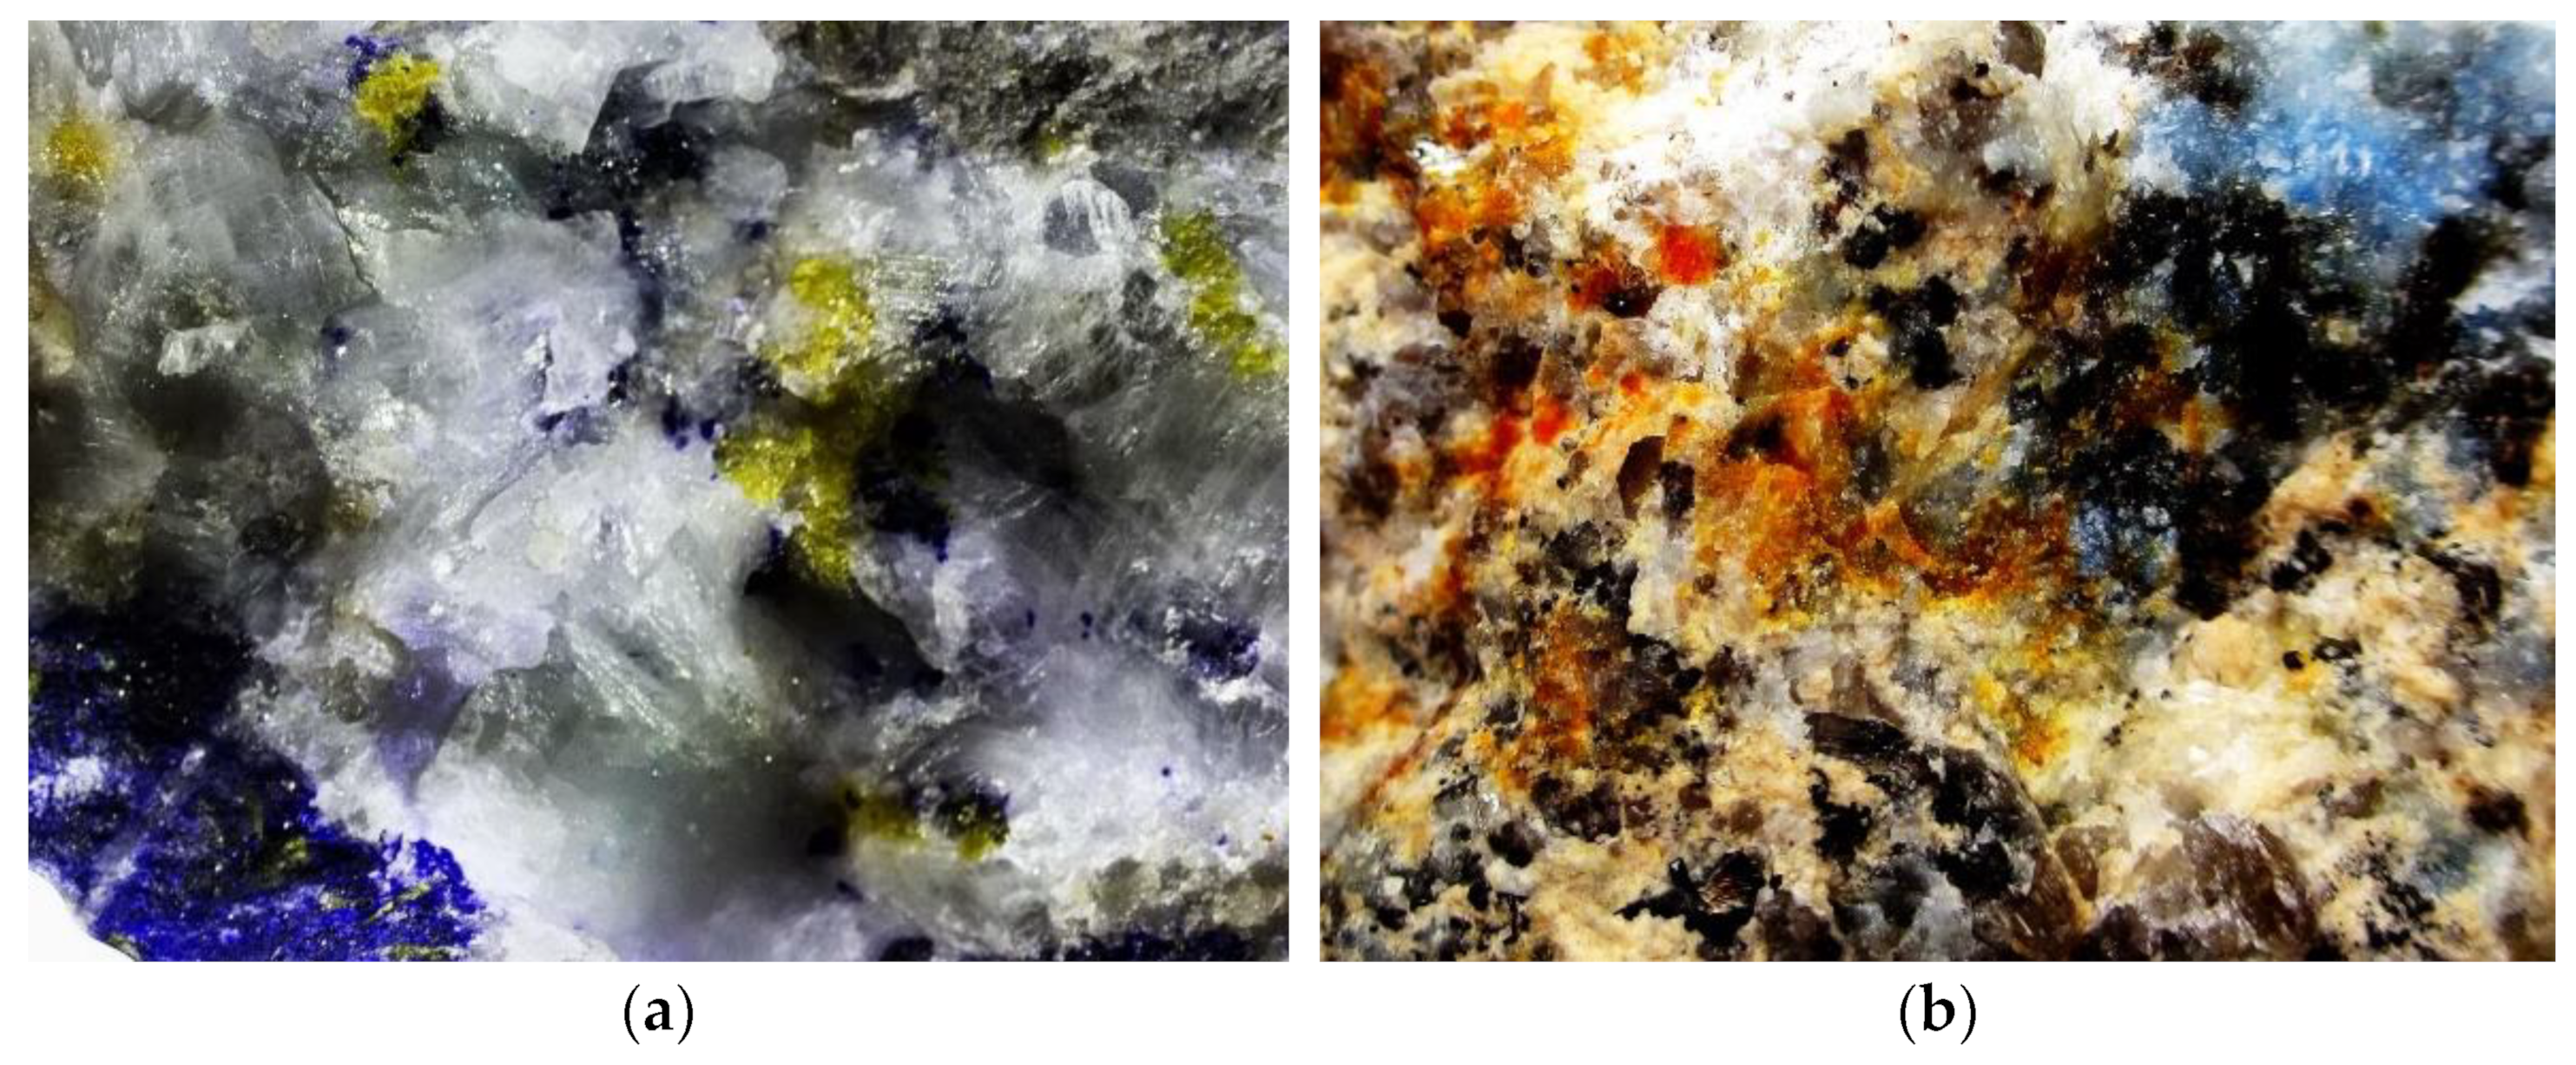
2.1. Natural Samples
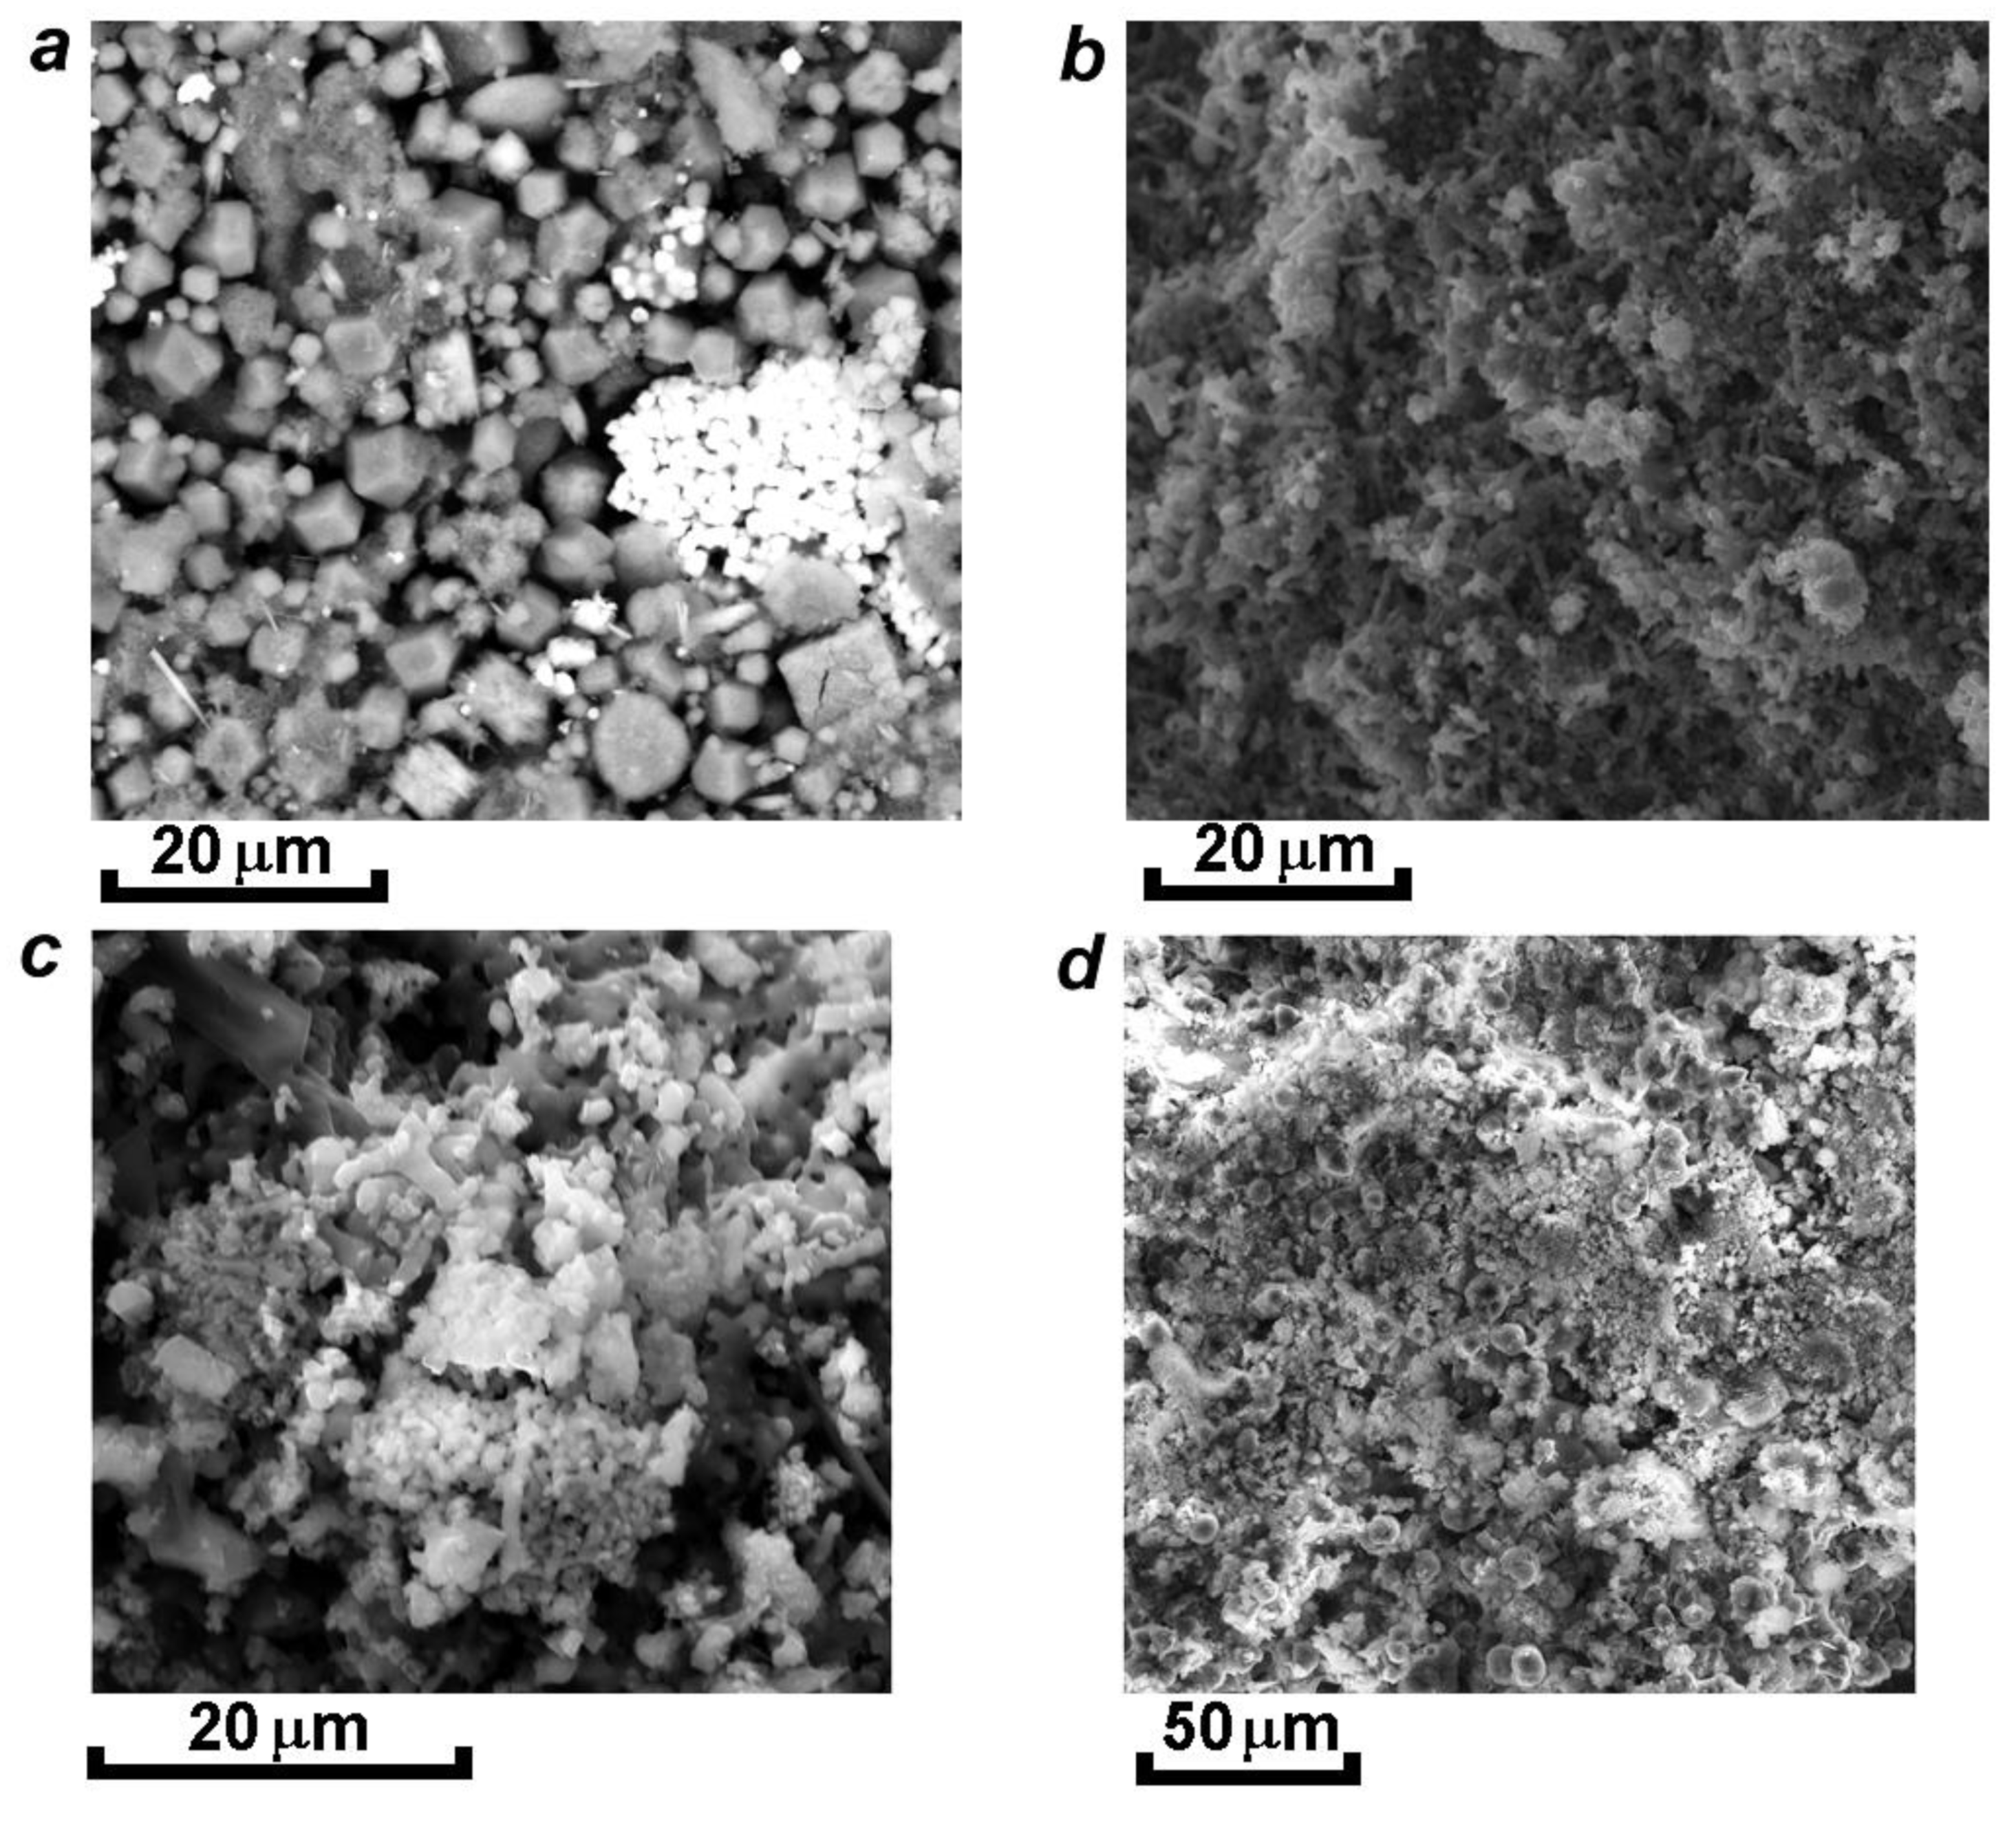
2.2. Synthesis and Thermal Conversions
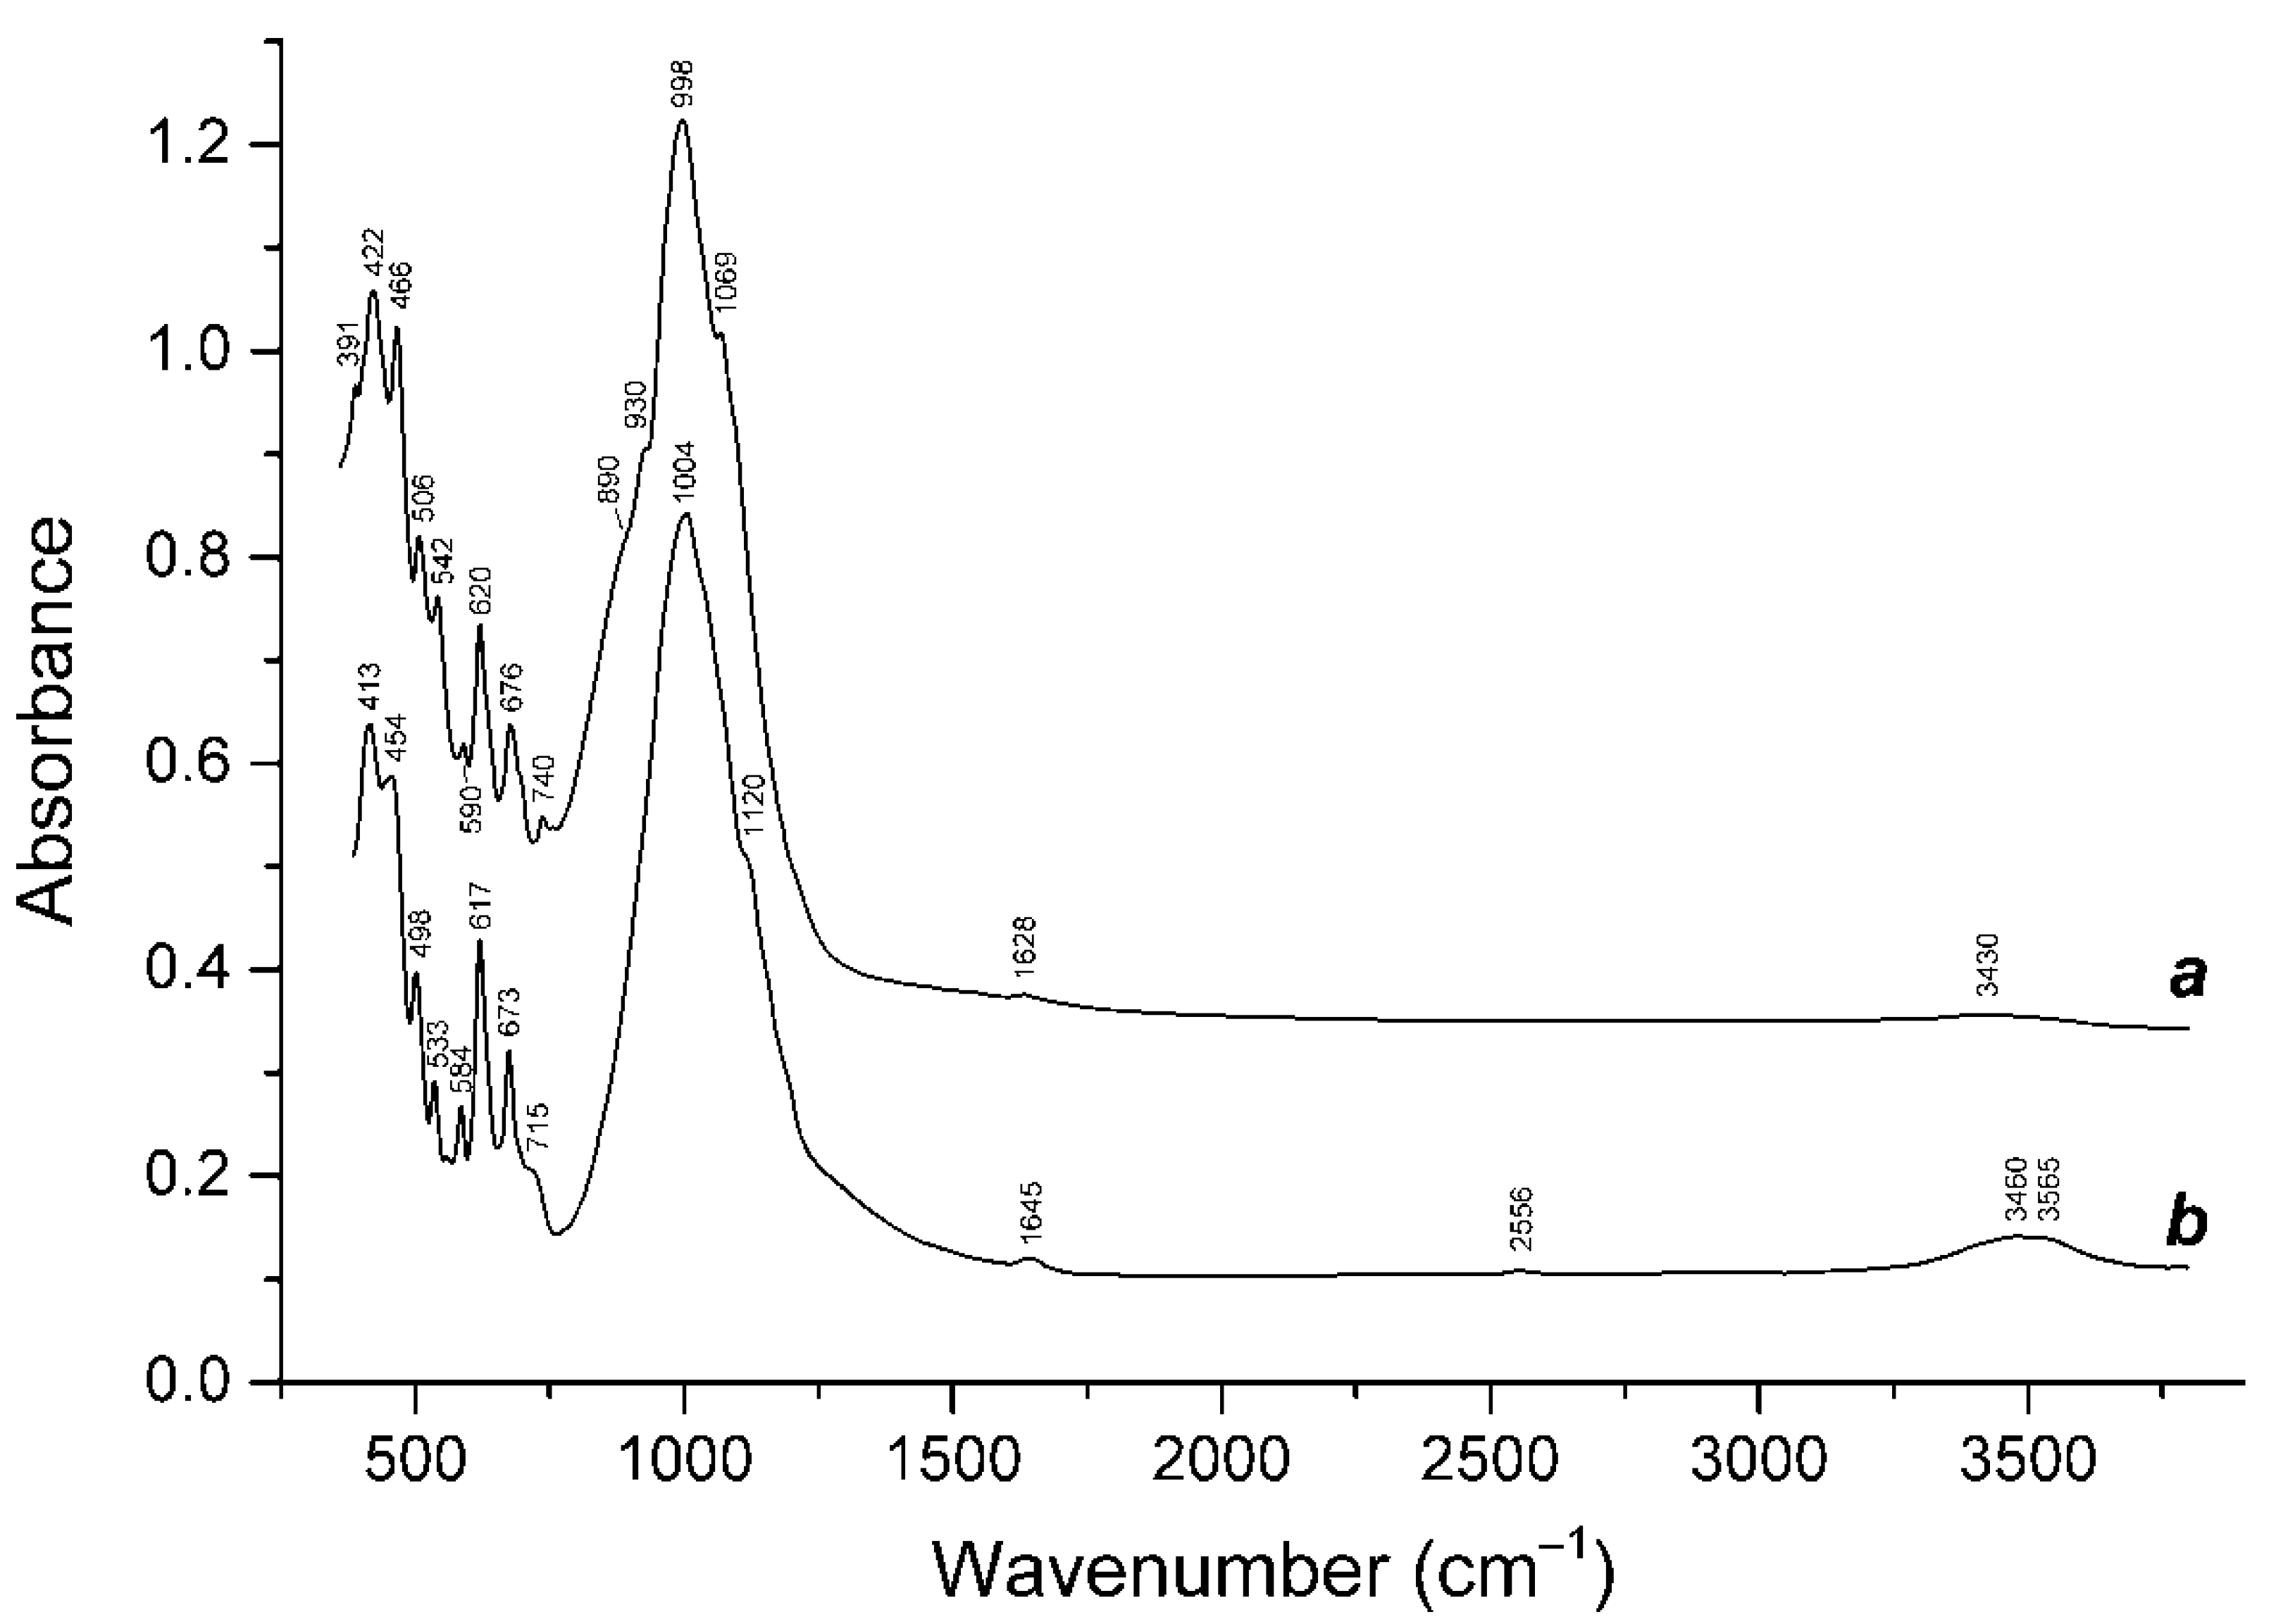
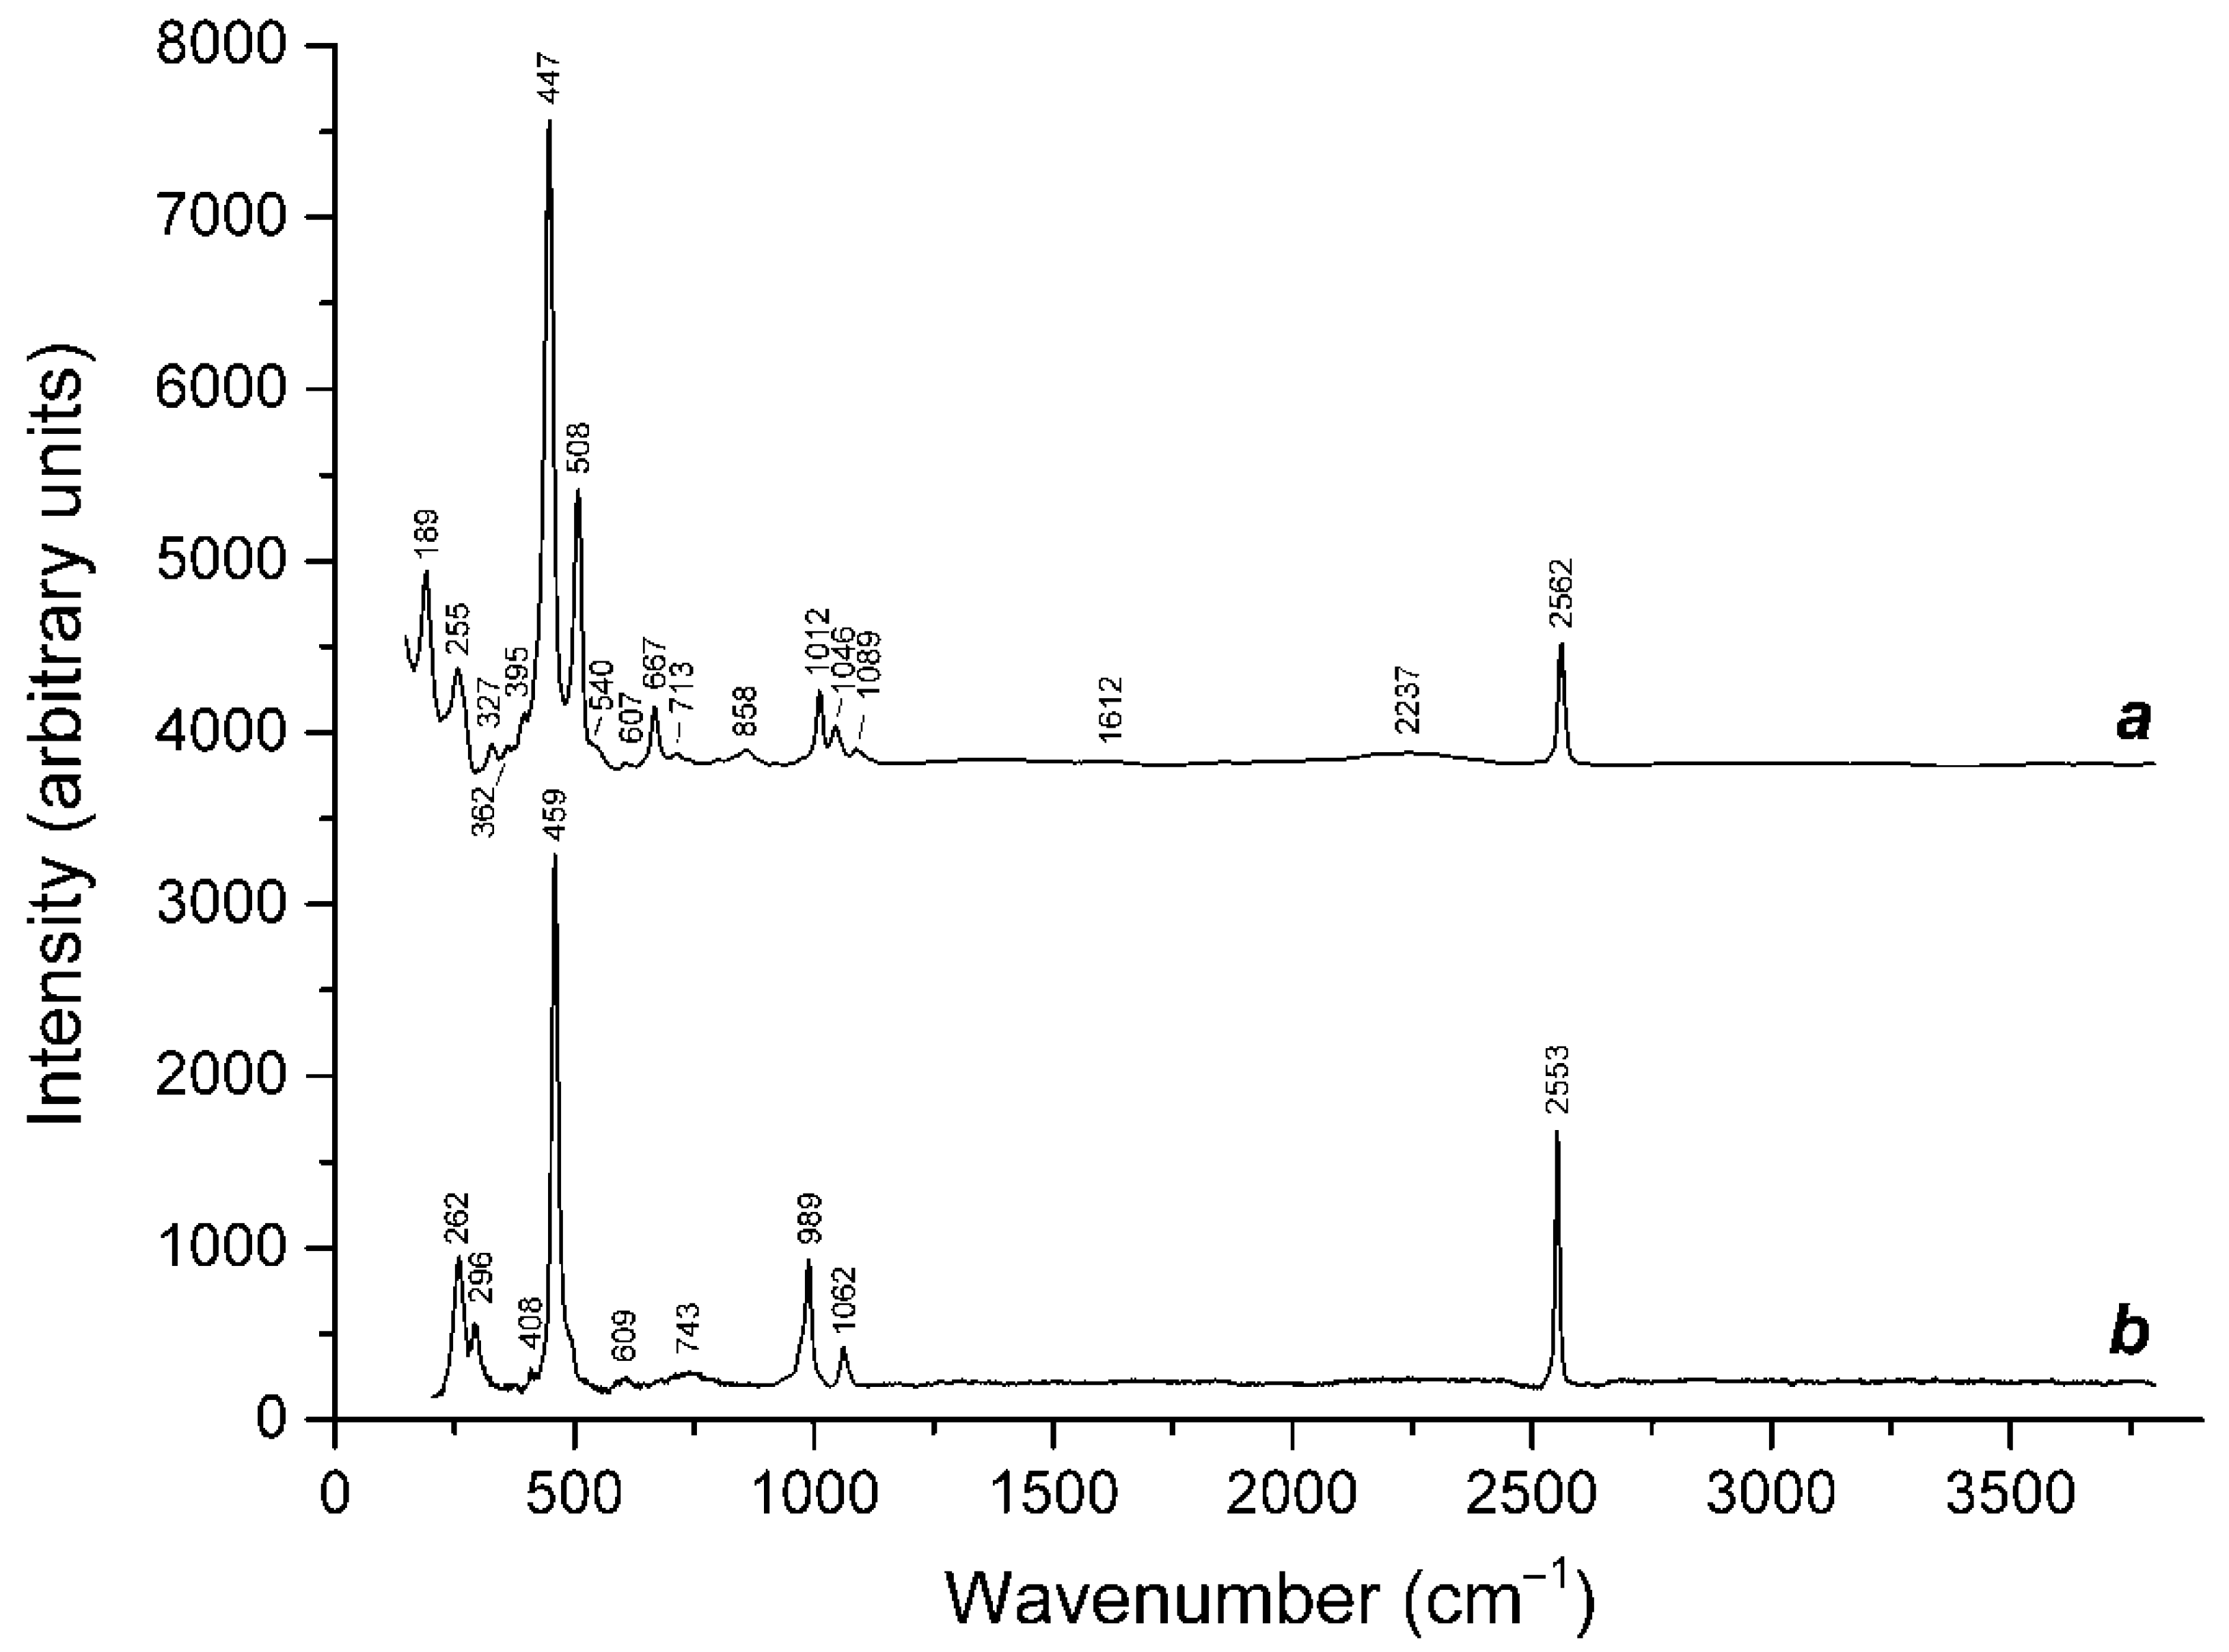
2.3. Analytical Methods
3. Results
3.1. Minerals of the Cancrinite-Cancrisilite-Vishnevite Solid-Solution Series
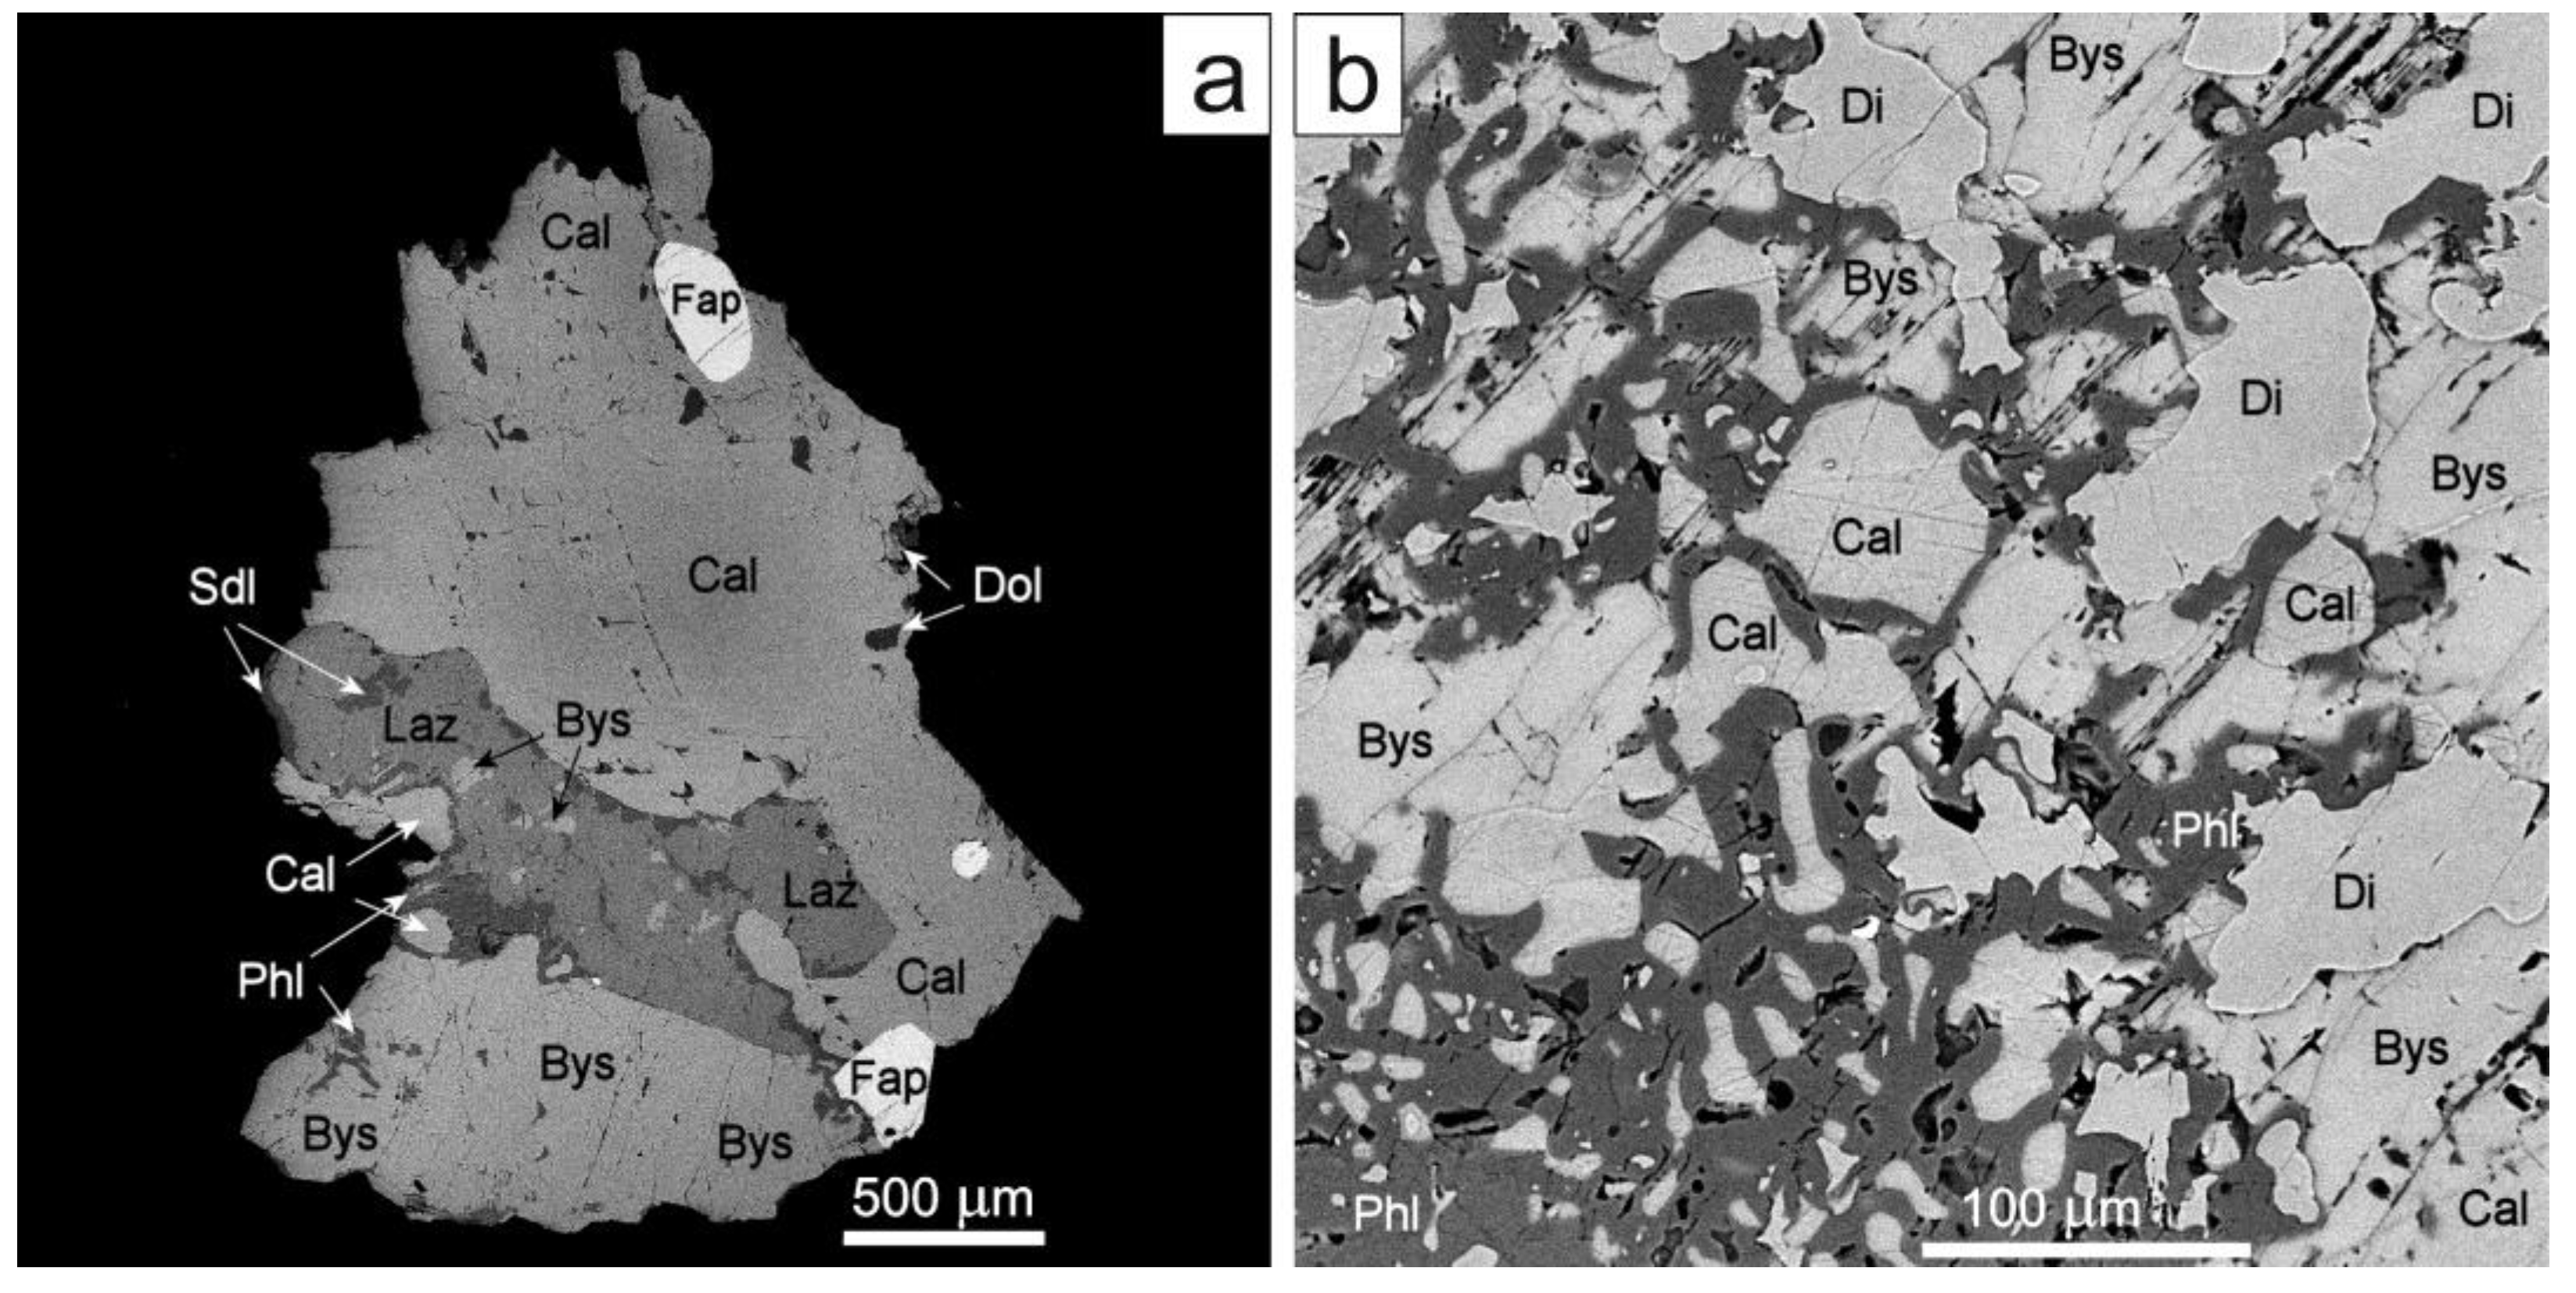
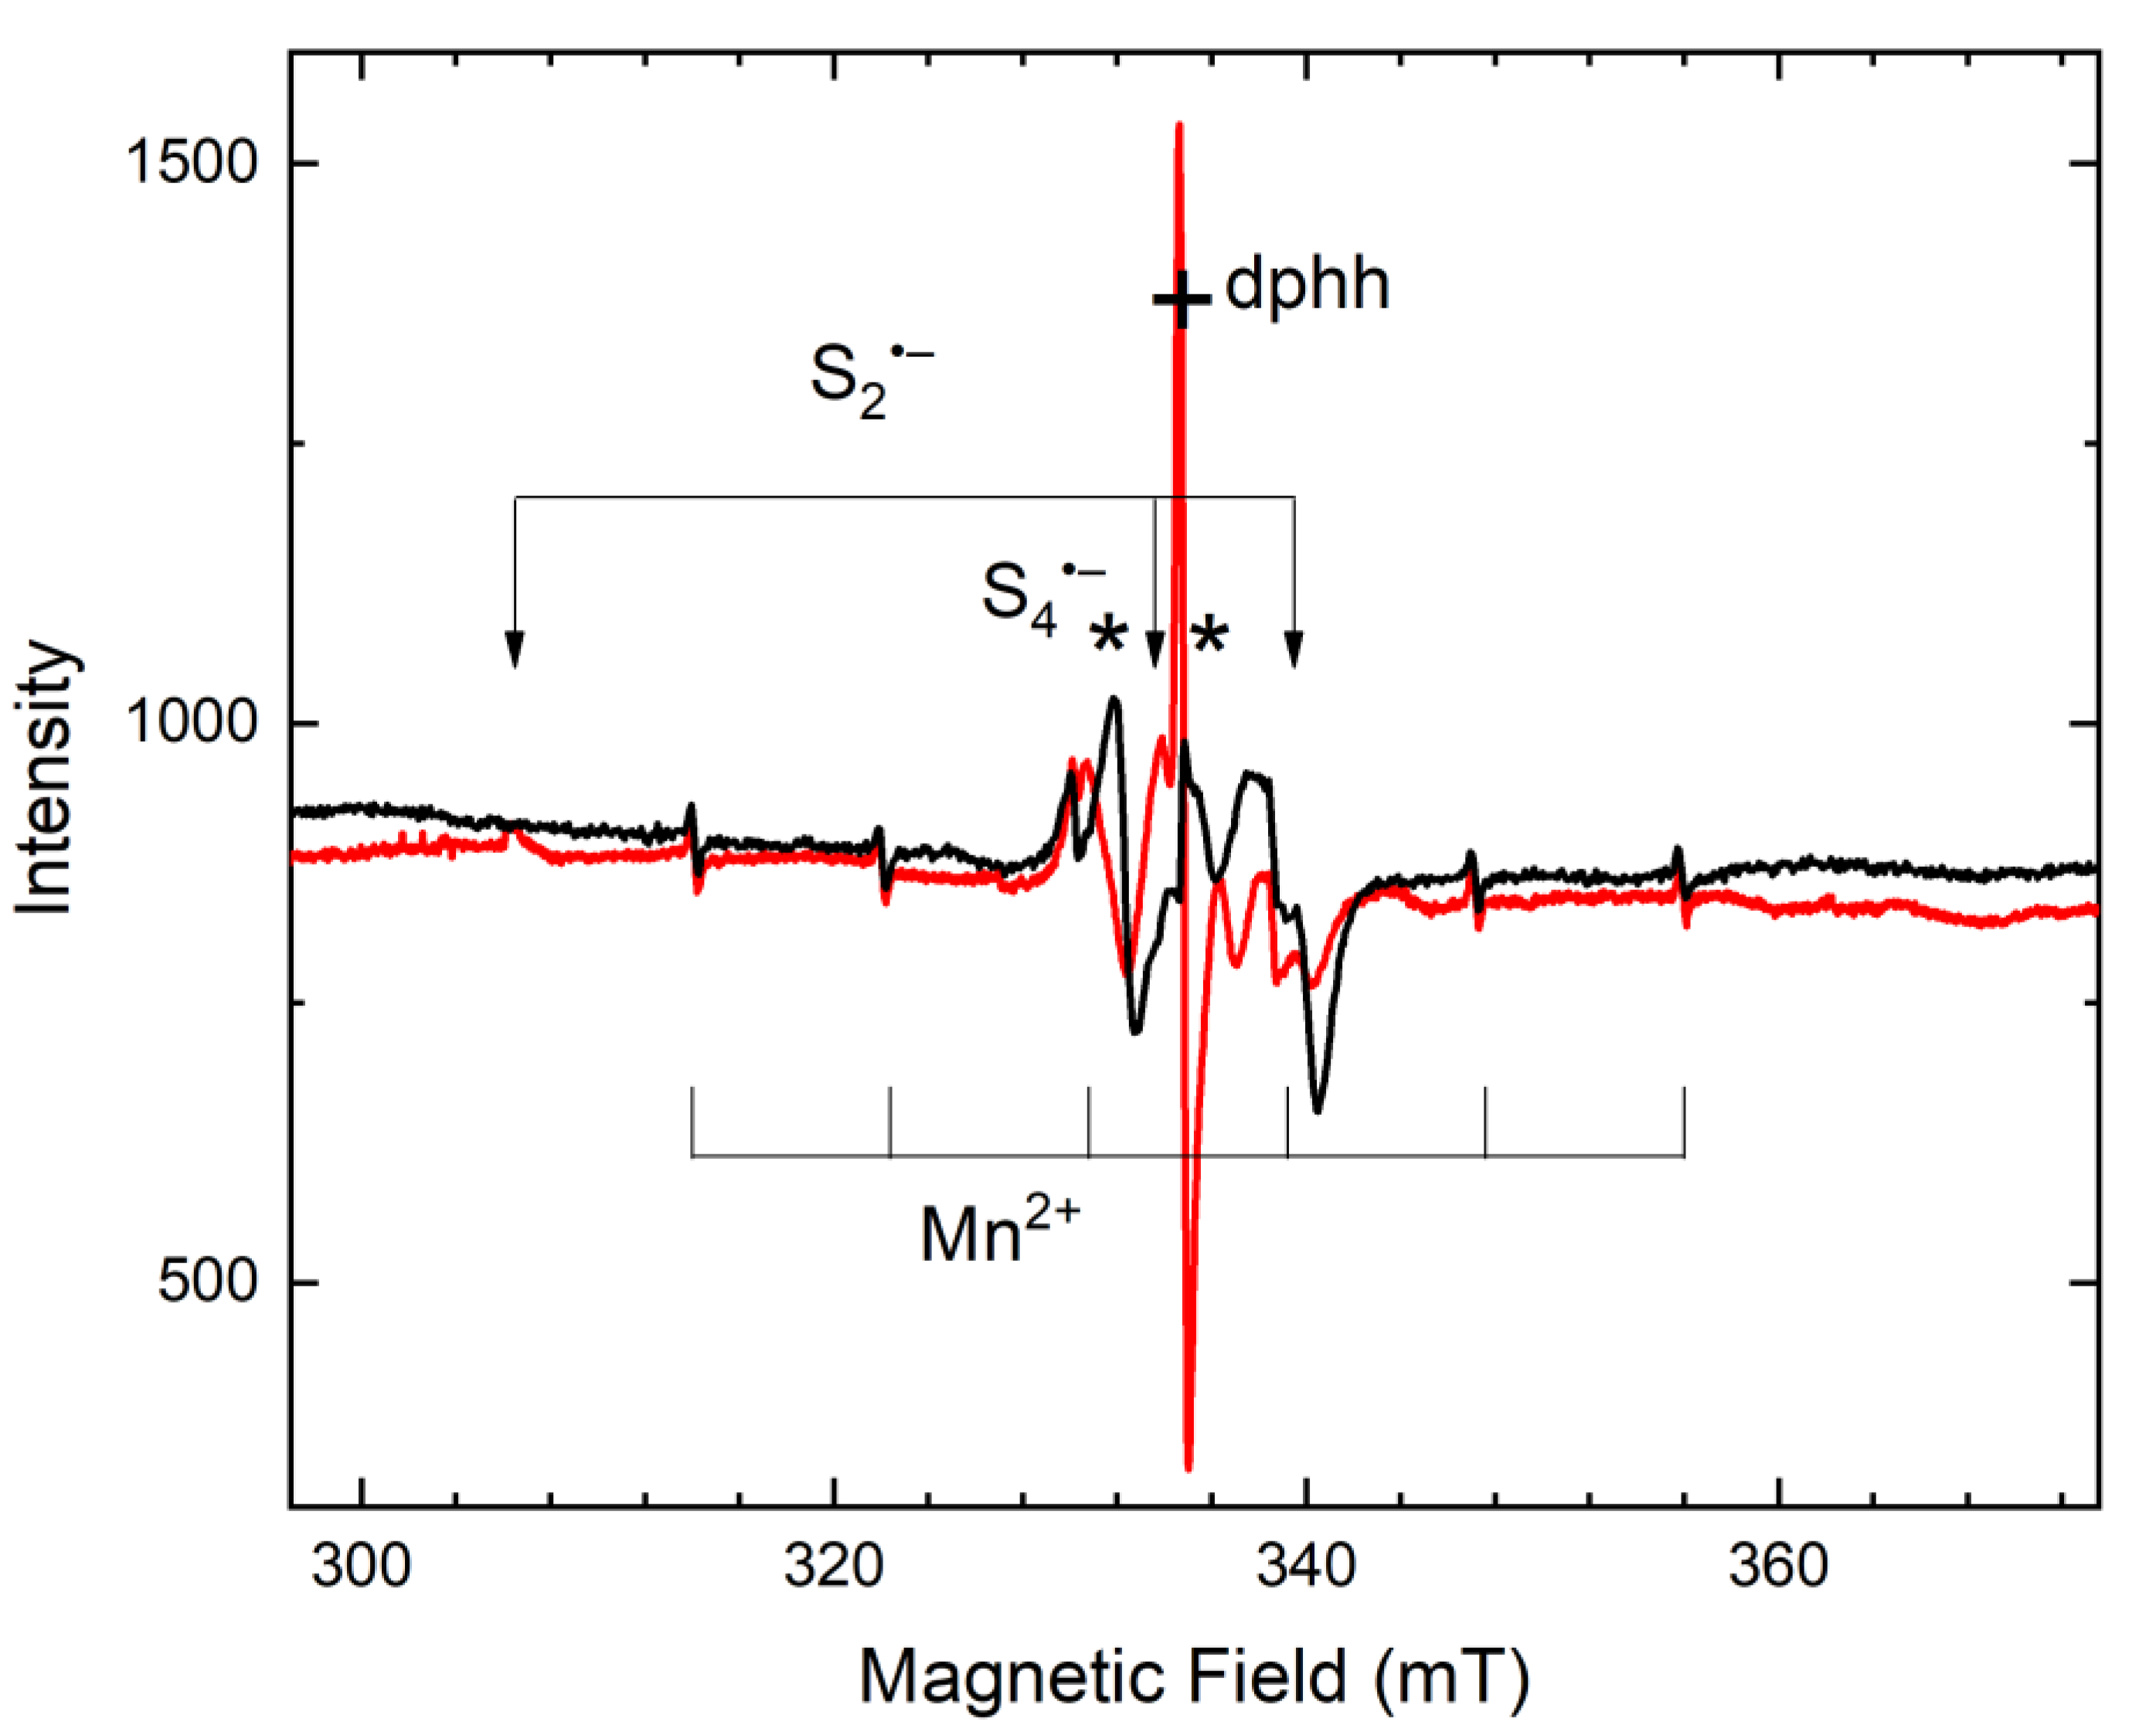
3.2. Isomorphism of Bystrite and Sulfhydrylbystrite
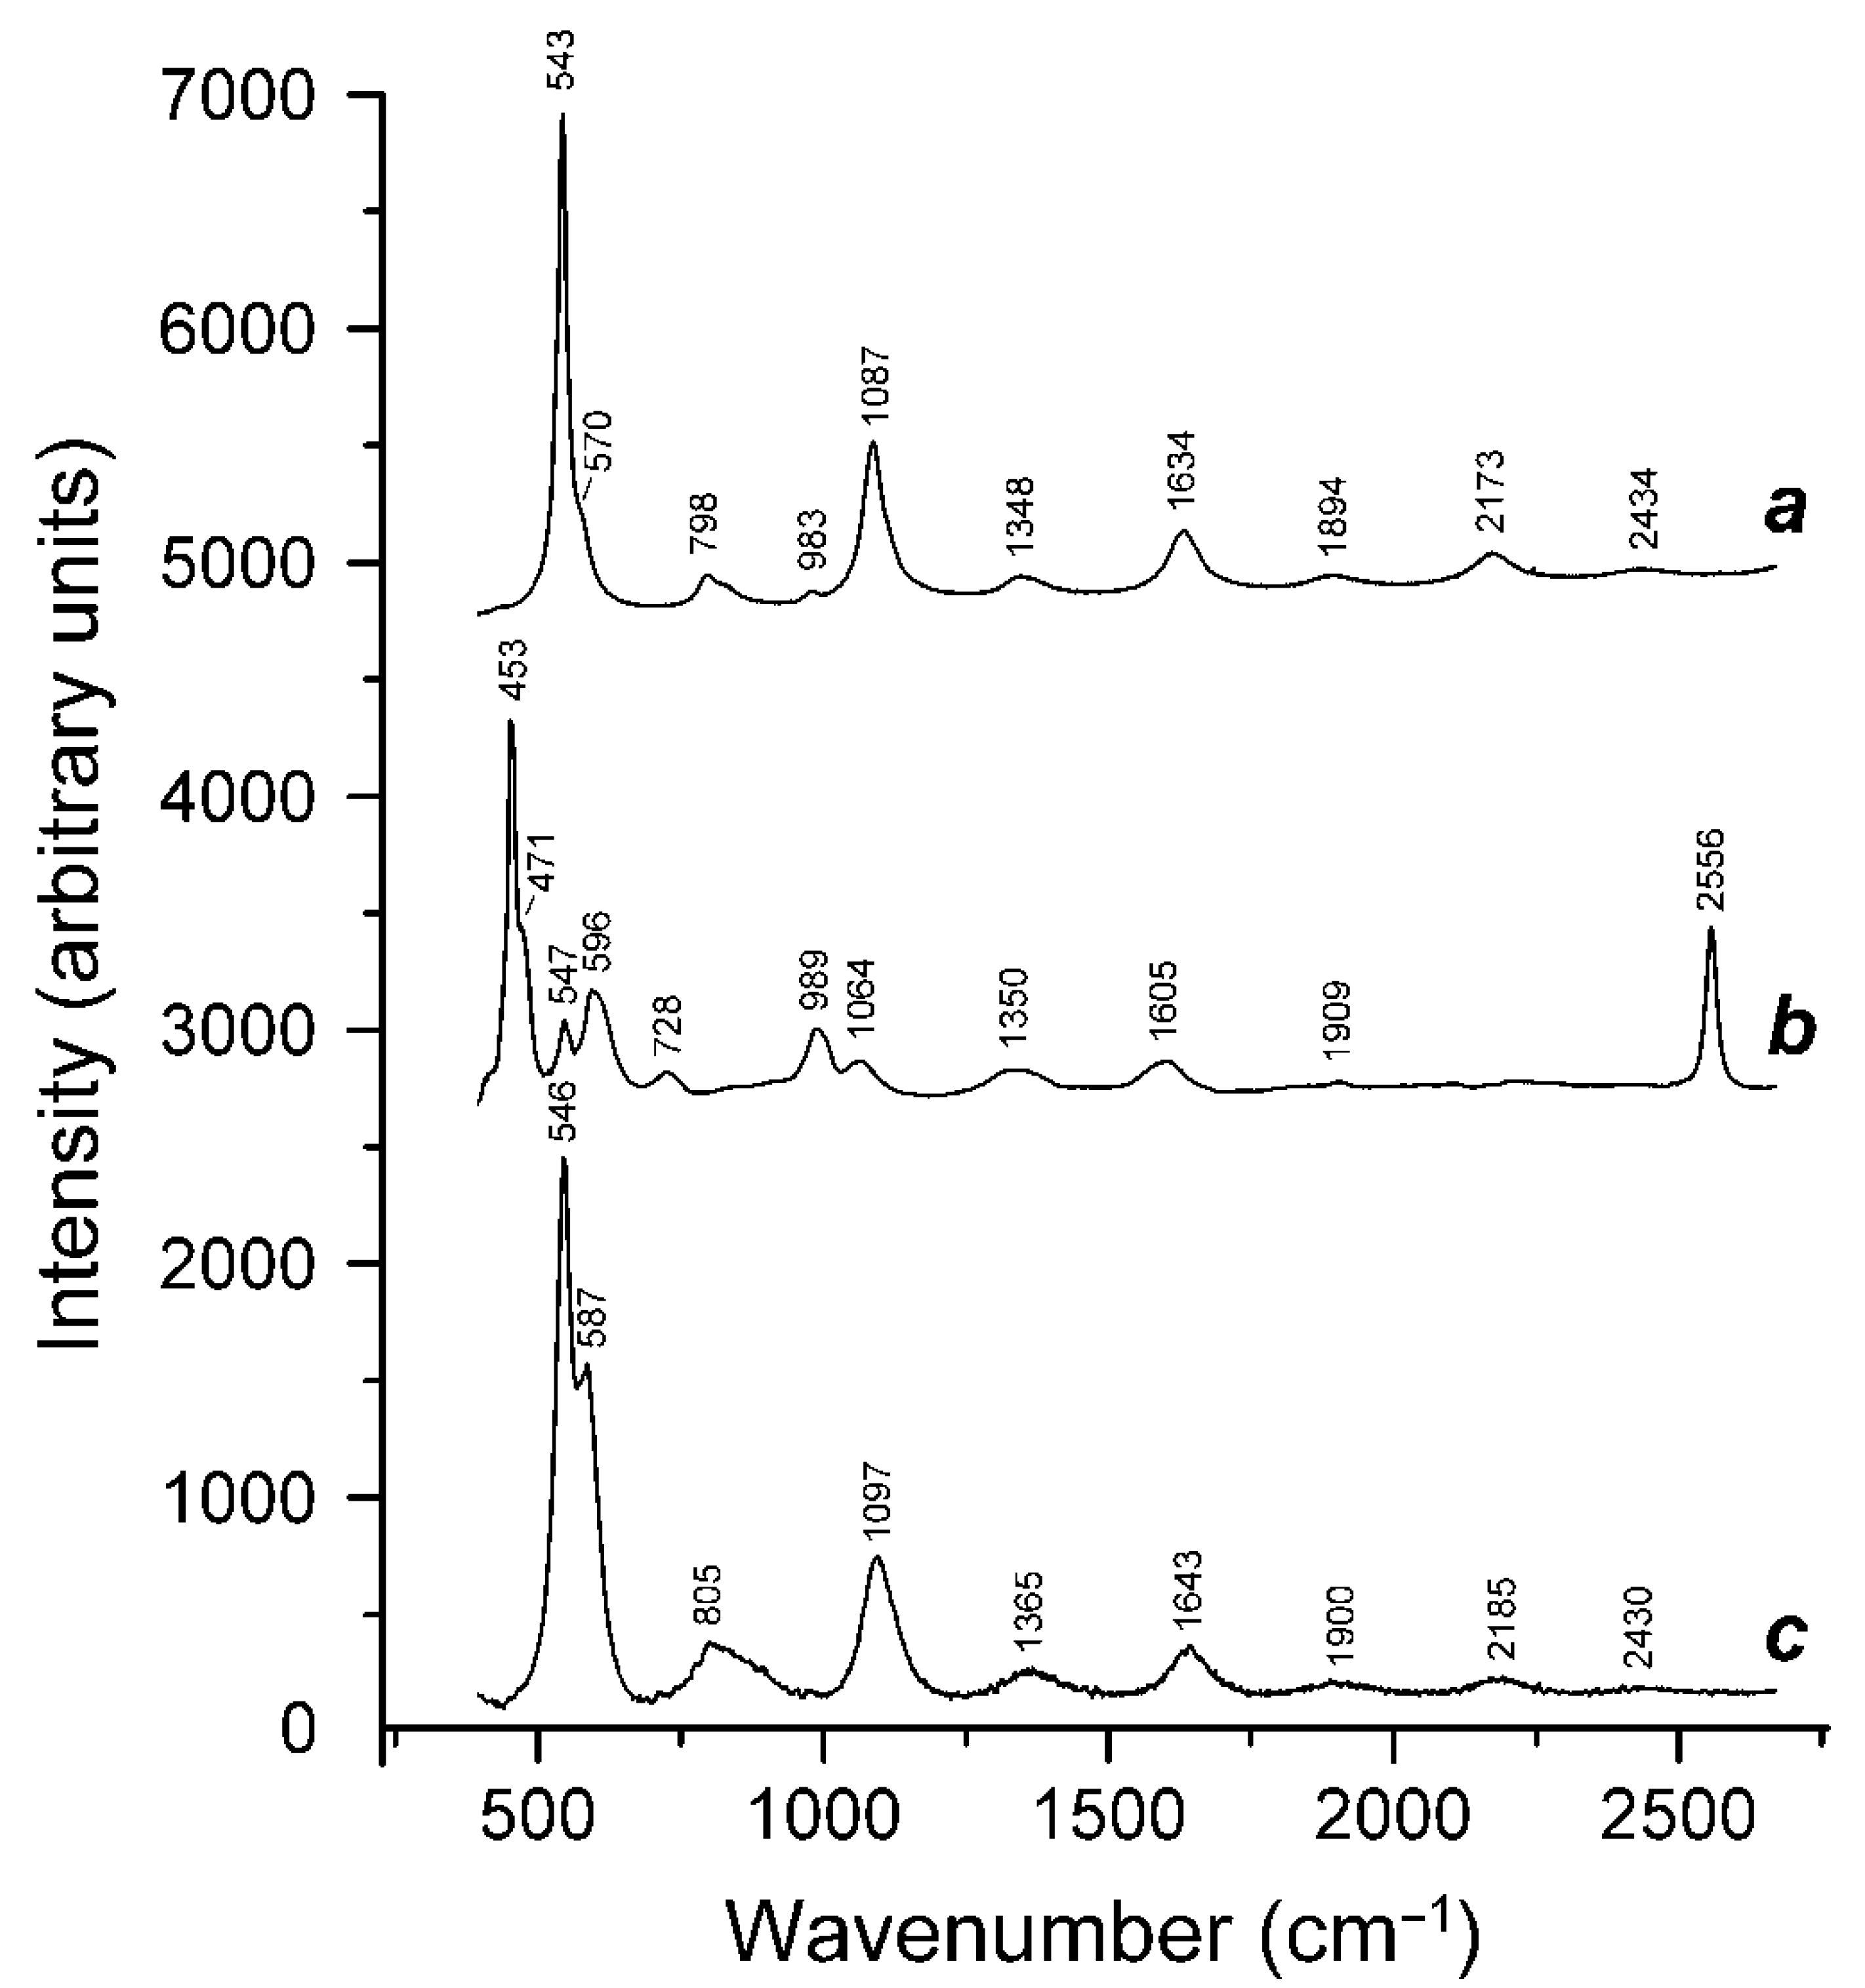
3.3. Thermal Transformations of S4-Bearing Haüyne and S-Sodalite–Haüyne Miscibility
3.4. Extra-Framework Components in Tugtupite
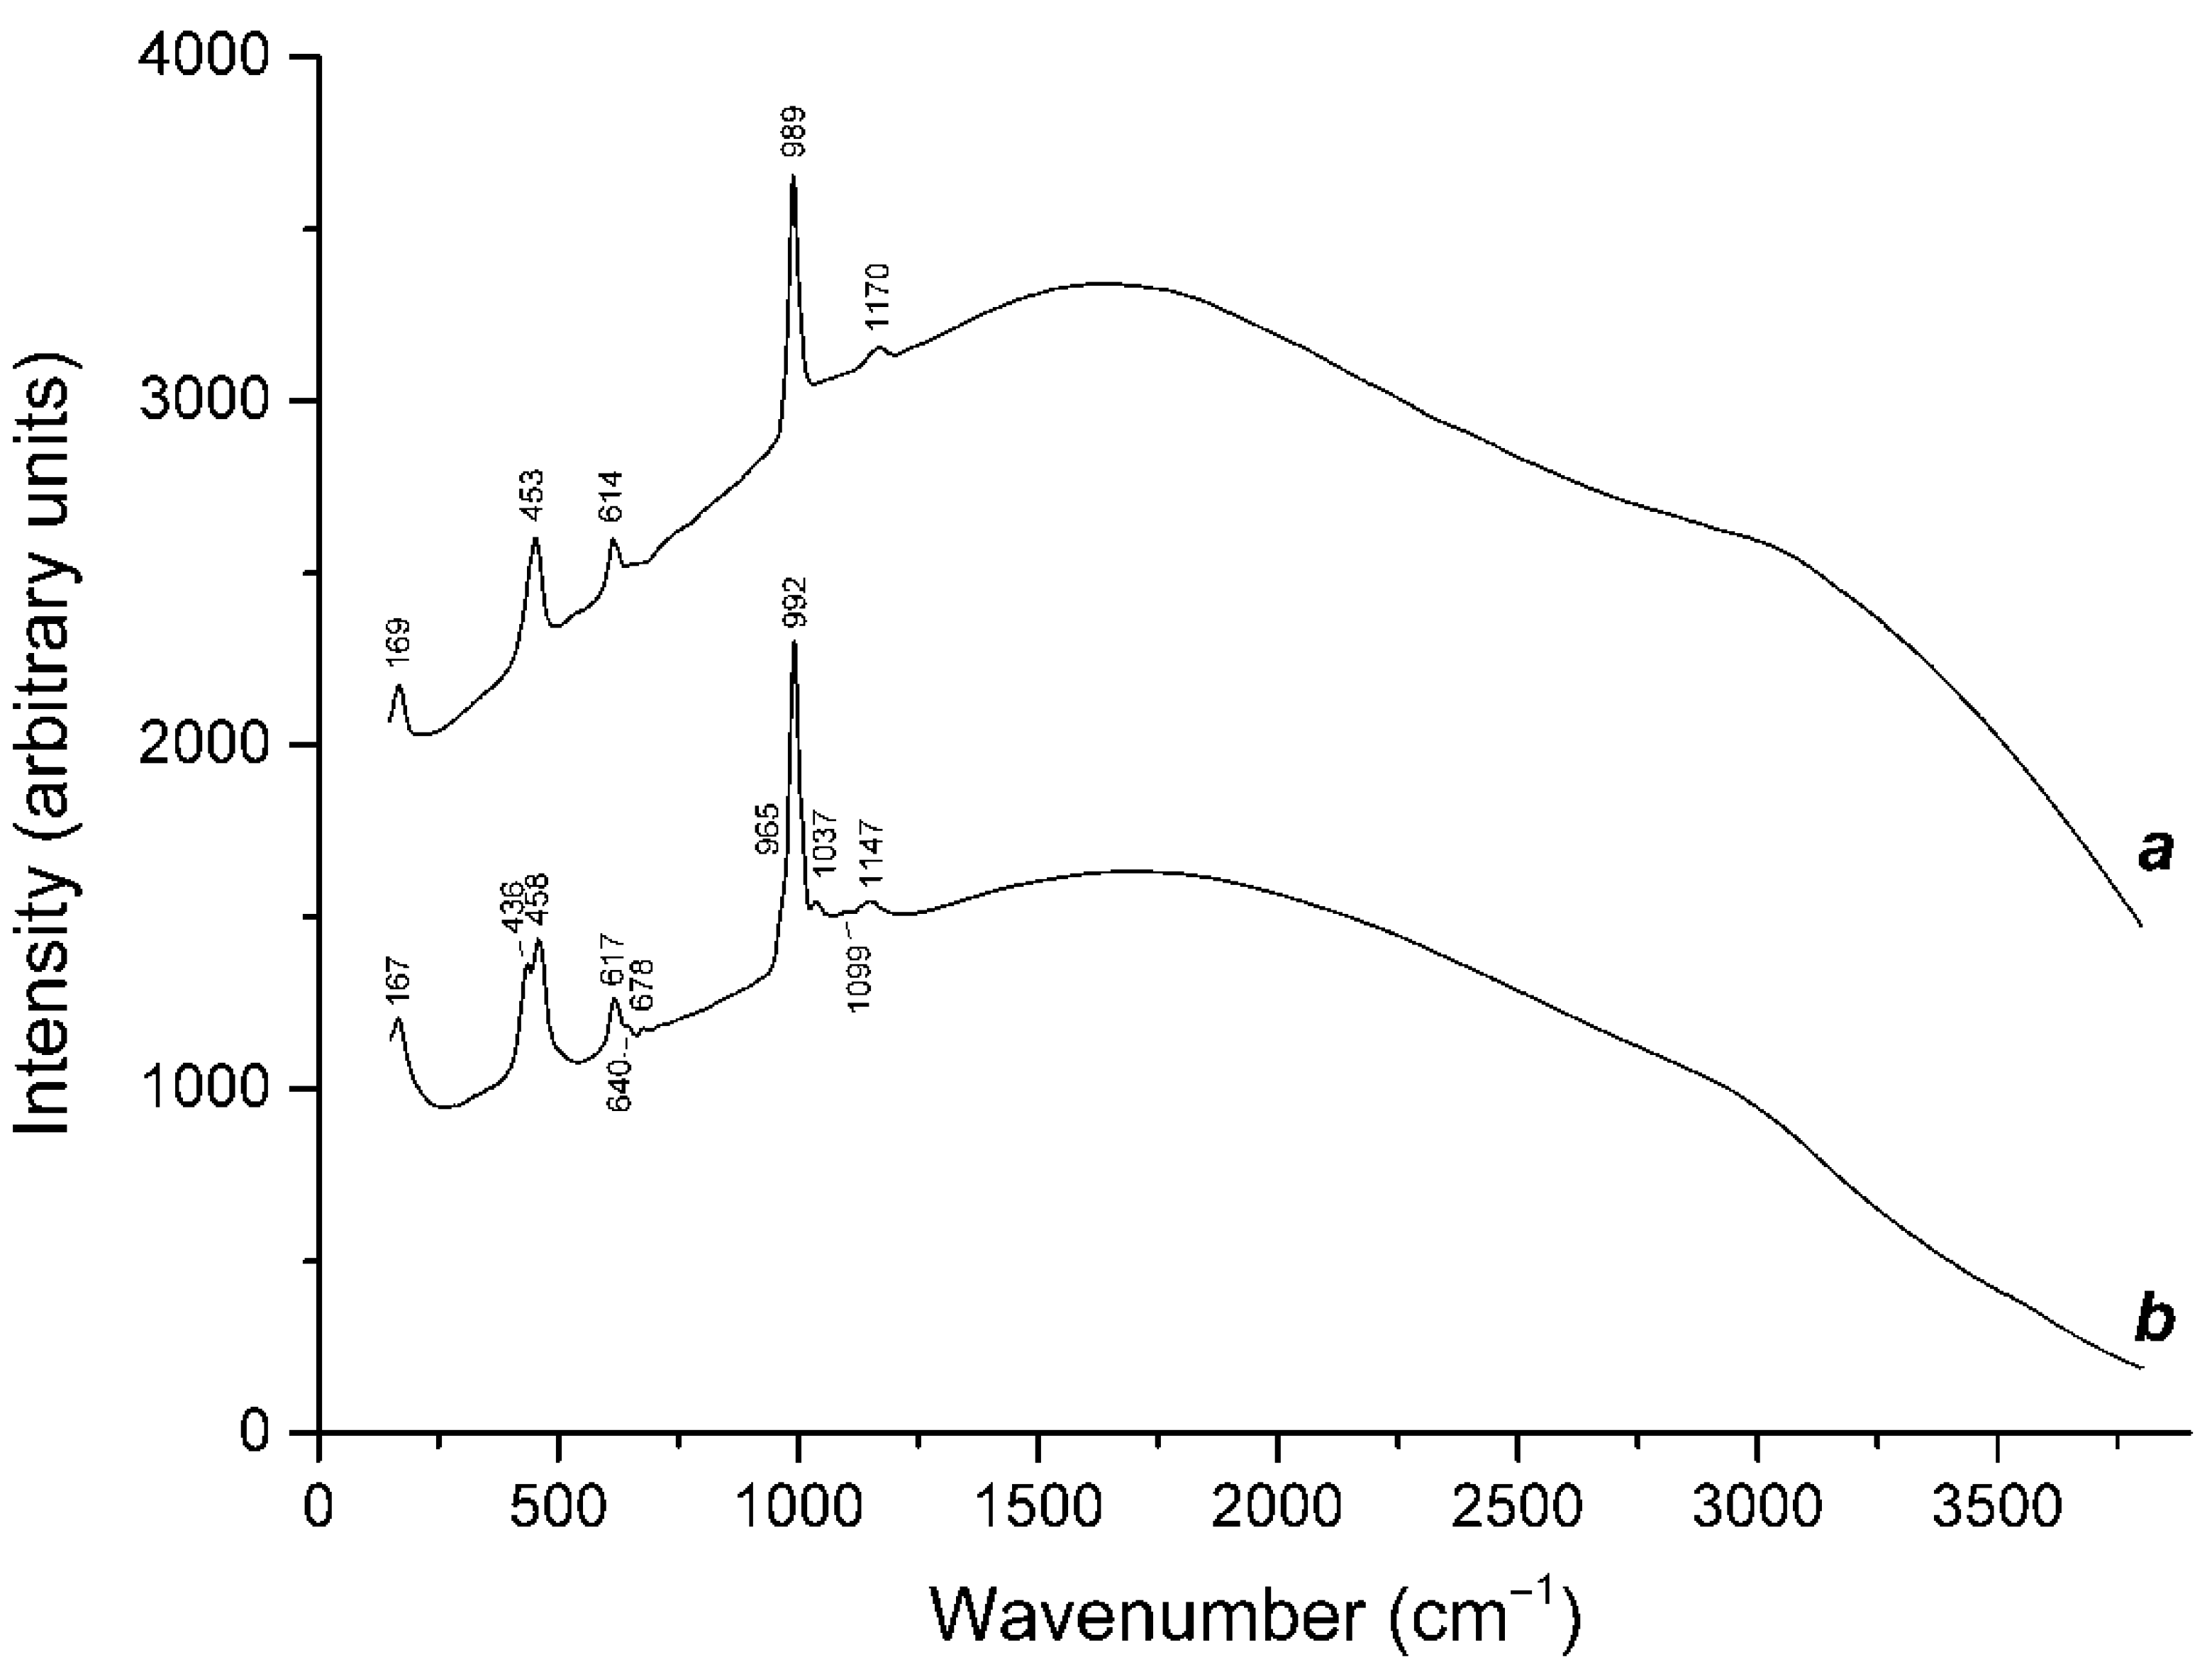
3.5. Extra-Framework Components in Vladimirivanovite and their Thermal Transformations
3.6. S-Bearing Groups in Biachellaite and SO32—-Rich Analogue of Marinellite
3.7. S-Bearing Scapolites
3.8. Synthesis and Thermal Conversions of S-Bearing Sodalite- and Cancribite-Type Materials
4. Discussion
4.1. General Remarks on the Isomorphism of S-bearing Species in Feldspathoids
4.2. Structural Relationships between S-Bearing Sodalite-Group Minerals
4.3. Thiosulfate Anion as an Extra-Framework Constituent of Cancrinite-Type Compounds
4.4. Thermal Transformations of S-Bearing Species in Feldspathoids
4.5. Color Centers in Feldspathoids and Related Minerals
5. Conclusions
Author Contributions
Funding
Data Availability Statement
Conflicts of Interest
References
- Ballirano, P.; Maras, A.; Buseck, P.R. Crystal chemistry and IR spectroscopy of Cl- and SO4-bearing cancrinite-like minerals. Amer. Mineral. 1996, 81, 1003–1012. [Google Scholar] [CrossRef]
- Bonaccorsi, E.; Merlino, S. Modular microporous minerals: Cancrinite-davyne group and C-S-H phases, Rev. Mineral. Geochem. 2005, 57, 241–290. [Google Scholar] [CrossRef]
- Merlino, S. Feldspathoids: Their average and real structures. In Feldspars Feldspathoids; Brown, W.L., Ed.; NATO ASI Series; Springer: Dordrecht, The Netherlands, 1984; Volume 137, pp. 435–470. [Google Scholar] [CrossRef]
- Chukanov, N.V.; Aksenov, S.M.; Rastsvetaeva, R.K. Structural chemistry, IR spectroscopy, properties, and genesis of natural and synthetic microporous cancrinite- and sodalite-related materials: A review. Micropor. Mesopor. Mater. 2021, 323, 111098. [Google Scholar] [CrossRef]
- Chukanov, N.V.; Sapozhnikov, A.N.; Shendrik, R.Y.; Vigasina, M.F.; Steudel, R. Spectroscopic and crystal-chemical features of sodalite-group minerals from gem lazurite deposits. Minerals 2020, 10, 1042. [Google Scholar] [CrossRef]
- Sapozhnikov, A.N.; Tauson, V.L.; Lipko, S.V.; Shendrik, R.Y.; Levitskii, V.I.; Suvorova, L.F.; Chukanov, N.V.; Vigasina, M.F. On the crystal chemistry of sulfur-rich lazurite, ideally Na7Ca(Al6Si6O24)(SO4)(S3)–·nH2O. Amer. Mineral. 2021, 106, 226–234. [Google Scholar] [CrossRef]
- Chukanov, N.V.; Zubkova, N.V.; Pekov, I.V.; Shendrik, R.Y.; Varlamov, D.A.; Vigasina, M.F.; Belakovskiy, D.I.; Britvin, S.N.; Yapaskurt, V.O.; Pushcharovsky, D.Y. Sapozhnikovite, Na8(Al6Si6O24)(HS)2, a new sodalite-group mineral from the Lovozero alkaline massif, Kola Peninsula. Mineral. Mag. 2022, 86, 49–59. [Google Scholar] [CrossRef]
- Chukanov, N.V.; Vigasina, M.F.; Zubkova, N.V.; Pekov, I.V.; Schäfer, C.; Kasatkin, A.V.; Yapaskurt, V.O.; Pushcharovsky, D.Y. Extra-framework content in sodalite-group minerals: Complexity and new aspects of its study using infrared and Raman spectroscopy. Minerals 2020, 10, 363. [Google Scholar] [CrossRef] [Green Version]
- Chukanov, N.V.; Zubkova, N.V.; Varlamov, D.A.; Pekov, I.V.; Belakovskiy, D.I.; Britvin, S.N.; Van, K.V.V.; Ermolaeva, V.N.; Vozchikova, S.A.; Pushcharovsky, D.Y. Steudelite, (Na3)[(K,Na)17Ca7]Ca4(Al24Si24O96)(SO3)6F6·4H2O, a new cancrinite-group mineral with afghanite-type framework topology. Phys. Chem. Miner. 2022, 49, 1. [Google Scholar] [CrossRef]
- Chukanov, N.V.; Pekov, I.V.; Olysych, L.V.; Massa, W.; Zadov, A.E.; Rastsvetaeva, R.K.; Vigasina, M.F. Kyanoxalite, a new cancrinite-group mineral species with extraframework oxalate anion from the Lovozero alkaline pluton, Kola peninsula. Geol. Ore. Depos. 2010, 52, 778–790. [Google Scholar] [CrossRef]
- Olysych, L.V.; Vigasina, M.F.; Melchakova, L.V.; Pekov, I.V.; Chukanov, N.V. Study of thermal decomposition of the cancrinite-kyanoxalite solid-solution series minerals. In Proceedings of the Abstracts of the XXVII International Conference “Geochemistry of Magmatic Rocks”, School “Geochemistry of Alkaline Rocks”, Moscow-Koktebel, Russia-Ukraine, 9–16 September 2010; pp. 135–136. [Google Scholar]
- Chukanov, N.V.; Vigasina, M.F.; Shendrik, R.Y.; Varlamov, D.A.; Pekov, I.V.; Zubkova, N.V. Nature and isomorphism of extra-framework components in cancrinite- and sodalite-related minerals: New data. Minerals 2022, 12, 729. [Google Scholar] [CrossRef]
- Chukanov, N.V.; Shendrik, R.Y.; Vigasina, M.F.; Pekov, I.V.; Sapozhnikov, A.N.; Shcherbakov, V.D.; Varlamov, D.A. Crystal chemistry, isomorphism, and thermal conversions of extra-framework components in sodalite-group minerals. Minerals 2022, 12, 887. [Google Scholar] [CrossRef]
- Shchipalkina, N.V.; Pekov, I.V.; Koshlyakova, N.N.; Britvin, S.N.; Zubkova, N.V.; Varlamov, D.A.; Sidorov, E.G. Unusual silicate mineralization in fumarolic sublimates of the Tolbachik volcano, Kamchatka, Russia—Part 2: Tectosilicates. Eur. J. Mineral. 2020, 32, 121–136. [Google Scholar] [CrossRef] [Green Version]
- Lo Giudice, A.; Angelici, D.; Re, A.; Gariani, G.; Borghi, A.; Calusi, S.; Giuntini, L.; Massi, M.; Castelli, L.; Taccetti, F.; et al. Protocol for lapis lazuli provenance determination: Evidence for an Afghan origin of the stones used for ancient carved artefacts kept at the Egyptian Museum of Florence (Italy). Archaeol. Anthropol. Sci. 2017, 9, 637–651. [Google Scholar] [CrossRef]
- Tauson, V.L.; Sapozhnikov, A.N.; Shinkareva, S.N.; Lustenberg, E.E. Indicative properties of lazurite as a member of clathrasil mineral family. Dokl. Earth Sci. 2011, 441, 1732–1737. [Google Scholar] [CrossRef]
- Gobeltz-Hautecoeur, N.; Demortier, A.; Lede, B.; Lelieur, J.P.; Duhayon, C. Occupancy of the sodalite cages in the blue ultramarine pigments. Inorg. Chem. 2002, 41, 2848–2854. [Google Scholar] [CrossRef]
- Heil, C.; Cataldo, S.; Bachelet, G.B.; Boeri, L. Superconductivity in sodalite-like yttrium hydride clathrates. Phys. Rev. B Condens. Matter. 2019, 99, 220502(R). [Google Scholar] [CrossRef] [Green Version]
- Ogura, M.; Morozumi, K.; Elangovan, S.P.; Tanada, H.; Ando, H.; Okubo, T. Potassium-doped sodalite: A tectoaluminosilicate for the catalytic material towards continuous combustion of carbonaceous matters. Appl. Catal. B. 2008, 77, 294–299. [Google Scholar] [CrossRef]
- Shanbhag, G.V.; Choi, M.; Kim, J.; Ryoo, R. Mesoporous sodalite: A novel, stable solid catalyst for base-catalyzed organic transformations. J. Catal. 2009, 264, 88–92. [Google Scholar] [CrossRef]
- Sachse, A.; Galarneau, A.; Renzo, F.D.; Fajula, F.; Coq, B. Synthesis of zeolite monoliths for flow continuous processes. The case of sodalite as a basic catalyst. Chem. Mater. 2010, 22, 4123–4125. [Google Scholar] [CrossRef]
- Hiyoshi, N. Nanocrystalline sodalite: Preparation and application to epoxidation of 2-cyclohexen-1-one with hydrogen peroxide. Appl. Catal. 2012, A419–A420, 164–169. [Google Scholar] [CrossRef]
- Manique, M.C.; Lacerda, L.V.; Alves, A.K.; Bergmann, C.P. Biodiesel production using coal fly ash-derived sodalite as a heterogeneous catalyst. Fuel 2017, 190, 268–273. [Google Scholar] [CrossRef]
- Wang, S.; Zhao, Z.-J.; Chang, X.; Zhao, J.; Tian, H.; Yang, C.; Li, M.; Fu, Q.; Mu, R.; Gong, J. Activation and spillover of hydrogen on sub-1 nm palladium nanoclusters confined within sodalite zeolite for the semi-hydrogenation of alkynes. Angew. Chem. Int. Ed. 2019, 58, 7668–7672. [Google Scholar] [CrossRef] [PubMed]
- Khajavi, S.; Jansen, J.C.; Kapteijn, F. Production of ultra pure water by desalination of seawater using a hydroxyl sodalite membrane. J. Membr. Sci. 2010, 356, 52–57. [Google Scholar] [CrossRef]
- Nabavi, M.S.; Mohammadi, T.; Kazemimoghadam, M. Hydrothermal synthesis of hydroxyl sodalite zeolite membrane: Separation of H2/CH4. Ceram. Int. 2014, 40, 5889–5896. [Google Scholar] [CrossRef]
- Kalantari, N.; Vaezi, M.J.; Yadollahi, M.; Babaluo, A.A.; Bayati, B.; Kazemzadeh, A. Synthesis of nanostructure hydroxysodalite composite membranes via hydrothermal method: Support surface modification and synthesis method effects. Asia Pac. J. Chem. Eng. 2015, 10, 45–55. [Google Scholar] [CrossRef]
- Wei, X.-L.; Pan, W.-Y.; Li, X.; Pan, M.; Huo, C.-F.; Yang, R.; Chao, Z.-S. MCM-22 zeolite-induced synthesis of thin sodalite zeolite membranes. Chem. Mater. 2020, 32, 333–340. [Google Scholar] [CrossRef]
- Yang, G.; Guo, H.; Kang, Z.; Feng, S.; Zhao, L.; Mintova, S. Sandwich-type H2/CO2 membranes comprising of graphene oxide and sodalite crystals with adjustable morphology and size. Micropor. Mesopor. Mater. 2020, 300, 110120. [Google Scholar] [CrossRef]
- Eterigho-Ikelegbe, O.; Bada, S.O.; Daramola, M.O. Preparation and evaluation of nanocomposite sodalite/α-Al2O3 tubular membranes for H2/CO2 separation. Membranes 2020, 10, 312. [Google Scholar] [CrossRef]
- Eden, C.L.; Daramola, M.O. Evaluation of silica sodalite infused polysulfone mixed matrix membranes during H2/CO2 separation. Mater. Today Proc. 2021, 38, 522–527. [Google Scholar] [CrossRef]
- Ntshangase, N.C.; Sadare, O.O.; Daramola, M.O. Effect of silica sodalite functionalization and PVA coating on performance of sodalite infused PSF membrane during treatment of acid mine drainage. Membranes 2021, 11, 315. [Google Scholar] [CrossRef]
- Navarro, J.A.R.; Barea, E.; Salas, J.M.; Masciocchi, N.; Galli, S.; Sironi, A.; Ania, C.O.; Parra, J.P. H2, N2, CO, and CO2 sorption properties of a series of robust sodalite-type microporous coordination polymers. Inorg. Chem. 2006, 45, 2397–2399. [Google Scholar] [CrossRef]
- Asgari, A.; Jawahery, S.; Bloch, E.D.; Hudson, M.R.; Flacau, R.; Vlaisavljevich, B.; Long, J.R.; Brown, C.M.; Queen, W.L. An experimental and computational study of CO2 adsorption in the sodalite-type M-BTT (M = Cr, Mn, Fe, Cu) metal–organic frameworks featuring open metal sites. Chem. Sci. 2018, 9, 4579–4588. [Google Scholar] [CrossRef] [Green Version]
- Wang, Y.; Jiang, Y.; Hu, S.; Peng, S.; Xu, C.; Lu, A. Dehydrated Na6[AlSiO4]6 sodalite as a promising SO2 sorbent material: A first principles thermodynamics prediction. , J. Amer. Ceram. Soc. 2019, 102, 3663–3672. [Google Scholar] [CrossRef]
- Asgari, M.; Semino, R.; Schouwink, P.A.; Kochetygov, I.; Tarver, J. Understanding how ligand functionalization influences CO2 and N2 adsorption in a sodalite metal-organic framework. Chem. Mater. 2020, 32, 1526–1536. [Google Scholar] [CrossRef]
- Dickson, J.O.; Harsh, J.B.; Lukens, W.W.; Pierce, E.M. Perrhenate incorporation into binary mixed sodalites: The role of anion size and implications for technetium-99 sequestration. Chem. Geol. 2015, 395, 138–143. [Google Scholar] [CrossRef] [Green Version]
- Gilbert, M.R. Pressureless sintering of sodalite waste-forms for the immobilization of pyroprocessing wastes. MRS Online Proc. Libr. 2014, 1744, 61–66. [Google Scholar] [CrossRef]
- Luksic, S.A.; Riley, B.J.; Parker, K.E.; Hrma, P. Sodalite as a vehicle to increase Re retention in waste glass stimulant during vitrification. J. Nucl. Mater. 2016, 479, 331–337. [Google Scholar] [CrossRef] [Green Version]
- Vance, E.R.; Gregg, D.J.; Grant, C.; Stopic, A.; Maddrell, E.R. Silver iodide sodalite for 129I immobilization. J. Nucl. Mater. 2016, 480, 177–181. [Google Scholar] [CrossRef]
- Lilova, K.; Pierce, E.M.; Wu, L.; Jubb, A.M.; Subramani, T.; Navrotsky, A. Energetics of salt-bearing sodalites, Na8Al6Si6O24X2 (X = SO4, ReO4, Cl, I): A treatment option for pertechnetate-enriched nuclear waste streams. ACS Earth Space Chem. 2020, 4, 2153–2161. [Google Scholar] [CrossRef]
- Grajciar, L. PbS clusters embedded in sodalite zeolite cavities of different compositions: Unraveling the structural evolution and optical properties using ab initio calculations. J. Phys. Chem. 2016, C120, 27050–27065. [Google Scholar] [CrossRef]
- Van den Berg, A.W.C.; Bromley, S.T.; Jansen, J.C. Thermodynamic limits on hydrogen storage in sodalite framework materials: A molecular mechanics investigation. Micropor. Mesopor. Mater. 2005, 78, 63–71. [Google Scholar] [CrossRef]
- Zheng, Z.; Guliants, V.V.; Misture, S. Sodalites as ultramicroporous frameworks for hydrogen separation at elevated temperatures: Thermal stability, template removal, and hydrogen accessibility. J. Porous Mater. 2009, 16, 343–347. [Google Scholar] [CrossRef]
- Rüscher, C.H.; Stemme, F.; Schomborg, L.; Buhl, J.-C. Low temperature hydrogen release from borontetrahydride-sodalite and its reloading: Observations in in-situ and ex-situ TIR experiments. In Ceramics for Environmental and Energy Applications; Boccaccini, A., Marra, J., Dogan, F., Lin, H.-T., Watanabe, T., Eds.; Wiley: Hoboken, NJ, USA, 2010; pp. 65–70. [Google Scholar]
- Gong, Y.-N.; Meng, M.; Zhong, D.-C.; Huang, Y.-L.; Jiang, L.; Lu, T.-B. Counter-cation modulation of hydrogen and methane storage in a sodalite-type porous metal–organic framework. Chem. Commun. 2012, 48, 12002–12004. [Google Scholar] [CrossRef] [PubMed]
- Rejmak, P. Computational refinement of the puzzling red tetrasulfur chromophore in ultramarine pigments. Phys. Chem. Chem. Phys. 2020, 22, 22684–22698. [Google Scholar] [CrossRef] [PubMed]
- Eckert, B.; Steudel, F. Molecular spectra of sulfur molecules and solid sulfur allotropes. Top. Curr. Chem. 2003, 231, 31–97. [Google Scholar] [CrossRef]
- Hettmann, K.; Wenzel, T.; Marks, M.; Markl, G. The sulfur speciation in S-bearing minerals: New constraints by a combination of electron microprobe analysis and DFT calculations with special reference to sodalite-group minerals. Amer. Mineral. 2012, 97, 1653–1661. [Google Scholar] [CrossRef]
- Steudel, R. (Ed.) Inorganic polysulfides Sn2− and radical anions Sn•−. In Elemental Sulfur und Sulfur-Rich Compounds II. Topics in Current Chemistry; Springer: Berlin/Heidelberg, Germany, 2003; Volume 231. [Google Scholar]
- Chivers, T.; Elder, P.J.W. Ubiquitous trisulfur radical anion: Fundamentals and applications in materials science, electrochemistry, analytical chemistry and geochemistry. Chem. Soc. Rev. 2013, 42, 5996–6005. [Google Scholar] [CrossRef]
- Wong, M.W.; Steudel, R. Structure and spectra of tetrasulfur S4—An ab initio MO study. Chem. Phys. Lett. 2003, 379, 162–169. [Google Scholar] [CrossRef]
- Caggiani, M.C.; Mangone, A.; Aquafredda, P. Blue coloured haüyne from Mt. Vulture (Italy) volcanic rocks: SEM-EDS and Raman investigation of natural and heated crystals. J. Raman Spectrosc. 2022, 53, 956–968. [Google Scholar] [CrossRef]
- Bény, C.; Guilhaumou, N.; Touray, J.-C. Native-sulphur-bearing fluid inclusions in the CO2-H2S-H2O-S system—Microthermometry and Raman microprobe (MOLE) analysis—Thermochemical interpretations. Chem. Geol. 1982, 37, 113–127. [Google Scholar] [CrossRef]
- Dubessy, J.; Boiron, M.-C.; Moissette, A.; Monnion, C.; Sretenskaya, N. Determination of water, hydrates and pH in fluid inclusions by micro-Raman spectrometry. Eur. J. Mineral. 1992, 4, 885–894. [Google Scholar] [CrossRef] [Green Version]
- Weser, G.; Hensel, F.; Warren, W.W. The optical absorption spectrum of fluid sulfur up to supercritical conditions. Ber. Bunsenges. Phys. Chem. 1978, 82, 588–594. [Google Scholar] [CrossRef]
- Paniz, H.; Lester, A. Vibronic absorption spectra of S3 and S4, in solid argon. J. Phys. Chem. 1992, 96, 6579–6585. [Google Scholar]
- Steudel, R.; Jensen, D.; Göbel, P.; Hugo, P. Optical absorption spectra of the homocyclic sulfur molecules Sn (n = 6, 7, 8, 9, 10, 12, 15, 20) in solution. Ber. Bunsenges. Phys. Chem. 1988, 92, 118–122. [Google Scholar] [CrossRef]
- Raulin, K.; Gobeltz, N.; Vezin, H.; Touat, N.; Ledé, B.; Moissette, A. Identification of the EPR signal of S2− in green ultramarine pigments. Phys. Chem. Chem. Phys. 2011, 13, 9253–9259. [Google Scholar] [CrossRef]
- Ostroumov, M.; Fritsch, E.; Faulques, E.; Chauvet, O. Etude spectrometrique de la lazurite du Pamir, Tajikistan. Canad. Mineral. 2002, 40, 885–893. [Google Scholar] [CrossRef] [Green Version]
- Huie, R.E.; Clifton, C.L.; Altstein, N. A pulse radiolysis and flash photolysis study of the radicals SO2-, SO3-, SO4- and SO5-. Int. J. Radiat. Appl. Instr. Part C Radiat. Phys. Chem. 1989, 33, 361–370. [Google Scholar] [CrossRef]
- McElroy, W.J.; Waygood, S.J. Kinetics of the reactions of the SO4- radical with SO4-, S2O82-, H2O and Fe2+. J. Chem. Soc. Faraday Trans. 1990, 86, 2557. [Google Scholar] [CrossRef]
- Steudel, R.; Chivers, T. The role of polysulfide dianions and radical anions in the chemical, physical and biological sciences, including sulfur-based batteries. Chem. Soc. Rev. 2019, 48, 3279–3319 and 4338. [Google Scholar] [CrossRef]
- Olysych, L.V. Structural and Genetic Mineralogy of the Cancrinite Group in Intrusive Alkaline Complexes. Ph.D. Thesis, Lomonosov Moscow State University, Moscow, Russia, 2010; 307p. (In Russian). [Google Scholar]
- Sapozhnikov, A.N.; Kaneva, E.V.; Cherepanov, D.I.; Suvorova, L.F.; Levitsky, V.I.; Ivanova, L.A.; Reznitsky, L.Z. Vladimirivanovite, Na6Ca2[Al6Si6O24](SO4,S3,S2,Cl)2·H2O, a new mineral of sodalite group. Geol. Ore Depos. 2012, 54, 557–564. [Google Scholar] [CrossRef]
- Zubkova, N.V.; Chukanov, N.V.; Varlamov, D.A.; Vigasina, M.F.; Pekov, I.V.; Ksenofontov, D.A.; Pushcharovsky, D.Y. SO32–-bearing analogue of marinellite: Crystal structure and vibrational spectroscopy. Geol. Ore Depos. 2022, in press. [Google Scholar]
- Chukanov, N.V.; Rastsvetaeva, R.K.; Pekov, I.V.; Zadov, A.E.; Allori, R.; Zubkova, N.V.; Giester, G.; Pushcharovsky, D.Y.; Van, K.V. Biachellaite, (Na,Ca,K)8(Si6Al6O24)(SO4)2(OH)0.5·H2O, a new mineral species of the cancrinite group. Geol. Ore Depos. 2009, 51, 588–594. [Google Scholar] [CrossRef]
- Tauson, V.L.; Goettlicher, J.; Sapozhnikov, A.N.; Mangold, S.; Lustenberg, E.E. Sulfur speciation in lazurite-type minerals (Na,Ca)8[Al6Si6O24](SO4,S)2 and their annealing products: A comparative XPS and XAS study. Eur. J. Mineral. 2012, 24, 133–152. [Google Scholar] [CrossRef]
- Chukanov, N.V.; Pekov, I.V.; Olysych, L.V.; Zubkova, N.V.; Vigasina, M.F. Crystal chemistry of cancrinite-group minerals with AB-type frameworks. II. IR spectroscopy and its crystal chemical implications: Review and new data. Canad. Mineral. 2011, 49, 1151–1164. [Google Scholar] [CrossRef]
- Pekov, I.V.; Olysych, L.V.; Chukanov, N.V.; Zubkova, N.V.; Pushcharovsky, D.Y.; Van, K.V.; Giester, G.; Tillmanns, E. Crystal chemistry of cancrinite-group minerals with AB-type frameworks. I. Chemical and structural variations: Review and new data. Canad. Mineral. 2011, 49, 1129–1150. [Google Scholar] [CrossRef]
- Frost, R.L.; Keeffe, E.C. Raman spectroscopic study of the sulfite-bearing minerals scotlandite, hannebachite and orschallite: Implications for the desulfation of soils. J. Raman Spectrosc. 2009, 40, 244–248. [Google Scholar] [CrossRef] [Green Version]
- Sapozhnikov, A.N.; Ivanov, V.G.; Piskunova, L.F.; Kashaev, A.A.; Terentieva, E.A.; Pobedimskaya, L.E. Bystrite Ca(Na,K)7(Si6Al6O24)(S3)1.5·2H2O—A new cancrinite-like mineral. Zap. Vsesyuznogo Miner. Obs. 1991, 120, 97–100. (In Russian) [Google Scholar]
- Sapozhnikov, A.N.; Kaneva, E.V.; Suvorova, L.F.; Levitsky, V.I.; Ivanova, L.A. Sulfhydrylbystrite, Na5K2Ca(Al6Si6O24)(S5)(SH), a new mineral with the LOS framework, and re-interpretation of bystrite: Cancrinite-group minerals with novel extra-framework anions, Mineral. Mag. 2017, 81, 383–402. [Google Scholar] [CrossRef]
- Pobedimskaya, E.A.; Terentieva, L.E.; Sapozhnikov, A.N.; Kashaev, A.A.; Dorokhova, G.I. Crystal structure of bystrite. Doklady Akad. Nauk SSSR. 1991, 319, 873–878. (In Russian) [Google Scholar]
- Chukanov, N.V. Infrared Spectra of Mineral Species: Extended Library; Springer: Dordrecht, The Netherlands; Heidelberg, Germany; New York, NY, USA; London, UK, 2014; 1716p, ISBN 9400771274. [Google Scholar]
- Chukanov, N.V.; Vigasina, M.F.; Rastsvetaeva, R.K.; Aksenov, S.M.; Mikhailova, J.A.; Pekov, I.V. The evidence of hydrated proton in eudialyte-group minerals based on Raman spectroscopy data. J. Raman Spectrosc. 2022, 53, 1188–1203. [Google Scholar] [CrossRef]
- Van Doorn, C.Z.; Schipper, D.J. Luminescence of O2−, Mn2+ and Fe3+ in sodalite. Phys. Lett. A 1971, 34, 139–140. [Google Scholar] [CrossRef]
- Rastsvetaeva, R.K.; Sapozhnikov, A.N.; Tauson, V.L.; Kashaev, A.A. Crystal structure of sulfide sodalite, a product of sulfate sulfur reduction in lazurite. Doklady Academii Nauk. 1997, 356, 773–776. (In Russian) [Google Scholar]
- Epelbaum, M.B.; Gorbatyi, Y.E.; Gusiynin, V.F.; Ivanov, I.P. Study of sodium sodalities with different intra-framework anions. In Essays in Physicochemical Petrology; Nauka: Moscow, Russia, 1970; Volume 2, pp. 269–280. (In Russian) [Google Scholar]
- Tauson, V.L.; Akimov, V.V.; Sapozhnikov, A.N.; Kuznetzov, K.E. Investigation of the stability conditions and structural-chemical transformations of Baikal lazurite. Geochemi. Int. 1998, 36, 717–733. [Google Scholar]
- Sapozhnikov, A.N.; Tauson, V.L.; Matveeva, L.N. Stepwise change of modulation wavelength in structure of cubic lazurite under annealing. Zap. Ross. Mineral. Obs. Proc. Rus. Mineral. Soc. 2001, 2, 121–125. (In Russian) [Google Scholar]
- Urusov, V.S. Theory of Isomorphic Miscibility; Nauka: Moscow, Russia, 1977; 251p. (In Russian) [Google Scholar]
- Urusov, V.S. The problem of the dimension parameter in the isomorphism theory and effective radii of aluminosilicate radicals. Mineral. Zhurnal 1980, 2, 3–11. (In Russian) [Google Scholar]
- Urusov, V.S. Crystal chemical and energetic characterization of solid solution. In Advances in Physical Geochemistry X. Thermodynamic Data: Systematics and Estimation; Saxena, S.K., Ed.; Springer: New York, NY, USA, 1992; Volume 10, pp. 162–194. [Google Scholar]
- Kotel’nikov, A.R.; Koval’skiy, A.M.; Suk, M.I. Experimental investigation of sodalite solid solutions with anionic isomorphism of chlorine and sulfur. Geokhimiya 2005, 34, 599–613. (In Russian) [Google Scholar]
- Gaft, M.; Panczer, G.; Nagli, L.; Yeates, H. Laser-induced time-resolved luminescence of tugtupite, sodalite and hackmanite. Phys. Chem. Miner. 2008, 36, 127–141. [Google Scholar] [CrossRef]
- Radomskaya, T.A.; Kaneva, E.V.; Shendrik, R.Y.; Suvorova, L.F.; Vladykin, N.V. Sulfur-bearing sodalite, hackmanite, in alkaline pegmatites of the Inagli massif (Aldan Shield): Crystal chemistry, photochromism, and luminescence. Geol. Ore Depos. 2021, 63, 696–704. [Google Scholar] [CrossRef]
- Blumentritt, F.; Fritsch, E. Photochromism and photochromic gems: A review and some new data (Part 1). J. Gemmol. 2021, 37, 780–800. [Google Scholar] [CrossRef]
- Agamah, C.; Vuori, S.; Colinet, P.; Norrbo, I.; Miranda de Carvalho, J.; Key, L.; Nakamura, O.; Lindblom, J.; van Goethem, L.; Emmermann, A. Hackmanite—The natural glow-in-the-dark material. Chem. Mater. 2020, 32, 8895–8905. [Google Scholar] [CrossRef]
- Jensen, A.; Petersen, O.V. Tugtupite: A gemstone from Greenland. Gems Gemol. 1982, 18, 90–94. [Google Scholar] [CrossRef] [Green Version]
- Warner, T.E.; Hutzen Andersen, J. The effects of sulfur intercalation on the optical properties of artificial “hackmanite”, Na8[Al6Si6O24]Cl1.8S0.1; “sulfosodalite”, Na8[Al6Si6O24]S; and natural tugtupite, Na8[Be2Al2Si8O24](Cl,S)2−δ. Phys. Chem, Miner. 2011, 39, 163–168. [Google Scholar] [CrossRef]
- Arieli, D.; Vaughan, D.E.W.; Goldfarb, D. New synthesis and insight into the structure of blue ultramarine pigments. J. Amer. Chem. Soc. 2004, 126, 5776–5788. [Google Scholar] [CrossRef]
- Tossell, J.A. Calculation of the visible-UV absorption spectra of hydrogen sulfide, bisulfide, polysulfides, and As and Sb sulfides, in aqueous solution. Geochem. Trans. 2003, 4, 28. [Google Scholar] [CrossRef] [PubMed]
- Vannotti, L.E.; Morton, J.R. Paramagnetic-resonance spectra of S2− in alkali halides. Phys. Rev. 1967, 161, 282–286. [Google Scholar] [CrossRef]
- Chukanov, N.V.; Vigasina, M.F. Vibrational (Infrared and Raman) Spectra of Minerals and Related Compounds; Springer: Dordrecht, The Netherlands, 2020; 1376p. [Google Scholar] [CrossRef]
- Hassan, I.; Grundy, H.D. The crystal structures of sodalite-group minerals. Acta Cryst. 1984, B40, 6–13. [Google Scholar] [CrossRef]
- Hassan, I.; Buseck, P. Cluster ordering and antiphase domain boundaries in haüyne. Can. Miner. 1989, 27, 173–180. [Google Scholar]
- Meuwsen, A.; Heinze, G. Darstellung einiger Schwermetall-Trithionate. Z. Anorg. Allgem. Chem. 1952, 69, 86–91. (In German) [Google Scholar] [CrossRef]
- Gabelica, Z. Compounds containing cadmium and thiosulfate ions. X. Infrared and Raman investigation of the structural behavior of the S2O32- ion in cadmium thiosulfate dihydrate, CdS2O3·2H2O. Chem. Lett. 1979, 8, 1419–1422. [Google Scholar] [CrossRef]
- Gabelica, Z. Structural study of solid inorganic thiosulfates by infrared and Raman spectroscopy. J. Molec. Struct. 1980, 60, 131–138. [Google Scholar] [CrossRef]
- Matulionyte, J.; Ragauskas, R.; Eicher-Lorka, O.; Niaura, G. Raman spectroscopic study of anion-exchange membranes in modified photographic fixer solution. Chemija 2006, 17, 1–6. [Google Scholar]
- Lindner, G.-G.; Massa, W.; Reinen, D. Structure properties of hydrothermally synthesized thiosulfate cancrinite. J. Solid State Chem. 1995, 117, 386–391. [Google Scholar] [CrossRef]
- Bindi, L.; Nestola, F.; Kolitsch, U.; Guastoni, A.; Zorzi, F. Fassinaite, Pb22+(S2O3)(CO3), the first mineral with coexisting thiosulphate and carbonate groups: Description and crystal structure. Mineral. Mag. 2011, 75, 2721–2732. [Google Scholar] [CrossRef]
- Chukanov, N.V.; Zubkova, N.V.; Pekov, I.V.; Giester, G.; Pushcharovsky, D.Y. Sulfite analogue of alloriite from Sacrofano, Latium, Italy: Crystal chemistry and specific features of genesis. Geol. Ore Depos. 2021, 63, 793–804. [Google Scholar] [CrossRef]
- Hassan, I.; Grundy, H.D. The structure of nosean, ideally Na8[Al6Si6O24]SO4·H2O. Canad. Mineral. 1989, 27, 165–172. [Google Scholar]
- Hassan, I.; Grundy, H.D. The crystal structure of haüyne at 294 and 153 K. Canad. Mineral. 1991, 29, 123–130. [Google Scholar]
- Sapozhnikov, A.N.; Bolotina, N.B.; Chukanov, N.V.; Shendrik, R.Y.; Kaneva, E.V.; Vigasina, M.F.; Ivanova, L.A. Slyudyankaite, Na28Ca4(Si24Al24O96)(SO4)6(S6)1/3(CO2)·2H2O, a new sodalite-group mineral from the Malo-Bystrinskoe lazurite deposit, Baikal Lake area. Amer. Mineral. 2023, in press. [Google Scholar]
- Ivanov, V.G.; Sapozhnikov, A.N. Lazurites of the USSR; Nauka: Novosibirsk, Russia, 1985; 172p. (In Russian) [Google Scholar]
- Bolotina, N.B.; Rastsvetaeva, R.K.; Sapozhnikov, A.N. Average structure of incommensurately modulated monoclinic lazurite. Crystallogr. Rep. 2006, 51, 589–595. [Google Scholar] [CrossRef]
- Shendrik, R.; Kaneva, E.; Radomskaya, T.; Sharygin, I.; Marfin, A. Relationships between the structural, vibrational, and optical properties of microporous cancrinite. Crystals 2021, 11, 280. [Google Scholar] [CrossRef]
- Kaneva, E.; Shendrik, R. Radiation defects and intrinsic luminescence of cancrinite. J. Lumin. 2022, 243, 118628. [Google Scholar] [CrossRef]


| Component | Spot Analysis No. | Mean | |||
|---|---|---|---|---|---|
| 1 | 2 | 3 | 4 | ||
| Na2O | 23.02 | 22.60 | 22.78 | 22.69 | 22.77 |
| K2O | 0.18 | 0.16 | 0.15 | 0.10 | 0.15 |
| Al2O3 | 25.85 | 25.23 | 25.80 | 25.64 | 25.63 |
| Fe2O3 | 0.72 | 0.52 | 0.38 | 0.35 | 0.49 |
| SiO2 | 39.66 | 41.34 | 40.40 | 40.82 | 40.56 |
| P2O5 | 0.24 | 0.42 | 0.45 | 0.26 | 0.34 |
| SO3 | 2.27 | 2.23 | 2.87 | 2.67 | 2.51 |
| Cl | 0.22 | 0.11 | 0.14 | 0.09 | 0.14 |
| −O≡Cl | −0.05 | −0.02 | −0.03 | −0.02 | −0.03 |
| Total | 92.11 | 92.59 | 92.94 | 92.60 | 92.56 |
| Component | Sulfhydrylbystrite (for 19 Spot Analyses) | Bystrite (for 5 Spot Analyses) | ||||
|---|---|---|---|---|---|---|
| Mean | Ranges | Standard Deviation | Mean | Ranges | Standard Deviation | |
| Na2O | 11.89 | 10.59–13.14 | 0.63 | 18.70 | 18.38–19.31 | 0.28 |
| K2O | 9.20 | 8.00–10.54 | 0.76 | 0.16 | 0.08–0.29 | 0.08 |
| CaO | 5.79 | 5.23–7.38 | 0.49 | 5.55 | 4.91–5.95 | 0.41 |
| Al2O3 | 26.29 | 25.17–27.27 | 0.59 | 26.95 | 26.20–27.43 | 0.46 |
| Fe2O3 | 0.07 | 0–0.35 | 0.11 | 0.03 | 0–0.11 | 0.05 |
| SiO2 | 32.35 | 31.52–34.72 | 0.74 | 32.68 | 31.88–33.64 | 0.73 |
| S52− | 14.08 | 15.68–17.34 (for total sulfur) | 0.43 (for total sulfur) | 14.87 | 14.69–15.50 (for total sulfur) | 0.31 (for total sulfur) |
| HS− | 2.21 | 0.51 | ||||
| S2− | 0.28 | - | ||||
| S0 | - | - | ||||
| Cl− | 0.27 | 0–0.65 | 0.19 | 2.70 | 2.39–2.90 | 0.19 |
| –O≡ S52− | −1.41 | - | - | −1.48 | - | - |
| –O≡ HS− | −0.53 | - | - | −0.12 | - | - |
| –O≡ S2− | −0.14 | - | - | - | - | - |
| –O≡Cl− | −0.06 | - | - | −0.61 | - | - |
| Total | 100.29 | - | - | 99.94 | - | - |
| Constituent | Sample 15 | Sample 16 |
|---|---|---|
| Content (wt.%) | ||
| Na2O | 3.05 | 5.21 |
| K2O | 0.64 | 0.31 |
| CaO | 17.57 | 14.75 |
| Al2O3 | 27.91 | 27.32 |
| SiO2 | 43.61 | 48.19 |
| SO3 | 1.97 | 0.10 |
| Cl | 0.58 | 0.68 |
| –O=Cl | –0.13 | –0.15 |
| Total | 95.20 | 96.41 |
| Formula coefficients based on Si + Al = 12 apfu | ||
| Na | 0.93 | 1.51 |
| K | 0.13 | 0.05 |
| Ca | 2.95 | 2.36 |
| Al | 5.16 | 4.81 |
| Si | 6.84 | 7.19 |
| S | 0.23 | 0.01 |
| Cl | 0.15 | 0.16 |
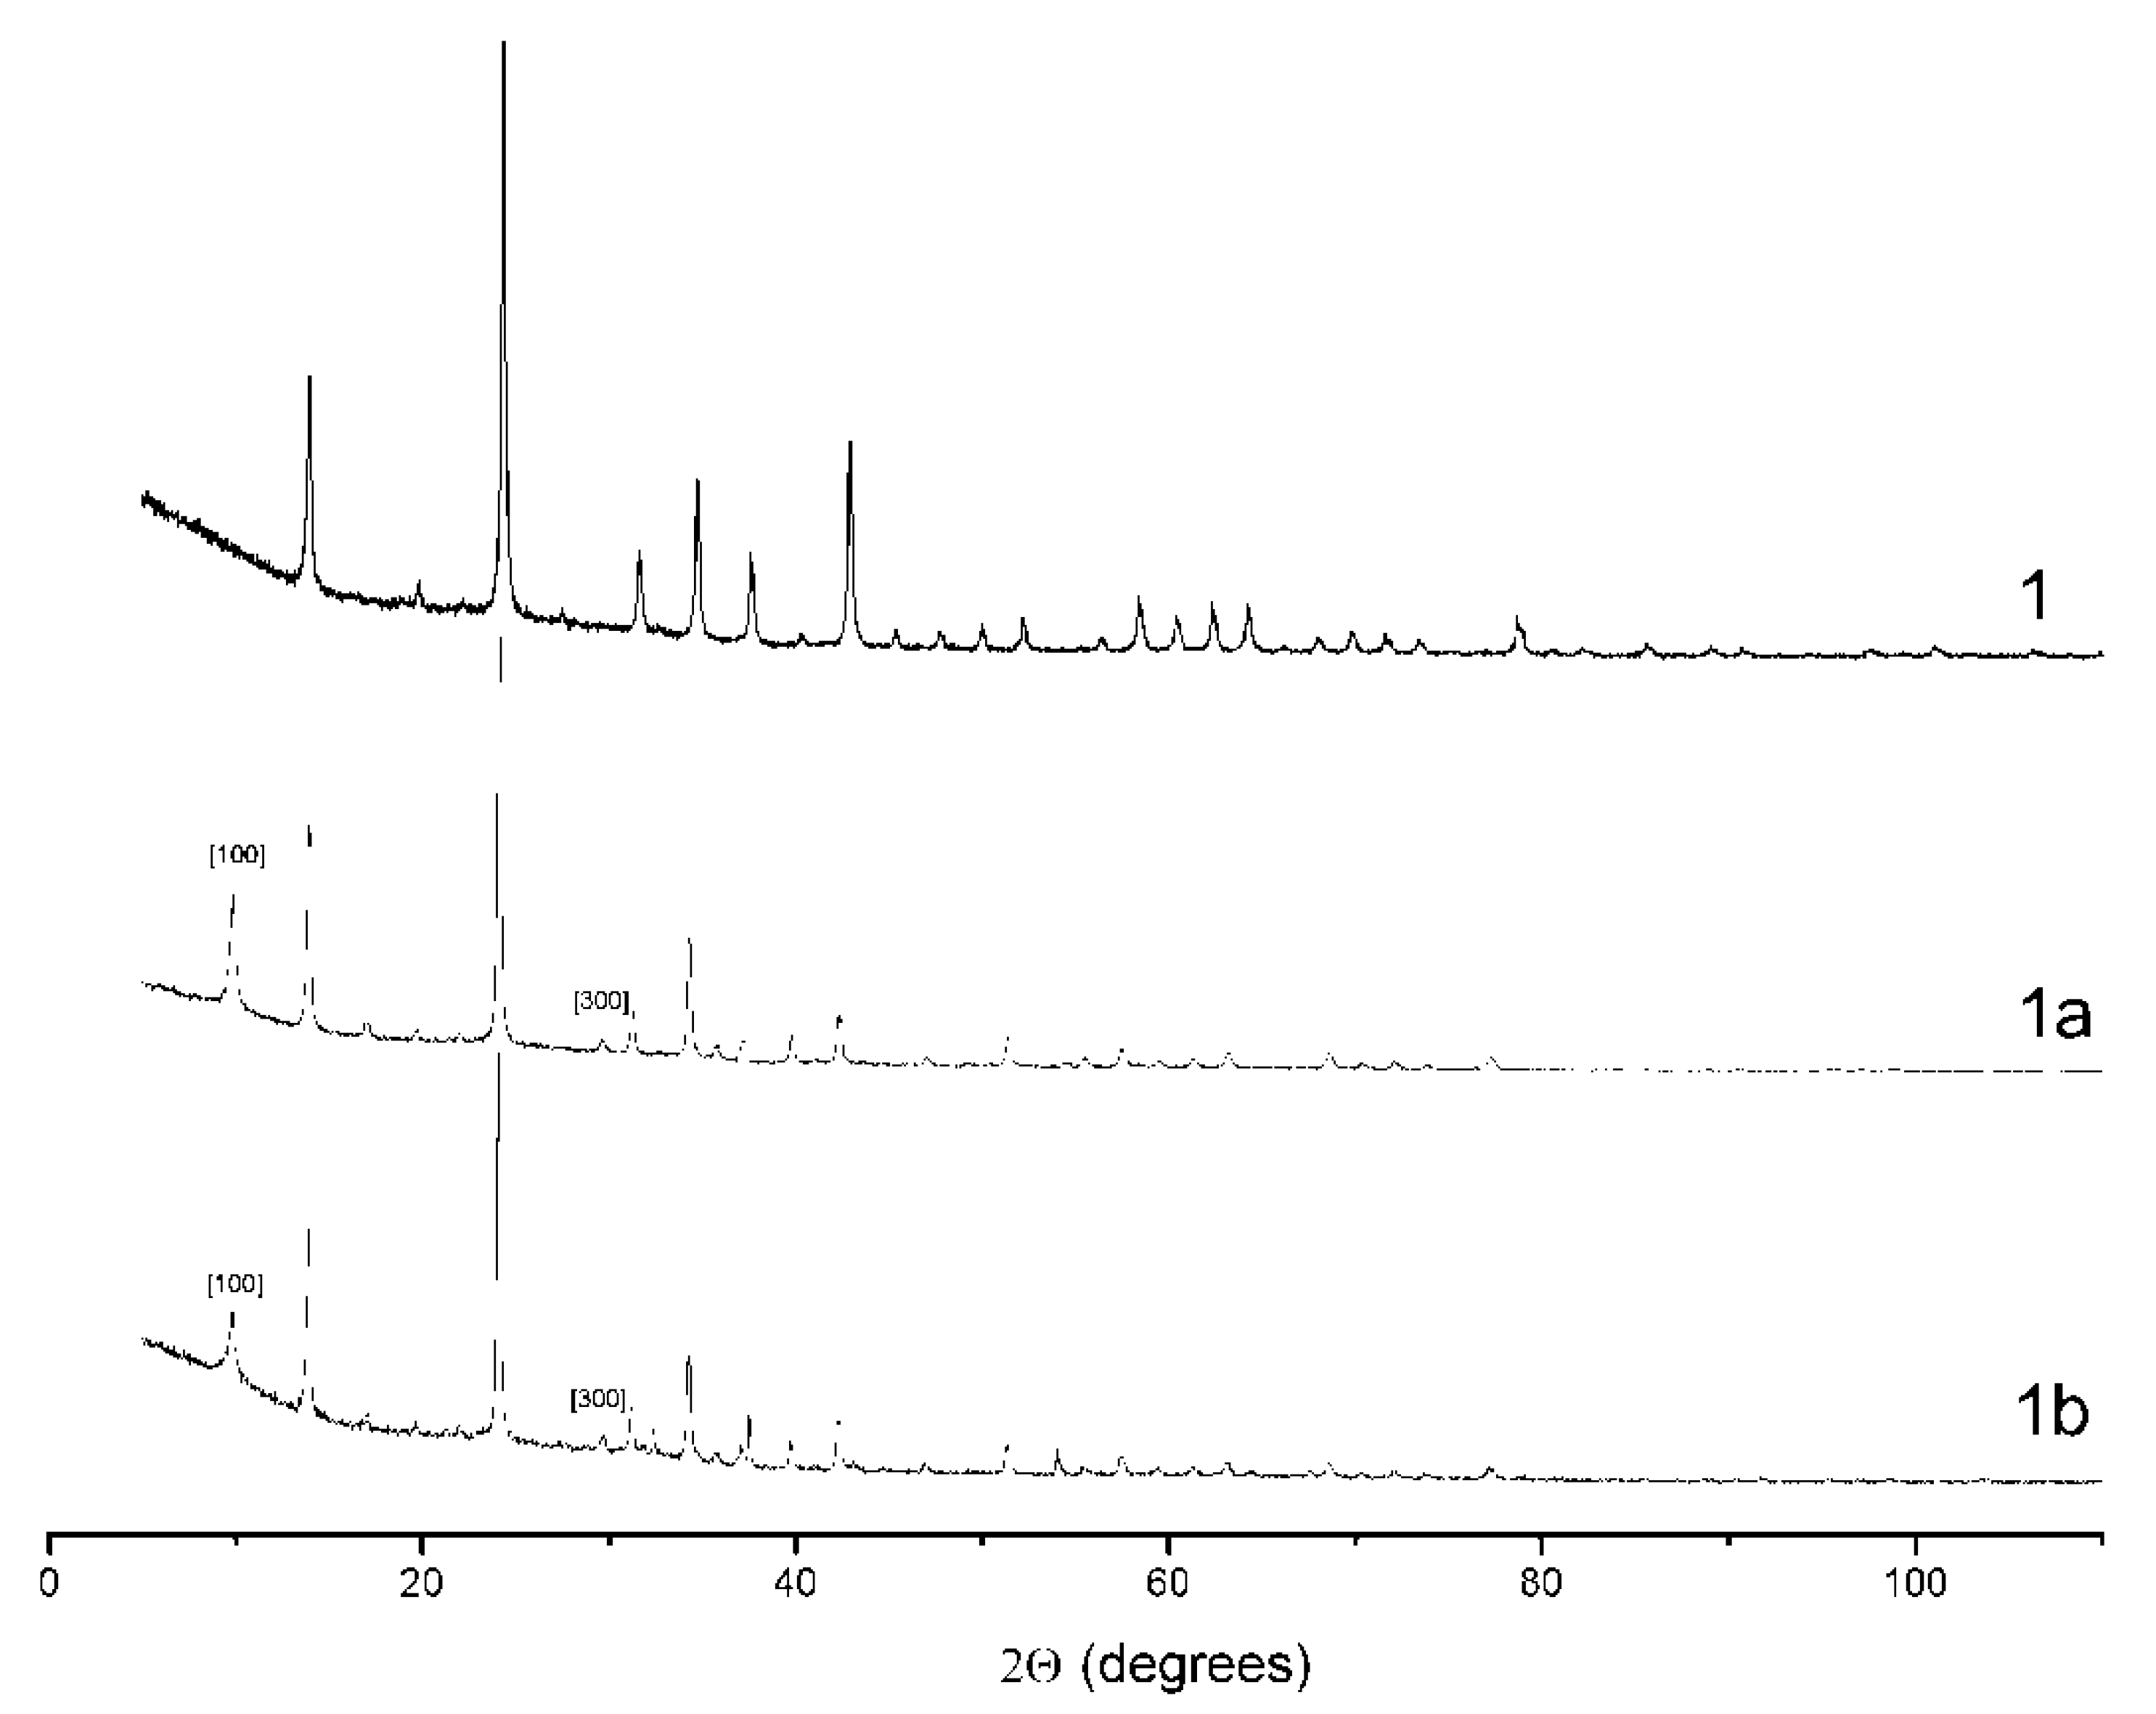
| Experiment | S-Bearing Salt | Treatment Conditions | Color of the Product | Space Group, Unit Cell Parameters |
|---|---|---|---|---|
| 1 | Na2S ·10H2O | Initial product of synthesis | Pale blue | P4-3n, a = 8.9217(3) Å, V = 710.14(1) Å3 |
| 1a | Na2S ·10H2O | t = 800 °C, 6 h, muffle furnace | White | P23, a = 9.0878(1) Å, V = 750.55(1) Å3 |
| 1b | Na2S ·10H2O | t = 700 °C, 6 h, muffle furnace with carbon tablets | Blue | P23, a = 9.0926(1) Å, V = 751.74(1) Å3 |
| 2 | Na2SO3·5H2O | Initial product of synthesis | White | P63, a = 12.7004(7) Å, c = 5.1768(7) Å, V = 723.2(1) Å3 and P4-3n, a = 8.8867(3) Å, V = 701.8(1) Å3 |
| 2a | Na2SO3·5H2O | t = 800 °C, 6 h, muffle furnace | White | P23, a = 9.0928(1) Å, V = 751.79(1) Å3 |
| 2b | Na2SO3·5H2O | t = 700 °C, 6 h, muffle furnace with carbon tablets | White with pale blue hue | P23, a = 9.0913(1) Å, V = 751.41(1) Å3 |
| 3 | Na2S2O3 | Initial product of synthesis | Light green | P3, a = 12.6780(3) Å, c = 5.1905(2) Å, V = 722.5(1) Å3 |
| Analysis No. → Component ↓ | 1 | 2 | 3 | 4 | 5 | 6 | 7 |
|---|---|---|---|---|---|---|---|
| Content (wt.%) | |||||||
| Na2O | 24.3 | 15.36 | 19.23 | 19.14 | 21.43 | 22.68 | 16.00 |
| K2O | - | 0.67 | 5.15 | - | - | 1.54 | - |
| CaO | - | - | - | - | - | 0.18 | 4.69 |
| Al2O3 | 33.32 | 33.60 | 37.51 | 32.98 | 30.79 | 32.71 | 30.62 |
| Fe2O3 | - | - | - | - | 0.33 | 0.53 | 0.33 |
| SiO2 | 38.46 | 37.94 | 42.22 | 38.52 | 38.19 | 41.46 | 40.66 |
| HS− | 5.39 | - | - | - | - | - | - |
| SO3 | - | 12.79 | 14.29 | - | 8.10 | 3.66 | - |
| SO2 | - | - | - | 6.35 | - | - | - |
| S2O3 | - | - | - | - | - | - | 9.56 |
| Total | 100.24 * | 100.36 | 118.40 | 94.99 | 98.85 | 102.75 | 100.57 * |
| Formula coefficients calculated on 12 Si + Al + Fe atoms per formula unit | |||||||
| Na | 7.27 | 4.61 | 5.18 | 6.15 | 6.67 | 6.56 | 4.83 |
| K | - | 0.13 | 0.91 | - | - | 0.29 | - |
| Ca | - | - | - | - | - | 0.03 | 0.78 |
| Al | 6.06 | 6.13 | 6.14 | 5.90 | 5.83 | 5.75 | 5.62 |
| Fe | - | - | - | - | 0.04 | 0.06 | 0.04 |
| Si | 5.94 | 5.87 | 5.86 | 6.10 | 6.13 | 6.19 | 6.34 |
| Stotal | 1.51 | 1.49 | 1.49 | 0.91 | 0.98 | 0.41 | 1.60 |
| Annealing Time, h | Parameters of Cubic Subcells, Å * | Content of the MSO4 Component, Mol.% ** | |
|---|---|---|---|
| Sulfide Phase | Sulfate-Rich Phase | ||
| T = 600 °C | |||
| 1 | 8.945 | - | 20 |
| 2 | 8.949 | - | 22 |
| 4 | 8.950 | - | 23 |
| 8 | 8.953 | - | 25 |
| 16 | 8.961 | - | 29 |
| 32 | 8.969 | - | 34 |
| 64 | 8.980, 9.069 | 91 | 40 |
| 128 | 8.988, 9.080 | 97 | 45 |
| 256 | 8.992, 9.078 | 96 | 47 |
| T = 700 °C | |||
| 1 | 8.975, 9.032 | 70 | 37 |
| 2 | 8.982, 9.042 | 75 | 41 |
| 4 | 8.984, 9.059 | 85 | 42 |
| 8 | 9.076 | 95 | - |
| 16 | 9.083 | 99 | - |
| Mineral | SO3, wt.% S *, wt.% | Kinds of Sulfide Groups | Symmetry | Unit Cell Parameters | References |
|---|---|---|---|---|---|
| Nosean | 10.27 0 | - | Cubic | a = 9.084(2) Å | [12,105] |
| Haüyne | 14.2 0 | - | Cubic | a = 9.1164(5) Å | [106] |
| SO42−-deficient haüyne | 12.43 0.11 | S2•–, S3•– | Cubic ** | a = 9.065(1) Å | [5] |
| S4-bearing haüyne (Sample 5) | 13.89 1.31 | S4, S3•– | Cubic ** | a = 9.071(2) Å | [5], this work |
| Slyudyankaite | 10.95 1.75 | S6, S4, S3•– | Triclinic ** | a = 9.0523(4) Å b = 12.8806(6) Å c = 25.681(1) Å α = 89.988(2)° β = 90.052(1)° γ = 90.221(1)° | [107] |
| “Monoclinic lazurite” | 10.89 1.94 | S3•–, S4 | Mono- clinic ** | a = 9.069(6) Å b = 12.868(1) Å c = 25.744(1) Å γ = 90.19(1) (1)° | [108,109], this work |
| Vladimirivanovite | 11.37 1.94 | S3•–, S2•– | Ortho- rhombic ** | a = 9.066(2) Å b = 12.851(3) Å c = 38.558(8) Å | [64], this work |
| Sapozhnikovite | 0 4.20 | HS−, S2•– | Cubic | a = 8.91462(7) Å | [7] |
| Lazurite | 8.08 5.07 | S3•–, S2− | Cubic ** | a = 9.087(2) Å | [6] |
Publisher’s Note: MDPI stays neutral with regard to jurisdictional claims in published maps and institutional affiliations. |
© 2022 by the authors. Licensee MDPI, Basel, Switzerland. This article is an open access article distributed under the terms and conditions of the Creative Commons Attribution (CC BY) license (https://creativecommons.org/licenses/by/4.0/).
Share and Cite
Chukanov, N.V.; Shchipalkina, N.V.; Shendrik, R.Y.; Vigasina, M.F.; Tauson, V.L.; Lipko, S.V.; Varlamov, D.A.; Shcherbakov, V.D.; Sapozhnikov, A.N.; Kasatkin, A.V.; et al. Isomorphism and Mutual Transformations of S-Bearing Components in Feldspathoids with Microporous Structures. Minerals 2022, 12, 1456. https://doi.org/10.3390/min12111456
Chukanov NV, Shchipalkina NV, Shendrik RY, Vigasina MF, Tauson VL, Lipko SV, Varlamov DA, Shcherbakov VD, Sapozhnikov AN, Kasatkin AV, et al. Isomorphism and Mutual Transformations of S-Bearing Components in Feldspathoids with Microporous Structures. Minerals. 2022; 12(11):1456. https://doi.org/10.3390/min12111456
Chicago/Turabian StyleChukanov, Nikita V., Nadezhda V. Shchipalkina, Roman Yu. Shendrik, Marina F. Vigasina, Vladimir L. Tauson, Sergey V. Lipko, Dmitry A. Varlamov, Vasiliy D. Shcherbakov, Anatoly N. Sapozhnikov, Anatoly V. Kasatkin, and et al. 2022. "Isomorphism and Mutual Transformations of S-Bearing Components in Feldspathoids with Microporous Structures" Minerals 12, no. 11: 1456. https://doi.org/10.3390/min12111456