


The Rheological Properties and Strength Characteristics of Cemented Paste Backfill with Air-Entraining Agent
 ,
,
Abstract
:1. Introduction
2. Experiment
2.1. Materials
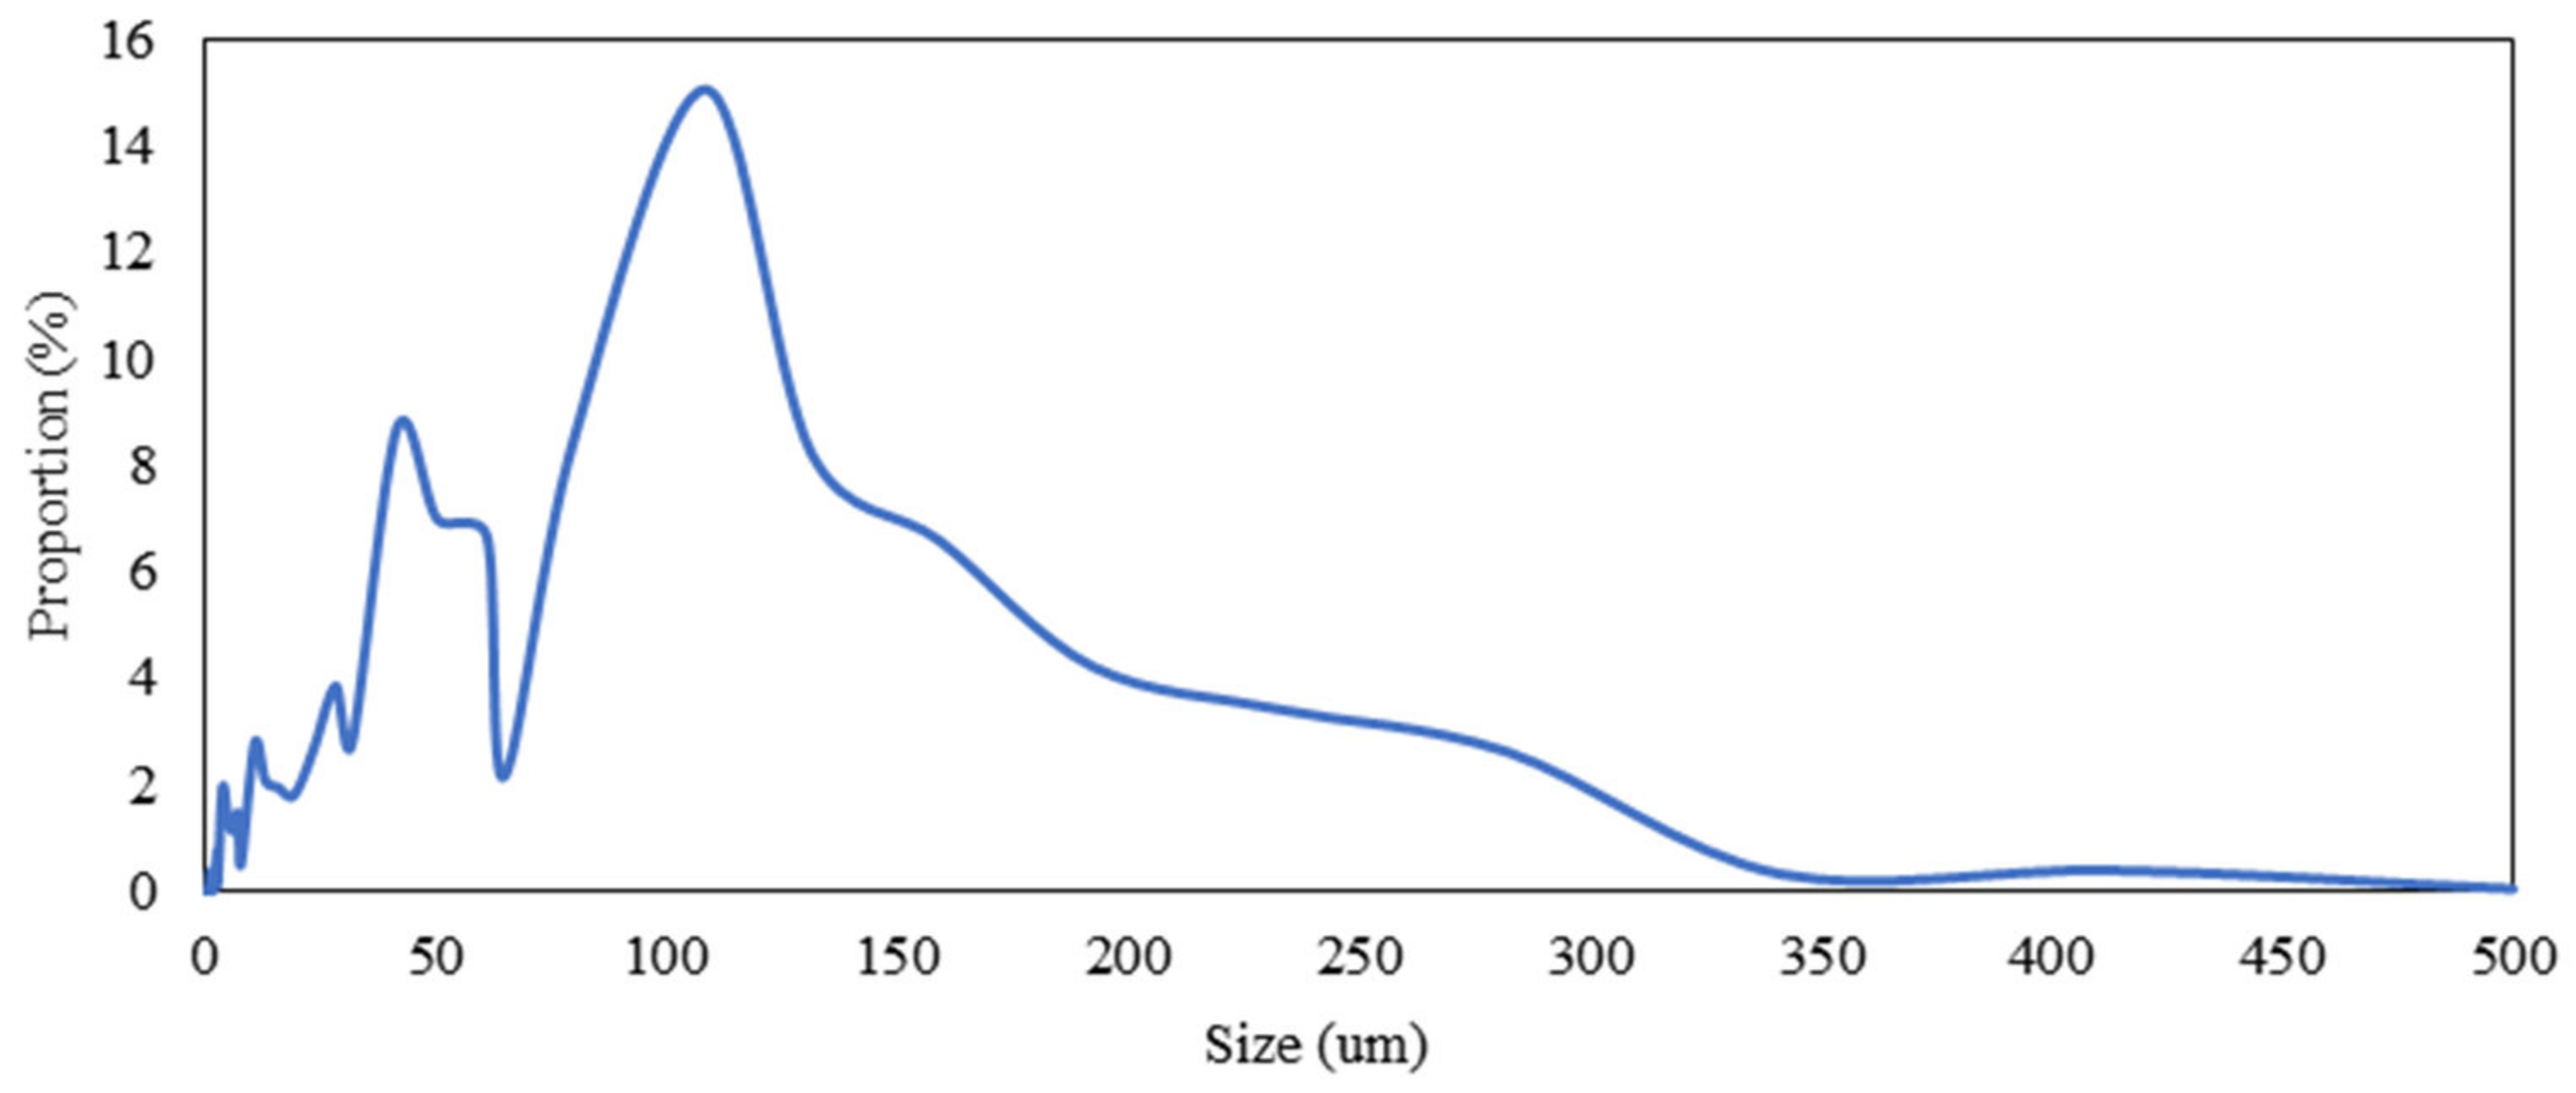
2.1.1. Gangue
2.1.2. Cement
2.1.3. Fly Ash
2.1.4. Air-Entraining Agents
2.2. Experimental Methods
2.2.1. Experimental Design
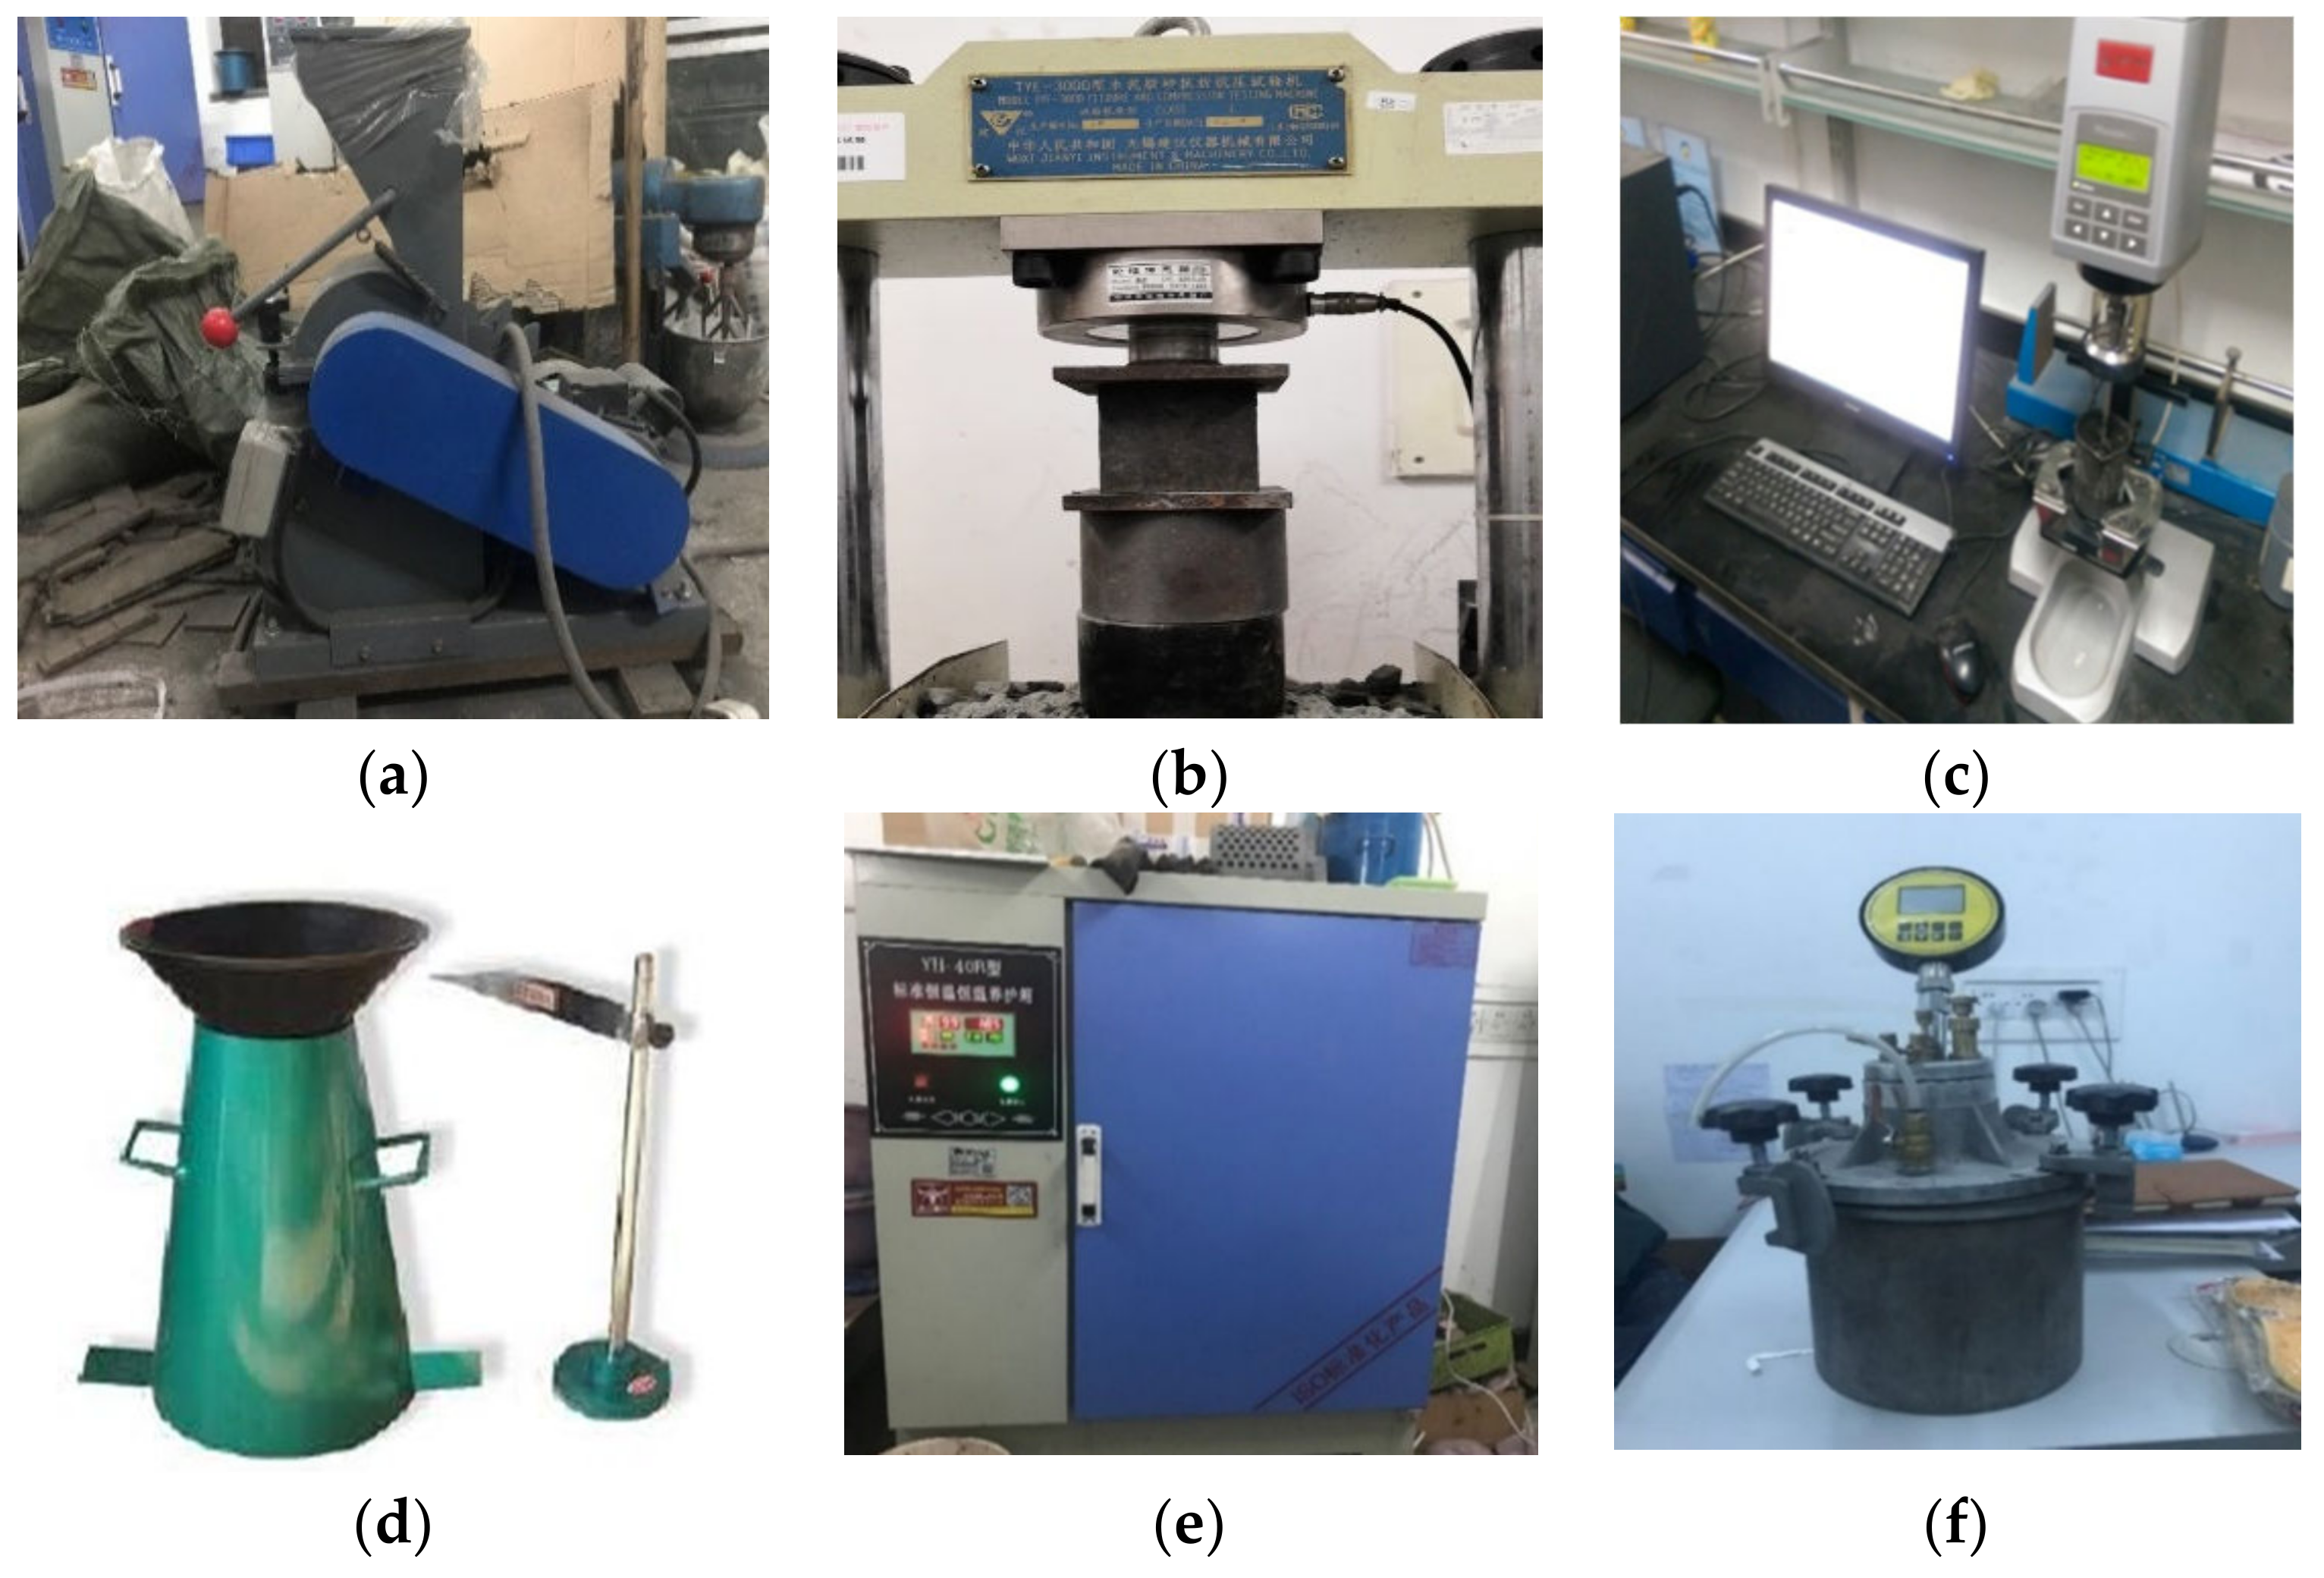
2.2.2. Slurry Mixing
- (a)
- Weighing of the raw materials according to the design table,
- (b)
- Pouring the solid material into the mixing vessel and mixing it at 75 r/min for 2 min,
- (c)
- Pouring water into the mixing vessel and mixing it at 75 r/min for 5 min,
- (d)
- Pouring the AEA solution into the slurry and mixing it at 58 r/min for 2 min. The lower speed is to make the bubbles in the paste more stable.
2.2.3. Air Content Test
- (a)
- After the calibration of the air content tester, fill the container with the slurry and vibrate it for 15–30 s until there are no bubbles.
- (b)
- Cover the lid, tighten the clamp, and open the exhaust valve. Fill the container with water until the air outlet flows.
- (c)
- Close the water injection valve and exhaust valve, open the air inlet valve, and pressurize the container to 0.1 MPa.
- (d)
- Press the valve lever 1–2 times and read out the pressure value and the air content value.
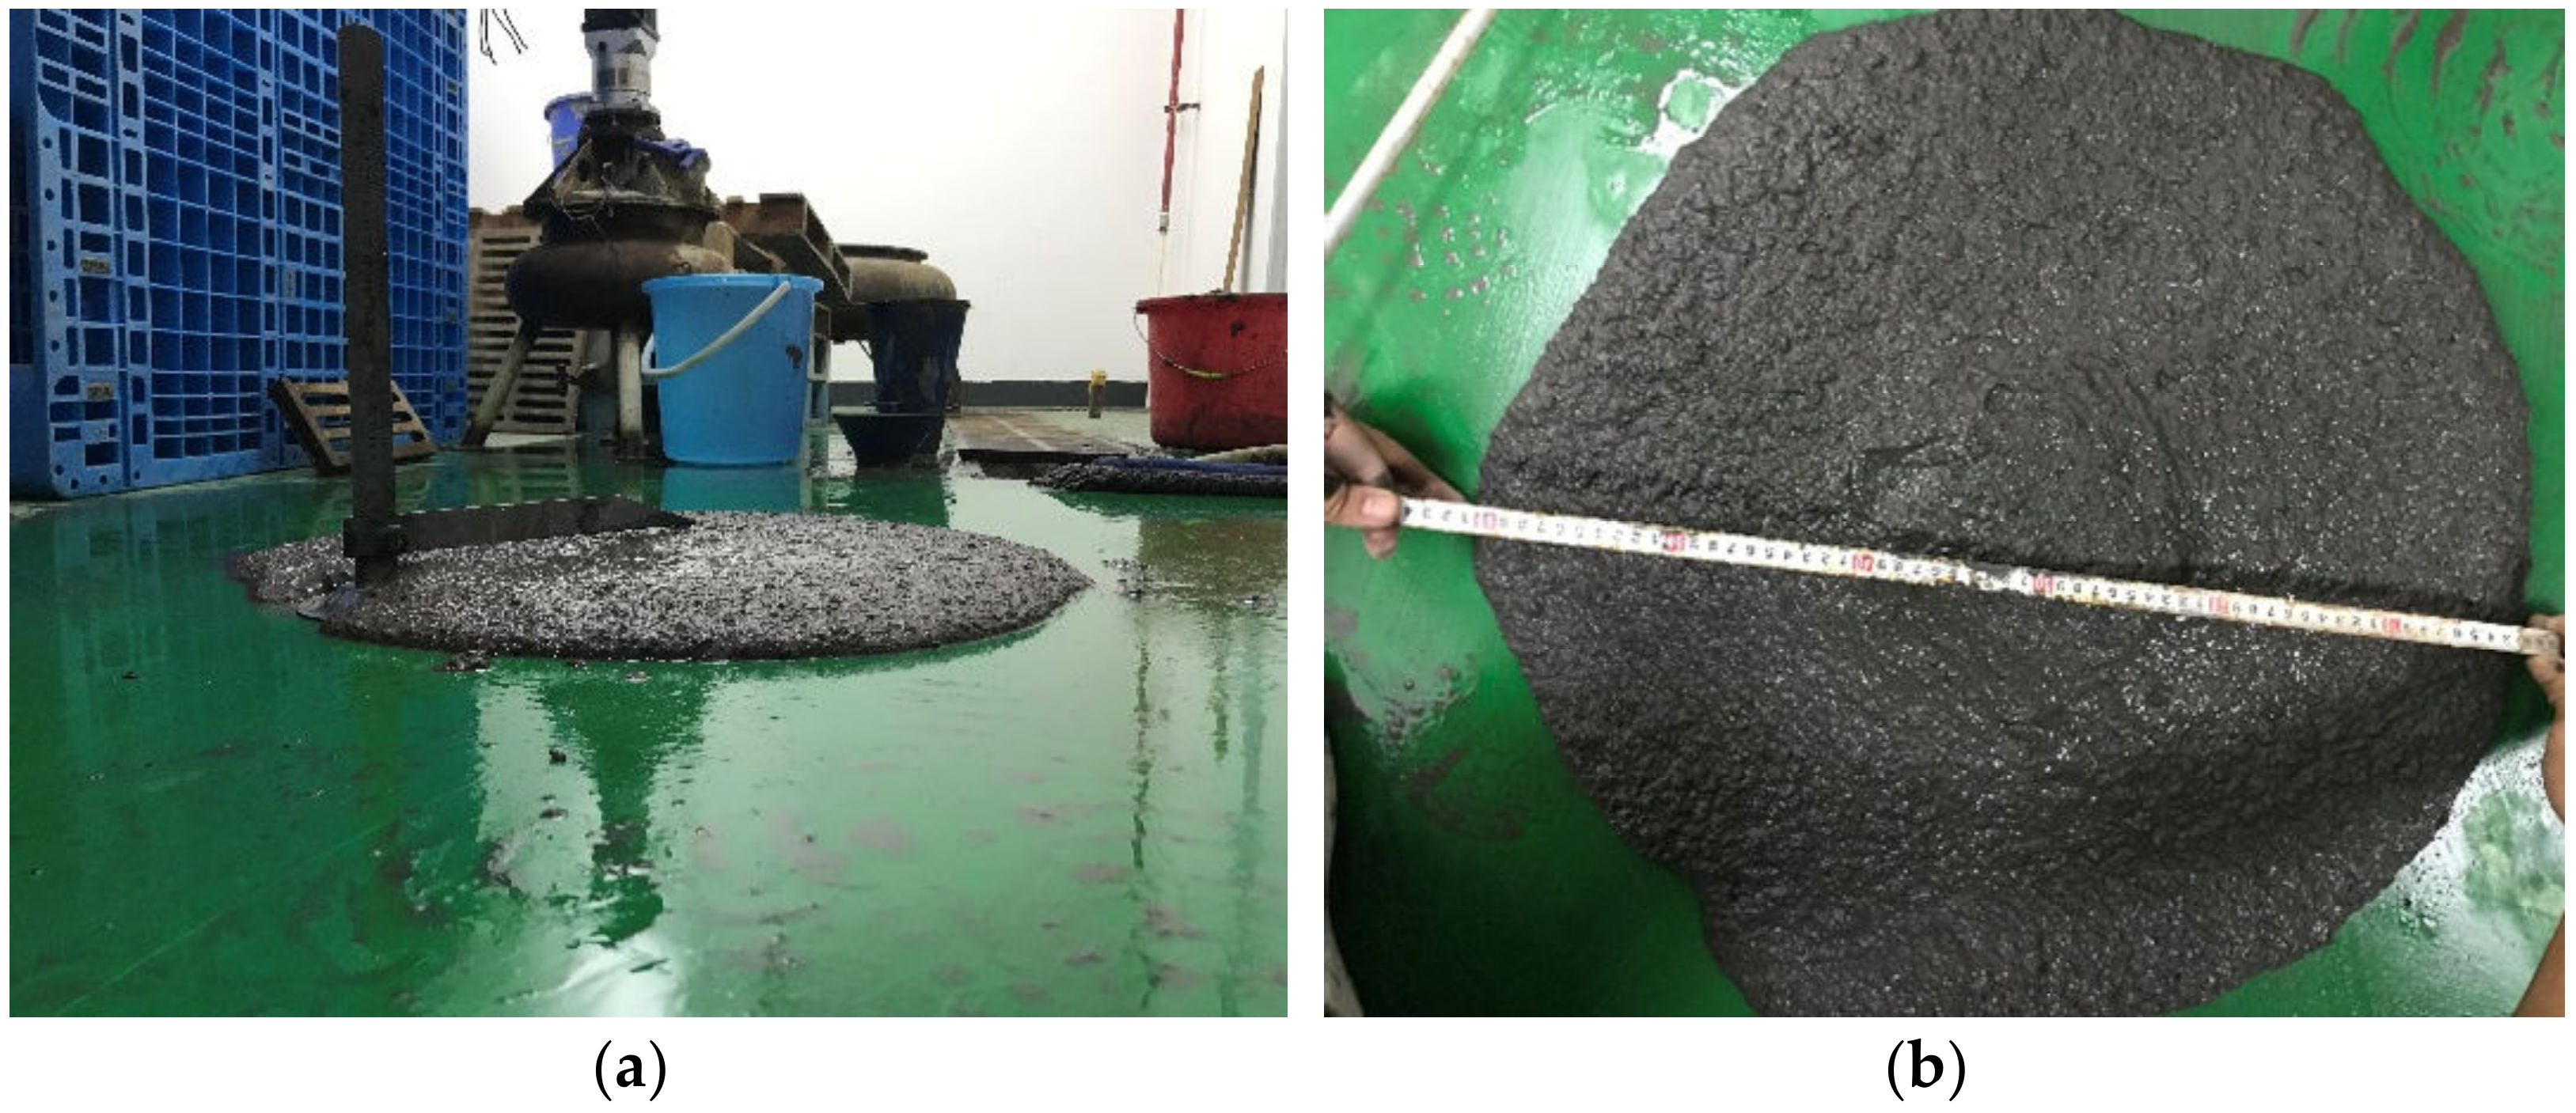
2.2.4. Slump and Expansion Test
2.2.5. Viscosity and Yield Stress Test
2.2.6. UCS Test
3. Results and Analysis
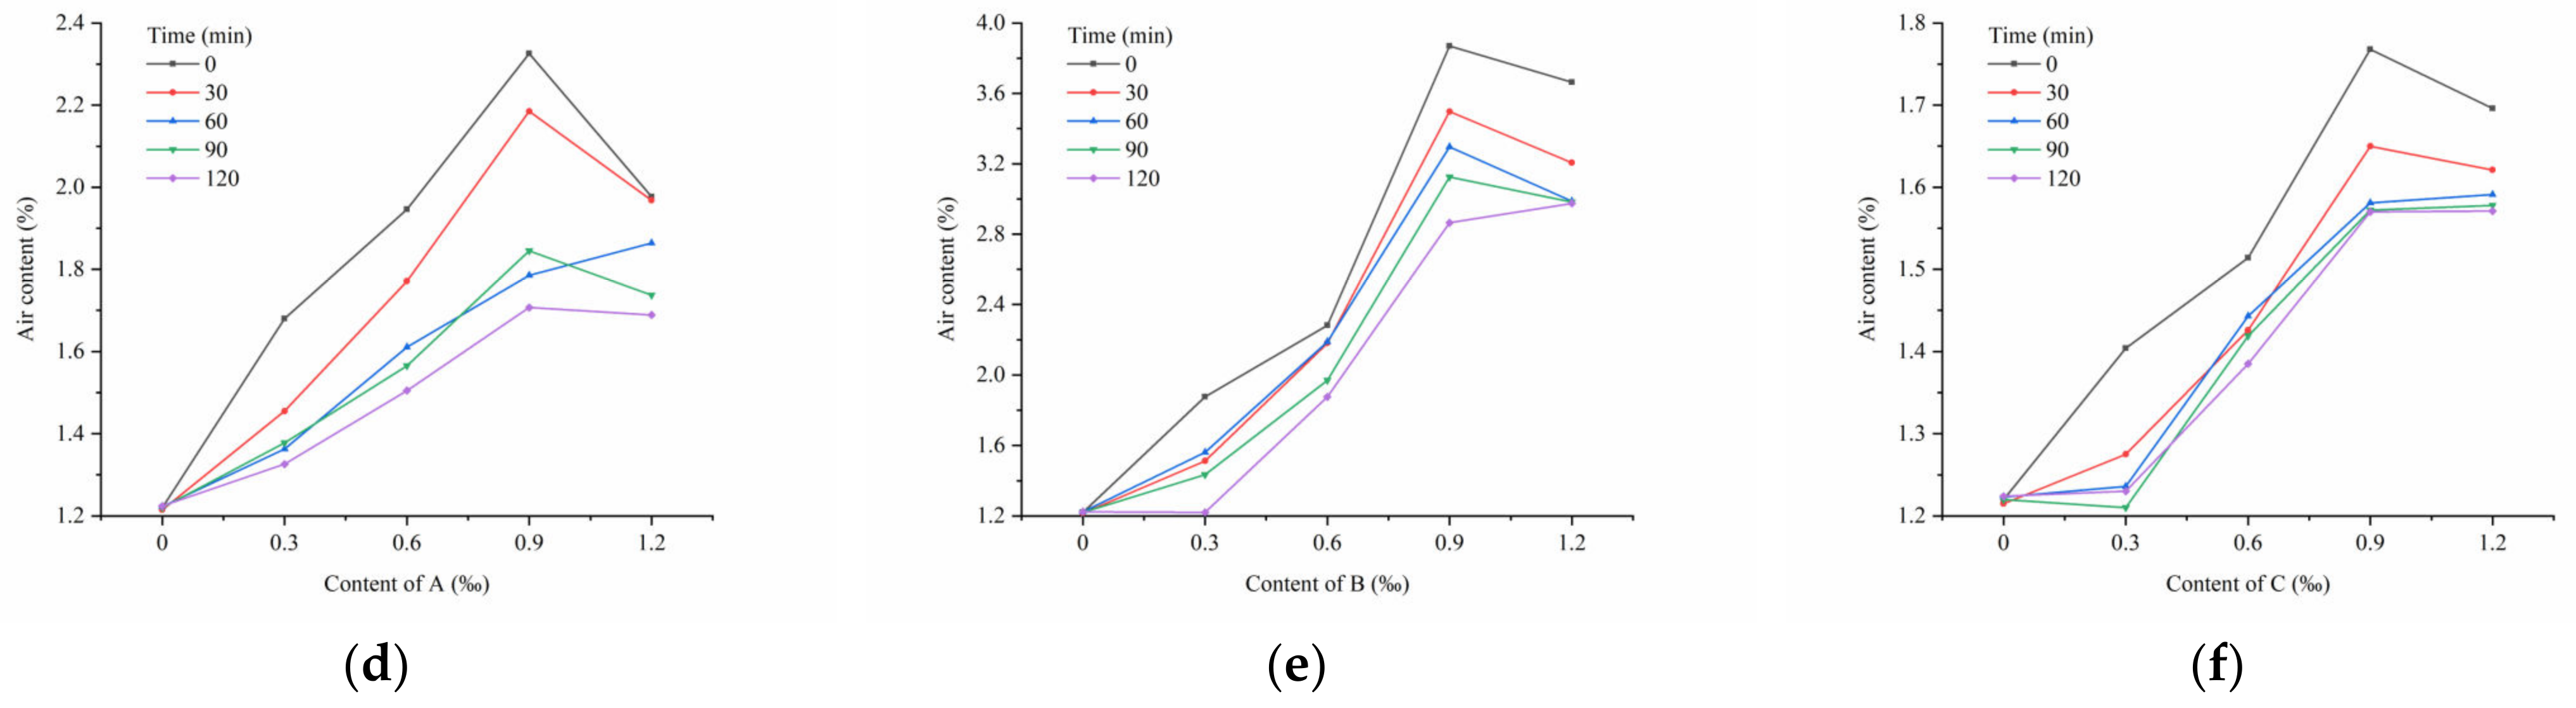
3.1. Air Content
3.2. Slump and Expansion
3.3. Yield Stress and Viscosity
3.4. Strength
4. Conclusions
- (1)
- AEA can form a large number of small-volume air bubbles in fresh slurry. The air content in the slurry decreases with time. With AEA content was 0 in the control group, and the highest air content of A was 109% of it, 319% for B, and 144% for C. However, the increase in air content has a limited effect. Compared to an AEA air content of 0.9‰, when the AEA content is 1.2‰, the air content of A is 85% of its highest value, 94% of that of B, and 96% of that of C. This may be because the number of air bubbles that can be accommodated reaches the upper limit, with too many tiny air bubbles combining to form large air bubbles that break easily.
- (2)
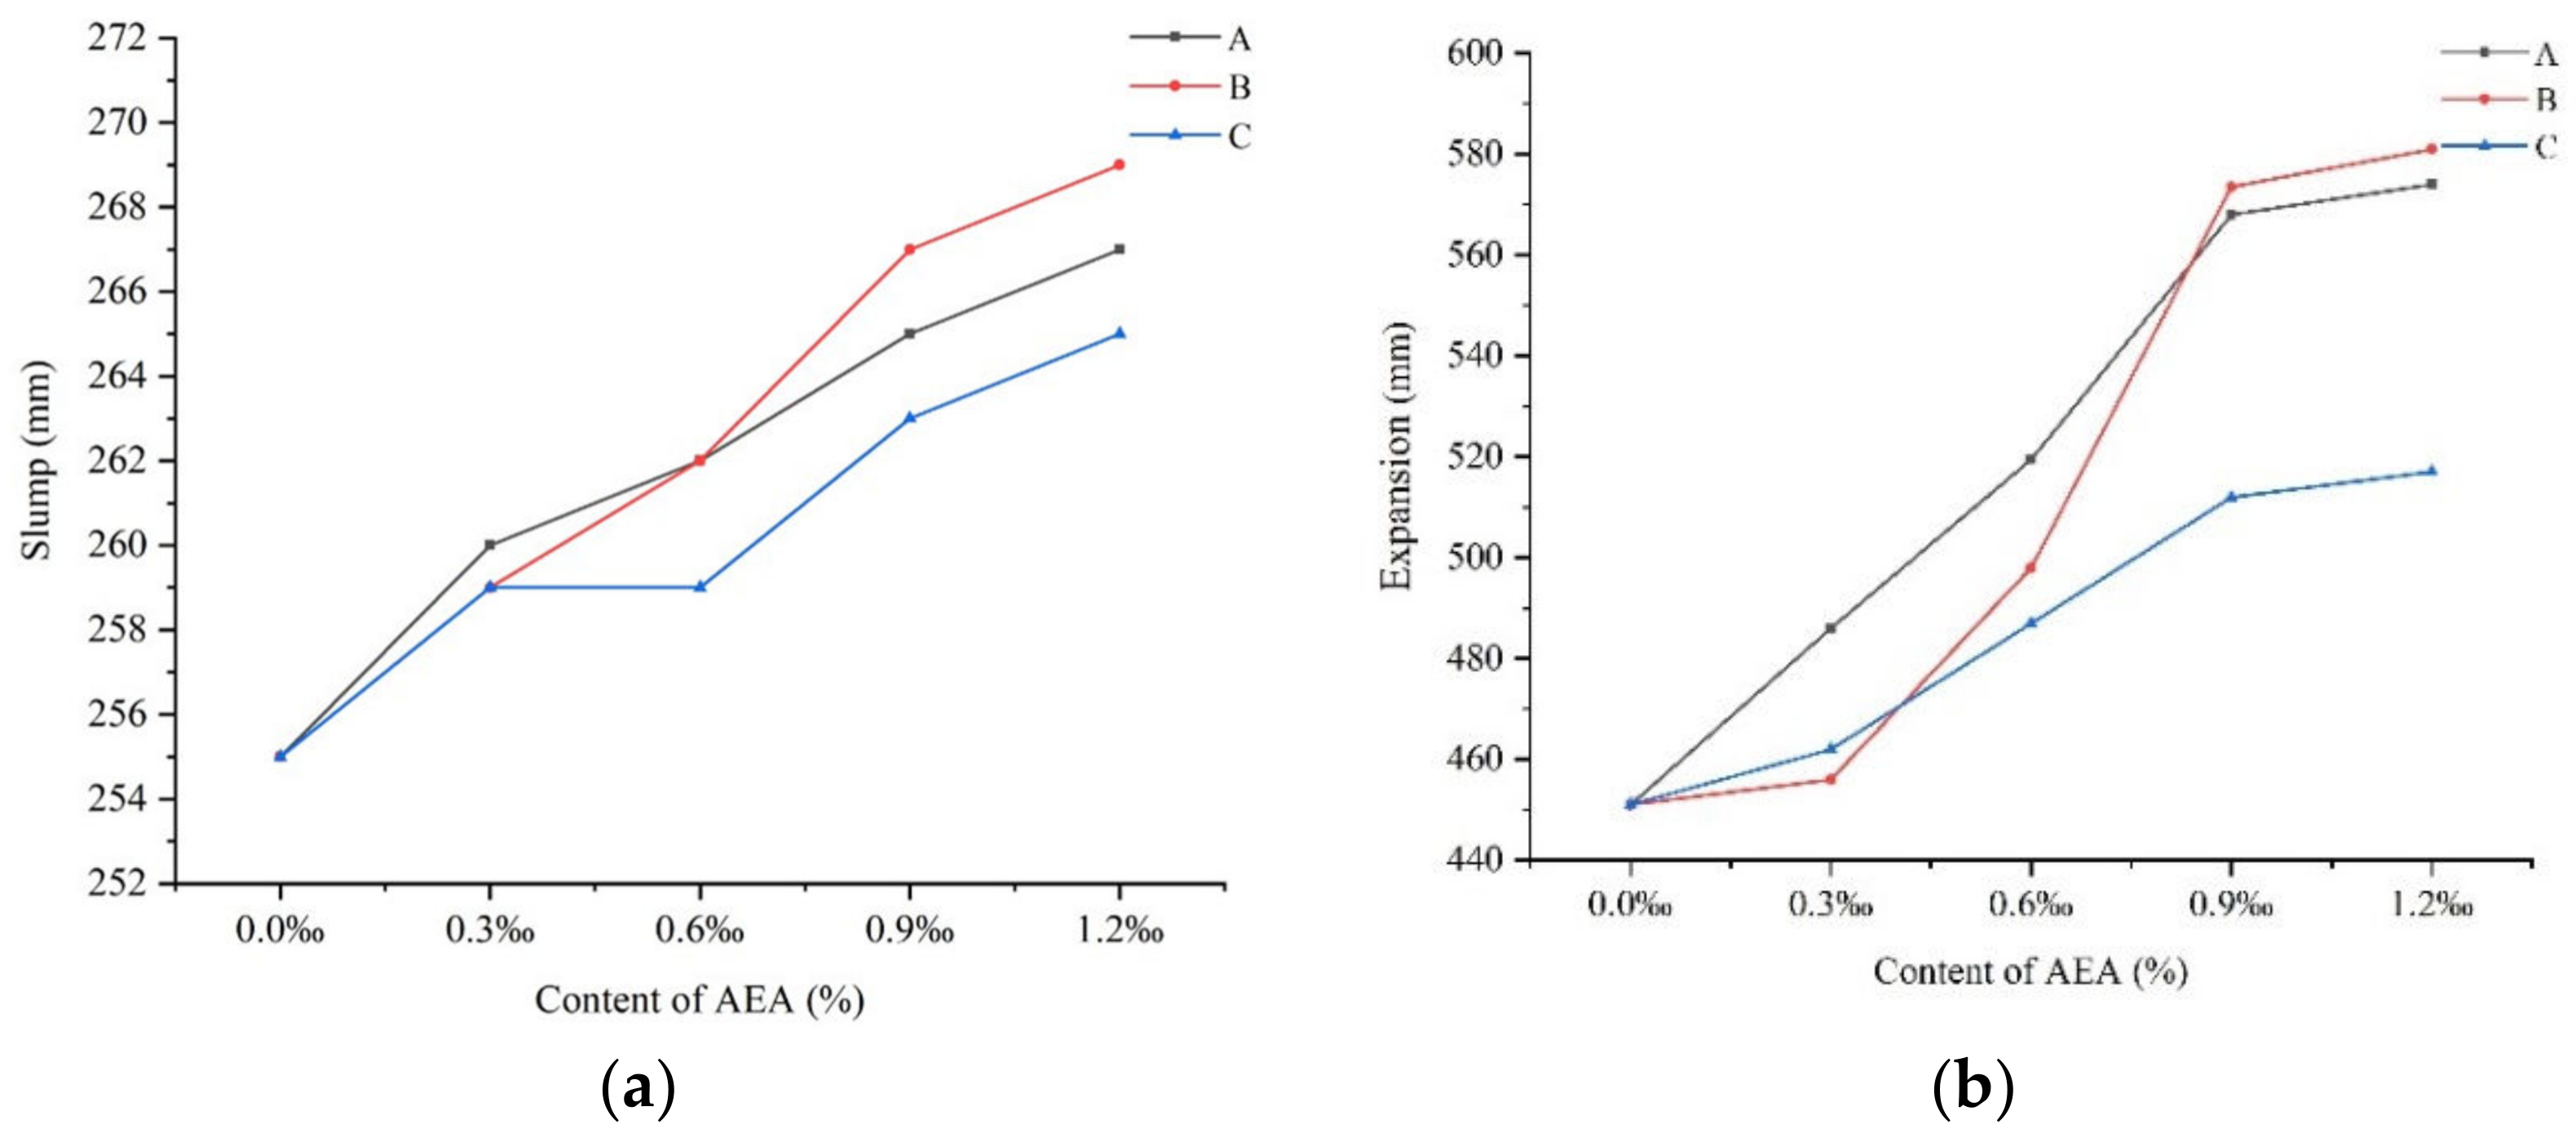
- AEA increases the slump and expansion of the fresh slurry. As the AEA content increases, the slump of the slurry also increased. Compared with an AEA content of 0, the slump of A increased by 12mm when the AEA content was 1.2, that of B increased by 14mm, and that of C increased by 10mm, which indicated that the slump of the slurry was improved by adding AEA. With the increase in the AEA content, the expansion of the slurry also increased. With the same AEA content (all 1.2), the expansion of B was 581 mm, that of A was 574 mm, and that of C was 517 mm. This indicates that B improved the expansion of the slurry the most. In characterizing the flowability of the slurry, the results of the expansiveness coincide with the slump results. The larger the value tested, the better the material will flow. This is probably because AEA increases the number of tiny bubbles in the slurry, resulting in the improved flowability of the slurry.
- (3)
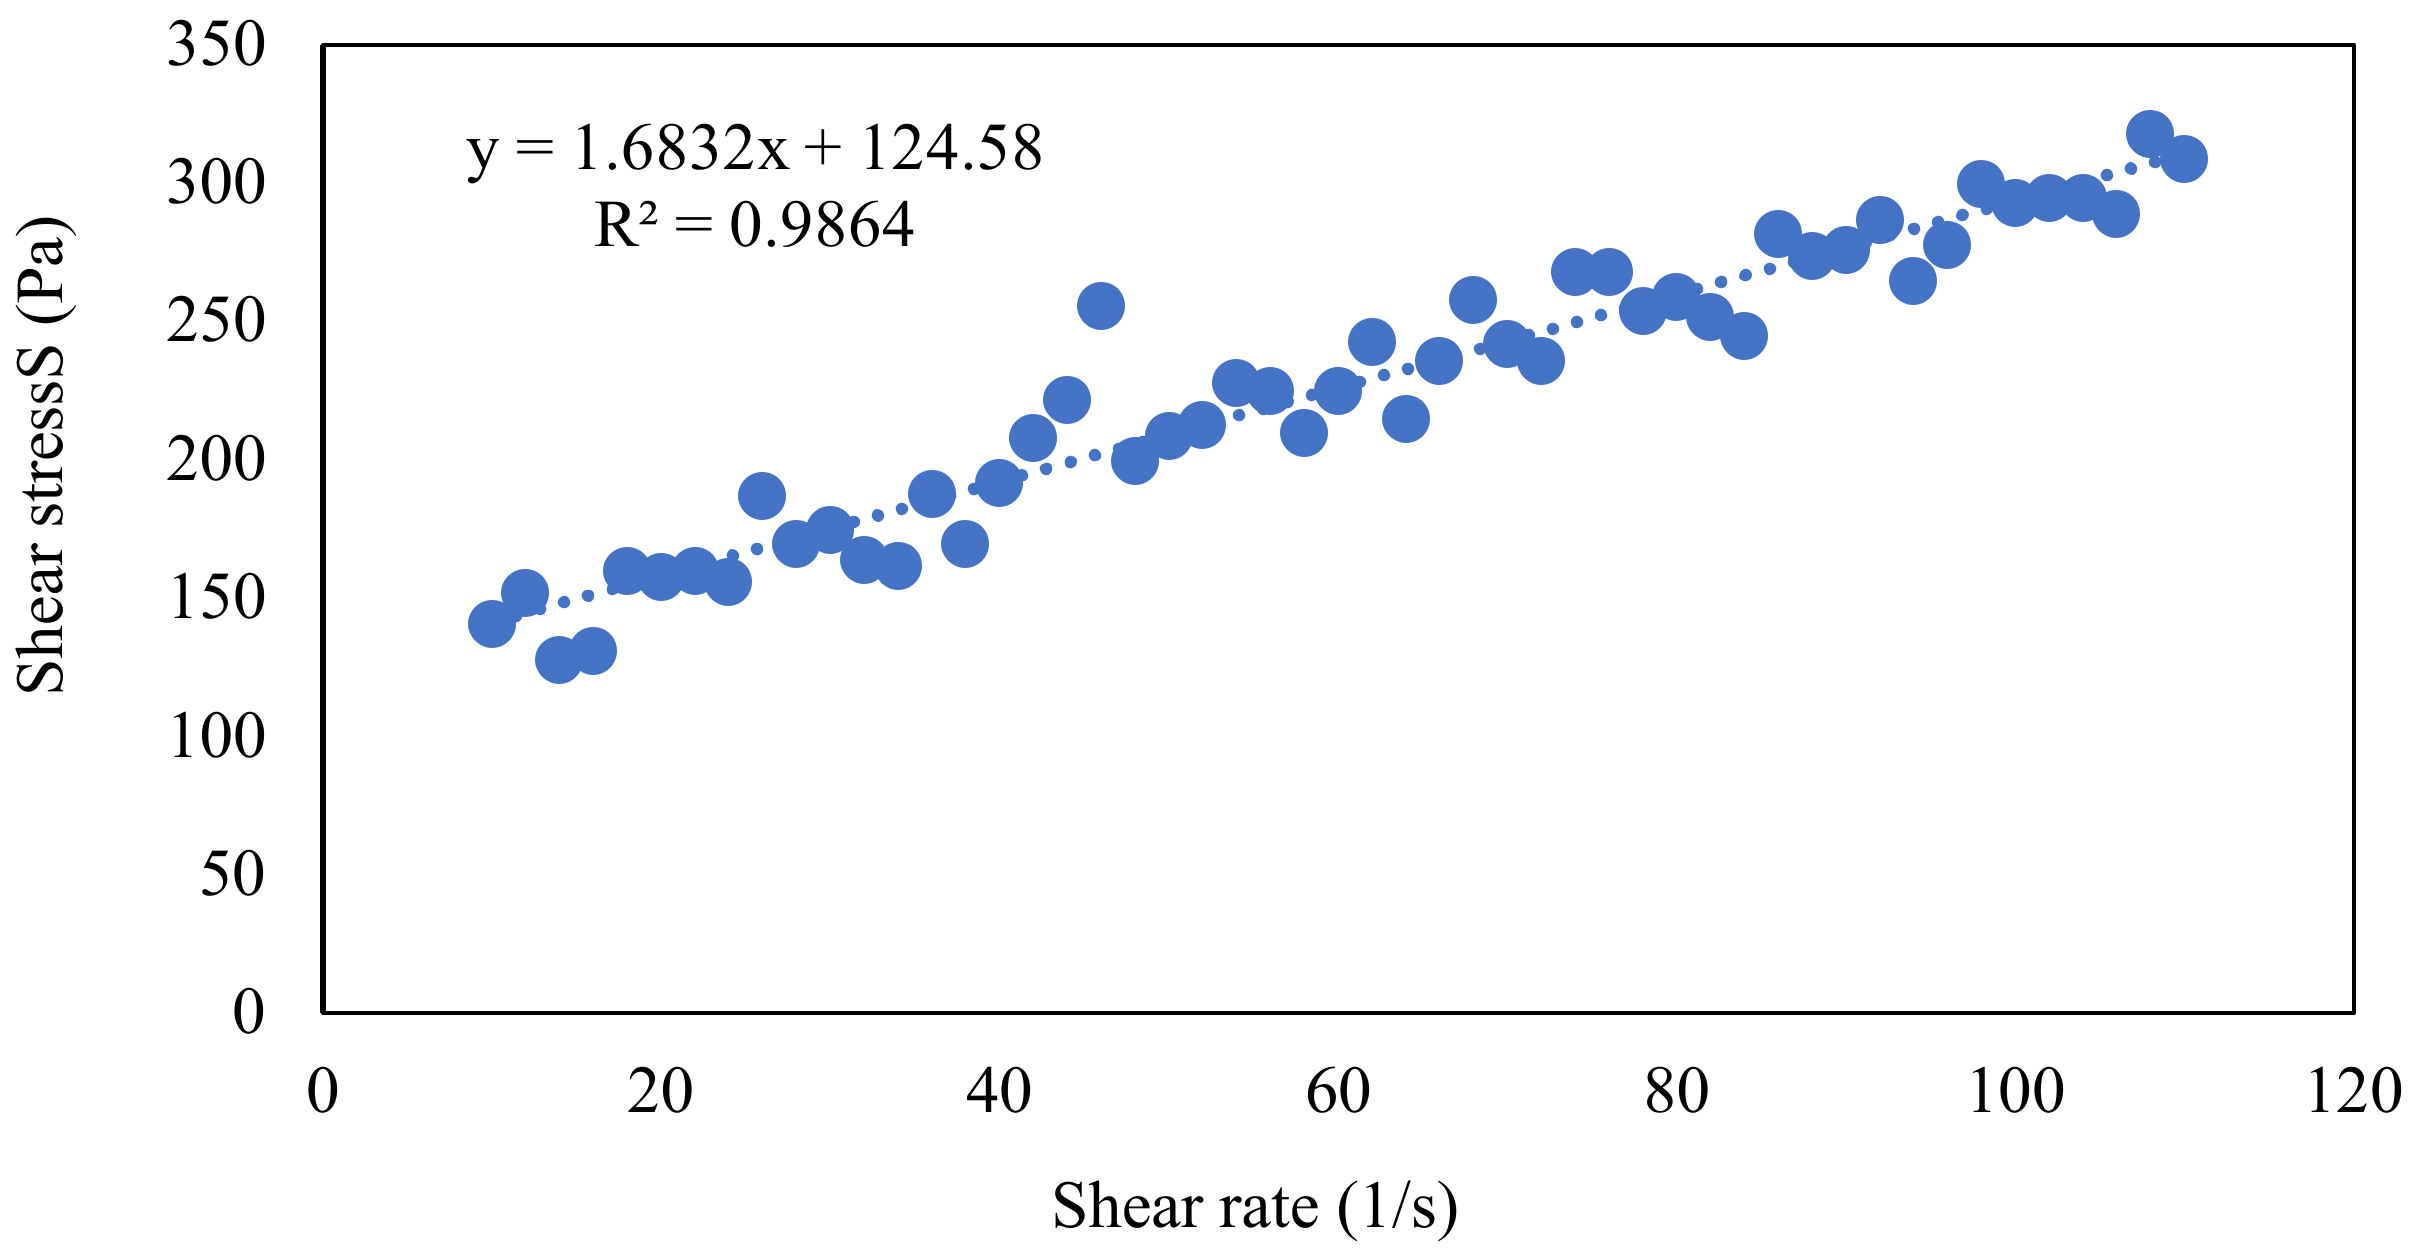
- AEA can reduce the viscosity and yield stress of the slurry. With the addition of AEA, both the viscosity and yield stress of the slurry decreased. In other words, AEA can improve the flow characteristics of fresh slurry. These results also prove the results of the slump and expansion tests.
- (4)
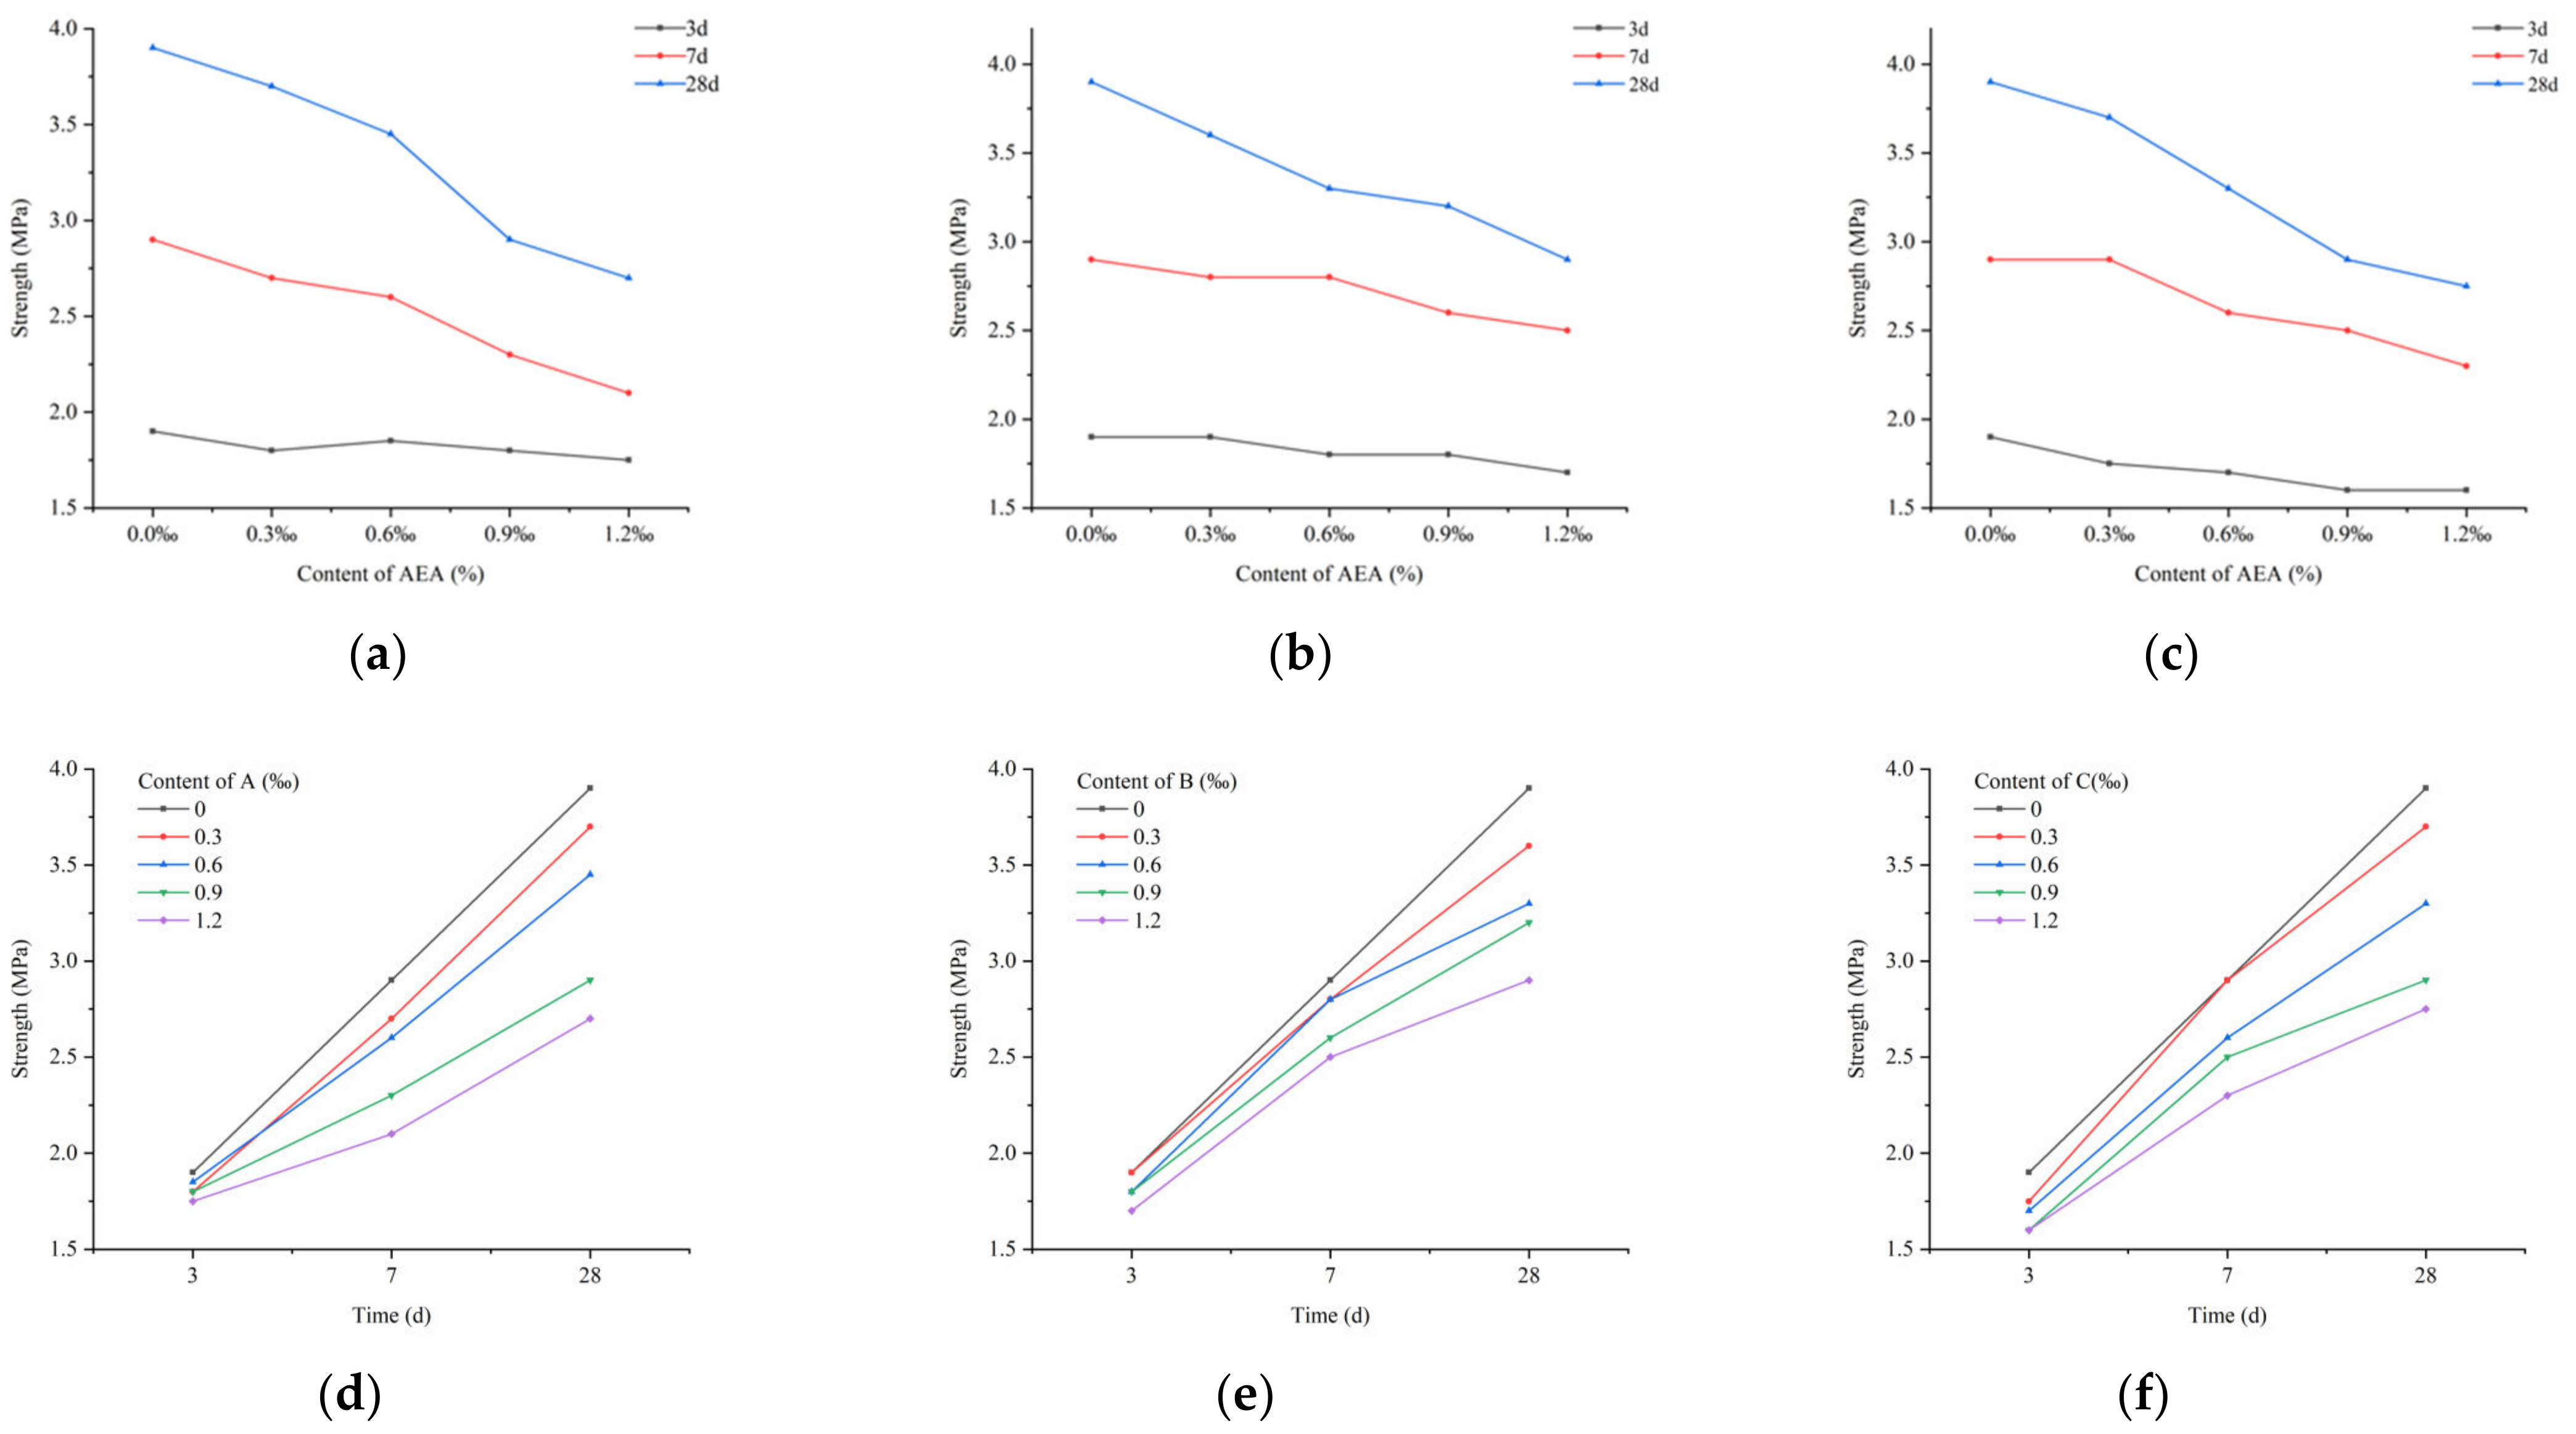
- AEA reduces the strength of the paste backfill sample, but it does not reduce it much. When the B content was 1.2‰, the strength of the samples after 28 days of maintenance was reduced by 25.6%. According to the analysis of the strength test results, the number and volume of bubbles increase as the AEA content increases, which means that the voids inside the samples increase and cause the strength of the samples to decrease.
- (5)
- Considering the above experimental results and analysis, the strength requirement of the paste for the Linxi mine is 3 MPa. The final dosage of 0.9‰ B is the best choice, as it can change the flowability of the paste better and reduce the pipeline transportation resistance and transportation energy consumption. At the same time, the reduction in strength is also acceptable.
- (6)
- Further research is encouraged in the following areas:
- (a)
- The mechanism of AEA affecting the flow properties and strength characteristics of paste made with gangue, fly ash, and cement should be studied using micro-experimental techniques.
- (b)
- The effects of physical and chemical properties of gangue on the bubble shape and size distribution should be determined.
- (c)
- Applicability of laboratory-scale results to field conditions should be considered.
Author Contributions
Funding
Data Availability Statement
Conflicts of Interest
References
- Chen, J.; Zeng, B.; Liu, L.; Tao, K.; Zhao, H.; Zhang, C.; Zhang, J.; Li, D. Investigating the anchorage performance of full-grouted anchor bolts with a modified numerical simulation method. Eng. Fail. Anal. 2022, 141, 106640. [Google Scholar] [CrossRef]
- Li, B.; Zhang, J.; Yan, H.; Zhou, N.; Li, M. Experimental investigation into the thermal conductivity of gangue-cemented paste backfill in mine application. J. Mater. Res. Technol. 2022, 16, 1792–1802. [Google Scholar] [CrossRef]
- Qi, T.; Gao, X.; Feng, G.; Bai, J.; Wang, Z.; Chen, Q.; Wang, H.; Du, X. Effect of biomass power plant ash on fresh properties of cemented coal gangue backfill. Constr. Build. Mater. 2022, 340, 127853. [Google Scholar] [CrossRef]
- Goswami, S. Impact of Coal Mining on Environment. Eur. Res. 2015, 92, 185–196. [Google Scholar]
- Chen, J.; Liu, P.; Liu, L.; Zetng, B.; Zhao, H.; Zhang, C.; Zhang, J.; Li, D. Anchorage performance of a modified cable anchor subjected to different joint opening conditions. Constr. Build. Mater. 2022, 336, 127558. [Google Scholar] [CrossRef]
- Zhang, X.; Feng, X.; Wang, Z.; Jian, J.; Chen, S.; Luo, W.; Zhang, C. Experimental study on the physico-mechanical properties and microstructure of foam concrete mixed with coal gangue. Constr. Build. Mater. 2022, 359, 129428. [Google Scholar] [CrossRef]
- Zhu, X.; Gong, W.; Li, W.; Bai, X.; Zhang, C. Reclamation of waste coal gangue activated by Stenotrophomonas maltophilia for mine soil improvement: Solubilizing behavior of bacteria on nutrient elements. J. Environ. Manag. 2022, 320, 115865. [Google Scholar] [CrossRef]
- Du, S.; Mao, S.; Guo, F.; Dong, K.; Shu, R.; Bai, J.; Xu, L.; Li, D. Investigation of the catalytic performance of coal gangue char on biomass pyrolysis in a thermogravimetric analyzer and a fixed bed reactor. Fuel 2022, 328, 125216. [Google Scholar] [CrossRef]
- Liu, H.; Bai, G.; Gu, Y.; Yan, F. The influence of coal gangue coarse aggregate on the mechanical properties of concrete columns. Case Stud. Constr. Mater. 2022, 17, e01315. [Google Scholar] [CrossRef]
- Zhu, M.; Qiu, J.; Chen, J. Effect and Mechanism of Coal Gangue Concrete Modification by Basalt Fiber. Constr. Build. Mater. 2022, 328, 126601. [Google Scholar]
- Li, C.; Wang, S.; Zhang, X.; Wu, J.; Zheng, S.; Sun, Z. In-situ preparation of coal gangue-based catalytic material for efficient peroxymonosulfate activation and phenol degradation. J. Clean. Prod. 2022, 374, 133926. [Google Scholar] [CrossRef]
- Li, G.; Deng, G.-Z.; Ma, J. Numerical modelling of the response of cemented paste backfill under the blasting of an adjacent ore stope. Constr. Build. Mater. 2022, 343, 128051. [Google Scholar] [CrossRef]
- Wang, M.; Liu, L.; Wang, S.; Lv, B.; Zhang, B.; Zhang, X.; Zhao, Y.; Huan, C. Numerical investigation of heat transfer and phase change characteristics of cold load and storage functional CPB in deep mine. Front. Earth Sci. 2020, 8, 31. [Google Scholar] [CrossRef] [Green Version]
- Qi, C.; Fourie, A. Cemented paste backfill for mineral tailings management: Review and future perspectives. Miner. Eng. 2019, 144, 106025. [Google Scholar] [CrossRef]
- Saedi, A.; Jamshidi-Zanjani, A.; Darban, A.K.; Mohseni, M.; Nejati, H. Utilization of lead–zinc mine tailings as cement substitutes in concrete construction: Effect of sulfide content. J. Build. Eng. 2022, 57, 104865. [Google Scholar] [CrossRef]
- Ghazi, A.B.; Jamshidi-Zanjani, A.; Nejati, H. Clinkerisation of copper tailings to replace Portland cement in concrete construction. J. Build. Eng. 2022, 51, 104275. [Google Scholar] [CrossRef]
- Barzegar Ghazi, A.; Jamshidi-Zanjani, A.; Nejati, H. Utilization of copper mine tailings as a partial substitute for cement in concrete construction. Constr. Build. Mater. 2022, 317, 125921. [Google Scholar] [CrossRef]
- Saedi, A.; Jamshidi-Zanjani, A.; Darban, A.K. A review of additives used in the cemented paste tailings: Environmental aspects and application. J. Environ. Manag. 2021, 289, 112501. [Google Scholar] [CrossRef]
- Saedi, A.; Jamshidi-Zanjani, A.; Darban, A.K. A review on different methods of activating tailings to improve their cementitious property as cemented paste and reusability. J. Environ. Manag. 2020, 270, 110881. [Google Scholar] [CrossRef]
- Tuylu, S. Effect of different particle size distribution of zeolite on the strength of cemented paste backfill. Int. J. Environ. Sci. Technol. 2022, 19, 131–140. [Google Scholar] [CrossRef]
- Tuylu, S. Investigation of the Effect of Using Different Fly Ash on the Mechanical Properties in Cemented Paste Backfill. J. Wuhan Univ. Technol.-Mater. Sci. Ed. 2022, 37, 620–627. [Google Scholar] [CrossRef]
- Li, T.; Wang, X.; Li, M.; Nan, D.; Shan, Q.; Chen, W. Synergy between suspending agent and air entraning agent in cement slurry. Rev. Romana Mater. 2020, 50, 344–353. [Google Scholar]
- Yang, B.; Yang, J.; Yu, Y.; Li, D.; Jiang, B.; Cheng, K. Study on proportioning test of a new cementing filling material and hydration mechanism. J. Min. Sci. Technol. 2017, 2, 475–481. (In Chinese) [Google Scholar]
- Wang, X.-M.; Zhao, B.; Zhang, C.-S.; Zhang, Q.-L. Paste-like self-flowing transportation backfilling technology based on coal gangue. Min. Sci. Technol. 2009, 19, 137–143. [Google Scholar] [CrossRef]
- Kasap, T.; Yilmaz, E.; Sari, M. Effects of mineral additives and age on microstructure evolution and durability properties of sand-reinforced cementitious mine backfills. Constr. Build. Mater. 2022, 352, 129079. [Google Scholar] [CrossRef]
- Wang, J.; Zhang, Q.; Yin, W.; Qi, S.; Gao, D.; Ma, D. On-Site Measurement on Compaction Characteristics of Coal Gangue and Surface Subsidence Disaster in Deep Backfilling Mining. Front. Earth Sci. 2021, 9, 724476. [Google Scholar] [CrossRef]
- Wang, C.; Liu, Y.; Hu, H.; Li, Y.; Lu, Y. Study on filling material ratio and filling effect: Taking coarse fly ash and coal gangue as the main filling component. Adv. Civ. Eng. 2019, 2019, 2898019. [Google Scholar] [CrossRef]
- Yin, W.; Zhang, K.; Ouyang, S.; Bai, X.; Sun, W.; Zhao, J. Experimental study on gangue backfilling materials improved by soda residue and field measurement of surface subsidence. Front. Earth Sci. 2021, 9, 1046. [Google Scholar] [CrossRef]
- Feng, G.; Wang, Z.; Qi, T.; Du, X.; Guo, J.; Wang, H.; Shi, X.; Wen, X. Effect of velocity on flow properties and electrical resistivity of cemented coal gangue-fly ash backfill (CGFB) slurry in the pipeline. Powder Technol. 2022, 396, 191–209. [Google Scholar] [CrossRef]
- Liu, L.; Fang, Z.; Qi, C.; Zhang, B.; Guo, L.; Song, K.I.-I.L. Numerical study on the pipe flow characteristics of the cemented paste backfill slurry considering hydration effects. Powder Technol. 2019, 343, 454–464. [Google Scholar] [CrossRef]
- Yang, B.; Cui, X.; Sun, H.; Kong, L.; Kong, X. Study on the feasibility of coal mine void area cementation filling to control mining damage. J. China Coal Soc. 2000, 343, 361–365. (In Chinese) [Google Scholar]
- Jin, J.; Qin, Z.; Lü, X.; Liu, T.; Zhang, G.; Shi, J.; Zuo, S.; Li, D. Rheology control of self-consolidating cement-tailings grout for the feasible use in coal gangue-filled backfill. Constr. Build. Mater. 2022, 316, 125836. [Google Scholar] [CrossRef]
- Jiang, H.; Fall, M.; Yilmaz, E.; Li, Y.; Yang, L. Effect of mineral admixtures on flow properties of fresh cemented paste backfill: Assessment of time dependency and thixotropy. Powder Technol. 2020, 372, 258–266. [Google Scholar] [CrossRef]
- Qiu, H.; Zhang, F.; Sun, W.; Liu, L.; Zhao, Y.; Huan, C. Experimental study on strength and permeability characteristics of cemented rock-tailings backfill. Front. Earth Sci. 2022, 10, 49. [Google Scholar] [CrossRef]
- Hefni, M.; Hassani, F. Effect of air entrainment on cemented mine backfill properties: Analysis based on response surface methodology. Minerals 2021, 11, 81. [Google Scholar] [CrossRef]
- Hefni, M.; Hassani, F. Experimental development of a novel mine backfill material: Foam mine fill. Minerals 2020, 10, 564. [Google Scholar] [CrossRef]
- Puthipad, N.; Ouchi, M.; Attachaiyawuth, A. Effects of fly ash, mixing procedure and type of air-entraining agent on coalescence of entrained air bubbles in mortar of self-compacting concrete at fresh state. Constr. Build. Mater. 2018, 180, 437–444. [Google Scholar] [CrossRef]
- Ke, G.; Zhang, J.; Tian, B.; Wang, J. Characteristic analysis of concrete air entraining agents in different media. Cem. Concr. Res. 2020, 135, 106142. [Google Scholar] [CrossRef]
- Cao, L.; Shi, F.; Qiu, M.; Chen, W.; Cao, P.; Zhou, C. Effects of air entraining agent on the rheological properties and electrochemical parameters of cement mortar. Constr. Build. Mater. 2022, 344, 128233. [Google Scholar] [CrossRef]
- Zhang, Y.; Gan, D.; Xue, Z.; Chen, X.; Hu, S. Effect of the initial air content in fresh slurry on the compressive strength of hardened cemented paste backfill. Adv. Mater. Sci. Eng. 2020, 2020, 8838572. [Google Scholar] [CrossRef]
- Hassani, F.; Hefni, M.; Kermani, M.; Vatne, D. Methods and Systems for Foam Mine Fill; McGill University: Montreal, QC, Canada, 2016. [Google Scholar]
- Hefni, M.; Hassani, F.P.; Kermani, M.F. A Review of the Properties of Foam Mine Fill. In Proceedings of the 13th ISRM International Congress of Rock Mechanics, Montreal, QC, Canada, 10–13 May 2015. [Google Scholar]
- Jones, M.N. The interaction of sodium dodecyl sulfate with polyethylene oxide. J. Colloid Interface Sci. 1967, 23, 36–42. [Google Scholar] [CrossRef]
- Yu, B.; Sun, J. Current synthesis of triterpene saponins. Chem.-Asian J. 2009, 4, 642–654. [Google Scholar] [CrossRef] [PubMed]
- Koczurkiewicz, P.; Czyż, J.; Podolak, I.; Wojcik-Pszczoła, K.; Galanty, A.; Janeczko, Z.; Michalik, M. Multidirectional effects of triterpene saponins on cancer cells-mini-review of in vitro studies. Acta Biochim. Pol. 2015, 62, 383–393. [Google Scholar] [CrossRef]
- Yang, B.; Yang, H. Experimental study on the energy evolution characteristics of high-concentration cemented backfill in coal mine. J. Min. Sci. Technol. 2022, 7, 304–312. (In Chinese) [Google Scholar]
- Zachl, A.; Buchmayr, M.; Gruber, J.; Anca-Couce, A.; Scharler, R.; Hochenauer, C. Air preheating and exhaust gas recirculation as keys to achieving an enhanced fuel water content range in stratified downdraft gasification. Fuel 2022, 323, 124429. [Google Scholar] [CrossRef]
- Ouyang, X.; Guo, Y.; Qiu, X. The feasibility of synthetic surfactant as an air entraining agent for the cement matrix. Constr. Build. Mater. 2008, 22, 1774–1779. [Google Scholar] [CrossRef]
- Zhang, L. Analysis on Slump and Expansion of Fresh Concrete by Cone Method and Spherical Defect Model. Fly Ash Compr. Util. 2018, 5, 140–142. (In Chinese) [Google Scholar]
- Zheng, J.; Zhu, Y.; Zhao, Z. Utilization of limestone powder and water-reducing admixture in cemented paste backfill of coarse copper mine tailings. Constr. Build. Mater. 2016, 124, 31–36. [Google Scholar] [CrossRef]
- Schackow, A.; Effting, C.; Folgueras, M.V.; Güths, S.; Mendes, G.A. Mechanical and thermal properties of lightweight concretes with vermiculite and EPS using air-entraining agent. Constr. Build. Mater. 2014, 57, 190–197. [Google Scholar] [CrossRef]
- Vatin, N.I.; Barabanshchikov, Y.; Komarinskiy, M.V.; Smirnov, S. Modification of the cast concrete mixture by air-entraining agents. Inz.-Stroit. Zurnal 2015, 56, 3–10. [Google Scholar] [CrossRef]
- Du, L.; Folliard, K.J. Mechanisms of air entrainment in concrete. Cem. Concr. Res. 2005, 35, 1463–1471. [Google Scholar] [CrossRef]
- Chen, J.; Qiao, M.; Gao, N.; Ran, Q.; Wu, J.; Shan, G.; Qi, S.; Wu, S. Cationic oligomeric surfactants as novel air entraining agents for concrete. Colloids Surf. A Physicochem. Eng. Asp. 2018, 538, 686–693. [Google Scholar] [CrossRef]
- Yin, S.; Shao, Y.; Wu, A.; Wang, Z.; Yang, L. Assessment of expansion and strength properties of sulfidic cemented paste backfill cored from deep underground stopes. Constr. Build. Mater. 2020, 230, 116983. [Google Scholar] [CrossRef]
- Zhang, D. Air entrainment in fresh concrete with PFA. Cem. Concr. Compos. 1996, 18, 409–416. [Google Scholar] [CrossRef]
- Tunstall, L.E.; Ley, M.T.; Scherer, G.W. Air entraining admixtures: Mechanisms, evaluations, and interactions. Cem. Concr. Res. 2021, 150, 106557. [Google Scholar] [CrossRef]
- Zhang, P.; Li, D.; Qiao, Y.; Zhang, S.; Sun, C.; Zhao, T. Effect of air entrainment on the mechanical properties, chloride migration, and microstructure of ordinary concrete and fly ash concrete. J. Mater. Civ. Eng. 2018, 30, 04018265. [Google Scholar] [CrossRef]
- Belem, T.; Benzaazoua, M. Design and application of underground mine paste backfill technology. Geotech. Geol. Eng. 2008, 26, 147–174. [Google Scholar] [CrossRef]
- Zhao, Y.; Taheri, A.; Karakus, M.; Chen, Z.; Deng, A. Effects of water content, water type and temperature on the rheological behaviour of slag-cement and fly ash-cement paste backfill. Int. J. Min. Sci. Technol. 2020, 30, 271–278. [Google Scholar] [CrossRef]
- Koohestani, B.; Belem, T.; Koubaa, A.; Bussière, B. Experimental investigation into the compressive strength development of cemented paste backfill containing Nano-silica. Cem. Concr. Compos. 2016, 72, 180–189. [Google Scholar] [CrossRef]
- Nasir, O.; Fall, M. Coupling binder hydration, temperature and compressive strength development of underground cemented paste backfill at early ages. Tunn. Undergr. Space Technol. 2010, 25, 9–20. [Google Scholar] [CrossRef]
- Shah, H.A.; Yuan, Q.; Zuo, S. Air entrainment in fresh concrete and its effects on hardened concrete—A review. Constr. Build. Mater. 2021, 274, 121835. [Google Scholar] [CrossRef]
- Gagné, R. Air Entraining Agents. In Science and Technology of Concrete Admixtures; Elsevier: Amsterdam, The Netherlands, 2016; pp. 379–391. [Google Scholar]
- Holan, J.; Novák, J.; Müller, P.; Štefan, R. Experimental investigation of the compressive strength of normal-strength air-entrained concrete at high temperatures. Constr. Build. Mater. 2020, 248, 118662. [Google Scholar] [CrossRef]
- Choi, P.; Yeon, J.H.; Yun, K.-K. Air-void structure, strength, and permeability of wet-mix shotcrete before and after shotcreting operation: The influences of silica fume and air-entraining agent. Cem. Concr. Compos. 2016, 70, 69–77. [Google Scholar] [CrossRef]
- González, D.C.; Mena, A.; Mínguez, J.; Vicente, M.A. Influence of air-entraining agent and freeze-thaw action on pore structure in high-strength concrete by using CT-Scan technology. Cold Reg. Sci. Technol. 2021, 192, 103397. [Google Scholar] [CrossRef]
- Qin, Y.; Hu, J.; Yang, D.; Kuang, Y.; Zhao, F.; Zhou, T. Optimization of transport performance and strength of the filling slurry in tailings reservoir waste by adding air entraining agent. Minerals 2020, 10, 730. [Google Scholar] [CrossRef]


| Chemical Composition | Al2O3 | SiO2 | K2O | CaO | TiO2 | Fe2O3 | Total |
|---|---|---|---|---|---|---|---|
| Content (%) | 23.43 | 41.86 | 0.82 | 23.74 | 1.36 | 5.09 | 100 |
| Density (kgm−3) | Chemical Composition (%) | |||||
|---|---|---|---|---|---|---|
| CaO | SiO2 | Al2O3 | Fe2O3 | MgO | Others | |
| 3120 | 65.08 | 22.36 | 5.53 | 3.46 | 1.27 | 2.30 |
| Chemical Composition | Al2O3 | SiO2 | K2O | CaO | TiO2 | Fe2O3 | Total |
|---|---|---|---|---|---|---|---|
| Content (%) | 31.89 | 56.89 | 1.39 | 1.84 | 1.95 | 5.38 | 100 |
| Groups | Cement (%) | Fly Ash (%) | Gangue (%) | Density (%) | H (‰) | AEA (‰) | ||
|---|---|---|---|---|---|---|---|---|
| A | B | C | ||||||
| G-1 | 12 | 20.5 | 42.7 | 75.2 | 0.3 | 0.0 | 0.0 | 0.0 |
| G-2 | 12 | 20.5 | 42.7 | 75.2 | 0.3 | 0.3 | 0.3 | 0.3 |
| G-3 | 12 | 20.5 | 42.7 | 75.2 | 0.3 | 0.6 | 0.6 | 0.6 |
| G-4 | 12 | 20.5 | 42.7 | 75.2 | 0.3 | 0.9 | 0.9 | 0.9 |
| G-5 | 12 | 20.5 | 42.7 | 75.2 | 0.3 | 1.2 | 1.2 | 1.2 |
| Groups | AEA | Dosage (‰) | Air Content (%) | ||||
|---|---|---|---|---|---|---|---|
| 0 min | 30 min | 60 min | 90 min | 120 min | |||
| G-1 | A | 0.0 | 1.220 | 1.215 | 1.223 | 1.220 | 1.224 |
| G-2 | 0.3 | 1.680 | 1.455 | 1.363 | 1.378 | 1.326 | |
| G-3 | 0.6 | 1.946 | 1.771 | 1.611 | 1.565 | 1.505 | |
| G-4 | 0.9 | 2.326 | 2.185 | 1.785 | 1.845 | 1.707 | |
| G-5 | 1.2 | 1.977 | 1.968 | 1.864 | 1.737 | 1.689 | |
| G-6 | B | 0.0 | 1.220 | 1.215 | 1.223 | 1.220 | 1.224 |
| G-7 | 0.3 | 1.877 | 1.512 | 1.561 | 1.434 | 1.22 | |
| G-8 | 0.6 | 2.282 | 2.181 | 2.189 | 1.969 | 1.876 | |
| G-9 | 0.9 | 3.87 | 3.497 | 3.296 | 3.125 | 2.865 | |
| G-10 | 1.2 | 3.664 | 3.206 | 2.987 | 2.983 | 2.975 | |
| G-11 | C | 0.0 | 1.220 | 1.215 | 1.223 | 1.220 | 1.224 |
| G-12 | 0.3 | 1.404 | 1.275 | 1.236 | 1.210 | 1.230 | |
| G-13 | 0.6 | 1.514 | 1.426 | 1.443 | 1.419 | 1.385 | |
| G-14 | 0.9 | 1.768 | 1.650 | 1.581 | 1.572 | 1.570 | |
| G-15 | 1.2 | 1.696 | 1.621 | 1.591 | 1.578 | 1.571 | |
| Groups | Dosage (‰) | Slump (mm) | ||
| A | B | C | ||
| G-1 | 0.0 | 255 | 255 | 255 |
| G-2 | 0.3 | 260 | 259 | 259 |
| G-3 | 0.6 | 262 | 262 | 259 |
| G-4 | 0.9 | 265 | 267 | 263 |
| G-5 | 1.2 | 267 | 269 | 265 |
| Groups | Dosage (‰) | Expansion (mm) | ||
| A | B | C | ||
| G-1 | 0.0 | 451 | 451 | 451 |
| G-2 | 0.3 | 486 | 456 | 462 |
| G-3 | 0.6 | 519.5 | 498 | 487 |
| G-4 | 0.9 | 568 | 573.5 | 512 |
| G-5 | 1.2 | 574 | 581 | 517 |
| Groups | AEA | Dosage (‰) | Regression Equation | R2 | Yield Stress (Pa) | Viscosity (Pa·s) |
|---|---|---|---|---|---|---|
| G-1 | A | 0.0 | y = 1.81x + 147.23 | 0.9327 | 147.23 | 1.81 |
| G-2 | 0.3 | y = 1.79x + 140.38 | 0.9486 | 140.38 | 1.79 | |
| G-3 | 0.6 | y = 1.67x + 130.57 | 0.9883 | 130.57 | 1.67 | |
| G-4 | 0.9 | y = 1.59x + 131.46 | 0.9782 | 131.46 | 1.59 | |
| G-5 | 1.2 | y = 1.65x + 137.95 | 0.9892 | 137.95 | 1.65 | |
| G-6 | B | 0.0 | y = 1.81x + 147.23 | 0.9327 | 147.23 | 1.81 |
| G-7 | 0.3 | y = 1.71x + 138.37 | 0.9785 | 138.37 | 1.71 | |
| G-8 | 0.6 | y = 1.76x + 131.52 | 0.9823 | 131.52 | 1.76 | |
| G-9 | 0.9 | y = 1.68x + 124.58 | 0.9864 | 124.58 | 1.68 | |
| G-10 | 1.2 | y = 1.61x + 119.95 | 0.9654 | 119.95 | 1.61 | |
| G-11 | C | 0.0 | y = 1.81x + 147.23 | 0.9327 | 147.23 | 1.81 |
| G-12 | 0.3 | y = 1.76x + 141.88 | 0.9625 | 141.88 | 1.76 | |
| G-13 | 0.6 | y = 1.71x + 136.29 | 0.9731 | 136.29 | 1.71 | |
| G-14 | 0.9 | y = 1.70x + 137.63 | 0.9283 | 137.63 | 1.70 | |
| G-15 | 1.2 | y = 1.68x + 128.81 | 0.9582 | 128.81 | 1.68 |
| Groups | AEA | Dosage (‰) | Strength (MPa) | ||
|---|---|---|---|---|---|
| 3d | 7d | 28d | |||
| G-1 | A | 0.0 | 1.9 | 2.9 | 3.9 |
| G-2 | 0.3 | 1.8 | 2.7 | 3.7 | |
| G-3 | 0.6 | 1.85 | 2.6 | 3.45 | |
| G-4 | 0.9 | 1.8 | 2.3 | 2.9 | |
| G-5 | 1.2 | 1.75 | 2.1 | 2.7 | |
| G-6 | B | 0.0 | 1.9 | 2.9 | 3.9 |
| G-7 | 0.3 | 1.9 | 2.8 | 3.6 | |
| G-8 | 0.6 | 1.8 | 2.8 | 3.3 | |
| G-9 | 0.9 | 1.8 | 2.6 | 3.2 | |
| G-10 | 1.2 | 1.7 | 2.5 | 2.9 | |
| G-11 | C | 0.0 | 1.9 | 2.9 | 3.9 |
| G-12 | 0.3 | 1.75 | 2.9 | 3.7 | |
| G-13 | 0.6 | 1.7 | 2.6 | 3.3 | |
| G-14 | 0.9 | 1.6 | 2.5 | 2.9 | |
| G-15 | 1.2 | 1.6 | 2.3 | 2.75 | |
Publisher’s Note: MDPI stays neutral with regard to jurisdictional claims in published maps and institutional affiliations. |
© 2022 by the authors. Licensee MDPI, Basel, Switzerland. This article is an open access article distributed under the terms and conditions of the Creative Commons Attribution (CC BY) license (https://creativecommons.org/licenses/by/4.0/).
Share and Cite
Yang, B.; Wang, X.; Yin, P.; Gu, C.; Yin, X.; Yang, F.; Li, T. The Rheological Properties and Strength Characteristics of Cemented Paste Backfill with Air-Entraining Agent. Minerals 2022, 12, 1457. https://doi.org/10.3390/min12111457
Yang B, Wang X, Yin P, Gu C, Yin X, Yang F, Li T. The Rheological Properties and Strength Characteristics of Cemented Paste Backfill with Air-Entraining Agent. Minerals. 2022; 12(11):1457. https://doi.org/10.3390/min12111457
Chicago/Turabian StyleYang, Baogui, Xiaolong Wang, Peng Yin, Chengjin Gu, Xindong Yin, Faguang Yang, and Tao Li. 2022. "The Rheological Properties and Strength Characteristics of Cemented Paste Backfill with Air-Entraining Agent" Minerals 12, no. 11: 1457. https://doi.org/10.3390/min12111457