Article

Impact of Recycled Process Water on Electrochemical Reactivity of Sulphide Ore

1
Boliden Kevitsa Mine, Kevitsantie 730, 99670 Petkula, Finland
2
Department of Bioproducts and Biosystems, School of Chemical Engineering, Aalto University, 00076 Aalto, Finland
*
Author to whom correspondence should be addressed.
Minerals 2022, 12(11), 1455; https://doi.org/10.3390/min12111455
Submission received: 13 October 2022 / Revised: 6 November 2022 / Accepted: 10 November 2022 / Published: 18 November 2022
(This article belongs to the Special Issue Water within Minerals Processing, Volume II)

Abstract

:
The Kevitsa Cu–Ni sequential flotation process is characterised by poor nickel recovery during summer periods (May–September). Evidently, the process water matrix in summer is different from that in other seasons; however, the Cu flotation performance is scarcely affected by the changes in the water matrix across the seasons. Increasingly different process water quality was generated through a grinding-and-dissolution protocol and its impact on the electrochemical reactivity of sulphide ore was studied. The main objective of this approach was to mimic the increasingly different quality of plant process water emanating from a closed-process water loop. Dissolved oxygen demand tests were conducted on the Kevitsa ore using water of varying quality from dissolution loops. The effect of the temperature and fine grind on the oxidation rates was also investigated. The study was coupled with EDTA metal ion extraction and xanthate adsorption tests. These showed that the number of dissolution loops, which has an impact on water quality, has a direct impact on the rate of oxidation of the ore. A fine grind and high temperature both increase the oxidation rates of the ore. The Kevitsa ore is most reactive in the first 10–20 min after milling. Furthermore, oxidation rates are also driven by the amount of pyrrhotite in the ore, with chalcopyrite being the least reactive, as indicated by the EDTA data. Xanthate adsorption is impacted by the water quality and fine grind. The combined effect of water quality, temperature and fine grind is expected to influence the flotation behaviour of sulphide minerals. The poor nickel recovery of the Kevitsa ore during the summer period is attributable to the unfavourable process water quality, which accelerates the oxidation of the ore during the summer period.

1. Introduction

The historical flotation performance data from the Kevitsa mine indicated that pentlandite minerals float poorly during the summer period (May–September) compared to winter. Chalcopyrite, on the other hand, is scarcely affected by seasonal changes. Chalcopyrite and pentlandite are the main mineral sources of copper and nickel, respectively [1]. Extreme weather conditions directly affect the recycled Kevitsa process water’s chemistry, which is used for grinding and flotation processes. Process water temperatures vary between 1 and 25 °C in winter and summer, respectively. The slurry temperatures after milling reach 35 °C in summer. With over 90% of process water being recycled, the water quality is significantly affected by the accumulation of recycled water species over time, and the dissolution of the tailings from the tailings pond in summer is accelerated due to the increased residence time and high temperatures [2]. Water quality plays an important role in determining the flotation behaviour of sulphide minerals. Studies have shown that the presence of and increase in certain ions have a direct impact on the floatability of sulphide minerals, as a consequence of surface reactions on the minerals. Other authors have highlighted the correlation between the ionic strengths of certain ions and sulphide mineral recovery as a result of froth stability and xanthate adsorption [3,4,5]. Evidently, the Kevitsa case demonstrated a similar correlation of low metal recoveries during summer months when the specific conductance (SPC) and temperature of the process water are high. Furthermore, the presence of dissolved oxygen in the process water plays a significant role in the oxidation of the ore. Previous studies have determined the following roles of dissolved oxygen in milling and flotation: (1) the promotion of galvanic interactions between grinding media and sulphide minerals; and (2) the oxidisation of mineral surfaces [6]. Other researchers have concluded that the floatability of sulphide minerals depends on the extent of the surface oxidation of the mineral [7]. The oxidation of the mineral surface, collectorless flotation and collector-induced flotation are strongly linked. It has been documented that the good floatability of sulphide minerals can only occur in moderately oxidising environments and not under reducing conditions [8]. Dissolved oxygen has a strong influence on the pulp potential, which, in turn, determines the nature of oxidation on the mineral surface and the rate of adsorption of xanthate on sulphide-mineral surfaces. However, mineral surface oxidation is not only dependent on dissolved oxygen, but also on other parameters, such as the pulp temperature, solution pH, association of minerals (i.e., galvanic interactions), milling media, free surface area of the particles and particle shape. It was also proven that the water composition matrix can affect the ore’s oxidation. It was shown that the oxidation rate of pyrite increases with increasing carbonate alkalinity and decreases as the sulphate concentration of the pulp increases [9].
In the case of Kevitsa, the valuable minerals (chalcopyrite and pentlandite) are associated with pyrrhotite and silicates as gangue minerals. Several studies have shown that chalcopyrite often exhibits strong collectorless floatability [10]. The floatability of chalcopyrite increases when increasing Eh to potentials above approximately 0–100 mV. Generally, the collectorless floatability of chalcopyrite is controlled by two processes: (1) metal dissolution, which produces a hydrophobic surface; and (2) metal hydroxide precipitation, which produces a hydrophilic surface. For chalcopyrite, the hydrophobic products are quite stable for further oxidation. A very long residence time was required to render the chalcopyrite surface sufficiently hydrophilic to reduce its floatability [10]. However, pentlandite’s behaviour is completely different. Researchers have pointed out that pentlandite can be oxidised very easily and that its floatability is extremely sensitive to oxidation [11]. Many methods have been used to study the oxidation of different ores [12,13]. However, the approaches used do not take into account the quality of the process water used. Unfortunately, processes in plants are not univariable, but are rather the result of a cascade of reactions that change the whole system. When one parameter changes, this is a sign that the whole system has changed. Therefore, it is important to study the system as a wholly unique entity and not in terms of singular parameters. More importantly, with the increasing water recycling rate in the mining industry, it is crucial to establish a laboratory approach that allows for the prediction of the effect of recycled water and external conditions on the floatability state of ore.
Therefore, this paper investigates a holistic method through which to study the oxidation behaviour of Ni-Cu ore under summer conditions, at a laboratory scale, using water of increasingly different quality from dissolution loops, in an effort to understand the potential causes of the poor flotation response of pentlandite minerals.

2. Materials and Methods

2.1. Materials

Low-grade Ni-Cu ore samples from Boliden Kevitsa Mine, Finland were used in the study. The samples included one from a crusher product and one slurry sample from a mill cyclone overflow product, plant flotation feed. The crusher product sample was collected and screened to a sub-4-mm particle size, homogenised, split into 1 kg portions using a rotary sample splitter, packed, and sealed in plastic bags, and then stored in a freezer at −20 degrees Celsius until needed for the experiment. This sample is referred to as the laboratory ore sample. Representative samples of both the Laboratory Ore sample and plant flotation feed sample were submitted to the Metso-Outotec Research Center in Pori, Finland, for mineralogical and elemental composition analysis. A polished resin section was prepared for mineralogical studies utilising a JEOL JSM-6490LV scanning electron microscope (SEM) equipped with an Oxford Instruments energy-dispersive spectrometer (EDS). The imaging and EDS analyses were performed under routine conditions using 20 kV acceleration voltage and 1 nA beam current. Mineral quantification was performed using HSC Chemistry® software. Additionally, the powder samples were analysed crystallographically using a PANalytical Aeris diffractometer. The main elements of the sample were analysed using inductively coupled plasma optical emission spectrometry (ICP-OES) after total dissolution. The nickel and iron content after bromine methanol dissolution was analysed to differentiate between the Ni and Fe content in sulphides and in silicates. Sulphur and carbon content was measured using an Eltra CS-2000 automatic analyser. The quantity of silica was analysed calorimetrically using a Hach DR 5000 UV-Vis spectrophotometer. Table 1 shows the mineral and elemental composition in both laboratory and plant ore samples.
The main non-sulphide gangue minerals were amphibole, diopside, olivine and serpentine, with trace amounts of talc.

2.2. Grinding

Grinding plays a critical role in the flotation process. In this study, the reference was the Kevitsa process plant. Therefore, laboratory ore samples were milled to match the plant PSD. Due to the nature of plant grinding circuit-autogenous milling, PSD is highly influenced by the ore mineralogy. Plant metallurgists have observed that there is a direct correlation between the amphibole levels in the ore and the amounts of fine generated from the mills. The plant targets 75% passing 75 µm as the standard grind size. A higher % of passing is a fine grind. For this reason, laboratory ore samples were milled to achieve both a standard grind and fine grind, as shown in Figure 1. The standard and fine grind samples were 75% and 90% passing 75 µm, respectively.

2.3. Dissolution Loop

The dissolution loop was first introduced by Le et al., 2020 [14]. The objective of the dissolution loop was to mimic the way in which impurities would accumulate within the process water in the event that the mine recycled its water. The approach was developed as a tool to replace the traditional method of using synthetic and fresh water when studying the effect of water quality on the floatability of an ore. In this study, the water matrix was created in the same way as described by Le et al., 2021 [14]. A dissolution loop consisted of six dissolution rounds. Each round was a combination of two steps: grinding and dissolution per se. For each dissolution round, a 1 kg sample of ore was milled in a laboratory ball mill at 61% solid content, as per the laboratory standard procedure, for 26 min to generate a standard grind size and 33 min for a fine grind size. Figure 1 shows the particle size distribution (PSD) for standard and fine grind samples milled at room temperature. The dissolution procedure involved pulp aeration at pH 9.5 for a total of 50 min aeration. The procedure was adopted as a means of simulating the Kevitsa laboratory flotation procedure, except that no reagents were added besides lime, and no concentrates were recovered from the flotation cell. After dissolution, the slurry was filtered, the water filtrate was collected and used for the next grinding round, and the filter cake was discarded. To investigate the impact of the temperature and fine grind, samples were prepared under the following conditions: (A) standard grind and room temperature (20 °C) during dissolution, (B) standard grind and high temperature (35 °C) during dissolution, and (C) fine grind and room temperature (20 °C) during dissolution. All samples were milled at room temperature.

2.4. Dissolved Oxygen Demand Test

The dissolved oxygen demand test was conducted to determine how much dissolved oxygen was consumed as the water quality changed. For laboratory ore samples, the dissolution loop protocol involved milling and dissolution, as shown in Figure 2. The dissolved oxygen demand (DOD) test was performed during dissolution for 50 min through the continuous agitation of slurry and turning on air at a 5 L/min flowrate for 5 min and turning off for the next 5 min. Non-conservative parameters such as pH, ORP, SPC, temperature (T) and dissolved oxygen (DO) were measured using a YSI Multiparameter Digital Water Quality Meter. The dissolution loop protocol (milling and dissolution) was repeated six times. However, DOD tests were only conducted for the first, third, and sixth loops. On the other hand, the plant flotation feed sample was only tested for DOD, as it was already in slurry form. The plant flotation feed sample was used as a reference in this study.
All DOD tests were performed in an open flotation cell, contrary to what other researchers have reported [12,13]. The idea behind the setup in this study was to imitate the configuration of plant flotation cells, which are open to the atmosphere. The measured parameters were expected to be much closer to a real plant case, as opposed to the ideal conditions created in other setups.

2.5. Adsorption Tests

The adsorption tests were conducted to determine whether water quality affects the amount of collector adsorption on the mineral surface. Sodium isopropyl xanthate (SIPX) was used as a collector in the adsorption tests. The samples were collected during the dissolution process, as shown in Figure 2. Samples for adsorption tests were only collected for dissolution loops one and six, at different aeration times, i.e., 10, 20, and 50 min, respectively. Each sample weighed 35 g and 1% SIPX solution was added to the sample, with an initial xanthate concentration of 2.3 ppm. The mixture was conditioned for 10 min at pH 9.5 and then filtered using 2 μm filter paper, and 5 millilitres of the filtrate was further filtered through 0.45 μm filter paper. Initial absorbance (A1) was measured using a Hach DR 6000 UV-Vis Spectrophotometer, and the absorbance peak at 301 nm was attributed to xanthate [2]. Sulphuric acid was later added to the filtrate samples to lower the pH to 2 and conditioned for 2 min. Sodium hydroxide was then added to revert the pH to the original value, and absorbance (A2) was measured. The difference between A1 and A2 represented the actual residual xanthate, as lowering the pH only decomposed xanthate. The absorbance readings were converted to concentration (ppm) according to the calibration curve via Equation (1) and compared with the initial xanthate concentration of 2.3 ppm to determine the amount of adsorbed xanthate on the ore.
Cppm = 11.386 × (A1 − A2) + 0.0536,
where Cppm is the xanthate concertation in ppm, A1 is the initial absorbance, and A2 is the final absorbance.

2.6. EDTA Metal Ion Extraction

EDTA extraction was performed to determine whether the water quality has an impact on the adsorption of metal ions on the mineral surface. The samples were collected as illustrated in Figure 2, and each was 24 mL in volume. A portion of each sample was filtered, and the water filtrate was analysed to determine the metal content before EDTA extraction. EDTA solution was prepared at 3% solution strength and pH adjusted to 7.5 using sodium hydroxide. In all cases, 24 mL of sample was added to 250 mL of EDTA solution, and the mixture was conditioned using a magnetic stirrer for 30 min in a covered beaker. The slurry mixture was then filtered using 2 μm and 0. 45 µm filter papers, respectively, and both solid and liquid samples were analysed for Ni, Cu, and Fe using Atomic Absorption Spectrometry. Percent EDTA extractable (Equation (2)) was calculated by considering the difference in the metal concentration of the slurry before and after EDTA extraction, according to Rumball and Richmond, 1996 [15].
% EDTA   extractable   M = Mass   of   M   in   EDTA   solution   Mass   of   M   in   Solids × 100

3. Results and Discussion

3.1. Effect of Temperature and Fine Milling on the Recycled Water Physicochemical Parameters

Non-conservative parameters were measured during the dissolution protocol. Table 2 shows the parameters measured at the end of the sixth loop for each of the three laboratory samples. The plant flotation feed sample was also measured separately and is included in the table. The parameters measured were temperature (T °C), dissolved oxygen level (DO %), specific conductance (SPC μS/cm), pH and redox potential (ORP mV).
The difference in measured parameters is attributed to the temperature and fine grind. For samples whose temperature was maintained between 20 and 21 °C, the change in dissolved oxygen concentration is attributed to the impact of the fine grind and suggests increased oxidation rates due to the high surface area. A similar effect of increased oxidation rates is observed for the standard-grind @ high-temperature sample. It can therefore be deduced that the fine grind and temperature affect the oxidation rates of the ore. The fine-grind @ room-temperature sample recorded the lowest DO, SPC, and ORP compared to the rest of the samples. The low ORP could be an indication of the extent of oxidation of the ore, while the SPC suggests that some of the dissolved metal species could have precipitated given the sample pH. On the other hand, the plant flotation feed sample had a much higher SPC, comparatively. This observation is expected considering the volumes of recycled water and ore involved at the plant scale. However, other parameters (T, DO, and ORP) of the plant flotation feed are similar to those of the standard-grind @ room-temperature samples.

Effect of Recycling Process Water on SPC, pH, and ORP

The recirculation of process water impacts the water quality and affects the flotation response. The specific conductance, pH, and ORP were monitored for the first, third, and sixth dissolution loop (DL). Each loop lasted for 50 min. Table 3 shows the codes used to identify test conditions.
Figure 3 shows how the SPC changes with the number of DL and sample type. The increase in the number of DL results in an increase in SPC, consistent with the findings of Le et al. [14]. However, the impact of the dissolution time on SPC seems to be minimal compared to that of the increase in the number of DL, remaining almost constant throughout the 50 min dissolution time. Furthermore, there is a 100% increase in SPC between DL 1 and DL 3 for all the samples, whereas DL 3 and DL 6 increased from 10 to 30%. The increase in SPC is attributed to the continued dissolution of the ore, with increased dissolution rates in the first three dissolution loops. Since the same ore was used in this study, the quality of the water, which changed at the end of every dissolution test, is believed to be the main driver of the change in the dissolution rates of the ore. However, the impact of recycling water seemed to decline between DL 3 and DL 6, which could be attributed to the reduced dissolution capacity as a result of either the saturation of ions in the solution or the passivation of the ore surface, or both.
It can, therefore, be deduced that the impact of water quality on the dissolution rate of the ore depends more on the number of cycles than the dissolution time. This observation is supported by the plant flotation feed SPC (Ref.), which increased by 12% in the first 10 min of dissolution and remained almost constant for the rest of the dissolution time. However, there was a significant difference in SPC readings between laboratory samples and plant flotation feed slurry samples. The plant process water has been recirculated several times since the commissioning of the plant (10 years ago) and the high volume of ore and tailings involved in the dissolution process could explain the difference in SPC magnitude.
Figure 4 is a plot of ORP during the dissolution process of different types of water from dissolution loops. There is a general drop in ORP in the first 10 min of dissolution for all the samples. Furthermore, there is a significant difference in the initial ORP between DL 1 and DL 6. In both cases, the ORP drops with an increase in the number of DL and an increase in dilution time in the first 10 min. Considering the ore under study, the major sulphide minerals are chalcopyrite, pentlandite, and pyrrhotite (Table 1). The presence of all three sulphide minerals leads to galvanic interactions, which would affect the ORP of the slurry. From the literature, the sulphide mineral with the lower rest potential acts as an anode and undergoes oxidation, while the one with the higher rest potential acts as a cathode [16,17]. Although both the laboratory ore and plant flotation feed samples contained pyrrhotite, the former had approximately three times more pyrrhotite than the latter. The difference in pyrrhotite levels was expected to have an impact on the oxidation of the ore in general, due to the fact that pyrrhotite had the lowest rest potential compared to the other two sulphide minerals. The drop in ORP in the first 10 min of dissolution and as the number of DL increases is attributed to the oxidation of the ore. Comparing the plant flotation feed (Ref.) to laboratory samples (A, B, and C) shows that more oxidation occurs in laboratory samples compared to plant samples, which is in line with the amount of pyrrhotite in the samples. An increase in ORP after 10 min of dissolution could suggest that the ore surface is passivated and any further aeration during dissolution does not result in the significant oxidation of the ore. It can, therefore, be deduced that the number of cycles (DL), dissolution time, and mineralogy of the ore have an impact on oxidation, which, in turn, affects ORP.
Figure 5 shows the curves of pH vs. ORP for laboratory ore samples and plant flotation feed samples under different treatment conditions. The pH/ORP parameters were monitored for the first, third, and sixth loops during dissolution experiments. Each curve starts at 0 min of dissolution, as indicated on the graphs, and the end of each curve represents 50 min of dissolution. The pH/ORP plot is important in determining whether the change in ORP is a result of the corresponding change in pH or is a result of the change in the concentration of oxidising/reducing species. When the pH/ORP curve parallels with the oxygen/water equilibrium line, the change in ORP is a result of the change in pH; however, if the curve is not parallel with the oxygen/water equilibrium line, the change in ORP is a result of oxidation/reduction reactions, Grano, 2010; Owusu et al., 2013 [18,19]. The plant flotation sample (Ref.) was subjected to a dissolution test for 50 min, similarly to other samples. The pH/ORP curve for the plant flotation feed sample shows strong oxidation/reduction reactions taking place in the first 10 min, consistent with the SPC trend observed in Figure 3. Similar trends are observed for all laboratory-generated samples, with a strong oxidation/reduction reaction taking place in the first 10 min. Furthermore, in the first 10 min of dissolution, there is a drop in both pH and ORP. This drop suggests the enhanced oxidation of sulphur-reduced compounds to a higher degree of oxidation, resulting in the acidification of the slurry. Generally, the sample prepared with a fine grind and at room temperature conditions shows an extended oxidation/reduction reaction for dissolution loop 6, similar to the plant flotation feed sample. The observed trends in all samples could be attributed to a possible pyrrhotite oxidation reaction, which generates acid in the solution [16]. The continuous decrease in both pH and ORP for the plant slurry at 50 min suggests that the Kevitsa ore is highly reactive over a long period of time (Figure 5); however, the rate of reaction is stronger in the first 10 min. The observed trends suggest that the water quality, which changes as the dissolution loops increase, has an impact on the oxidation/reduction reactions of the Kevitsa ore.

3.2. Dissolved Oxygen Demand

The dissolved oxygen demand (DOD) tests were conducted for 50 min, for plant and laboratory ore samples. The test involved the aeration of the slurry for 5 min and the cessation of aeration for the next 5 min. Figure 6 shows the dissolved oxygen level at the end of each cycle (left) and a full profile of the DOD tests (right).
All samples show a similar general trend, with an increase in endpoint dissolved oxygen levels as aeration progresses. The increase in endpoint DO levels indicates the diminishing reactivity of the ore as aeration continues. However, a close examination reveals a difference in trend in the first 10–20 min. The samples generated at a high temperature and fine grind show a drop in DO in the first 10–20 min, differing from the other two samples. This drop suggests an increase in the consumption of DO (high ore reactivity) in the first 10–20 min.
From this trend, it can be deduced that the temperature and increased ore surface area have an impact on the reactivity of the ore. Furthermore, the sample from the plant shows a steep increase in DO in the first 10 min, before flattening. This trend suggests that the ore is equally reactive in the first 10 min of the DOD test. The graphs for the full profile of DOD tests show that the laboratory-generated samples had high oxygen consumption rates compared to plant flotation feed samples. This trend suggests that the plant sample started reacting with oxygen during milling and classification. The oxygen consumption rate constant was calculated using the following formula [13]:
DOt = DO0 × 10−Kla×t
where DOt and DO0 are the dissolved oxygen concentrations at time t and t = 0, respectively, and Kla is the oxygen consumption rate constant. Figure 7 shows the dissolved oxygen consumption rate (Kla) as a function of SPC (left) and aeration time (right). The samples generated in the laboratory through the dissolution loop indicate an increase in SPC with an increase in the number of dissolution loops. Furthermore, the number of dissolution loops increases with the dissolved oxygen consumption rate. This trend confirms that the water quality, which changes with the number of dissolution loops, impacts the oxidation rates of the ore. The first 10–20 min of aeration show that as the water is recycled, the oxygen consumption rate increases. The increase in Kla is attributed to the oxidation reactions of the sulphide minerals present in the ore. This is supported by the pH/ORP relationship in the first 10–20 min, which shows a perpendicular curve to the oxygen/water line (Figure 5). For the fine grind sample, the first 20–30 min indicate an increased oxygen consumption rate for all DLs. The increased surface area generated from the fine grind provides a much larger reactive site compared to other samples. The behaviour suggests that the surface area has a strong impact on the oxidation rate. The plant flotation feed sample showed a steady decline in dissolved oxygen consumption rates with an increase in SPC and aeration time. The decrease in the dissolved oxygen consumption rate constant can be attributed to the passivation of the ore surfaces by oxidation products. Therefore, the water quality, surface area, and temperature have an impact on the oxidation rates of the ore.

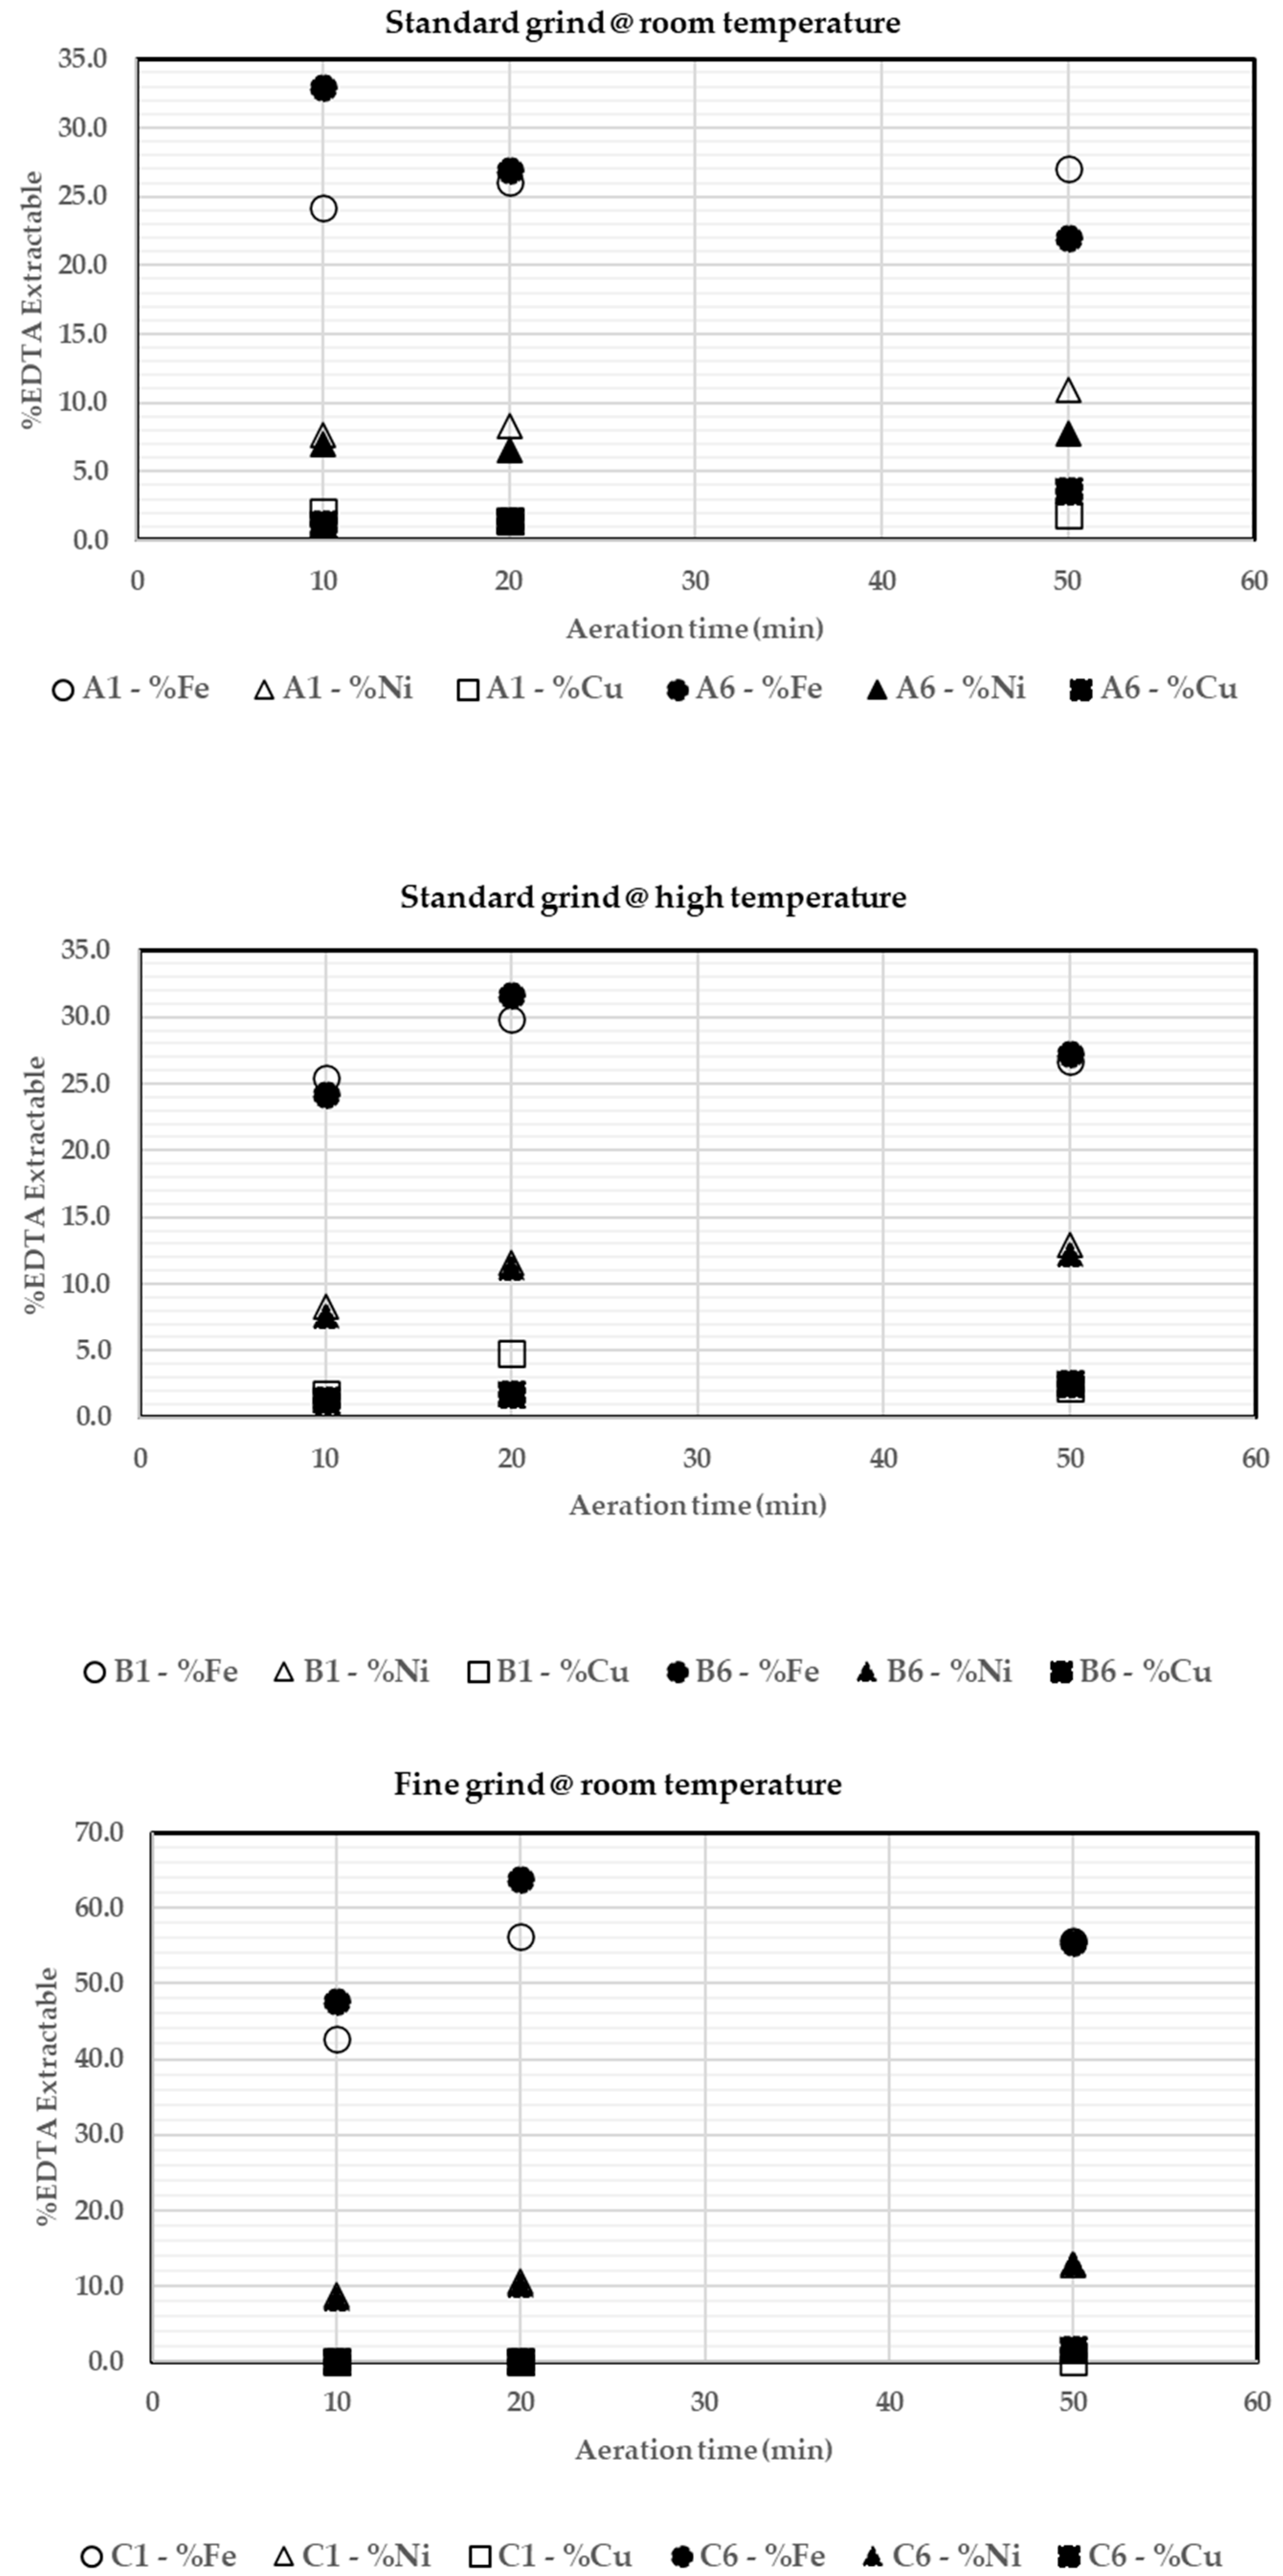
3.3. Ethylene Diamine Tetra-Acetic Acid (EDTA) Extractable Metal Ions

EDTA extraction techniques, coupled with surface analysis, are normally used to determine the extent of oxidation of sulphide mineral surfaces [15,18]. In this study, surface analysis was not included because the samples were low-grade ores with a fine particle size, making it difficult to analyse the surfaces of the minerals of interest. Previous attempts by plant metallurgists to analyse the surfaces of minerals of interest in the ore have proven futile due to the challenges stated above. Some studies have shown that sulphides with a lower rest potential, when locked with other sulphides, act as the anode and easily become oxidised [16,17]. Table 4 shows some of the common sulphide minerals with their respective rest potentials. In the case of the Kevitsa ore, pyrrhotite has the lowest rest potential and is, therefore, expected to oxidise more than pentlandite and chalcopyrite, respectively, due to galvanic interaction. Therefore, the order of oxidation would be stated as follows: pyrrhotite > pentlandite > chalcopyrite [16].
The EDTA extractable metal percentages were determined as indicated by Rumball and Richmond, 1996 [15] and are presented in Figure 8. In the case of the Kevitsa ore, there is very little pyrite mineral present, as shown in Table 1.
With respect to the samples under study, pyrrhotite is the most anodic, while chalcopyrite is the least. In all three samples under study, as shown in Figure 8, there is a substantial amount of iron on the ore surfaces, compared to nickel and copper. Iron is common in all three major sulphide minerals (Table 4); however, based on the order of oxidation, most of the extractable iron present can be attributed to pyrrhotite mineral.
The extent of pyrrhotite oxidation for standard-grind and high-temperature samples is comparable, with 30% EDTA extractable iron. Although the high temperature is expected to have a noticeable impact on the oxidation rate [16], the observed trend can be attributed to the small amount of sulphide minerals in the ore (low grade), which seemed to be less affected by the temperature. On the other hand, the fine-grind sample showed a significant amount of extractable iron, 60%. The increased surface area due to the fine grind is believed to provide a larger oxidation reaction surface area, resulting in higher levels of dissolution of metal ions and, ultimately, precipitation on ore surfaces. Figure 8 also shows nickel and copper, which can be attributed to the oxidation of pentlandite and chalcopyrite, respectively. However, the extent of oxidation of the two minerals is lower, 10% and 5%, respectively, compared to pyrrhotite. This observation is in line with the rest potential’s relationship with the oxidation rates: the higher the rest potential, the less oxidative the sample [16]. It can, therefore, be deduced that chalcopyrite oxidises the least in Kevitsa and may not play a significant role in the impact on water quality. Furthermore, the oxidation rate seems to increase with the dissolution loops, with the exception of samples prepared under the standard grind at room temperature. The impact of temperature is noticeable when the dissolution loop increases. This implies that the quality of water has a role in determining the oxidation rates of the ore. The presence of certain metal ions in water acts as an oxidising agent. Ferric ions have been documented to be stronger oxidising agents than oxygen and tend to react with the mineral surface [16]. An increase in the dissolution loop results in an increase in dissolved ions—SPC—as shown in Figure 6. It can, therefore, be deduced that the amount of certain dissolved ions in the water accelerates the oxidation rate of the ore.

3.4. Xanthate Adsorption

Figure 9 shows three graphs representing three different test conditions, namely room-temperature, high-temperature, and fine grind. The graphs are plotted as aeration vs. time residue xanthate concentration. The initial xanthate concertation (A0, B0, and C0) was maintained at 2.3 ppm for all the tests, thereby making the tests comparable. Samples for adsorption tests were collected at different aeration times during the dissolution process, and adsorption tests were conducted on each sample taken. Residual xanthate was measured for each sample collected at 10, 20, and 50 min aerations of the slurry. The difference in residue xanthate concentration after the adsorption tests was considered to be the amount of xanthate adsorbed on the ore. As the aeration time and the number of dissolution loop increased, the water quality changed, as shown by the SPC in Figure 3. The change in water quality has an impact on xanthate adsorption. The increase in aeration time and dissolution loops caused an increase in the amount of xanthate adsorbed on the ore. Previous studies conducted by Mhonde et al., 2020 [20] have shown that the temperature and ionic strength of water have an impact on the adsorption of xanthate on mineral surfaces. The authors observed that most cation species improved the adsorption of xanthate on chalcopyrite and pentlandite, while S2O32− had the opposite effect. Furthermore, the authors observed that temperature had a positive impact on xanthate adsorption on chalcopyrite and a negative impact on pentlandite. In this study, the increase in the number of dissolution loops under different test conditions caused the release of cations and anions, which, in turn, had an influence on the adsorption of xanthate on the ore [4,17]. As expected, the fine grind was believed to generate more ions due to the increased surface area, thereby impacting xanthate adsorption to a greater extent compared to the samples under room-temperature and high-temperature conditions. Xanthate adsorption in sulphide mineral flotation is one of the most imperative requirements for the effective recovery of sulphide minerals. Previous studies have indicated that the adsorption of dixanthogen on the mineral surface is responsible for the hydrophobicity of most sulphide minerals [17].

4. Conclusions

The scarcity of freshwater around the world and the need to recycle process water as a sustainable strategy in mining lead to the challenge of understanding the everchanging water quality and its impact on the flotation process. This study shows that water quality plays a critical role in determining the electrochemical reactivity of ores. The study revealed that the recirculation of process water results in a progressive change in water quality, which, consequently, has an impact on the electrochemical reactivity of the ore. This observation implies that, for closed-process water circuits, the impact of recycled process water quality will have a progressive effect on the electrochemical reactivity of the ore. It is, therefore, important, at the design stage of process plants, to consider the progressive impact of water quality on flotation performance as a result of closed-process water circuits.
This study reveals that the number of process water recycles has a much stronger impact on the oxidation of the ore than the residence time within the process. It can, therefore, be expected that the effect of water quality in closed-circuit plants will have an incremental effect on the oxidation of the ore until the saturation level of dissolved ions in process water is reached. Furthermore, the study has shown that the Kevitsa ore is most reactive to the process water quality in the first 10–20 min after grinding. The temperature and fine grind seem to increase the oxidation rates of the ore and, in turn, affects the adsorption of xanthate. Oxidation rates are further driven by the amounts of pyrrhotite in the ore. It can, therefore, be deduced that controlling the water quality would benefit the flotation process of the Kevitsa plant.

Author Contributions

Conceptualisation, B.M. and O.D.; methodology, B.M.; validation, O.D.; formal analysis, B.M.; investigation, B.M.; resources, O.D.; data curation, B.M.; writing—original draft preparation, B.M.; writing—review and editing, B.M. and O.D.; supervision, O.D.; project administration, O.D.; funding acquisition, O.D. and B.M. All authors have read and agreed to the published version of the manuscript.

Funding

This research received no external funding.

Data Availability Statement

Not applicable.

Acknowledgments

The authors would like to acknowledge Nora Schreithofer and Thi Minh Khanh Le for their input in the experiments and for suggesting some changes during the drafting of the manuscript. The authors further thank Boliden Kevitsa Mine for providing the samples and the Department of Bioproducts and Biosystems, Aalto University for supporting this study.

Conflicts of Interest

The authors declare no conflict of interest.

References

  1. Musuku, B.; Muzinda, I.; Lumsden, B. Cu-Ni processing Improvements at First Quantum’s Kevitsa mine. Miner. Eng. 2016, 88, 9–17. [Google Scholar] [CrossRef]
  2. Muzinda, I.; Schreithofer, N. Water Quality Effects on Flotation: Impacts and Control of Residual Xanthates. Miner. Eng. 2018, 125, 34–41. [Google Scholar] [CrossRef]
  3. Manono, M.S.; Corin, K.C.; Wiese, J.G. An investigation into the effect of various ions and their ionic strength on the flotation performance of a platinum bearing ore from the Merensky reef. Miner. Eng. 2012, 36–38, 231–236. [Google Scholar] [CrossRef]
  4. Manenzhe, R.M.; Corin, K.C.; Wiese, J.G.; Manono, M.S.; Musuku, B. The effect of water quality on the adsorption of a xanthate collector in the flotation of a sulphide ore. In Proceedings of the IMPC 2018—29th International Mineral Processing Congress, Moscow, Russia, 17–21 September 2018; pp. 1148–1157. [Google Scholar]
  5. Wiese, J.; Harris, P.; Bradshaw, D. The response of sulphide and gangue minerals in selected Merensky ores to increased depressant dosages. Miner. Eng. 2007, 20, 986–995. [Google Scholar] [CrossRef]
  6. Kuopanportti, H.; Suorsa, T.; Pöllänen, E. Effects of oxygen on kinetics of conditioning in sulphide ore flotation. Miner. Eng. 1997, 10, 1193–1205. [Google Scholar] [CrossRef]
  7. Bicak, O.; Ekmekci, Z. Prediction of flotation behavior of sulphide ores by oxidation index. Miner. Eng. 2012, 36–38, 279–283. [Google Scholar] [CrossRef]
  8. Ralston, J. Eh and its consequences in sulphide mineral flotation. Miner. Eng. 1991, 4, 7–11. [Google Scholar] [CrossRef]
  9. Nordstrom, D.K. Aqueous pyrite oxidation and the consequent formation of secondary iron minerals. In Acid Sulphate Weather; Soil Science Society of America: Washington, DC, USA, 2015; pp. 37–56. [Google Scholar]
  10. Hayes, R.A.; Ralston, J. The collectorless flotation and separation of sulphide minerals by Eh control. Int. J. Miner. Process. 1988, 23, 55–84. [Google Scholar] [CrossRef]
  11. Heiskanen, K.; Kirjavainen, V.; Laapas, H. Possibilities of collectorless flotation in the treatment of pentlandite ores. Int. J. Miner. Process. 1991, 33, 263–274. [Google Scholar] [CrossRef]
  12. Greet, C.J.; Brown, S. Oxygen demand testing—A new laboratory procedure. Australas. Inst. Min. Metall. Publ. Ser. 2000 2000, 6, 189–195. [Google Scholar]
  13. Clement, O.; Skinner, W.; Fornasiero, D.; Addai-Mensah, J.; Zanin, M. Oxygen demand test: A diagnostic tool for determining the optimum aeration in the selective flotation of chalcopyrite from pyrite. In Proceedings of the IMPC 2014—27th International Mineral Processing Congress, Santiago, Chile, 20–24 October 2014. [Google Scholar]
  14. Le, T.M.K.; Schreithofer, N.; Dahl, O. Dissolution test protocol for estimating water quality changes in minerals processing plants operating with closed water circulation. Minerals 2020, 10, 653. [Google Scholar] [CrossRef]
  15. Rumball, J.A.; Richmond, G.D. Measurement of oxidation in a base metal flotation circuit by selective leaching with EDTA. Int. J. Min. Process. 1996, 48, 1–20. [Google Scholar] [CrossRef]
  16. Sandhu, J. Physical Separation of Thermally Upgraded Pyrrhotite. Master’s Thesis, Applied Science Graduate Department of Chemical Engineering, University of Toronto, Toronto, ON, Canada, 2019. [Google Scholar]
  17. Mendiratta, N.K. Kinetic Studies of Sulphide Mineral Oxidation and Xanthate Adsorption. Ph.D. Thesis, Virginia Polytechnic Institute and State University, Blacksburg, VA, USA, 2000. [Google Scholar]
  18. Grano, S. CHAPTER 6-Chemical Measurements During Plant Surveys and Their Interpretation. In Flotation Plant Optimisation: A Metallurgical Guide to Identifying and Solving Problems in Flotation Plants; Greet, J.C., Ed.; Australasian Institute of Mining and Metallurgy: Carlton, Australia, 2010; Volume 16, pp. 107–121. [Google Scholar]
  19. Owusu, C.; Addai-Mensah, J.; Fornasiero, D.; Zanin, M. Estimating the electrochemical reactivity of pyrite ores- their impact on pulp chemistry and chalcopyrite flotation behaviour. Adv. Powder Technol. 2013, 24, 801–809. [Google Scholar] [CrossRef]
  20. Mhonde, N.; Schreithofer, N.; Corin, K.; Mäkelä, M. Assessing the combined effect of water temperature and complex water matrices on xanthate adsorption using multiple linear regression. Minerals 2020, 10, 733. [Google Scholar] [CrossRef]
Figure 1. Particle size distribution for standard and fine grind samples.
Minerals 12 01455 g001
Figure 2. Dissolution loop protocol and dissolved oxygen demand test.
Minerals 12 01455 g002
Figure 3. Effect of dissolution loop and dissolution time on SPC.
Minerals 12 01455 g003
Figure 4. Effect of dissolution loop and dissolution time on ORP.
Minerals 12 01455 g004
Figure 5. Effect of dissolution loop and dissolution time on pH vs. ORP.
Minerals 12 01455 g005
Figure 6. Dissolved oxygen levels at the end of each cycle and a full profile as a function of aeration time.
Minerals 12 01455 g006
Figure 7. Dissolved oxygen consumption rate (Kla) as a function of SPC and aeration time.
Minerals 12 01455 g007
Figure 8. EDTA extractable metals as a function of aeration time.
Minerals 12 01455 g008
Figure 9. Residue xanthate vs. aeration time using 1 and 6 dissolution loops in water under normal temperature (top), high temperature (middle), and fine grind (bottom).
Minerals 12 01455 g009
Table 1. Mineral and elemental assays used in the study.
Minerals/ElementsLaboratory Ore Samples (%)Plant Flotation Feed Sample%
Chalcopyrite1.291.96
Pentlandite0.630.81
Pyrrhotite1.340.52
Non-sulphide gangues96.7496.71
Cu0.360.38
Ni0.230.24
Fe9.008.20
S1.241.28
Table 2. Measured physicochemical parameters at the end of the sixth dissolution loop.
Sample NameT °CDO %SPC μS/cmpHORP mV
Standard grind @ room temperature21718649.021
Standard grind @ high temperature33528598.624
Fine grind @ room temperature20136039.1−10
Plant flotation feed—reference207018729.727
Table 3. Sample codes for all samples.
Sample NameDL #Code
Standard grind @ room temperature1A1
3A2
6A3
Standard grind @ high temperature1B1
3B2
6B3
Fine grind @ room temperature1C1
3C2
6C3
Plant flotation feed Ref.
Table 4. Rest potential values for some sulphide minerals [17].
MineralFormulaRest Potential (V)
PyriteFeS20.66
ChalcopyriteCuFeS20.56
SphaleriteZnS0.46
PentlanditeNiFeS0.35
PyrrhotiteFe(1−x) S0.31
GalenaPbS0.28
Publisher’s Note: MDPI stays neutral with regard to jurisdictional claims in published maps and institutional affiliations.

