Article

Chemostratigraphic and Textural Indicators of Nucleation and Growth of Polymetallic Nodules from the Clarion-Clipperton Fracture Zone (IOM Claim Area)

1
Institute of Marine and Environmental Sciences, University of Szczecin, 70-383 Szczecin, Poland
2
Interoceanmetal Joint Organization, 71-541 Szczecin, Poland
3
Faculty of Navigation, Maritime University of Szczecin, 70-500 Szczecin, Poland
4
State Geological Institute of Dionýz Štúr, 817 04 Bratislava, Slovakia
*
Author to whom correspondence should be addressed.
Minerals 2021, 11(8), 868; https://doi.org/10.3390/min11080868
Submission received: 7 June 2021 / Revised: 30 July 2021 / Accepted: 2 August 2021 / Published: 11 August 2021
(This article belongs to the Special Issue Exploration of Polymetallic Nodules)

Abstract

:
The detailed mineralogical and microgeochemical characteristics of polymetallic nodules collected from the Interoceanmetal Joint Organization (IOM, Szczecin, Poland) claim area, Eastern Clarion-Clipperton Fracture Zone (CCFZ, Eastern Pacific) were described in this study. The obtained data were applied for the delimitation of nodule growth generations and estimation of the growth ratios (back-stripping using the Co-chronometer method). The applied methods included bulk X-ray powder diffraction (XRD) and electron probe microanalysis (EPMA), providing information about Mn-Fe minerals and clays composing nodules, as well as the geochemical zonation of the growth generations. The analyzed nodules were mostly diagenetic (Mn/Fe > 5), with less influence on the hydrogenous processes, dominated by the presence of 10-Å phyllomanganates represented by todorokite/buserite, additionally mixed with birnessite and vernadite. The specific lithotype (intranodulith), being an integral part of polymetallic nodules, developed as a result of the secondary diagenetic processes of lithification and the cementation of Fe-rich clays (potentially nontronite and Fe-rich smectite), barite, zeolites (Na-phillipsite), bioapatite, biogenic remnants, and detrital material, occurs in holes, microcaverns, and open fractures in between ore colloforms. The contents of ∑(Ni, Cu, and Co) varied from 1.54 to 3.06 wt %. Several remnants of siliceous microorganisms (radiolarians and diatoms) were found to form pseudomorphs. The applied Co-chronometer method indicated that the nodules’ age is mainly Middle Pliocene to Middle Pleistocene, and the growth rates are typical of diagenetic and mixed hydrogenetic–diagenetic (HD) processes. Additionally, few nodules showed suboxic conditions of nucleation. Growth processes in the eastern part of the CCFZ deposit might have been induced with the Plio-Pleistocene changes in the paleooceanographic conditions related to the deglaciation of the Northern Hemisphere.

1. Introduction

Polymetallic nodules, also called manganese nodules, are spheroidal-to-ellipsoidal concretions found at the sea bottom. Polymetallic nodules are present in almost all oceanic basins: the abyssal plains of the Pacific Ocean (Clarion-Clipperton Fracture Zone (CCFZ) [1,2,3,4,5], Peru Basin [6], and Manihiki Plateau or Penrhyn Basin [7,8]); the Indian Ocean (the Central Indian Ocean Basin [9]); and the Atlantic Ocean [10], as well as marginal seas such as the South China Sea [11] and semi-landlocked seas such as the Baltic Sea [12].
Nodules are fragile and often fractured, with varying morphology and nuclei. Nodules are usually completely or partly buried in the semi-liquid geochemically active layer (GAL) of surface sediments, mainly in siliceous-clayey silts (e.g., [1]). GAL is the main environment for polymetallic nodule development [13]. Hence, the sedimentary settings, as well as the geochemical and biological processes in the layers up to several centimeters thick [14], are the crucial factors determining the type of nodule growth generation. The occurrence of nodules, buried up to 2.5 m in the sediment, should be mentioned [15].
Polymetallic nodules are composed of a nucleus (core) that is surrounded by concentric ore-bearing microlayers of Fe oxyhydroxides and Mn oxyhydroxides (laminae), forming cauliflower-like colloforms and non-ore-bearing, irregular-shaped, admixtures of detrital materials of various origins. The nodule nuclei can be clayey-zeolitic consolidated sediment, bioclastic material (e.g., a piece of fish bone or tooth), volcanoclastic materials, or fragments of older nodules (e.g., [2,16]). Microlayers (laminae) are highly enriched in a variety of elements relative to their average abundances in the Earth’s crust and seawater. Compared to the crustal abundances, the concentrations of Mn, Co, Mo, and Th are 100 times higher, whereas those of Ni, Ag, Ir, and Pb are 50 times higher, and those of Cu, Zn, Cd, Yb, W, and Bi are 10–50 times higher [17]. These high concentrations of metals indicate that polymetallic nodules may be a prospective resource; however, currently, no exploitation is being conducted. The main processes responsible for laminae formation include: the hydrogenic precipitation of Mn and Fe oxyhydroxides and oxides under oxic conditions directly from oceanic and pore waters (hydrogenic origin), precipitation from hydrothermal waters (hydrothermal origin), and precipitation and reprecipitation under suboxic conditions from pore waters, which are enriched with elements derived from sediments and buried nodules (diagenetic origin) [5,18]. The factor controlling the type of precipitation (hydrogenic vs. diagenetic) is the redox potential [1,5,15,16,19,20,21,22]. Until recently, little attention was paid to the non-ore parts of polymetallic nodules (see references [15,23]). The general environmental conditions favoring nodules growth are presented in Figure 1.
Polymetallic nodules can be used in reconstructions of deep-water circulation and continental weathering during the Plio–Pleistocene period. Combining magnetic profiling with geochemical and isotopic data provides a useful tool for the estimation of the age and growth generations of polymetallic nodules, in which fluctuations in the Earth’s magnetic field are reliably stored [24,25].

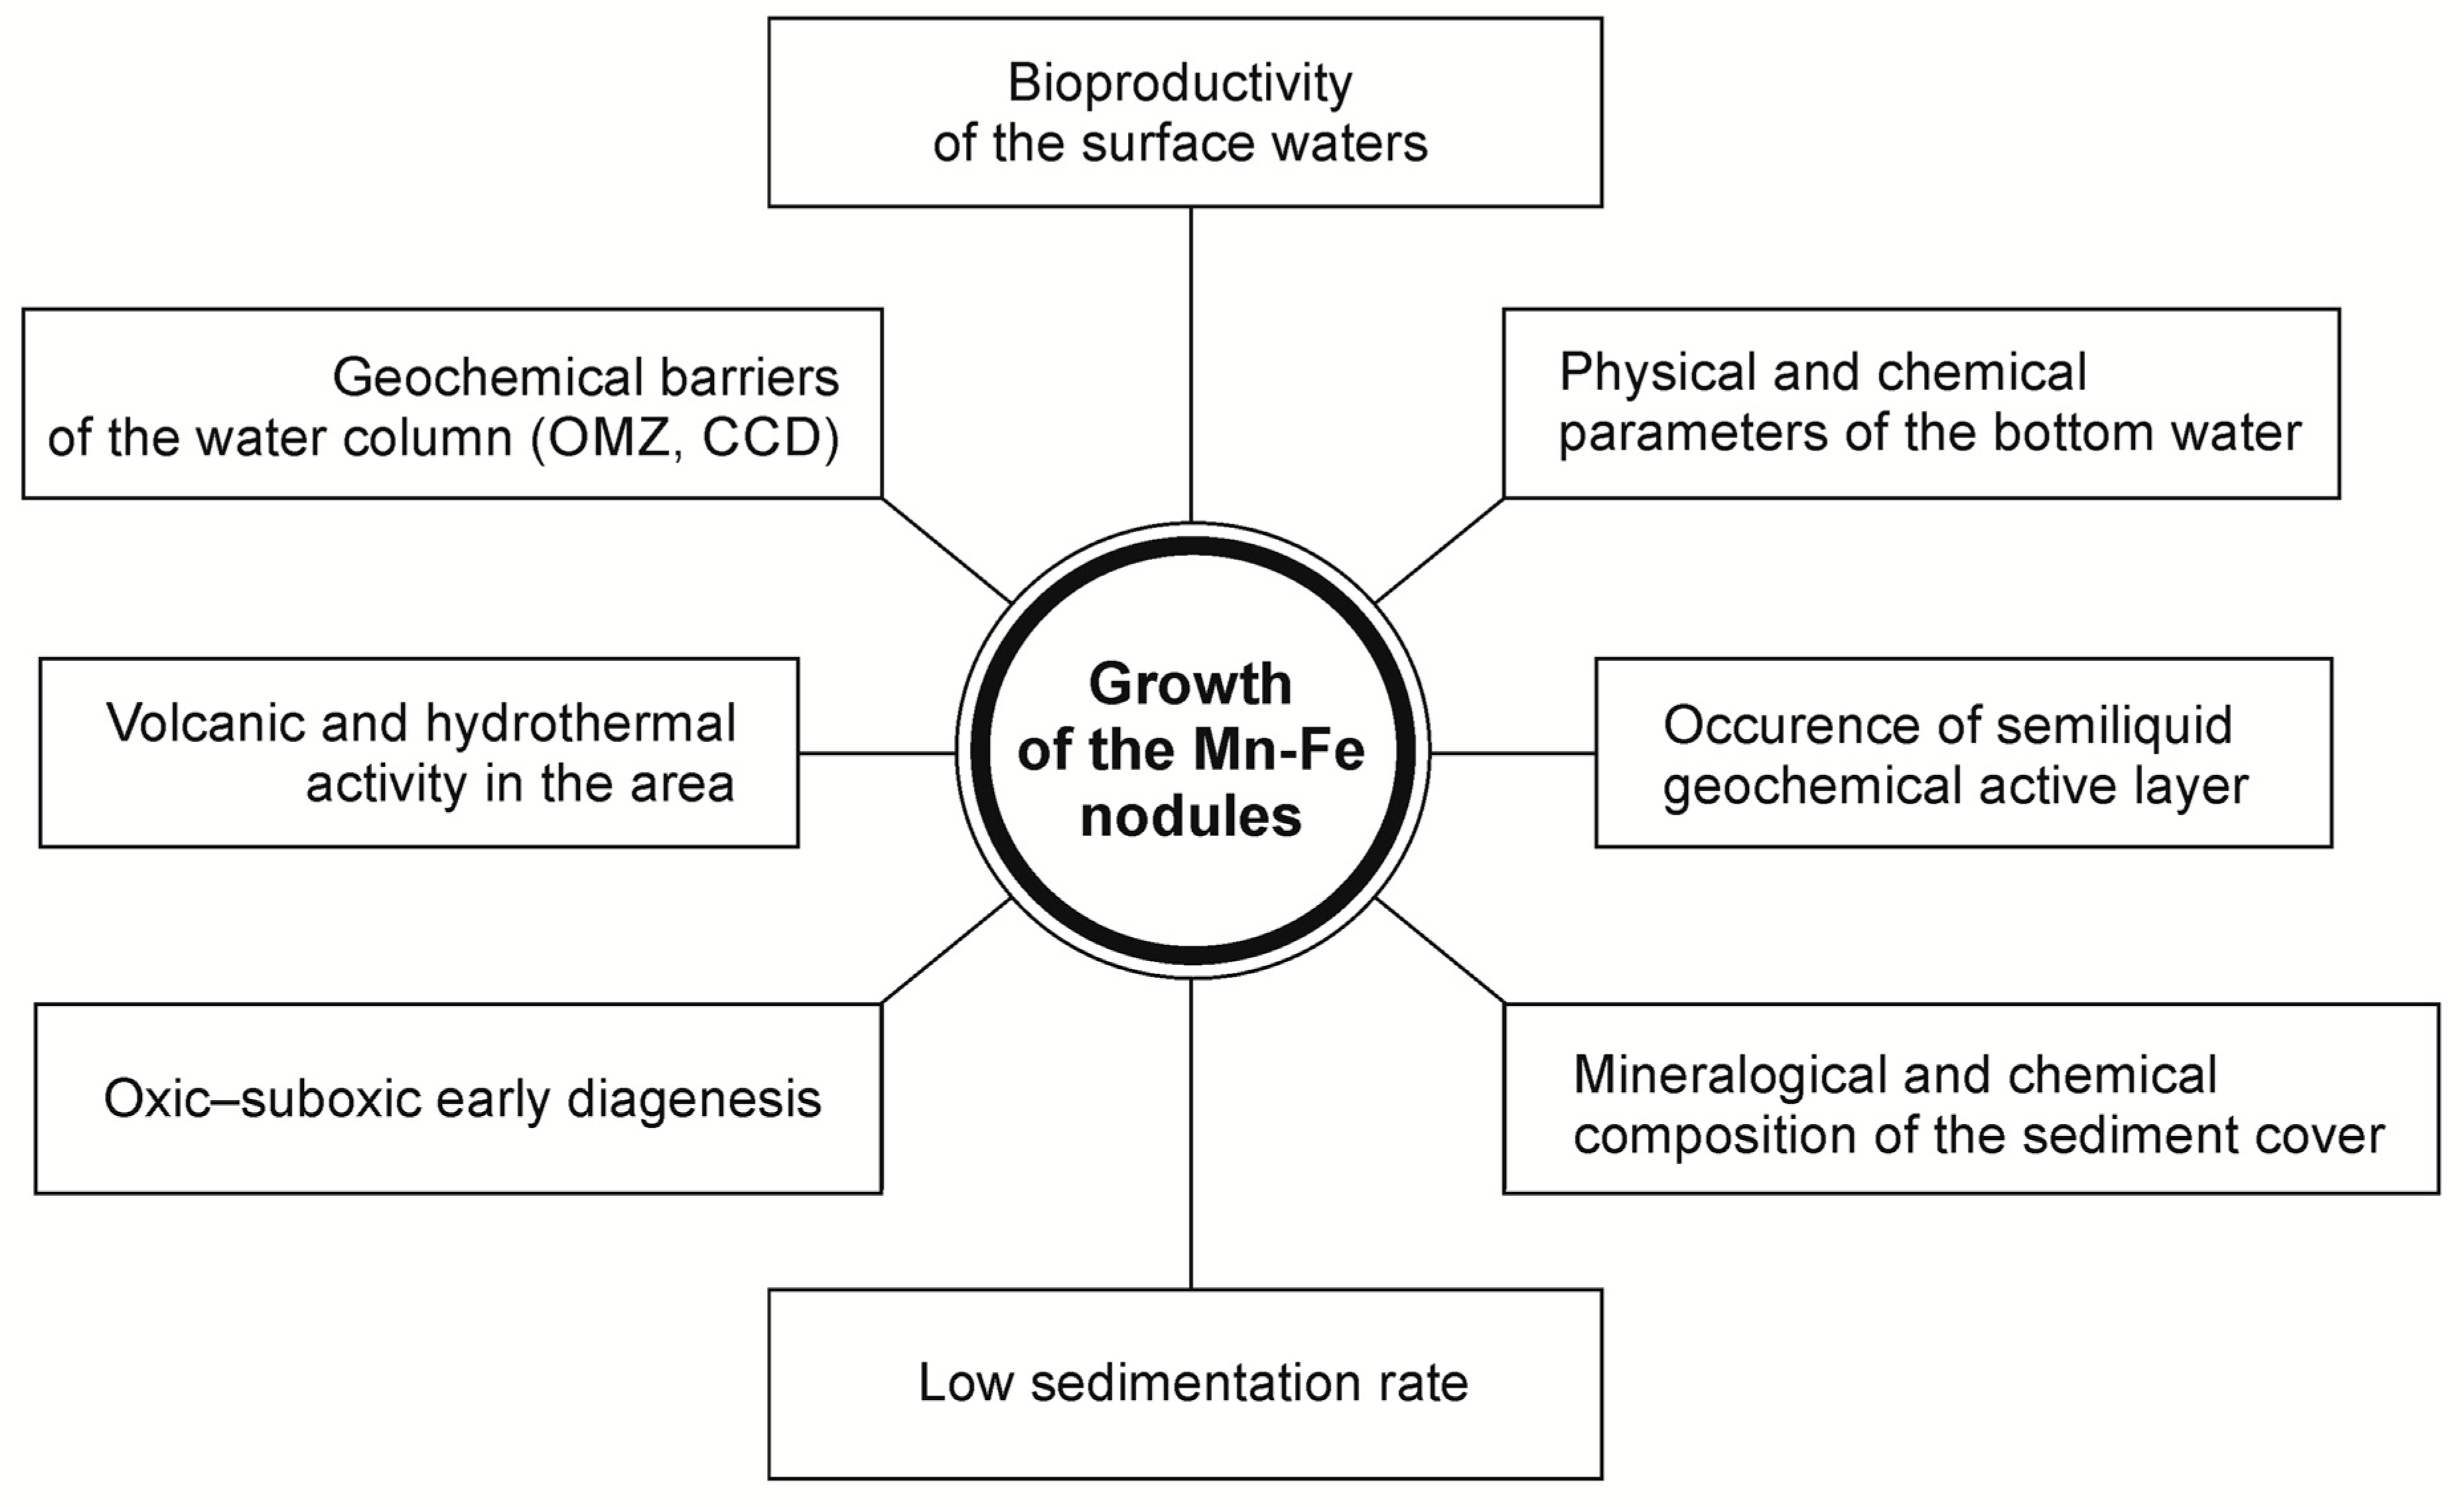
2. Characteristics of Polymetallic Nodules from the CCFZ

In detail, the nodules from the CCFZ are characterized by the presence of two main types of laminae composed of ore minerals precipitated directly from the solution: those of hydrogenic and diagenetic origin [1,5]. The hydrogenic layers are characterized by an Mn/Fe ratio < 3, Ni + Cu content < 1.5 wt %, and Co content of about 0.4 wt % [1,5]. Trace metals such as Co are enriched in the hydrogenic layer precipitating directly from well-oxygenated seawater. The excellent sorption of trace metals results from the high porosity and large surface area of the hydrogenic layers [20,26].
Diagenetic microlayers show a Mn/Fe ratio > 10, Ni + Cu content of ~4 wt %, and a Co content of ~0.1 wt % [5]. The enrichment of most metals resulted from the secondary diagenetic mobilization and precipitation under oxic conditions and, further, the reprecipitation–mobilization influenced by the sub- and anoxic conditions occurring under the burial of the sediment cover [18]. Recently, an additional type of microlayer was described as an Fe-Al-Si-rich type 3 layer [15]. This type of layers occurs, according to reference [15], only in buried nodules. They are characterized by a high content of Si (~20%) and Al (~2%); low Mn/Fe ratio (<0.5); and a very low concentration of metals such as Ni, Cu, and Co.
Polymetallic nodules are classified by their morphotypes as diagenetic (“D” nodules) and hydrogenetic (“H” nodules). They differ in sizes (the H type is smaller); the predominance of the given type of microlayer (the H type is mostly hydrogenic); the chemical and mineralogical compositions, which also depend on the ratio between the hydrogenetic and diagenetic components; the geological setting; and the depth of occurrence and geochemical barriers in the water column [27]. The dominant mineral phase in H (hydrogenetic)-type nodules is vernadite, often associated with amorphous FeOOH; D-type (diagenetic) nodules more frequently contain 10-Å phyllomanganates (todorokite/buserite) and birnessite (7-Å manganate) [5,28,29]. In addition to manganese minerals, the minor components include X-ray amorphous Fe oxyhydroxides (feroxyhyte, ferrihydrite, and goethite), usually intergrown and overgrown with vernadite; detrital aluminosilicates; and authigenic minerals such as zeolites, which are mainly phillipsites and clinoptilolites [26,30]. Increased contents of 10-Å vernadite and the lack of todorokite are often observed in older suboxic–diagenetic colloforms, which usually indicate increased contents of the interlayer cations, including Na, Ca, Mg, and K. The stability of vernadite is probably due to the reorganization and incorporation of metals (Ni and Cu) within the interlayer of the crystal structure [31].
The presence of higher contents of Fe-rich minerals (feroxyhyte δ-FeOOH or feroxyhyte transformed to goethite) was previously indicated in typically diagenetic nodules from the CCFZ as a direct result of the upward migration of Fe2+ and Mn2+ from the upper layers of sediments in the presence of increased Corg. Contents, as well as the lack of oxidizing bacteria. According to reference [32], the precipitation of Fe3+ and Mn oxides does not play an important role in the formation of ferromanganese nodules, and the reductive processes need to be considered as a potential factor affecting the growth of nodules. Higher contents of amorphous P-rich minerals (e.g., apatite) are often related to diagenetic alterations, the presence of Fe oxyhydroxides, and potential Fe enrichment in a highly oxidized sedimentary environment [33].
Several admixtures of Fe-rich clay minerals identified in hydrogenetic–diagenetic polymetallic nodules and ferromanganese crusts (e.g., nontronite, the ferrous end member of dioctahedral smectite) usually form cements and replace the pyroclastic material on which Mn oxides and oxyhydroxides can be developed [34].
The growth rate of polymetallic nodules can be determined by a number of isotopic methods, including 230Th/232Th [35], tritium/3He [36], and 10Be/26Al [37], as well as with biostratigraphic techniques [38]. The most commonly used method is the application of 230Th, which has the main limitation of a comparatively short half-life (7.52 × 10⁴ years) [39]. Growth rates depend on the environmental conditions and the sources of the precipitated components. The predominance of hydrogenetic components results in the slowest growth rate (<5 mm/Myr). The larger the diagenetic input to nodules, the higher the growth rate [26]. Under oxic diagenetic conditions, the growth rate is up to 16 mm/Myr [40], but under suboxic diagenetic conditions, the growth rate increases up to 250 mm/Myr [35]. Notably, the growth rate is not a linear function, and individual generations of manganese layers grow at different rates. The highest growth rate of nodules from the CCFZ (about 19.8 mm/Myr) indicates Pliocene generation, and the lowest (about 5.7 mm/Myr) indicates a third Pleistocene layer [41].

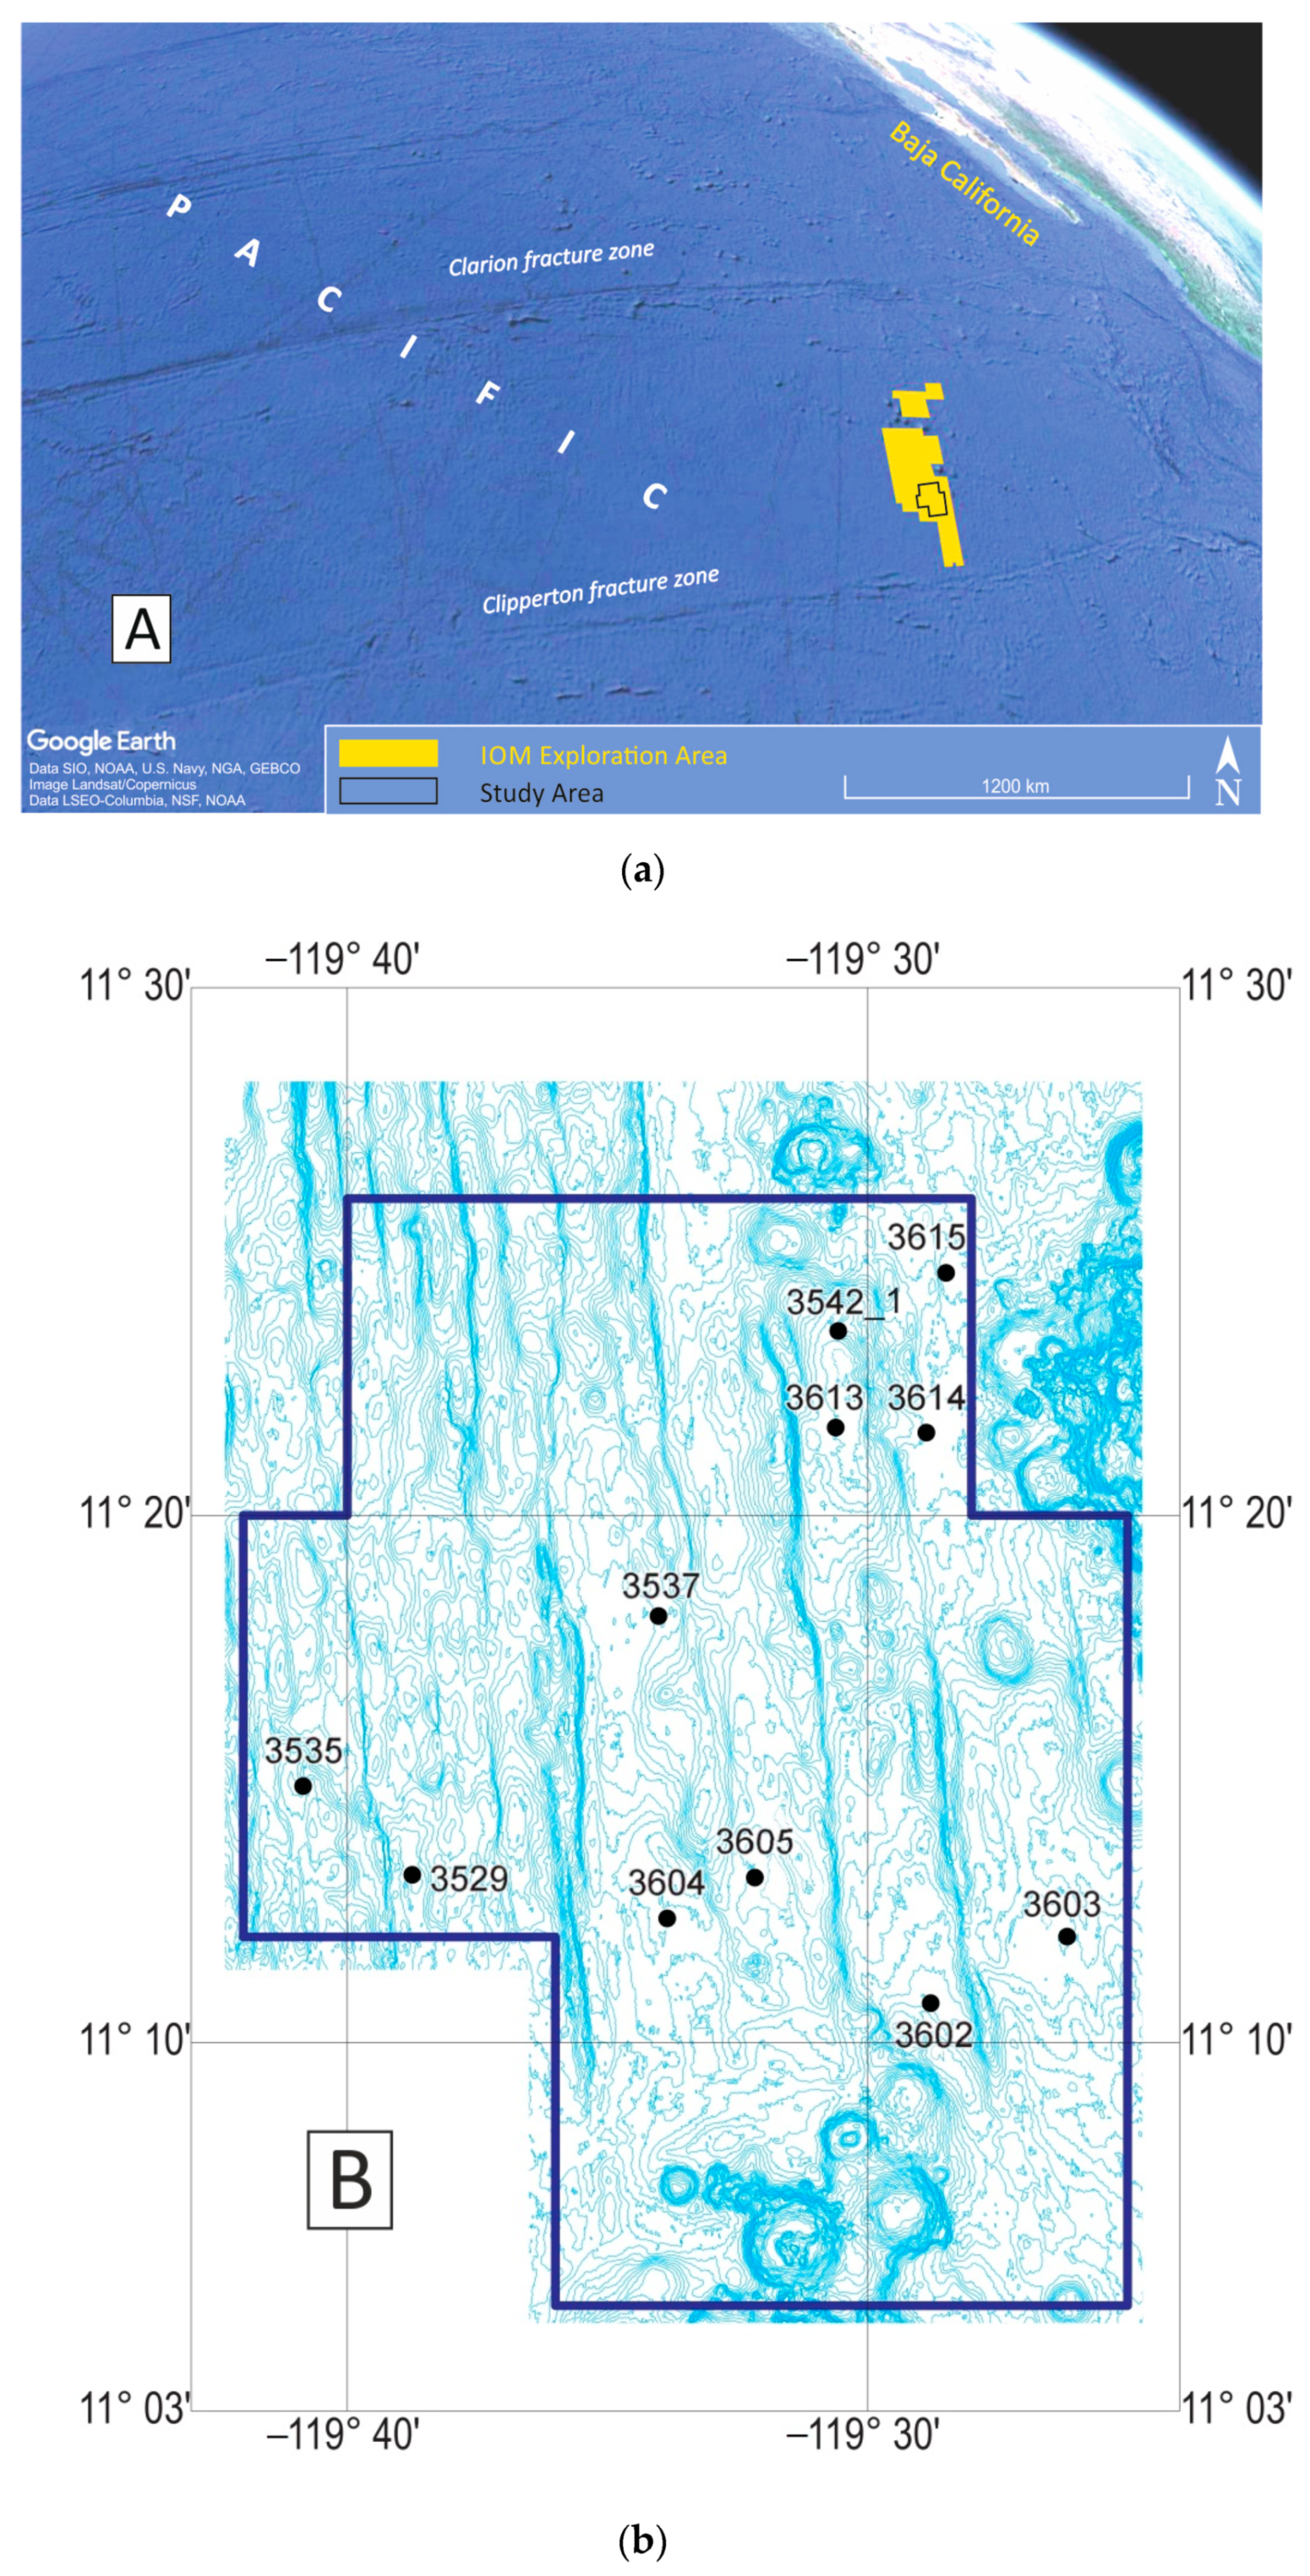
3. Study Area and Geological Settings

In this study, we included samples of polymetallic nodules collected from 11 locations in the Interoceanmetal Joint Organization (IOM) claim area in the tropical Eastern Pacific in the eastern part of the Clarion-Clipperton Fracture Zone (CCFZ; Figure 2a). The CCFZ is an abyssal area with a depth range from 3800 m in the east to 5600 m in the west, punctuated with numerous seamounts of various heights [42,43]. The local seafloor morphology is dominated by horst and graben structures [13,43,44]. The surface of the IOM license area is located in water depths ranging from 2450 to 4750 m [45]. In the vicinity of the IOM site, the regular structure of the seabed is diversified by two outstanding seamount chains (the Acapulco Seamount chain to the northeast and the nameless chain to the south). These features show typical conical shapes and a steepness of 3–6°, with the largest diameter 30 km [46,47].
The presence of volcanic seamounts may have had a significant regional impact on the sedimentation rate, the chemical characteristics of the sedimentary cover, and the variability in the sedimentary conditions. Additionally, reference [43] suggested the presence of contourite features associated with the sweeping of the sedimentary cover by the water currents encountering topographic obstacles.
The oldest oceanic crust of the CCFZ is located in its western part and is associated with the development of the East Pacific Rise (EPR) spreading zone formed about 80 Ma ago. The age of the basaltic rocks in the IOM claim area is slightly over 20 Ma [41,48]. In the IOM claim area, the volcanic fundament is covered with pelagic sediments up to 100 m thick [45]; in the western part of the CCFZ, they reach up to 300 m [13]. This spatial differentiation results from the high spreading rate in the area of the EPR and the seabed bathymetry resulting from the step-and-block structure of the basement [41]. The dominant types of the bottom sediments, covering approx. 80% of the CCFZ area, are siliceous silts, clays, and oozes. Around 15% of the seafloor is covered with carbonate sediments, whereas less than 5% is zeolitic clays and sediments rich in volcanogenic components [49]. The sedimentation rate in the IOM site ranges between 0.2 and 1.15 cm·kyr−1 [50]. The supply of particulate organic carbon (POC) to the seafloor in the IOM claim area is estimated as ~1.7 mg Corg m−2·d−1 [50,51,52]. The total organic carbon (TOC) content in the CCFZ surface sediments is <0.5 wt % [50].
Despite the low carbon influx, the presence of a diverse substrate—soft sediments and hard nodules—results in a relatively high abundance of benthic species [52]. The benthic organisms’ activity plays an important role in sediment irrigation and ventilation, as well as in the migration of the elements [13]. The bioturbation depth at the IOM site is up to 13 cm [50].
The redox potential plays a significant role in nodule formation (Figure 1). The bottom mean oxygen concentration in the IOM area is estimated as 147 µM. In the upper 30 cm of the sediments, the O2 content decreases to 30 µM; however, it can still be detected at a depth of 3 m [50]. In addition, in the areas located in the vicinity of the seamount’s foothills, the oxygen concentration in the pore waters, after an initial decrease along with the depth, gradually increases toward the basaltic substrate, which is explained by the circulation of oxygenated water in the pores and cracks of the seamount base [44]. Due to the low growth rate of nodules, their formation and preservation correspond to the changes in the redox conditions over time connected to glacial/interglacial shifts (fluctuations in the redox boundary within the sediments) [53].
Mn2+ occurs below the oxygen penetration depth, where it is mobilized due to dissimilatory reduction [50], probably with the participation of bacteria involved in metal cycling [54]. In the Eastern CCFZ, the content of Mn2+ dissolved in the pore waters is detected in the range from 0.2 to 25 µM. In the IOM claim area, Mn2+ appears at a depth of 3 m, where its content increases up to 13 µM [50].

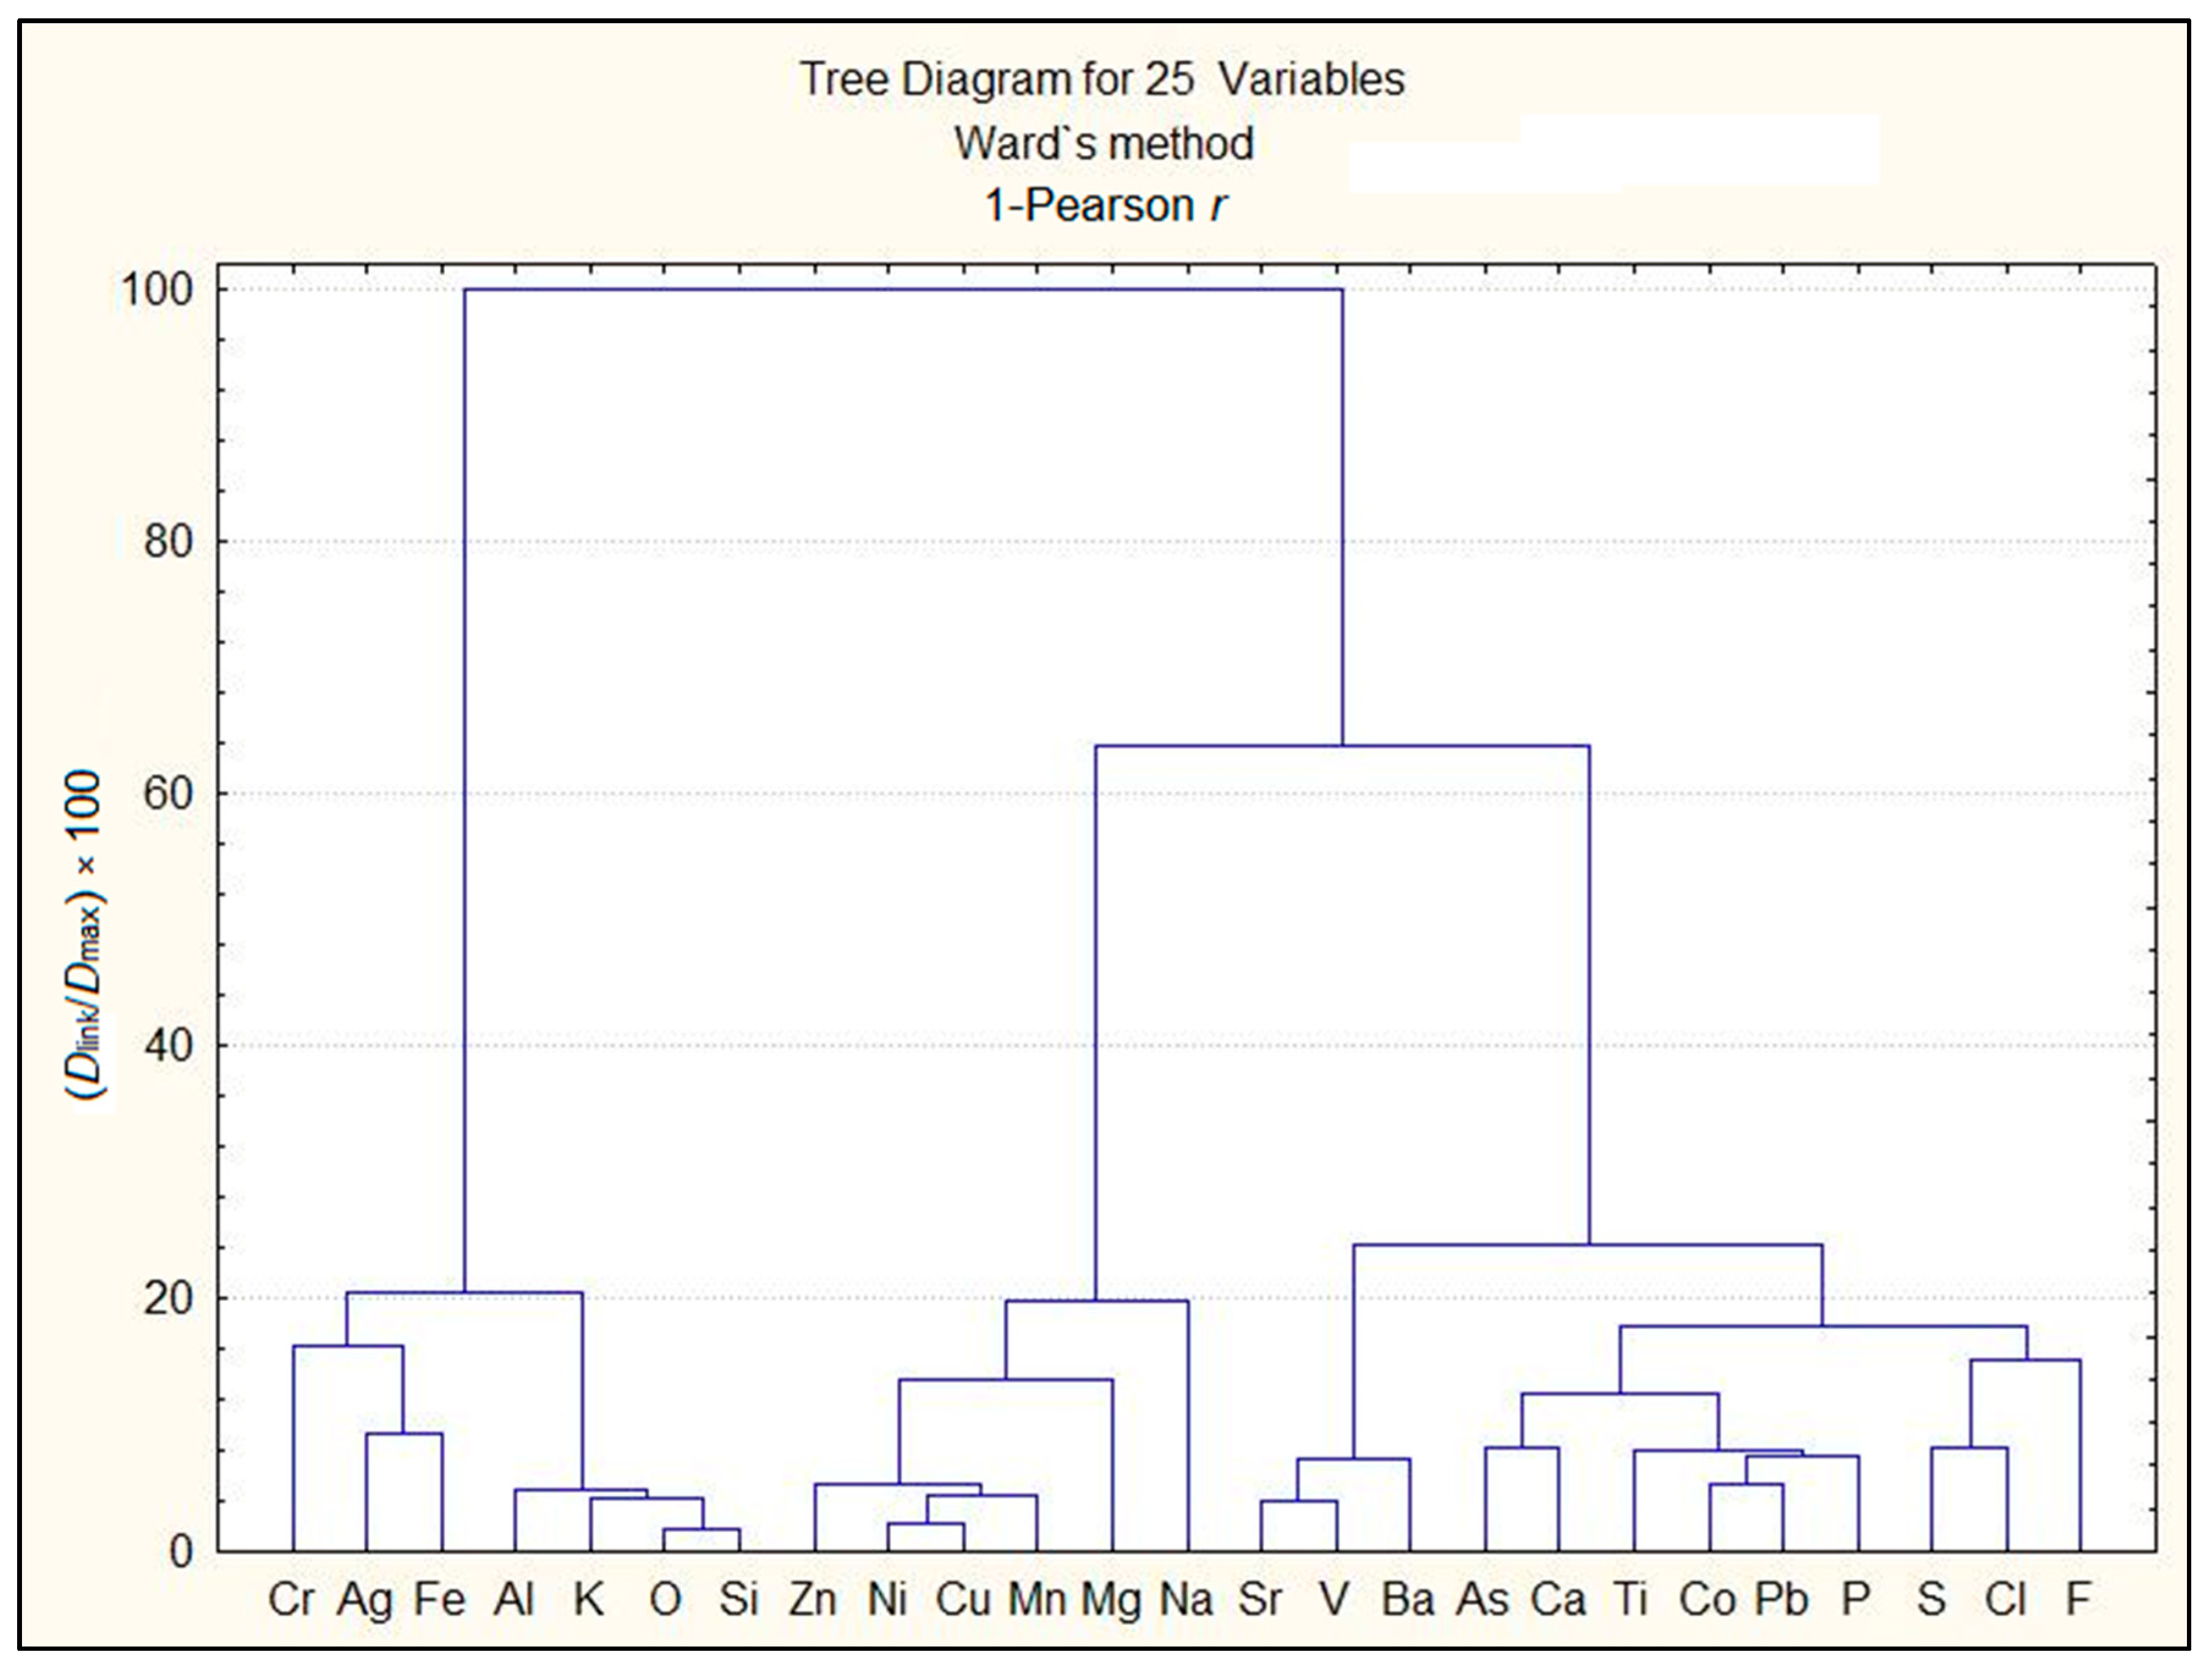
4. Materials and Methods

4.1. Samples

Samples of polymetallic nodules were collected at the IOM sampling sites using a Reineck box corer (Ocean Instruments, Fall City, WA, USA) during the IOM research cruises at the IOM H22 polygons (in 2014 and 2019, respectively; Figure 2a,b). Eleven nodules were selected for this study. The surface area of the box corer was 0.25 m2, and the maximum penetration depth was 0.5 m. The nodules were separated from the uppermost non-disturbed layer of soft surface sediments (represented mostly by siliceous-clayey silts). The samples were recovered from a depth range of 4272–4511 m.
The recovered polymetallic nodules were friable and highly porous. To prevent destruction during the cutting and grinding processes, the samples were impregnated with resin under vacuum conditions. Most of the samples were prepared in a form of polished, thin sections. A few small samples were cast in epoxy and prepared in the form of polished sections (a circular diameter of 2.54 cm). The surfaces of the samples were coated with a layer of carbon to ensure proper surface conductivity and quality using an electron probe microanalyzer (EPMA) and backscattered electron (BSE) images.

4.2. Bulk X-ray Powder Diffraction (XRD)

The bulk mineralogical XRD analysis of all the samples was performed using a PANalytical Empyrean diffractometer (Malvern Panalytical Ltd., Malvern, UK) at the Faculty of Chemical Technology and Engineering, West Pomeranian University of Technology, Szczecin, Poland (WPUT). The analytical settings were as follows: monochromatic Cu-Kα radiation at 35 kV and 30 mA, scans from 5° to 80° (2θ), a step size of 0.024° (2θ), and using a wide-angle detector (PIXcel 3D). For the qualitative and quantitative analysis of the mineral compositions, Match!3 Software (version 3.8.1.143, Crystal Impact, Bonn, Germany) [55] and the COD database of reference patterns (e.g., [56]) were used. For the amount estimation, we used the Rietveld method and presented the results in a semi-quantitative way.

4.3. Electron Probe Microanalysis (EPMA)

The samples were studied using a CAMECA SX 100 electron probe microanalyzer (EPMA) equipped with four wavelength dispersive spectrometers (WDSs) at the State Geological Institute of Dionýz Štúr, Bratislava, Slovakia. The data were collected using the WinEDS control system. As the measured area may be inhomogeneous, we chose an electron beam diameter of 10 μm. The analyses were performed with an accelerating voltage of 15 kV and a sample current of 35 nA. The following elements were analyzed: F, Na, Si, Al, Mg, P, Cl, K, S, Ca, Ba, Ti, Pb, Fe, Mn, Cr, Cu, Zn, V, As, Sr, Co, Ni, and Ag. The REE was not measured, since the concentrations were below the detection limit (<0.02 wt %). Oxygen was recalculated after the stoichiometry of the other elements. Long counting times were applied to achieve a higher analysis precision (~13 min for the single-spot analysis). The average detection limit was about 200–500 ppm (expanded 3 sigma) and varied for each element. Spots analyzed by the microprobe were noted in the BSE images. Representative data spots were used to determine the types of minerals based on stoichiometry and the chemical composition [57].
To assess the chemical variability in the nodules, we used the line profiling and X-ray mapping methods. Profiles were planned across the nodules to capture the core and rim. The noted counts were proportional to the concentrations of the elements and quantitatively recalculated based on the spot analyses located at the profiles. Elements such as Mn, Cu, Ti, Co, Fe, Ni, and Zn were measured on profiles of the 7 selected nodules, with each profile consisting of 1024 analytical spots distributed over even and equal distances.
Samples with clear core–rim relationships were selected for X-ray mapping. Theis method showed the changes in their relative concentrations in the selected areas. When the concentrations of some of the elements were very low, the conditions for X-ray mapping were set for a long acquisition time to achieve the necessary analytical precision. Around 8–12 h was required for an X-ray map.

4.4. Growth Rate and Age Back-stripping

The relative growth rates were estimated using the Cobalt chronometer method [58]. The bulk samples method provides reliable and comparable results to isotopic measurements; however, the calculated growth rates need to be considered as the maximum ones because of the lack of sensitivity to potential hiatuses. The growth rates R were calculated based on the Co, Mn, and Fe content data obtained during EPMA profiling:
R = 6.8 × 10⁻¹/(Con)1.67 (mm/Myr)
where:
Con = Co × 50/Fe + Mn
For the estimation of the growth rates and genetic types of colloform textures (hydrothermal, diagenetic, hydrogenic, and mixed), we used normalized profile data (mean metal contents) and removed the highly siliceous layers indicating anomalously low total contents of Fe and Mn (usually, <10% wt %), the presence of increased contents of clay minerals, and extreme values of the growth rate R (thousands to hundreds of thousands mm/Ma). We assumed that these layers were formed relatively rapidly in comparison to ordinary Mn-Fe oxyhydroxides composing typical Mn-Fe colloform textures.
For the estimation of the nodule age, the bulk and back-stripping methods were applied. The latter is based on the recalculated and normalized data of EPMA profiling. Back-stripping enabled distinguishing potential growth hiatuses visible in the samples and removing them from the total age of the analyzed nodules.

5. Results

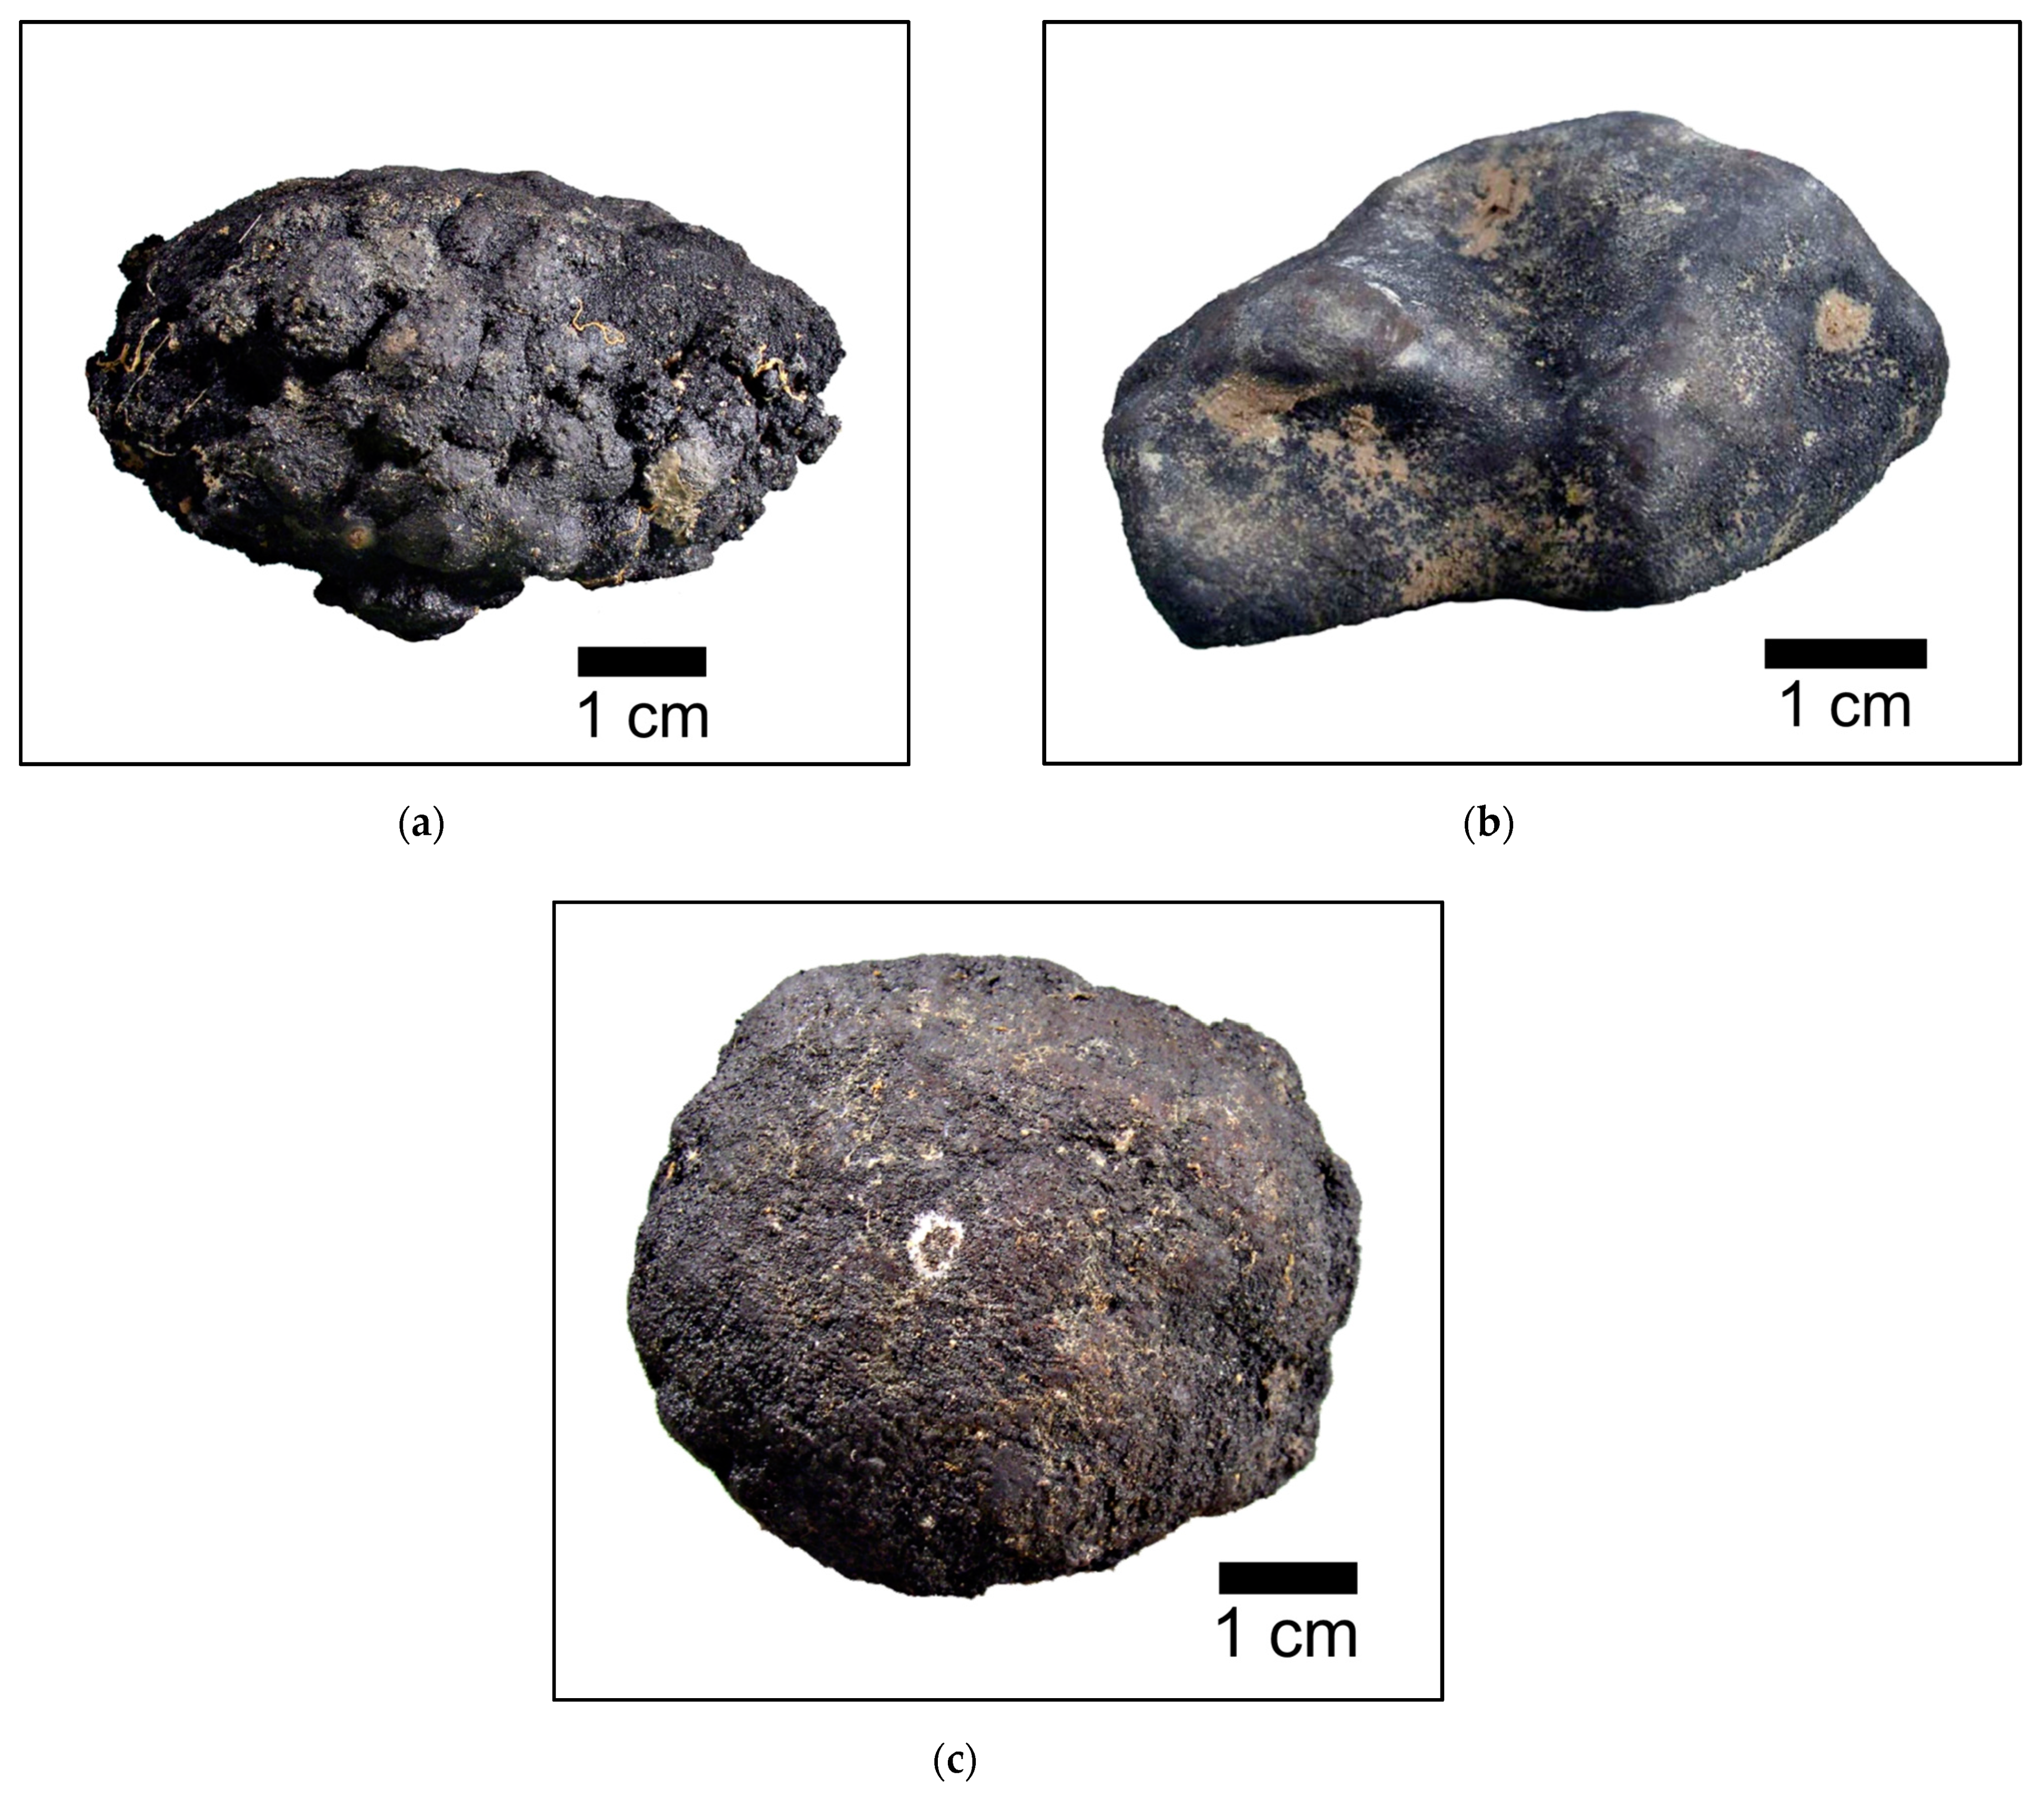
5.1. General Description of Samples
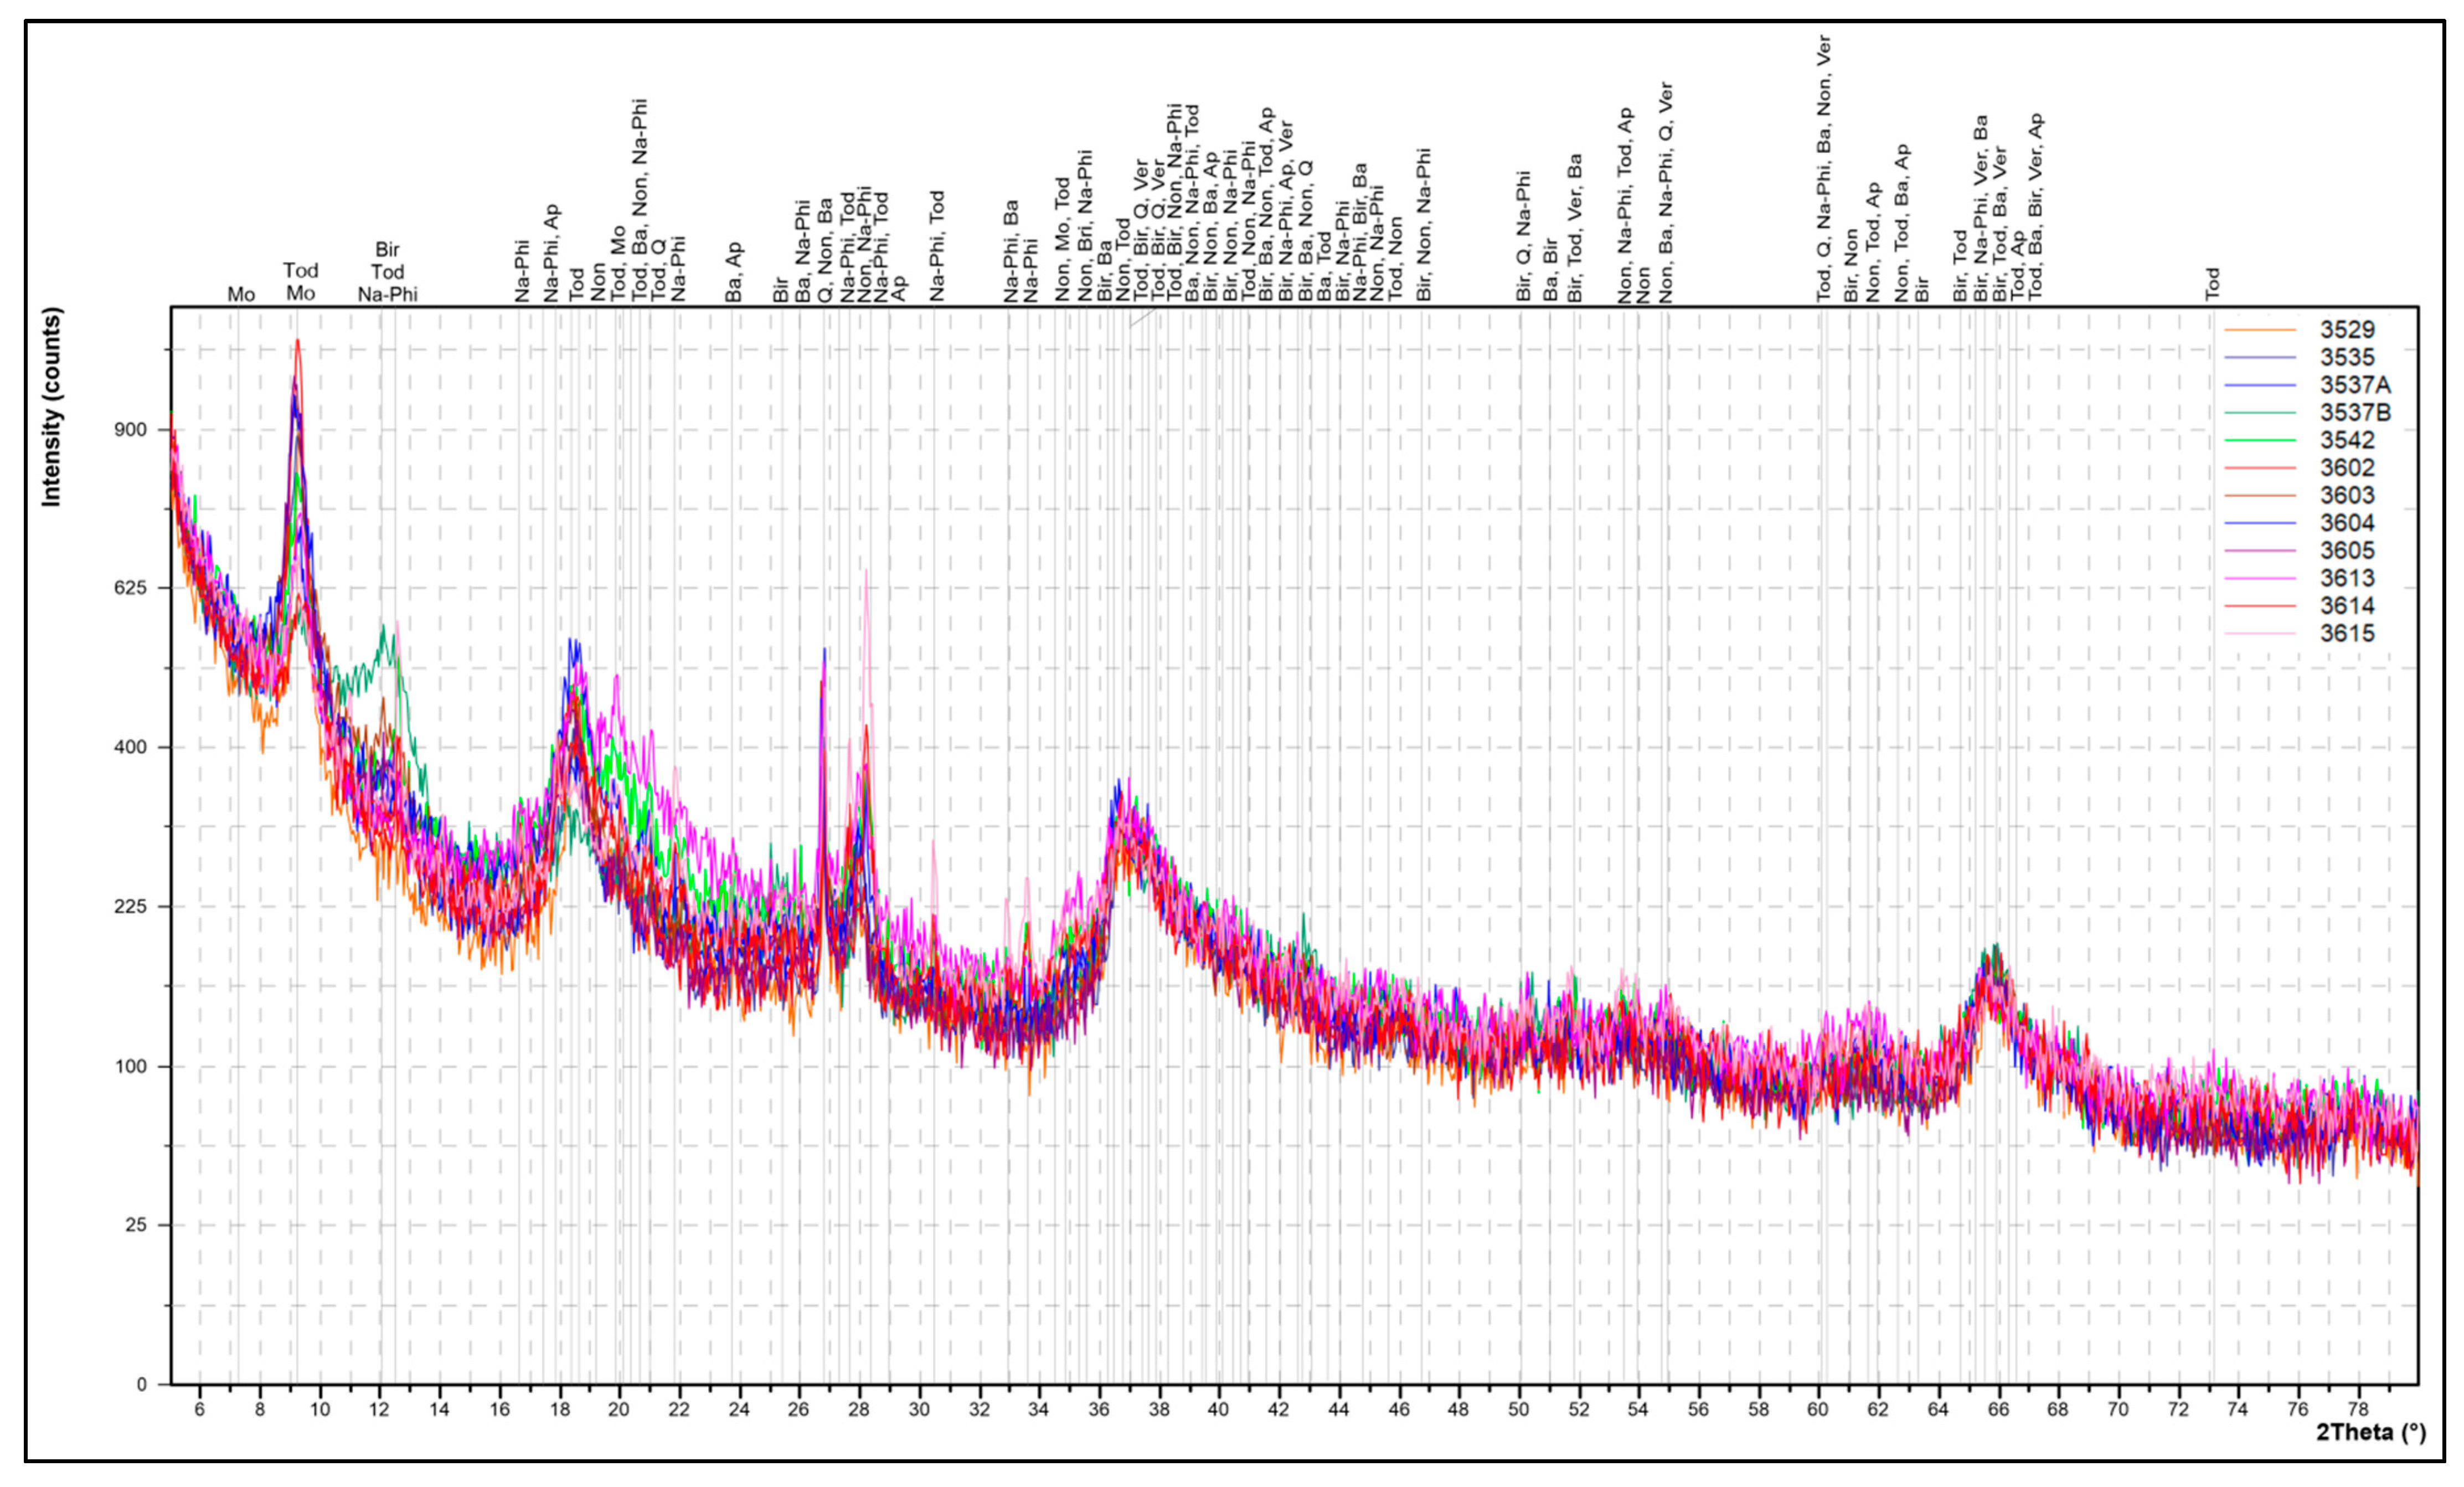
The collected polymetallic nodules are represented by three major types: (i) diagenetic (D), (ii) hydrogenetic (H), and (iii) mixed hydrogenetic–diagenetic (HD) (Figure 3a–c). The diagenetic nodules prevailed in the analyzed materials (Table 1).

5.2. Bulk XRD

The analyzed samples are generally dominated by todorokite/buserite, with a lesser amount of birnessite and traces of vernadite. Additionally, the samples indicated the presence of Fe-rich clay minerals (potentially nontronite and Fe-smectite) and mixtures of quartz, barite, zeolites (potentially Na-phillipsite), apatite, and barite (Figure 4 and Table 2). In some cases, the presence of buserite was reflected by a 9.62–9.59-Å reflection overlapping with todorokite. The presence of dual 2.39–2.45-Å peaks observed in a few samples suggested the presence of 10-Å phyllomanganates, as well as collapsed Mn oxyhydroxides (e.g., [59]). Some samples showed buserite dehydration to birnessite or even potentially defected (collapsed) todorokite to buserite, related to the drying process occurring due to the long storage time under relatively warm conditions (cruises in 2014 and 2019) (e.g., [31,33,60,61]).

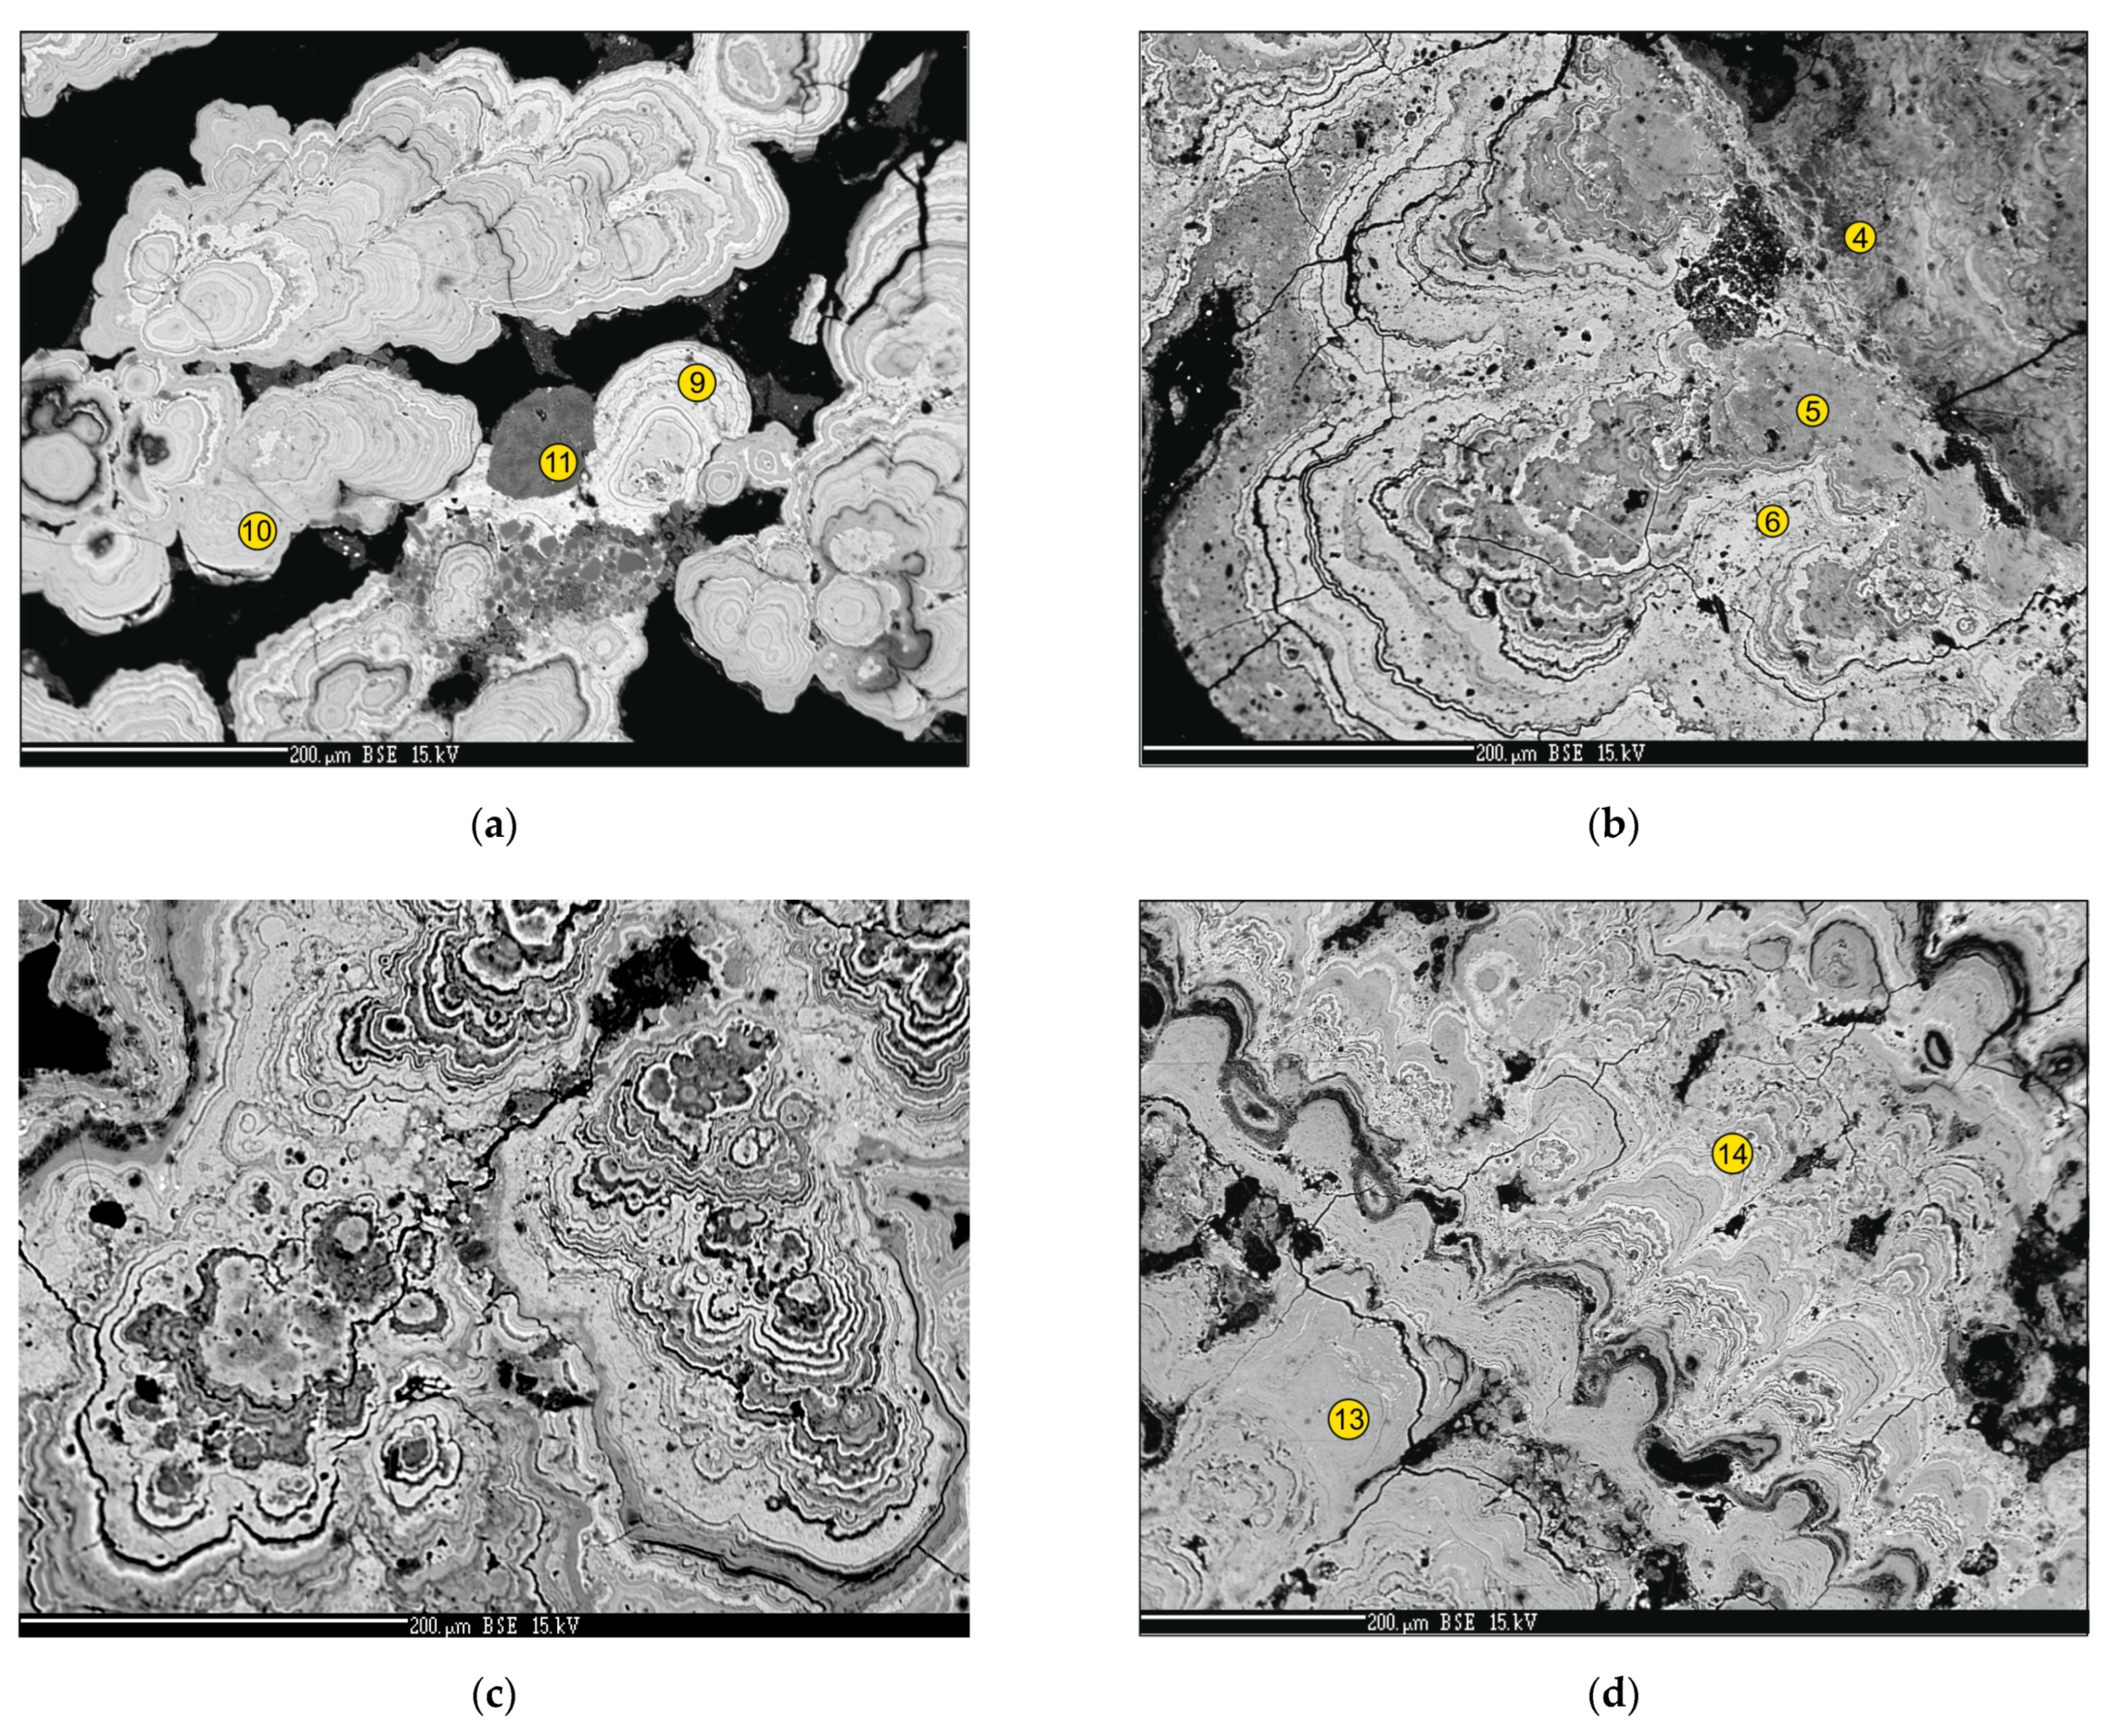
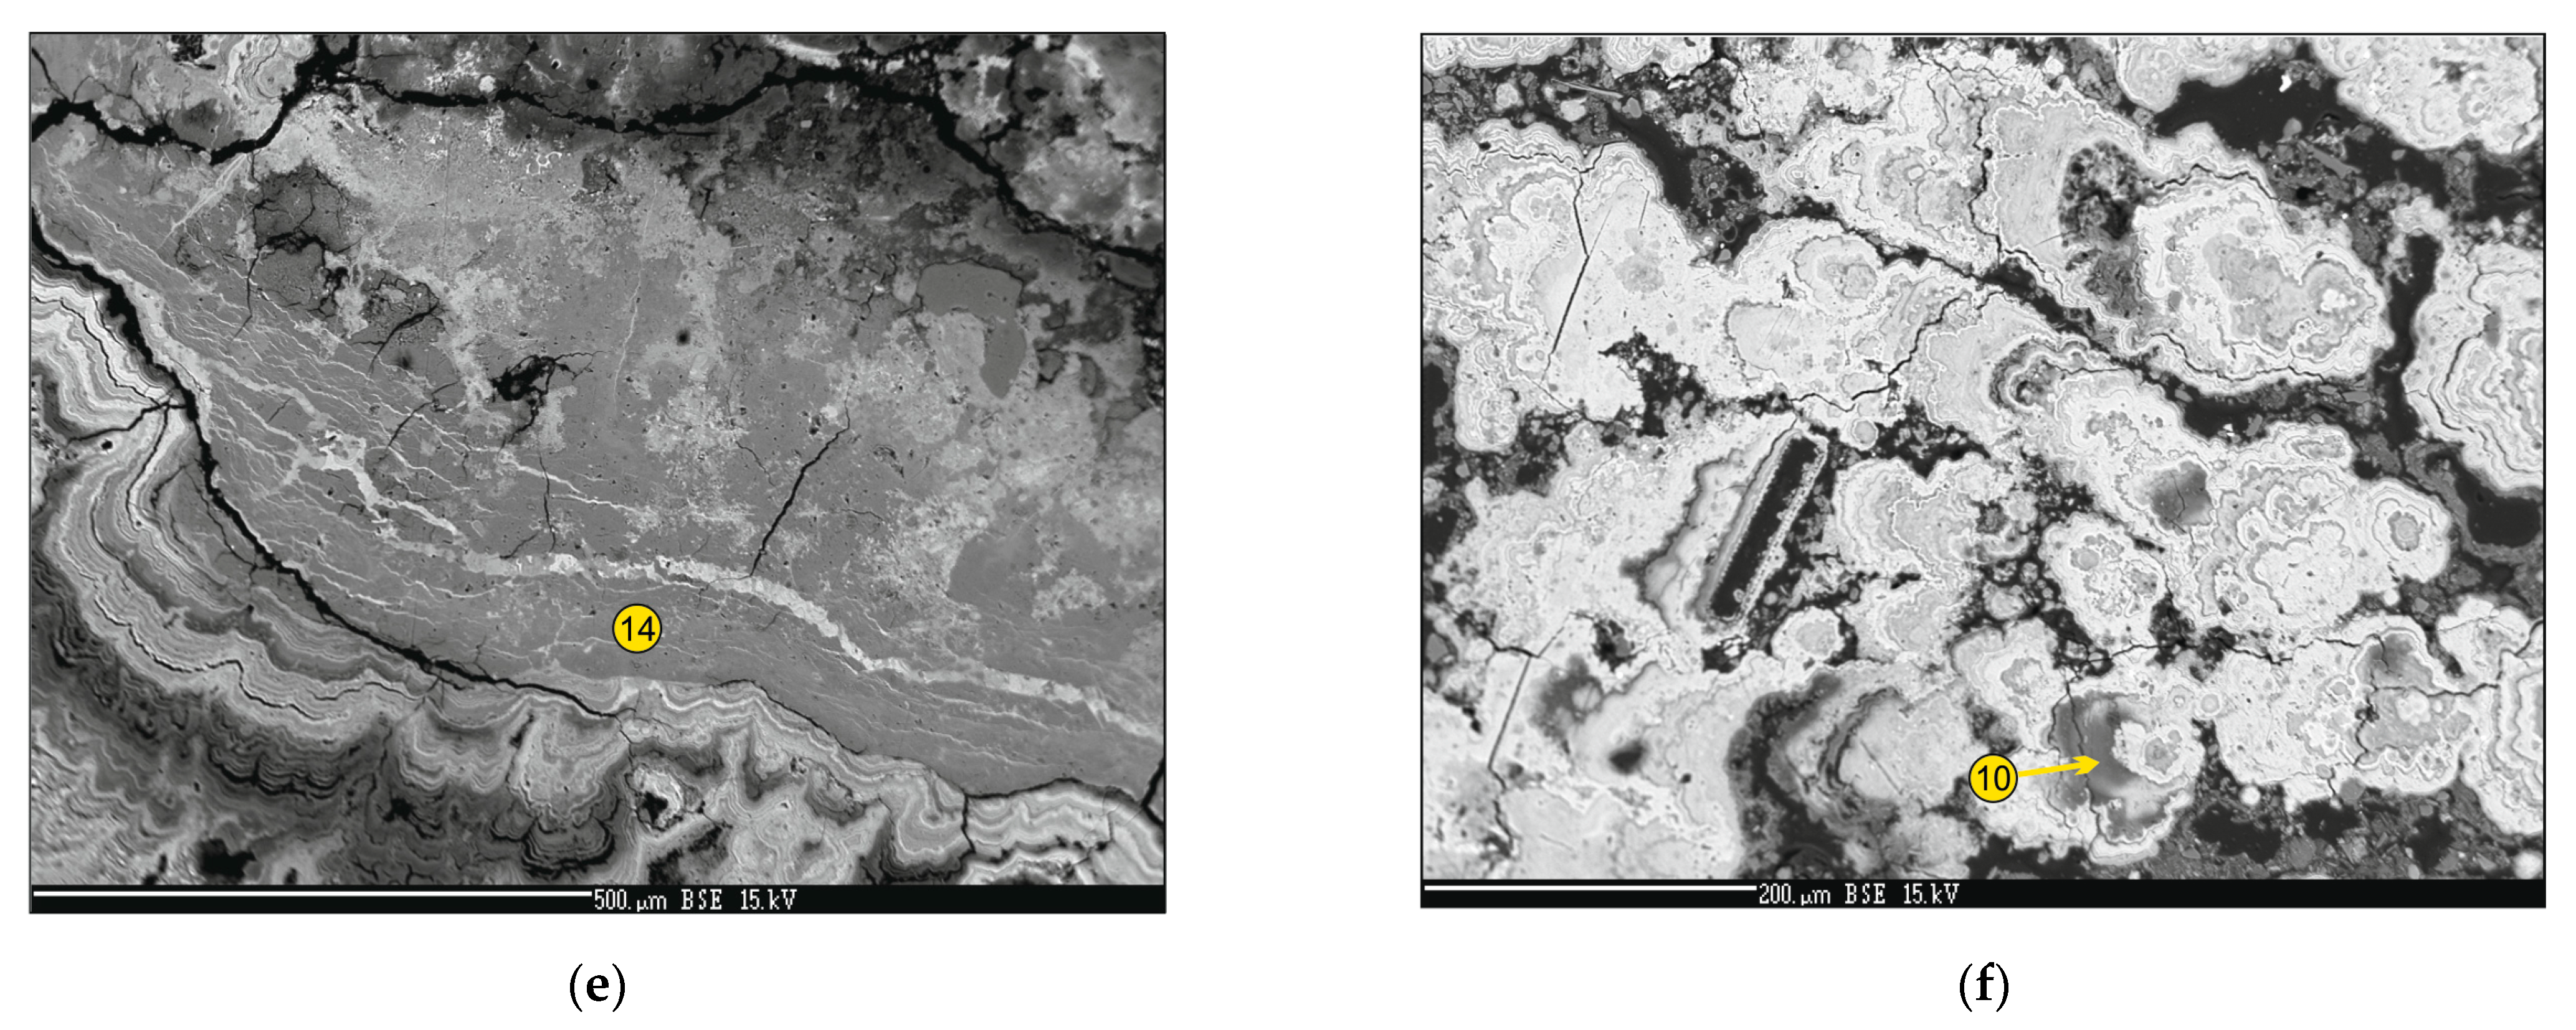
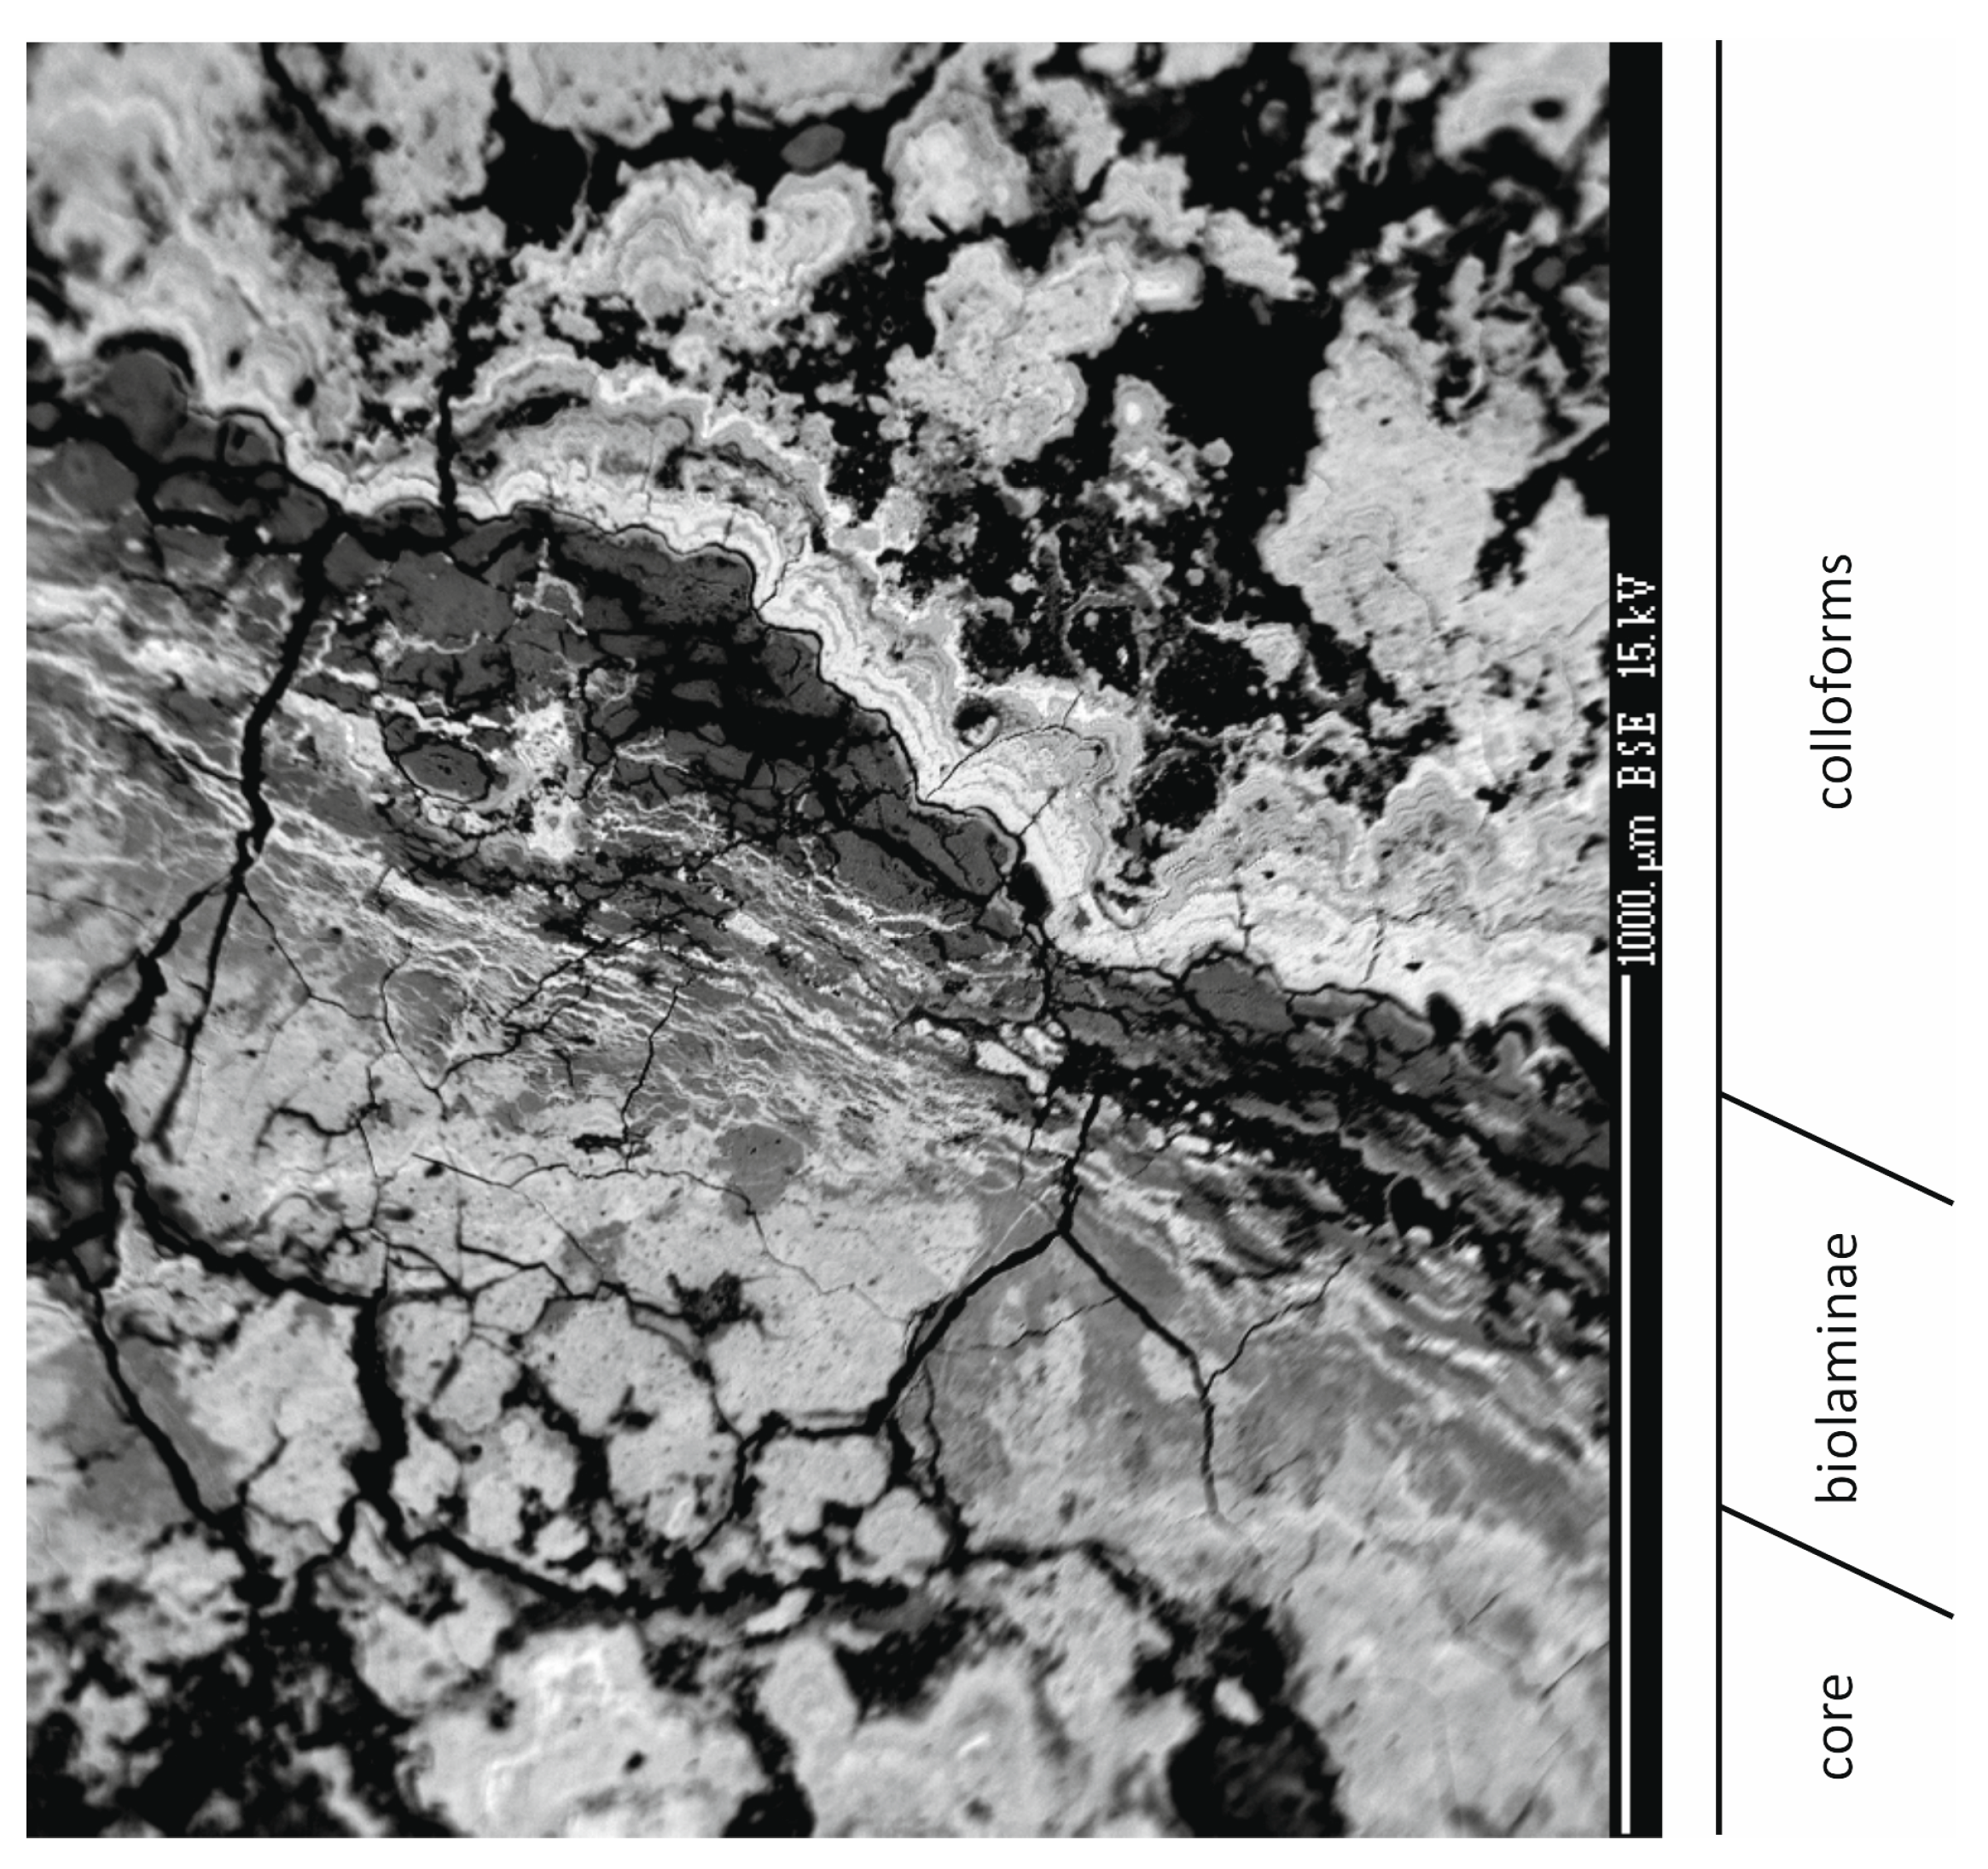
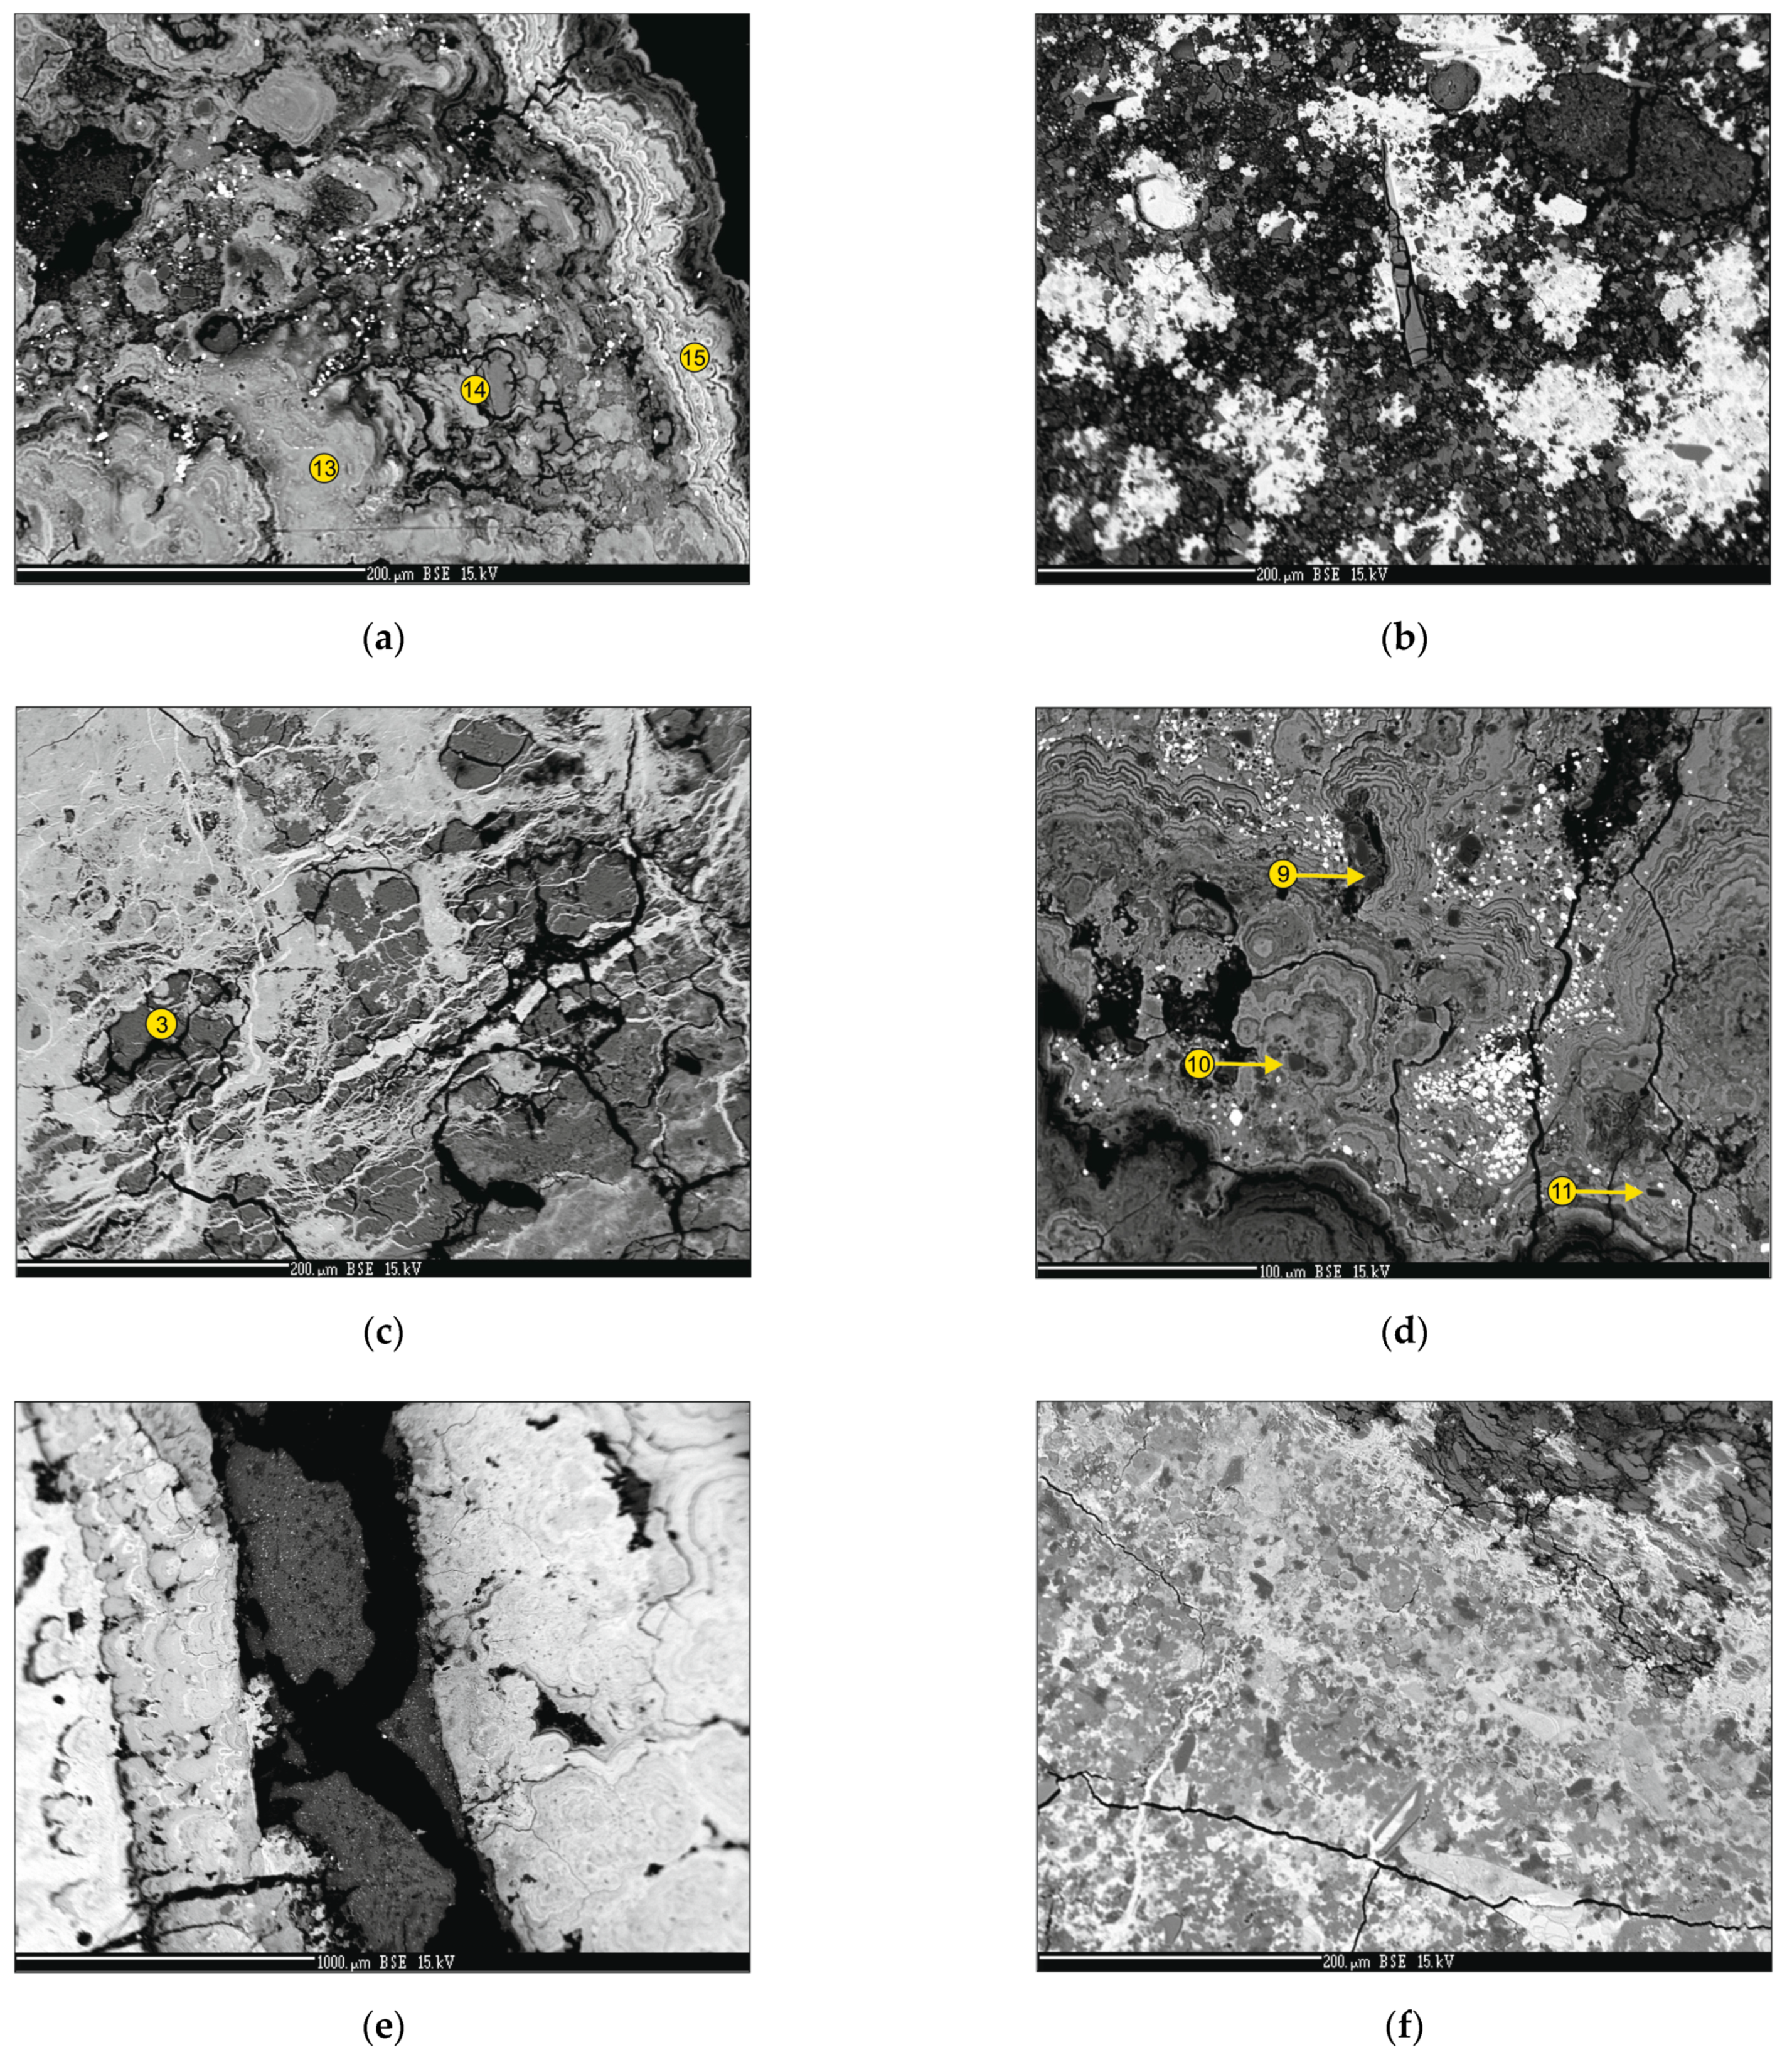
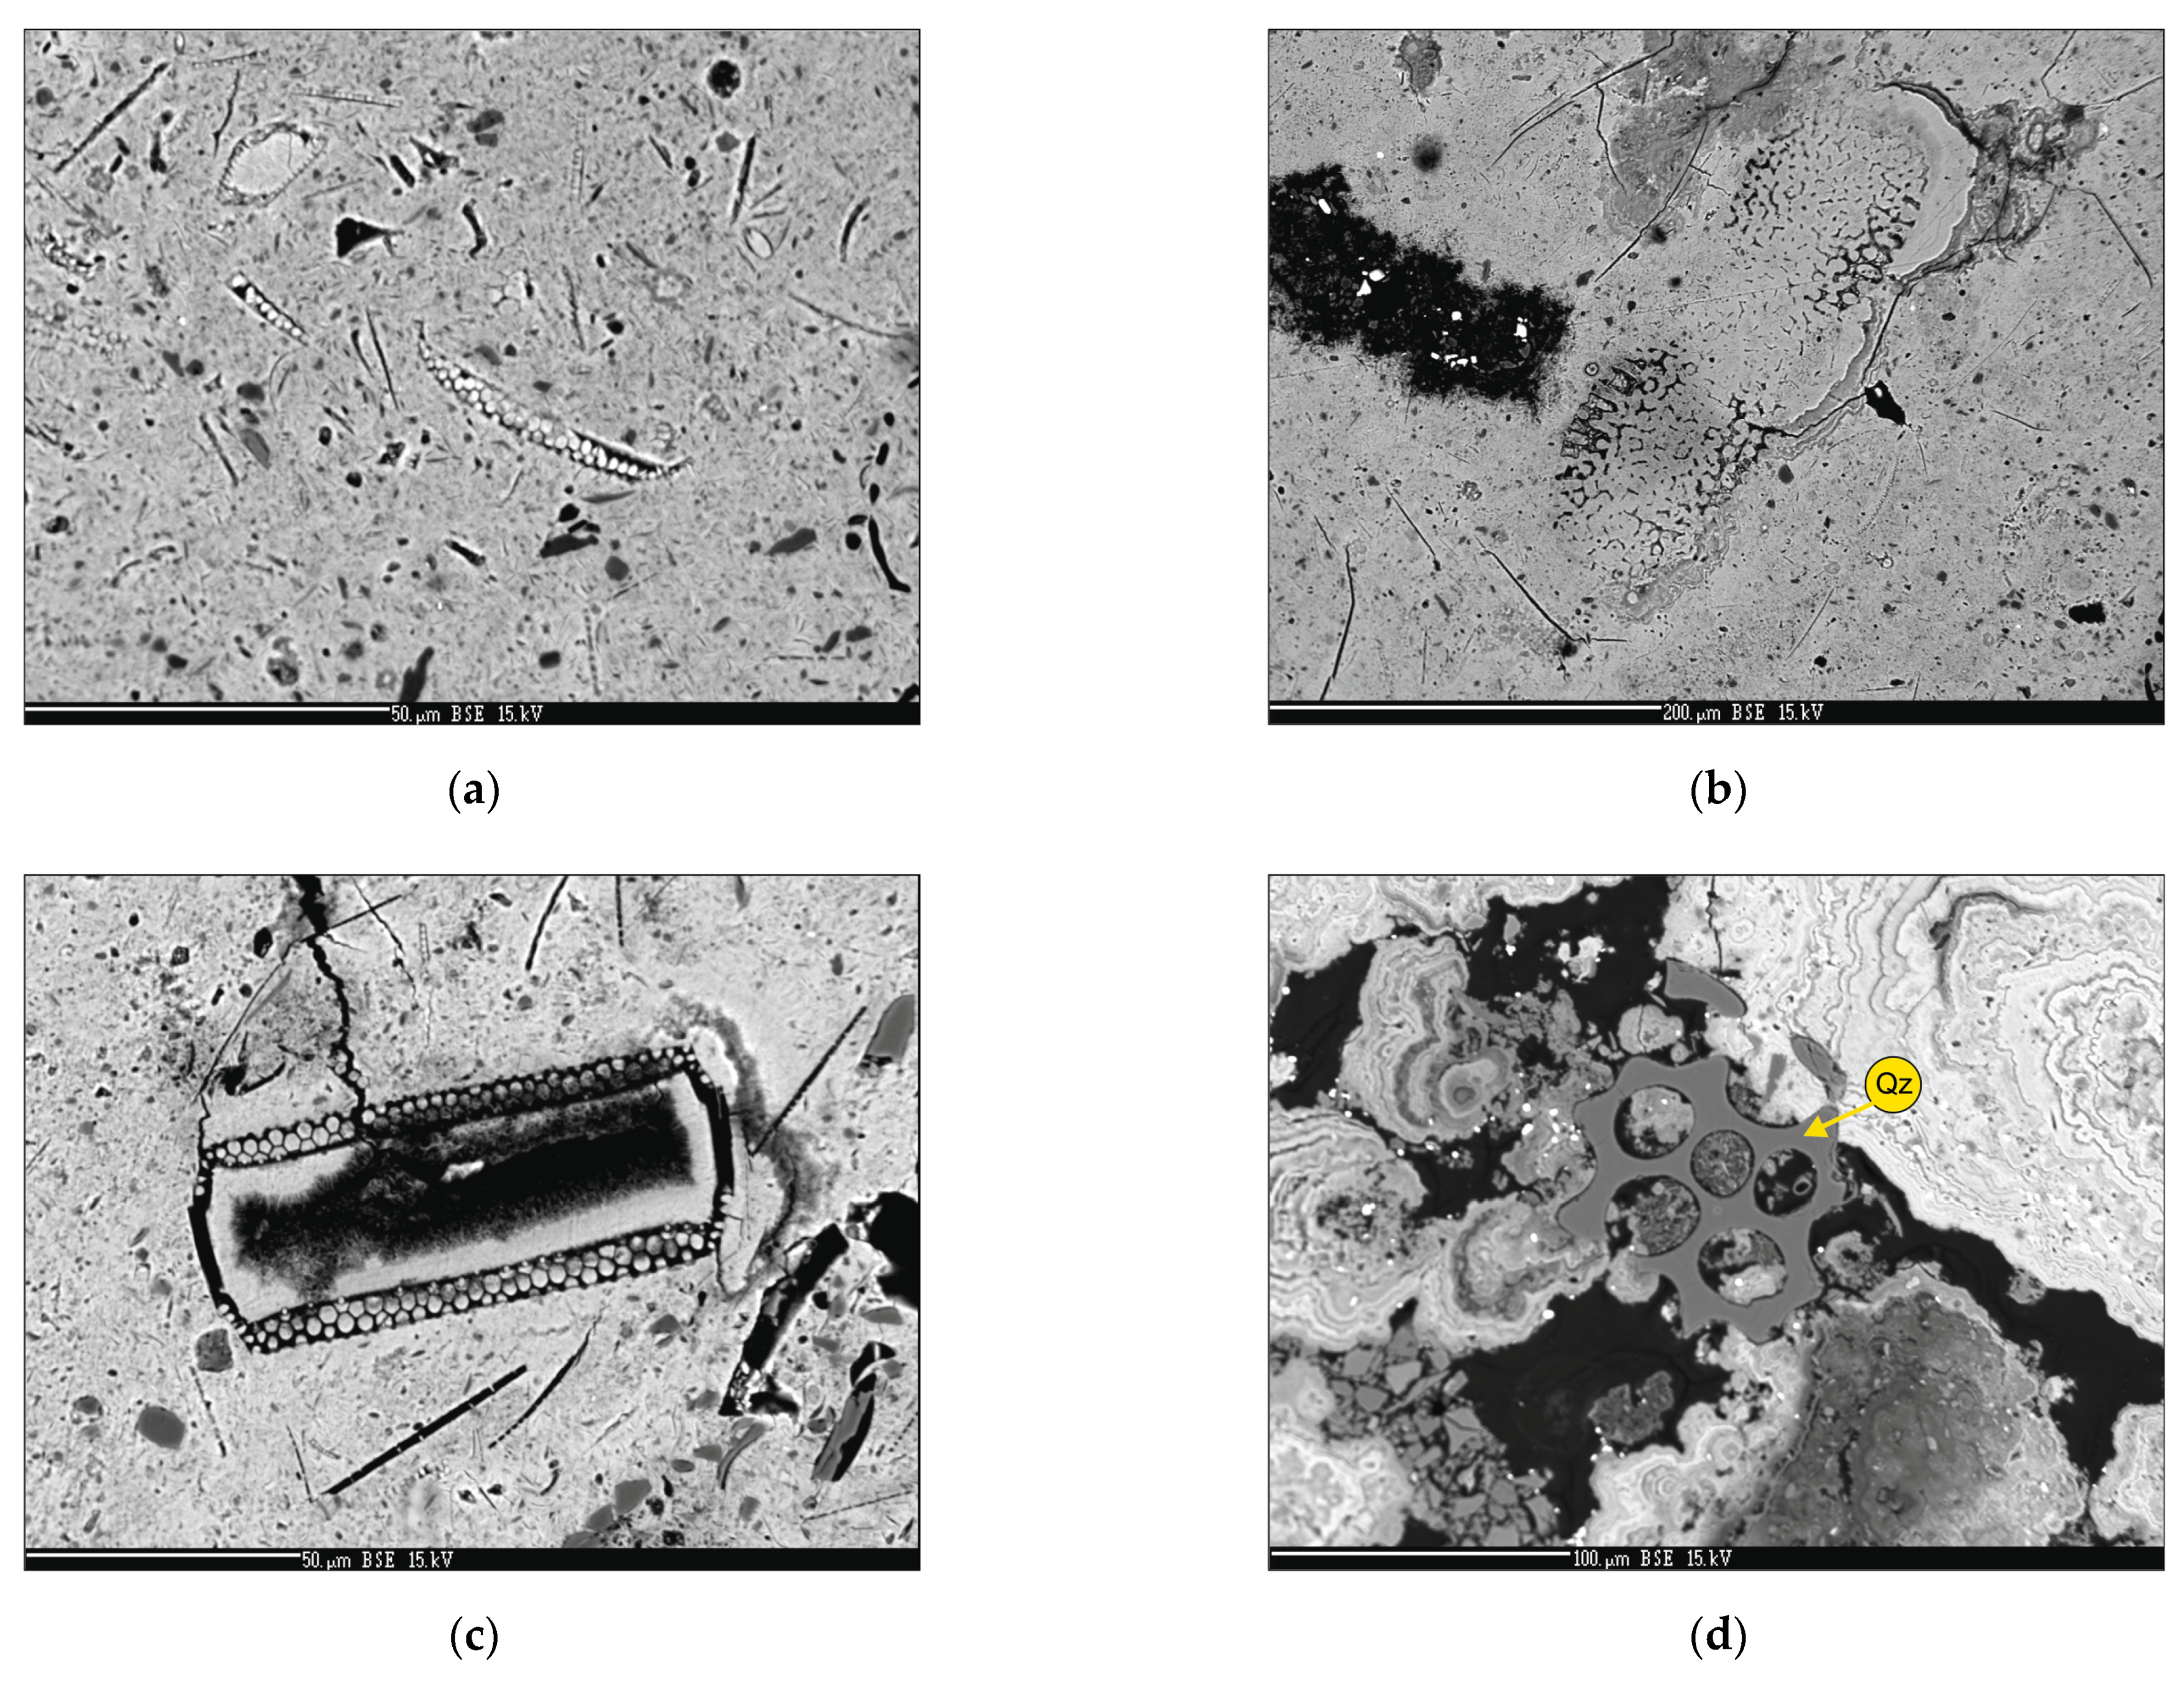
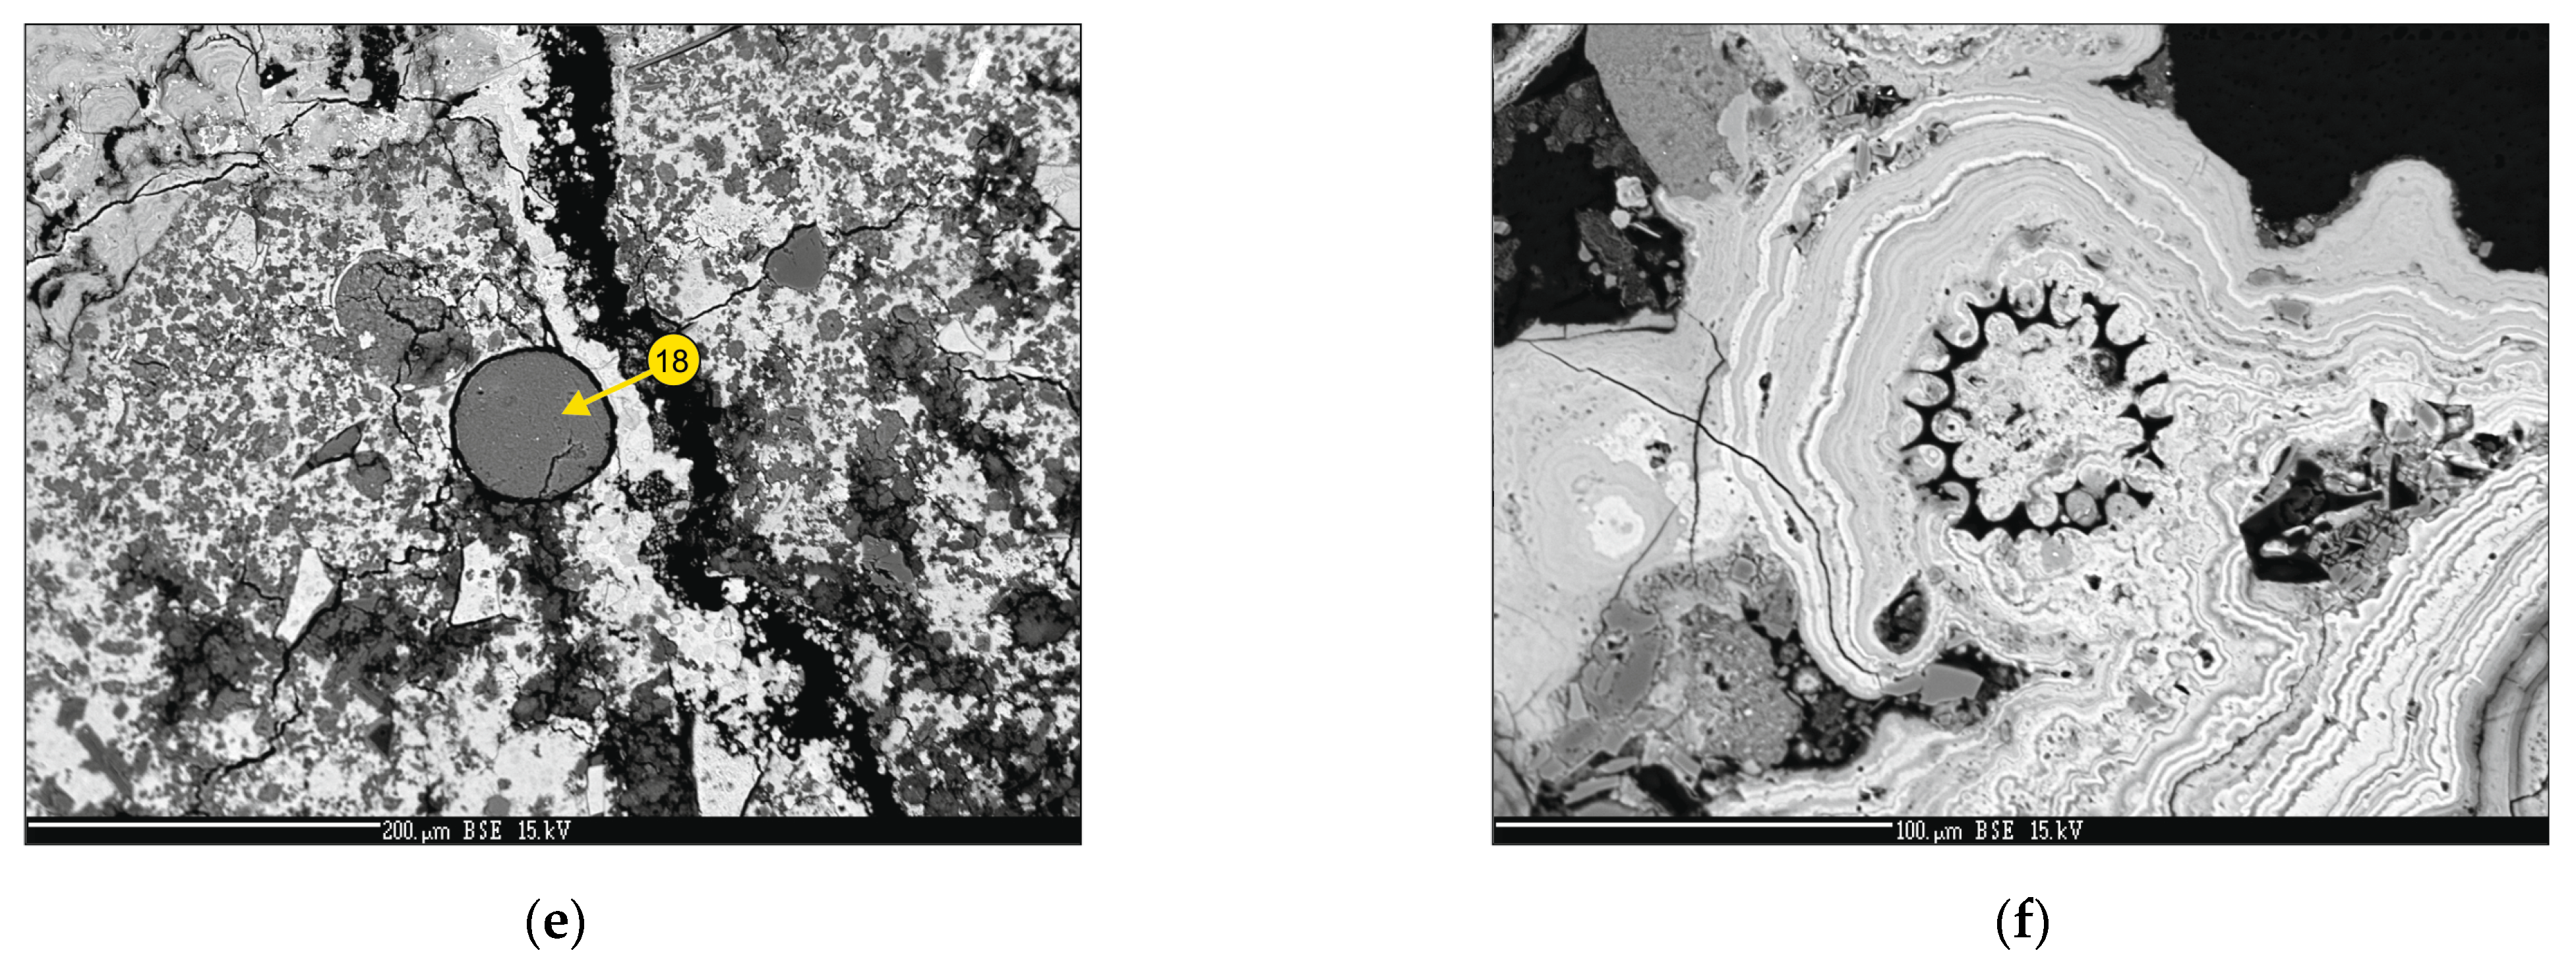
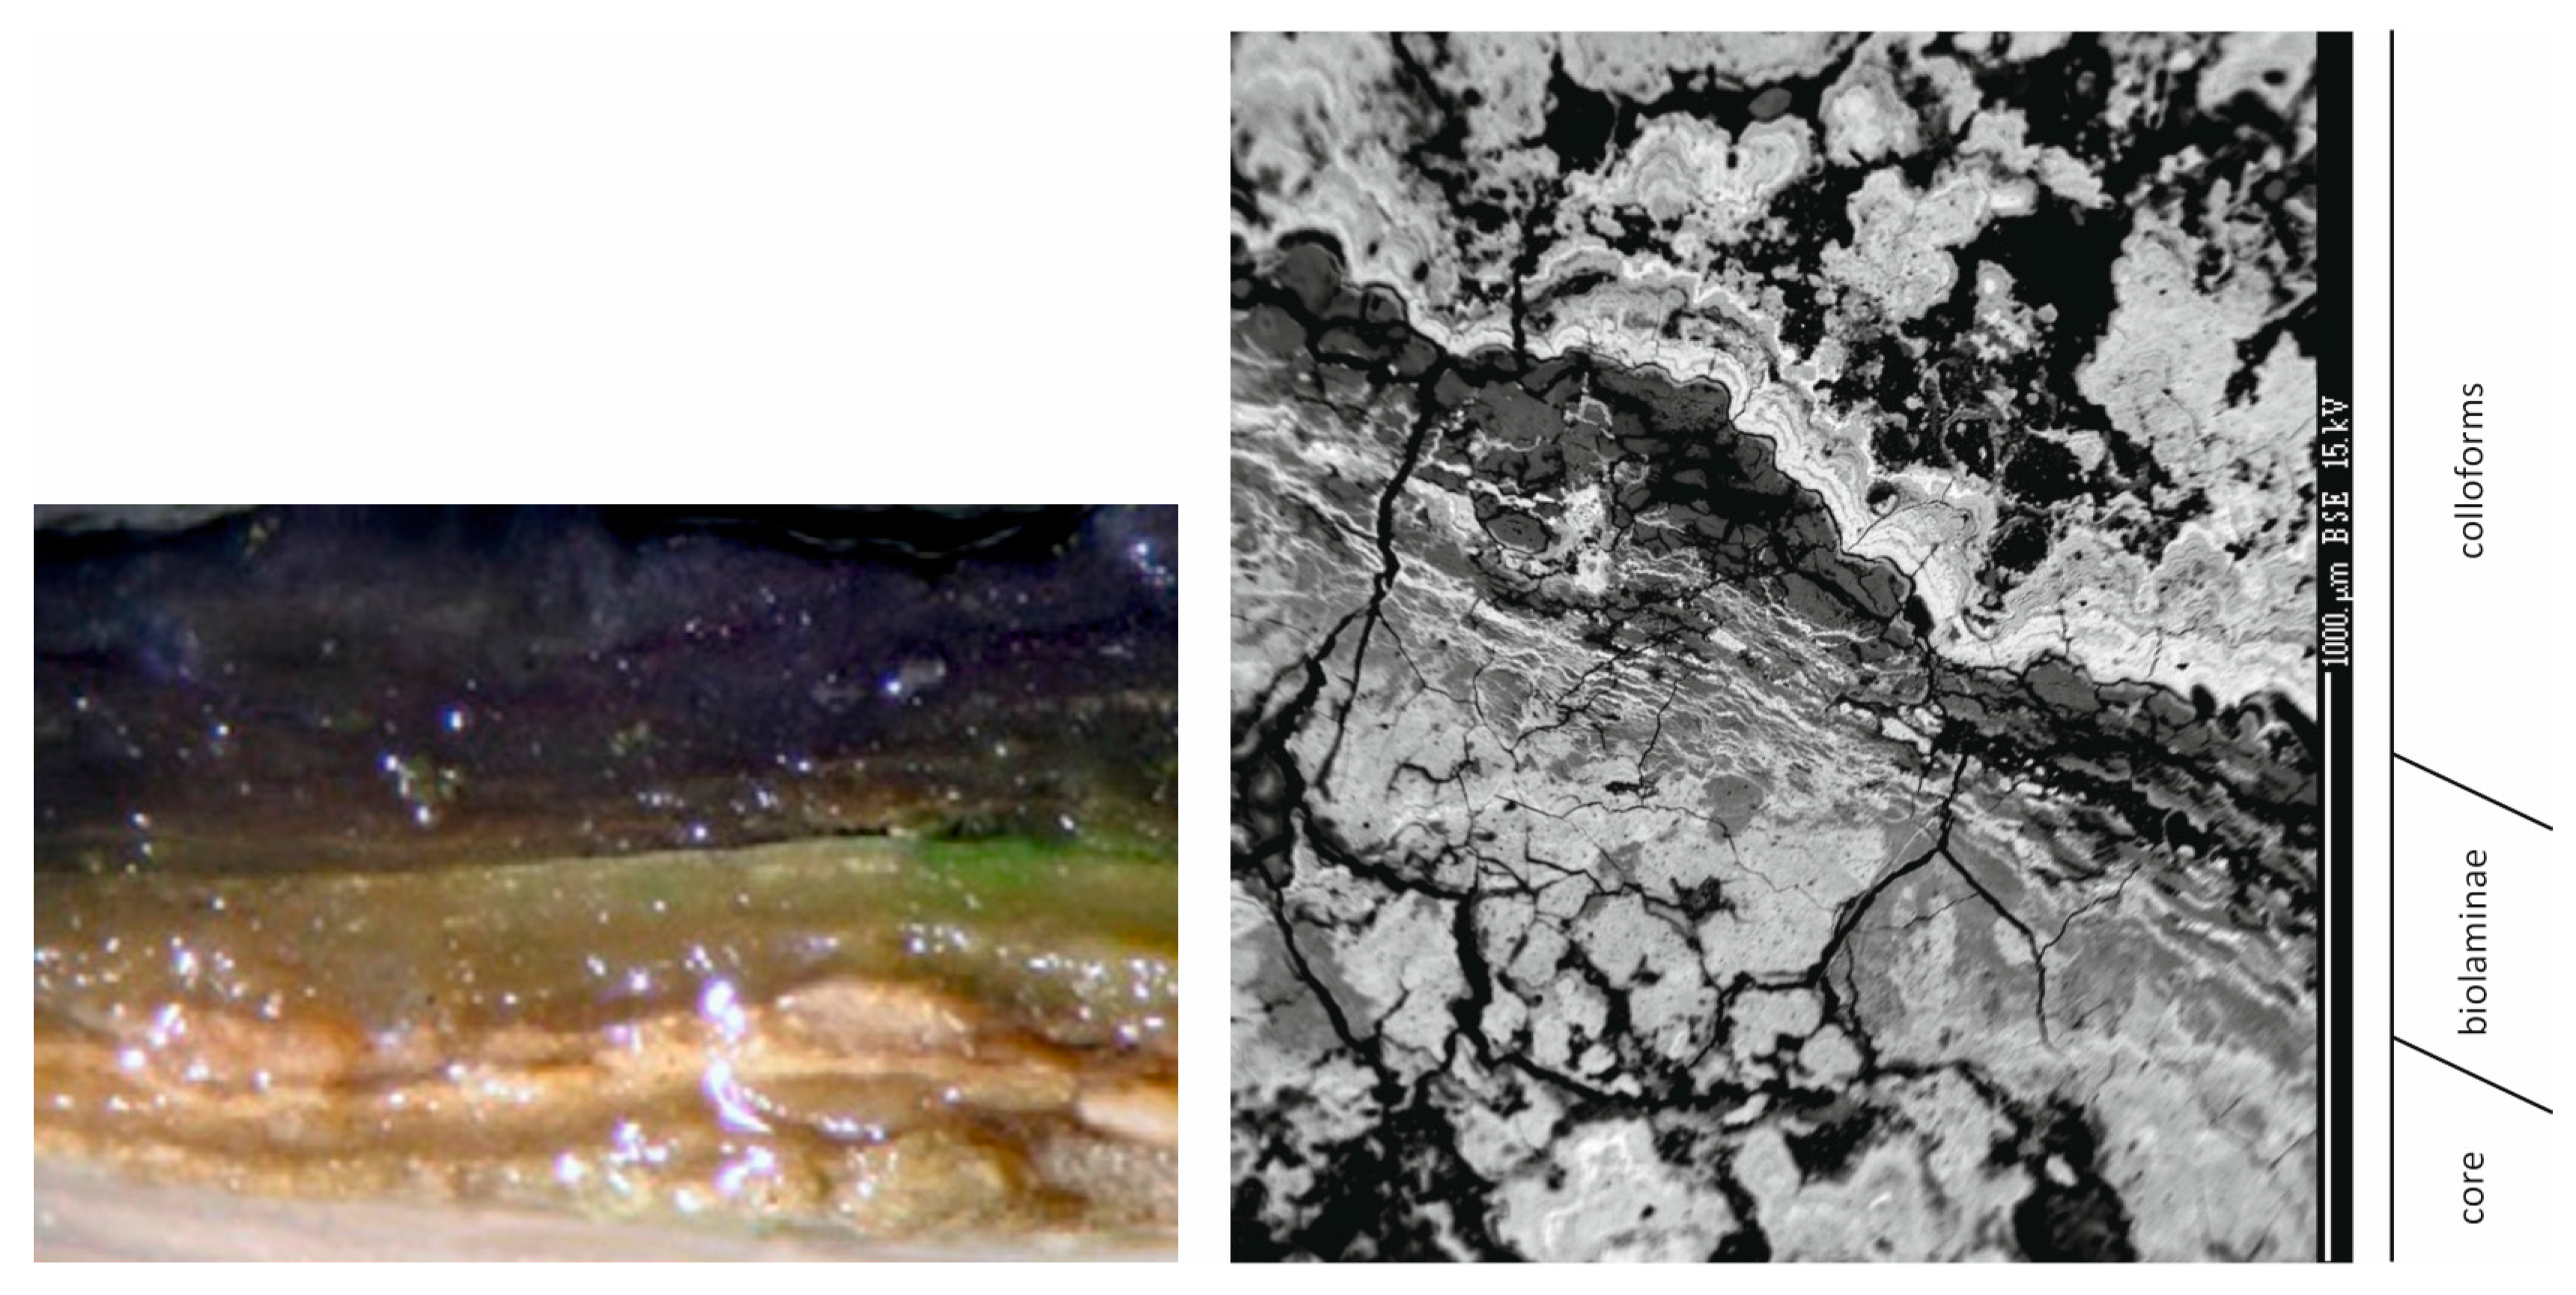
5.3. Textural Features
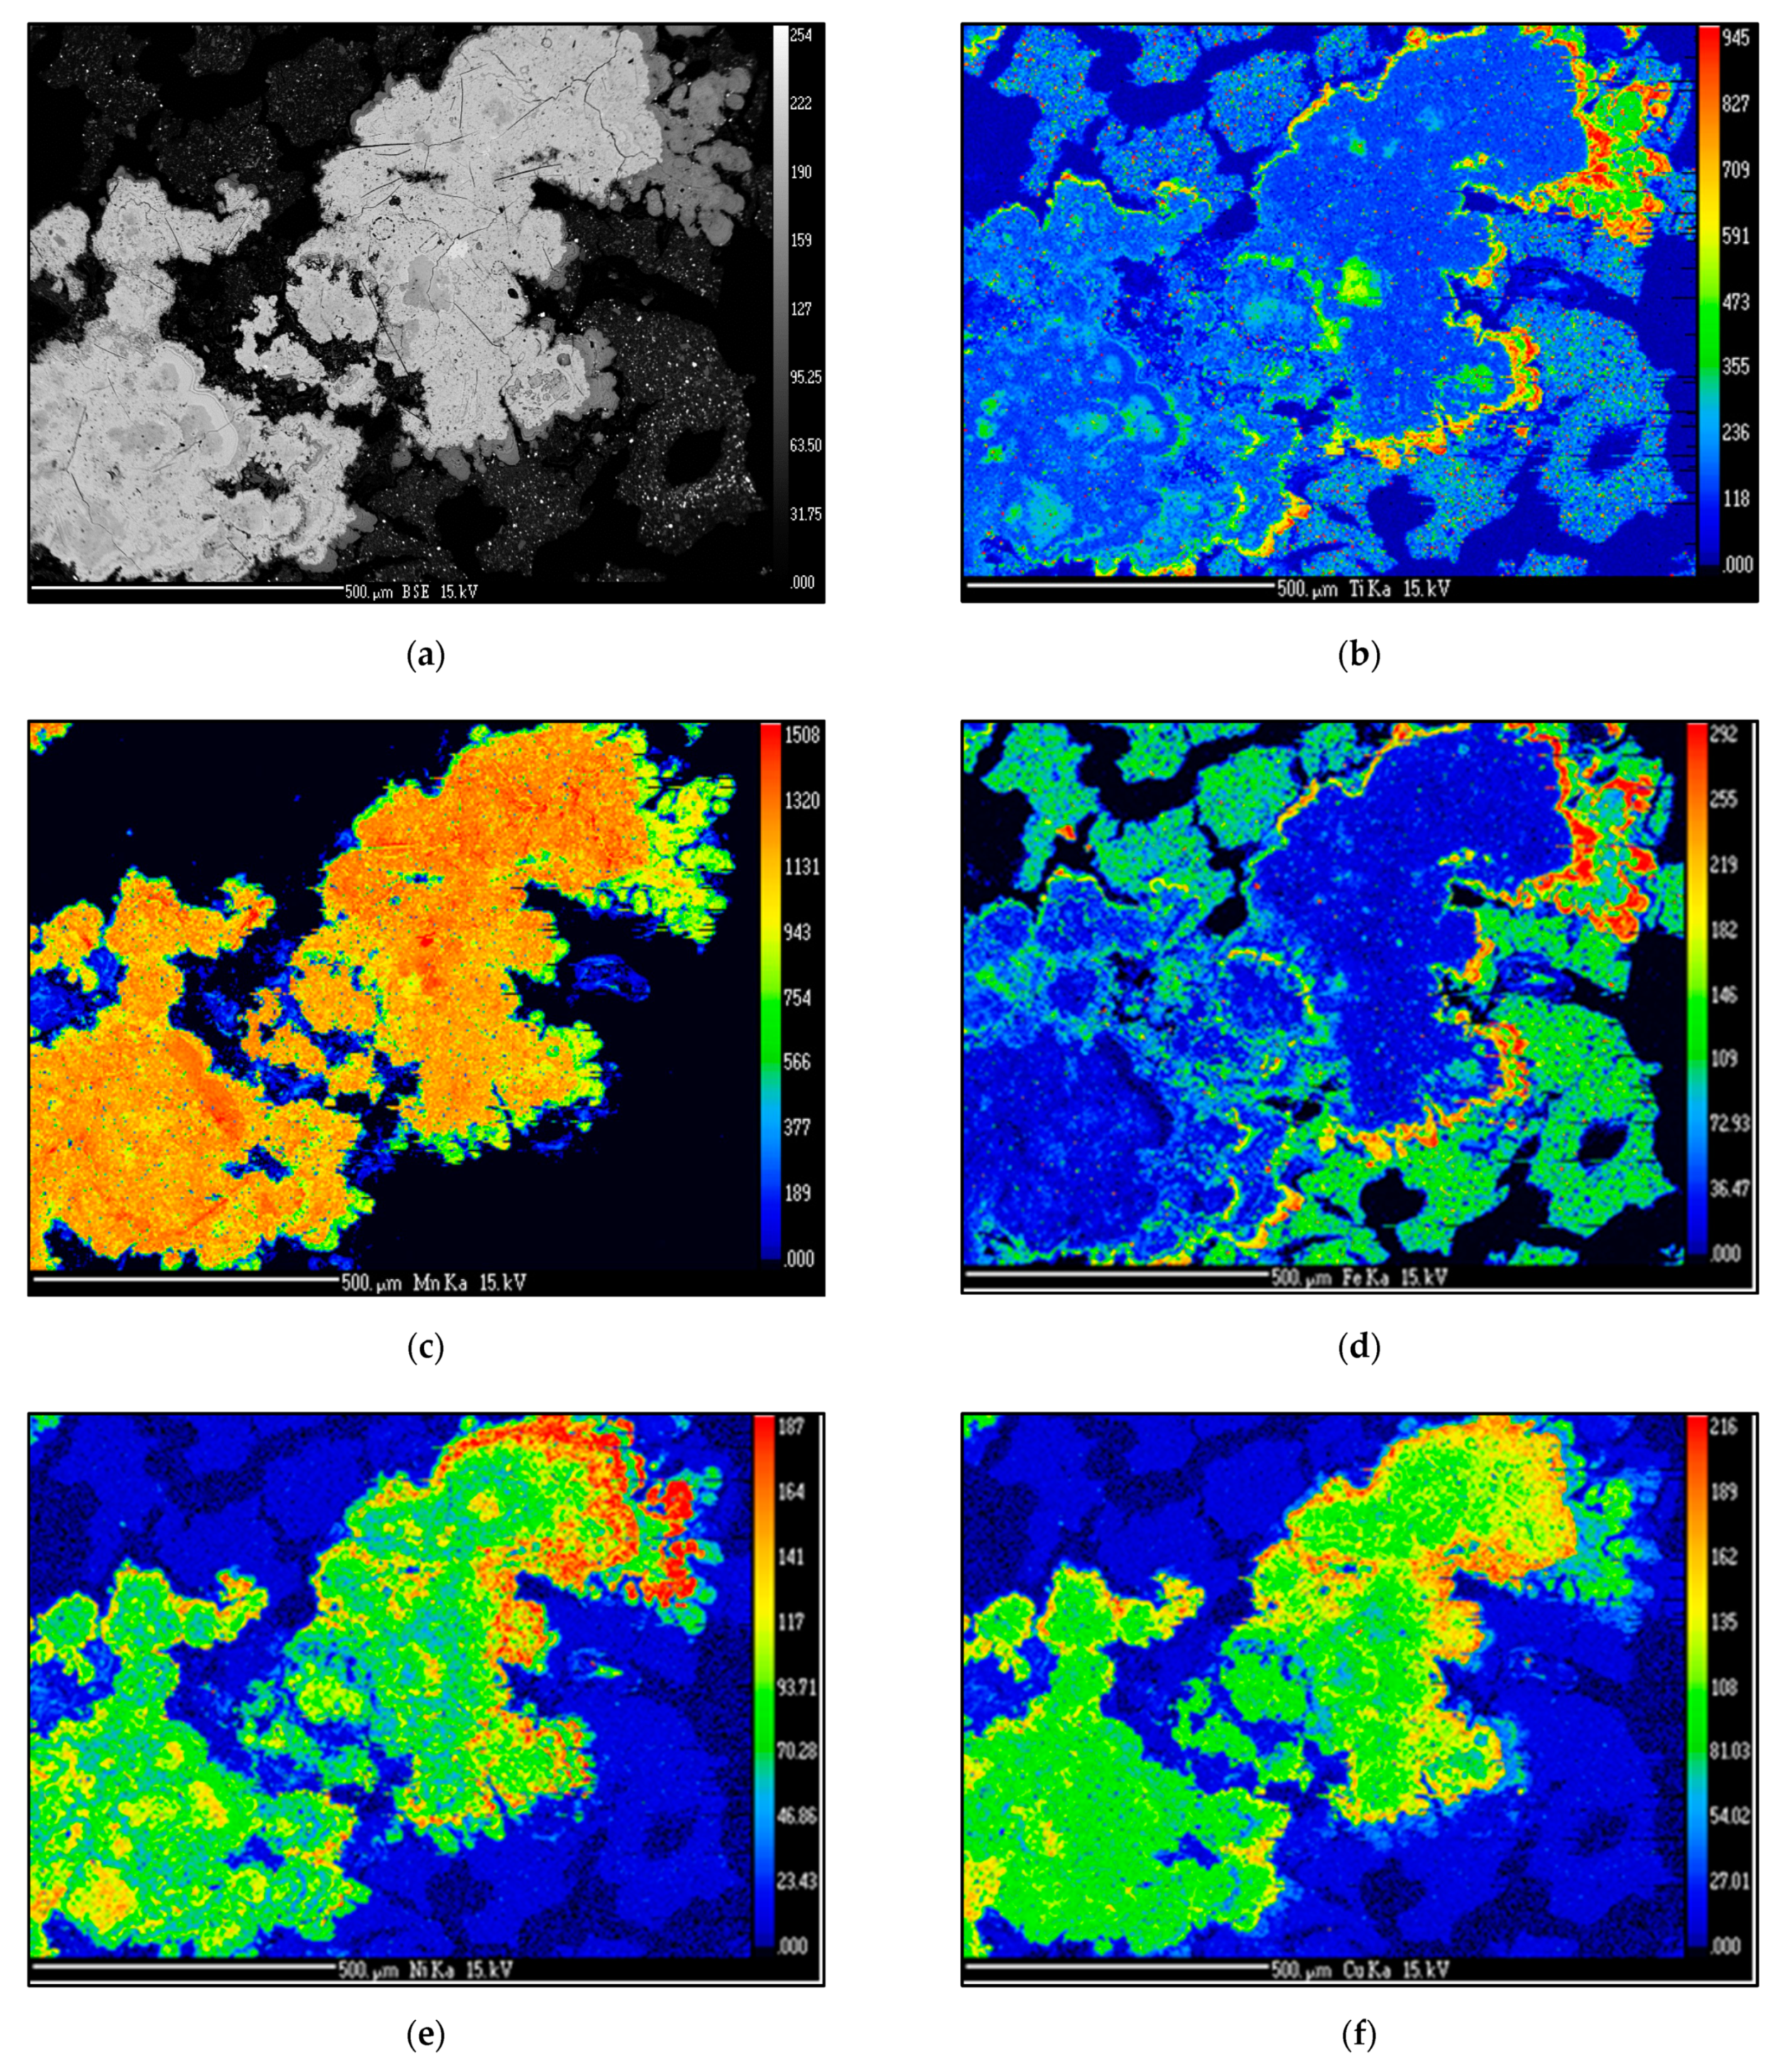
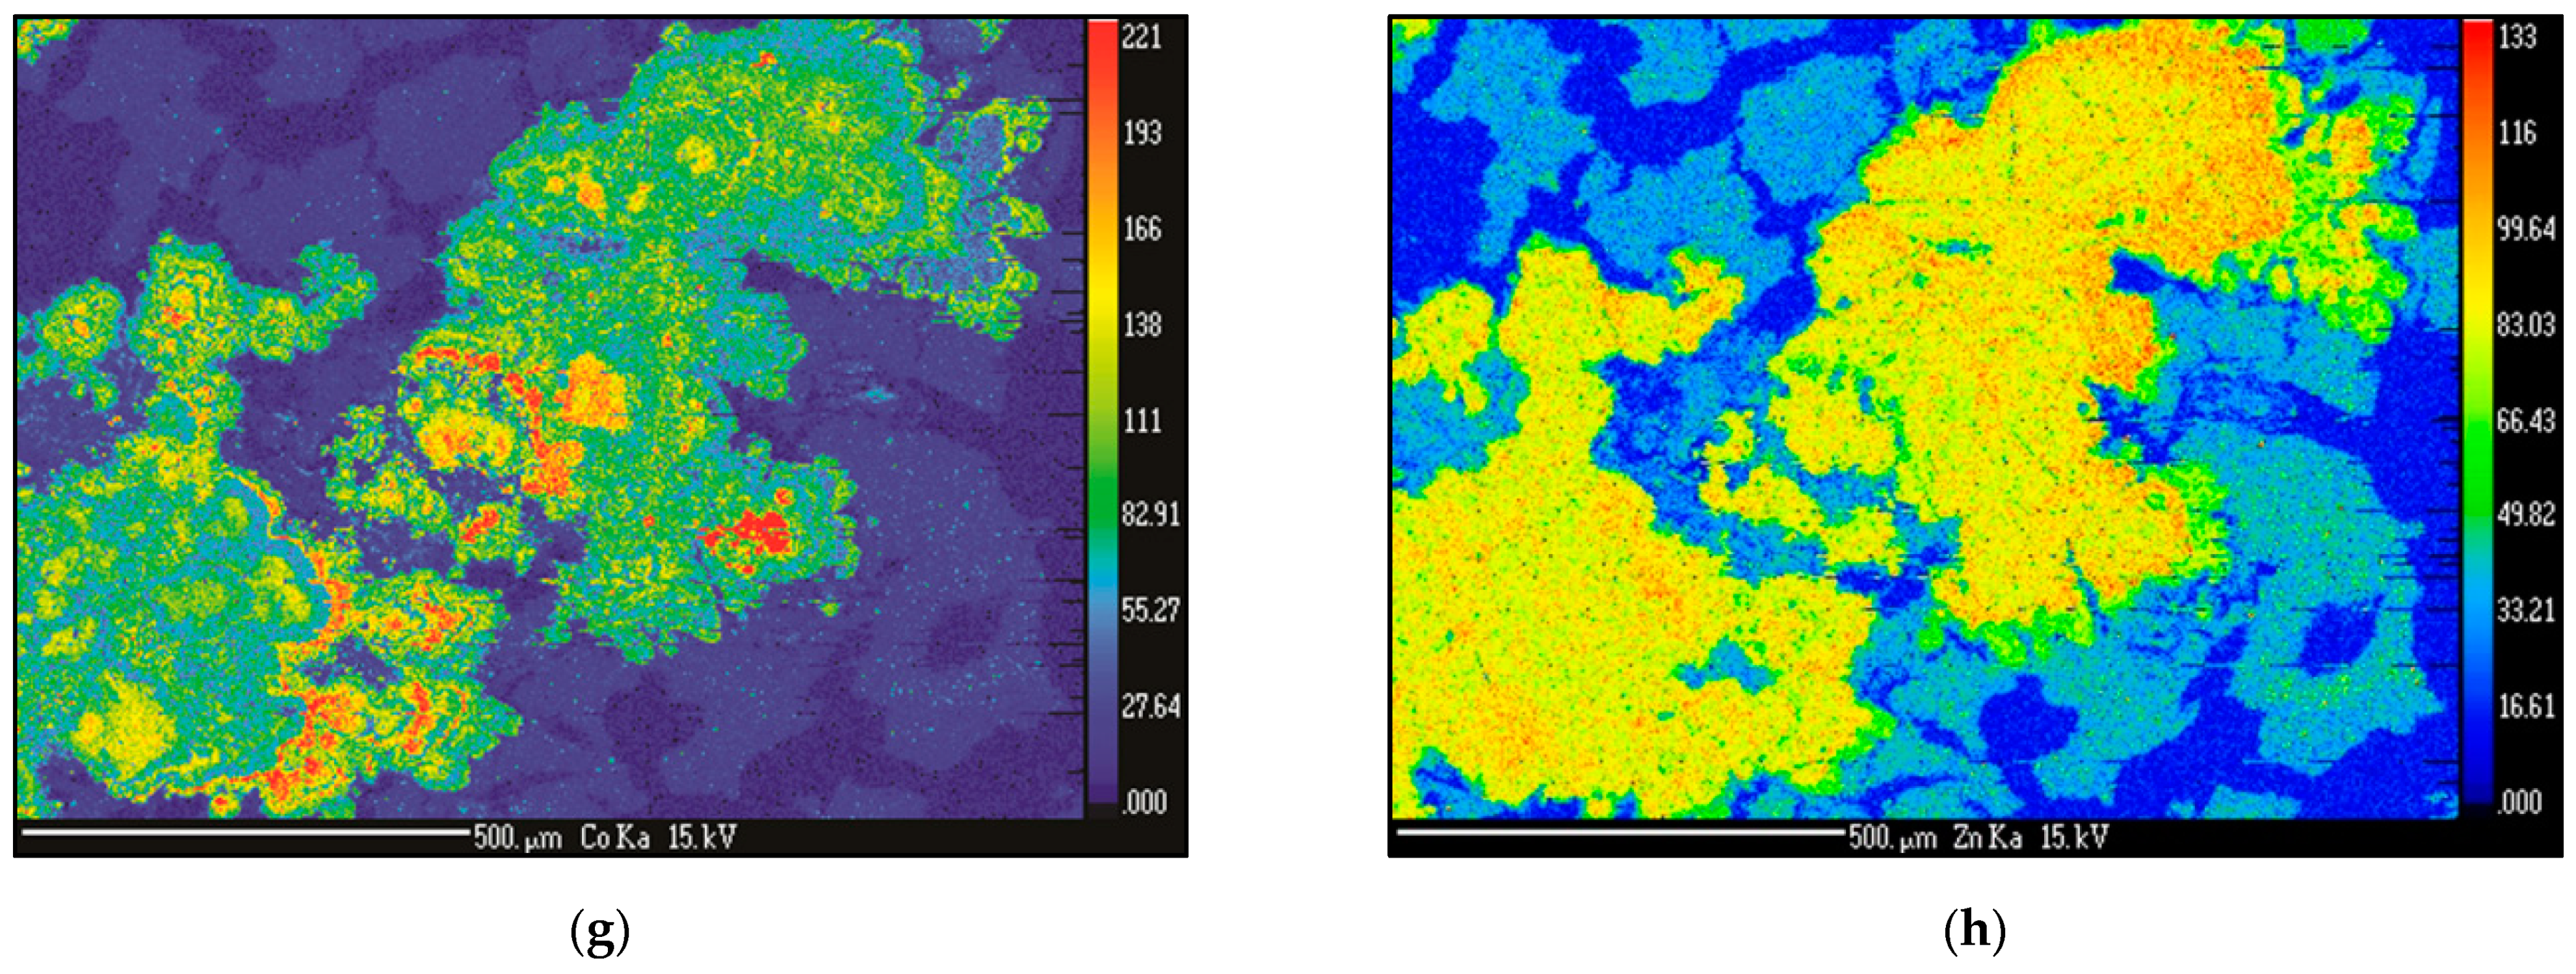
The analyzed polymetallic nodules consist of a core concentrically overgrown by laminae (microlayers) and areas of lithified detrital materials. The core, the laminae, and the detrital material were considered separately. The core is composed of either fragments of ancient nodules (here, Mn-Fe laminae are clearly visible) or fragments of rocks (an absence of laminae).
The growth structures (laminae) overgrowing the core developed as colloforms composed of precipitated Mn-rich oxyhydroxides, mainly Ni–Cu-rich todorokite/10-Å phyllomanganates (buserite) and birnessite (Figure 5a–d). The number of laminae composed of vernadite is relatively low (e.g., Figure 5d). The internal microstructure of the nodules is also characterized by the presence of irregularly arranged Fe-rich clay minerals (potentially Fe-rich smectite or nontronite) and zeolites (in the Na-phillipsite type), as well as admixtures of detrital minerals (e.g., authigenic barite, feldspars, pyroxenes, zoisite, ilmenite, quartz, or chalcedony) and bioclasts. These components are often embedded in a Mn- or Fe-containing matrix within irregular zones between the colloforms. In some cases, clays and zeolites form massive infillings, as well as veins and veinlets (Figure 5e). In all the samples, traces of biogenic input were visible in the form of pseudomorphs of siliceous microfossils, mainly diatoms and radiolarians (Figure 5f).
The growth structures adjacent to the nodule core differ in their microtextural features from Mn-Fe microlayers forming botryoidal (microglobular) textures. These developed as parallel, thin laminae, separated by planar spaces, filled in with cement (Figure 6). Their architecture is far less complicated; no cauliflower-like protuberances were observed. The thickness of their sequence is very small compared to the thickness of the sequence of colloforms. Often, these are cut by fissures and cracks.
Massive (lithified) detrital matter, diagenetically altered, was observed in most of nodules, filling in the spaces between the colloforms and often mixed with Mn-(Fe) oxyhydroxides (Figure 7b,c,f). Here, well-formed crystals of barite are clearly visible. Barite is developed as loose euhedral crystals of a few micrometers in diameter trapped in hollows and open cracks of cutting nodules or on the irregular surfaces of colloforms (Figure 7a,d,e) often overgrown by reprecipitated Fe-Mn laminae.
The presence of biomorphic textures was observed in all the samples, mainly in the sections composed of pure Mn-rich oxyhydroxides, as well as between colloforms (Figure 8a–f). Single pseudomorphs and their groups occur especially frequently in the sections composed of massive and pure Mn oxyhydroxides and of intermediate-to-low contents of metals such as Ni, Cu, or Zn. The biogenic relics are usually well-preserved and non-crushed. The interior of the phantoms is usually filled with highly porous and well-crystallized nanoneedles of pure and metal-depleted Mn oxyhydroxides (Figure 7c); however, massive bright colloforms rich in Cu and Ni are also associated with some organic remnants (Figure 8f).
The nodules are characterized by secondary fissures and microcracks. They either appear parallel to the laminae (concordant) (Figure 5a–e) or cut through them at different angles (Figure 6 and Figure 7c–f). Some cracks are arranged radially from the center to the outer edge of the nodule. They can be in the range of a few micrometers or can extend several centimeters with a thickness of a few millimeters. Mostly, these are parallel-sided cracks (sensu [62]), which can be straight or curved. In the latter case, they often reproduce the primary structures of the individual laminae of colloforms as a separation plane (joint planes). Some of crevices are open, and the others are filled with fine, lithified, diagenetically modified sediment and detrital matter; others have been healed (cemented) with Mn oxyhydroxides sprouting in the fissures.

5.4. X-ray Mapping

The X-ray mapping conducted during the EPMA confirmed the diffusive metals redistribution amongst the various types of colloforms (Figure 9a–h). The highest contents of the metals such as Ni and Cu were measured in the external Mn colloforms, as well as in some loose, internal, and well-developed colloforms (Figure 9c,e,f). The internal parts of growth structures usually show the highest concentration of Mn; however, the associated metal content is rather intermediate. The most external botryoidal layers are enriched with Fe, Ti, and Co, which is typically associated with Fe-rich Mn oxyhydroxides. The highest contents of Co were observed in the middle internal parts of the analyzed colloforms (Figure 9d,g). Zn is distributed rather uniformly in Mn-dominated colloforms; however, this also indicates increased contents toward the external layers (Figure 9h).

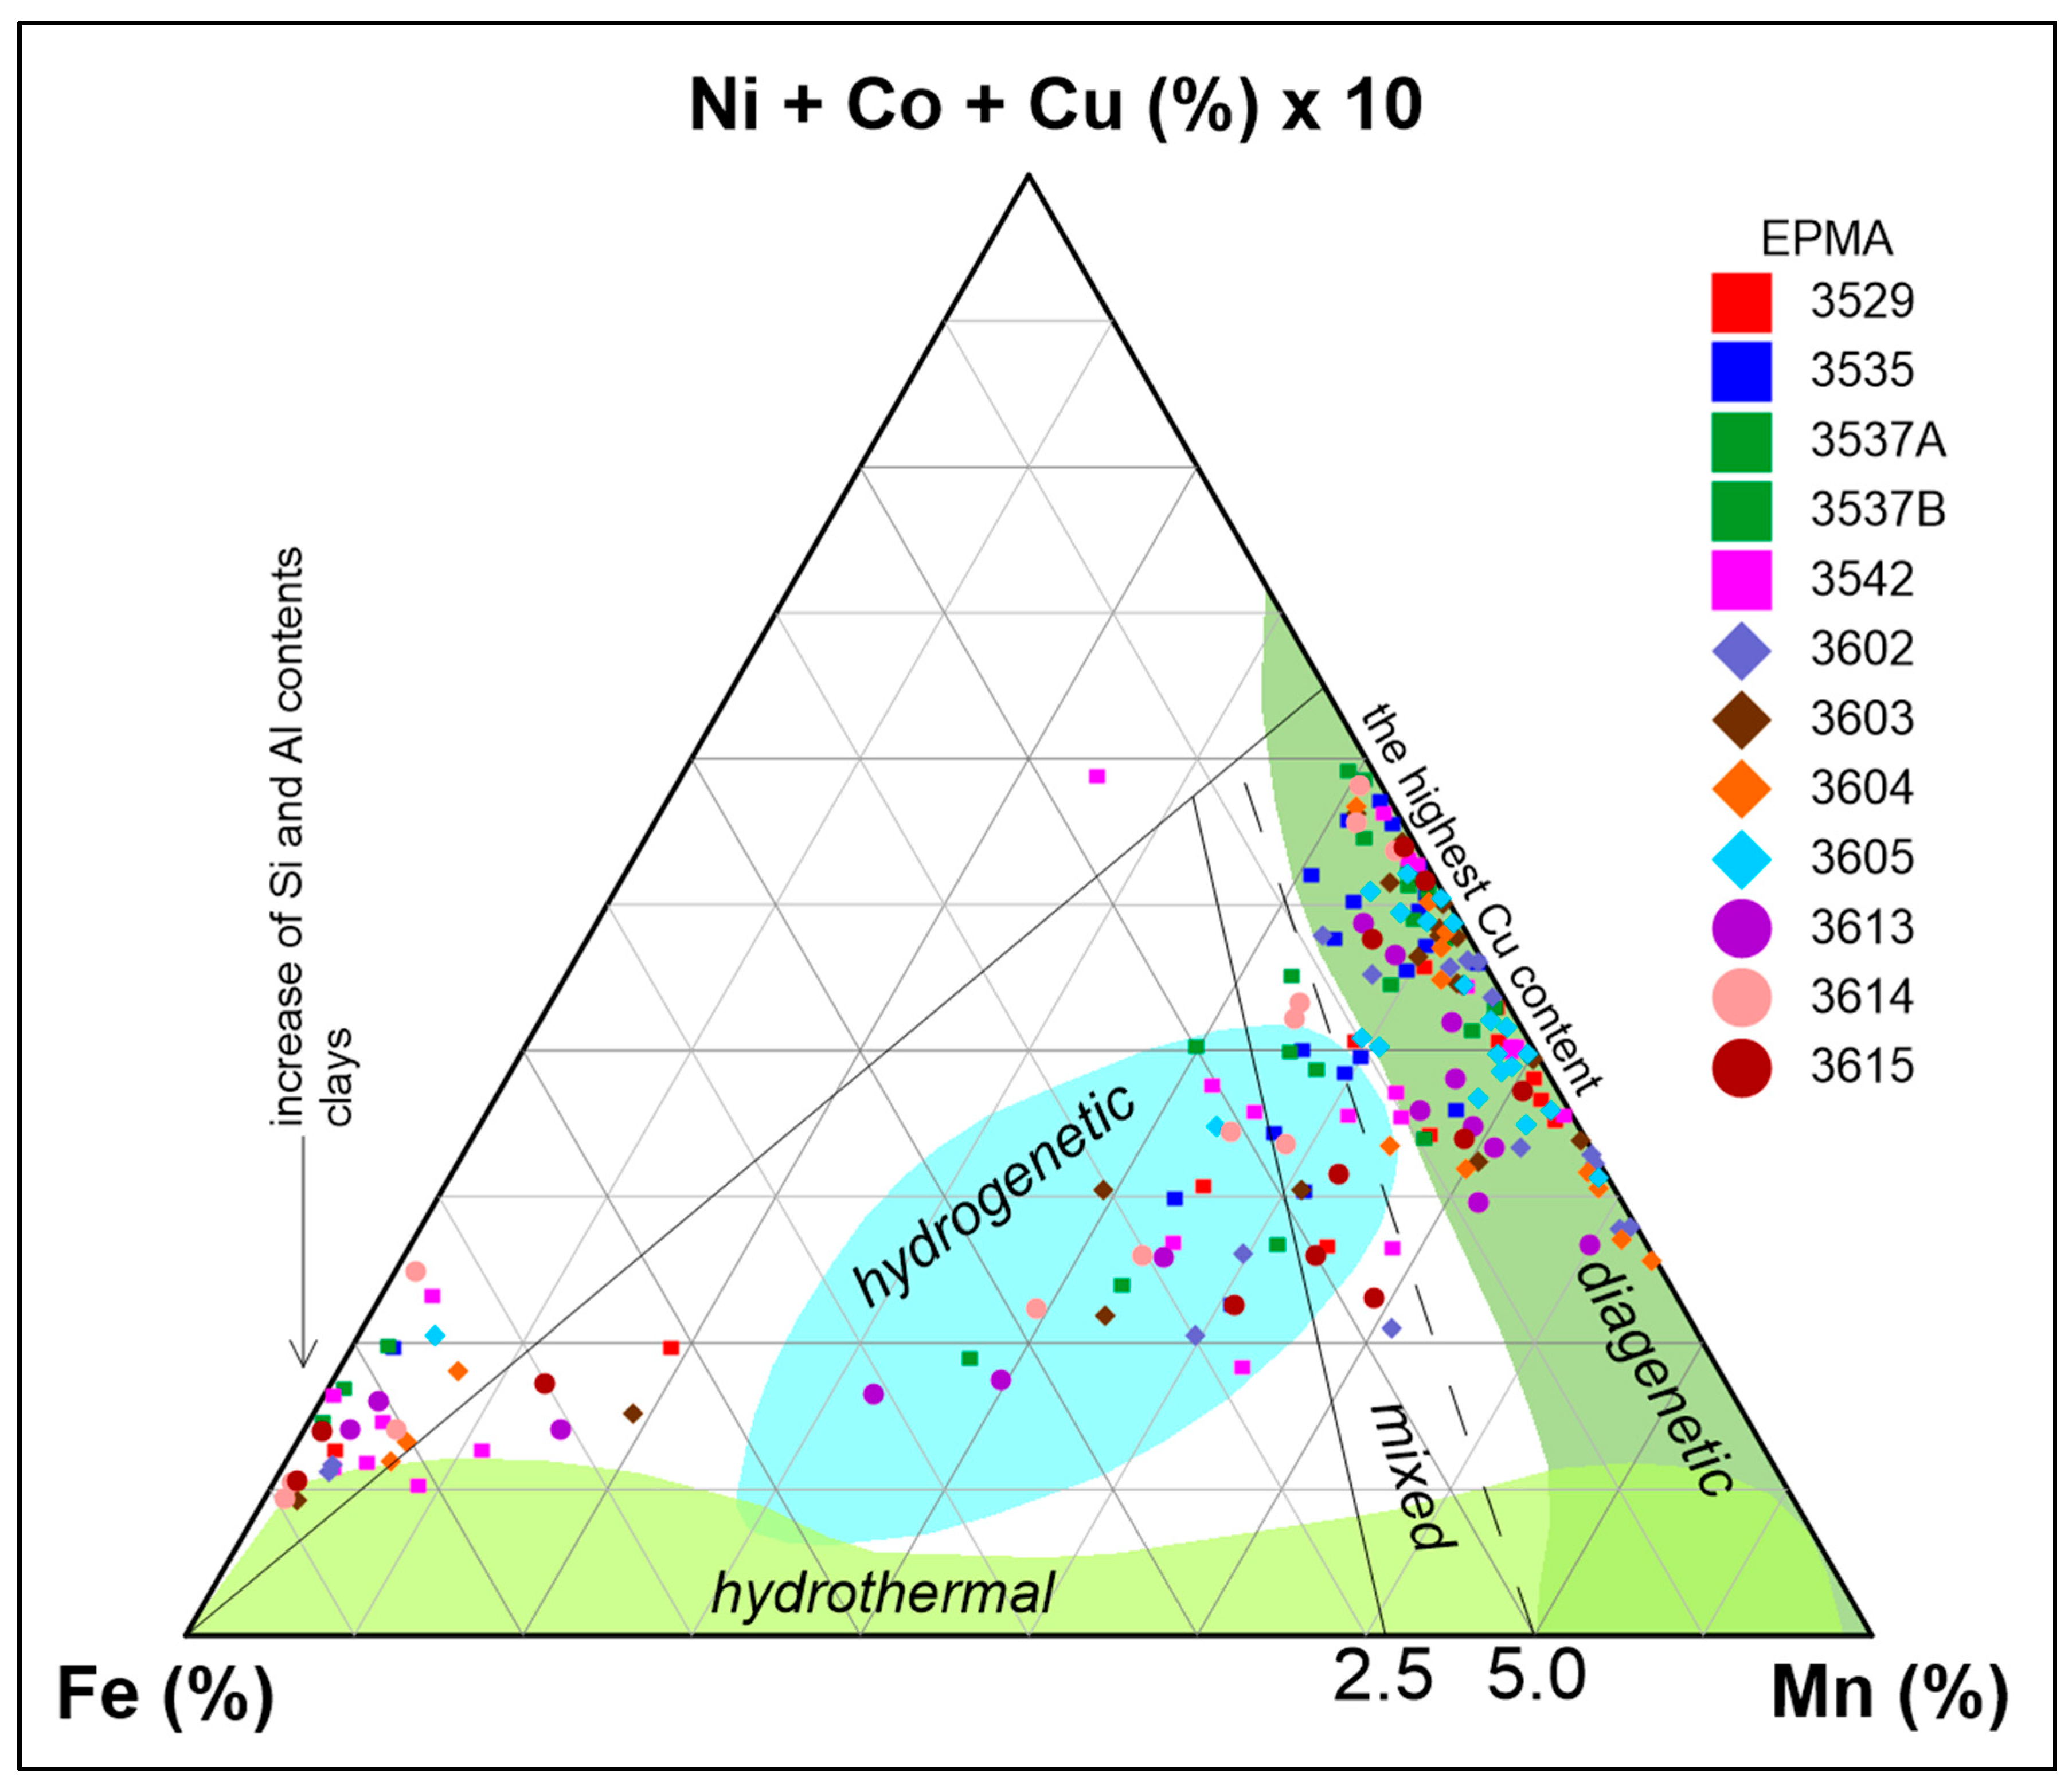
5.5. EPMA Geochemistry

The results of the spot EPMA evidenced the nonuniform distribution of the metals in the nodules. Several of the measurement points were characterized by high concentrations of Mn in relation to Fe and were assigned to the traditionally defined diagenetic morphotype (Mn/Fe ratio > 5; Figure 10). The measurements typical for hydrogenetic or mixed (hydrogenetic–diagenetic–biogenous) morphotypes, i.e., depleted in Mn in comparison to the diagenetic morphotype, were less frequent (Figure 10). The elevated contents of Fe (plots near the Fe edge; Figure 10) measured for nearly 30 points in all the analyzed nodules were associated with the intercalation of the clay minerals and other components of detrital origin (enriched with Si, Al, or alkali-alkaline metals).
In general, regardless of the internal differentiation of the nodules, the mean Mn and Fe contents varied from 19.6 to 38.9 wt % and from 3.2 to 8.3 wt %, respectively (Table 3). The mean Mn/Fe ratio was 5.37. The phosphatization level was low and varied from 0.11 to 0.29 wt %. The mean Si and Al contents varied from 3.2 to 12.0 wt % and from 0.9 to 3.8 wt %, respectively. The mean Si/Al ratio was 3.59. The low mean Ti admixtures (from 0.08 to 2.8 wt %) were associated with the detrital components (titaniferous magnetite or ilmenite).
Mg and Ca dominated among the alkaline earth metals; their concentrations ranged from 1.8 to 2.5 wt % and from 1.2 to 1.8 wt %, respectively. The mean K and Na contents were lower compared to those of Mg and Ca and ranged from 0.7 to 2.3 wt % and 0.8 to 1.4 wt %, respectively. The relatively high content of Ba was due to barite crystals (0.17 to 0.65 wt %). The mean Sr content was low and varied from 0.05 to 0.07 wt % (Table 3).
Among the economically critical metals, Ni and Cu dominated, with their mean contents varying from 0.60 to 1.52 wt % and 0.64 to 1.42 wt %, respectively. The mean EPMA contents of Ni and Cu were 1.15 and 1.08 wt %, respectively. The Co concentration varied from 0.06 to 0.31 wt %, averaging 0.20 wt %.
The hydrogenetic and mixed hydrogenetic–diagenetic nodules showed lower contents of ∑(Cu, Ni, and Co) compared to the diagenetic nodules, with concentrations varying from 1.54 to 2.07 wt %. Additionally, low contents of Zn were identified (mean = 0.14 wt %, varying from 0.07 to 0.19 wt %), as well as Pb, As, Cr, and V. The mean contents of S and Cl varied from 0.05 to 0.15 wt %, averaging 0.07 wt %, and from 0.09 to 0.72 wt %, averaging 0.24 wt %, respectively (Table 3).
The representative EPMA data of the recognized minerals and the mean EPMA geochemistry are shown in Appendix A and Appendix B, respectively.
The statistical interrelations between all the analyzed elements are shown in the hierarchical tree in Figure 11. Mn was related mostly to Ni, Cu, and Zn and to the alkali-alkaline representatives (Na and Mg; seawater and seafloor basalt influences). Fe showed close relations with Ag and Cr, as well as Si, Al, and K (associated with the clay and detrital components). Ba showed the highest correlation with Sr and V (organic origin). Co had important relationships with P, Pb, and Ti and less with Ca and As (influences related to the presence of apatite, detrital matter, or potentially low hydrothermal input). S was related mostly to Cl and F.

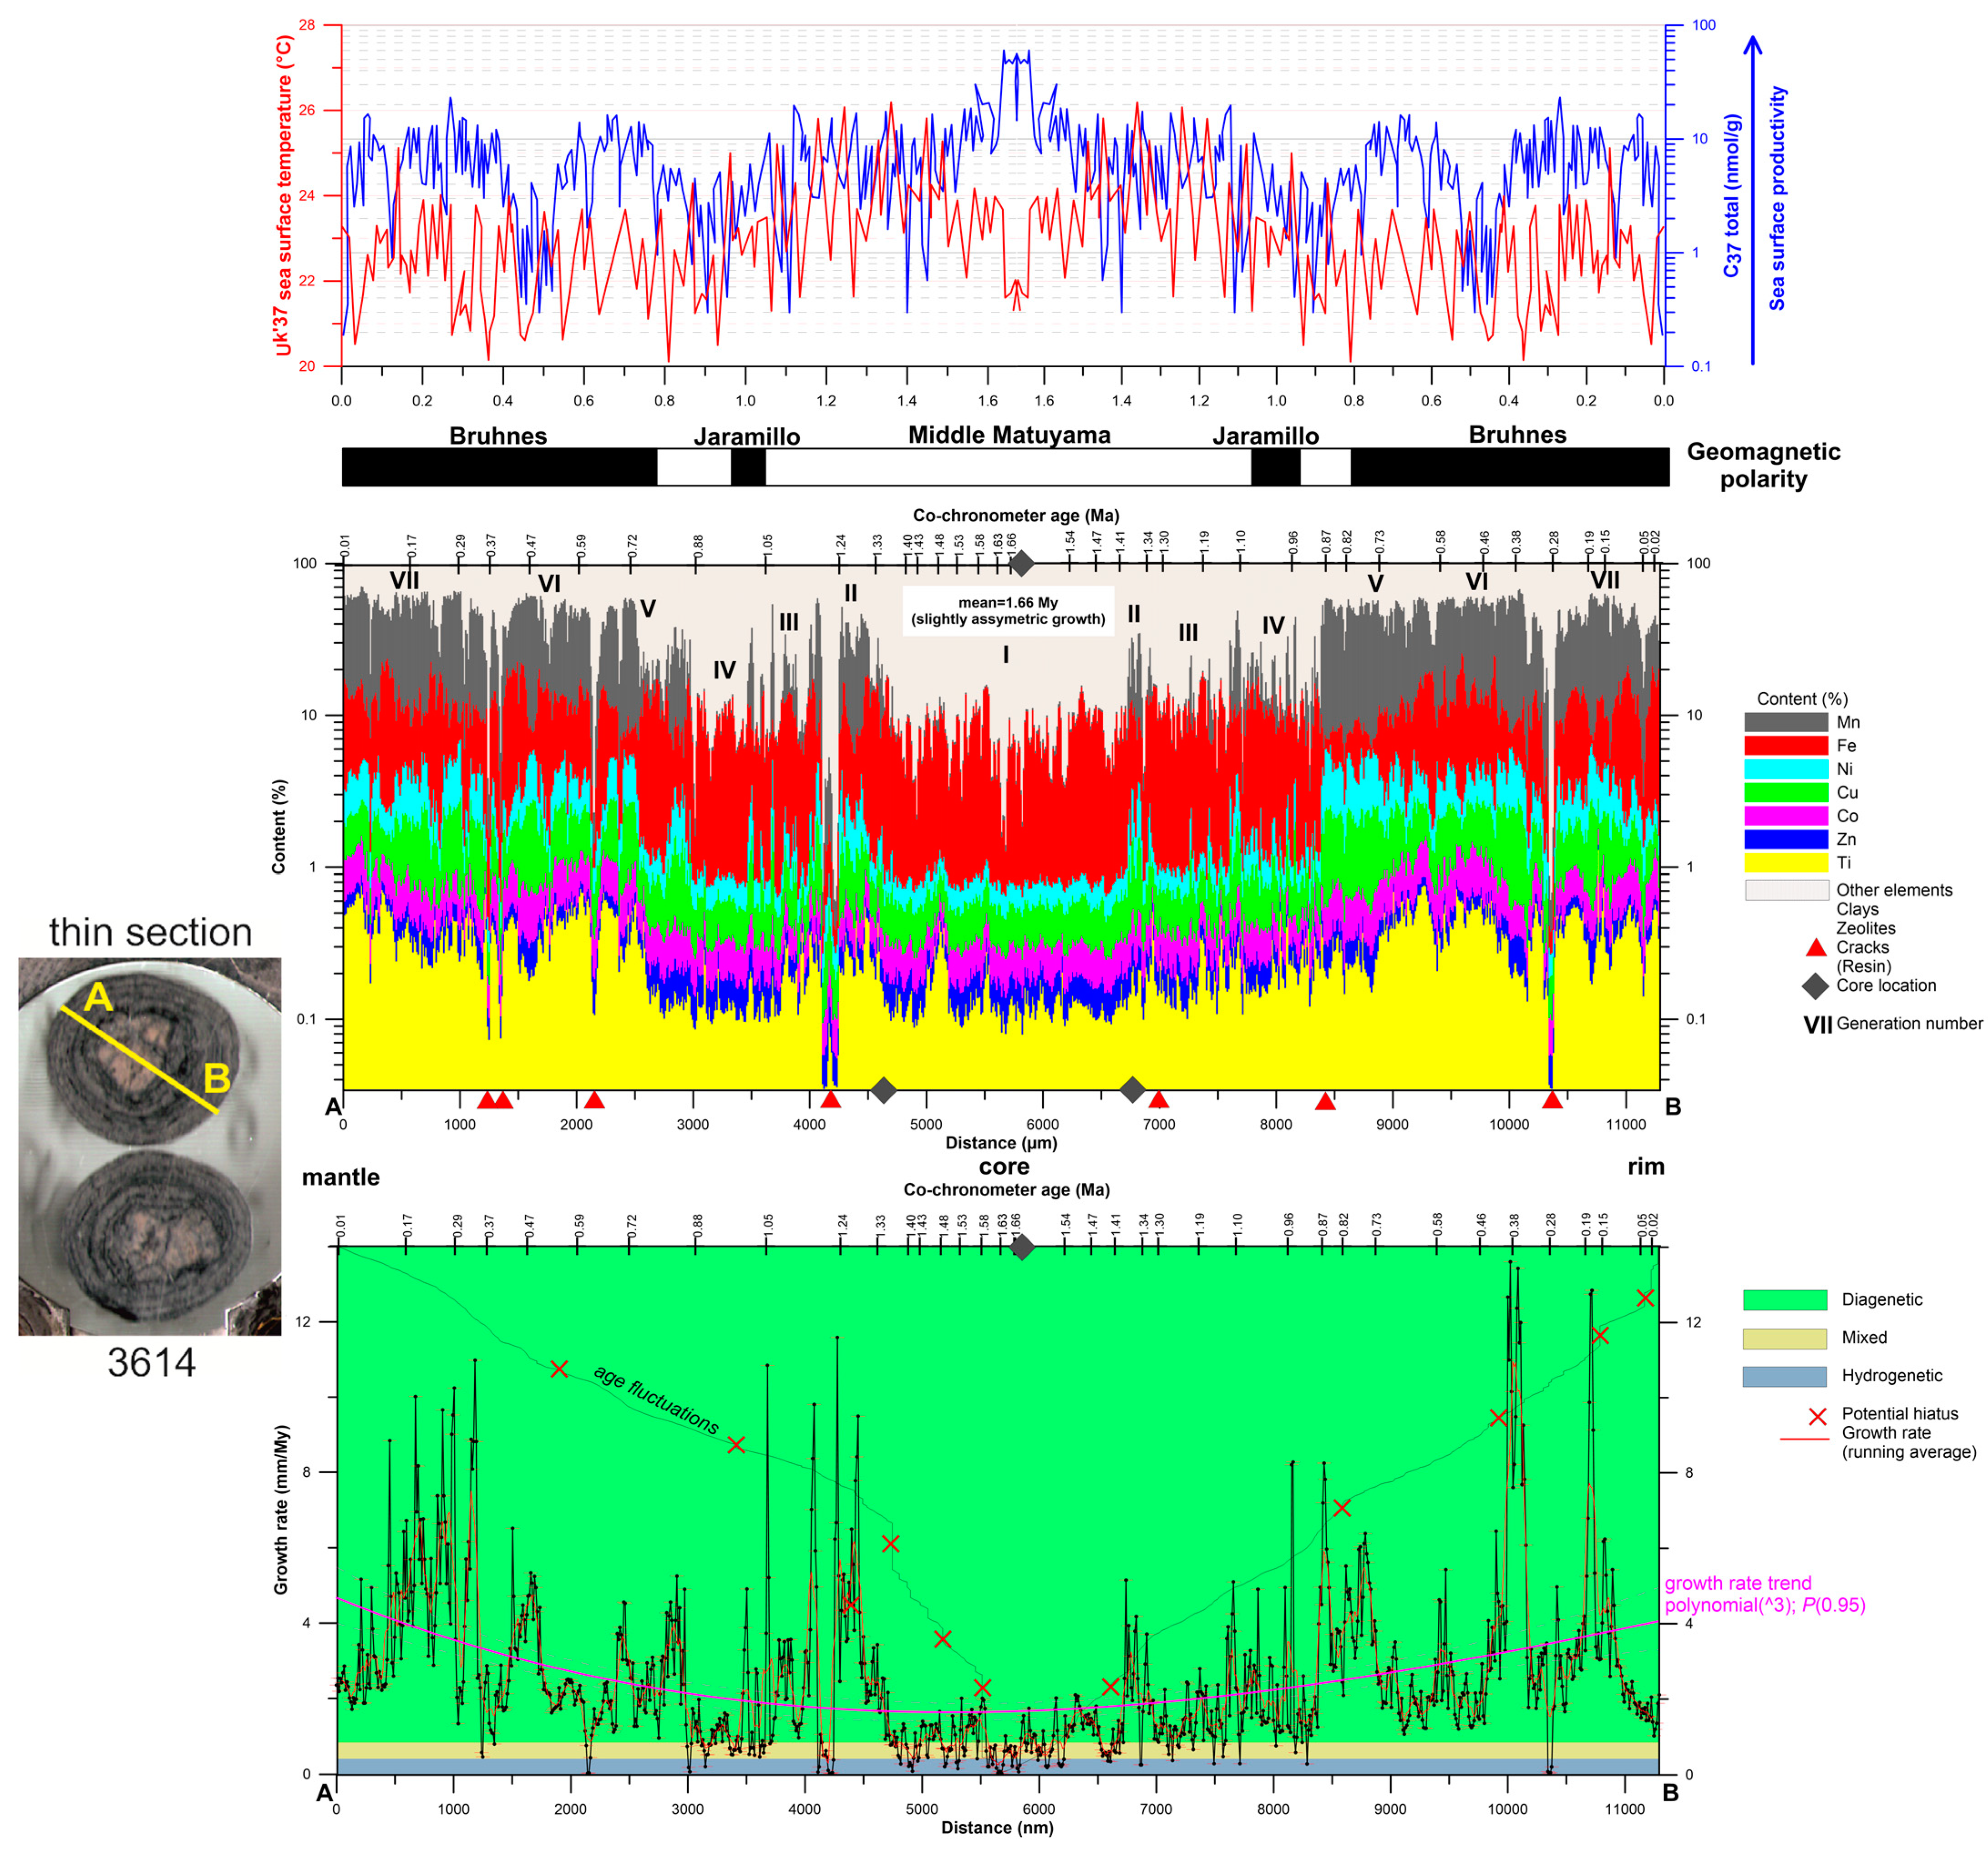
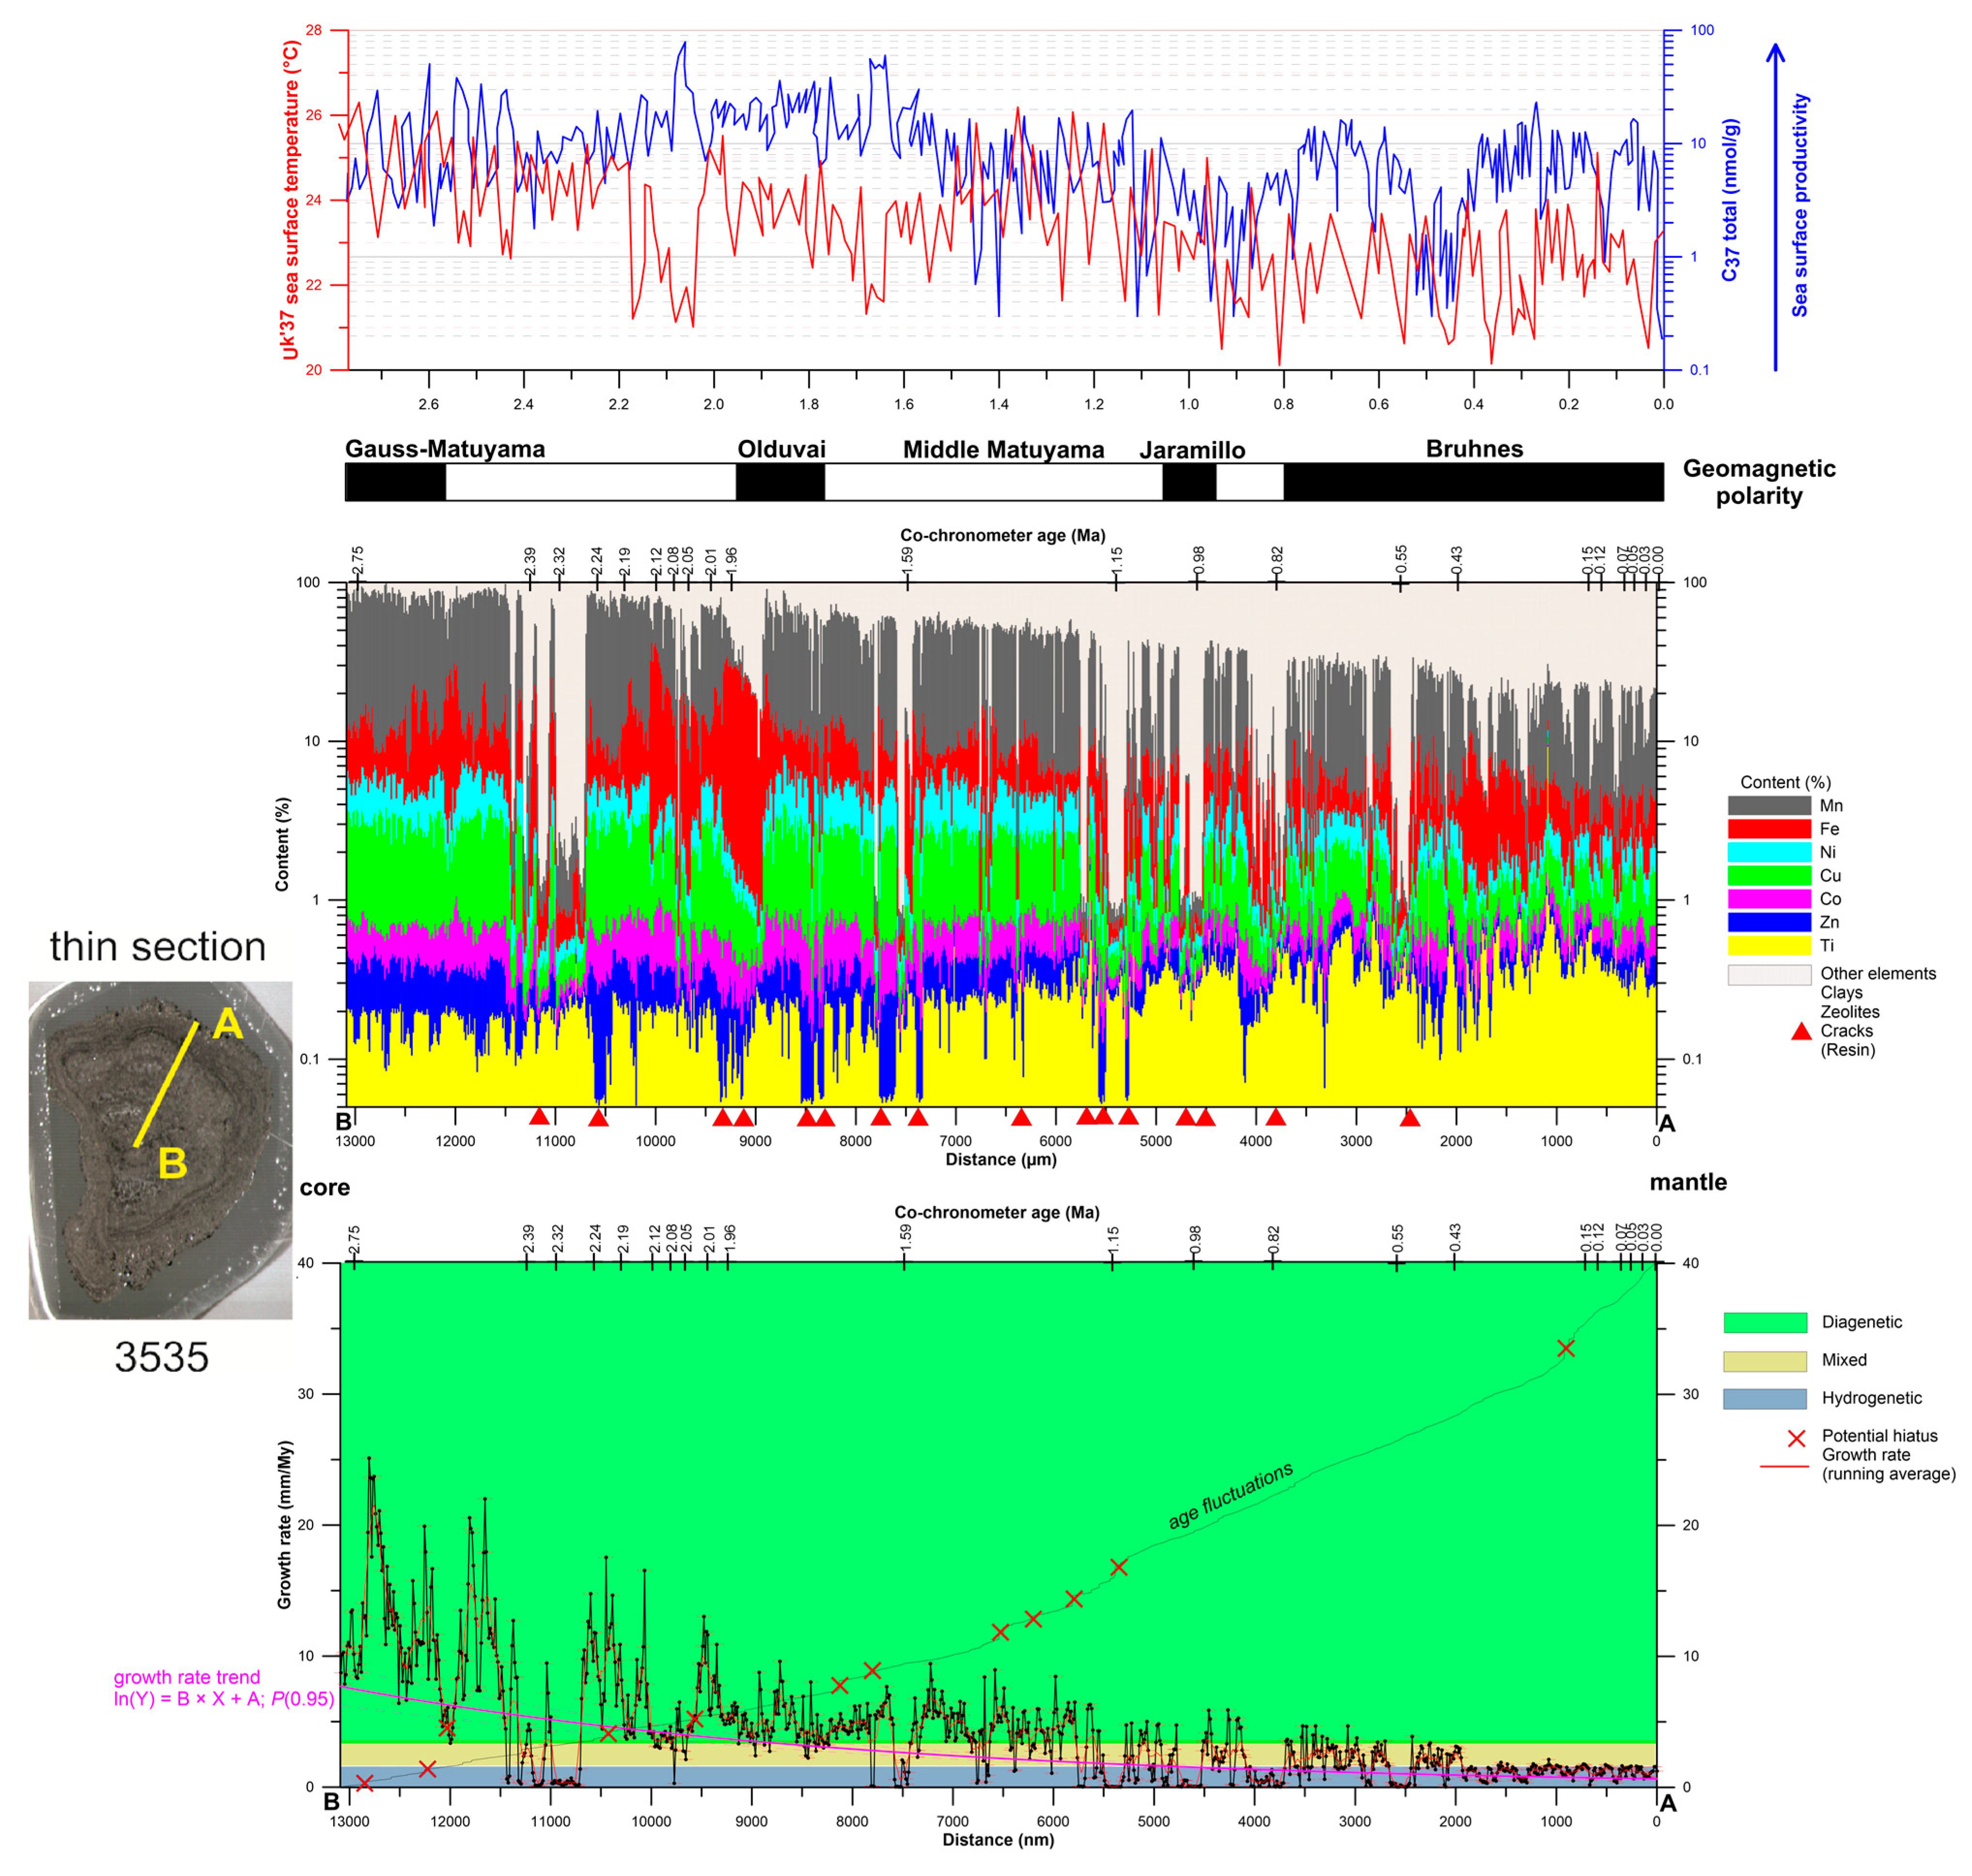
5.6. Growth Generations and Age

According to the spot EPMA and Co-chronometer back-stripping of the Co, Mn, and Fe data (Table 4), the described samples of the polymetallic nodules were aged 1.66–3.25 Ma (Early Pliocene to Middle Pleistocene). The mean age was 2.51 ± 0.71 Ma. The EPMA profiling of the normalized data provided comparable results, with ages varying from 1.85 to 3.09 Ma (Late Pliocene to Early Pleistocene). The mean age was similar (2.44 Ma) to that produced by the spot analysis; however, the standard deviation was lower (±0.51 Ma), so the application of back-stripped Co-chronometer data may provide more reliable results compared to a bulk estimation (e.g., by the control and removal of anomalous data points). The mean growth rate R varied from 2.6 to 14.2 ± 3.3 mm/Myr. The mean age difference between both methods was 0.28 ± 0.11 Ma, with a relative error of −3.7% ± 13.6%.
Figure 12 and Figure 13 compiled information regarding the metal content, age estimation, and calculated growth rate in the profiles through representative nodules. The fluctuations in the metal contents and growth rates are the basis for the interpretation of the lithogenesis of the nodule: the laminae of diagenetic origin significantly differ from those of the hydrogenic and mixed types. Rapid changes can be assigned to potential local and regional hiatuses and secondary cracks and fissures.
Figure 11 presents a nodule traditionally classified as the hydrogenetic/mixed morphotype collected from station 3614 (size and shape of a nut, with a smooth surface). Its core is composed of mudstone (lithified clay) and surrounded by Fe-Mn laminae, of which, in the oldest, interior part of the nodule, those of hydrogenic origin prevail, and, in the outer parts, are replaced with diagenetic ones. A slightly asymmetrical internal structure is clearly visible. Seven cracks cutting into the nodule are marked by rapid changes in the metal concentrations. Metal content fluctuations provided the basis for the identification of six generations of microlayers (II–VII) overgrowing the first generation of the core here, represented by mudstone (I). The growth rate increases toward the outer parts of the nodule.
Figure 13 represents the nodule traditionally classified as having a diagenetic morphotype collected from station 3535 (rough surface with cauliflower-like protuberances). Its core is extensive (18 mm in the longest axis) and inhomogeneous. Two generations of the core can be recognized: (i) an older generation composed of angular parts, broken in halves, and healed, with fragments of the ancient nodule composed of diagenetic laminae (highest content of metals and the highest growth rate), and (ii) a younger generation of concentric Mn-Fe microlayers (a decline in the total metal content and growth rate). Near the outer parts of the core, a portion of the hydrogenic component increases. The core is surrounded by a relatively thin (6 mm thick) sequence of microlayers of mixed and hydrogenic origins, characterized by the lowest growth ratio and the lowest total metal content. A group of 16 cracks is visible with rapid changes in the metal concentrations. The growth rate decreases toward the outer parts of the nodule.

6. Discussion

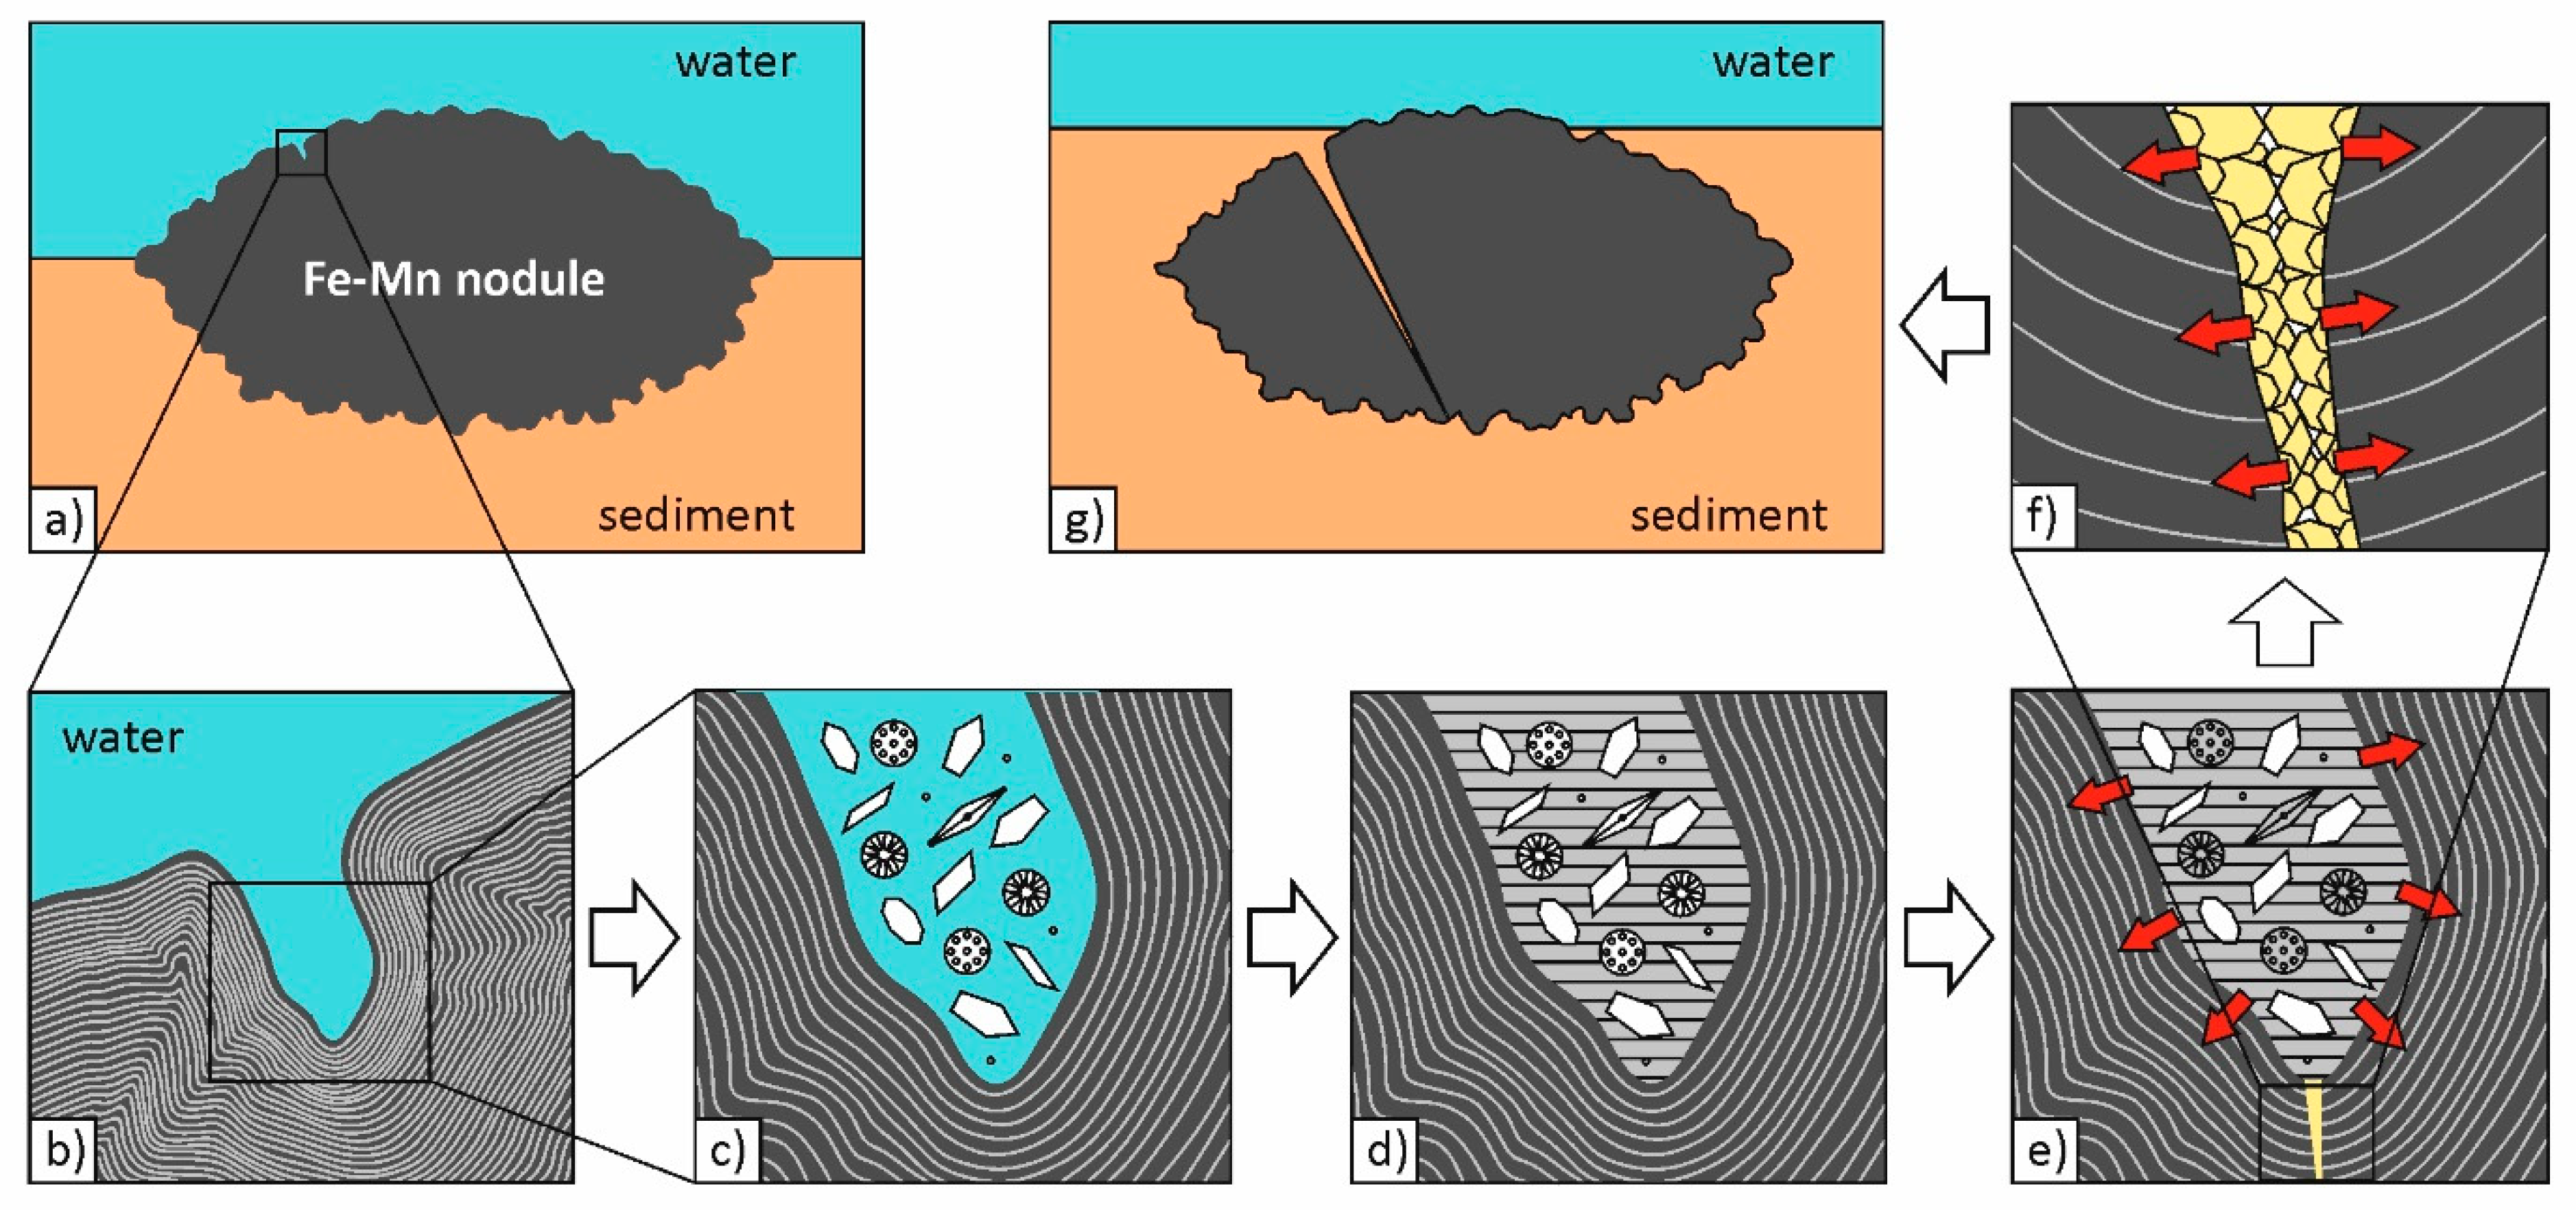
6.1. Nodules Microtexture

Core (nucleus) growth structures precipitated from solutions (laminae, microlayers, or colloforms) and admixtures of lithified detrital components were distinguished at the microstructural levels of the investigated polymetallic nodules. The bodies of the nodules were cut with cracks, fissures, and veins. These microstructural elements are discussed in the subsections below.
Ancient, buried nodules can be an additional source of Mn. In this case, the mobilization of Mn occurs under suboxic conditions, and Mn is reprecipitated on the nodule’s surface being formed in the topmost geochemically active layer of the sediment under oxic conditions at the sediment–water interface.

6.1.1. Laminae (Microlayers)

According to the EPMA data, all the samples of polymetallic nodules collected from the CCFZ IOM claim area demonstrate the prevailing diagenetic influences, reflected in the predominance of laminae of diagenetic origin. Here, dominant suboxic diagenetic processes are evidenced by the high contents of the metals (Ni, Cu, Co, and Zn) in most of the colloforms, related to the relatively pure birnessite transformed to todorokite-buserite. Morphologically, these represent the D nodules and are, in bulk, characterized by increased contents of Ni, Cu, and Co, especially in comparison to the hydrogenetic (H) or mixed (HD) morphotypes. The portion of hydrogenic microlayers in some nodules is high enough to classify these as H (hydrogenetic) and HD (mixed) nodules. In these morphotypes, a slightly increased content of Co is related to a higher amount of Fe and is, consequently, observed mostly in H and HD nodules. The contents of the other elements are comparable in all types of the analyzed nodules; however, the D nodules show slightly higher contents of Ba and Mg and a lower amount of Ti in relation to the H and HD types.
The highest contents of the metals such as Ni, Cu, Co, and Zn were observed in thin and bright laminae composed of Mn (Fe) oxyhydroxides, mainly todorokite/buserite and birnessite, and related to the structural admixtures of Fe with a predisposed Mn/Fe ratio above 2.5. Laminae enriched with Ti dominated, with Fe usually developed as low-crystalline δ-FeOOH. Amorphic Fe oxides and oxyhydroxides may be directly formed from deep-sea muds, where diagenetic processes led to the transfer of the Fe and Mn metals in the solution and their upward migration during the growth of the collomorphs (e.g., [32]). Elevated contents of Ti and alkali or alkaline metals are also related to weathering surfaces (e.g., around basaltic debris remnants) composed of Fe-rich clays and amorphic Fe oxyhydroxides (potentially feroxyhyte or ferrihydrite).
Microlayers adjacent to the cores, formed at the very first stage of nodule growth, show biogenic influences. Their microstructures show similarities to microbial mats (Figure 14). Microbial participation in nodule formation was first proposed and demonstrated in the laboratory [66,67,68]. Additionally, Wang et al. [23] described two morphotypes of microorganisms identified in nodules from the CCFZ and determined their role in the biogenic accumulation of several metals, including Mn, Fe, Co, and Ni.

6.1.2. Admixtures of Lithified Detrital Components

Euhedral crystals of barite were one of the most distinct admixture components of the examined polymetallic nodules, visible as white, contrast-rich plates irregularly arranged on the surface of the colloforms and overgrown by younger laminae or in between colloforms in zones composed of the detrital matter of biogenic organism remnants; the rubble of ore minerals (mainly basalt-derived Ti-rich magnetite and ilmenite); and grains of quartz, feldspar, and clays. According to prior studies [70,71,72], these barite crystals are of marine (or pelagic) origin, precipitated directly from seawater. The primary source of Ba is the biomass. Their regular, euhedral shapes in the investigated polymetallic nodules evidence their authigenic origins. Barite is stable under oxic conditions and, as a mineral with a high density (4.5 g/cm3), tends to be trapped in hollows and open cracks cutting into nodules or on the irregular surfaces of colloforms.
The chemical composition of the lithified detrital material containing barite crystals shows high concentrations of Si, Al, and Fe and low concentrations of Mn and the accessory metals. These areas of the Mn-Fe nodules, with their low metal contents, differ from the ore-carrying microlayers of hydrogenic and diagenetic origins. Using the terminology from the field of deposit geology, inclusions inside Mn-Fe nodules of non-ore minerals can be defined as gangue.
To differentiate this nodule part from the ore-carrying ones, a new term is proposed: intranodulith. Intranodulith shall be considered a specific lithotype being an integral part of polymetallic nodules that developed as a result of the secondary diagenetic processes of lithification and cementation of trapped materials within holes, microcaverns, or open fractures in between ore colloforms (Figure 15). Its petrography, mineralogy, and geochemistry can vary widely and is different from the host rock (colloforms) and from the surrounding soft sediment of the ocean floor. Intranodulith sensu lato may correspond to the Fe-Al-Si-rich type 3 layer in buried nodules described by reference [15] and the interstitial material of the micronodules described previously [23].

6.1.3. Core (Nucleus)

Most of the investigated nodules show cores composed of irregular, broken fragments of ancient nodules (of first-generation nodules). Based on this observation, we assumed that there must have been broken fragments of nodules available for the initiation of new nodule growths. Their chemical compositions (high Fe but relatively low Mn and trace metal contents) suggest a mixed hydrogenetic–hydrothermal origin of the broken nodules of the first generation (according to the traditional Bonatti [63] classification compared to Figure 10). The relatively high growth rates (>10 mm/Myr) of the individual layers in the core may also indicate the strong influences of the diagenetic component (e.g., [73,74]). Typical hydrothermal alterations of Fe-Mn oxyhydroxides seem to be negligible. Only single traces of pyrolusite, hollandite, or braunite are potentially found in the EPMA data, usually indicating a lower metal availability in the environment compared to the typically associated Mn-Fe oxyhydroxides. The formation of proto-thermal braunite may occur only at increased temperature and a lowered O2 partial pressure [75]; therefore, the influence of thermal water in the active volcanic part of the CCFZ in the past cannot be precluded.

6.1.4. Cracks, Fissures and Veins

These questions remain: How did the first-generation nodules, forming the cores of the investigated nodules, defragment? What factors influenced the mechanical breakdown of the massive mineral objects? Most of the fissures in the sedimentary rocks arose as a part of the post-sedimentary or diagenetic processes. During their entire existence, similar physical properties such as a high hydrostatic pressure, low temperature, and rather stable sedimentation rate prevailed. One can assume that only a few environmental factors could fluctuate slightly over time, such as the oxygen saturation, temperature, redox potential, or current regime. From a geological point of view, similar conditions prevailed during the uninterrupted growth of the nodule.
To disintegrate well-solidified Mn-Fe nodules, considerable mechanical pressure on the seabed would have to be assumed. This could have occurred as a result of gravitate sediment rearrangements, such as underwater slides or turbidites triggered, e.g., by earthquakes or volcanic eruptions. In the CCFZ, with active volcanism, this explanation appears plausible. Unfortunately, opposing this explanation of the mechanical crushing of the nodules, there are no traces of significant mass flow deposits on the seabed. Whether the current energy, which led to the formation of the contourites (bottom current deposits) described in the CCFZ, is sufficient for the destruction of the nodules remains questionable.
Mega- and macrofauna activities occur on the seabed of the CCFZ. Bioturbations play an important role in sediment relocation, but it is unlikely that they can lead to the crushing of polymetallic nodules, which are hard compared to the surrounding soft sediment.
In addition to mechanical shattering, there is another hypothesis of nodule disintegration—internally initiated crystal wrecking. According to McMahon et al. [76], salinity-related syneresis, loading or compaction, seismic activity, microbial processes, and authigenic mineralization are considered potential explanations of subaqueous crack formations.
We argue that the biogenic roles of microorganisms probably play a role in this process. According to Wang et al. [23], microorganisms considerably influence the formation of the nodules of the CCFZ (biomineralization processes). In polymetallic nodules from the IOM claim area, some veins conformed to the Mn-Fe laminae (secondarily mineralized with cement). We postulate that these veins arose as a result of the biogenic activity of the microbes living on the surfaces of the nodules that were successively overgrown by the subsequently formed ore microlayers. These planar biogenic separation planes were then, at a later stage of nodule development, filled in with secondary Mn-rich cements (compared, e.g., to Figure 8a–d).
Many veins (of different origins than the planar ones described before) cut through the nodules at various angles or are arranged radially from the center toward the rim zone. This type also includes the longest and thickest veins. We interpret this type of extension process of the microcracks as generated due to the authigenic mineralization of the cement crystals inside the fissures. Therefore, what caused the initial break within the nodule and why? We argue that an increase in the volume during the diagenetic lithification of the sediments trapped in cavities between colloforms (intranodulith) might have been responsible for the initial impulse that ultimately led to cracks of the Mn-Fe nodules. The further growth of the cement crystals within the initial fissure led to their additional extension, which could have ultimately caused the breakage of the nodules directly at the seafloor, being evidenced, e.g., in seabed photos or photo profiles. This secondary diagenetic process can cause the disintegration of the whole nodule without the influence of any external factors—the nodule disintegrates “by itself” (Figure 15). Even today, on the seabed, one can find not only complete but, also, apparently crushed nodules (Figure 16).
We argue that, under constant pressure conditions during the entire period of existence of the nodules (under almost the same hydrostatic water pressure), even the apparently low forces of crystal growth can disturb the stability of the fragile equilibrium of the nodule and cause a splitting (cracking) of its body.

6.2. Chemostratigraphy, Age and Growth Generations

The analyzed polymetallic nodules showed a growth rate typical for the D, sD, and mixed HD nodules (Table 4). The highest growth rate was observed in the samples located in the closest vicinity to extinct underwater volcanoes (Figure 2). The indicated age of the nodules from the IOM claim area is almost twice younger compared to the nodules collected in the extreme western part of the CCFZ (more than 3500 km from the IOM area), which started from ~4.7 Ma [77].
According to the Co-chronometer back-stripping data, seven major groups/generations of colloforms were distinguished in the representative nodules (Figure 12 and Figure 13). The analyzed nodules usually showed asynchronous growth, with no visible relationships between age and the morphological or chemical type. As mentioned before, the HD, H, and sD nodules (3542, 3613, 3614, and 3615) were located in the surrounding volcanic hills in the NE part of the study area. All these samples showed a trend of a slight increase in the growth rate toward the rim. The interior indicated the stronger influence of the hydrogenous processes, evidenced by the presence of vernadite layers mixed with pure Mn oxyhydroxides, as well as admixtures of clay minerals.
Most of analyzed samples indicated increased contents of Fe and Ti in the rim parts; however, a positive relationship of these metals is not always visible (increase in the hydrogenetic component toward the rim). Although Ti is usually associated with some detrital input, some Mn-rich colloforms also show increased contents of Ti. It seems that the nodules in this part of the IOM area started to form relatively slowly, and the growth ratio increased gradually during the Plio–Pleistocene period. A shift in the forming conditions was observed around 750–850 ka ago, evidenced by a rapid drop in thee Mn, Ni, and Cu contents, as well as an increase in the Fe amount (e.g., 3614, Figure 12).
For the other typical diagenetic nodules, the growth rate trend is rather stable; however, some of them show an increase in the growth rate, and others, a decrease. Similar to H, in the HD and sD nodules, increases in the Ti and Fe contents were observed in the rim colloforms. The slightly different geochemical characteristics of the nodules located near the volcanic hills provide evidence of the influences related to the topography, the sedimentary processes, the intensity of the sea bottom currents (e.g., [43]), or even the hydrothermal processes related to the discharge of metals in the seamount areas (e.g., [78,79]).
The formation of polymetallic nodules in the study area shows potential relationships with the Northern Hemisphere Glaciation, which induced a drop in the sea surface temperature and the shoaling of thermocline [80]. Deglaciation processes increased the water flow from the Northern Hemisphere, which might have affected the increase in the productivity and, consequently, higher nutrient contents in the deep-sea sediments (Late Pliocene–Early Pleistocene productivity maximum; 3–1.5 Ma). The intensification of the Walker and Hadley circulations over the tropical Pacific might have helped at the onset of the glaciations and the subsequent deglaciations during the late Plio–Pleistocene [81]. The visible decline in productivity occurred between 1 and 2 Ma and followed the establishment of an opal belt ~2 Ma [65]. Several examples in the analyzed polymetallic nodules from the IOM area indicate a decrease in the Mn/Fe ratio, related to the decrease in the sea surface temperature (SST), as well as the reduced productivity, especially in the group of the middle-to-late Pleistocene colloforms. Older layers often indicate an increase in the Fe content, related to productivity increases and drops in the sea surface temperature (SST).
In some nodules (3602, 3604, 3613, and, especially, 3614), we observed changes in the geochemistry (increases in the Fe and Ti contents) around 750–900 ka, which may be related to the mid-Pleistocene cooling events [81], increased Fe accumulation [82], and high bioproductivity evidenced by a barite formation. On the orbital time scales, the export production of barite is generally higher during cold periods (glacial maxima) between 4.3 and 1.1  Ma [83]. The presence of a large amount of barite mixed with clays or pure Mn oxyhydroxides might be evidence of its formation during this kind of cold event related to the increased productivity of sea surface water (SSW). The potential hydrothermal influences are related to the sediments and nodule alterations with basaltic lavas and gas emanations. In this case, the presence of pure Mn and Fe oxides, as well as traces of palagonized volcanic glass or admixtures of debris minerals (e.g., hydromicas or Fe chlorite), might be related to weak hydrothermal seafloor alterations [84]. All the changes in the palaeoceanographic conditions in this part of the CCFZ must be considered along with the steady depth increase of the seafloor, which affected the location of the geochemical barriers, current intensity, and sedimentation rates (e.g., [49]).
For the purposes of Co-chronometer data back-stripping, the best are small-to-medium nodules with a lack of internal cracks and the presence of a relatively low number of admixtures (including clays, zeolites, or Fe-rich debris components). Contact zones between the Mn-Fe colloforms and clays or zeolites led to the formation of cracks, which strongly affect the data back-stripping process. In this case, the extreme growth rates and ages in loose or partially filled spaces should be removed from the final results. The cracking processes can also be induced by the aging and dehydration of nodules or the transformation of Mn-Fe oxyhydroxides (e.g., [60,61,85]). Intranodulith in cracks includes pure Mn-oxyhydroxide cement, clays, zeolites, barite, and other minerals. The formation of this kind of structure might be an indicator of Mn excess in the solution, leading to conclusions regarding the alterations and dissolutions of older Mn (Fe) oxyhydroxides and the recrystallization of younger manganates (e.g., [86]).
According to the general comparison of the back-stripped chemostratigraphic data, the highest contents of the metals are associated with Mn-rich colloforms, indicating diagenetic formation under oxygen-rich seawater. The general increase in productivity observed in the tropical Pacific following the Northern Hemisphere Deglaciation influenced the changes in the thermocline position and related parameters, which strongly affected the speciation of Fe and Mn. Diagenetic influences usually strongly rely on the oxic–suboxic front transition observed in the uppermost layers of the sediments [13,53]. Notably, very pure Mn-oxyhydroxides (e.g., birnessite or todorokite/buserite) do not always show the highest contents of strategic metals, such as Ni, Cu, or Co, which means that admixtures of Fe in the structures of manganates or intercalation with vernadite is needed for the acquisition of metals. This rule might be associated similarly to growth ratios, where intermediate values (4–8 mm/Myr) are preferred for the highest concentrations of metals. The high content of Fe observed in the colloforms (vernadite admixtures) dated more than 2.4 to 2.5 Ma is associated with Late Pliocene to Early Pleistocene warming and the increase in the global mean sea level. In several nodules, we observed the presence of intranodulith developed in the cracks, Co-chronometerically dated 1.4–2.2 Ma (Middle Matuyama–Olduvai magnetozones), which was a period of sea surface temperature decrease coupled with productivity increase.
The observed short- (40–50 kyr and 100–200 kyr) and long-scale periodicity (~400–500 kyr) of the Fe and Mn contents, as well as the growth ratio fluctuations, might also be a new and potentially useful tool for tracing changes in the palaeoceanographical conditions during the Plio–Pleistocene productivity increase (the presence of todorokite-birnessite, as well as collapsed 10-Å phyllomanganates). This long-term periodicity was observed especially in the layers formed after 1.8–2.0 Ma. Chemostratigraphic profiling data of the polymetallic nodules using EPMA can also be correlated to the magnetosome and isotopic methods of dating.

7. Conclusions

Polymetallic nodules collected in the eastern part of the CCFZ in the IOM claim area showed complex internal textures reflecting multistage nucleation affected by potential changes in the paleoproductivity and surface temperatures occurring during the Late Pliocene-to-Middle Pleistocene (Plio–Pleistocene) postglacial transition. Most of the analyzed samples showed distinctive diagenetic features evidenced by relatively high growth rates (>5 mm/Myr), increased Ni + Cu + Co contents (>4 wt %), and admixtures of Fe-rich clays or barite.
Intranodulith was proposed as a term describing the specific lithotype that is the integral part of polymetallic nodules, which developed as a result of the secondary diagenetic processes of lithification and cementation of trapped detrital materials within holes, microcaverns, or open fractures in between ore colloforms.
The polymetallic nodules located in the nearest vicinity to underwater volcanic-shaped areas usually showed higher inputs of the hydrogenic components (slow growth rates, increased amount of Fe, and the presence of vernadite) compared to the nodules collected in relatively flat, streaked, and meridian-oriented blocks of the seafloor.
A hypothesis of nodule cracking on the seafloor being caused by internal tension in the vein created by crystal growth was proposed.

Author Contributions

Conceptualization, A.S. (Artur Skowronek), Ł.M., D.Z., A.S. (Agnieszka Strzelecka), and P.K.; methodology, A.S. (Artur Skowronek), P.K., Ł.M., and A.S. (Agnieszka Strzelecka); software, A.S. (Artur Skowronek), Ł.M., P.K., and A.K.; validation, A.S. (Artur Skowronek), T.A., Ł.M., D.Z., P.B., K.M., and P.K.; formal analysis, A.S. (Artur Skowronek), Ł.M., K.M., D.Z., and A.S. (Agnieszka Strzelecka); investigation, A.S. (Artur Skowronek), P.K., Ł.M., D.Z., K.M., and A.S. (Agnieszka Strzelecka); resources, A.S. (Artur Skowronek), T.A., P.B., and P.K.; data curation, A.S. (Artur Skowronek), K.M., Ł.M., and P.K.; writing—original draft preparation, A.S. (Artur Skowronek), Ł.M., D.Z., A.S. (Agnieszka Strzelecka), P.K., and K.M.; writing—review and editing, A.S. (Artur Skowronek), K.M., Ł.M., A.S. (Agnieszka Strzelecka), and D.Z.; visualization, A.S. (Artur Skowronek), Ł.M., A.S. (Agnieszka Strzelecka), and A.K.; supervision, A.S. (Artur Skowronek), and T.A.; project administration, A.S. (Artur Skowronek); and funding acquisition, T.A., and A.S. (Artur Skowronek). All authors have read and agreed to the published version of the manuscript.

Funding

This research received no external funding.

Data Availability Statement

The data that support the findings of this study are available from the corresponding author upon request.

Acknowledgments

We wish to thank Rafał J. Wróbel (WPUT), Szczecin for providing the results of the XRD analysis.

Conflicts of Interest

The authors declare no conflict of interest. The funders had no role in the design of the study; in the collection, analyses, or interpretation of the data; in the writing of the manuscript; or in the decision to publish the results.

Appendix A

Table A1. Representative EPMA data of the major minerals identified in the analyzed polymetallic nodules from the IOM area CCFZ (EPMA; N = 46). All data are given in wt %. The mineral types were distinguished based on the stoichiometry [54].
IDFNaSiAlMgPClKSCaBaTiPbFeMnCrCuZnVAsSrCoNiAgO- Total
Todorokite/Buserite-Birnessite (Alteration and Transformation Traces)
3615_5_120.000.950.881.473.000.200.071.150.061.450.140.080.000.5846.160.002.060.350.030.080.050.042.890.0027.7389.41
3615_5_130.001.000.991.422.960.060.041.040.031.540.110.040.010.7744.950.012.250.270.040.080.060.043.070.0027.2188.01
3614_1_30.002.161.091.462.380.070.120.870.031.460.190.130.001.3743.160.001.930.170.040.070.060.073.160.0026.7886.78
3602_5_120.001.851.330.641.990.090.071.090.021.640.160.020.000.7245.680.001.680.340.030.060.060.052.260.0026.5386.29
3535_2_90.002.041.171.382.120.080.130.950.042.020.120.110.000.6443.430.002.500.270.060.070.060.092.900.0026.7586.93
3605_5_120.020.882.731.762.440.240.041.130.061.510.710.040.000.7044.450.001.470.150.070.070.070.061.680.0028.6288.91
3529_1_10.000.932.902.002.620.750.060.950.062.241.000.340.031.3042.070.001.350.130.100.080.080.161.470.0029.4890.08
3604_4_80.000.881.542.654.320.080.020.380.011.090.430.040.032.0138.120.002.330.160.090.110.040.402.550.0027.0384.29
3535_2_70.000.821.092.573.840.180.050.300.041.660.130.250.002.8938.480.002.400.170.050.100.070.312.500.0027.1085.02
3614_3_60.001.430.942.614.300.140.400.460.141.240.200.200.011.2639.050.002.050.160.060.110.050.283.270.0027.0785.42
3605_1_10.001.110.370.722.130.080.100.810.041.280.780.100.021.5141.900.001.380.160.100.080.080.431.650.0023.8778.73
3605_1_20.001.180.280.692.120.060.080.870.031.140.640.060.001.2143.560.001.350.160.080.070.070.321.590.0024.1579.70
3613_80.000.932.671.152.090.080.430.820.041.280.640.090.023.6038.430.000.970.080.080.070.070.460.670.0025.7480.41
3535_5_120.001.771.160.852.070.080.230.960.031.660.240.080.031.7742.370.011.960.200.030.070.090.202.170.0025.6783.71
3613_50.000.662.261.492.570.110.680.640.071.460.940.140.032.5636.060.001.120.070.120.080.080.431.240.0024.7177.52
Todorokite/Buserite-Birnessite (Impure Mixtures)
3529_3_60.010.667.091.431.760.660.290.830.231.290.320.130.048.6524.860.000.600.080.060.070.050.270.340.0027.7377.47
3535_8_190.000.535.502.102.040.780.220.710.082.290.230.510.069.0030.430.000.980.160.050.080.080.491.160.0030.2087.69
3537_7_130.060.674.221.011.261.250.170.580.293.200.410.230.0712.9630.520.000.370.080.060.090.110.830.380.0029.8588.66
3535_1_20.000.733.031.771.990.270.240.980.142.030.810.350.044.2436.940.001.060.100.120.080.090.171.070.0027.1883.42
3537_4_80.000.612.401.552.670.450.060.600.112.320.350.430.044.9639.430.001.670.130.060.080.060.221.670.0028.6288.50
3605_3_80.000.534.641.992.690.490.100.760.081.760.470.270.056.4235.710.001.240.100.070.090.060.261.340.0030.0889.20
3537_1_30.001.234.571.412.330.060.090.530.061.550.270.160.001.1040.670.001.960.160.050.070.040.332.300.0029.0187.95
Mn-Fe Vernadite (Partially Impure)
3602_7_160.000.637.371.251.560.540.310.860.102.130.320.360.1212.6125.860.000.260.060.060.070.100.620.480.0030.1085.76
3613_20.000.436.631.620.790.372.380.220.112.410.170.840.1017.3516.030.010.230.090.080.090.120.310.170.0026.6877.21
3613_130.001.236.500.910.770.341.910.330.111.700.160.540.1223.2614.840.000.290.080.100.090.080.220.240.0027.7081.52
3537_7_140.000.7911.173.001.320.250.251.310.071.750.190.100.0617.4714.710.010.280.050.060.060.060.390.080.0032.2585.68
3535_7_150.000.527.461.911.590.800.130.700.042.210.330.510.1414.7224.440.000.660.110.090.090.100.620.380.0031.5089.03
3603_2_90.010.829.742.062.130.500.191.000.041.480.350.190.0716.1520.860.000.770.110.070.090.070.280.570.0032.9090.44
3537_2_70.010.238.011.801.240.290.190.550.082.040.250.360.0815.3620.610.000.410.100.060.080.100.500.220.0029.3581.93
Fe-Rich Clays (Intranodulith Mixtures: Potentially Nontronite and Fe-Rich Smectite)
3604_2_30.000.3125.643.572.800.040.042.770.010.490.050.030.0016.461.340.000.190.040.020.040.000.040.040.0042.9696.89
3604_2_40.000.3025.923.542.850.040.032.710.010.490.030.040.0117.411.330.000.180.060.030.050.000.040.030.0143.7098.82
3535_2_40.000.2325.642.902.970.020.041.930.020.870.000.120.0116.540.550.000.280.070.020.060.010.060.080.0042.2194.61
3605_6_140.000.2724.832.762.240.070.032.270.010.830.000.110.0117.391.040.000.370.070.020.050.010.050.050.0041.3993.88
3615_3_100.000.3524.544.202.490.050.083.620.010.460.000.290.0116.600.260.000.140.060.030.060.000.050.010.0142.0295.34
3529_3_80.000.5724.551.932.420.040.101.720.020.780.020.030.0018.110.550.000.180.070.000.070.000.070.020.0040.4091.66
3542_4_130.000.4624.582.842.310.060.222.320.030.610.000.220.0019.121.130.000.160.060.010.060.010.060.050.0042.0496.33
3613_140.002.2620.472.181.800.040.182.620.020.340.040.070.0017.023.650.000.190.060.020.050.000.090.060.0037.0988.24
3604_4_70.000.6023.512.542.270.100.031.970.020.660.040.050.0019.021.830.010.330.070.020.070.000.070.060.0040.7794.02
3602_5_100.000.2723.751.542.290.040.071.740.020.690.000.030.0120.340.700.000.150.060.000.070.000.080.030.0039.9591.85
3602_7_150.000.3021.131.062.140.080.551.740.030.650.000.170.0119.490.660.010.200.030.020.060.000.050.020.0136.2084.60
Zeolites (Impure Intranodulith: Na-Phillipiste)
3615_4_110.001.7827.228.540.860.000.104.570.010.520.010.040.015.120.070.000.060.040.010.020.000.010.010.0043.2792.29
3542_3_110.002.0628.117.371.370.020.083.600.030.270.060.290.007.490.320.010.170.040.010.040.000.010.050.0044.7696.16
3614_1_10.001.1122.019.920.780.030.095.170.040.160.060.090.014.500.300.000.050.020.030.000.000.020.010.0038.2182.62
3615_2_60.003.1525.608.660.330.030.055.090.010.400.100.070.001.443.870.000.090.020.010.010.000.010.090.0041.8890.90
3614_2_50.003.3428.8110.000.180.000.034.270.010.060.010.010.001.590.030.000.040.000.020.020.000.010.000.0044.6593.07
3542_5_200.003.5029.829.920.080.000.004.680.010.240.000.020.000.390.580.010.050.010.000.020.000.020.070.0045.6395.05

Appendix B

Table A2. Basic statistics of the analyzed polymetallic nodules from the IOM claim area CCFZ (EPMA; N = 191). All data are given in wt %.
StatisticsIDFNaSiAlMgPClKSCaBaTiPbFeMnCrCuZnVAsSrCoNiAgO-
Mean35290.000.996.101.502.050.270.241.190.071.190.440.210.035.2530.960.000.930.100.050.070.050.260.860.0027.75
Min.N = 130.000.350.310.580.790.020.030.360.010.480.020.030.000.480.550.000.180.040.000.040.000.070.020.0019.06
Max.0.041.7624.554.232.651.000.764.510.232.511.000.830.1018.1145.910.001.680.180.120.090.080.551.590.0041.55
St. dev.0.010.478.000.880.480.330.251.020.070.580.250.260.035.3714.870.000.440.040.030.010.020.150.530.006.62
Mean35350.001.023.971.542.030.290.280.720.081.730.220.270.045.4830.210.001.300.150.050.070.070.231.360.0025.56
Min.N = 210.000.230.190.350.970.020.040.300.020.590.000.020.000.270.550.000.280.060.010.060.010.030.080.0012.71
Max.0.042.3325.642.903.841.001.161.930.253.160.810.990.1416.5446.700.022.500.340.120.100.130.622.900.0042.21
St. dev.0.010.585.210.650.640.280.250.380.060.720.170.240.045.0811.230.000.670.070.030.010.030.170.790.006.61
Mean3537A0.000.988.132.292.070.270.101.160.071.790.180.160.036.0830.520.001.420.190.040.070.060.231.380.0031.41
Min.N = 140.000.460.120.931.170.030.020.530.010.650.000.040.000.710.110.000.130.050.000.050.000.020.030.0026.07
Max.0.061.8026.625.983.231.250.252.630.293.200.410.430.0717.4746.900.012.950.560.070.090.110.833.240.0143.23
St. dev.0.020.418.531.410.630.330.060.630.070.630.120.110.025.3315.480.000.880.140.020.010.030.231.010.005.11
Mean3537B0.000.905.451.611.800.110.300.840.051.280.180.190.045.0623.910.001.140.110.030.060.050.191.130.0023.53
Min.N = 90.000.220.400.441.060.060.040.320.020.790.000.040.010.580.190.000.200.030.000.050.020.030.050.0015.68
Max.0.011.8125.854.213.510.290.842.860.082.040.290.360.0815.3643.920.032.520.240.060.090.100.503.160.0042.71
St. dev.0.000.497.521.050.740.070.250.730.020.470.100.110.025.4313.790.010.900.090.020.010.020.141.050.008.48
Mean35420.001.2912.033.561.970.110.141.550.061.600.200.240.027.2623.430.000.770.090.040.070.050.160.930.0033.93
Min.N = 240.000.210.150.230.060.000.000.260.000.130.000.020.000.320.080.000.010.010.000.010.000.010.020.0024.53
Max.0.073.8829.8214.273.250.390.445.280.357.570.710.940.0721.7946.770.012.260.260.100.100.130.653.290.0146.98
St. dev.0.010.9811.713.610.920.110.111.390.071.430.190.250.026.8219.570.000.680.060.030.020.040.201.060.008.11
Mean36020.000.854.630.932.040.250.121.020.051.550.650.200.036.1836.330.001.030.140.070.070.080.201.110.0028.44
Min.N = 160.000.270.040.051.160.030.040.250.010.650.000.000.000.120.660.000.150.030.000.050.000.020.020.0024.63
Max.0.011.8523.751.752.900.750.551.740.112.883.690.900.1320.3450.820.011.830.340.180.110.160.622.260.0139.95
St. dev.0.000.417.110.490.480.240.130.400.030.650.860.260.047.1415.450.000.570.070.050.010.040.190.760.004.02
Mean36030.001.415.021.362.110.280.151.060.051.640.280.110.035.9035.200.001.410.190.050.070.060.131.520.0029.06
Min.N = 180.000.370.040.071.200.010.040.580.010.390.000.000.000.250.410.000.080.030.010.050.000.010.040.0024.39
Max.0.052.5525.323.283.711.080.342.540.142.480.800.280.1520.8747.620.042.900.350.130.090.130.563.150.0041.39
St. dev.0.010.606.780.790.640.290.080.530.040.560.210.090.047.2913.420.010.720.090.030.010.030.130.930.004.54
Mean36040.011.167.061.752.490.120.111.230.051.240.580.080.015.3032.380.001.110.160.060.070.050.151.070.0029.89
Min.N = 140.000.300.100.221.640.040.020.380.010.490.030.010.000.181.330.000.180.040.020.040.000.040.030.0022.89
Max.0.042.9425.923.574.320.490.682.770.262.402.830.390.0719.0248.010.012.330.390.160.110.150.482.550.0143.70
St. dev.0.010.699.511.050.680.110.170.730.070.590.800.090.026.6616.810.000.610.110.040.020.040.130.870.006.82
Mean36050.010.923.181.102.100.160.131.040.071.420.470.100.033.1638.870.001.390.170.070.070.070.201.470.0026.78
Min.N = 210.000.270.080.181.390.050.030.600.010.680.000.010.000.311.040.000.370.070.020.050.010.040.050.0016.29
Max.0.041.5124.832.763.230.560.452.270.242.410.840.290.1117.3947.400.012.270.300.120.090.100.562.820.0041.39
St. dev.0.010.355.470.660.420.140.100.360.070.430.230.080.034.1210.950.000.390.060.030.010.020.140.700.004.51
Mean36130.000.897.081.671.810.140.720.840.071.300.440.280.048.2523.670.000.640.070.080.070.060.310.600.0026.67
Min.N = 150.000.161.180.710.770.020.150.220.020.340.000.060.002.170.330.000.140.030.000.050.000.030.000.0015.90
Max.0.002.2620.473.122.570.372.382.620.152.831.181.000.1223.2644.870.011.180.160.120.100.130.532.150.0137.09
St. dev.0.000.476.730.700.550.110.610.570.040.670.390.280.046.7213.780.000.380.030.040.010.040.160.570.005.02
Mean36140.011.259.823.261.850.170.661.630.151.150.170.280.048.1319.570.000.760.090.040.060.050.251.060.0029.86
Min.N = 130.000.270.940.720.180.000.030.300.010.060.000.010.001.260.030.000.040.000.020.000.000.010.000.0019.66
Max.0.043.3428.8110.004.300.551.605.170.392.080.520.600.1117.3243.160.012.050.190.080.110.110.653.270.0144.65
St. dev.0.010.8310.303.071.050.150.591.710.120.670.150.210.035.5215.280.000.740.060.020.030.040.221.230.008.44
Mean36150.001.3611.983.851.810.130.142.290.061.280.240.190.015.3123.810.000.780.140.050.060.050.061.050.0033.42
Min.N = 120.000.350.881.220.090.000.010.620.010.130.000.020.000.530.070.000.010.020.000.000.000.000.000.0026.22
Max.0.003.1528.979.423.270.710.575.620.252.580.680.540.0516.6046.160.012.250.350.120.090.120.193.070.0143.99
St. dev.0.000.8810.693.020.990.180.151.790.070.710.220.170.014.8717.480.000.740.120.040.030.040.051.060.006.82

References

  1. Halbach, P.; Friedrich, G.; von Stackelber, U. The Manganese Nodule Belt of the Pacific Ocean. In Geological Environment, Nodule Formation, and Mining Aspects; Ferdinand Enke Verlag: Stuttgart, Germany, 1988. [Google Scholar]
  2. Kotliński, R. Metallogenesis of the World’s ocean against the background of oceanic crust evolution. Spec. Pap. Pol. Geol. Inst. 1999, 4, 1–70. [Google Scholar]
  3. Morgan, C.L. Resource Estimates of the Clarion-Clipperton Manganese Nodule Deposits. In Handbook of Marine Mineral Deposits; Cronan, D., Ed.; CRC Press: London, UK, 2000; pp. 145–170. [Google Scholar]
  4. International Seabed Authority. A Geological Model of Polymetallic Nodule Deposits in the Clarion–Clipperton Fracture Zone; International Seabed Authority Technical Study No. 6; International Seabed Authority: Kingston, Jamaica, 2010; pp. 1–211. Available online: https://ran-s3.s3.amazonaws.com/isa.org.jm/s3fs-public/files/documents/tstudy6.pdf (accessed on 12 February 2020).
  5. Wegorzewski, A.V.; Kuhn, T. The influence of suboxic diagenesis on the formation of manganese nodules in the Clarion Clipperton nodule belt of the Pacific Ocean. Mar. Geol. 2014, 357, 123–138. [Google Scholar] [CrossRef]
  6. von Stackelberg, U. Growth history of manganese nodules and crusts of the Peru Basin. In Manganese Mineralization: Geochemistry and Mineralogy of Terrestrial and Marine Deposits, 119; Nicholson, K., Hein, J.R., Bühn, B., Dasgupta, S., Eds.; Geological Society Special Publication: London, UK, 1997; pp. 153–176. [Google Scholar]
  7. Cronan, D. Regional and Environmental Variability of Manganese Nodules in the Central South Pacific. In Harvesting Seabed Minerals Resources in Harmony with Nature; Hein, J.R., Barriga, F.J.A.S., Morgan, C.L., Eds.; UMI: Lisbon, Portugal, 2014. [Google Scholar]
  8. Kunzendorf, H.; Glasby, G.P. Minor and REE in Manganese Crust and Nodule and Sediments from the Manihiki Plateau and Adjacent Areas: Results of HMNZS Tui Cruises. Mar. Georesources Geotechnol. 1994, 12, 271–281. [Google Scholar] [CrossRef]
  9. Jauhari, P.; Pattan, J.N. Ferromanganese Nodules from the Central Indian Ocean Basin. In Handbook of Marine Mineral Deposits, Cronan D., Ed.; CRC Press: London, UK, 2000; pp. 171–197. [Google Scholar]
  10. González, F.J.; Somoza, L.; Hein, J.R.; Medialdea, T.; León, R.; Urgorri, V.; Reyes, J.; Martín-Rubí, J.A. Phosphorites, Co-rich Mn nodules, and Fe-Mn crusts from Galicia Bank, NE Atlantic: Reflections of Cenozoic tectonics and paleoceanography. Geochem. Geophys. Geosyst. 2016, 17. [Google Scholar] [CrossRef] [Green Version]
  11. Zhong, Y.; Liu, Q.S.; Chen, Z.; Gonzalez, F.J.; Hein, J.R.; Zhang, J.; Zhong, L.F. Tectonic and paleoceanographic conditions during the formation of ferromanganese nodules from the northern South China Sea based on the highresolution geochemistry, mineralogy and isotopes. Mar. Geol. 2019, 410, 146–163. [Google Scholar] [CrossRef]
  12. Szamałek, K.; Uścinowicz, S.; Zglinicki, K. Rare earth elements in Fe-Mn nodules from the southern baltic sea—A preliminary study. Biul. Panstw. Inst. Geol. 2018, 472, 199–212. (In Polish) [Google Scholar] [CrossRef]
  13. Maciąg, Ł.; Zawadzki, D.; Kotarba, M.J.; Piestrzyński, A.; Kotliński, R.A.; Wróbel, R.; Zych, H. Thermal Properties and Burial Alteration of Deep-Sea Sediments: New Indicators of Oxic–Suboxic Diagenesis. Minerals 2020, 10, 901. [Google Scholar] [CrossRef]
  14. Kuhn, T.; Wegorzewski, A.; Rühlemann, C.; Vink, A. Composition, Formation, and Occurrence of Polymetallic Nodules. In Deep-Sea Mining Resource Potential, Technical and Environmental Considerations; Sharma, R., Ed.; Springer: Berlin/Heidelberg, Germany, 2017; pp. 23–64. [Google Scholar] [CrossRef] [Green Version]
  15. Heller, C.; Kuhn TVersteegh, G.J.M.; Wegorzewski, A.V.; Kasten, S. The geochemical behavior of metals during early diagenetic alteration of buried manganese nodules. Deep. Sea Res. Part I Oceanogr. Res. Pap. 2018, 142, 16–33. [Google Scholar] [CrossRef]
  16. Hein, J.R.; Koschinsky, A. Deep-ocean ferromanganese crusts and nodules. In The Treatise on Geochemistry; Scott, S., Ed.; Elsevier BV: Amsterdam, The Netherlands, 2014; Volume 12, pp. 273–291. [Google Scholar] [CrossRef]
  17. Chester, R.; Jickells, T.D. Marine Geochemistry, 3rd ed.; Wiley-Blackwell: Hoboken, NJ, USA, 2012; ISBN 978-1-118-34907-6. [Google Scholar]
  18. Koschinsky, A.; Hein, J.R.; Kraemer, D.; Foster, A.L.; Kuhn, T.; Halbach, P. Platinum enrichment and phase associations in marine ferromanganese crusts and nodules based on a multi-method approach. Chem. Geol. 2020, 539. [Google Scholar] [CrossRef]
  19. Hein, J.R.; Yeh, H.-W.; Alexander, E. Origin of iron-rich montmorillonite from the manganese nodule belt of the north equatorial Pacific. Clays Clay Min. 1979, 27, 185–194. [Google Scholar] [CrossRef]
  20. Koschinsky, A.; Halbach, P. Sequential leaching of marine ferromanganese precipitates: Genetic implications. Geochim. Cosmochim. Acta 1995, 59, 5113–5132. [Google Scholar] [CrossRef]
  21. Pattan, J.N.; Parthiban, G. Do manganese nodules grow or dissolve after burial? Results from the Central Indian Ocean Basin. J. Asian Earth Sci. 2007, 30, 696–705. [Google Scholar] [CrossRef] [Green Version]
  22. Mel’nikov, M.E.; Avdonin, V.V.; Pletnev, S.P.; Sedysheva, T.E. Buried ferromanganese nodules of the Magellan Seamounts. Lithol. Miner. Resour. 2016, 51, 1–12. [Google Scholar] [CrossRef]
  23. Wang, X.; Schlossmacher, U.; Wiens, M.; Schroeder, H.C.; Mueller, W.E.G. Biogenic Origin of Polymetallic Nodules from the Clarion-Clipperton Zone in the Eastern Pacific Ocean: Electron Microscopic and EDX Evidence. Mar. Biotechnol. 2009, 11, 99–108. [Google Scholar] [CrossRef]
  24. Oda, H.; Usui, A.; Miyagi, I.; Joshima, M.; Weiss, B.P.; Shantz, C.; Fong, L.E.; McBride, K.K.; Harder, R.; Baudenbacher, F.J. Ultrafine-scale magnetostratigraphy of marine ferromanganese crust. Geology 2011, 39, 227–230. [Google Scholar] [CrossRef] [Green Version]
  25. Yi, L.; Medina-Elizalde, M.; Kletetschka, G.; Yao, H.; Simon, Q.; Paterson, G.A.; Bourlès, D.L.; Deng, X.; Du, J.; Qin, H.; et al. The potential of marine ferromanganese nodules from Eastern Pacific as recorders of Earth’s magnetic field changes during the past 4.7 Myr: A geochronological study by magnetic scanning and authigenic 10Be/9Be dating. J. Geophys. Res. Solid Earth 2020, 125. [Google Scholar] [CrossRef]
  26. Hein, J.R.; Mizell, K.; Koschinsky, A.; Conrad, T.A. Deep-ocean mineral deposits as a source of critical metals for high- and green-technology applications: Comparison with land-based resources. Ore Geol. Rev. 2013, 51, 1–14. [Google Scholar] [CrossRef]
  27. Zawadzki, D.; Kotliński, R. Uwarunkowania występowania i rozmieszczenia perspektywicznych nagromadzeń tlenkowych skupień żelazowo-manganowych. Górnictwo Geoinżynieria 2011, 35, 427–439. (In Polish) [Google Scholar]
  28. Kotliński, R. Konkrecje polimetaliczne. In Surowce Mineralne Mórz i Oceanów; Kotliński, R., Szamałek, K., Eds.; Wydawnictwo Naukowe Scholar: Warszawa, Poland, 1998; pp. 127–184. (In Polish) [Google Scholar]
  29. Kuhn, T.; Wegorzewski, A.V.; Heller, C.; Rühlemann, C. The mineralogy of marine Fe-Mn oxides and consequences for the extraction of metals. In Harvesting Seabed Minerals Resources in Harmony with Nature; Hein, J.R., Barriga, F.J.A.S., Morgan, C.L., Eds.; UMI: Lisbon, Portugal, 2014. [Google Scholar]
  30. Piper, D.Z. Rare Earth Elements in Ferromanganese Nodules and Other Marine Phases. Geochim. Cosmochim. Acta 1974, 38, 1007–1022. [Google Scholar] [CrossRef]
  31. Wegorzewski, A.V.; Kuhn, T.; Dohrmann, R.; Wirth, R.; Grangeon, S. Mineralogical characterization of individual growth structures of Mn-nodules with different Ni+Cu content from the central Pacific Ocean. Am. Mineral. 2015, 100, 497–2508. [Google Scholar] [CrossRef]
  32. Chukrov, F.V.; Zvyagin, B.B.; Yermilova, L.P.; Gorshkov, A.I. Mineralogical Criteria in the Origin of Marine Iron-Manganese Nodules. Miner. Deposita 1976, 11, 24–32. [Google Scholar] [CrossRef]
  33. Vereshchagin, O.S.; Perova, E.N.; Brusnitsyn, A.I.; Ershova, V.B.; Khudoley, A.K.; Shilovskikh, V.V.; Molchanova, E.V. Ferro-manganese nodules from the Kara Sea: Mineralogy, geochemistry and genesis. Ore Geol. Rev. 2019, 106, 192–204. [Google Scholar] [CrossRef]
  34. Josso, P.; Pelleter, E.; Pourret, O.; Fouquet, Y.; Etoubleau, J.; Cheron, S.; Bollinger, C. A new discrimination scheme for oceanic ferromanganese deposits using high field strength and rare earth elements. Ore Geol. Rev. 2017, 87, 3–15. [Google Scholar] [CrossRef] [Green Version]
  35. von Stackelberg, U. Manganese Nodules of the Peru Basin. In Handbook of Marine Mineral Deposits; Cronan, D., Ed.; CRC Press: London, UK, 2000; pp. 197–238. [Google Scholar]
  36. Li, Y.; Song, H.; Li, J. Extraterrestrial 3He in marine polymetallic nodules: A potential method for measuring growth rate of nodules. Sci. China Ser. B Chem. 2002, 45, 38–46. [Google Scholar] [CrossRef]
  37. Zhang, Z.G.; Du, Y.S.; Wu, C.H.; Fang, N.Q.; Yang, S.X.; Liu, J.; Song, C.B. Growth of a polymetallic nodule from northwestern continental margin of the South China Sea and its response to changes in paleoceanographical environment of the late Cenozoic. Sci. China Earth Sci. 2013, 56, 453–463. [Google Scholar] [CrossRef]
  38. Huang, Y.; Duan, W. Biostratigraphic study of polymetallic nodules in Central Pacific Ocean. Mar. Geol. Quat. Geol. 1994, 14, 95–104. [Google Scholar]
  39. Somayajulu, B.L.K. Growth rates of oceanic manganese nodules: Implications to their genesis, palaeo-earth environment and resource potential. Curr. Sci. 2000, 78, 300–309. [Google Scholar]
  40. Achurra, L.E.; Lacassie, J.P.; Le Roux, J.P.; Marquardt, C.; Belmar, M.; Ruiz-del-Solar, J.; Ishman, S.E. Manganese nodules in the Miocene Bahía Inglesa Formation, north-central Chile: Petrography, geochemistry, genesis and palaeoceanographic significance. Sediment. Geol. 2009, 217, 128–139. [Google Scholar] [CrossRef]
  41. Kotliński, R. Pole konkrecjonośne Clarion-Clipperton—Źródło surowców w przyszłości. Górnictwo Geoinżynieria 2011, 35, 195–214. (In Polish) [Google Scholar]
  42. Glover, A.; Dahlgren, T.; Wiklund, H.; Mohrbeck, I.; Smith, C. An End-to-End DNA Taxonomy Methodology for Benthic Biodiversity Survey in the Clarion-Clipperton Zone, Central Pacific Abyss. J. Mar. Sci. Eng. 2016, 4, 2. [Google Scholar] [CrossRef] [Green Version]
  43. Juan, C.; van Rooij, D.; de Bruycker, W. An assessment of bottom current controlled sedimentation in Pacific Ocean abyssal environments. Mar. Geol. 2018, 403, 20–33. [Google Scholar] [CrossRef]
  44. Mewes, K.; Mogollón, J.M.; Picard, A.; Rühlemann, C.; Kuhn, T.; Nöthen, K.; Kasten, S. Impact of depositional and biogeochemical processes on small scale variations in nodule abundance in the Clarion-Clipperton Fracture Zone. Deep. Sea Res. Part I Oceanogr. Res. Pap. 2014, 91, 125–141. [Google Scholar] [CrossRef]
  45. IOM Interoceanmetal Joint Organization. Available online: iom.gov.pl (accessed on 28 June 2021).
  46. NOAA. Available online: maps.ngdc.noaa.gov (accessed on 28 May 2021).
  47. Marine Regions Database. Available online: marineregions.org (accessed on 28 May 2021).
  48. Li, C.-F.; Wang, J. Thermal structures of the Pacific lithosphere from magnetic anomaly inversion. Earth Planet. Phys. 2018, 2, 52–66. [Google Scholar] [CrossRef]
  49. Yubko, V.; Kotliński, R. Volcanic, tectonic and sedimentary factors. In Prospectors Guide for the Clarion–Clipperton Zone Polymetallic Nodule Deposits, Development of a Geological Models for the Clarion-Clipperton Zone Polymetallic Nodule Deposit; Morgan, C., Ed.; ISA: Kingston, Jamaica, 2009; Volume 1, pp. 11–34. [Google Scholar]
  50. Volz, J.B.; Mogollón, J.M.; Geibert, W.; Arbizu, P.M.; Koschinsky, A.; Kasten, A. Natural spatial variability of depositional conditions, biogeochemical processes and element fluxes in sediments of the eastern Clarion-Clipperton Zone, Pacific Ocean. Deep. Sea Res. Part I 2018, 140, 159–172. [Google Scholar] [CrossRef]
  51. Lutz, M.J.; Caldeira, K.; Dunbar, R.B.; Behrenfeld, M.J. Seasonal rhythms of net primary production and particulate organic carbon flux to depth describe the efficiency of biological pump in the global ocean. J. Geophys. Res. 2007, 112. [Google Scholar] [CrossRef]
  52. Amon, D.J.; Ziegler, A.F.; Dahlgren, T.G.; Glover, A.G.; Goineau, A.; Gooday, A.J.; Wiklund, H.; Smith, C.R. Insights into the abundance and diversity of abyssal megafauna in a polymetallic-nodule region in the eastern Clarion-Clipperton Zone. Sci. Rep. 2016, 6, 30492. [Google Scholar] [CrossRef]
  53. Volz, J.B.; Liu, B.; Köster, M.; Henkel, S.; Koschinsky, A.; Kasten, S. Post-depositional manganese mobilization during the last glacial period in sediments of the eastern Clarion-Clipperton Zone, Pacific Ocean. Earth Planet. Sci. Lett. 2020, 532. [Google Scholar] [CrossRef]
  54. Wang, C.S.; Liao, L.; Xu, H.X.; Xu, X.W.; Wu, M.; Zhu, L.Z. Bacterial diversity in the sediment from polymetallic nodule fields of the Clarion-Clipperton Fracture Zone. J. Microbiol. 2010, 48, 573–585. [Google Scholar] [CrossRef]
  55. Match!—Phase Analysis Using Powder Diffraction, Crystal Impact—Dr. H. Putz & Dr. K. Brandenburg GbR, Kreuzherrenstr. 102, 53227 Bonn, Germany. Available online: https://www.crystalimpact.de/match (accessed on 1 June 2021).
  56. Vaitkus, A.; Merkys, A.; Gražulis, S. Validation of the Crystallography Open Database using the Crystallographic Information Framework. J. Appl. Crystallogr. 2021, 54, 661–672. [Google Scholar] [CrossRef] [PubMed]
  57. Webmineral Database. Available online: www.wbmineral.com (accessed on 26 June 2021).
  58. Manheim, F.T.; Lane-Bostwick, C.M. Cobalt in ferromanganese crusts as a monitor of hydrothermal discharge on the Pacific sea floor. Nature 1988, 335, 59–62. [Google Scholar] [CrossRef]
  59. Manceau, A.; Lanson, M.; Takahashi, Y. Mineralogy and crystal chemistry of Mn, Fe, Co, Ni, and Cu in a deep-sea Pacific polymetallic nodule. Am. Mineral. 2014, 99, 2068–2083. [Google Scholar] [CrossRef]
  60. Golden, D.C.; Chen, C.C.; Dixon, J.B. Transformation of Birnessite to Buserite, Todorokite, and Manganite under Mild Hydrothermal Treatment. Clays Clay Miner. 1987, 35, 271–280. [Google Scholar] [CrossRef]
  61. Wegorzewski, A.V.; Grangeon, S.; Webb, S.M.; Heller, C.; Kuhn, T. Mineralogical transformations in polymetallic nodules and the change of Ni, Cu and Co crystal-chemistry upon burial in sediments. Geochim. Cosmochim. Acta 2020, 282, 19–37. [Google Scholar] [CrossRef]
  62. Pratt, B.R. Septarian concretions: Internal cracking caused by synsedimentary earthquakes. Sedimentology 2001, 48, 189–213. [Google Scholar] [CrossRef]
  63. Bonatti, E.; Kraemer, T.; Rydell, H. Classification and genesis of submarine iron-manganese deposits. In Ferromanganese Deposits on the Ocean Floor, 1st ed.; Horn, D.R., Ed.; National Science Foundation: Washington, DC, USA, 1972; pp. 149–161. [Google Scholar]
  64. Cronan, D.S. Underwater Minerals; Academic Press: London, UK, 1980; pp. 1–362. [Google Scholar]
  65. Lawrence, K.T.; Liu, Z.; Herbert, T.D. Evolution of the Eastern Tropical Pacific Through Plio-Pleistocene Glaciation. Science 2006, 312, 79–83. [Google Scholar] [CrossRef] [Green Version]
  66. Ehrlich, H.L. Bacteriology of manganese nodules. I. Bacterial action on manganese in nodule enrichments. Appl. Microbiol. 1963, 11, 15–19. [Google Scholar] [CrossRef]
  67. Ehrlich, H.L. Reaction with manganese by bacteria from marine ferromanganese nodules. Dev. Ind. Microbiol. 1966, 7, 43–60. [Google Scholar]
  68. Ehrlich, H.L. Bacteriology of manganese nodules. II. Manganese oxidation by cell-free extract from a manganese nodule bacterium. Appl. Microbiol. 1968, 16, 197–202. [Google Scholar] [CrossRef]
  69. Prieto-Barajas, C.M.; Valencia-Cantero, E.; Santoyo, G. Microbial mat ecosystems: Structure types, functional diversity, and biotechnological application. Electron. J. Biotechnol. 2018, 31, 48–56. [Google Scholar] [CrossRef]
  70. Goldberg, E.D.; Arrhenius, G. Chemistry of pelagic sediments. Geochim. Acta 1958, 13, 153–212. [Google Scholar] [CrossRef]
  71. Bishop, J.K.B. The barite-opal-organic carbon association in oceanic particulate matter. Nature 1988, 311, 341–343. [Google Scholar] [CrossRef]
  72. Griffith, E.M.; Paytan, A. Barite in der ocean—Occurrence, geochemistry and palaeoceanographic applications. Sedimentology 2012, 59, 1817–1835. [Google Scholar] [CrossRef]
  73. Hein, J.R.; Konstantinova, N.; Mikesell, M.; Mizell, K.; Fitzsimmons, J.N.; Lam, P.J.; Jensen, L.T.; Xiang, Y.; Gartman, A.; Cherkashov, G.; et al. Arctic deep water ferromanganese-oxide deposits reflect the unique characteristics of the Arctic Ocean. Geochem. Geophys. Geosyst. 2017, 18, 3771–3800. [Google Scholar] [CrossRef]
  74. Conrad, T.A.; Hein, J.R.; Paytan, A.; Clague, D.A. Formation of Fe-Mn crusts within a continental margin environment. Ore Geol. Rev. 2017, 87, 25–40. [Google Scholar] [CrossRef]
  75. Halbach, P.; Gursky, H.J.; Gursky, M.M.; Schmidt-Effing, R.; Maresch, W.V. Composition and formation of fossil manganese nodules in Jurassic to Cretaceous radiolarites from the Nicoya Ophiolite Complex (NW Costa Rica). Miner. Deposita 1992, 27, 153–160. [Google Scholar] [CrossRef]
  76. McMahon, S.; van Smeerdijk Hood, A.; McIlroy, D. The origin and occurrence of subaqueous sedimentary cracks. In Earth System Evolution and Early Life: A Celebration of the Work of Martin Brasier; Brasier, A.T., McIlroy, D., McLoughlin, N., Eds.; Geological Society Special Publication: London, UK, 2017; Volume 48, p. 285. [Google Scholar] [CrossRef]
  77. Liu, J.; Tian, J.; Liu, Z.; Herbert, T.D.; Fedorov, A.V.; Lyle, M. Eastern equatorial Pacific cold tongue evolution since the late Miocene linked to extratropical climate. Sci. Adv. 2019, 5, eaau6060. [Google Scholar] [CrossRef] [Green Version]
  78. Maciąg, Ł.; Harff, J. Application of multivariate geostatistics for local-scale lithological mapping—Case study of pelagic surface sediments from the Clarion-Clipperton Fracture Zone, north-eastern equatorial Pacific (Interoceanmetal claim area). Comput. Geosci. 2020, 139, 104474. [Google Scholar] [CrossRef]
  79. Versteegh, G.J.M.; Koschinsky, A.; Kuhn, T.; Preuss, I.; Kasten, S. Geochemical consequences of oxygen diffusion from the oceanic crust into overlying sediments and its significance for biogeochemical cycles based on sediments of the NE Pacific. Biogeosci. Discuss. 2021, 1–34. [Google Scholar] [CrossRef]
  80. Ronge, T.A.; Nürnberg, D.; Tiedemann, R. Plio-Pleistocene Variability of the East Pacific Thermocline and Atmospheric Systems. Paleoceanogr. Paleoclimatol. 2020, 35, e2019PA003758. [Google Scholar] [CrossRef]
  81. Li, L.; Li, Q.; Tian, J.; Wang, P.; Wang, H.; Liu, Z. A 4-Ma record of thermal evolution in the tropical western Pacific and its implications on climate change. Earth Planet. Sci. Lett. 2011, 309, 10–20. [Google Scholar] [CrossRef]
  82. Jiang, X.; Zhao, X.; Zhao, X.; Chou, Y.M.; Hein, J.R.; Sun, X.; Zhong, Y.; Ren, J.; Liu, Q. A magnetic approach to unravelling the paleoenvironmental significance of nanometer-sized Fe hydroxide in NW Pacific ferromanganese deposits. Earth Planet. Sci. Lett. 2021, 565, 116945. [Google Scholar] [CrossRef]
  83. Ma, Z.; Ravelo, A.C.; Liu, Z.; Zhou, L.; Paytan, A. Export production fluctuations in the eastern equatorial Pacific during the Pliocene-Pleistocene: Reconstruction using barite accumulation rates. Paleoceanography 2015, 30, 1455–1469. [Google Scholar] [CrossRef] [Green Version]
  84. Andrushchenko, N.F.; Gradusov, B.P.; Yeroshchev-Shak, V.A.; Yanshina, R.S.; Borisovskiy, S.Y. Composition and structure of metamorphosed ferromanganese nodules, new vein formations of manganese hydroxides, and the surrounding pelagic sediments in the Southern Basin of the Pacific Ocean floor. Int. Geol. Rev. 1975, 17, 1375–1392. [Google Scholar] [CrossRef]
  85. Grangeon, S.; Lanson, B.; Lanson, M. Solid-state transformation of nanocrystalline phyllomanganate into tectomanganate: Influence of initial layer and interlayer structure. Acta Crystallogr. 2014, 70, 828–838. [Google Scholar] [CrossRef] [PubMed]
  86. Banerjee, R.; Roy, S.; Dasgupta, S.; Mukhopadhyay, S.; Miura, H. Petrogenesis of ferromanganese nodules from east of the Chagos Archipelago, Central Indian Basin, Indian Ocean. Mar. Geol. 1999, 157, 145–158. [Google Scholar] [CrossRef]
Figure 1. Factors impacting the formation and growth of polymetallic nodules (based on reference [13]). OMZ, oxygen minimum zone; CCD, carbonate compensation depth.
Minerals 11 00868 g001
Figure 2. The location of study area: (a) general view of the Clarion-Clipperton Fracture Zone and (b) simplified relief of the seafloor and location of the IOM sampling sites within the CCFZ. The study area is characterized by the presence of two major structural forms of the seafloor: (i) volcanic hills located in the S and NE parts of the study area, and (ii) N–S-oriented blocky streaks and escarpments covering the rest of the area. The relief data were collected using backscatter profiling.
Minerals 11 00868 g002
Figure 3. Representative examples of 3 major types of polymetallic nodules collected in the area of the IOM CCFZ: (a) diagenetic (D), (b) hydrogenetic (H), and (c) mixed hydrogenetic–diagenetic (HD). All photographs are from reference [43].
Minerals 11 00868 g003
Figure 4. Bulk XRD diffraction patterns of the analyzed polymetallic nodules from the IOM claim area CCFZ. The identified minerals are: Tod—todorokite/buserite), Bir—birnessite, Ver—vernadite, Cl—clays (potentially Fe-rich smectite/Mo—montmorillonite and Non—nontronite), Na-Phi—Na-phillipsite, Ba—barite, Ap—apatite, and Q—quartz.
Minerals 11 00868 g004
Figure 5. Representative EPMA BSE images of the analyzed polymetallic nodules. Sample 3642: (a) massive bright and well-developed colloforms composed of pure Mn oxyhydroxides enriched with Ni and Cu (9,10); no. 11 is an intraclast of Fe-rich clay minerals. Sample 3602: (b) typical Mn-rich diagenetic colloforms enriched with metals (5,6) and bordering a zone of veinlets and Fe-rich clay aggregates (4). (c) Typical Mn-colloforms enriched with metals. (d) Two generations of columnar growth visible in the external group of colloforms: (13) grey massive colloforms of the vernadite type enriched with Co (>0.6%) and (14) bright lamellar colloforms composed of Mn-rich oxyhydroxides and enriched with Ni and Cu (>4.0%). Sample 3613: (e) columnar Mn oxyhydroxides enriched with Ni and Cu overgrown on massive clay minerals (14) cut by several diagenetic veinlets composed of metal-rich Mn (Fe) oxyhydroxides. Sample 3535: (f) Mn-(Fe) colloforms surrounding small clay aggregates, (10) as well as a pennate diatom.
Minerals 11 00868 g005aMinerals 11 00868 g005b
Figure 6. BSE thin section across a nodule—contact zone between the core and colloforms composed of microlayers of biogenic (microbial) origin. Sample 3604, IOM, CCFZ.
Minerals 11 00868 g006
Figure 7. Mineral admixtures observed in polymetallic nodules from the IOM claim area CCFZ. Sample 3537: (a) massive lamellar vernadite-type (13) and bright columnar colloforms (15) with a number of small barite crystals and clay infillings (14). Sample 3642: (b) dotted irregular texture indicating a mixture of pure Mn oxyhydroxides enriched with Ni and Cu, as well as Fe-rich clays. Sample 3604: (c) Fe-rich clay aggregates (3) and bright veinlets rich in Mn and metals developed as diagenetic cementations. (d) Mn-Fe colloforms with irregular infillings extremely rich in barite (bright spots) and debris minerals such as plagioclase (albite) (9), zoisite (10), and quartz/chalcedony (11). Sample 3642: (e) thick diagenetic vein filled with Fe-rich clay minerals and barite. Sample 3542: (f) massive patchy texture composed of a mixture of Mn-(Fe) oxyhydroxides and clays; in the upper-right corner, massive and crushed clays.
Minerals 11 00868 g007
Figure 8. Representative examples of the biomorphic remnants discovered in the analyzed polymetallic nodules from the IOM claim area CCFZ. Sample 3604: (a) porous relics of diatoms and radiolarians surrounded with massive Mn-rich oxyhydroxides, (b) a pseudomorph of symmetrical radiolarian filled with pure Mn-rich oxyhydroxides, and a (c) remnant of cylindrical diatom composed of pure Mn-rich oxyhydroxides developed as fine needles and surrounded by other pseudomorphs and debris minerals (e.g., albite). Sample 3537: (d) siliceous remnants of radiolarian surrounded by Mn (Fe) oxyhydroxides, clays, and barite. Sample 3642: (e) a globule (vitroclast) composed of ferro-aluminoceladonite (18), as a potential product of crystal-vitric tuff alterations. Sample 3615: (f) radiolarian pseudomorph surrounded with Ni–Cu-rich colloforms of pure Mn oxyhydroxides.
Minerals 11 00868 g008aMinerals 11 00868 g008b
Figure 9. Representative example of the EPMA X-ray maps of the massive botryoidal textures observed in the polymetallic nodules from the IOM claim area CCFZ: Sample 3602: (a) BSE image, (b) Ti distribution, (c) Mn distribution, (d) Fe distribution, (e) Ni distribution, (f) Cu distribution, (g) Co distribution, and (h) Zn distribution. The total counts are presented as a color scale unit.
Minerals 11 00868 g009aMinerals 11 00868 g009b
Figure 10. Location of the EPMA spot data at the Fe-Mn-10 (∑(Ni, Co, and Cu)) ternary plot; 2.5–5.0 = Mn/Fe ratio (reference [63] with further modifications). Coloring identifying major genetic types of analyzed colloforms.
Minerals 11 00868 g010
Figure 11. Hierarchical tree plot indicating the relationships between the metals in the analyzed polymetallic nodules. Agglomeration of the 25 variables using Ward’s method. The distances were scaled according to the equation: D = (Dlink/Dmax) × 100.
Minerals 11 00868 g011
Figure 12. Representative example of EPMA complex chemostratigraphic back-stripping using Co-chronometer data in relation to the geochemistry, magnetic anomalies of the seafloor, and selected palaeoceanographic parameters of the surface seawater (productivity and temperature curves from reference [65]). Sample 3614, sD nodule. The analyzed nodule is characterized by slightly asymmetric growth and a small number of internal cracks. The nucleus (1st generation) developed as a highly diagenetic, compacted, Fe-rich mudstone formed during the Early Pleistocene (Middle Matuyama MZ) when the productivity increased and sea surface temperature decreased. The growth rates increase toward the rim part of the nodule (pink trend line), followed by a distinctive increase in the contents of the analyzed metals, potentially due to the effects of a slight cooling, lower productivity, and elevation of the thermocline, which resulted in a lower Fe content (Bruhnes MZ; generations V–VII). The potential hiatuses indicated in the figure are related to rapid changes in the lithology. The yellow A–B line at the thin section photograph shows EPMA profiling line.
Minerals 11 00868 g012
Figure 13. Representative example of EPMA complex chemostratigraphic back-stripping using Co-chronometer data in relation to the geochemistry, magnetic anomalies of the seafloor, and selected palaeoceanographic parameters of the surface seawater (productivity and temperature curves from reference [65]). Sample 3535, HD nodule. The analyzed nodule is characterized by a visible bimodality of the nucleation processes. The external layers show typical hydrogenic influences; however, the middle and interior indicate the highest diagenetic input. The growth ratio decreases toward the rim. The Ti content shows different trends and is negatively correlated with Mn. The highest content of the metals is observed in the middle and core parts of the nodule. The highest content of iron (vernadite-rich colloforms) is indicated to be in the Late Pleistocene (Early Matuyama MZ), affected by the increase in productivity and decrease in the sea surface temperature. The yellow A–B line at the thin section photograph shows EPMA profiling line.
Minerals 11 00868 g013
Figure 14. Comparison of the microbial mats (left) [69] with laminae of biogenic (microbial) origin in a polymetallic nodule (right, area between the white lines) in sample 3604.
Minerals 11 00868 g014
Figure 15. Simplified scheme of nodule cracking due to cement growth: (ag) the steps of the cracking process from a solid (a) to a broken nodule (g). Nodule crack caused by internal tension in the vein created by crystal growth inside the intranodulith. Red arrows indicate internal tension forces.
Minerals 11 00868 g015
Figure 16. An example of a nodule-bearing seabed; the crushed fragments of nodules are marked by red circles. Photo from reference [45].
Minerals 11 00868 g016
Table 1. General descriptions of the collected polymetallic nodules from the IOM claim area.
Sample IDDepth (m)LatitudeLongitudeXY Dimensions (cm)Growth Type 1
3529431011°13.180′ N119°38.751′ W6.5 × 5.5D
3535432311°14.863′ N119°40.850′ W3.5 × 1.5D
3537427211°18.090′ N119°34.017′ W3.5 × 1.5D-HD
3542436311°23.488′ N119°30.562′ W4.0 × 2.5H
3602451111°10.743′ N119°28.785′ W4.5 × 3.0D
3603443911°12.007′ N119°26.161′ W3.5 × 4.0D
3604440211°12.352′ N119°33.851′ W5.0 × 2.5D
3605437811°13.127′ N119°32.165′ W4.5 × 3.0D
3613447511°21.657′ N119°30.611′ W5.0 × 1.0HD
3614436111°21.561′ N119°28.868′ W1.5 × 1.5H-HD
3615436911°24.591′ N119°28.489′ W4.5 × 3.0H-HD
1 Morphotype from reference [56].
Table 2. Mineral compositions of the bulk polymetallic nodule samples from the IOM claim area, as determined by XRD. The amount of minerals is shown semi-quantitatively based on the results of the peak comparisons and integration: ++++ dominating <50%, +++ 50–30%, ++ 30–10%, + 10–5%, and (+) traces <5%.
Sample IDTypeTodorokite/BuseriteBirnessiteVernaditeClaysBariteApatiteZeolitesQuartz
3529D+++++(+)+(+)+++(+)
3535D++++++(+)+(+)++(+)
3537AD-HD++++(+)++(+)(+)+++
3537BD-HD+++++(+)++(+)+-+
3542H+++++(+)++(+)+++(+)
3602D++++++(+)-(+)(+)+(+)
3603D+++++(+)++(+)(+)++
3604D++++++(+)+(+)(+)+(+)
3605D++++++(+)+++---
3613HD+++++(+)++(+)+++(+)
3614H-HD++++++(+)+(+)-++(+)
3615H-HD++++(+)++(+)-+++(+)
Table 3. Mean EPMA data (N = 191) of the analyzed polymetallic nodules from the CCFZ IOM claim area. Contents of the chemical elements are given in wt %.
IDN1Type 2FNaSiAlMgPClKSCaBaTiPbFeMnCrCuZnVAsSrCoNiAgO-Total∑(Ni,Cu,Co)Mn/FeSi/AlType 3
352913D0.000.996.101.502.050.270.241.190.071.190.440.210.035.2530.960.000.930.100.050.070.050.260.860.0027.7580.552.045.894.06D
353521D0.001.023.971.542.030.290.280.720.081.730.220.270.045.4830.210.001.300.150.050.070.070.231.360.0025.5676.712.895.512.57D
3537A14D-HD0.000.988.132.292.070.270.101.160.071.790.180.160.036.0830.520.001.420.190.040.070.060.231.380.0031.4188.643.035.023.56D
3537B9D-HD0.000.905.451.611.800.110.300.840.051.280.180.190.045.0623.910.001.140.110.030.060.050.191.130.0023.5367.962.464.733.39HD
354224H0.001.2912.033.561.970.110.141.550.061.600.200.240.027.2623.430.000.770.090.040.070.050.160.930.0033.9389.511.863.233.38HD
360216D0.000.854.630.932.040.250.121.020.051.550.650.200.036.1836.330.001.030.140.070.070.080.201.110.0028.4485.982.345.884.96D
360318D0.001.415.021.362.110.280.151.060.051.640.280.110.035.9035.200.001.410.190.050.070.060.131.520.0029.0687.103.065.973.68D
360414D0.011.167.061.752.490.120.111.230.051.240.580.080.015.3032.380.001.110.160.060.070.050.151.070.0029.8986.132.336.114.03D
360521D0.010.923.181.102.100.160.131.040.071.420.470.100.033.1638.870.001.390.170.070.070.070.201.470.0026.7882.943.0512.322.89sD
361315HD0.000.897.081.671.810.140.720.840.071.300.440.280.048.2523.670.000.640.070.080.070.060.310.600.0026.6775.711.542.874.23HD
361413H-HD0.011.259.823.261.850.170.661.630.151.150.170.280.048.1319.570.000.760.090.040.060.050.251.060.0029.8680.302.072.413.01HD
361512H-HD0.001.3611.983.851.810.130.142.290.061.280.240.190.015.3123.810.000.780.140.050.060.050.061.050.0033.4288.081.894.493.11HD
Mean0.001.097.042.042.010.190.261.210.071.430.340.190.035.9529.070.001.060.130.050.070.060.201.130.0028.8682.472.385.373.57-
Min0.000.853.180.931.800.110.100.720.051.150.170.080.013.1619.570.000.640.070.030.060.050.060.600.0023.5367.961.542.412.57-
Max0.011.4112.033.852.490.290.722.290.151.790.650.280.048.2538.870.001.420.190.080.070.080.311.520.0033.9389.513.0612.324.96-
SD0.000.192.830.940.180.070.210.410.030.210.160.070.011.355.840.000.270.040.010.000.010.060.260.002.966.220.502.430.64-
1N–number of EPMA analytical points. 2 According to the morphology [2]. 3 According to the Mn/Fe ratio.
Table 4. Comparison of the Co-chronometer mean growth rate estimation and polymetallic nodule ages using the EPMA spot data and back-stripping of the geochemical profiles.
IDAge Spot EPMA(Ma)Age Profile EPMA (Ma)Mean R EPMA (mm/Myr)Age Difference (Ma)Relative Age Difference (%)Type 1
35293.99-3.8--D
35353.152.784.30.37−11.7D
3537A1.702.035.00.33+19.4D
3537B1.83-4.4--D
35422.80-6.4--D
36022.973.099.00.06+2.0D
36031.41-14.2--sD
36041.992.1610.50.17+8.5sD
36052.702.298.30.41−15.2D
36132.572.252.70.32−12.5HD
36141.991.662.60.33−16.6HD
36153.053.256.5--sD
Mean2.512.446.50.28−3.7-
St. dev.0.710.513.30.1112.9-
1 According to reference [64]: D—diagenetic, HD—mixed hydrogenetic-to-diagenetic, and sD—suboxic diagenetic.
Publisher’s Note: MDPI stays neutral with regard to jurisdictional claims in published maps and institutional affiliations.

