Article

Pb2+ Uptake by Magnesite: The Competition between Thermodynamic Driving Force and Reaction Kinetics

by
Fulvio Di Lorenzo
1,*,
Tobias Arnold
1 and
Sergey V. Churakov
1,2
1
Institute of Geological Sciences, University of Bern, Baltzerstrasse 3, CH-3012 Bern, Switzerland
2
Laboratory for Waste Management, Paul Scherrer Institute, Forschungsstrasse 111, CH-5232 Villigen, Switzerland
*
Author to whom correspondence should be addressed.
Minerals 2021, 11(4), 415; https://doi.org/10.3390/min11040415
Submission received: 2 April 2021 / Revised: 11 April 2021 / Accepted: 12 April 2021 / Published: 14 April 2021

Abstract

:
The thermodynamic properties of carbonate minerals suggest a possibility for the use of the abundant materials (e.g., magnesite) for removing harmful divalent heavy metals (e.g., Pb2+). Despite the favourable thermodynamic condition for such transformation, batch experiments performed in this work indicate that the kinetic of the magnesite dissolution at room temperature is very slow. Another set of co-precipitation experiments from homogenous solution in the Mg-PbII-CO2-H2O system reveal that the solids formed can be grouped into two categories depending on the Pb/Mg ratio. The atomic ratio Pb/Mg is about 1 and 10 in the Mg-rich and Pb-rich phases, respectively. Both phases show a significant enrichment in Pb if compared with the initial stoichiometry of the aqueous solutions (Pb/Mg initial = 1 × 10 − 2–1 × 10⁻⁴). Finally, the growth of {10.4} magnesite surfaces in the absence and in the presence of Pb2+ was studied by in situ atomic force microscopy (AFM) measurements. In the presence of the foreign ion, a ten-fold increase in the spreading rate of the obtuse steps was observed. Further, the effect of solution ageing was also tested. We observed the nucleation of a secondary phase that quickly grows on the {10.4} surfaces of magnesite. The preferential incorporation of Pb2+ into the solid phase observed during precipitation and the catalytic effect of Pb2+ on magnesite growth are promising results for the development of environmental remediation processes. These processes, different from the transformation of magnesite into cerussite, are not limited by the slow dissolution rate of magnesite. Precipitation and growth require an external carbon source, thus they could be combined with carbon sequestration techniques.

1. Introduction

The formation of carbonate minerals is a complex process with many implications for natural (ocean sedimentation, rock weathering, etc.) and anthropological (scale formation, cement degradation, geological carbon storage, etc.) processes. The ubiquity and the exploitability of carbonates make this material suitable for applications in the field of environmental remediation. Previous studies demonstrated that carbonate minerals could be used to remove harmful divalent heavy metals from water [1,2,3,4,5,6,7]. This process occurs in groundwater reservoirs where the presence of carbonate naturally controls the distribution of divalent heavy metals between the aqueous and the solid phases [8]. When in contact with the most common carbonate minerals, dangerous contaminants such as Pb2+ and Cd2+ are spontaneously taken up by the solid phase assemblage and, thus, removed from the aqueous solution. However, apart from the favourable thermodynamic conditions, such remediation processes also require favourable reaction kinetics. Industrial applications rely on the reactivity of systems which are often far away from thermodynamic equilibrium, and their efficiency is mainly controlled by the reaction time. The kinetics of carbonate mineral reactivity depends on different factors that can be grouped into three categories: (i) physical-chemical properties of the system (temperature, pressure, pH, redox potential, ionic strength, additives); (ii) properties specific to the sample (grain size, surface area, defects and dislocation densities); and (iii) intrinsic factors related to the specific type of mineral (properties of the chemical constituents, hydration, crystalline structure, habit and polymorphism). These kinetic factors can produce a misalignment between experimental results and thermodynamic predictions. A clear example is provided by our recent publications [9,10], which highlighted the influence of polymorphism (calcite and aragonite, CAL and ARG, respectively) and crystallographic relationships between reactants and products during the uptake of Pb2+(aq). The main conclusion of these studies showed that orthorhombic phases are less effective in terms of the mass of remediation agent required to achieve a target Pb2+ uptake per time. These observations motivated the present study. Anhydrous magnesium carbonate, magnesite, has a rhombohedral structure, thus it should be less prone to suffer surface passivation by cerussite. However, magnesite (MGS) is renowned for the slow dissolution and growth kinetics at room temperature conditions in the framework of the so-called dolomite problem [11,12,13]. The reasons underlying this behaviour have been assigned to two peculiar characteristics of this mineral: (i) the lattice limitation in the spatial configuration of the carbonate unit in the crystalline structure [14,15]; (ii) the low polarizability of Mg2+ that leads to a high hydration energy and an elevated residence time of water molecules in the first hydration shell [16,17,18,19]. Recent studies dealing with norsethite, BaMg(CO3)2, hypothesised that the bulk aqueous value of the dehydration energy of Mg2+ is substantially lowered by the interaction between cations taking place at the surface of the solid phase [20]. However, the absence of solid solutions in the system Ba-Mg-CO2-H2O has also been pointed out as a key factor distinguishing the behaviour of norsethite from dolomite [21,22]. Finally, the reaction pathway that leads from amorphous precursors to norsethite is currently being investigated. The existence of crystallization precursors [23,24] or a direct crystallization mechanism [25] has been a matter of debate.
In conclusion, the thermodynamic equilibria and the absence of isomorphism between the reactant and product are favourable factors, although lattice limitations and the elevated cation hydration could be responsible for the slow kinetics. The present investigation of the effectiveness of Pb2+(aq) uptake by MGS aims to answer the question if and under which conditions magnesium carbonate could be used to perform environmental remediation of Pb-bearing wastewaters. To shed light into this process, we used a combination of experimental approaches and analytical techniques. The dissolution of MGS and the interaction with Pb2+(aq) were studied in batch experiments under pH-stat conditions (pH = 5.5), and its behaviour was compared with calcite and aragonite in the same conditions. Complementary information regarding the surface reactivity was obtained with the Atomic Force Microscope (AFM). In situ flow-through experiments were carried out to see the behaviour of the {10.4} surfaces of MGS during dissolution, growth and interaction with aqueous lead. Finally, batch precipitation experiments were performed on the Mg-Pb-H2O-CO2 system to study the incorporation of the heavy metal into the solid phase during nucleation and growth from homogeneous solutions. The experimental results presented in this work are aimed to discuss and carefully evaluate the theoretical possibilities and the practical limitations that must be taken into account for the development of environmental remediation technologies based on magnesite.

2. Thermodynamic Background

The spontaneity of the uptake of heavy metals by carbonate minerals is a consequence of the marked difference in solubility between remediation agents and products. An overview of the solubility products of the most common anhydrous carbonate minerals is provided in Figure 1A. On the left side of Figure 1A, the most soluble carbonate minerals are listed. It is important to notice that the most soluble carbonate minerals are the most abundant in nature (i.e., magnesite, aragonite, calcite and dolomite). On the other hand, the most insoluble carbonate minerals are cerussite and otavite, which are the ones containing Pb2+ and Cd2+, respectively. The high difference in solubility between abundant carbonate minerals (i.e., the potential remediation agent) and heavy-metal bearing carbonates (i.e., the remediation product) provides the thermodynamic driving force that should allow for a spontaneous and self-sustainable remediation process, even at room temperature. The elevated solubility difference between magnesite (MGS) and cerussite (CER) provides the basis for the uptake of aqueous lead (Pb2+(aq)) in the presence of MGS. The results of a simulation for this water-mineral reaction as a function of pH are provided in Figure 1B. Magnesite dissolves and the supply of carbonate ions to the solution allows CER to precipitate. At thermodynamic equilibrium, the initial system constituted by a Mg-rich solid and a Pb-rich solution transforms into a Pb-rich solid and a Mg-rich solution. Similar behaviour is predicted for calcite (Figure 1C), aragonite or dolomite acting as remediation agents for Pb2+ or Cd2+ in solution.

3. Materials and Methods

3.1. Materials

The Natural Museum of Bern provided natural magnesite from Oberdorf im Burgenland (Austria, NMB-A3155), aragonite (Spain, NMB 43411) and calcite (Mexico, NMB B5531). The natural samples were ground using an agate mortar and pestle. After pulverization, sieves were used to separate a grain population with size 66 < Ø < 250 μm. This relatively homogenous population of crystals was washed with technical grade ethanol (94% with isopropanol) while applying ultrasounds for 30 s. Ethanol washing was repeated 3 times. Finally, a single washing with ultrapure H2O (ρ > 18.2 MΩ × cm) was carried out and the samples were dried for 12 h in an oven at 105 °C. The superficial area of the crystals was determined at this stage using Nitrogen Absorption (BET method, Coulter SA3100). The specific surface areas of the fraction of interest for the three minerals were 3.5 m2/g, 6.8 m2/g, and 4.6 m2/g for MGS, ARG and CAL, respectively. Stock solutions were prepared from reagent grade Mg(NO3)2, Pb(NO3)2, NaHCO3 and KNO3 (Sigma Aldrich) dissolved in ultrapure water. Nitrates were used to avoid the formation of secondary Pb-bearing phases associated with the presence of halogens (e.g., phosgenite) [26]. Stock solutions of NaOH and HNO3 were purchased from VWR and used to adjust the pH. Experiments were carried out in borosilicate glassware. Geochemical simulations were performed with PHREEQC using minteq.dat; phreeqc.dat was used for the simulations involving electrical conductivity [27].

3.2. Batch Interaction

Batch experiments of dissolution and Pb uptake were performed under pH stat conditions with OMNIS (Metrohm). Two millimoles of MGS, ARG or CAL powder was inserted into a beaker containing 100 mL of a freshly prepared KNO3 (19 mmol/Kgw) or Pb(NO3)2 (10 mmol/Kgw) solution. A floating magnetic stirrer (ThermoFisher) was used to maximize the mass transport and system homogenization. The pH of the solution was measured continuously to control the addition of nitric acid from the burette with the digital sensor dUnitrode (Metrohm). The conductivity module 856 (Metrohm) was used to determine the electrical conductivity. After 20 h, the experiments were stopped and the samples were filtered (Ø < 0.45 μm) under low vacuum to collect the solid phase. A total of 1 mL of water was passed to avoid salt precipitation. The samples were stored in Petri dishes at 25 °C and low (<40%) relative humidity for more than 1 week before characterization.

3.3. Precipitations

Batch precipitation experiments were performed in Eppendorf tubes containing 1 mL of Mg(NO3)2 + Pb(NO3)2 (1 and 0.01 mol/kg, respectively) mixtures in different ratios, according to the values reported in the Supplementary Materials (Figure S1). After the homogenization with a vortex mixer, 0.5 mL of a NaHCO3 (0.2 mol/kg) solution was added to allow the precipitation of solid phases. The Eppendorf tubes were centrifuged at 6000 rpm for 1 min (VWR MiniStar Silverline) to allow the sedimentation of the precipitate. The liquid was finally removed with a disposable Pasteur pipette (HuberLab). The solids were stored at 25 °C and low relative humidity before characterization.

3.4. In Situ AFM

In situ flow-through Atomic Force Microscopy was performed with a Cypher ES Environmental AFM (Oxford Instruments). The images were recorded in tapping mode at 25 °C using Arrow UHF-AuD probes (NanoWorld). The topographies of the mineral surface were acquired during and after the injection of the solutions into the flow-through cell. The supersaturated solutions used for the MGS growth experiments were prepared analogously to the precipitation experiments. To test the effect of solution ageing, the solutions were either fresh or prepared 2 weeks before the utilization. The aged solution was centrifuged (6000 rpm, 1 min), a second time, just a few hours before the utilization. Magnesite {10.4} surfaces were freshly prepared for the experiments by cleavage using a stainless steel blade. The crystal was stuck on the magnetic holder (Ted Pella) using conductive carbon cement (Leit-C, Agar Scientific). The images were processed uniquely with a zero-order flattening executed by the default software of the Cypher Asylum. The extraction of section profiles and other measurements were performed with the open source software Gwyddion [28].

3.5. Solid Characterization

Scanning electron microscopy was performed in variable pressure mode (p = 20 mPa) on uncoated samples with a Zeiss EVO 50. Backscattered electron images (BSE) and energy-dispersive x-ray spectroscopy (EDX) spectra were collected with an electron acceleration voltage (EHT) of 20 kV. Natural samples of MGS and CER were used as standards to improve the reliability of semi-quantitative EDX analysis. X-ray diffraction of powder samples was measured with a PANalytical Xpert Pro equipped with a Cu X-ray source (working at 40 kV and 40 mA). Diffractograms were recorded between 5° and 70° 2θ. Reference patterns were retrieved from the PDF-2 database; the corresponding ID number is reported in the figure together with the reference spectrum.

4. Results

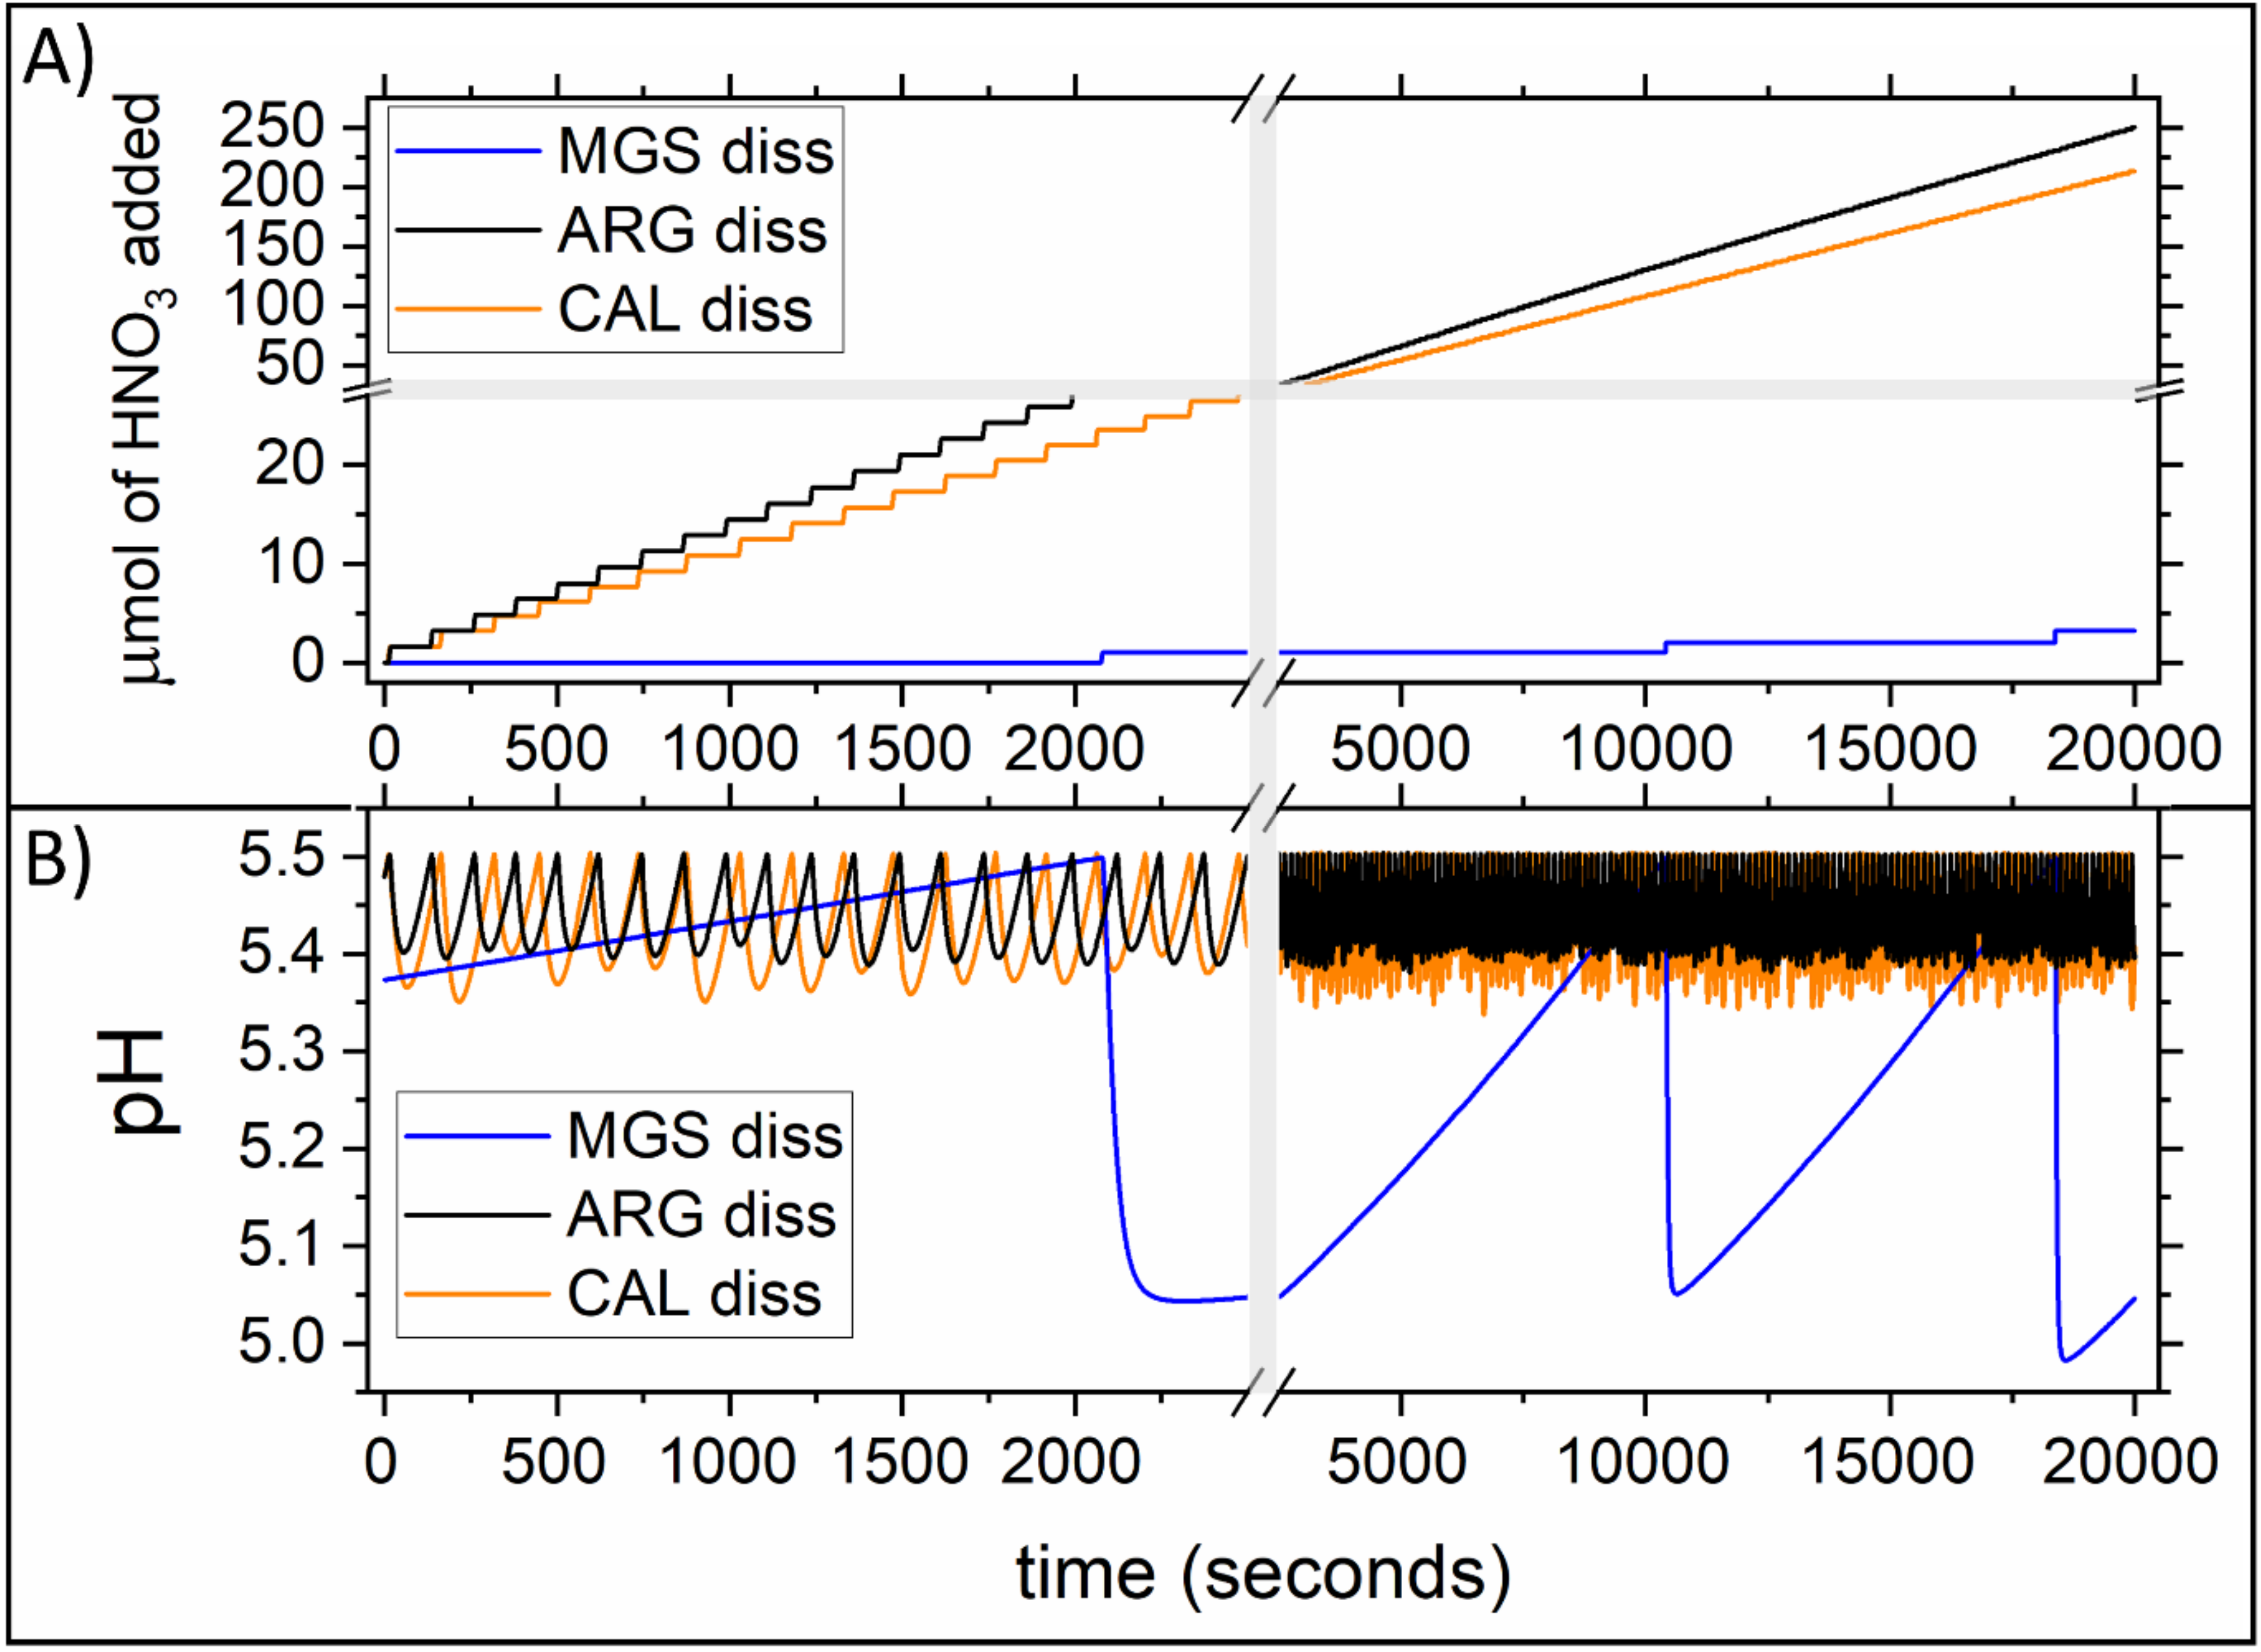
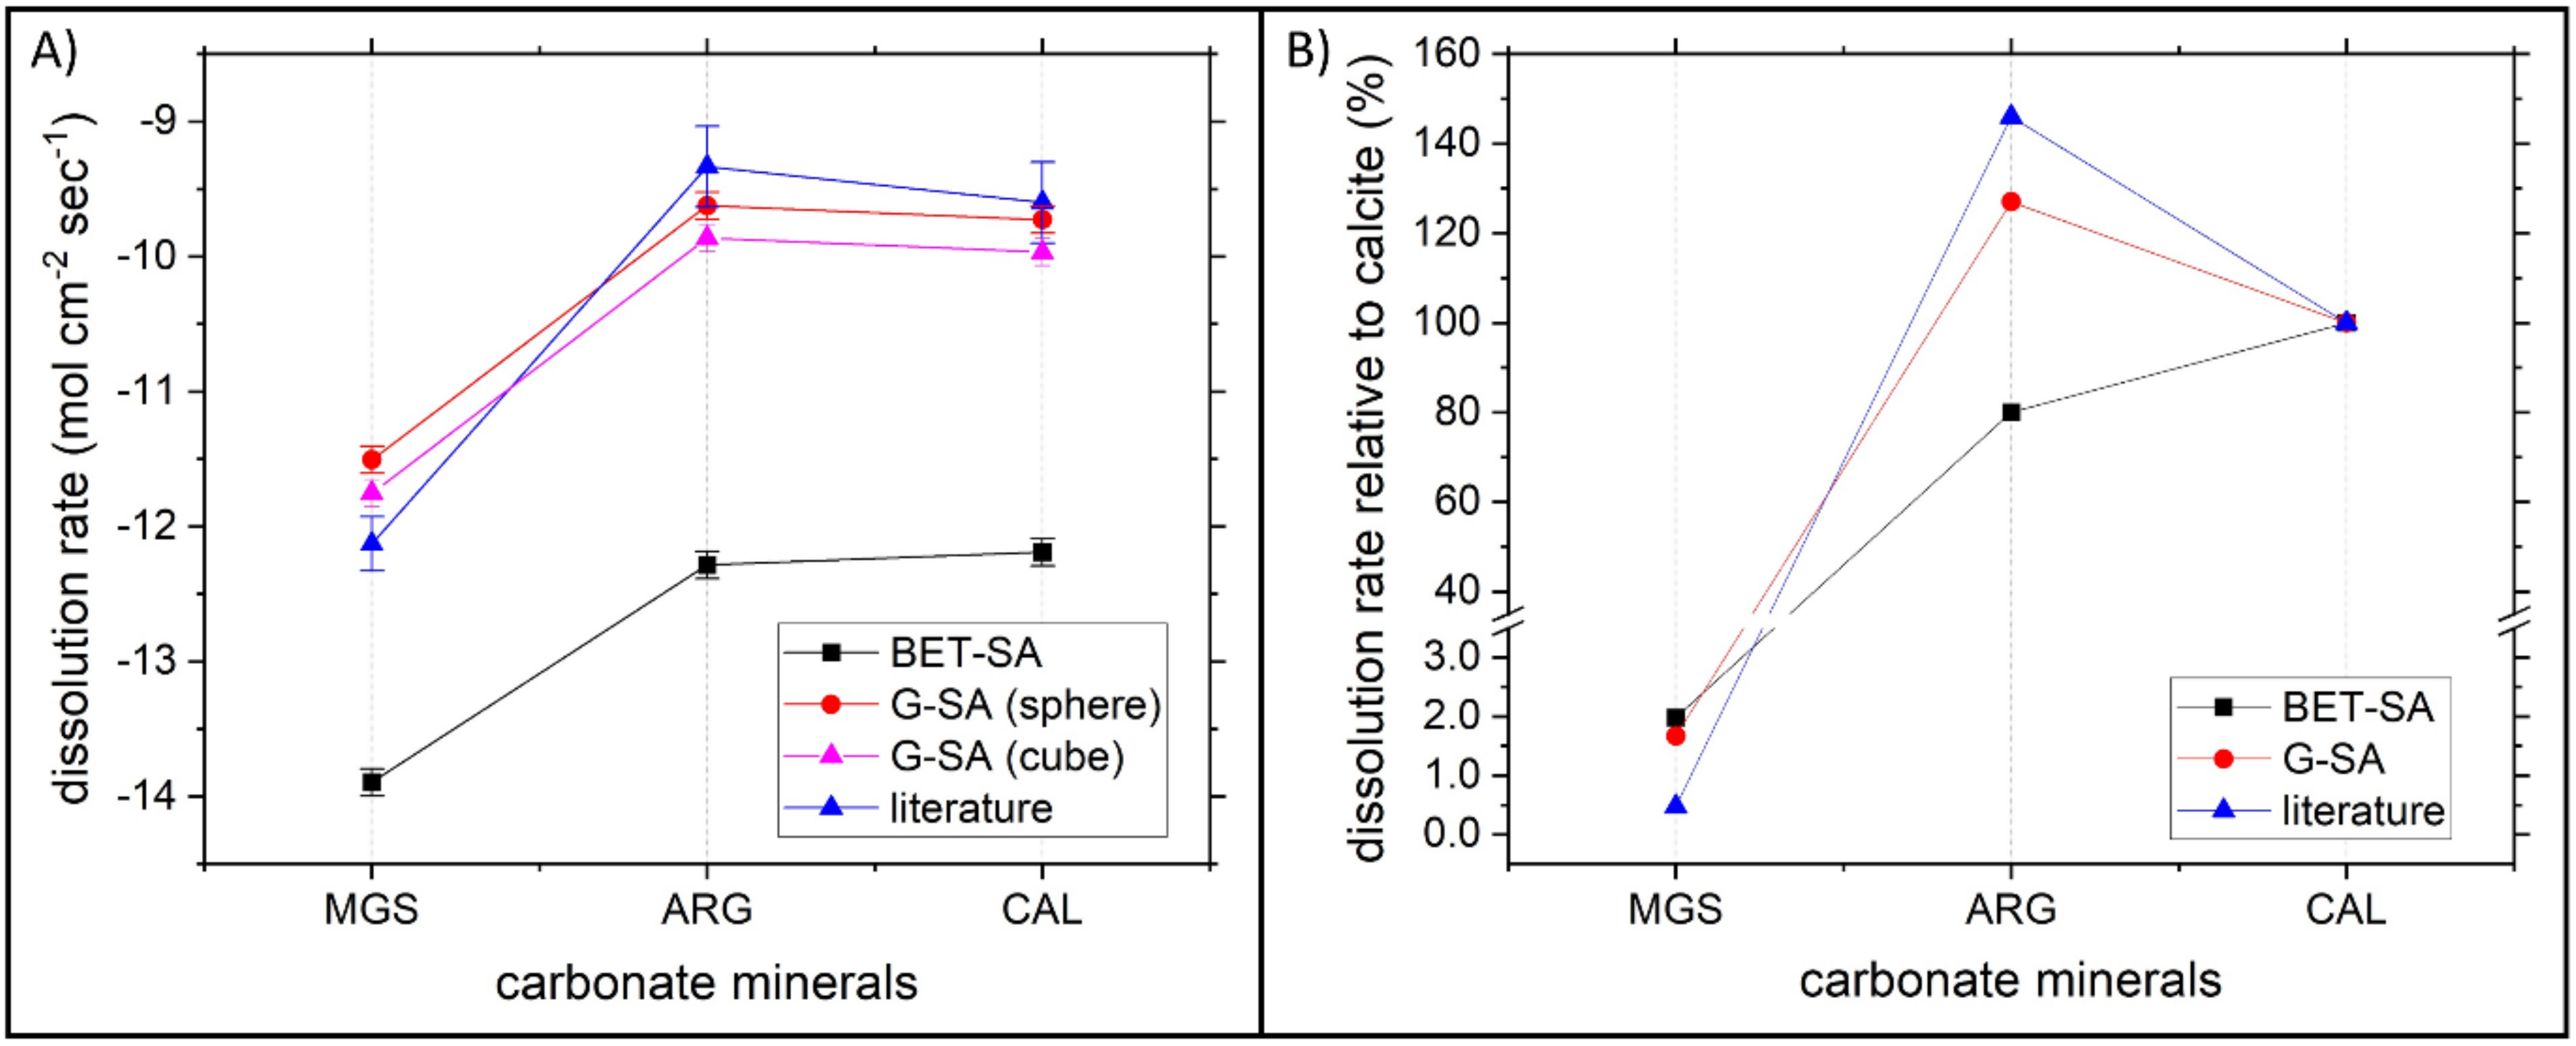
4.1. Comparison among the Dissolution Rate of Magnesite, Aragonite and Calcite

Batch experiments with powder samples were performed to determine the feasibility of remediation processes based on the solvent-mediated transformation of magnesite into cerussite [10]. In order to highlight the influence of the remediation agent on the overall kinetics of the process, the system was designed in such a way that the reaction yield is controlled by the dissolution of the substrate rather than by the precipitation of the product. The assumption of a dissolution controlled process has been proved in our previous work and can be reasonably inferred from the elevated initial concentration of Pb2+(aq) combined with the very low solubility of CER.
Under equal conditions, the dissolutions of CAL and ARG have comparable rates [29,30,31]. In contrast, the dissolution of MGS is reported to be about two orders of magnitude slower [32]. The titration experiments conducted in this study (Figure 2) that we performed provide a complementary experimental confirmation of these observations. The dissolution of MGS, CAL and ARG in acidic solution (pH = 5.5, in our case) supplies carbonate units and increases the pH of the solution. In the titration experiments, the pH is controlled at pH 5.5 by the addition of nitric acid (Figure 2A). The repetitive addition of the acid determines the oscillating behaviour of pH during the dissolution experiments shown in Figure 2B. The moles of HNO3 consumed during these cycles allow us to calculate the dissolution rate. In order to correlate the moles of HNO3 and the moles of carbonate minerals dissolved, the protonation equilibrium of the carbonate groups needs to be taken into account. For this purpose, the ratio between H2CO3 and HCO3 species was calculated with PHREEQC. The presence of CO32− species can be neglected due to the low amount of their low concentration at pH 5.5 (three orders of magnitude less abundant than bicarbonates). According to the calculations based on our experimental conditions, each mole of HNO3 added corresponded to the neutralization of 0.565 moles of carbonate released from the mineral. The need for this correction factor arises from the evidence that once the carbonate units are released from the mineral to the solution, their protonation state must adapt to the dissociation constants of carbonic acid (Ka,1 and Ka,2).
Another crucial parameter that needs to be assessed in order to calculate the dissolution rates is the reactive surface area. Despite the apparent simplicity of this parameter, its practical derivation is still debated [33]. The reactive surface area is often identified with the geometrical surface area (G-SA) or with the BET surface area (BET-SA). Both the empirical surface areas (G-SA and BET-SA) are approximations of the reactive surface area. The G-SA is an underestimation of the reactive surface area. The G-SA can be calculated with different expressions depending on the assumption about the ideal geometry. Under a spherical approximation [33], the relationship corresponds to:
G S A s p h e r e = 6 d e ×   ρ
where ρ is the density of the material and de is the effective diameter [34]. The latter can be calculated with the expression:
d e = d m a x d m i n ln d m a x d m i n
where dmax and dmin correspond to the size of the sieves employed for preparing the samples, 250 μm and 66 μm, respectively.
Alternatively, considering an ideal cubic shape, the effective diameter can be considered the diagonal of a cube and the geometric surface area corresponds to:
G S A c u b e = 6 × 3 d e × ρ
Both these expressions of the G-SA suffer from the limitation of considering ideally smooth crystal surfaces in addition to the ideal geometry.
The roughness of the crystal facets is taken into account when the surface area is calculated by nitrogen adsorption through the BET method [35]. Based on studies on quartz grains, Gautier and co-workers demonstrated that the BET-SA overestimates the reactive surface area. The BET-SA takes into account crystalline surfaces that have negligible effect on the overall reactivity. This is, for example, the case of the walls of the etch pits that show a negligible contribution to the overall dissolution rate along the perpendicular directions [33].
Comparing the dissolution rates calculated with the different surface areas (Figure 3A), it can be observed that the dissolution rates calculated using the geometric surface area are in agreement with the literature values [29,30,31]. This evidence supports the idea that the G-SA is a better approximation of the reactive surface area rather than the BET-SA. The values reported in Figure 3A testify the importance of the value assigned to the reactive surface area, aiming at a quantitative determination of mineral dissolution rates. A relative estimation of the dissolution rates allows us to overcome this problem. If the dissolution rate of MGS is reported as a percentage of the dissolution rate of CAL, it can be observed that MGS dissolution occurs at a rate that is about 1.5 orders of magnitude lower (1.7–2%) than CAL (Figure 3B). It is important to underline that the dissolution rate calculated with this procedure relies on the supply of carbonate units from the substrate; therefore, the hydration properties of aqueous magnesium ions should not play a direct role. The slow increase in pH in MGS dissolution suggests that the strong solvation of Mg2+ and the lattice constrains should both be responsible for the difference in the availability of carbonate units from minerals when comparing MgCO3 and CaCO3
The dissolution rate calculated in this study corresponds to far from equilibrium conditions. The saturation index (SI) in the system is very low. Theoretically, if all the minerals added (2 mmol to 100 mL of solution) should dissolve, the solution would remain undersaturated. Up to 7.7 mmol of CAL and 13.2 mmol of MGS are required to reach equilibrium while maintaining the pH 5.5 constant. This means that the total amount of minerals used for the dissolution experiments is only a fraction of the amount required to reach the saturation with respect to these phases—26% in the case of calcite and 15% for magnesite. This ensures that the dissolution rate is measured in far from equilibrium conditions (SI < −1; 1 − Ω > 0.9).

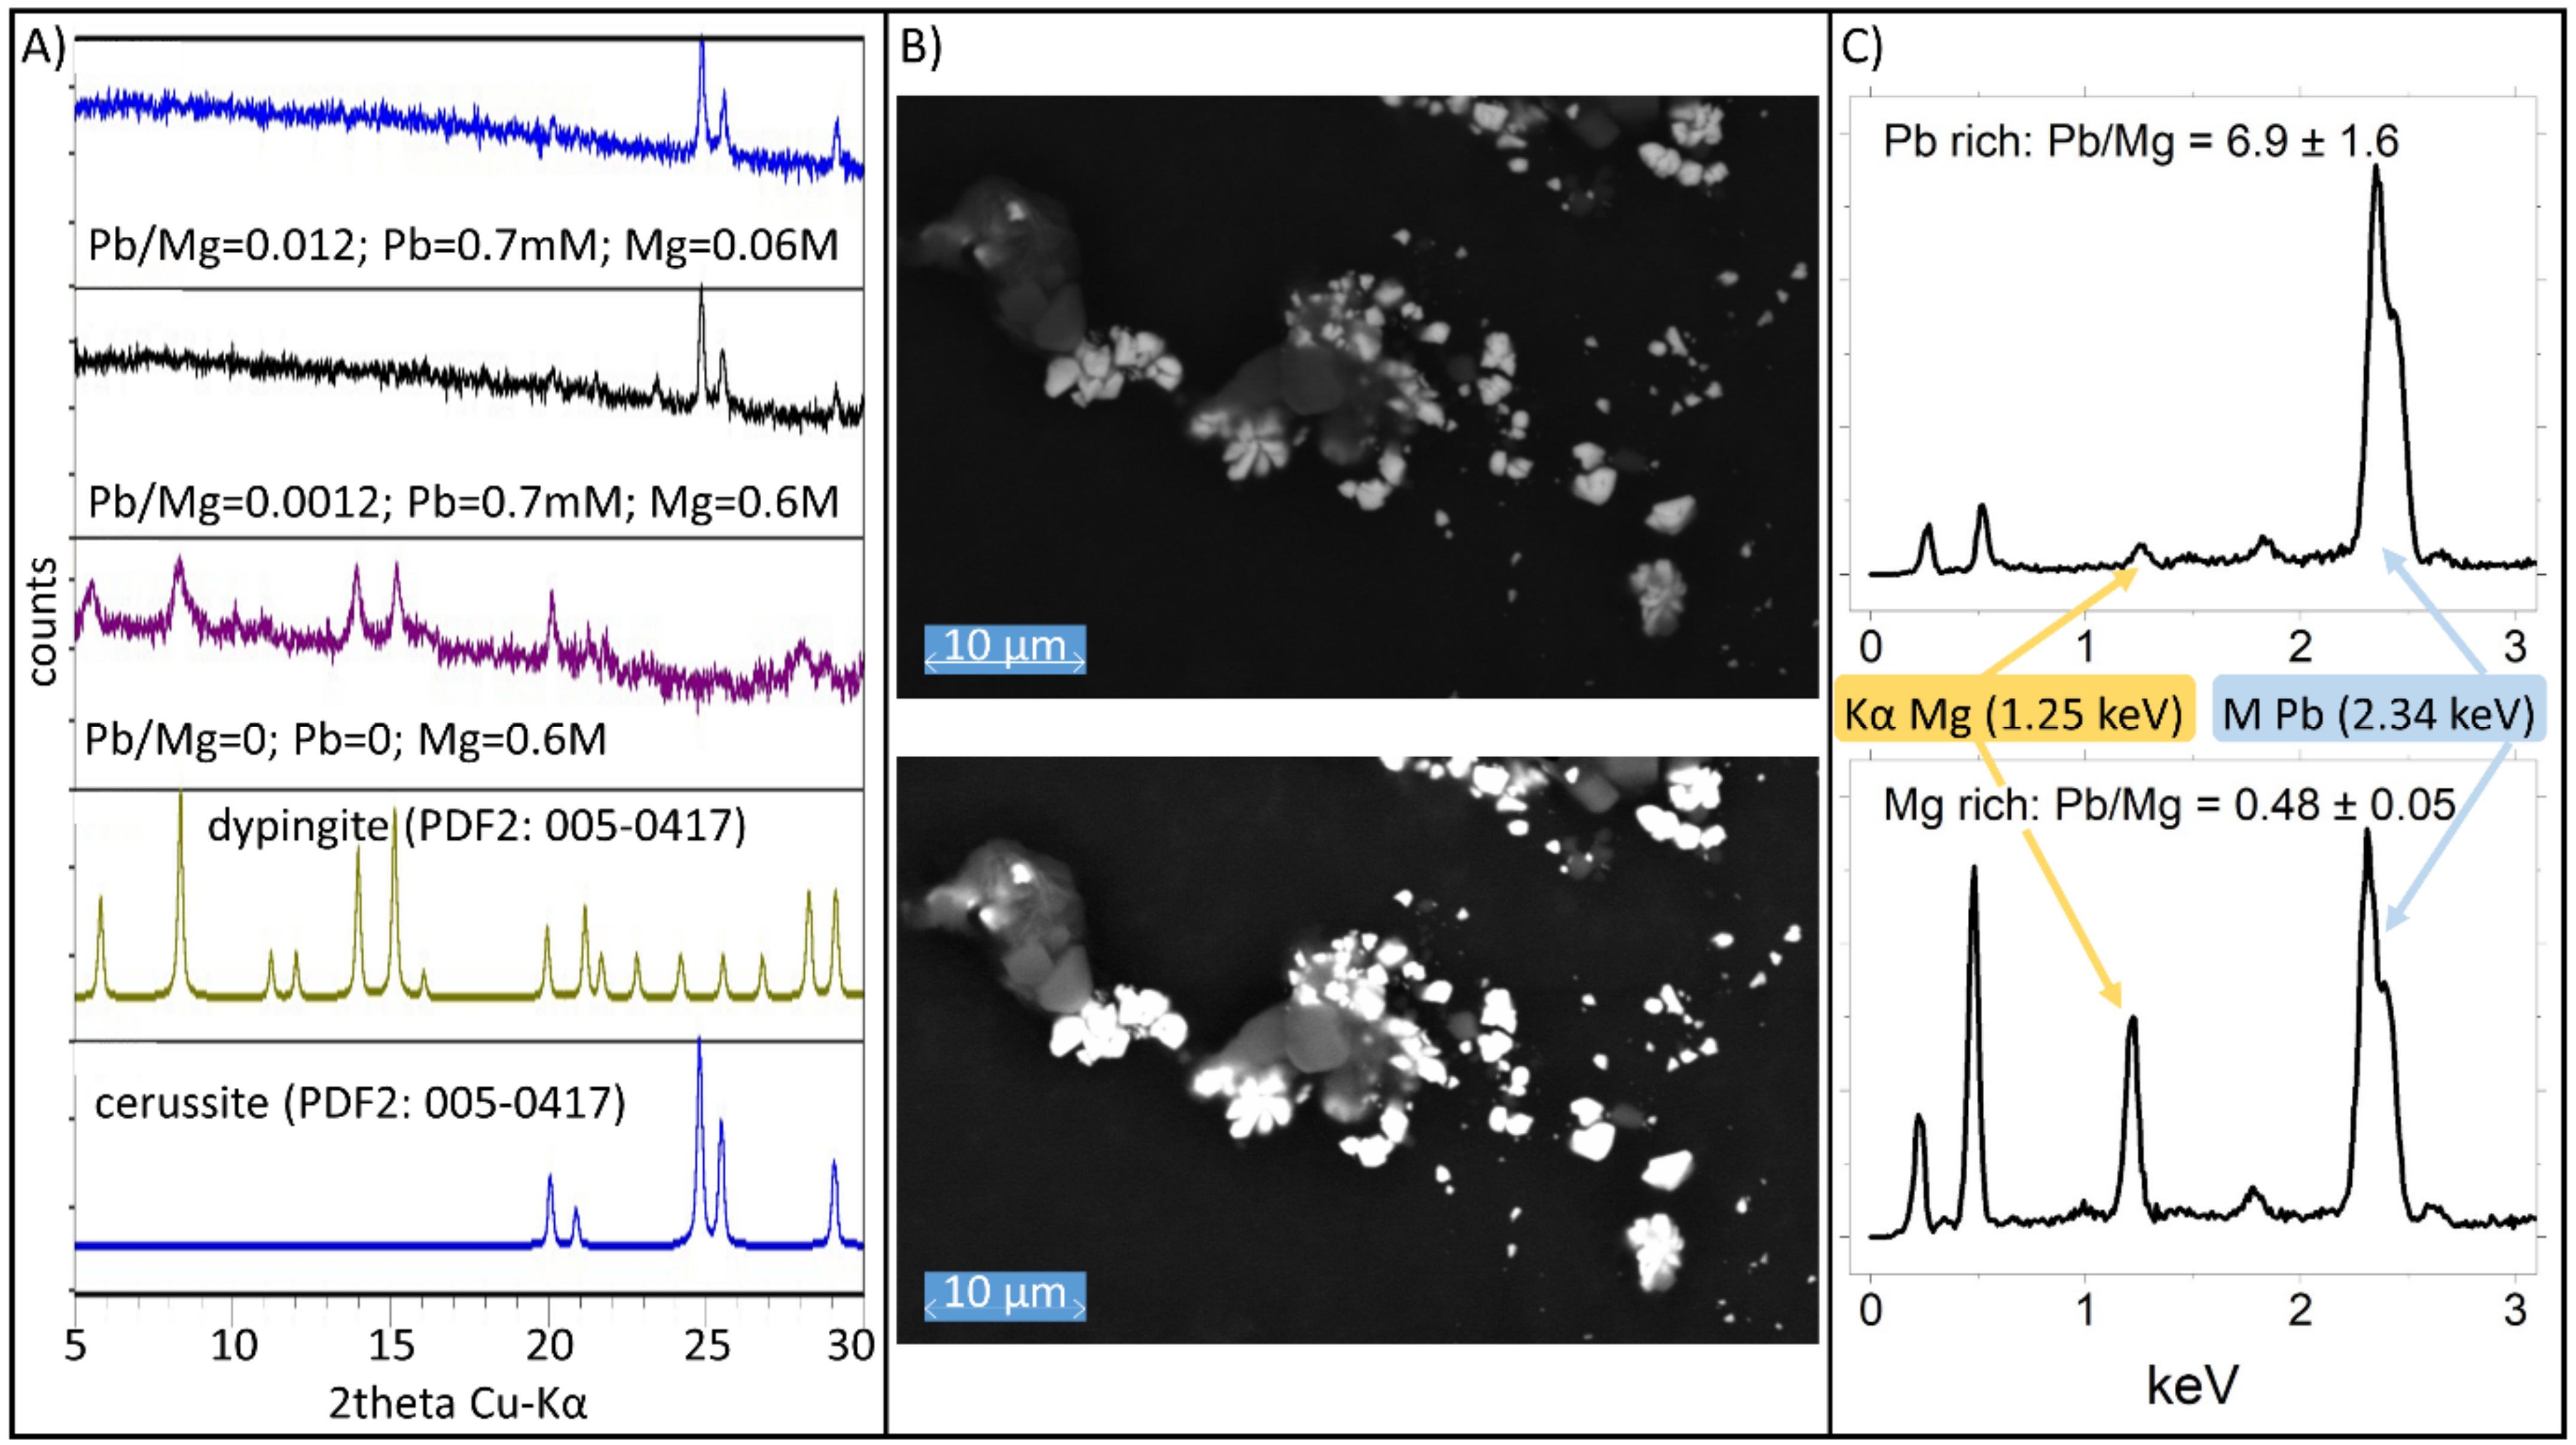
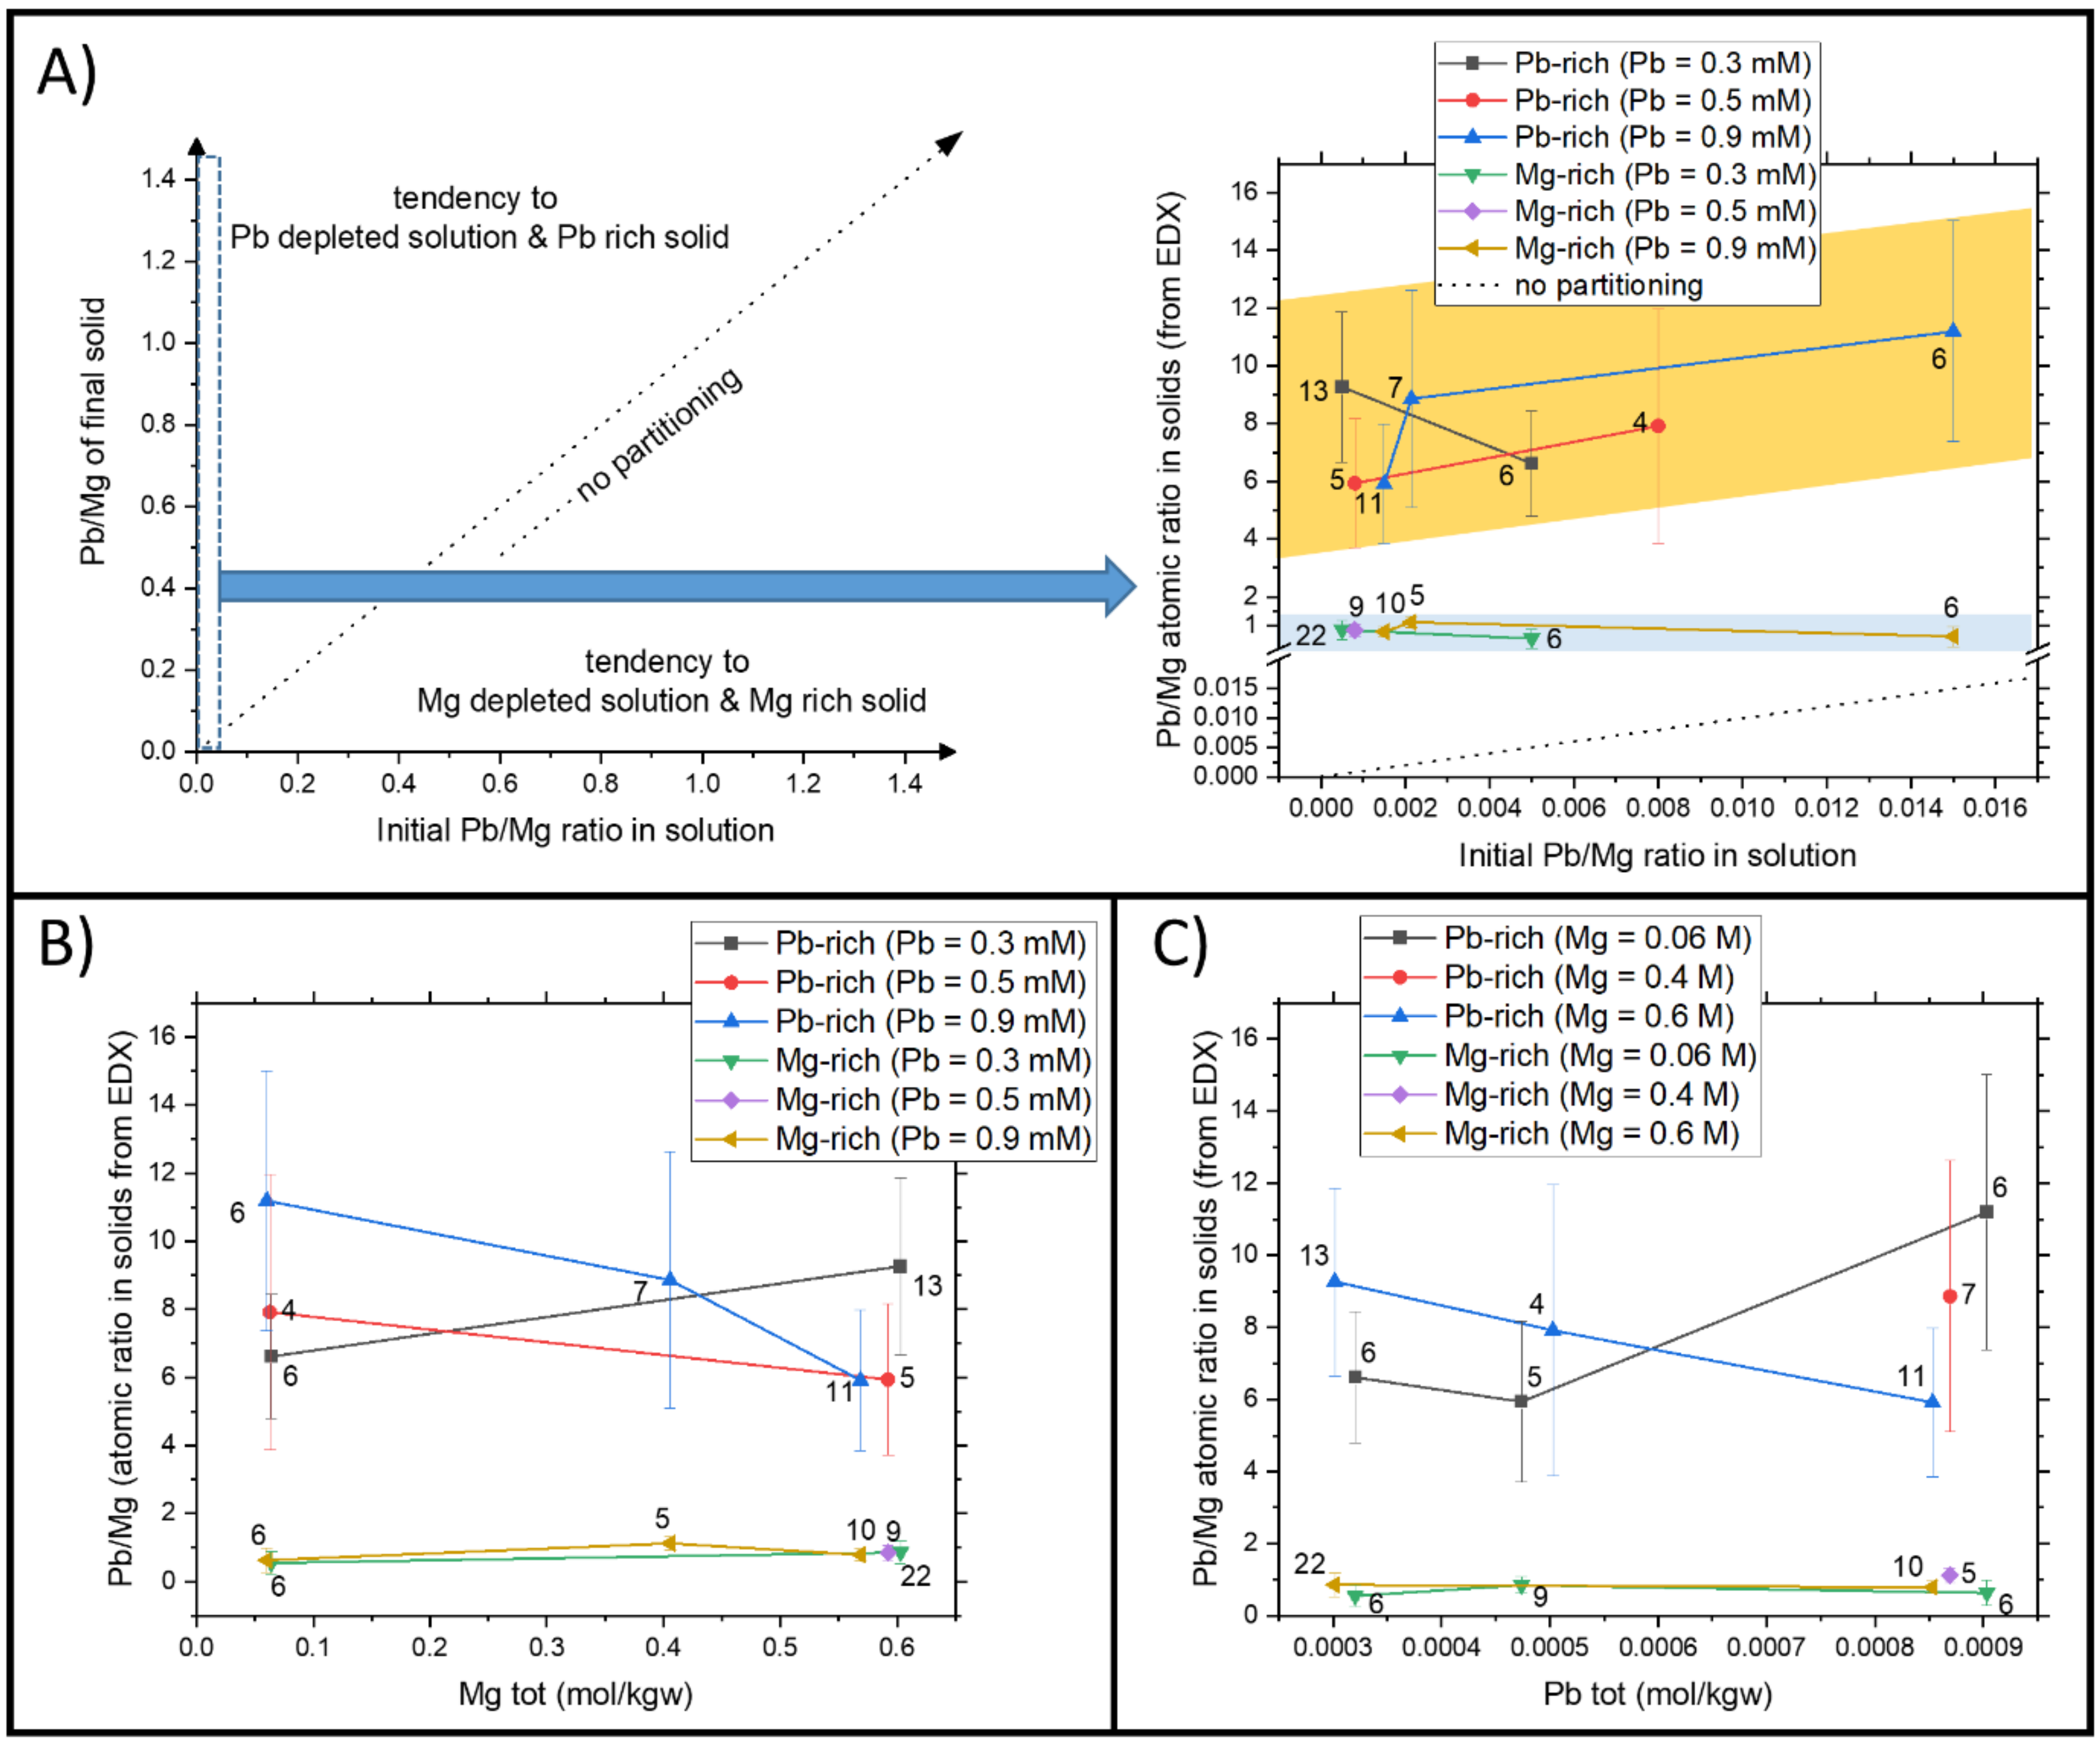
4.2. The Precipitation in Far from Equilibrium Conditions for the System Mg-PbII-CO2-H2O

A set of precipitation experiments has been conducted in the presence of different amounts of Mg and PbII to observe the distribution of ions in the solid phase. A complete overview of the tested experimental conditions is provided in Figure S1. The Pb/Mg ratios used in the experiments are small (1.5 × 10⁻² < Pb/Mg (atomic ratio) < 1.5 × 10⁻⁴) to resemble a reasonable enrichment with respect to the natural abundance (Pb/Mgnatural ≈ 10−5) [36]. The product phase precipitated in the presence of Pb2+ was detected by XRD as cerussite (Figure 4A). In the absence of Pb2+, the precipitated product was identified as dypingite. The absence of a product phase with a layered structure (i.e., such as dolomite or norsethite) can be excluded (Figure S2). All the collected XRD patterns had an elevated background/signal ratio, suggesting the presence of a solid phase with low crystallinity (Figure 4A). SEM micrographs with backscattered electrons allow the observation of the presence of two phases with different Pb/Mg ratios based on the difference in signal intensity (Figure 4B). EDX analysis on these solids confirmed the different chemical compositions of the two phases that were therefore classified into Pb-rich and Mg-rich groups (Figure 4C).
The EDX measurements, despite the qualitative character of this technique, allow the estimation of the incorporation of Pb2+aq into the solid phases. In the absence of preferential partitioning of one element into the solid phase, its incorporation in the solid resembles the initial stoichiometry of the ions in solution. In far-from-equilibrium conditions, it has been shown that ion partitioning tends to follow the stoichiometry of the solution rather than the equilibrium solubility [37]. Our experiments investigated different far-from-equilibrium conditions while maintaining a small Pb/Mg ratio to emulate realistic conditions (Figure 5A and Figure S1). The composition of the two solid phases is relatively constant in the Pb/Mg range studied. Both the Pb-rich and the Mg-rich phases are highly enriched in lead in comparison with the initial stoichiometry. Despite the elevated uncertainties, there is a measurable tendency for the composition of the Pb-rich solid to become more enriched in Pb when the Pb/Mg increases (Figure 5A). The initial aqueous concentrations of Mg (Figure 5B) and Pb (Figure 5C) do not seem to control the composition of the Pb-rich and Mg-rich phases. This observation is important because the expected concentration of the ions in wastewater is likely to be lower than in our experiments (SIMGS = 1.7–2.1; SICER = 1.7–2.9), where the use of high concentrations is motivated by the need to establish conditions for an instantaneous precipitation.
The experimental investigation of Mg and Pb coprecipitation shows that Pb is incorporated preferentially into the solid (Figure 5). This result is promising for environmental remediation processes because it demonstrates that a selective precipitation of PbCO3 could also be performed in the presence of high concentrations of Mg, as in real cases.

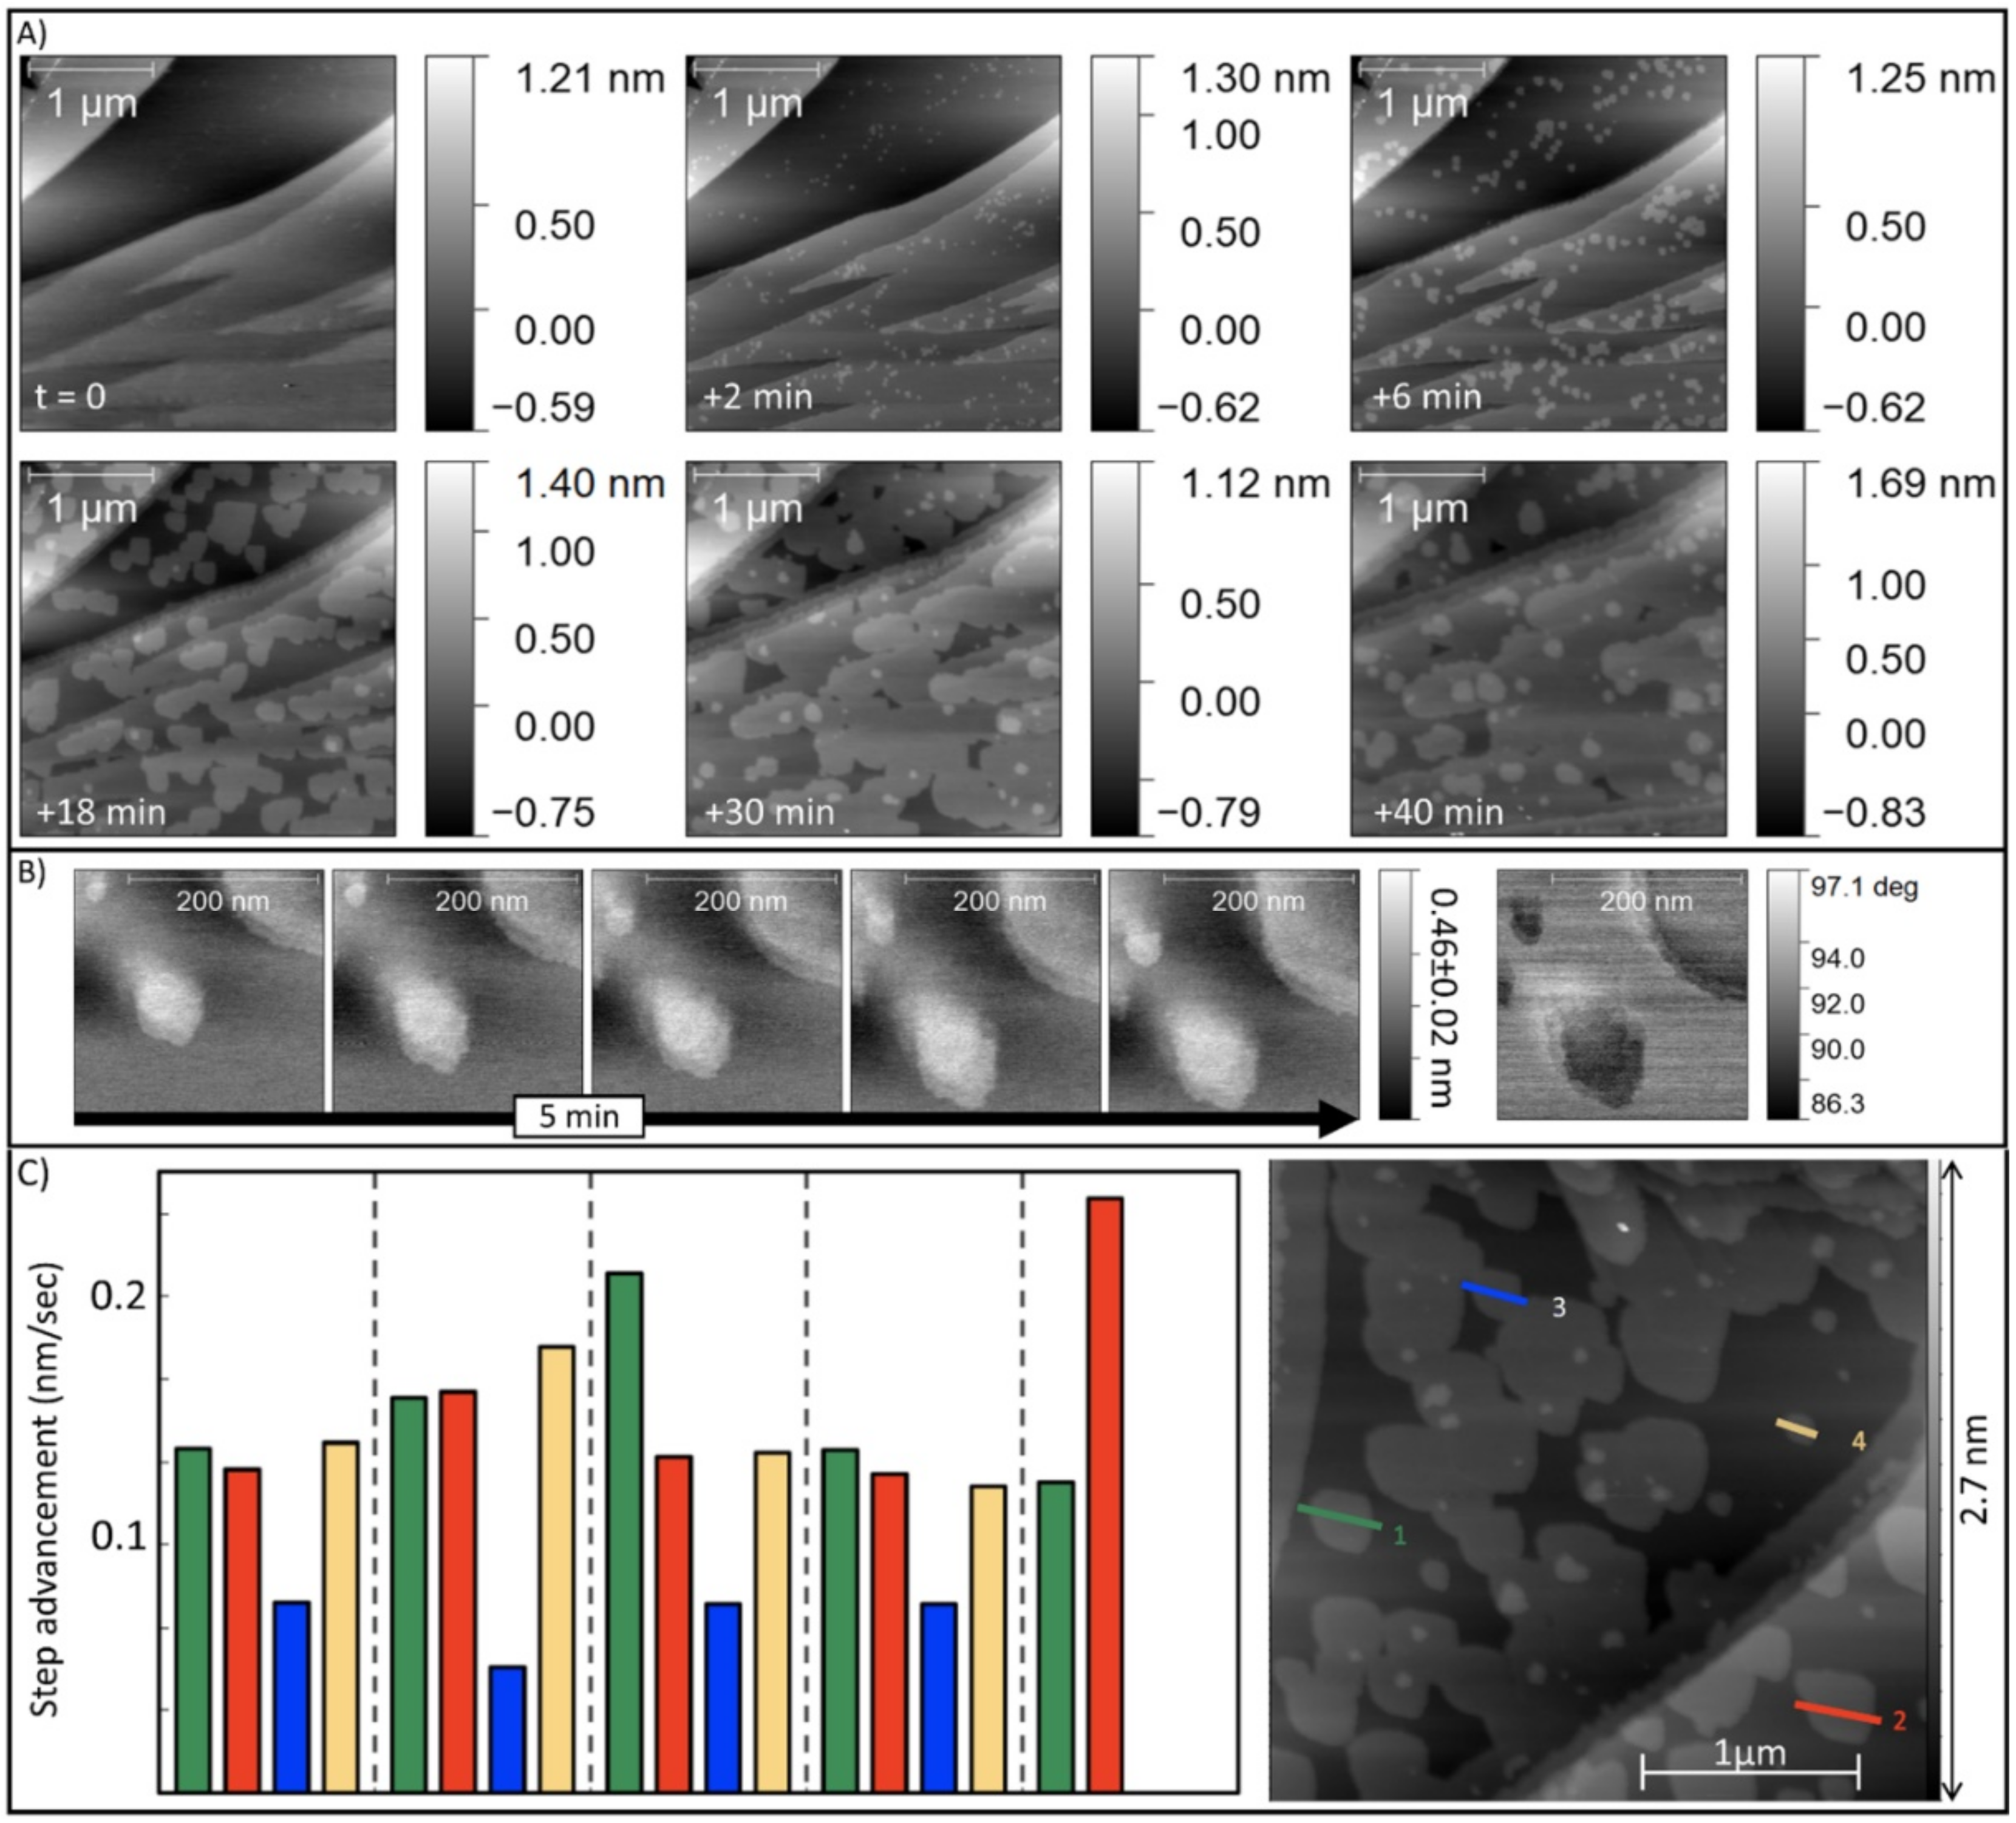
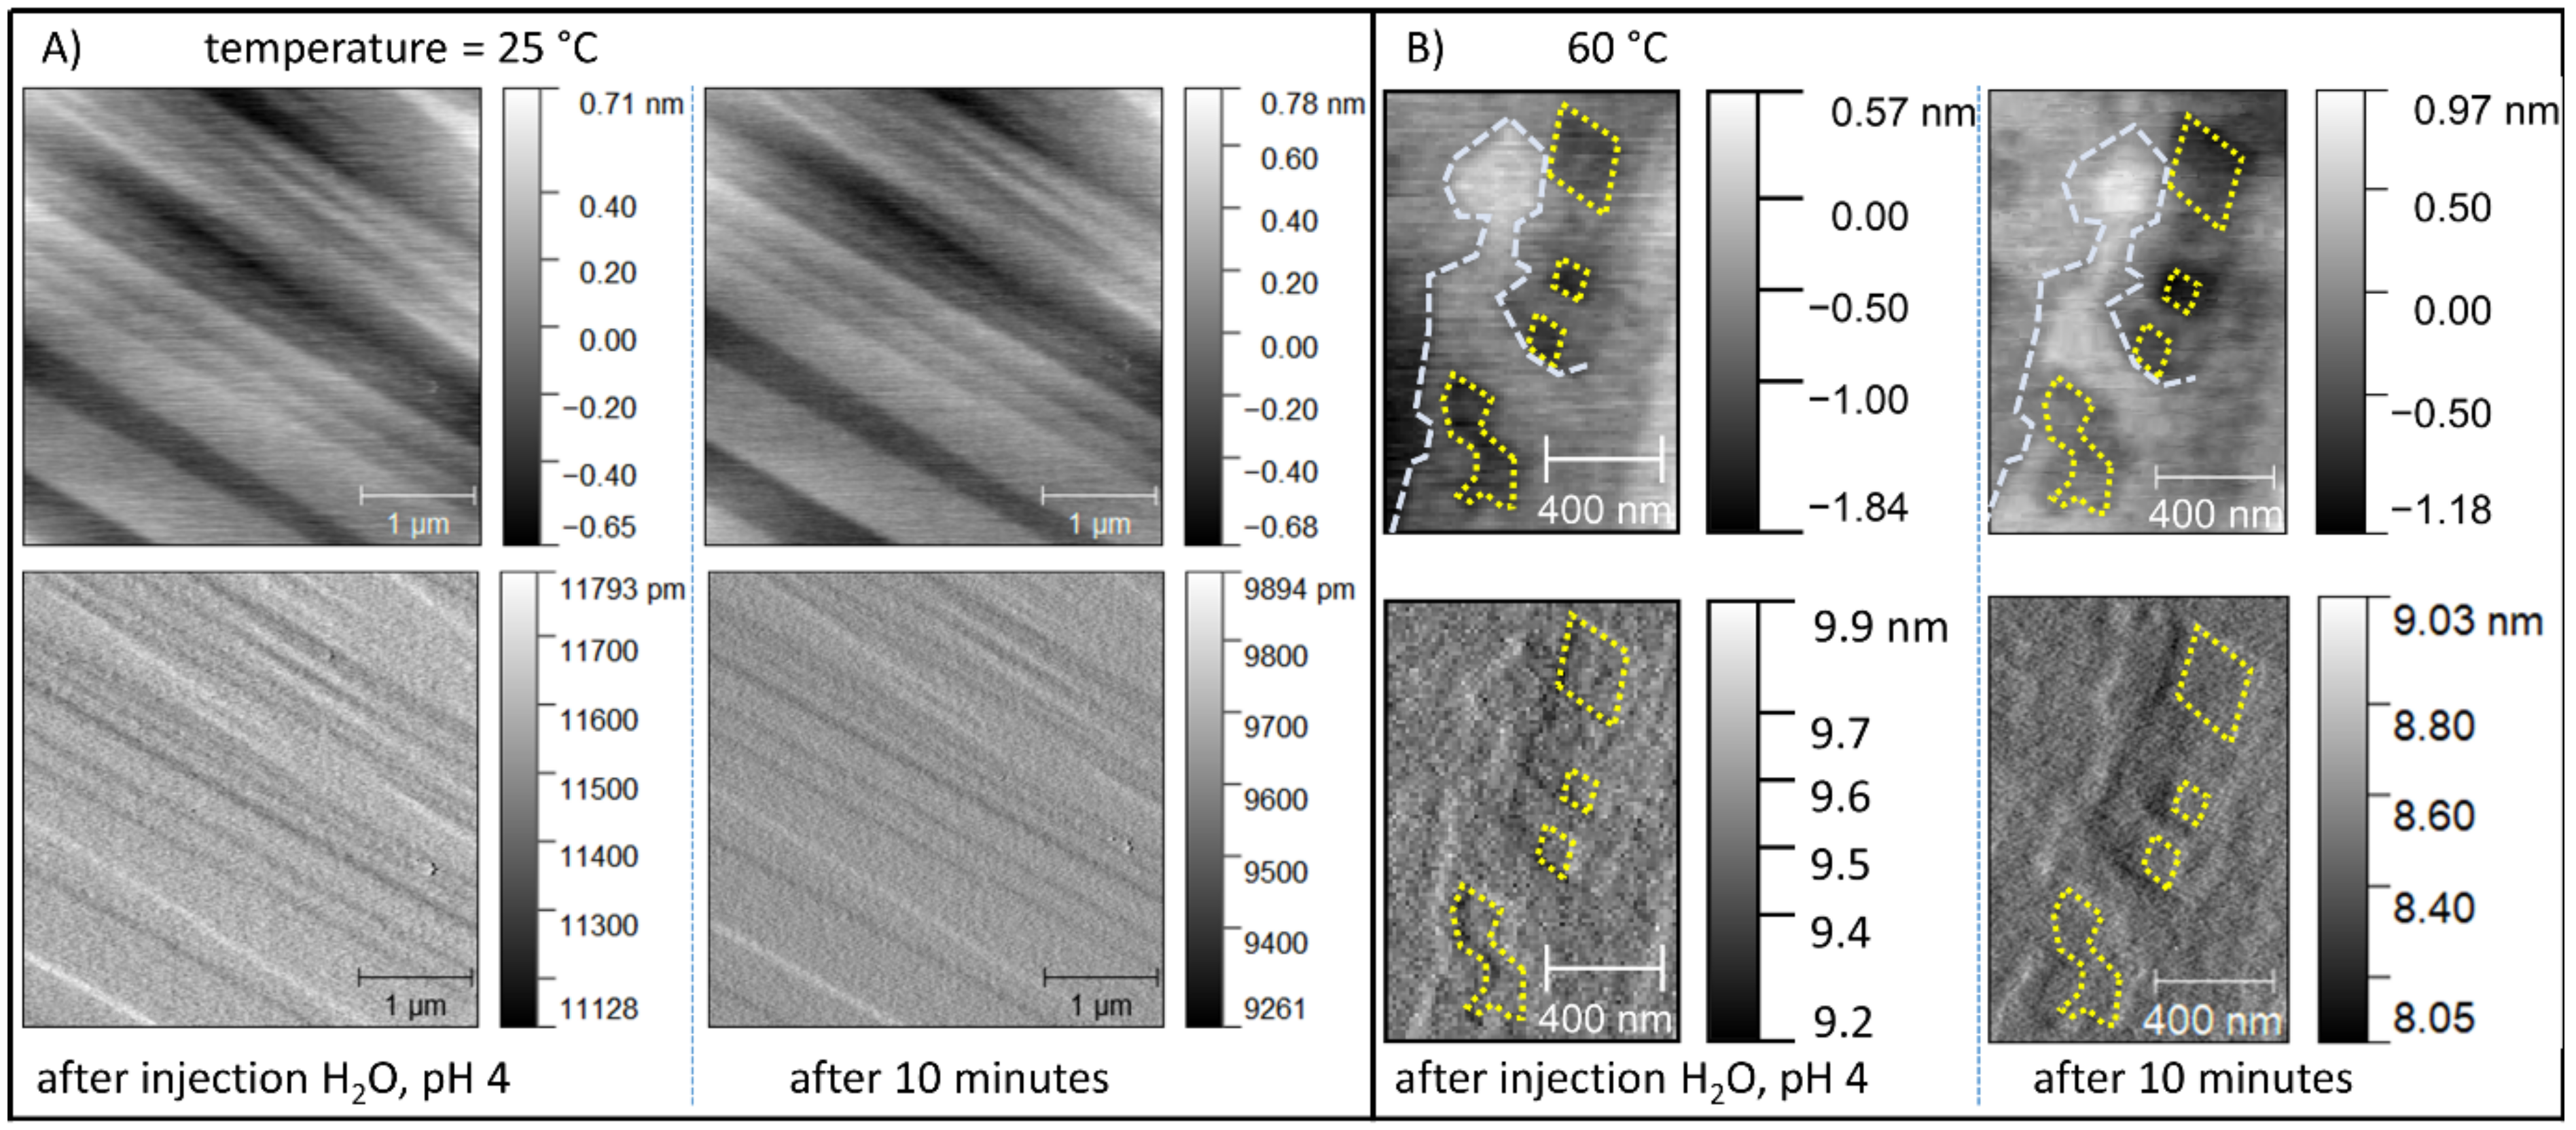
4.3. The Growth of {10.4} Surfaces of Magnesite in Presence and Absence of Pb2+

The favourable incorporation of Pb2+ in the solid phase, during co-precipitation experiments in the Mg-PbII-CO2-H2O system, motivates the study of the effect that the presence of Pb2+ has on MGS growth. A suitable technique to investigate this effect is in situ AFM [38]. We compare the spreading rate of the step edges on the {10.4} surfaces of MGS during interaction with a growth solution with or without Pb2+. The growth of MGS in supersaturated solution at 25 °C is a process so slow that it is hard to visualize even with AFM. The observed step advancement rate in pure Mg-CO2-H2O is in the order of picometers per second (0.001 nm/sec). In the presence of Pb2+, a tenfold increase in the spreading rate of the obtuse step edges was observed (0.010 ± 0.003 nm/sec). The evolution of the surface topography of MGS {10.4} surfaces shows the advancement of the obtuse step edges (Figure 6A). By comparing the section profiles of images recorded at different times, it is possible to quantify the movement of the step edges. The only mathematical adjustment on the profiles is an offset to match the position and the height of the section maximum (Figure 6B). The difference between the initial profile and the actual profile can be calculated to determine the overgrown region during the time lapse between the two frames (Figure 6C). It is interesting to notice that the advancement of the acute step is so small that it does not significantly affect the alignment of the profiles extracted from different frames. This is reflected in the maintenance of the alignment on the right side of the steps, i.e., the acute steps (Figure 6B). The error on the advancement rate of the obtuse step due to the advancement of acute steps can be inferred by the relative half peak broadness of positive (overgrowth along the obtuse step) and negative (uncertainty due to acute step advancement) peaks. The broadness ratio is about 20%, thus smaller than the standard deviation of repeated measurements that is about 30% (0.010 ± 0.003 nm/sec). An important insight into the growth mechanism of MGS in the presence of Pb2+ is provided by the analysis of the phase channel, which is sensitive to variations in the composition of the material [39,40]. An accurate observation of the phase channel on a step that grew in the presence of Pb2+ (Figure 6D) shows the presence of a phase contrast with the pristine MGS steps. This evidence points toward the incorporation of Pb2+ in the obtuse steps of MGS. The strong difference in the reactivity of acute and obtuse steps also agrees with the evidence that Pb2+ is significantly greater than Mg2+ [41]. The size of Pb2+ makes it prone to interact with the region that presents a minor steric hindrance, thus the obtuse rather than acute step.
Another effect that we aimed to investigate by flow-through AFM is the ageing of the supersaturated solution. To tackle this problem, we stored the supersaturated solution for two weeks prior to the AFM experiment. The effect of solution ageing is relevant for the Mg-CO2-H2O system because the thermodynamic stable phase (MGS) does not form at 25 °C. Experimentally, the sluggish reactivity of MGS needs to be compensated with high supersaturation (in our AFM experiments: SIMGS = 1.96; ΩMGS = 91). Increasing the supersaturation in the system Mg-CO2-H2O, there is an increased probability to precipitate metastable hydrated phases. In particular, this system is characterized by a variety of hydrated carbonates (barringtonite, nesquehonite, lansfordite) and hydroxyl-carbonates (artinite, hydromagnesite, dypingite). This is in agreement with our precipitation experiments that show the formation of dypingite (Figure 4A).
After ageing, the nuclei of a secondary phase that cannot be filtered or centrifuged due to the size (Ø < 50 nm) are present in solution. These nuclei immediately deposit onto the {10.4} surfaces of MGS (Figure 7B) and they spread through a fast 2D island growth process (Figure 7A) [42,43]. The growth of this secondary phase (0.13 ± 0.04 nm/sec) is more than one order of magnitude faster than the growth of MGS in the presence of Pb2+ (0.010 ± 0.003 nm/sec); thus, about two orders of magnitude faster than the growth of MGS in the absence of Pb2+ (0.001 nm/sec). The overgrown phase shows a phase contrast with the pristine material (Figure 7C). In this case, the phase contrast is likely to be affected by the hydration of the phase more than by Pb2+ incorporation. However, the evidence of the incorporation of Pb2+ in the solid phases formed in these experimental conditions was previously provided by analysing the Pb/Mg ratio in the two solid species identified (Figure 4 and Figure 5).

5. Discussion

5.1. Thermodynamic vs. Kinetic Control on Magnesite Dissolution

The thermodynamic equilibrium calculations for Mg-Pb-CO2-H2O predict favourable partitioning of Pb2+ into the solid phase (Figure 1B). However, the rate of MGS dissolution is controlled by the slow reaction kinetics. Clear evidence for the kinetically hindered precipitation of MGS has been provided in this study by in situ AFM measurements. The solubility of MGS decreases with temperature, analogously to other carbonate minerals, and this phenomenon is defined retrograde solubility [44]. The retrograde solubility is a consequence of the negative enthalpy of dissolution observed in carbonate minerals. On the other hand, the kinetics of chemical reactions tend to increase at higher temperature. Typically, reactants and products are separated by large activation barriers. According to the Boltzmann distribution, the probability to overcome the reaction barrier increases proportionally to temperature.
Thus, thermodynamic and kinetic parameters have opposite effects on the temperature dependence of MGS solubility. In agreement with the previous studies dealing with MGS reactivity [32,38,45], we show that the dissolution rate is very slow at 25 °C. In Figure 8, we present a comparison between the dissolution behaviour of {10.4} surfaces of MGS at 25 and 60 °C in an acidic solution (HNO3, pH 4). The undersaturation is high; it is infinite assuming that Mg and/or C are not present at all in the initial acidic solution. Therefore, thermodynamics predicts that MGS should dissolve at both temperatures in this system. The retrograde solubility of MGS makes the equilibrium concentration ( s = K s p _ M G S ) of Mg2+ (or CO32-) at 60 °C 42% of the concentration at 25 °C (Figure S3). According to this observation, every infinitesimal supply of ions from the dissolving crystal to the solution that produces a decrease in the undersaturation (the thermodynamic driving force) will determine a decrease in the dissolution rate (proportional to the thermodynamic driving force). From a thermodynamic point of view, the decrease should be more pronounced at 60 than at 25 °C because the equilibrium solubility at higher temperature is lower.
The temperature dependence of the kinetics rate is the opposite. According to the Arrhenius equation, the reaction rate has an exponential dependence on temperature:
r a t e = A m i n e E a / R T
where Amin represents the surface area of the mineral, Ea stands for the activation energy, and R and T are the gas constant and the absolute temperature, respectively. Assuming a unitary mineral surface and selecting Ea = 46 kJ/mol [32], it can be estimated that the rate of MGS dissolution would increase about seven times passing from 25 to 60 °C, as shown in Figure 4.
The experimental observation of the interaction between {10.4} surfaces of MGS and acidic solutions at different temperatures provides clear evidence of the control exerted by the activation energy of reaction kinetics on the dissolution of MGS. At 25 °C, it is not possible to see any evident sign of dissolution on the surface (Figure 8A). The situation is different at higher temperature (60 °C) where the rhombohedral etch pits, which appear during heating, grow after injecting fresh acidic solution (Figure 8B). These observations match the results provided in a detailed study by Saldi and co-authors [45]. Their study about MGS growth showed that the reactivity at 25 °C of this material is so sluggish that the advancement of the acute step in a supersaturated solution (Ω = 10, see ref [45]) would require 1.5 years to proceed 10 nm.

5.2. The Consequences of the Sluggish Kinetics of Magnesite Aiming at Pb2+(aq) Uptake

In order to reveal the role of specific Pb–MGS surface interaction on the kinetics of MGS dissolution and growth, a set of reference dissolution experiments with KNO3 was compared to the equivalent experiments with Pb(NO3)2. The presence of KNO3 is required to maintain similar ionic strength and nitrate concentration in the different experiments. The pH of the KNO3 solutions was adjusted at 4.3, and the pH of Pb(NO3)2 through the addition of HNO3. The evolution of the pH in the different experiments with the three substrates is reported in Figure 9A. It is clear that the pH during dissolution and recrystallization experiments follow two different paths. The reasons behind the different behaviour are twofold: (i) PbII has a stronger Lewis acidity than K, (ii) the carbonate units released by the substrate are not accumulated in solution, but rather reprecipitate as components of PbCO3.
In the initial solution, the presence of Pb2+ and its association constants with oxygen and hydroxyl groups of water determine the initial pH = 4.3. When the carbonate mineral is added to the Pb-bearing solution, the increase in pH is much slower if compared with the pure dissolution (in the presence of KNO3 to have the same ionic strength and [NO3]). The rise in pH between 4.3 and pH 5 is faster for MGS in the absence of Pb2+ than for ARG and CAL in the presence of Pb2+ (Figure 9A). This observation could be surprising taking into account that the dissolution of ARG and CAL occurs more than 50 times faster than MGS (Figure 3B). This observation is explained by the Lewis acidity of Pb2+ ions that buffer the pH of the solution at a value around pH 5.4. The buffer capacity of the Pb-bearing solutions prevents the quick rise in pH correlated to CO32− dissolution that is observed in K-bearing experiments (i.e., pure dissolution). The progressive reduction in the concentration of Pb2+ and the release of carbonate units allow the pH to raise. A comparison between the behaviours of pH in the experiments with MGS (MGS diss and MGS-Pb, Figure 9A) clearly shows that in the initial stages of mineral–water interaction, the pH is controlled by the buffering capacity of Pb2+. The small amount of carbonate units released by MGS can raise the pH above 5.5 in the Pb-free experiments, where K+ is unable to maintain the acidic pH that was artificially created by adding HNO3. On the contrary, in the presence of Pb2+ the pH of MGS experiments hardly covered the trajectory between 4.3 and 4.6 during approximately 20 h of interaction.
The effect of carbonate units on pH in Pb-bearing experiments becomes more evident in the later reaction stages following the initial rise in pH (Figure 9A). Observing the evolution of pH in the experiments with ARG, it can be seen that the pH reaches a maximum (5.45) after 5000 sec (less than 2 h). After reaching this maximum, the pH decreases and it stabilizes to the value 5.4. This behaviour provides the key to understand the effect of CO32− on pH in the presence of Pb2+. The formation of PbCO3 occurs after the release of a sufficient amount of CO32− from the dissolving substrate. Our previous studies [9,10] demonstrated that, due to the isomorphism of ARG and cerussite (both orthorhombic), the activation energy required to nucleate the product phase is lower than in rhombohedral phases (such as CAL and MGS). During the initial rise in the pH, both the supply of CO32− and the reduction of [Pb2+] contribute to the observed decrease in the acidity. However, after the nucleation of PbCO3, the following growth of the product phase does not allow the accumulation of inorganic carbon in solution. It is worth underlining that nucleation requires supersaturation, i.e., it is not sufficient to reach saturation, rather a certain degree of supersaturation is needed to overcome the nucleation enthalpy [46,47]. After the successful nucleation of CER, the consumption of CO32− as building units of cerussite becomes faster than the supply of CO32− from the dissolving substrate. As a result, the pH starts decreasing and it stabilizes to a pH value (5.4) that is the consequence of the lower amount of [Pb2+] and the net increase in dissolved inorganic carbon (C+4tot). The net increase in dissolved inorganic carbon, after reaching the pH maximum, must be small (ΔC+4tot ≈ 1 × 10⁻⁵–1 × 10⁻⁴) due to the elevated difference in the solubility of the substrates and the product (Figure 1A) [9]. When the pH approaches the asymptotic value, the system becomes fully controlled by the substrate dissolution.
The scenario is slightly different during the interaction of CAL with the Pb-bearing solution. In this case, the precipitation of cerussite cannot take advantage of the template effect offered by the substrate, and as a result, the nucleation of PbCO3 occurs later in time (i.e., when the supersaturation reached by cerussite is higher than in the case with ARG). In this condition, CER precipitation occurs through a smaller number of crystals with greater size if compared with ARG [10]. The minor reactive surface area of a few big crystals (CER on CAL) than many small crystals (CER on ARG) determines the absence of a pH drop in the CAL–Pb curve (Figure 9A).
The continuous measurement of the electrical conductivity confirms the observation that the net flux of ions from the substrates, in the experiments with Pb2+, is much lower than in the pure dissolution experiments (Figure 9B). The two solutions (KNO3 and PbNO3) start from similar conductivity values (in agreement with PHREEQC calculations). The following increase in conductivity over time is minor for the experiments with Pb compared to the experiment of dissolution. The precipitation of CER slows down the net increase in ions in solution due to the much lower solubility of the product in comparison with the substrates. In all the Pb-bearing experiments, the conductivity increase is minor compared to that observed for the dissolution of MGS, despite the slow reactivity of this material.
A comparison among the dissolution rates of CAL, ARG, MGS and the amount of substrate reacted is presented in Figure 9C. The slow dissolution of MGS does not allow the uptake of an amount of Pb2+ comparable with CAL and ARG. The dissolution of CAL and ARG occurs faster in the absence of Pb2+. The growth of the product phase on the substrate decreases the reactive surface area of the substrate. The decrease in the reactive surface area is pronounced for ARG, but it is less efficient in CAL. However, even a substrate that is prone to surface inhibition in this system, such as aragonite, is much more favourable for the overall reaction yield than MGS, which dissolves too slowly.

6. Conclusions

This experimental work provides a detailed overview of the main thermodynamic and kinetic parameters controlling the dissolution and growth phenomena relevant for environmental remediation purposes in the system Mg-PbII-CO2-H2O. The interest toward this system rises from the favourable thermodynamics and the absence of isomorphism between magnesite and cerussite, which previous studies demonstrated to be a limiting factor for the transformation reaction in the presence of an increase in the molar volume [10]. The experiments conducted in this study demonstrate that, despite the favourable thermodynamic conditions, the transformation reaction between magnesite and cerussite is unlikely to play an important role in the development of remediation processes for PbII pollution. The dissolution of the substrate is too slow in comparison with CaCO3; therefore, this latter material is always preferable independently from the polymorph. The kinetic limitation could be overcome by increasing the temperature; however, this approach would substantially increase the cost of the remediation process.
The scenario is different if the process considered is the precipitation from aqueous constituents instead of a transformation reaction. The solid formed during the precipitation is enriched in Pb if compared with the initial stoichiometry of the solutions, which are characterized by a low abundance of Pb relative to Mg. MGS formation at room temperature is kinetically hindered [12,48,49,50]. Instead, metastable hydrated Mg-bearing carbonates are formed [51,52,53,54]. The large activation energy preventing the formation of MGS and the substantial difference in solubility between MGS and CER determine a preferential partitioning of Pb in the solid phase. The preferential incorporation of Pb in the solid allows us to hypothesize that, despite the abundance of Mg in natural waters, remediation processes relying on the precipitation of Pb could be successful. This process would also require an external source of inorganic carbon (CO2) that may attenuate the carbon footprint of wastewater treatment plants [55].
From a mechanistic point of view, the acceleration of the spreading rate of MGS step edges, which occurs in the presence of Pb2+, generates new questions about the influence of cation interactions on the kinetic barriers that characterize the MGS reactivity at room temperature. The fast growth of the secondary phase observed on the MGS surface renews the interest toward a precipitation system for environmental remediation processes. However, further studies would be necessary to figure out whether this effect is related to a difference in the hydration properties of Mg2+ or it is rather related to the inclusion of Pb2+ in the MGS structure and the formation of solid solutions.
In conclusion, an environmental remediation process based on MGS as the substrate for a solvent-mediated transformation reaction is unlikely to play an important role in industrial application due to the sluggish kinetics of MGS dissolution. However, the slow kinetics of MGS precipitation is favourable for Pb entrapment by the precipitation of carbonate from Mg2+ and Pb2+-bearing solutions, leading to a strong PbII enrichment in the solid phase even in far-from-equilibrium conditions.

Supplementary Materials

The following are available online at https://www.mdpi.com/article/10.3390/min11040415/s1. Figure S1: Concentration, saturation indexes and pH of the solutions for the precipitation experiments. Figure S2: Powder x-ray diffraction of the precipitation products in the range 30–70° 2θ Cu-Kα. Figure S3: Variation of the solubility product of magnesite as a function of temperature. Figure S4: Variation of magnesite dissolution rate as a function of temperature.

Author Contributions

Conceptualization, F.D.L. and S.V.C.; methodology, F.D.L.; formal analysis, T.A. and F.D.L.; investigation, T.A. and F.D.L.; writing—original draft preparation, F.D.L.; writing—review and editing, F.D.L.; supervision, S.V.C.; project administration, S.V.C.; funding acquisition, S.V.C. All authors have read and agreed to the published version of the manuscript.

Funding

Swiss National Science Foundation: R’EQUIP grant ID164017.

Institutional Review Board Statement

Not applicable.

Informed Consent Statement

Not applicable.

Data Availability Statement

All the data are provided in the manuscript.

Acknowledgments

The authors thank the Natural History Museum of Bern for providing the natural samples. R’EQUIP grant ID164017 by the Swiss National Science Foundation is acknowledged.

Conflicts of Interest

The authors declare no conflict of interest.

References

  1. Godelitsas, A.; Astilleros, J.M.; Hallam, K.; Harissopoulos, S.; Putnis, A. Interaction of Calcium Carbonates with Lead in Aqueous Solutions. Environ. Sci. Technol. 2003, 37, 3351–3360. [Google Scholar] [CrossRef] [Green Version]
  2. Godelitsas, A.; Astilleros, J.M. Dissolution, sorption/(re)precipitation, formation of solid solutions and crystal growth phenomena on mineral surfaces: Implications for the removal of toxic metals from the environment. Eur. Mineral. Union Notes Mineral. 2010, 10, 289–324. [Google Scholar] [CrossRef]
  3. Prieto, M.; Astilleros, J.M.; Fernández-Díaz, L. Environmental Remediation by Crystallization of Solid Solutions. Elements 2013, 9, 195–201. [Google Scholar] [CrossRef]
  4. González-Núñez, R.; Rigol, A.; Vidal, M. Assessing the efficacy over time of the addition of industrial by-products to remediate contaminated soils at a pilot-plant scale. Environ. Monit. Assess. 2017, 189, 155. [Google Scholar] [CrossRef]
  5. Davis, A.D.; Webb, C.J.; Sorensen, J.L.; Dixon, D.J.; Hudson, R. Geochemical thermodynamics of cadmium removal from water with limestone. Environ. Earth Sci. 2018, 77, 1–5. [Google Scholar] [CrossRef]
  6. Füllenbach, L.C.; Perez, J.P.H.; Freeman, H.M.; Thomas, A.N.; Mayanna, S.; Parker, J.E.; Göttlicher, J.; Steininger, R.; Radnik, J.; Benning, L.G.; et al. Nanoanalytical Identification of Siderite Dissolution-Coupled Pb Removal Mechanisms from Oxic and Anoxic Aqueous Solutions. Acs Earth Space Chem. 2020, 4, 1966–1977. [Google Scholar] [CrossRef]
  7. Roza Llera, A.; Jimenez, A.; Fernández-Díaz, L. Removal of Pb from Water: The Effectiveness of Gypsum and Calcite Mixtures. Minerals 2021, 11, 66. [Google Scholar] [CrossRef]
  8. Stumm, W.; Morgan, J.J. Aquatic Chemistry: Chemical Equilibria and Rates in Natural Waters; Wiley: Hoboken, NJ, USA, 1996; p. 1040. [Google Scholar]
  9. Di Lorenzo, F.; Ruiz-Agudo, C.; Churakov, S.V. The key effects of polymorphism during PbII uptake by calcite and aragonite. CrystEngComm 2019, 21, 6145–6155. [Google Scholar] [CrossRef]
  10. Di Lorenzo, F.; Cametti, G.; Vanhecke, D.; Churakov, S.V. The Role of Interfaces in Controlling Pb2+ removal by calcium carbonate minerals. Cryst. Growth Des. 2020, 20, 6157–6169. [Google Scholar] [CrossRef]
  11. Arvidson, R.S.; Mackenzie, F.T. The dolomite problem: Control of precipitation kinetics by temperature and saturation state. Am. J. Sci. 1999, 2, 257–288. [Google Scholar] [CrossRef] [Green Version]
  12. Di Lorenzo, F.; Rodríguez-Galán, R.M.; Prieto, M. Kinetics of the solvent-mediated transformation of hydromagnesite into magnesite at different temperatures. Miner. Mag. 2014, 78, 1363–1372. [Google Scholar] [CrossRef] [Green Version]
  13. Di Lorenzo, F.; Prieto, M. Dissolution–Recrystallization of (Mg,Fe)CO3 during Hydrothermal Cycles: FeII/FeIII Conundrums in the Carbonation of Ferromagnesian Minerals. Cryst. Growth Des. 2017, 17, 4170–4182. [Google Scholar] [CrossRef]
  14. Xu, J.; Yan, C.; Zhang, F.; Konishi, H.; Xu, H.; Teng, H.H. Testing the cation-hydration effect on the crystallization of Ca–Mg–CO3 systems. Proc. Natl. Acad. Sci. USA 2013, 110, 17750–17755. [Google Scholar] [CrossRef] [PubMed] [Green Version]
  15. Hong, M.; Xu, J.; Teng, H.H. Evolution of calcite growth morphology in the presence of magnesium: Implications for the dolomite problem. Geochim. Cosmochim. Acta 2016, 172, 55–64. [Google Scholar] [CrossRef] [Green Version]
  16. Di Tommaso, D.; De Leeuw, N.H. Structure and dynamics of the hydrated magnesium ion and of the solvated magnesium carbonates: Insights from first principles simulations. Phys. Chem. Chem. Phys. 2009, 12, 894–901. [Google Scholar] [CrossRef]
  17. Hamm, L.M.; Wallace, A.F.; Dove, P.M. Molecular Dynamics of Ion Hydration in the Presence of Small Carboxylated Molecules and Implications for Calcification. J. Phys. Chem. B 2010, 114, 10488–10495. [Google Scholar] [CrossRef]
  18. Koskamp, J.A.; Ruiz-Hernandez, S.E.; Di Tommaso, D.; Elena, A.M.; De Leeuw, N.H.; Wolthers, M. Reconsidering Calcium Dehydration as the Rate-Determining Step in Calcium Mineral Growth. J. Phys. Chem. C 2019, 123, 26895–26903. [Google Scholar] [CrossRef] [Green Version]
  19. Zhang, X.; Alvarez-Lloret, P.; Chass, G.A.; Di Tommaso, D. Interatomic potentials of Mg ions in aqueous solutions: Structure and dehydration kinetics. Eur. J. Miner. 2019, 31, 275–287. [Google Scholar] [CrossRef]
  20. Lindner, M.; Saldi, G.D.; Carrocci, S.; Bénézeth, P.; Schott, J.; Jordan, G. On the growth of anhydrous Mg-bearing carbonates—Implications from norsethite growth kinetics. Geochim. Cosmochim. Acta 2018, 238, 424–437. [Google Scholar] [CrossRef]
  21. Lindner, M.; Saldi, G.D.; Jordan, G.; Schott, J. On the effect of aqueous barium on magnesite growth—A new route for the precipitation of the ordered anhydrous Mg-bearing double carbonate norsethite. Chem. Geol. 2017, 460, 93–105. [Google Scholar] [CrossRef]
  22. Lindner, M.; Jordan, G. On the growth of witherite and its replacement by the Mg-bearing double carbonate norsethite: Implications for the dolomite problem. Am. Miner. 2018, 103, 252–259. [Google Scholar] [CrossRef]
  23. Pimentel, C.; Pina, C.M.; Martinez, C.M.P. The formation of the dolomite-analogue norsethite: Reaction pathway and cation ordering. Geochim. Cosmochim. Acta 2014, 142, 217–223. [Google Scholar] [CrossRef]
  24. Pimentel, C.; Pina, C.M. Reaction pathways towards the formation of dolomite-analogues at ambient conditions. Geochim. Cosmochim. Acta 2016, 178, 259–267. [Google Scholar] [CrossRef] [Green Version]
  25. Liu, C.; Li, W. Transformation of amorphous precursor to crystalline carbonate: Insights from Mg isotopes in the dolomite-analogue mineral norsethite [BaMg(CO3)2]. Geochim. Cosmochim. Acta 2020, 272, 1–20. [Google Scholar] [CrossRef]
  26. Bersani, D.; Campani, E.; Casoli, A.; Lottici, P.; Marino, I.-G. Spectroscopic study of the degradation products in the holy water fonts in Santa Maria della Steccata Church in Parma (Italy). Anal. Chim. Acta 2008, 610, 74–79. [Google Scholar] [CrossRef]
  27. Parkhurst, D.L.; Appelo, C.A.J. Description of Input and Examples for PHREEQC Version 3−A Computer Program for Speciation, Batch-Reaction, One-Dimensional Transport, and Inverse Geochemical Calculations; Book 6, Section A; US Geological Survey: Reston, VA, USA, 2013; Chapter 43.
  28. Nečas, D.; Klapetek, P. Gwyddion: An open-source software for SPM data analysis. Cent. Eur. J. Phys. 2012, 10, 181–188. [Google Scholar] [CrossRef]
  29. Morse, J.W.; Arvidson, R.S.; Lüttge, A. Calcium Carbonate Formation and Dissolution. Chem. Rev. 2007, 107, 342–381. [Google Scholar] [CrossRef]
  30. Naviaux, J.D.; Subhas, A.V.; Rollins, N.E.; Dong, S.; Berelson, W.M.; Adkins, J.F. Temperature dependence of calcite dissolution kinetics in seawater. Geochim. Cosmochim. Acta 2019, 246, 363–384. [Google Scholar] [CrossRef] [Green Version]
  31. Dong, S.; Berelson, W.M.; Rollins, N.E.; Subhas, A.V.; Naviaux, J.D.; Celestian, A.J.; Liu, X.; Turaga, N.; Kemnitz, N.J.; Byrne, R.H.; et al. Aragonite dissolution kinetics and calcite/aragonite ratios in sinking and suspended particles in the North Pacific. Earth Planet. Sci. Lett. 2019, 515, 1–12. [Google Scholar] [CrossRef] [Green Version]
  32. Pokrovsky, O.S.; Golubev, S.V.; Schott, J.; Castillo, A. Calcite, dolomite and magnesite dissolution kinetics in aqueous solutions at acid to circumneutral pH, 25 to 150 °C and 1 to 55 atm pCO2: New constraints on CO2 sequestration in sedimentary basins. Chem. Geol. 2009, 265, 20–32. [Google Scholar] [CrossRef]
  33. Gautier, J.-M.; Oelkers, E.H.; Schott, J. Are quartz dissolution rates proportional to B.E.T. surface areas? Geochim. Cosmochim. Acta 2001, 65, 1059–1070. [Google Scholar] [CrossRef]
  34. Tester, J.W.; Worley, W.G.; Robinson, B.A.; Grigsby, C.O.; Feerer, J.L. Correlating quartz dissolution kinetics in pure water from 25 to 625 °C. Geochim. Cosmochim. Acta 1994, 58, 2407–2420. [Google Scholar] [CrossRef]
  35. Brunauer, S.; Emmett, P.H.; Teller, E. Adsorption of Gases in Multimolecular Layers. J. Am. Chem. Soc. 1938, 60, 309–319. [Google Scholar] [CrossRef]
  36. Suess, H.E.; Urey, H.C. Abundances of the Elements. Rev. Mod. Phys. 1956, 28, 53–74. [Google Scholar] [CrossRef]
  37. Putnis, A. Effects of kinetics and mechanisms of crystal growth on ion-partitioning in solid solution–aqueous solution (SS–AS) systems. Eur. Mineral. Union Notes Mineral. 2010, 10, 43–64. [Google Scholar] [CrossRef] [Green Version]
  38. Renard, F.; Røyne, A.; Putnis, C.V. Timescales of interface-coupled dissolution-precipitation reactions on carbonates. Geosci. Front. 2019, 10, 17–27. [Google Scholar] [CrossRef]
  39. García, R.; Pérez, R. Dynamic atomic force microscopy methods. Surf. Sci. Rep. 2002, 47, 197–301. [Google Scholar] [CrossRef]
  40. Callagon, E.B.R.; Lee, S.S.; Eng, P.J.; Laanait, N.; Sturchio, N.C.; Nagy, K.L.; Fenter, P. Heteroepitaxial growth of cadmium carbonate at dolomite and calcite surfaces: Mechanisms and rates. Geochim. Cosmochim. Acta 2017, 205, 360–380. [Google Scholar] [CrossRef] [Green Version]
  41. Shannon, R.D. Revised effective ionic radii and systematic studies of interatomic distances in halides and chalcogenides. Acta Crystallogr. 1976, 32, 751–767. [Google Scholar] [CrossRef]
  42. Dove, P.M.; Han, N.; De Yoreo, J.J. Mechanisms of classical crystal growth theory explain quartz and silicate dissolution behavior. Proc. Natl. Acad. Sci. USA 2005, 102, 15357–15362. [Google Scholar] [CrossRef] [PubMed] [Green Version]
  43. Pastero, L.; Bruno, M.; Aquilano, D. Habit Change of Monoclinic Hydroxyapatite Crystals Growing from Aqueous Solution in the Presence of Citrate Ions: The Role of 2D Epitaxy. Crystals 2018, 8, 308. [Google Scholar] [CrossRef] [Green Version]
  44. Bénézeth, P.; Saldi, G.D.; Dandurand, J.-L.; Schott, J. Experimental determination of the solubility product of magnesite at 50 to 200 °C. Chem. Geol. 2011, 286, 21–31. [Google Scholar] [CrossRef]
  45. Saldi, G.D.; Jordan, G.; Schott, J.; Oelkers, E.H. Magnesite growth rates as a function of temperature and saturation state. Geochim. Cosmochim. Acta 2009, 73, 5646–5657. [Google Scholar] [CrossRef]
  46. De Yoreo, J.J.; Vekilov, P.G. Principles of Crystal Nucleation and Growth. Rev. Miner. Geochem. 2003, 54, 57–93. [Google Scholar] [CrossRef] [Green Version]
  47. Gebauer, D.; Völkel, A.; Cölfen, H. Stable Prenucleation Calcium Carbonate Clusters. Science 2008, 322, 1819–1822. [Google Scholar] [CrossRef] [PubMed] [Green Version]
  48. Radha, A.; Fernandez-Martinez, A.; Hu, Y.; Jun, Y.-S.; Waychunas, G.A.; Navrotsky, A. Energetic and structural studies of amorphous Ca1−xMgxCO3 × nH2O (0 ≤ x ≤ 1). Geochim. Cosmochim. Acta 2012, 90, 83–95. [Google Scholar] [CrossRef]
  49. Stefánsson, A.; Bénézeth, P.; Schott, J. Potentiometric and spectrophotometric study of the stability of magnesium carbonate and bicarbonate ion pairs to 150 °C and aqueous inorganic carbon speciation and magnesite solubility. Geochim. Cosmochim. Acta 2014, 138, 21–31. [Google Scholar] [CrossRef]
  50. Wen, H.; Li, L. An upscaled rate law for magnesite dissolution in heterogeneous porous media. Geochim. Cosmochim. Acta 2017, 210, 289–305. [Google Scholar] [CrossRef]
  51. Hänchen, M.; Prigiobbe, V.; Baciocchi, R.; Mazzotti, M. Precipitation in the Mg-carbonate system—Effects of temperature and CO2 pressure. Chem. Eng. Sci. 2008, 63, 1012–1028. [Google Scholar] [CrossRef]
  52. Ballirano, P.; De Vito, C.; Mignardi, S.; Ferrini, V. Phase transitions in the MgCO2H2O system and the thermal decomposition of dypingite, Mg5(CO3)4(OH)2 × 5H2O: Implications for geosequestration of carbon dioxide. Chem. Geol. 2013, 340, 59–67. [Google Scholar] [CrossRef]
  53. Fricker, K.J.; Park, A.-H.A. Effect of H2O on Mg (OH)2 carbonation pathways for combined CO2 capture and storage. Chem. Eng. Sci. 2013, 100, 332–341. [Google Scholar] [CrossRef]
  54. Harrison, A.L.; Mavromatis, V.; Oelkers, E.H.; Bénézeth, P. Solubility of the hydrated Mg-carbonates nesquehonite and dypingite from 5 to 35 °C: Implications for CO2 storage and the relative stability of Mg-carbonates. Chem. Geol. 2019, 504, 123–135. [Google Scholar] [CrossRef]
  55. Lu, L.; Guest, J.S.; Peters, C.A.; Zhu, X.; Rau, G.H.; Ren, Z.J. Wastewater treatment for carbon capture and utilization. Nat. Sustain. 2018, 1, 750–758. [Google Scholar] [CrossRef]
Figure 1. (A) Solubility product of anhydrous carbonate minerals from Minteq.dat. This database is included in Phreeqc and was used for the following simulations. (B) Phreeqc simulation showing the amount of Pb2+ that can be precipitated by adding 0.02 mol (1.7 g) of magnesite to 1 L of a solution with an initial Pb2+ concentration of 10 mM. (C) A similar Pb2+ uptake is achieved using 0.02 mol (2 g) of calcite (notice the break in the right axis of Figure 1B). Analogous system behaviour is predicted for aragonite and dolomite as remediation agents. Among the contaminants, otavite (cadmium carbonate) shows a solubility even lower than cerussite (PbCO3), thus Cd2+ could also be efficiently taken up through this spontaneous reaction.
Minerals 11 00415 g001
Figure 2. (A) μmol of HNO3 added during the dissolution of magnesite (MGS), aragonite (ARG) and calcite (CAL). (B) pH cycles during carbonate dissolution. The grey areas are used to highlight the presence of breaks in the axes.
Minerals 11 00415 g002
Figure 3. (A) Dissolution rates of MGS, ARG and CAL normalized by the surface area. Two geometrical surface areas are reported (sphere and cube approximations) together with BET surface area and literature values [30,31,32]. (B) Dissolution rate of MGS and ARG normalized with respect to CAL.
Minerals 11 00415 g003
Figure 4. (A) X-ray diffraction of the precipitation products shows that cerussite is the only detectable phase in presence of Pb. Pb free experiments show the formation of dypingite as crystalline phase. The high background to signal ratio suggests the formation of solid with low crystallinity. (B) SEM micrographs show the presence of two phases during the coprecipitation of Mg and Pb carbonates. The images reported were collected with backscattered electron on the same area. Two different brightness-contrast settings are used to allow the visualization of the Pb-rich (bright) and Mg-rich (dark) phases due to the elevated difference in the atomic weight. (C) EDX analysis confirms the presence of two different phases characterized by a different Pb/Mg ratio.
Minerals 11 00415 g004
Figure 5. (A) Composition of the solid phase as a function of the Pb/Mg ratio in the initial solution. The plot on the left shows the range of compositions investigated and the plot on the right shows the preferential incorporation of Pb in the solid phases. (B) Composition of the solid phases as a function of the initial total magnesium content. (C) Composition of the solid phases as a function of total lead content. The numbers next to the symbols refer to the number of independent EDX analyses used to calculate the averages and the standard deviations.
Minerals 11 00415 g005
Figure 6. (A) Sequence of images from the height channel. The images cover a time range of 4 h after the injection of a supersaturated solution containing Pb2+ on {10.4} MGS surfaces. (B) Section profiles are extracted from successive frames to calculate the step advancement rate. The profiles are compared by introducing a constant offset to align the height and the position of the maximum in every profile. (C) The difference between the initial and the actual profile allows us to visualize and to quantify the overgrown regions of the step edges. (D) The overgrown regions of the steps show a phase contrast with the pristine regions; this effect is likely due a change in electron density caused by Pb2+ incorporation.
Minerals 11 00415 g006
Figure 7. (A) Sequence of height channel images recorded onto a {10.4} MGS surface after the injection of a supersaturation solution analogous to Figure 6, but after ageing. (B) Height channel images at high magnification of few nuclei that grow during 5 min. (C) Step propagation rates calculated from the time-resolved size increment of the four particles shown on the right side. The colours of the lines and the columns link every particle with its step advancement rate.
Minerals 11 00415 g007
Figure 8. In situ observation of {10.4} surfaces of MGS in contact with acidic solution, pH 4 (HNO3). The images were acquired in tapping mode. The first row corresponds to height channels, while the second row reports the respective amplitude channels. (A) The dissolution at 25 °C is sluggish and it is not possible to detect any dissolution feature. (B) In the same conditions but at higher temperature (60 °C), dissolution features are observed on the {10.4} surfaces of MGS, despite the retrograde solubility. Yellow and blue lines of constant size are used to highlight the evolution of etch pits and step edges, respectively. This evidence demonstrates that the existence of kinetic barriers controls the dissolution of MGS at room temperature conditions.
Minerals 11 00415 g008
Figure 9. (A) Comparison between the evolution of pH in dissolution and recrystallization experiments for MGS, ARG and CAL. (B) Evolution of electrical conductivity in absence and in presence of Pb2+. The star symbols refer to the conductivity of the respective solution calculated with PHREEQC. (C) Comparison between the amount of substrate that reacted during the dissolution of MGS, ARG and CAL and the amount of substrate reacted during the batch recrystallization experiments in presence of Pb2+. The experiments labelled with the asterisk (in Figure 9C) refer to literature values from [9].
Minerals 11 00415 g009
Publisher’s Note: MDPI stays neutral with regard to jurisdictional claims in published maps and institutional affiliations.

