Article

Comprehending the Causes of Presence of Copper and Common Heavy Metals in Sediments of Irrigation Canals in Taiwan

1
Institute of Environmental Engineering and Management, National Taipei University of Technology, Taipei 106, Taiwan
2
Soil and Groundwater Remediation Fund Management Board, Environmental Protection Administration, Taipei 100, Taiwan
3
Apollo Technology Co., Ltd., Taipei 104, Taiwan
4
Graduate Institute of Environmental Engineering, National Taiwan University, Taipei 106, Taiwan
*
Author to whom correspondence should be addressed.
Minerals 2021, 11(4), 416; https://doi.org/10.3390/min11040416
Submission received: 24 March 2021 / Revised: 10 April 2021 / Accepted: 12 April 2021 / Published: 14 April 2021
(This article belongs to the Special Issue Elemental Concentration and Pollution in Soil, Water, and Sediment)

Abstract

:
In 2019, Taiwan completed its first thorough heavy metal investigation of irrigation canal sediments by this study with the support of Taiwan Environmental Protection Administration. Box-and-whisker plots were used to analyze the sediment distribution and to define metal concentrations. Possible metal pollution sources, the polluted agricultural land, irrigation area, and water sources were also evaluated using spatial analysis to understand the possible causes of sediment pollution. Results showed that the main heavy metal in agricultural land was Cu, found in 77% of contaminated agricultural land sites. Most sites with Cu pollution in sediments were in Taoyuan City and Changhua County. The heavy metals present in the sediment pollution sites in Taoyuan were consistent with those of possible pollution sources upstream, namely, Cr, Cu, and Pb. The main heavy metals in sediment pollution sites in Changhua were Cr, Cu, Ni, Pb, and Zn, whereas those for the polluted agricultural land sites were Cr, Cu, Ni, and Zn, without Pb. The main irrigation water sources in Changhua include drainages and rivers, with some receiving most wastewater pollution mass of release of Changhua, and functions as an irrigation water source with a high release mass in Cr, Cu, Ni and Zn. These findings indicate that the sites of sediment pollution, sites of polluted agricultural land, and the sources of pollution share corresponding heavy metal characteristics. Therefore, in Changhua, the sediments were polluted mainly because (1) the irrigation canals received the highest masses of pollutant releases into drainage wastewater of the county; and (2) the return flow from irrigation and the illegal discharge of wastewater. The preliminary assessment results for sediment pollution in Taoyuan also suggest that the main causes may be irrigation by polluted rivers or drainages and return flows.

1. Introduction

Agricultural lands contaminated by heavy metals has become a serious problem and is of concern in Taiwan [1]. Although Taiwan has an annual precipitation reaching 95.2 billion m3, which is approximately 2.6 times the world average, the sum of annual evaporation and runoff to the sea reaches 75.1 billion m3 because of Taiwan’s geographic characteristics of a longer north–south span in comparison to the west–east span and the Central Mountain Range running from the north to the south of the island [2]. This leads to difficulty in water storage and the rainfall that can be used by each person is only 1/6 of world average in Taiwan [3]. Therefore, irrigation canals provide the foundation of rice agriculture in Taiwan. Water storage systems including reservoirs and farm ponds are employed to store a considerable amount of rainwater. Through water transmission systems, such as leading canals, main canals, and lateral canals, water is led to ditches and dispatched to agricultural land for irrigation [4]. The systems enable regions including Changhua, Chiayi, and Tainan Counties to grow rice crops successfully and ensure abundant harvests. However, as of November 2020, the number of agricultural land sites listed as having soil contamination was 7294, of which 5589 contained copper (Cu) pollution, accounting for 77% of the sites. The data thus indicated that Cu is the main pollutant of agricultural land in Taiwan [5].
Excessive trace elements in agricultural soil may inhibit the growth or decrease the yield of food [6], and the food loss caused by the abnormal Cu concentration in the soil may be higher than other causes leading to food safe and food security threats. Cu can cause growth inhibition, oxidative damage, antioxidant response, and disturbances in physiological and biochemical processes in food crops such as wheat, rice, and maize [7,8,9,10]. One study found that when the Cu concentration in the culture solution reached 10 μM, the germination rate of rice (Oryza sativa L.) was reduced by about 60% compared with the control group (from 93% to 34%), and the root length was reduced by about 40% (from 80.3 mm to 50.1 mm) [11]; when the Cu concentration in the soil is 100 mg/kg, the yield of rice grain decreases by 10%, and when the concentration is between 300 mg/kg and 500 mg/kg, the yield of rice grain is reduced by 50%. When the Cu concentration reaches 1000 mg/kg, the yield of rice grain is reduced by 90%. Cao and Hu [12] investigated that rice grown in paddy soils irrigated by Cu-containing wastewater would lead to the problem of less effective tiller and black roots; in addition, the yield of rice grain was reduced by 18%–25%. The Cu concentration reaching 50 mg/kg also had a significant effect on root weight [13]. Moreover, the Cu concentration in brown rice (15.5 mg/kg) was measured higher than the value of 10 mg/kg of maximum permissible concentration in grains promulgated by Food and Agriculture Organization (FAO) [14] when the Cu concentration in the paddy soil reached 101.2 mg/kg [12]. In Taiwan, the higher bioaccumulation of Cu in the soil–grapevine system in vineyards may also cause a public concern of general population exposure to Cu through grape consumption [15,16,17,18].
Rice is the most important food crop in Taiwan; the average annual harvest area in the past 10 years is higher than that of other crops, such as grains, vegetables, and fruits [19]. If the high Cu concentration in farmland soils reduces rice production, it may cause a food crisis in Taiwan. Unfortunately, several agricultural land sites are polluted with Cu and other common heavy metals by irrigation water [20,21,22,23] or specifically, suspended solids in irrigation water [24]. Although the strategy of separating irrigation and drainage canals may improve the quality of irrigation water [25], the suspended solids in irrigation water may accumulate at the bottom of canals and form sediments. No large-scale study has been conducted to investigate the sediments of irrigation canals before this study. If sediments are resuspended or scoured because of rainwater flooding into agricultural land, they may pollute the land.
To protect citizen health and secure sediment quality, the Environmental Protection Administration (EPA) of the Executive Yuan in Taiwan incorporated sediment quality management provisions in amendments to the Soil and Groundwater Pollution Remediation Act in 2010 and made subsidiary regulations including “Regulations on the Classification Management and Usage Limitation of Sediment Quality Guidelines” and “Implementation Regulations on Testing Sediments for the Future Reference of Local Industry Competent Authorities” after the implementation of the Act. The regulations were effective as of January 2014. According to Paragraph 5 of Article 6 of the Soil and Groundwater Pollution Remediation Act, the authorities responsible for rivers, irrigation canals, lakes, and reservoirs must test the bottom sediment quality of the listed water bodies and submit the resulting data to the central competent authority.
Therefore, this study is of importance, exploring the distribution of Cu and other common heavy metal pollutants in the sediments of irrigation canals and compared it with that of Cu-polluted agricultural sites. A composite analysis of possible pollution sources, situations of surface waters, and other heavy metal pollution characteristics was conducted to determine the sediment pollution characteristics and possible causes.

2. Materials and Methods

2.1. Data

The total number of water bodies reported on by all industry competent authorities in the initial period of regular reporting (2014–2019) was 557, including 118 rivers, 94 lakes and reservoirs, and 345 irrigation canals. Among the water bodies, 35 rivers and two reservoirs were approved to be exempted from reporting because of gravel on the bottom, and one reservoir was exempted because of ongoing construction. Reports on a total of 519 water bodies were to be completed in the first operation period, consisting of 83 rivers, 91 lakes and reservoirs, and 345 irrigation canals. All competent authorities were to complete all reports on sediment quality by 2019. The sediment samples of one reservoir (under construction) and 63 irrigation canals (without sufficient amounts of sediments) could not be collected. Thus, the actual number of water bodies tested in the first operation period comprised 83 rivers, 90 lakes and reservoirs, and 282 irrigation canals.

2.2. Sampling and Analytical Methods

Relevant sampling, preprocessing, and analytical methods were implemented according to the standard methods provided by the Environmental Analysis Laboratory of the EPA, Executive Yuan. The methods included NIEA S104 (sediment sampling method), NIEA M353 (method for detecting metal in waste and sediments—acid digestion), NIEA M301 (method for detecting metal in waste and sediments—microwave assisted acid digestion), NIEA S310 (method for detecting arsenic in soil and sediments—arsine atomic absorption spectrometry), NIEA M111 (flame atomic absorption spectrometry), NIEA M104 (inductively coupled plasma atomic emission spectrometry), NIEA M317 (method for detecting the total mercury in soil, sediments, and waste—cold vapor atomic absorption spectrometry), and NIEA M318 (method for detecting the total mercury in solid and liquid samples—thermal decomposition, amalgamation, and atomic absorption spectrophotometry).
Hand shovels, sampling spoons, and grab samplers were used to collect samples from sediments in rivers, irrigation canals, lakes, and reservoirs. The samples were air dried (for approximately 7–10 days), oven dried at 30 ± 4 °C, or freeze dried. All dried samples were sifted using 2 mm (10 mesh) standard sieves before they were further ground and sifted through 0.15 mm (100 mesh) standard sieves.
The homogenized samples underwent microwave digestion or acid digestion to complete the digestion process. The microwave digestion method involved adding 1 mg of the sample into 9 ± 0.1 mL concentrated nitric acid and 3 ± 0.1 mL concentrated hydrochloric acid and mixed evenly. Microwave digestion devices were used to heat samples to 175 ± 5 °C at a rate of approximately 10 °C/min, and the temperature was maintained for 10 ± 1 min. Each sample was poured into a volumetric flask and diluted with reagent water. The supernatant digestion solution was collected and analyzed using instruments. The acid digestion method involved adding 0.01 mg of the sample into the digestion vessel. Then, 10 mL of (1:1) nitric acid, 5 mL of concentrated acid, 2 mL of water, and 3 mL of 30% hydrogen peroxide were sequentially added to the vessel, which was heated to 95 ± 5 °C by vapor collection devices. After each reflux condensation without boiling the sample, 1 mL of 30% hydrogen peroxide was added until the sample was heated and minimum bubbles were present or the sample appearance remained unchanged. Then, 10 mL of concentrated hydrochloric acid was added to the digestion solution, which was then heated to 95 ± 5 °C. The nonboiling sample underwent reflux for 15 min. After the sample was condensed, it was diluted to a constant volume of 100 mL using reagent water. Whatman Grade 40 filter papers (or equivalent products) or centrifugal methods were employed to collect the supernatant digestion solution for instrumental analysis.
Digestion solutions can be determined through flame atomic absorption spectrometry for cadmium (Cd), chromium (Cr), Cu, nickel (Ni), lead (Pb), and zinc (Zn). Graphite furnace atomic absorption spectrometry can be used to determine arsenic (As), Cd, Cr, Cu, Ni, Pb, and Zn content. Inductively coupled plasma atomic emission spectrometry or inductively coupled plasma mass spectrometry can be used to determine As, Cd, Cr, Cu, Hg, Ni, Pb, and Zn.

2.3. Graphic and Spatial Analysis

The sediment data had to be processed using appropriate statistical methods to identify the value distributions and trends. A box-and-whisker plot [26] is a common schematic method for presenting descriptive statistics. The method yields five-number summaries, including the first quartile, median, third quartile, minimum, and maximum. In consideration of the absence of previous irrigation canal baseline data in Taiwan, 1.5 × interquartile range can be added to the third quartile to obtain the outlier value as the screening basis for high pollution potential sites.
Bar charts provided concentration distribution trends of pollutants, visualizing pollutants with higher concentrations and concentration trends for different sediment sites with icons. Pie charts and radar charts facilitated the comparisons of different types of data such as the number of sediment pollution sites in different counties and cities and the distribution and number of agricultural land pollution sites.
A geographic information system was adopted to present vector or grid information that provided coordinate information including the sediment sampling site, agricultural land, pollution source, irrigation canal, and surface water. Spatial analysis was conducted to extract the data characteristics of different ranges for spatial distribution patterns.

3. Results and Discussion

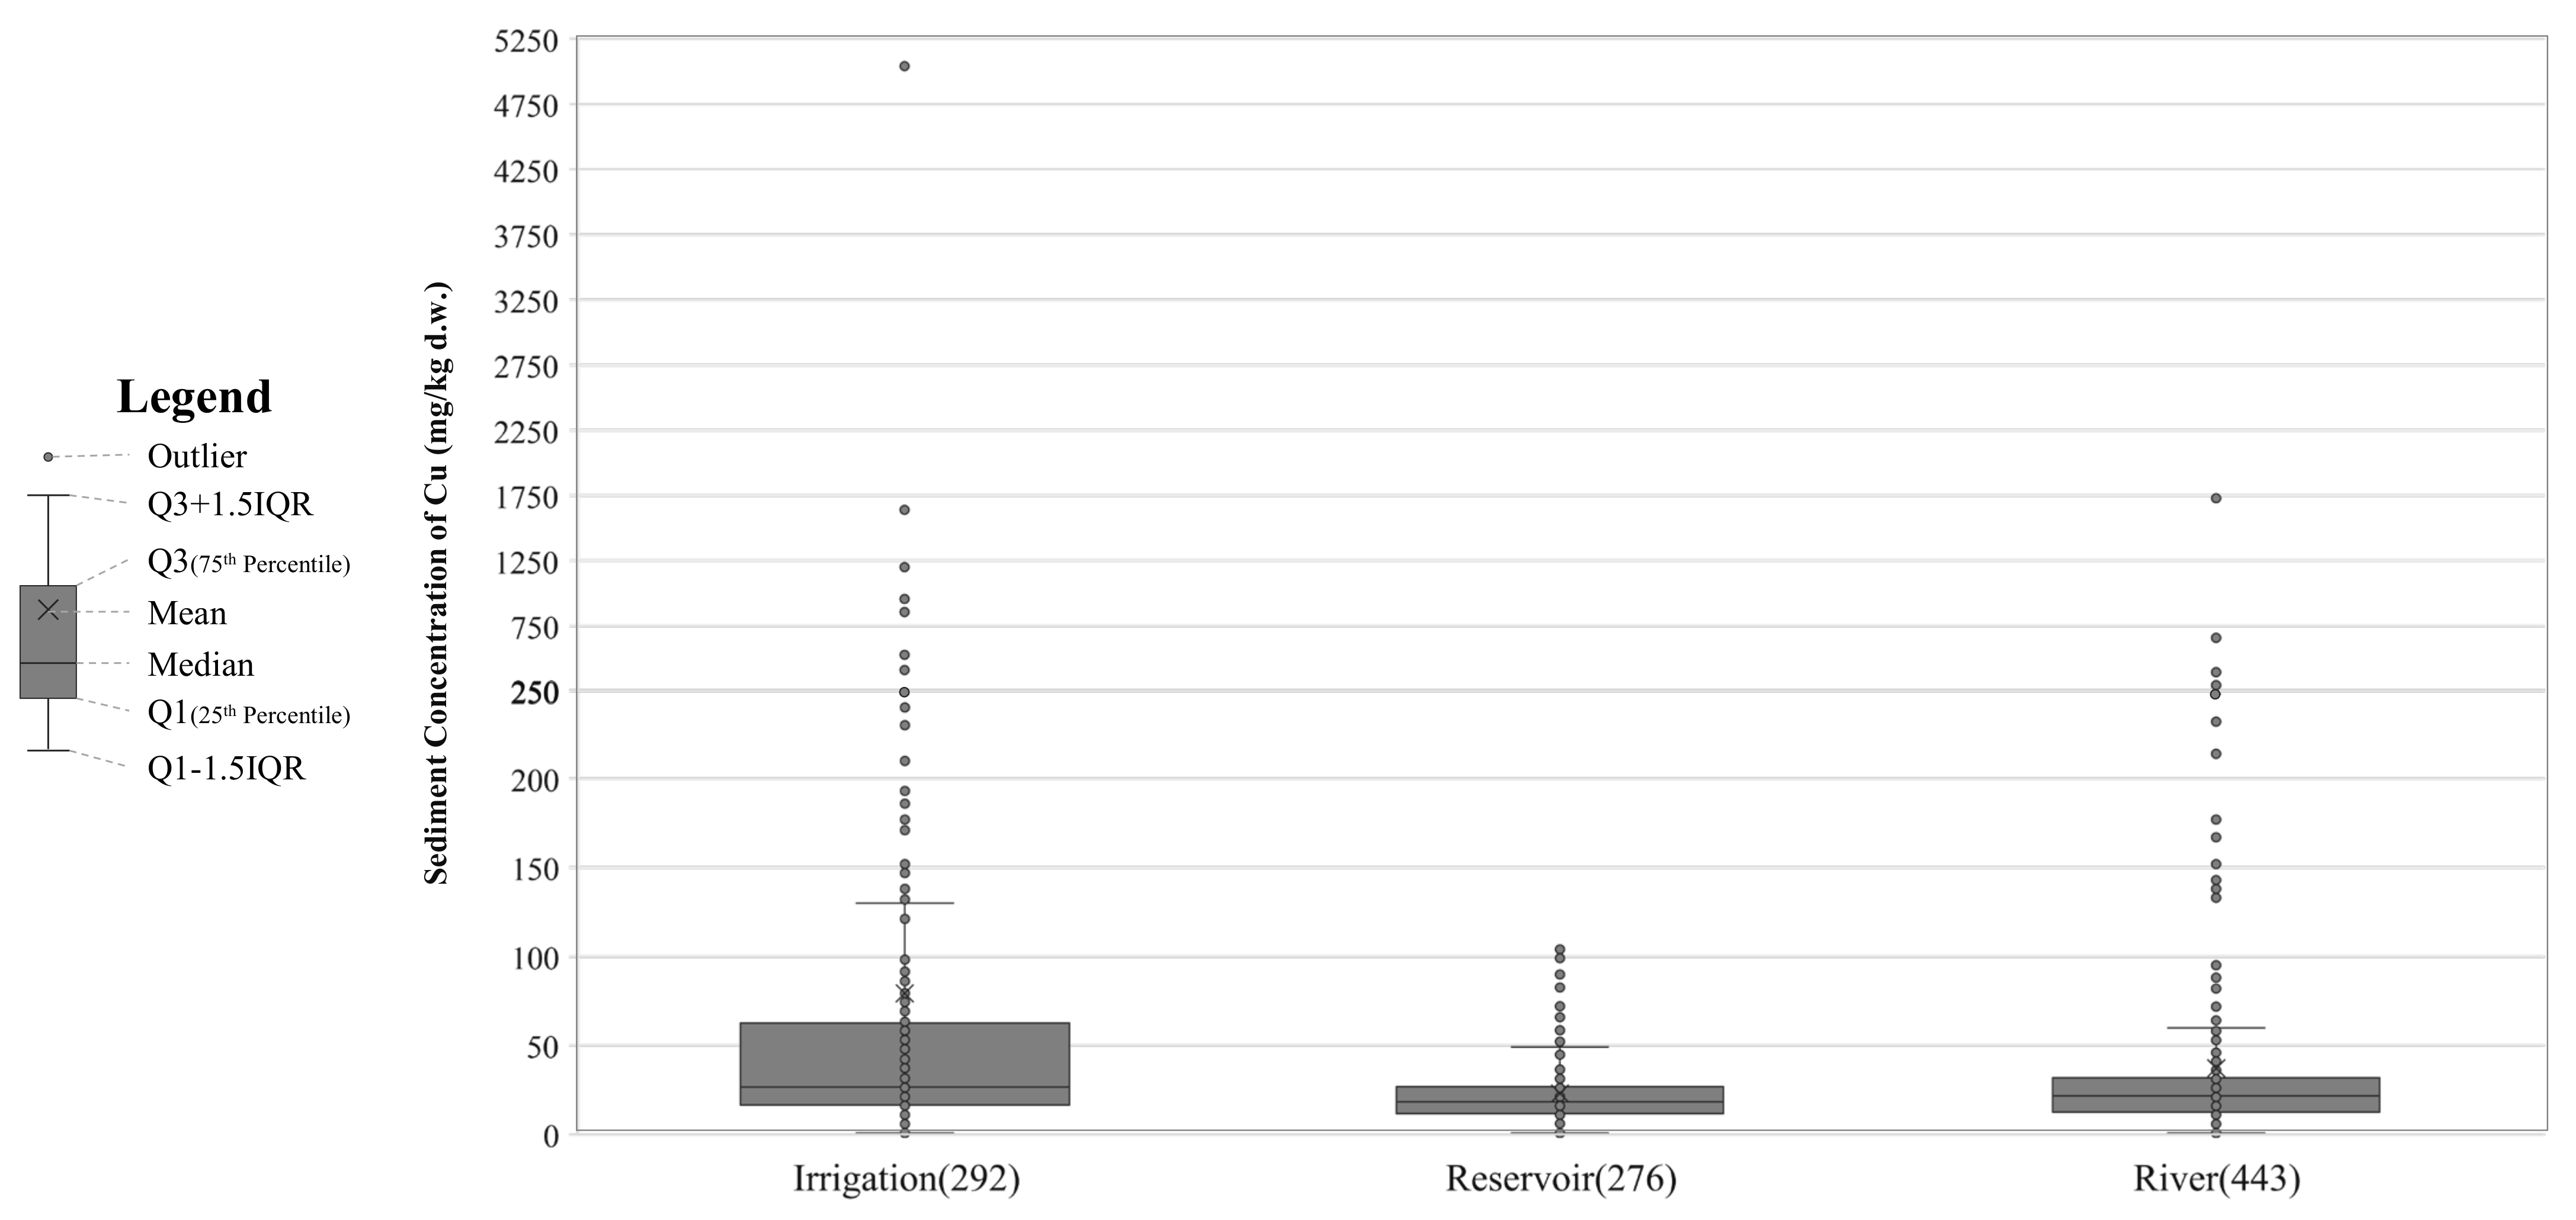
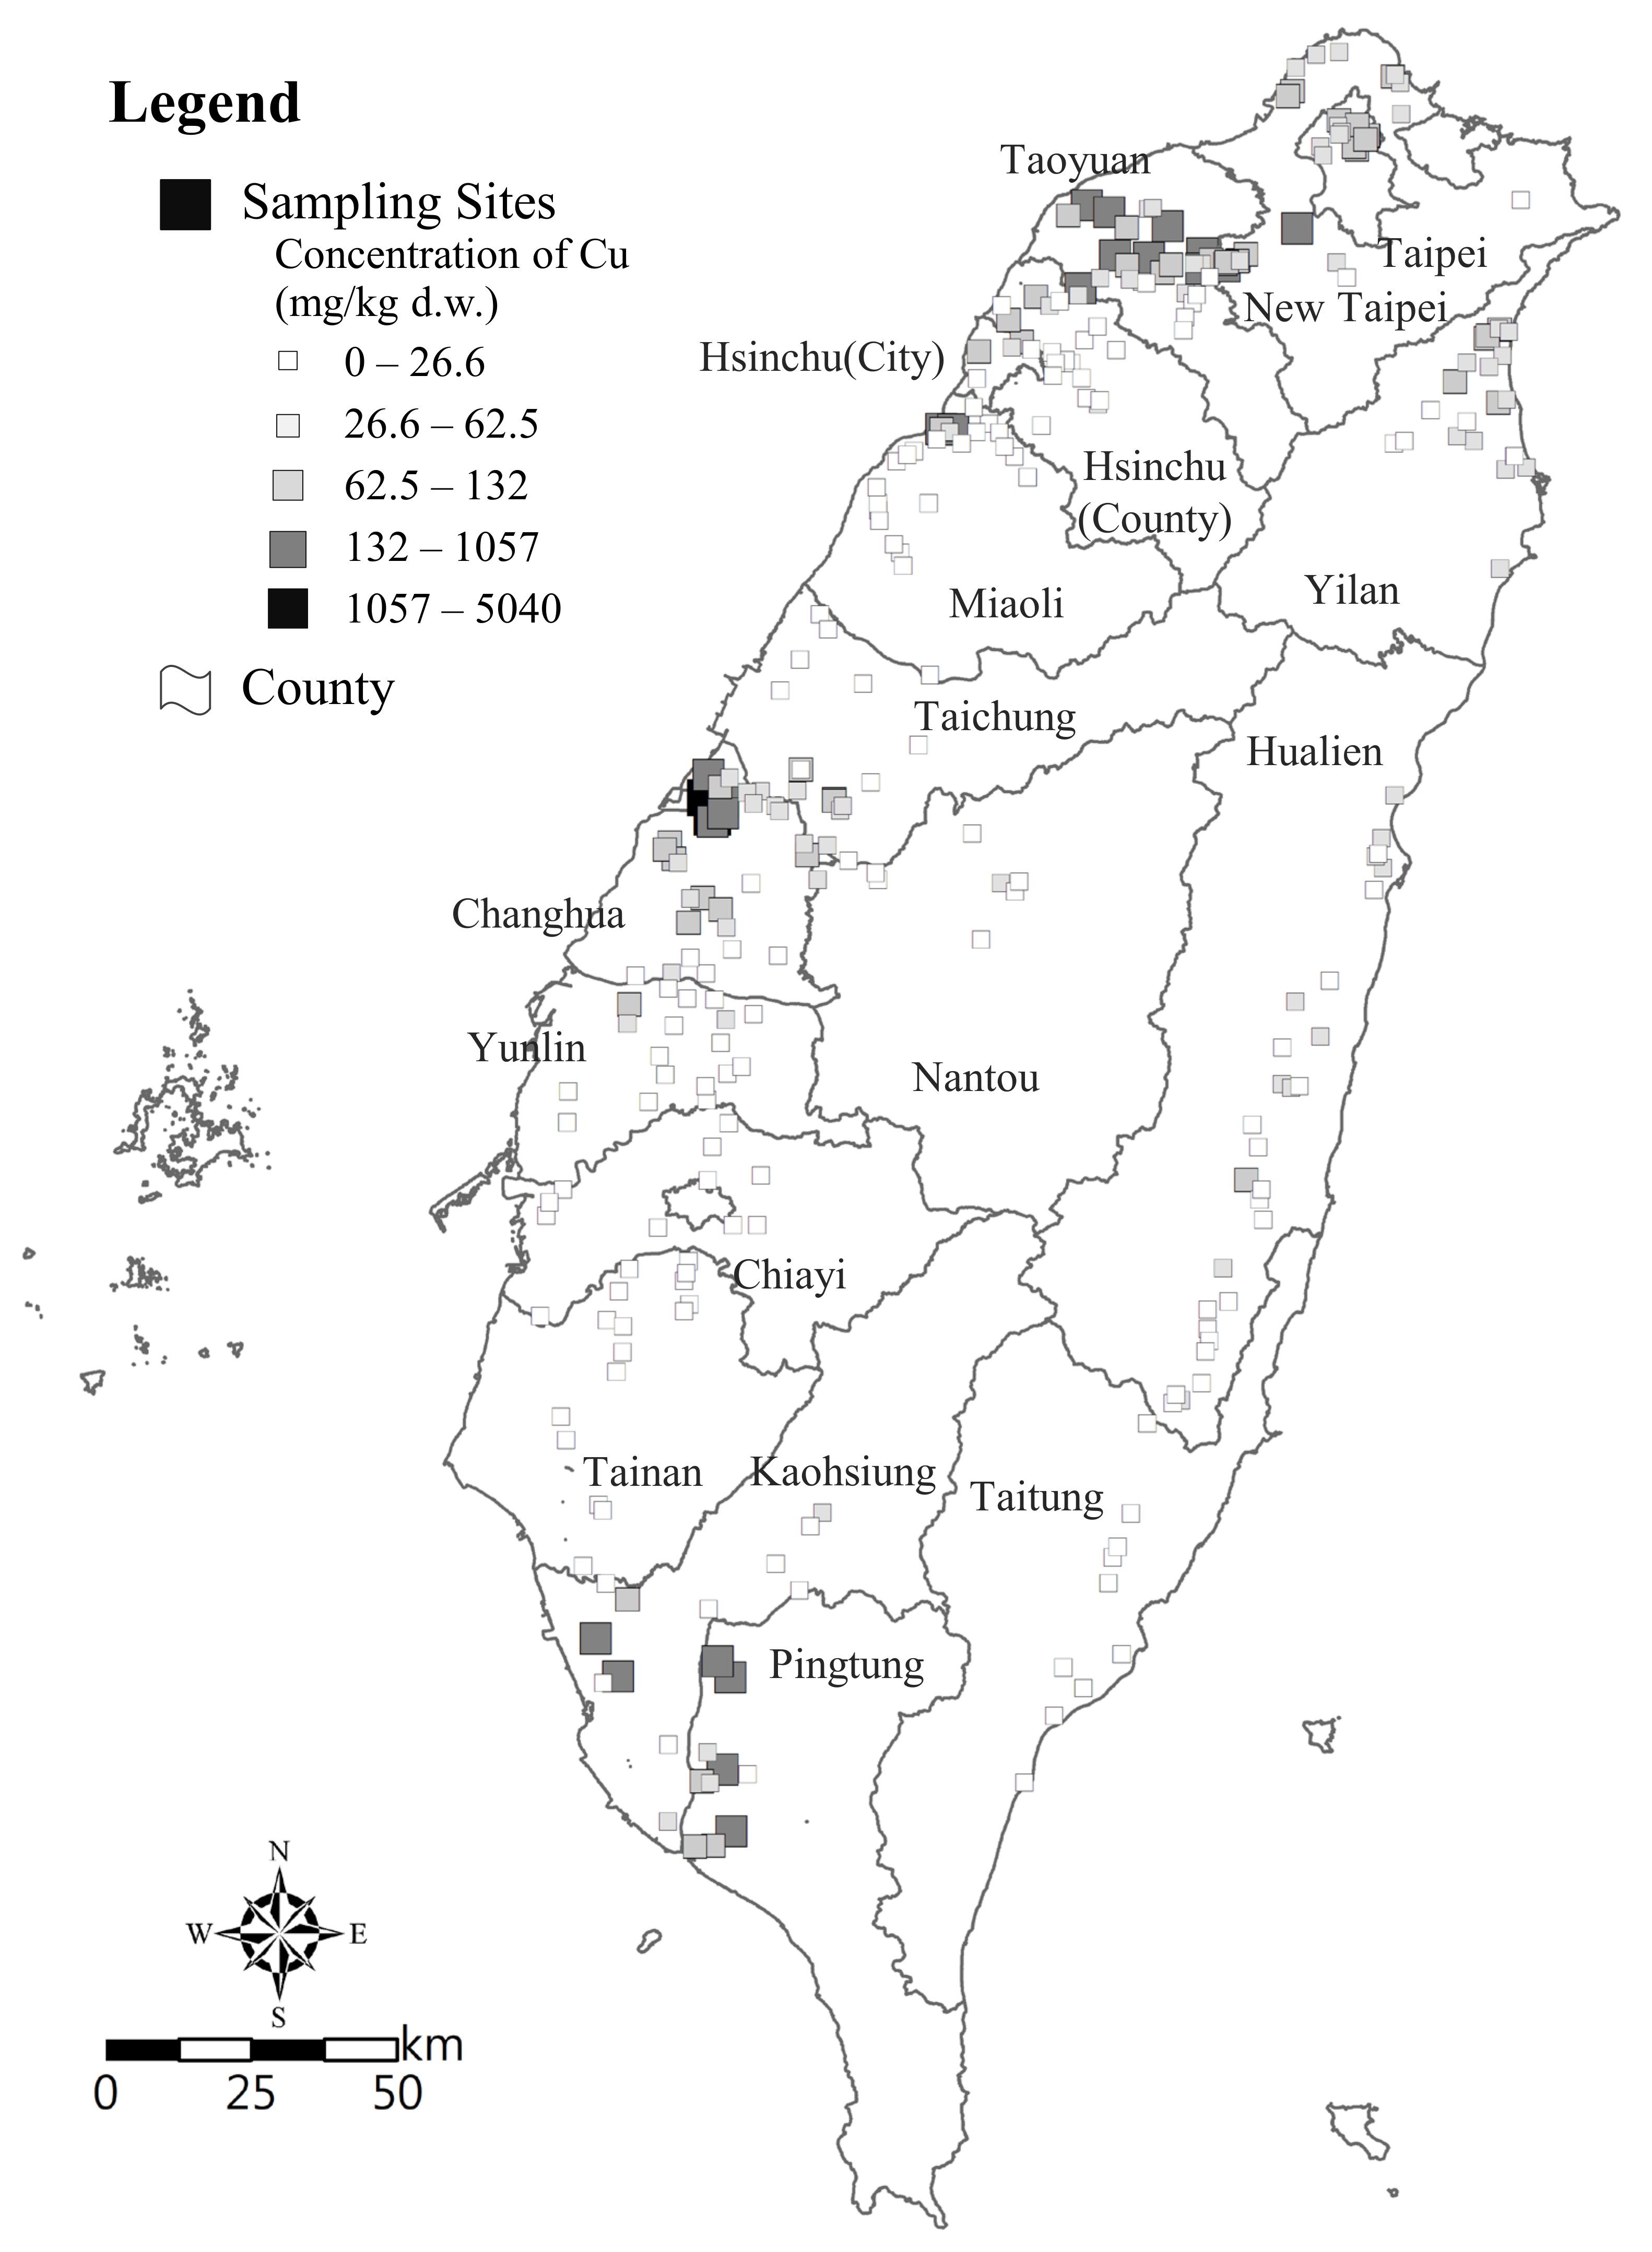
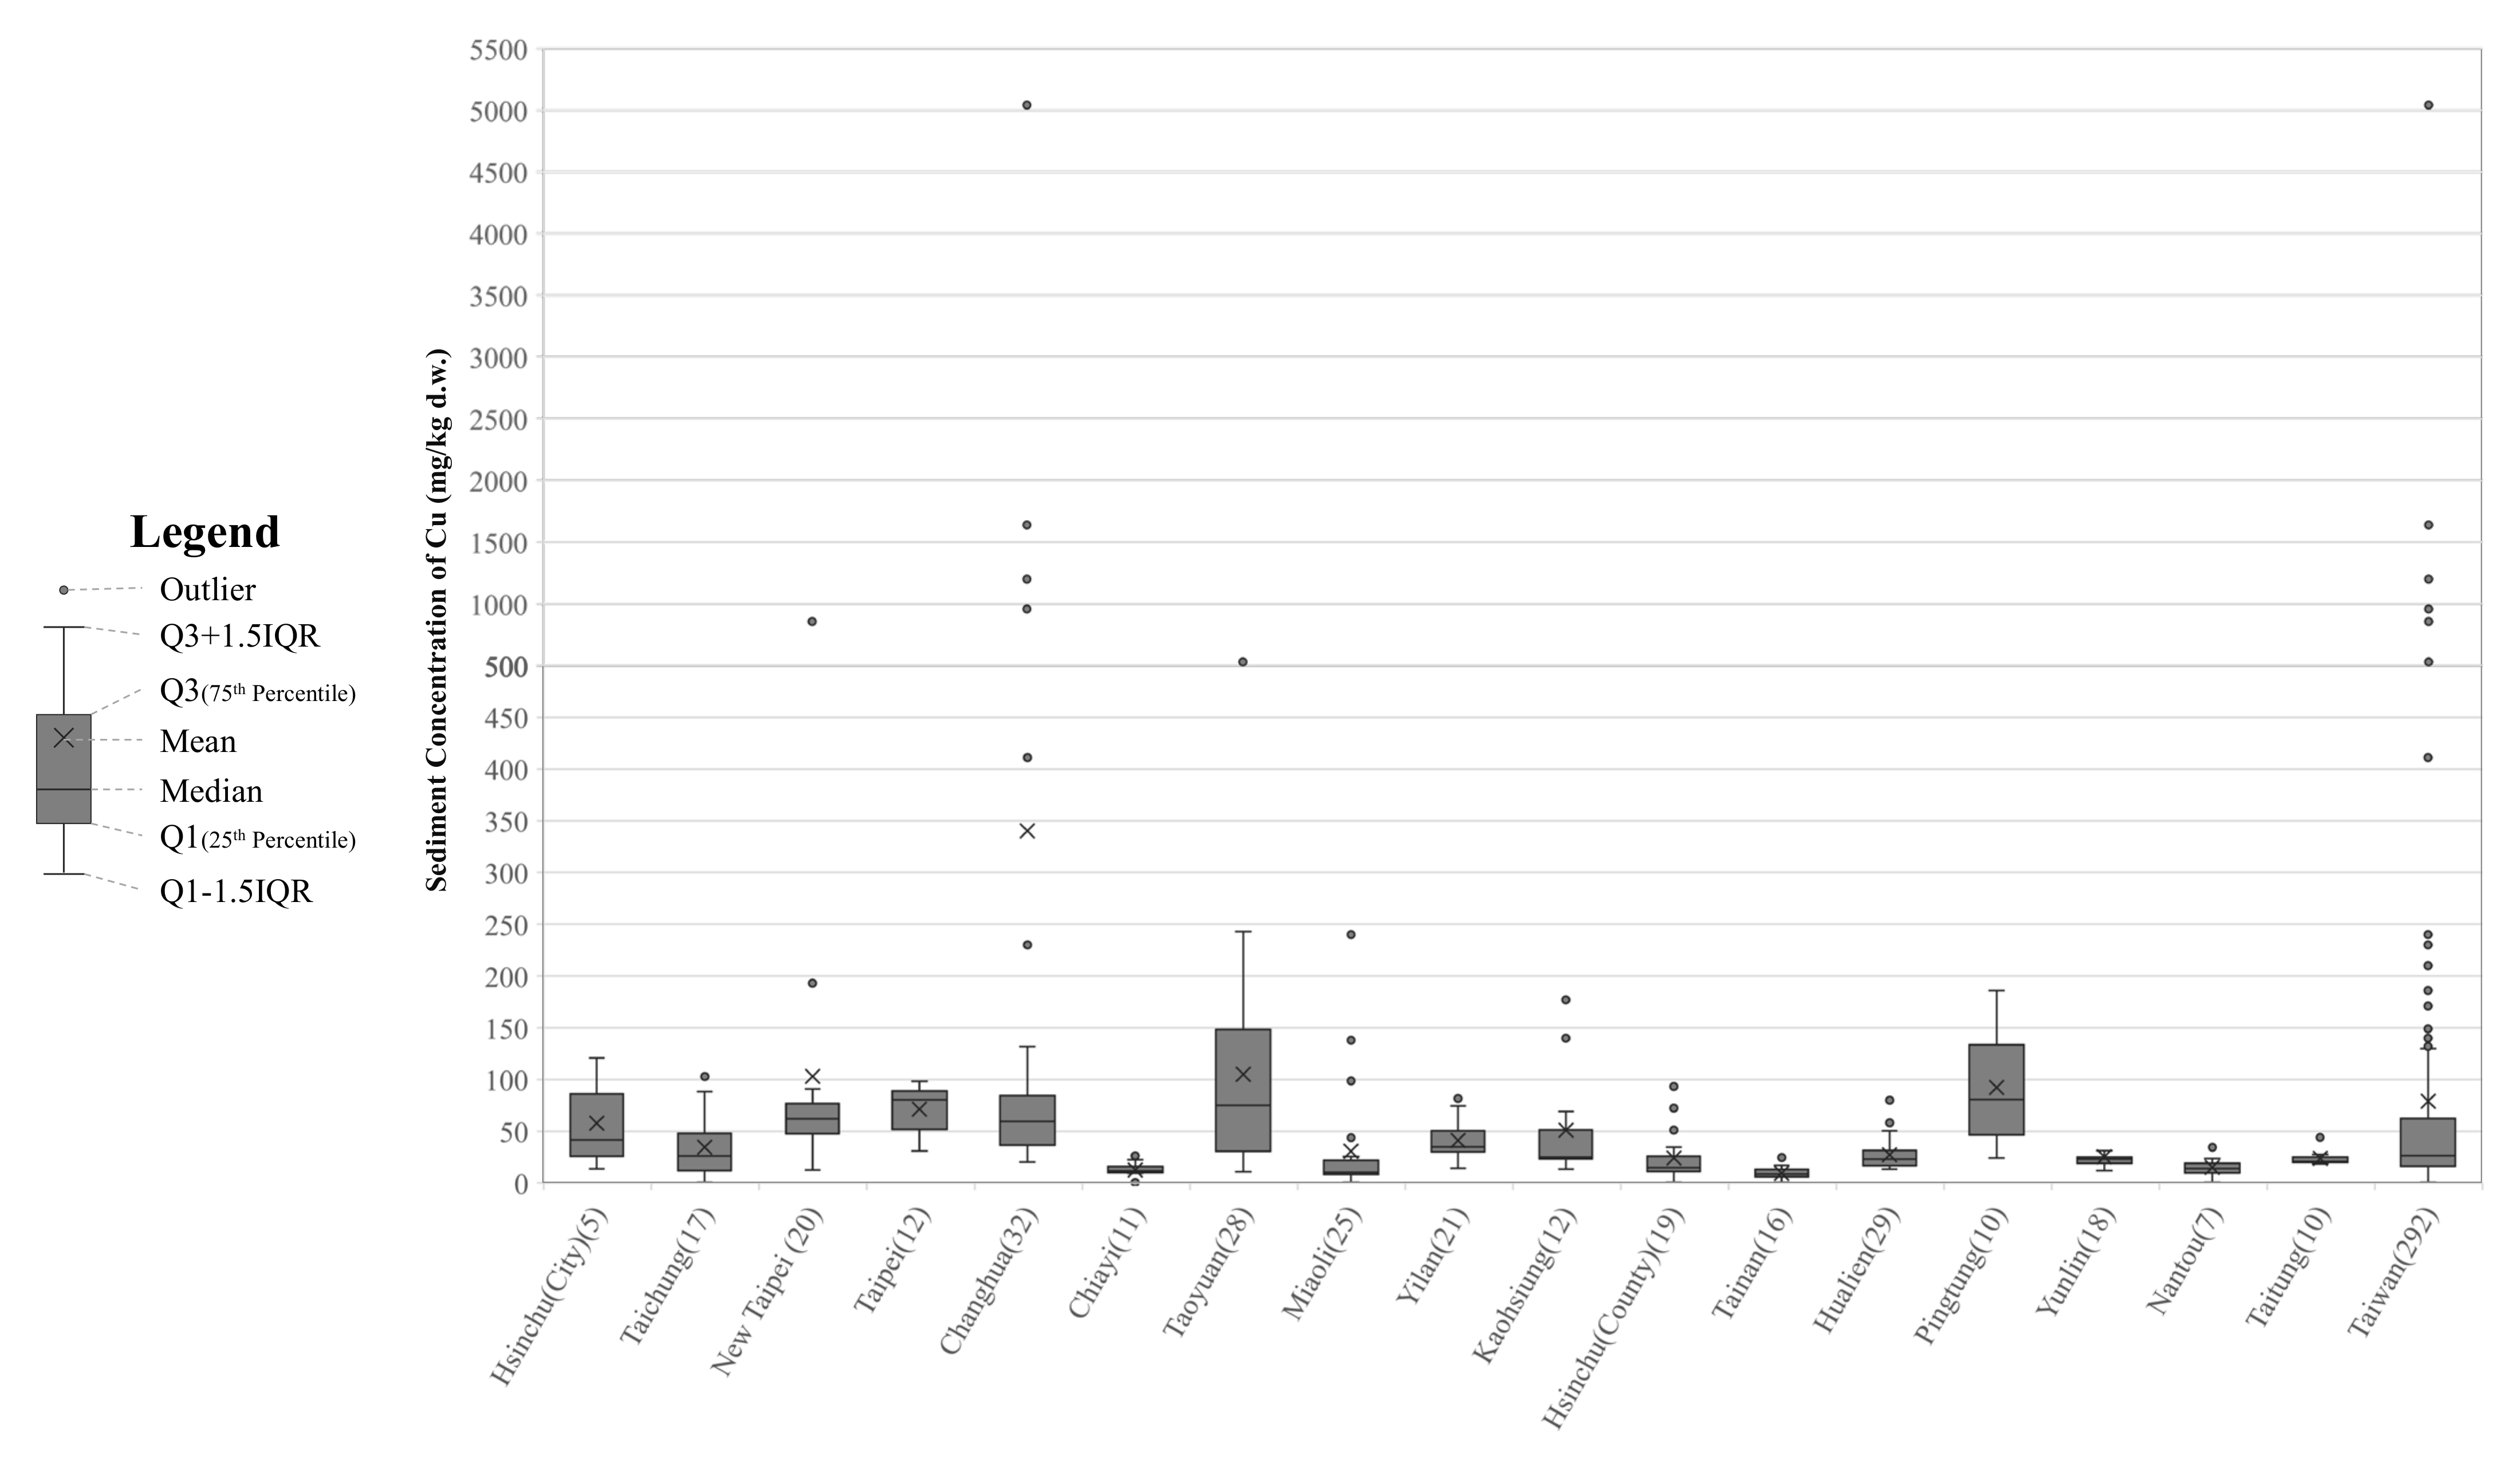
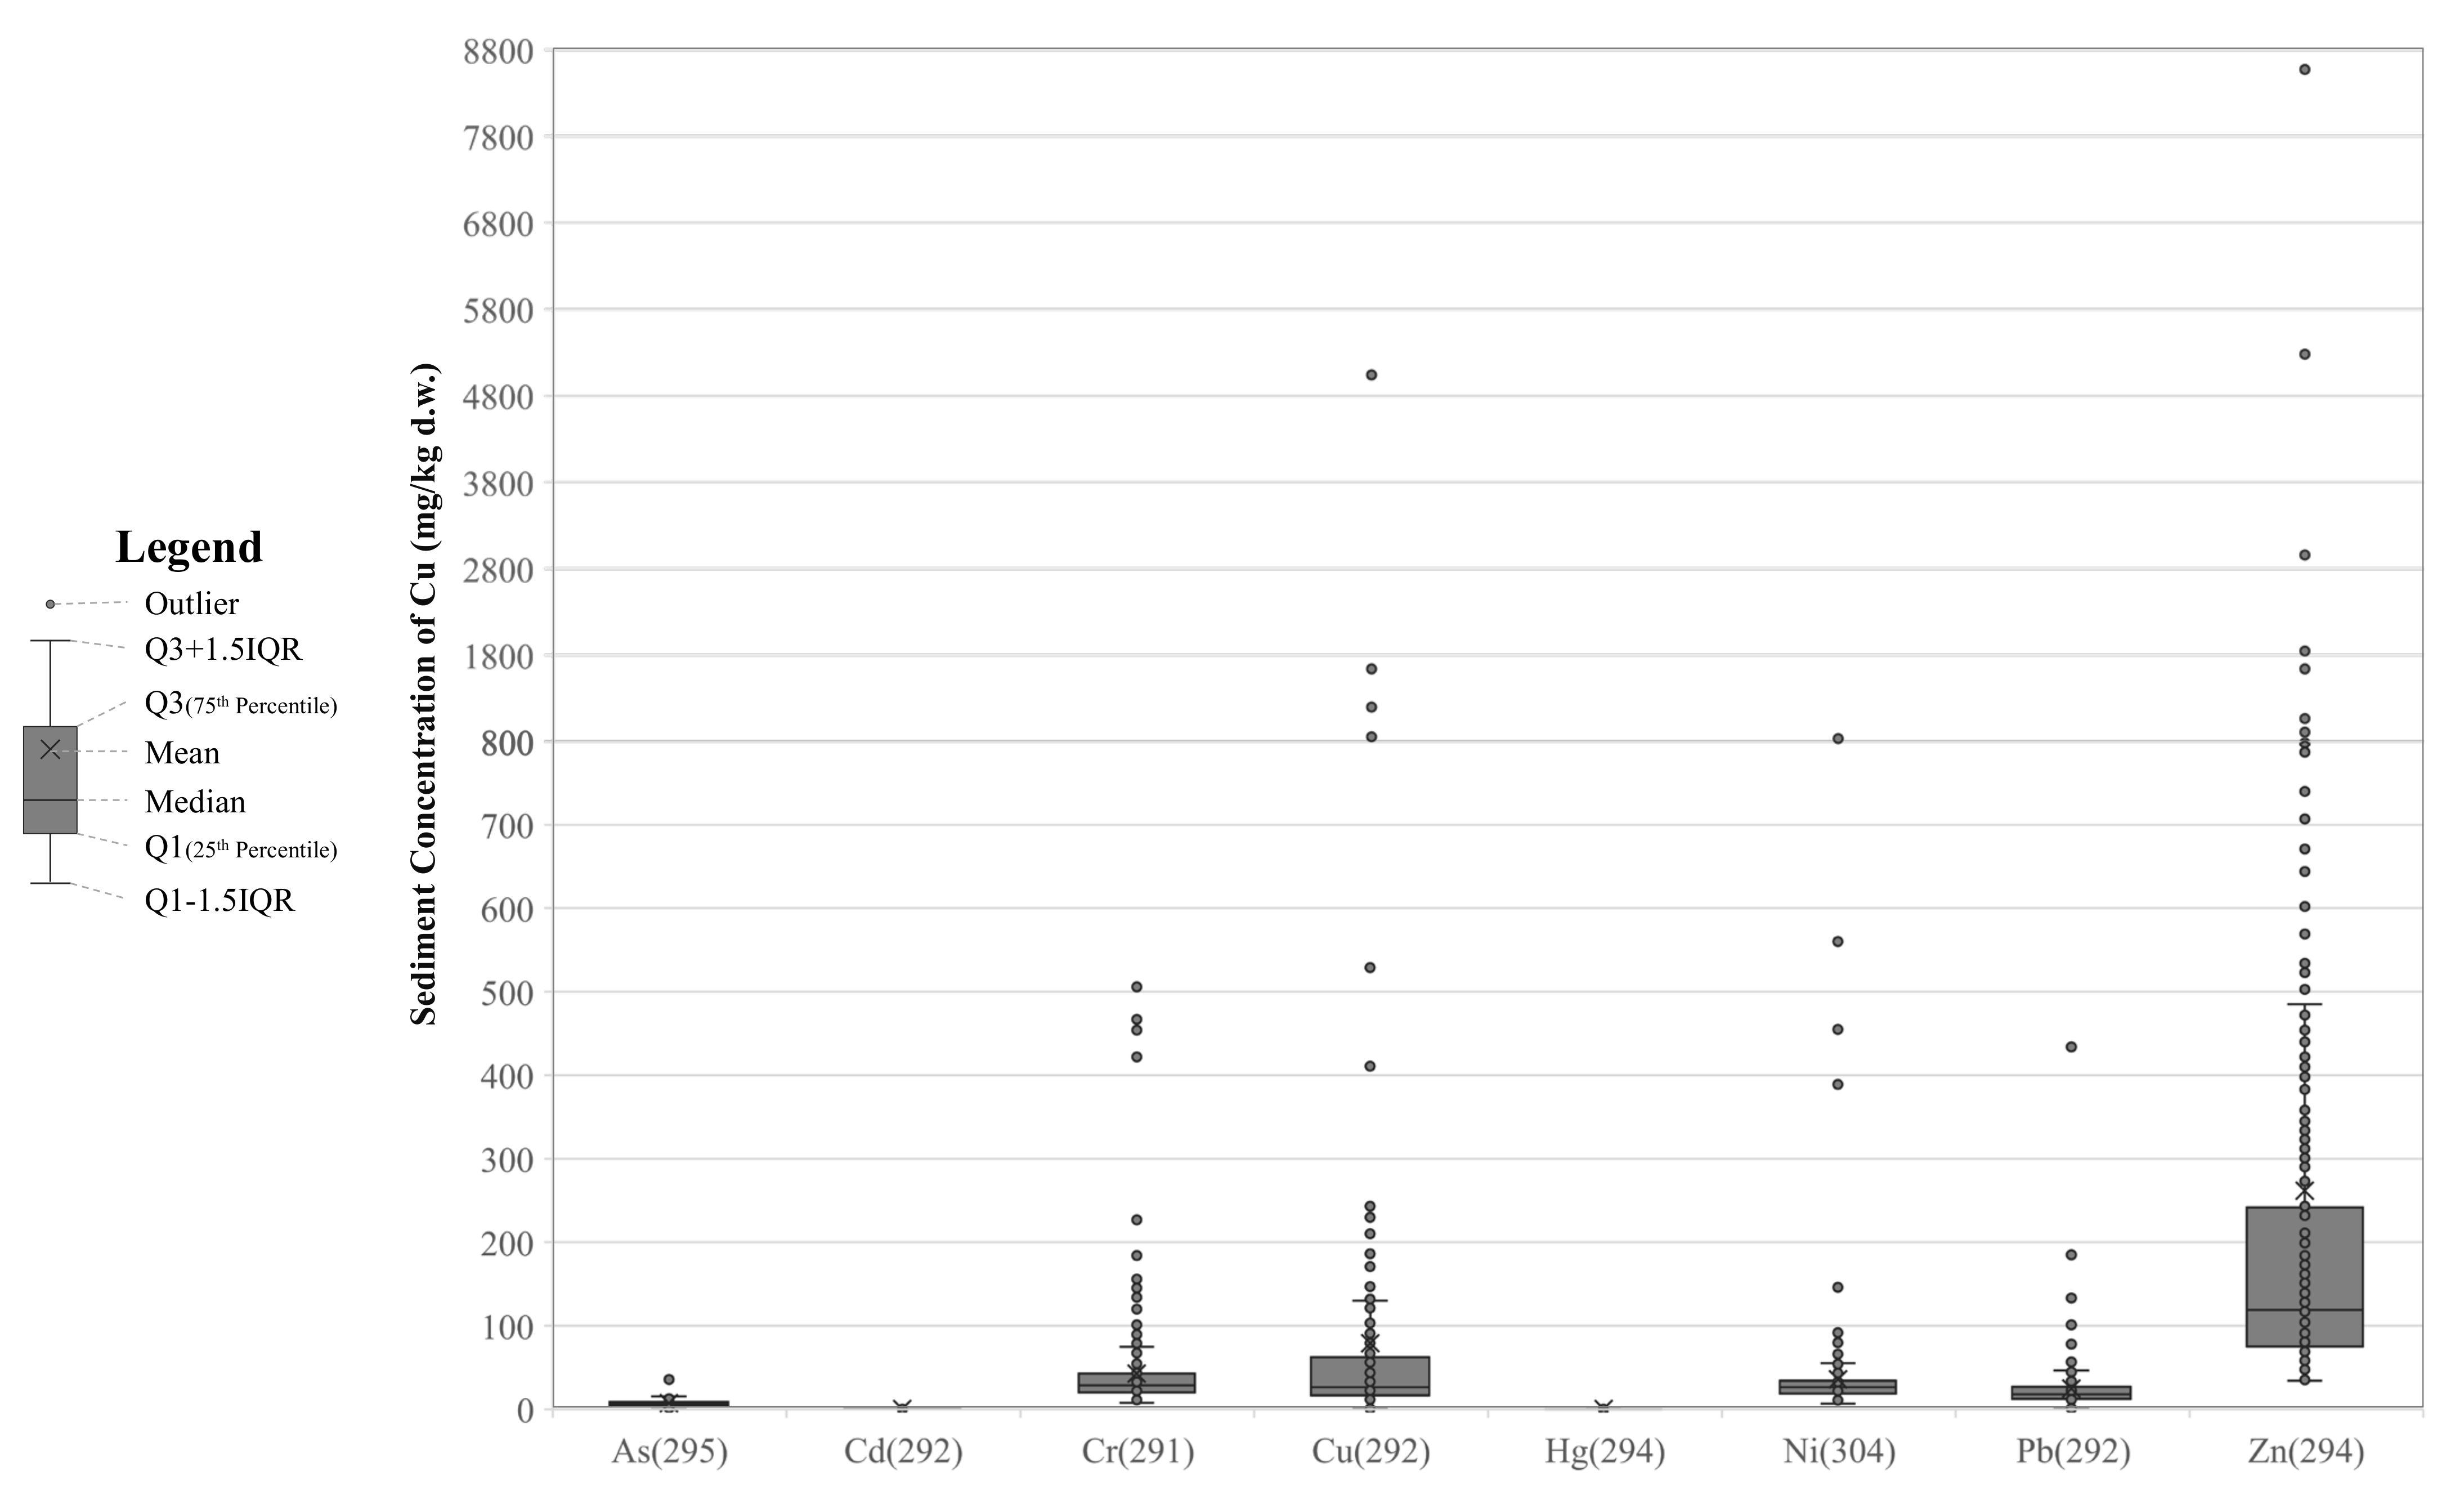
3.1. Cu Distribution in Irrigation Canal Sediments

Sediment quality data for irrigation canals, rivers, and reservoirs between 2014 and 2019 were collected. The numbers of sampling sites in irrigation canals, rivers, and reservoirs are 292, 443, and 276, respectively. The Cu concentration distribution is shown in Figure 1 and Table S1 (Supplementary Materials). The median concentrations of the three water body types were similar, with 26.6, 21.6, and 18.3 mg/kg for irrigation canals, rivers, and reservoirs, respectively. The sediment concentration in the third quartile for irrigation canals was approximately twice that of rivers and reservoirs; the sediment concentrations of the three water bodies were 62.5, 31.7, and 26.7 mg/kg, respectively. Compared with rivers and reservoirs, the Cu cumulative concentration in sediments from irrigation canals was notably higher.
The irrigation canal sampling sites were collected in 15 counties and cities. Given the industrial characteristics of counties and cities, different sediment flow and distribution trends may have been present. Therefore, sediment concentration variation in the 15 counties and cities was explored separately. The distribution of the sampling sites of irrigation canals is presented in Figure 2 and Figure 3 and Table S2 (Supplementary Material). The average number of sampling sites per county or city was 17. Changhua had the most sampling sites (32), followed by Hualien (29), whereas Hsinchu City had the fewest (5). Descriptive statistics of sediment concentration data (Figure 3) indicated that the highest average concentration was observed in Changhua, where it reached 340 mg/kg. The concentrations in Taoyuan (105 mg/kg), New Taipei City (105 mg/kg), and Pingtung (92.2 mg/kg) were higher than the overall average concentration (79.2 mg/kg). The median concentrations of Pingtung (80.6 mg/kg) and Taipei City (80.3 mg/kg) were similar and both high. The median concentration of Taoyuan was 75.0 mg/kg. The median concentrations of Changhua (59.5 mg/kg), New Taipei City (56.9 mg/kg), Hsinchu City (41.7 mg/kg), and Yilan (34.8 mg/kg) were higher than the overall median concentration (26.6 mg/kg). In general, compared with the overall irrigation canal sediment concentration distribution pattern in Taiwan (Figure 3), the sediment concentration distribution patterns of Pingtung, Taoyuan, New Taipei City, Hsinchu City, Changhua, and Taipei City were high.

3.2. Pollution Characteristics Analysis

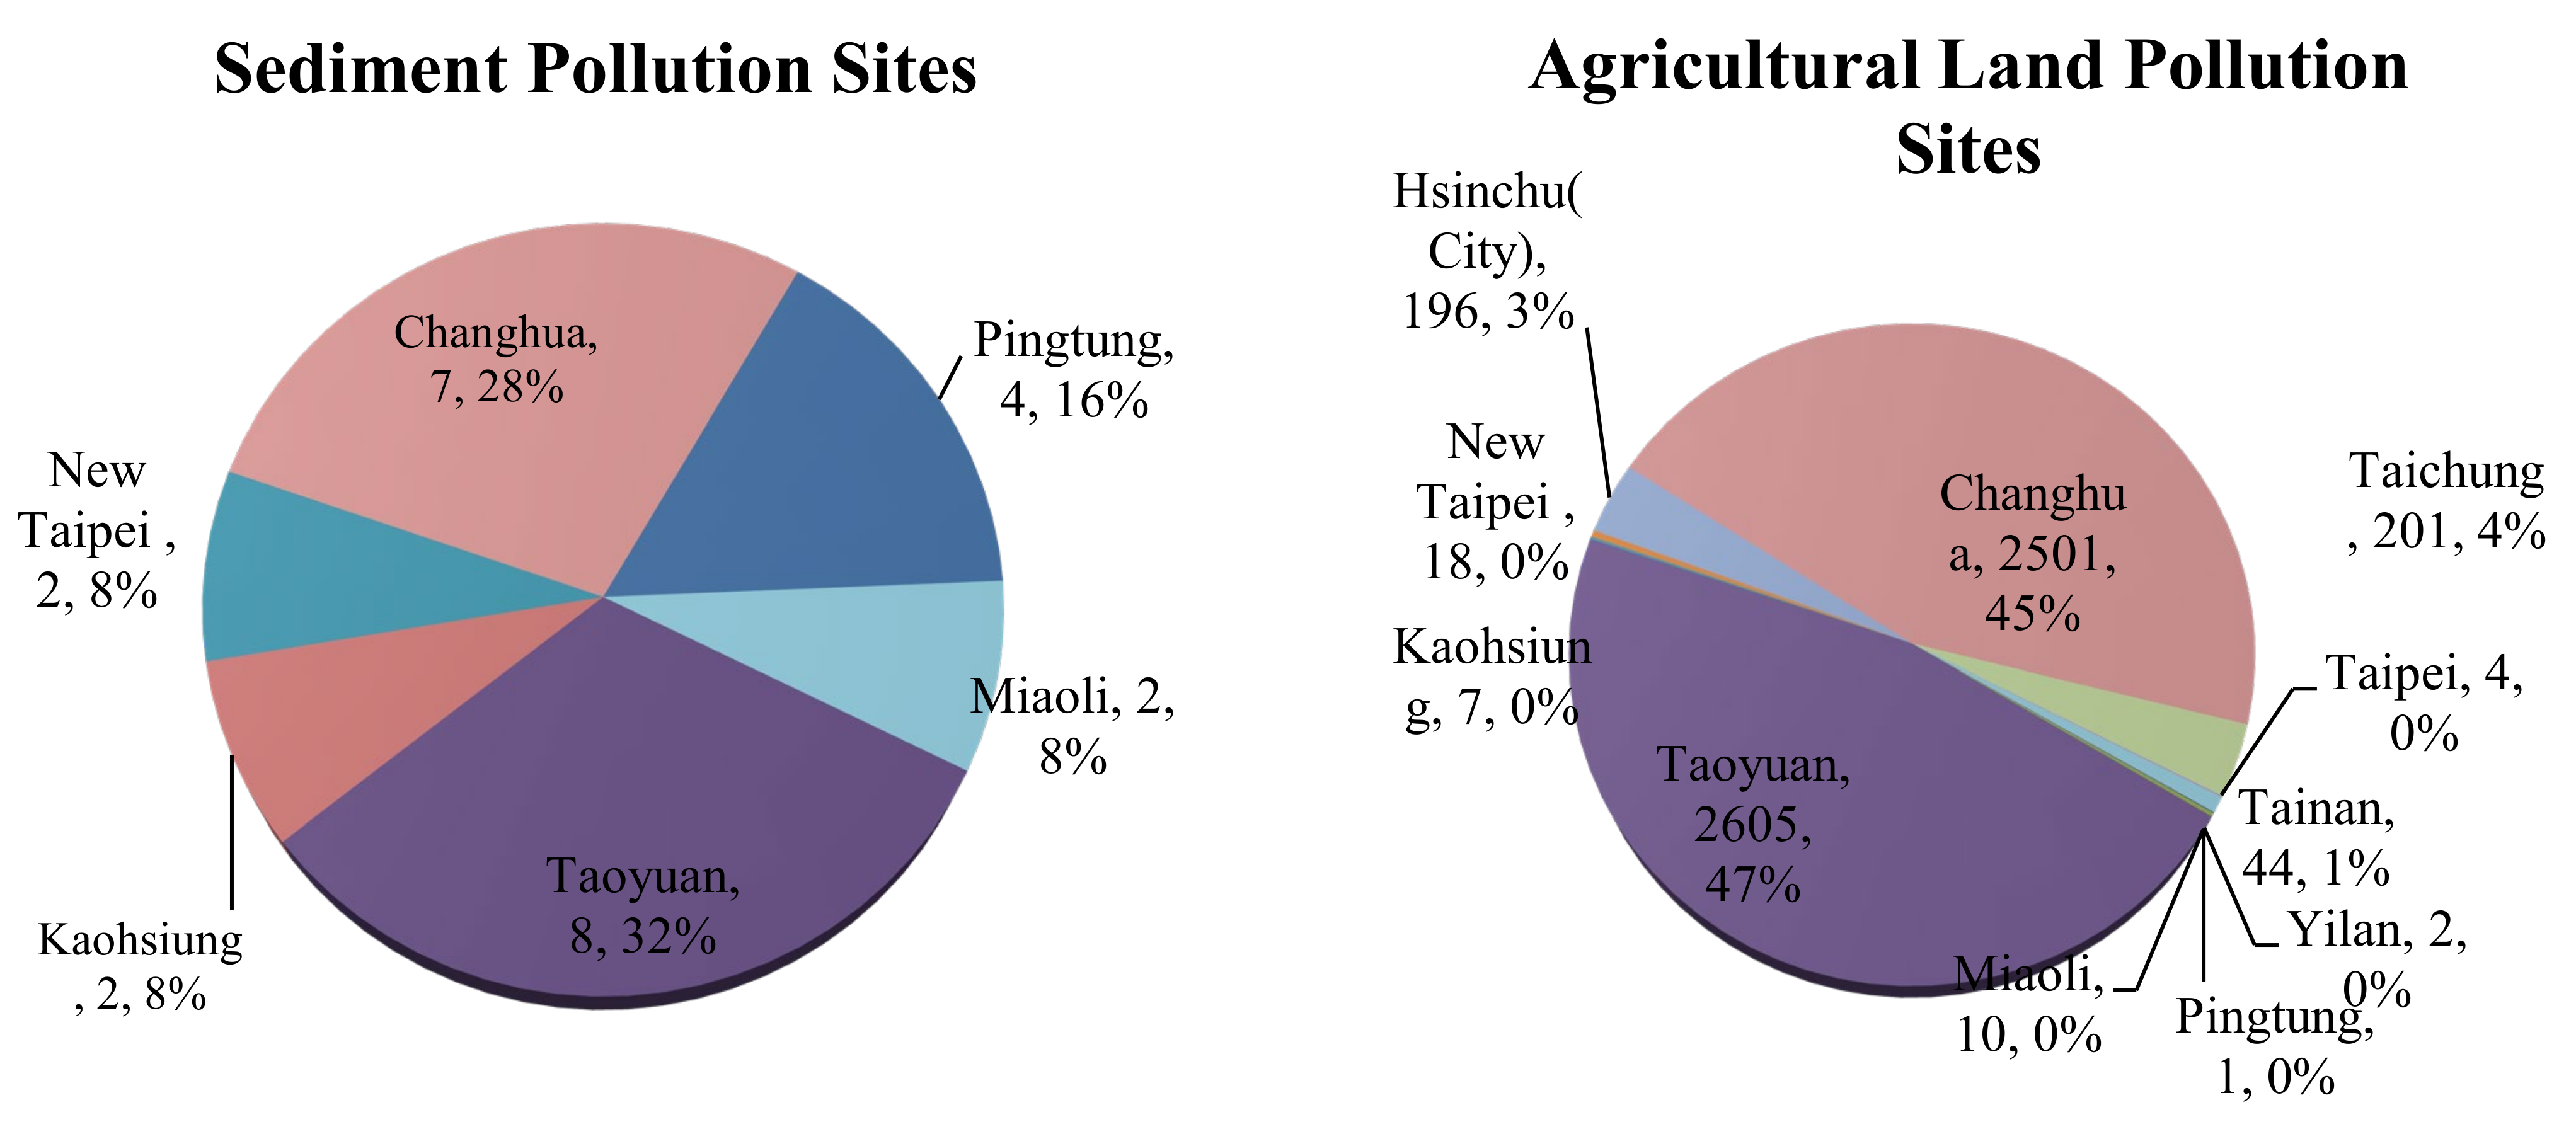
3.2.1. Irrigation Canal Sediment Pollution and Agricultural Land Pollution Site Patterns

Taiwan’s sediment management policy uses the upper limit value of sediment quality guidelines as the value to commence risk assessment. Table 1 shows the lower and upper limit values of sediment quality guidelines for heavy metals. Based on logistic regression model, the ecological effects of an individual species can be considered to be “rarely observed” (≤25% possibility) if a metal concentration falls below the lower limit; those at upper-limit concentrations are likely to have more apparent ecological effects making their effects more “frequently observed” (≥50%). Regarding the use of risk assessment results as the basis for determining treatment necessity, no control standard to determine pollution level has been stipulated. Therefore, the outlier value exceeding the upper extreme of the box-and-whisker plot was used to determine the pollution of sediments. Moreover, because sediments could resuspend and flow into agricultural land with irrigation water or accumulate by suspended solids in effluent [27], the pollution potential of sediments may be consistent with the characteristics of downstream polluted agricultural land [21]. However, because the sampling time of sediments and soil of polluted agricultural land differed, heavy metal pollutants in sediments across counties and cities and those in control sites of polluted agricultural land soil (hereinafter referred to as the polluted agricultural land site) were compared. Survey results up to the time the current study was reported were used to assess possible pollution intervention patterns.
According to the study hypothesis of pollution determination, the upper extreme of the overall irrigation canal sediment concentration in Taiwan (132 mg/kg) was used as the reference. A total of 25 sites exhibited Cu concentrations higher than the upper extreme in sediments. The distribution of the 25 sediment pollution sites and the sediment pollutants and concentrations are shown in Figure 4. The number of pollution sites was highest in Taoyuan (eight sites), followed by Changhua (seven sites) and Pingtung (four sites). Miaoli, Kaohsiung, and New Taipei City each had two pollution sites. In addition, the overall outliers for As, Cd, Cr, Cu, Hg, Ni, Pb, and Zn in irrigation canals was calculated to understand the pollutants (as detailed in Figure 5 and Table S3 (Supplementary Materials)). Among the 25 sediment pollution sites, most pollution patterns containing Cu concurrently contained Cr, Cu, Ni, Pb, and Zn (eight sites, approximately 32%), followed by the pattern concurrently presenting Cr, Cu, Pb, and Zn (five sites, 20%), and the patterns of Cu + Pb, Cu + Pb + Zn, and Cu + Zn (each with two sites, 8%). Most other patterns also presented these five heavy metals (Cr, Cu, Ni, Pb, and Zn).
Agricultural land pollution site characteristics for each county and city are summarized in Table 2. The agricultural land pollution sites were located mainly in Taoyuan (47%) and Changhua (45%). In the heavy metal pollutant patterns, most sites contained Cu pollution, totaling 3341 sites (59.8%), followed by pollution sites containing Cr, Cu, Ni, and Zn (10.8%) and the pattern of Cu and Zn (7.9%). The aforementioned three patterns accounted for nearly 80% of the agricultural land pollution sites. In addition to Cr, Cu, Ni, and Zn, pollutants including Cd, Pb, As, and Hg were identified in low proportions.
Again, sediment pollution sites and agricultural land pollution sites were mainly distributed in Taoyuan and Changhua (Figure 6). The agricultural land pollution sites in Taoyuan generally contained Cu, with these totaling 2400 sites and accounting for 92% of the total number of agricultural land pollution sites in Taoyuan. The sediment pollution sites did not present notable patterns. Cr, Cu, Ni, Pb, and Zn were all possible pollutants. The agricultural land pollution sites were mainly distributed in areas near TY4 in northeastern Taoyuan (as detailed in Section 3.2.2). Overall, 71% (5/7) and 26% (648/2501) of sediment and agricultural land pollution sites in Changhua, respectively, exhibited pollution patterns containing Cr, Cu, Ni, and Zn. In addition, the locations of the patterns were distributed closely (as detailed in Section 3.2.3).

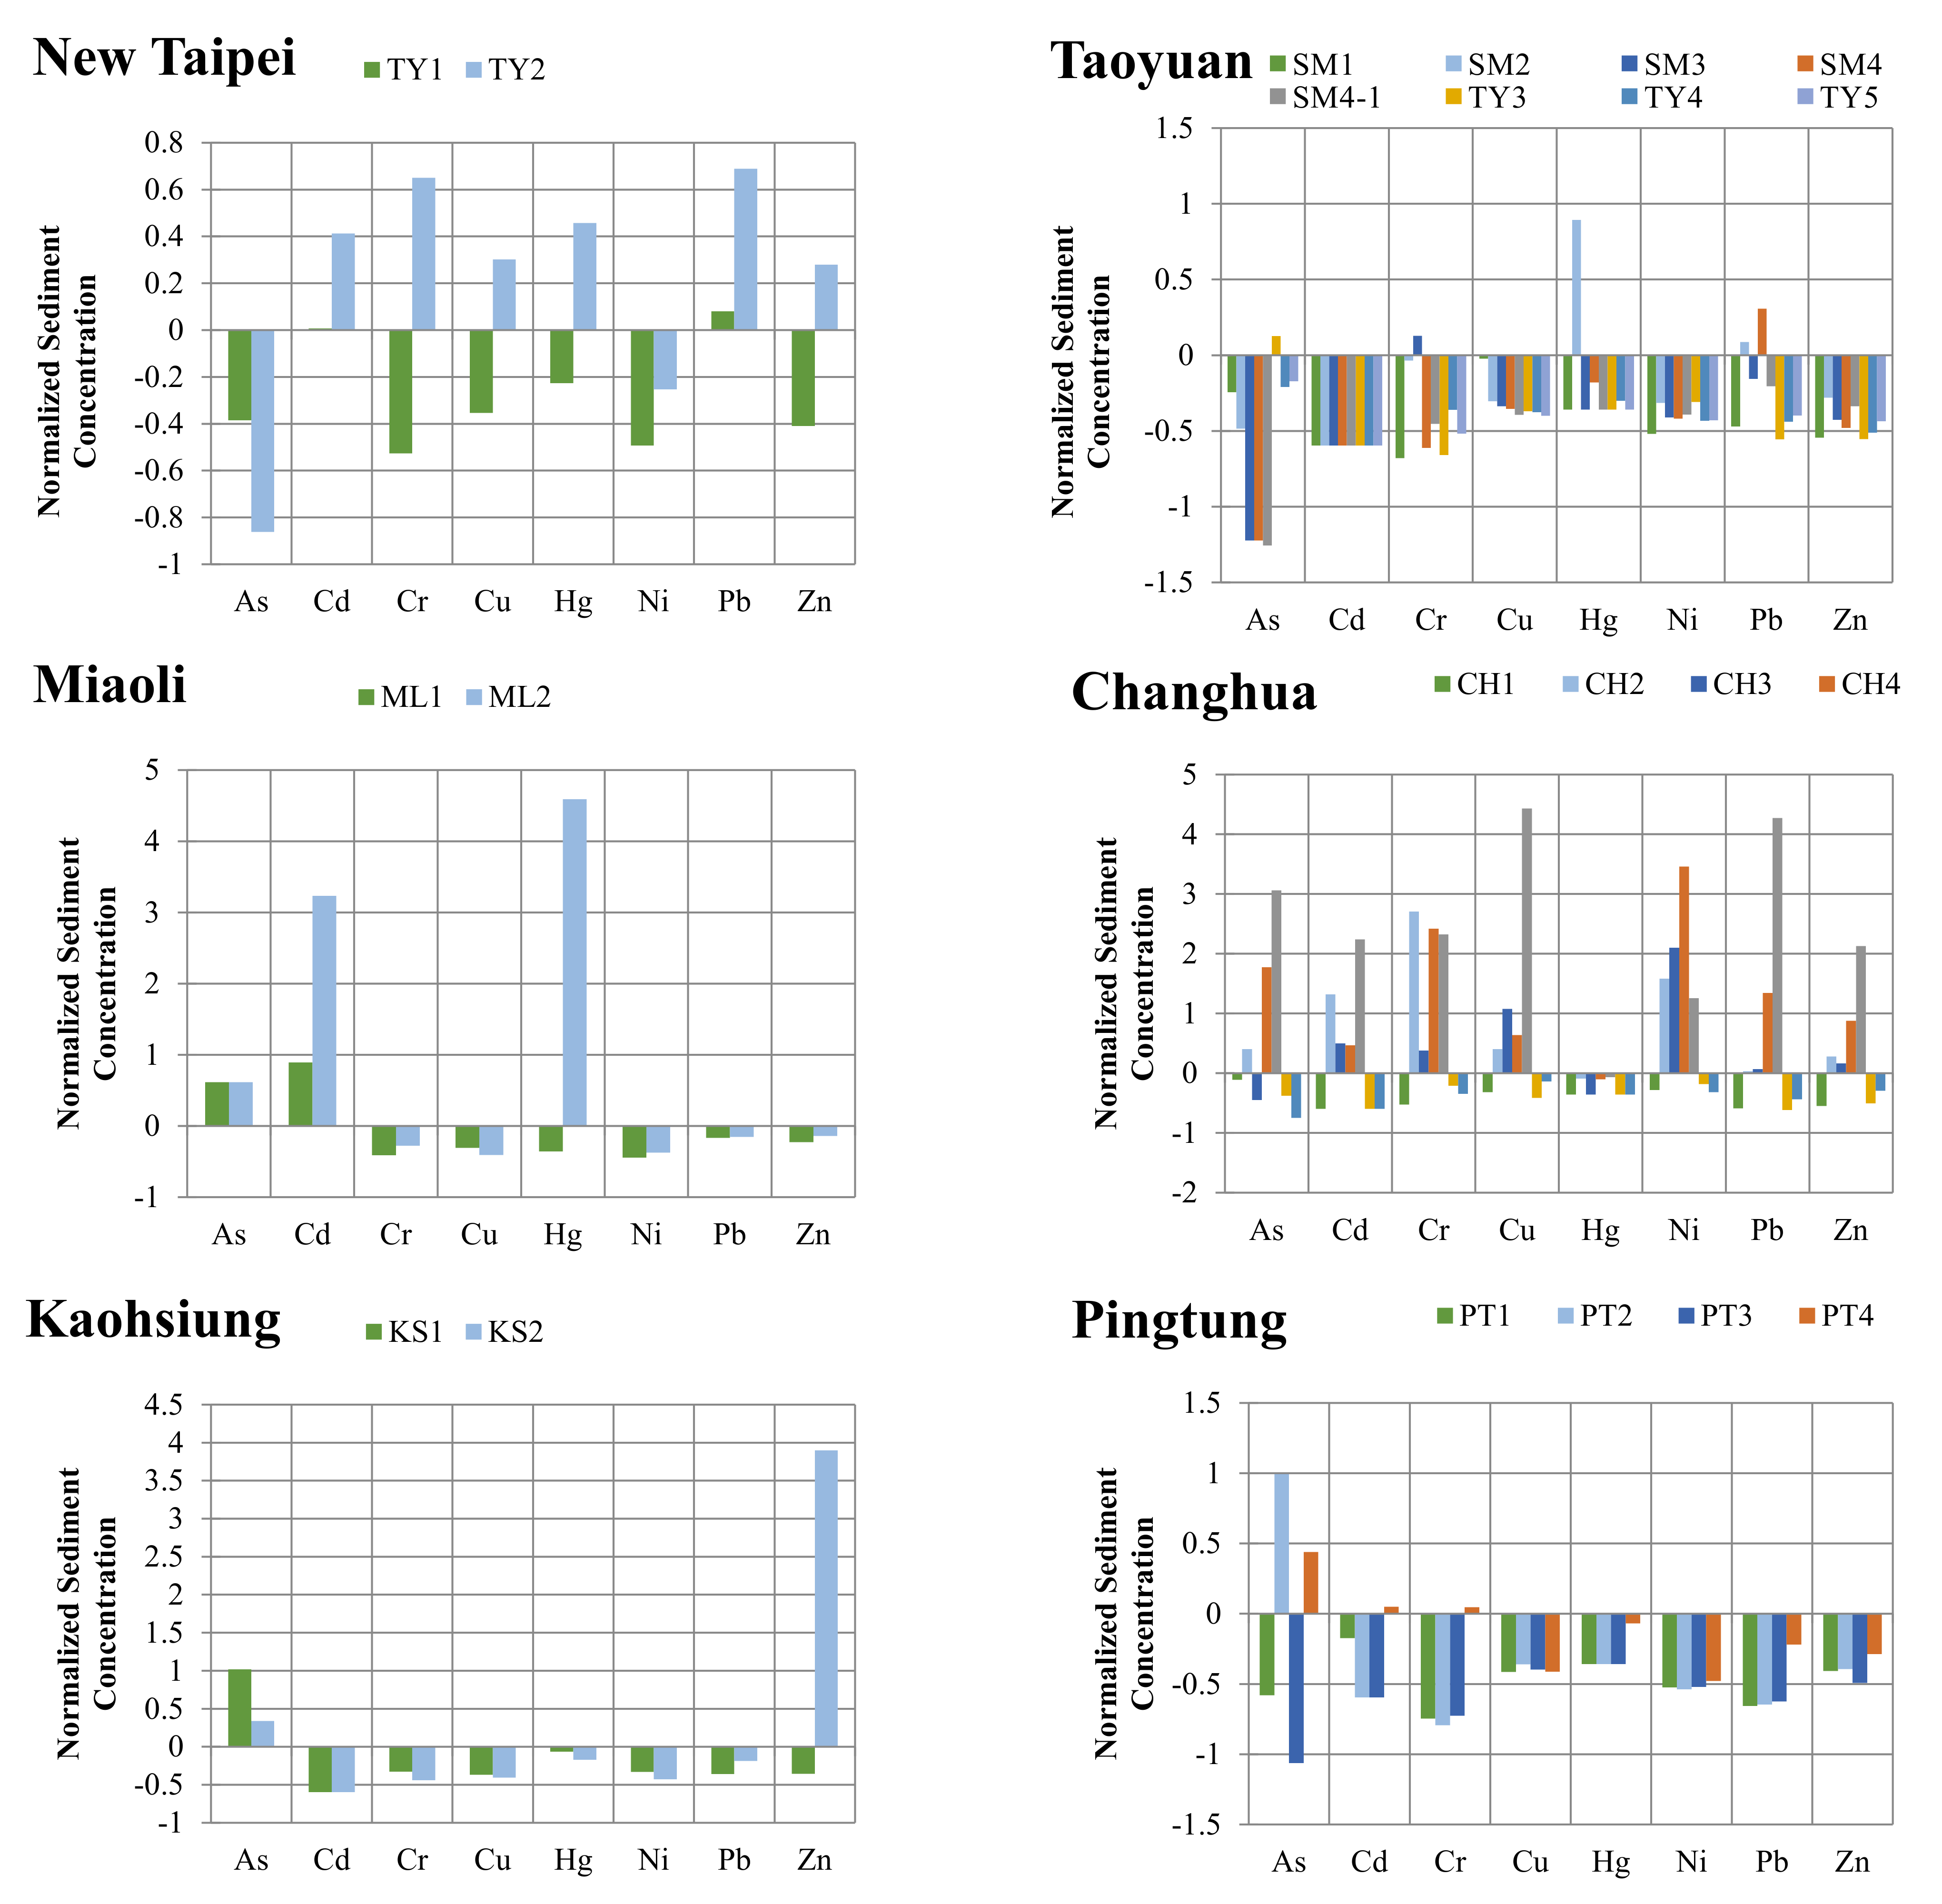
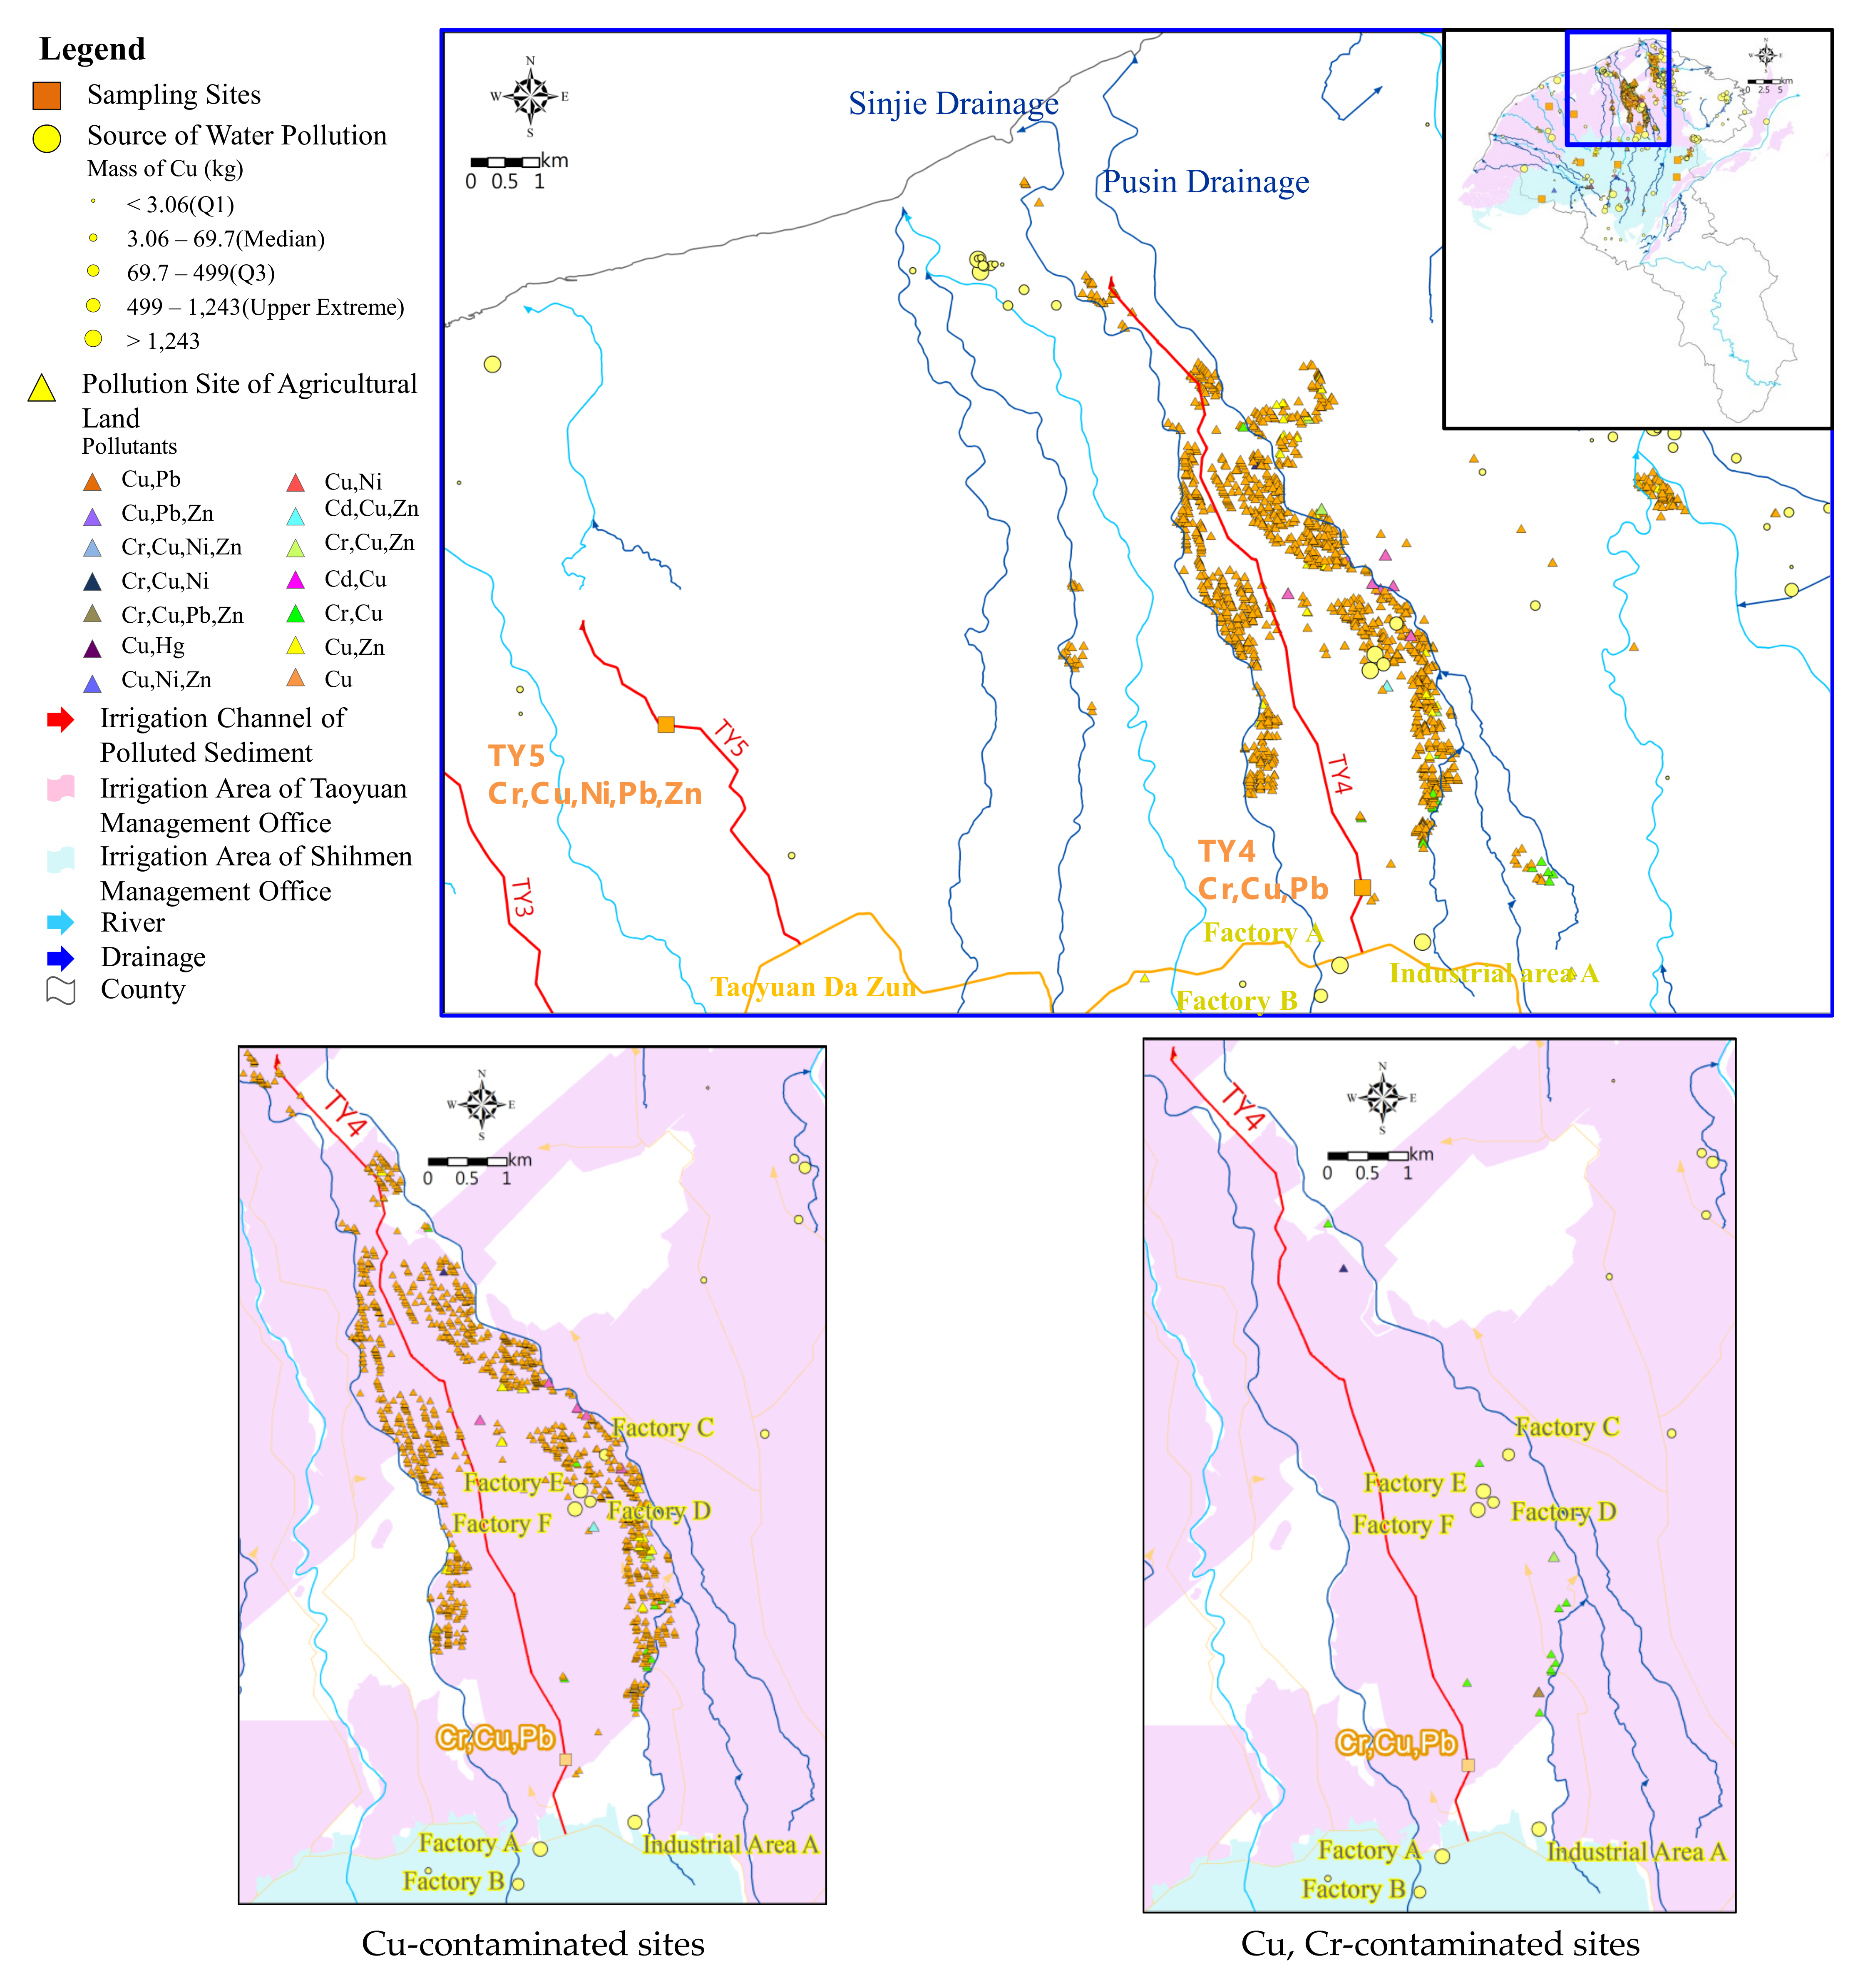
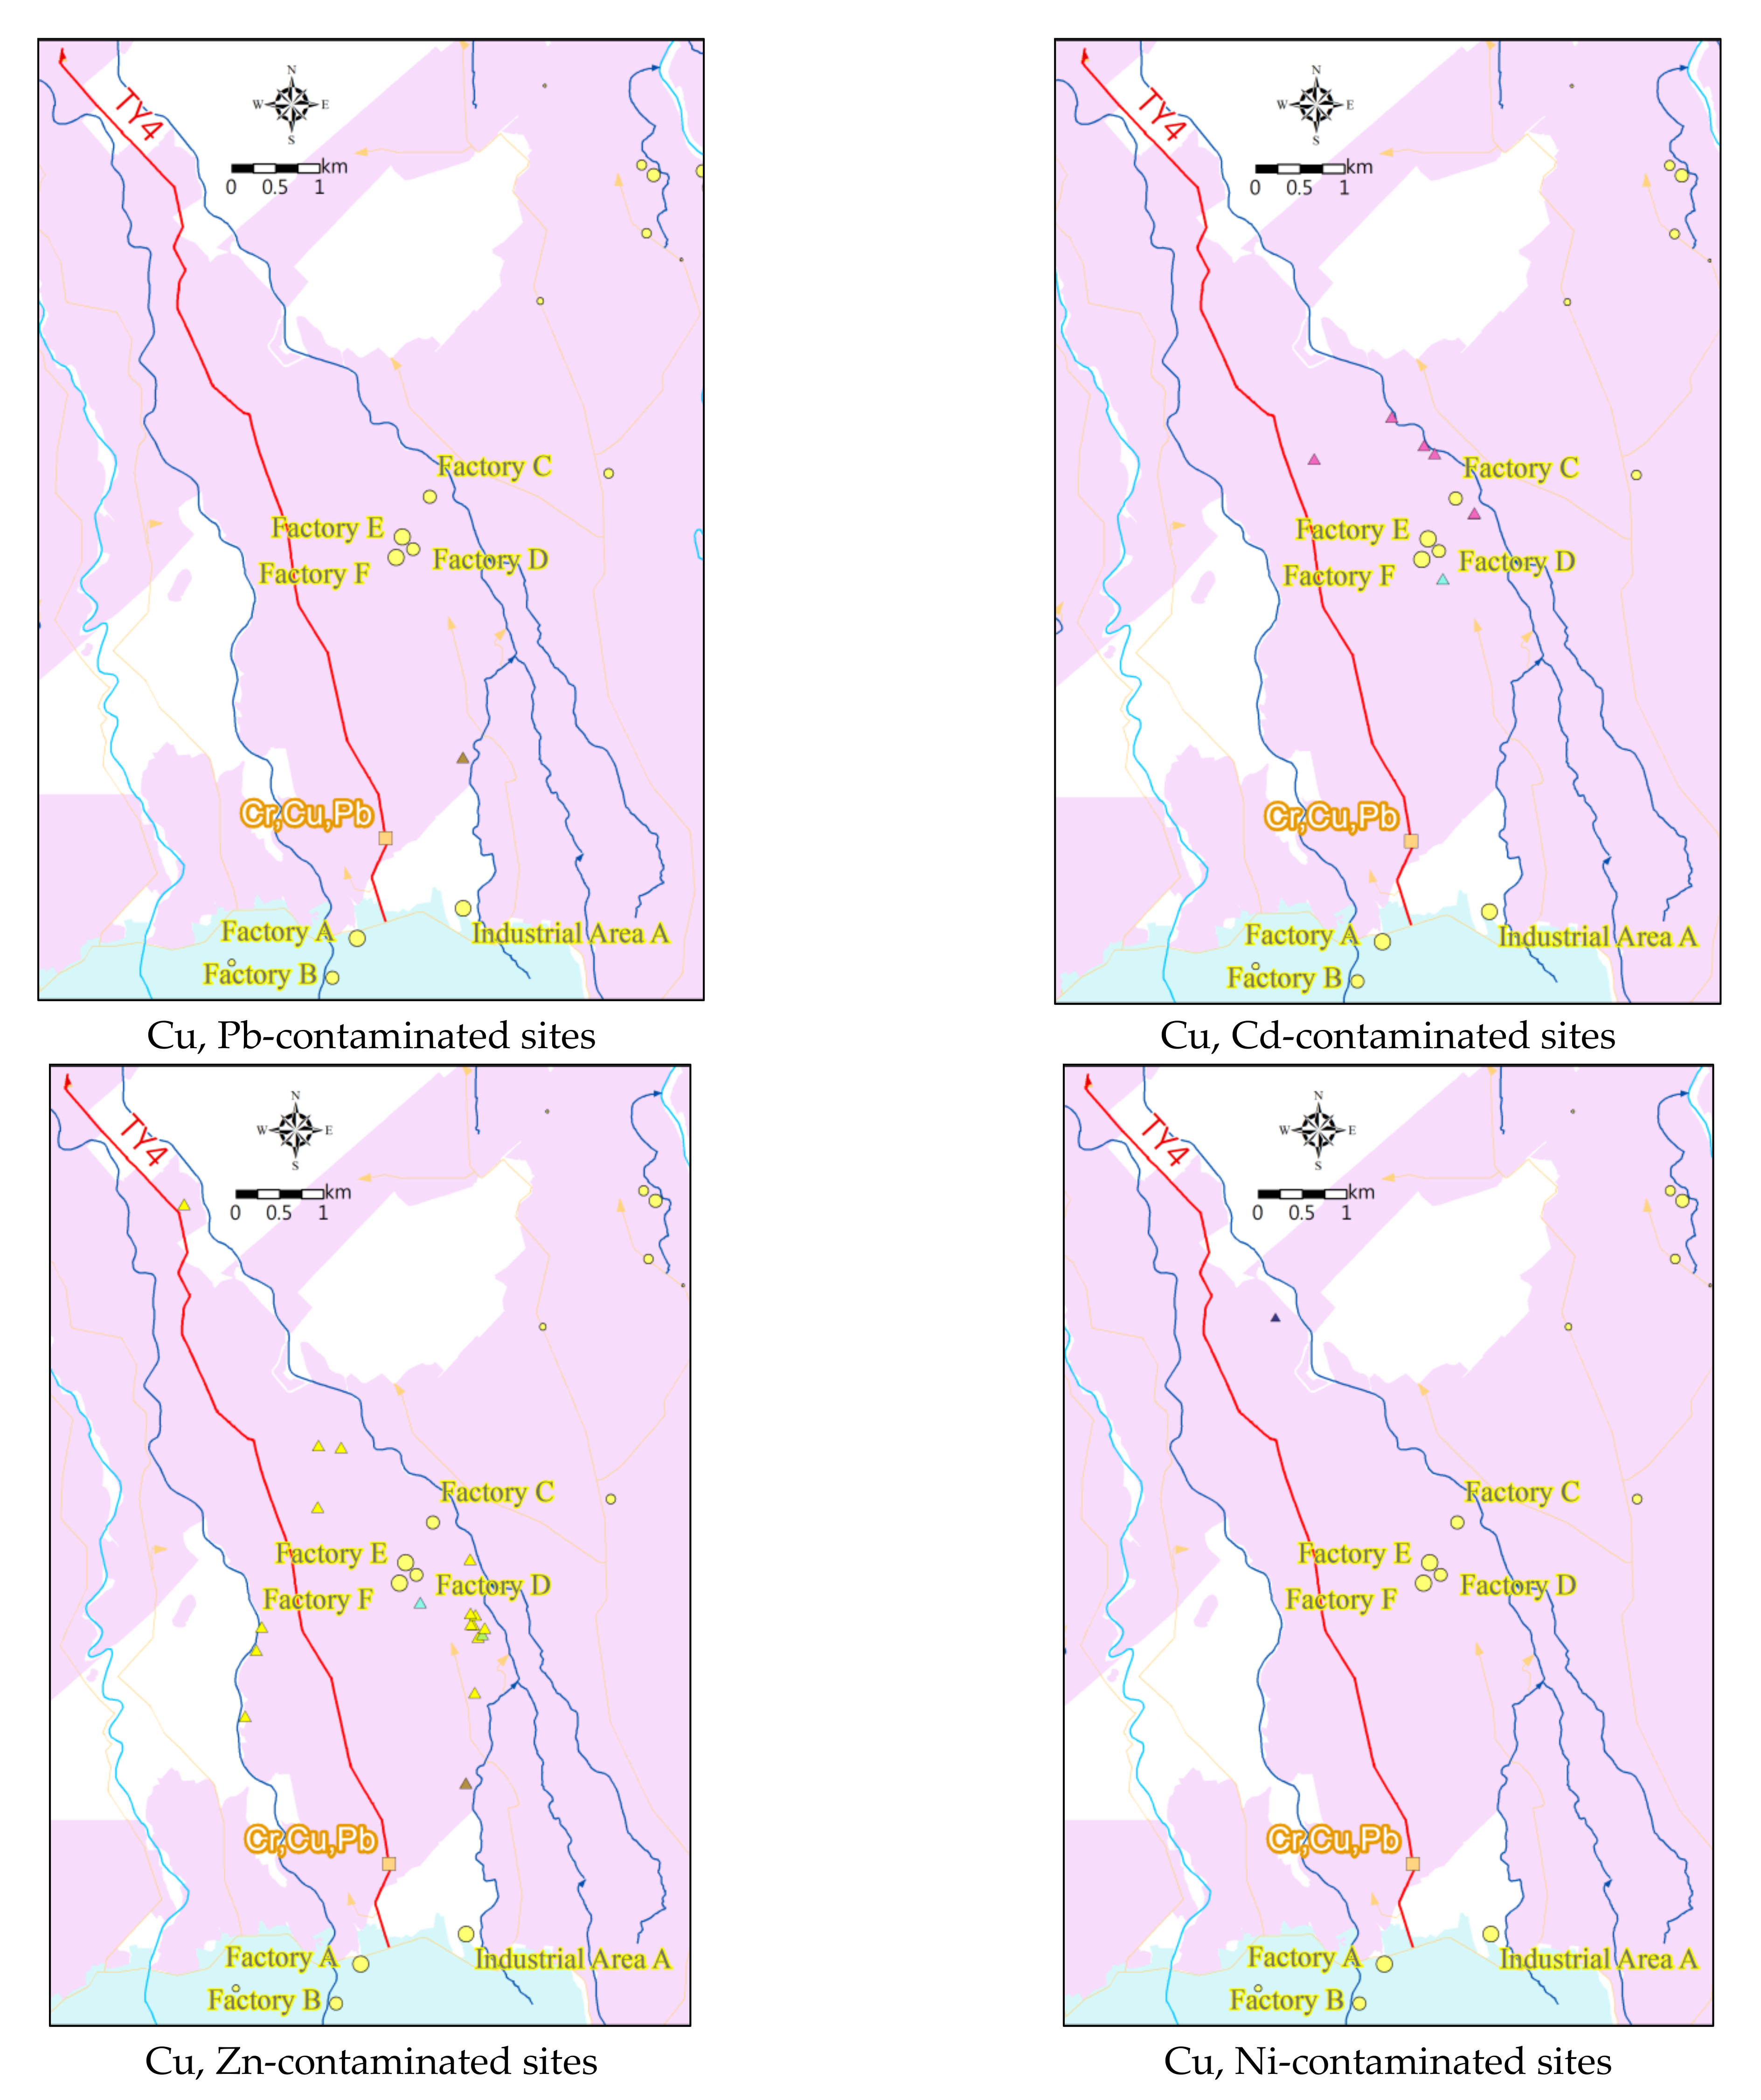
3.2.2. Analysis of Sediment Pollution and Possible Pollution Sources in Taoyuan

Sediment pollution sites, irrigation canals, agricultural land pollution sites, possible pollution sources, and surface waters in Taoyuan are plotted in Figure 7. The areas with both sediment and agricultural land pollution sites were distributed between the trunk lines of Sinjie Drainage and Pusin Drainage. At the west side of the Sinjie Drainage trunk line and the east side of the trunk line of Pusin Drainage, irrigation canals are present. The irrigation area of TY4 was less likely to include irrigation canals supplying irrigation beyond the range between the two drainages. Therefore, the preliminary comparison of the pollution characteristics of sediment and agricultural land pollution sites in the range between these drainages was conducted.
The sediment pollution characteristic items in TY4 indicated mainly Cr, Cu, and Pb. The agricultural land pollution sites were in the area that bordered Sinjie Drainage to the west, Pusin Drainage to the east, Taoyuan Da Zun to the south, and the shoreline to the north. A total of 1503 agricultural pollution sites were present in this area, accounting for 58% of all the agricultural pollution sites in Taoyuan. In this area, 97% of the agricultural land pollution sites were mainly polluted by Cu. Agricultural land containing both Cr and Cu accounted for 0.7%. Two Pb-containing agricultural land pollution sites were 1.3 km from the sediment pollution sites. Given that Pb in agricultural soil must reach 500 mg/kg to be identified as pollution (48.7 mg/kg of Pb in sediment was used as the pollution criterion in this study), a preliminary inference was made that the criterion was possibly related to the low proportion of Pb-containing agricultural land pollution sites. For Cr and Cu, the characteristics of sediment pollution sites corresponded to those of the agricultural land pollution sites. Agricultural land pollution sites with patterns of Cu + Zn pollution (1%), Cd + Cu pollution (0.4%), and Cd + Cu + Zn pollution (0.1%) were located close to the downstream area of drainage trunk lines. The patterns might be related to downstream pollution; Zn and Cd were not found in the sediments.
In terms of the number of potential Cu sources in Taoyuan City, bare printed circuit boards (PCBs) manufacturing has the largest number, accounting for about 43% of the total factories, followed by surface treatments with 15% of the total. The Cu emission amount is also the highest in the PCB manufacturing industry, which accounted for about 78% from 2014 to 2019. A comparison of the pollution sources revealed that two PCB factories (Factory A and B) and an industrial area (Industrial A) were located at the upstream area of sediment pollution sites, two factories operated near the trunk line of Sinjie Drainage, and another 4 PCB factories operated (Factory C, D, E, and F) near the trunk line of Pusin Drainage at the downstream the sediment pollution sites. The heavy metal release mass of the six factories and the industrial area into flowing water during the period 2014–2019 are shown in Figure 8. The two upstream factories were located near the upstream area of the canal with the sediment pollution sites, where the heavy metal masses of releases were mostly Cu (approximately 86%), Ni (approximately 9.3%), and Pb (approximately 3.4%). The release of Cr was small (from only one factory source; approximately 0.1%). The sediments therefore presented pollution characteristics of Cr, Cu, and Pb. However, the level of Ni in the sediments did not attain the level of pollution, possibly because of nonhomogenous samples or different sampling time points or for other reasons. Ni was also not notably present in agricultural land pollution sites. The overall heavy metal mass of release was high in Industrial Area A, with considerably different pollutants. Therefore, most agricultural land pollution sites with Cd, Cr, Ni, Pb, and Zn were located near the Pusin Drainage trunk line. Fewer corresponding characteristics were found in sediment pollution sites.
An investigation of historical survey data on the research area suggested that agricultural land pollution possibly resulted from effluent entering irrigation water sources. Although irrigation water quality might not appear abnormal, the constant accumulation of low concentrations of heavy metal might cause heavy metal buildup in agricultural land soil [28,29]. In addition, the EPA of the Executive Yuan in Taiwan analyzed the water quality and suspended solids at the diversion dams of the Pusin Drainage trunk line and found that most suspended solids were composed of Cu pollutants. The analysis indicated that the water and suspended solids contained 0.103 mg/L and 2890 mg/kg of Cu pollutants, respectively [27]. Suspended solids, with their notably high proportion of Cu pollution, are prone to enter sediments or agricultural land with irrigated water.
Taoyuan’s main irrigation source is Shihmen Reservoir, which offers approximately 47% and 48% of the irrigation water consumed in Taoyuan and Shihmen Management Office areas, respectively. For the remaining 53% of irrigation water, supplementation by nearby rivers and drainages is relied upon [30,31]. Between 2014 and 2019, approximately 61% of Cu in industrial wastewater was released into rivers or drainages [32]. To facilitate appropriate water resource use, irrigation water surplus was returned (i.e., return water). Investigation revealed that return water in the irrigation area of Shihmen Management Office accounted for 20% of the overall water resource [30], leading to the possible pollution of agricultural land downstream due to the return of polluted water sources upstream [28]. The summary results of the present study indicated that the pollution characteristics of sediment pollution sites were consistent with those of agricultural land pollution sites (Cr and Cu) and the characteristics of sediment pollution sites were similar to pollution sources (Cr, Cu, and Pb), suggesting similar sources of pollution at the sediment and agricultural land pollution sites. Therefore, the main cause of sediment pollution accumulation in Taoyuan was inferred to be the irrigation canals (rivers or drainages) affected by industrial pollution and return water utilization.

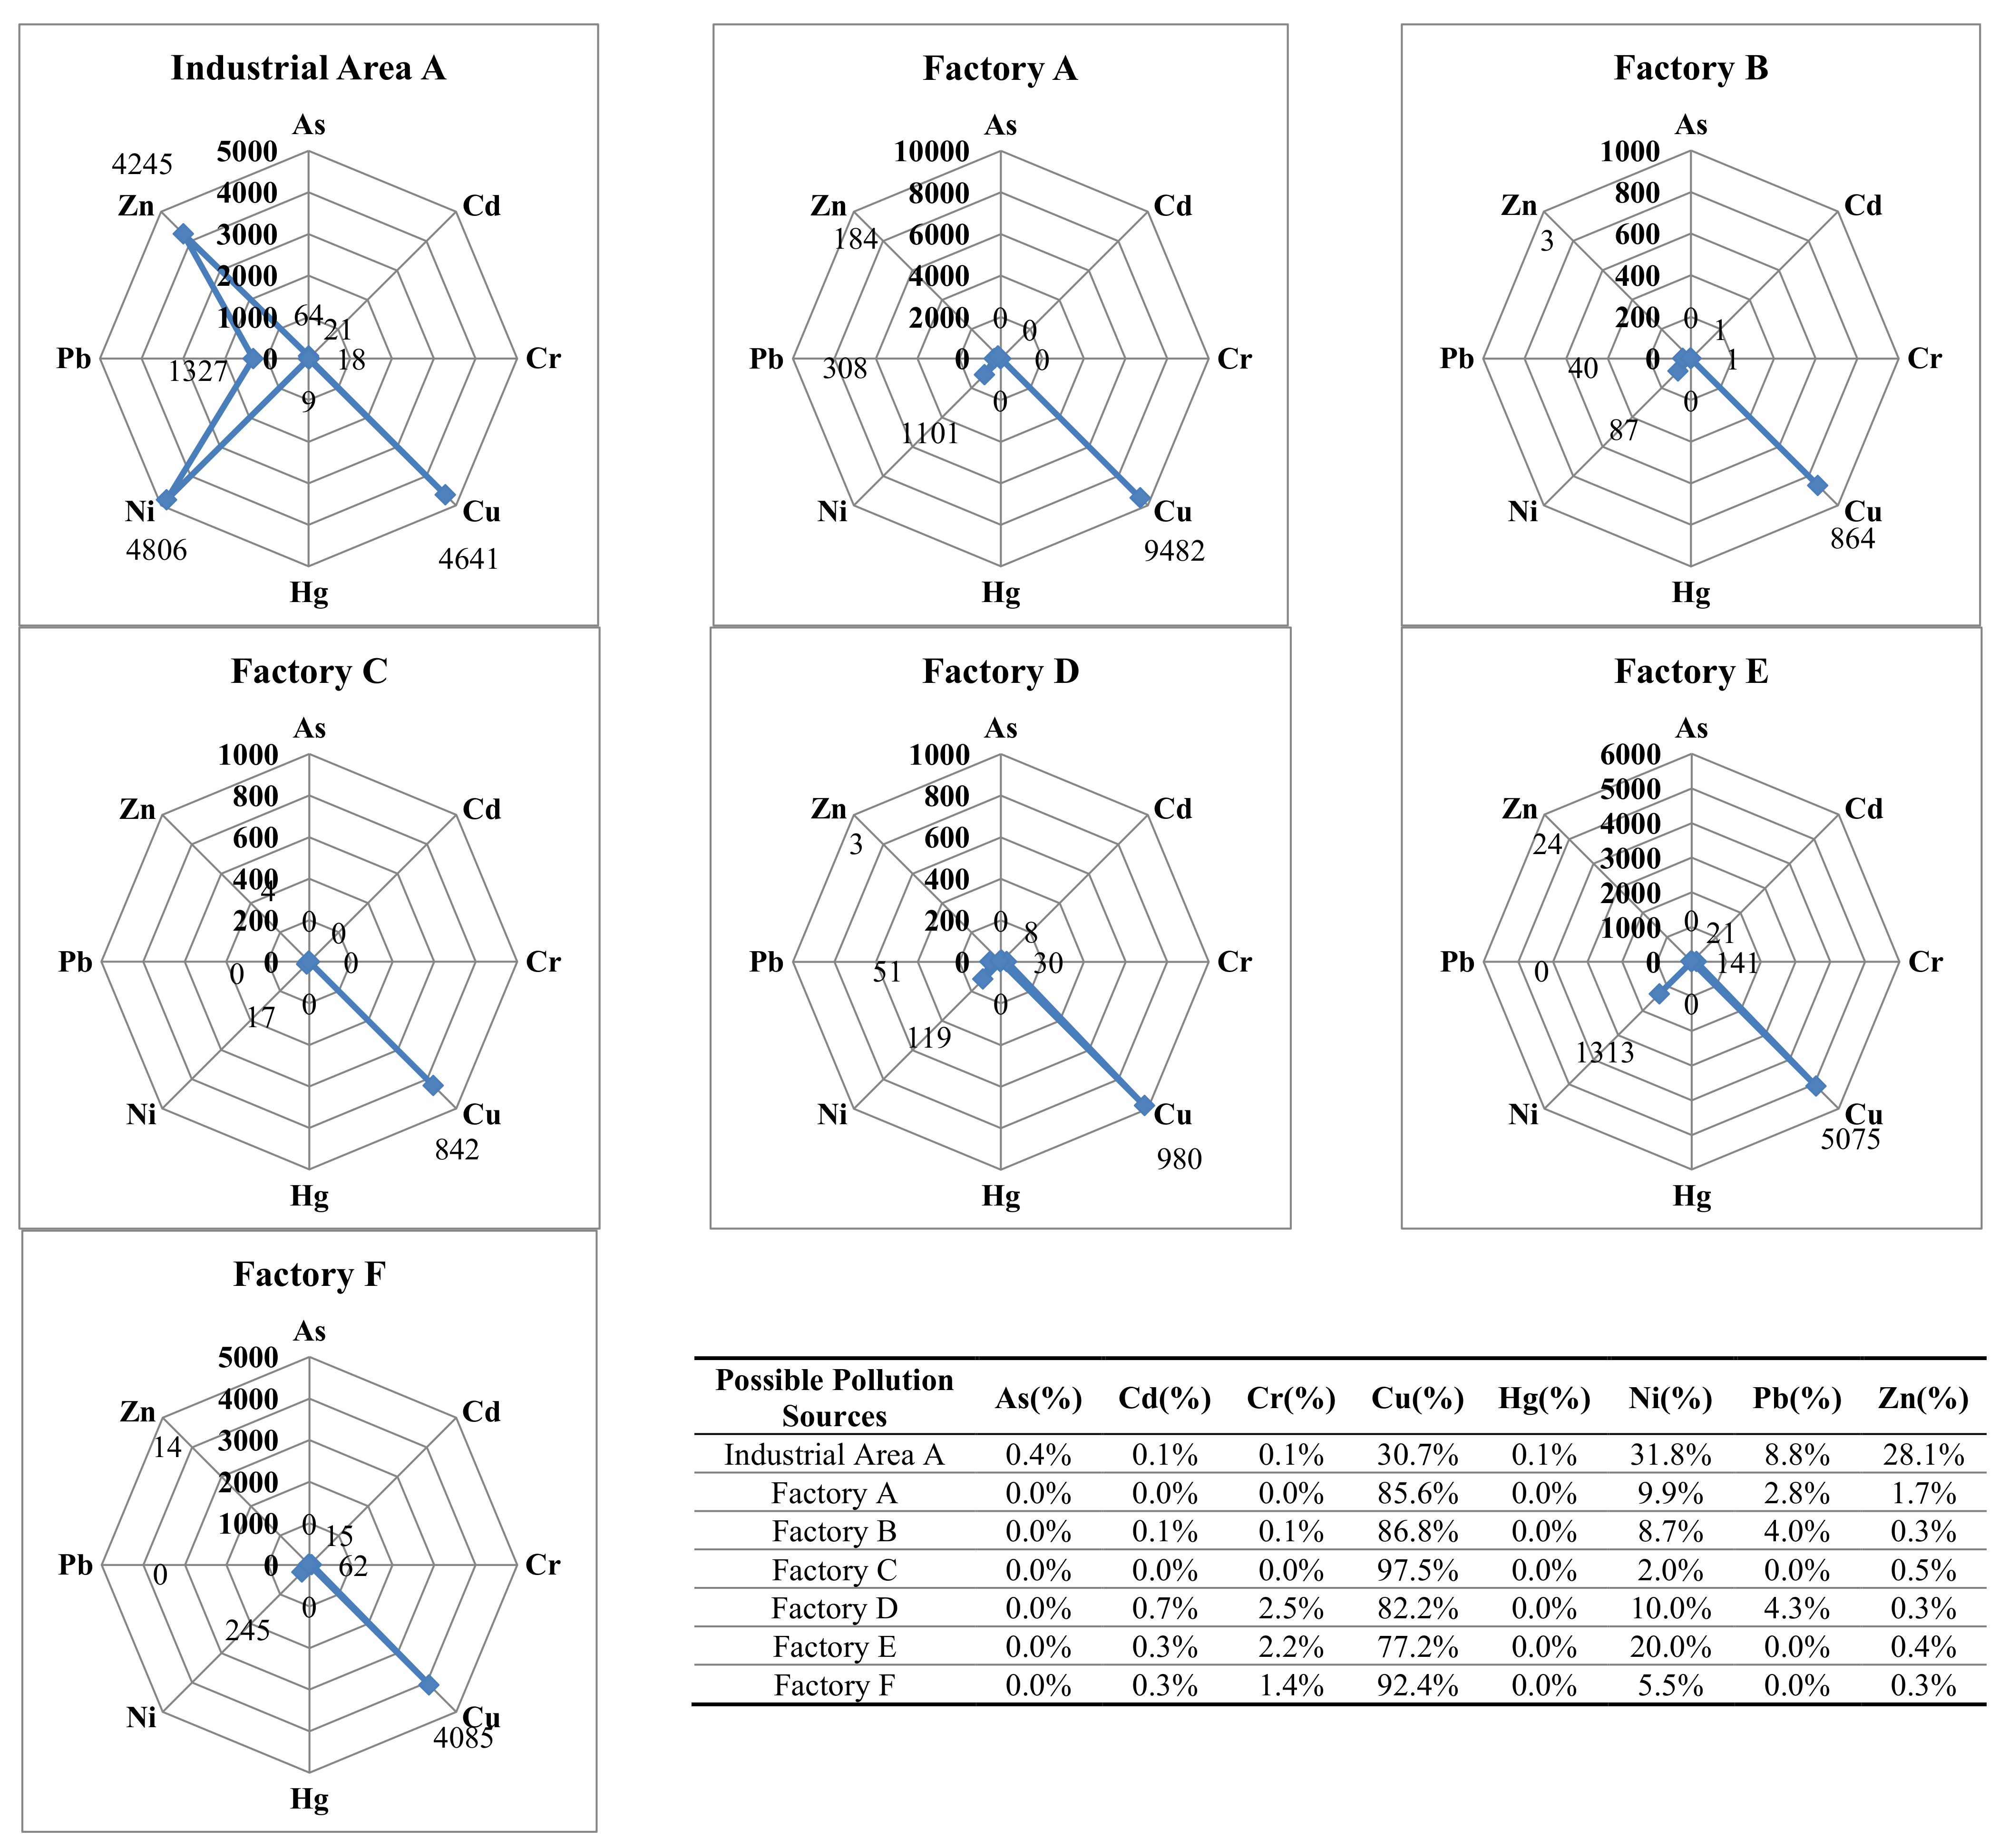
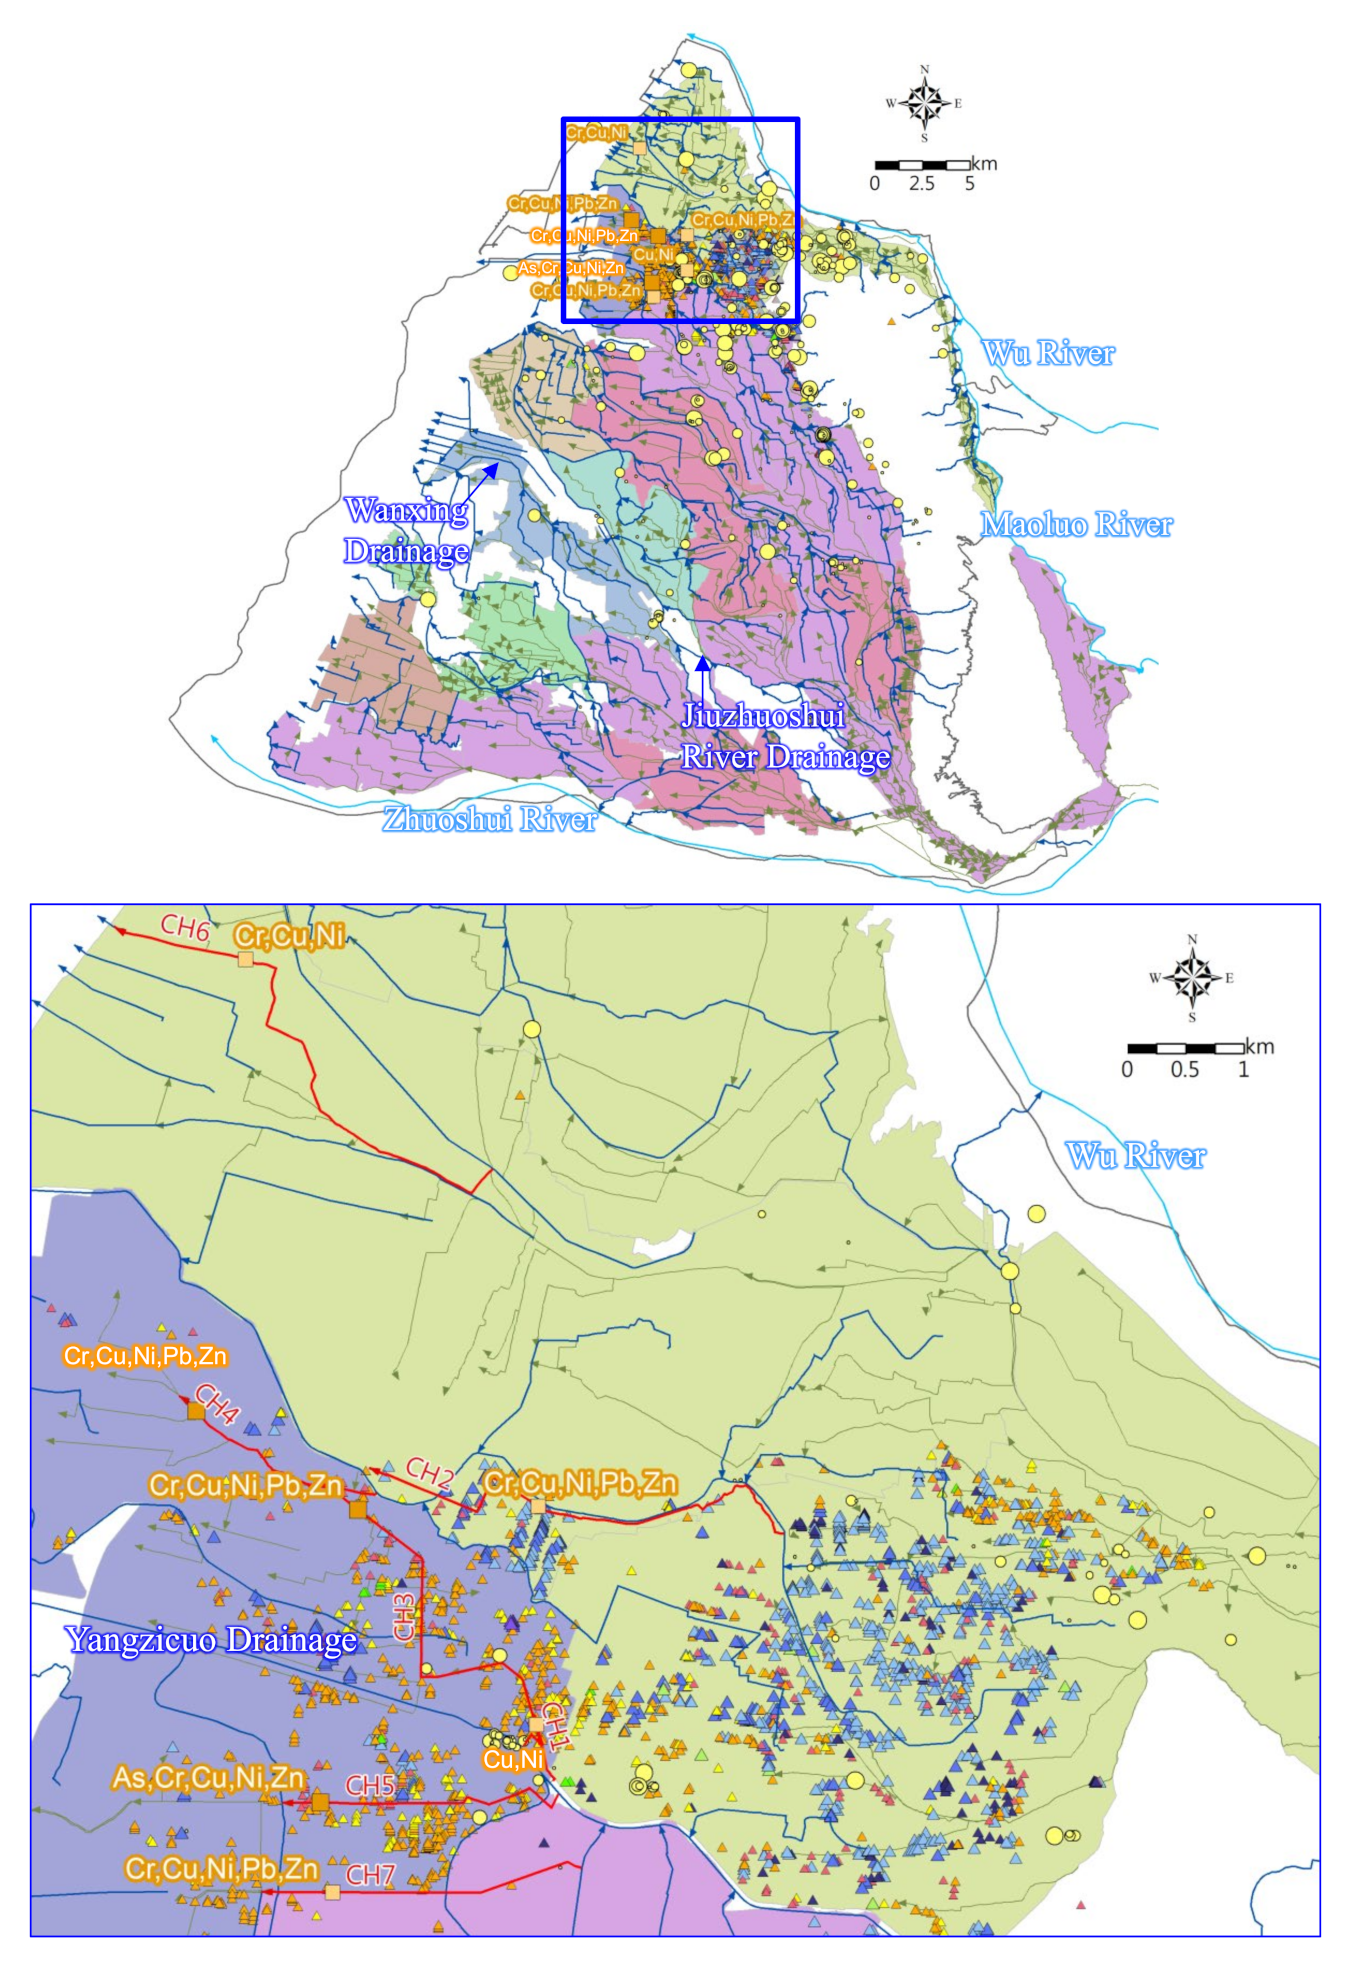
3.2.3. Analysis of Sediment Pollution and Possible Pollution Sources in Changhua

Sediment pollution sites, irrigation canals, areas with different irrigation sources, agricultural land pollution sites, possible pollution sources, and surface waters in Changhua are plotted in Figure 9. Most waterways in Changhua were planned as municipal or business drainage. The north and south sides of the research area were the Wu River and the Zhuoshui River, respectively. In addition to the two rivers, multiple drainages were categorized as irrigation canals in Changhua. Dividing the irrigation area according to water sources renders single water source areas (Wu River, Zhuoshui River, and Jiuzhuoshui River Drainage trunk line), double water source areas (Wu River and Yangzicuo Drainage trunk line, Zhuoshui River and Yuliao River Drainage trunk line, and Jiuzhuoshui River Drainage trunk line and Zhuoshui River), and triple water source areas (Jiuzhuoshui River Drainage trunk line, Zhuoshui River, and Wanxing Drainage trunk line). Sediment and agricultural land pollution sites categorized according to water sources are shown in Table 3. Most sediment pollution sites were irrigation canals with water sources from the Wu River and the Wu River + Yangzicuo Drainage trunk line. The irrigation area of the Wu River contained two sediment pollution sites, and the pollutants from the two sources, respectively, were Cr, Cu, Ni, Pb, and Zn, and Cr, Cu, and Ni. The irrigation area with the Wu River and Yangzicuo Drainage trunk line as the water sources contained five sediment pollution sites, of which three had Cr, Cu, Ni, Pb, and Zn; one had As, Cr, Cu, Ni, and Zn; and one had Cu and Ni. Aside from As, the pollutants in the two irrigation areas were quite similar.
In all, 2501 agricultural land pollution sites in Changhua contained Cu. The agricultural land pollution sites in the Wu River irrigation area accounted for 57% (1431 sites) of all the Cu-containing agricultural land pollution sites in Changhua. Many in the irrigation area (38% or 538 agricultural land pollution sites) contained Cr, Cu, Ni, and Zn. Approximately 20% of the sites (287) presented only Cu. Approximately 12% (175 sites) and 11% (159 sites) of the agricultural land pollution sites contained the patterns of Cu + Ni and Cu + Ni + Zn, respectively. The agricultural land pollution sites in the Wu River and Yangzicuo Drainage trunk line irrigation area accounted for approximately 30% (747 sites) of all the Cu-containing agricultural land pollution sites. In this area, most (63%, 473 sites) agricultural land pollution sites contained Cu pollution, followed by those presenting the patterns of Cu + Zn (17%, 129 sites), Cu + Ni (8%, 60 sites), and Cu + Ni + Zn (6%, 47 sites). The pollution patterns of the sediment and agricultural land pollution sites implied that the main pollutants were Cr, Cu, Ni, and Zn. Pb, which exhibited a trend similar to that in Taoyuan, which was found in sediment pollution sites but not in agricultural land pollution sites.
According to the heavy metal mass of the release of various receiving waters between 2014 and 2019 (shown in Table 4), the main irrigation water sources of sediment pollution sites were the Wu River and the Yangzicuo Drainage trunk line. The mass of release of Cu into the Yangzicuo Drainage accounted for 51% of the total amount of mass of release of Cu. Although the mass of release of Cu was only 3% in the Wu River, the receiving waters for 38% of the Cu release were not clearly recorded. Regarding the Cr mass of release, 33% and 7% entered the Yangzicuo Drainage trunk line and the Wu River, respectively. For the Ni mass of release, 9% and 2%, respectively, entered the Yangzicuo Drainage trunk line and the Wu River; whereas the receiving waters for 79% of the Ni release were not recorded. Regarding the Zn mass of release, 22% and 9% entered the Yangzicuo Drainage trunk line and the Wu River, respectively. The results revealed that irrigation water sources were the main receivers of wastewater. A study in 1999 noted that if an annual mean of water conductivity of greater than 750 μmho/cm indicated water pollution, as recorded during the period 1979–1996, then 46%–86.2% of irrigation water was contaminated in Changhua [33]. Figure 9 presents the spatial distribution of possible pollution sources. The distribution suggests that considerable possible pollution sources existed in the irrigation areas of the Wu River and the Zhuoshui River. Historical survey data revealed that along the bank between upstream and downstream areas of the Yangzicuo Drainage trunk line, many unregistered illegal electroplating factories secretly discharged unprocessed waste solutions into the Yangzicuo Drainage trunk line at midnight. Numerous environmental auditing results have revealed that most heavy metal pollution in Changhua was from the illegal discharge of wastewater by legal electroplating factories and unauthorized pipelines installed by illegal factories [34]. In addition, many irrigation canals were discovered to be using return water [34], which further resulted in the polluted water affecting the soil quality of agricultural land downstream. Therefore, considerable irrigation from drainages or rivers affected by industrial pollutants and the presence of both legal and illegal factories in the irrigation area were the main causes of sediment pollution in Changhua.

4. Conclusions

Taiwan completed its first heavy metal detection survey in sediments in irrigation canals in 2019, during which a total of 292 data were collected. Compared with rivers and reservoirs, sediment heavy metal concentrations in irrigation canals, especially Cu, were substantially higher. A division by counties and cities revealed that most sites with high Cu concentrations in sediments were located in Taoyuan City and Changhua County, where 60% (15/25) of sediment pollution sites were discovered to contain a high Cu content, and 91% (5106/5589) of agricultural land pollution sites were recorded to contain Cu.
The sediment pollution sites, Cu-containing agricultural pollution sites, and pollution sources in Taoyuan and Changhua were compared. Notably, the heavy metal release items of sediment pollution sites and possible pollution sources upstream in Taoyuan were consistent; both contained Cr, Cu, and Pb. In addition, the proportion of Cu mass of release was considerably high (86%). The sediment pollution sites in Changhua were with the main pollutants being Cr, Cu, Ni, Pb, and Zn and the main pollutants in agricultural land pollution sites were Cr, Cu, Ni, and Zn. These results revealed that the pollution characteristics in sediment pollution sites, agricultural land pollution sites, and pollution sources were highly consistent. We also noticed that return water irrigation may compromise downstream irrigation water quality because of polluted water returned upstream. The results indicated that the primary cause of sediment pollution in Taoyuan might be irrigation water sources from polluted rivers or drainages and return water. For Changhua, irrigation sources included drainages that receive the discharge of most wastewater pollution in the county. Incidences of return irrigation and illegal discharge of wastewater were reported in certain regions, which polluted sediments in Changhua. Results from this study establish a valuable linkage of the distribution of Cu and common heavy metal pollutants in the sediments of irrigation canals, polluted agricultural sites, and these potential heavy metal sources to understand the possible causes of sediment pollution. These results also demonstrate the importance of the adequate management of irrigation and drainage systems to prevent the accumulation of Cu and common heavy metal pollutants in sediment and its subsequent pollution to farmland.

Supplementary Materials

The following are available online at https://www.mdpi.com/article/10.3390/min11040416/s1, Table S1: Supporting information of the box-and-whisker plot analysis of sediment quality in irrigation canals, rivers, and reservoirs based on Cu concentration, Table S2: Supporting information of the box-and-whisker plot analysis of Cu concentration in irrigation canal sediment sampling sites in various counties and cities in Taiwan, Table S3: Supporting information of heavy metal statistics of irrigation canals in Taiwan.

Author Contributions

Conceptualization, S.-H.H., T.-C.C. and H.-C.H.; methodology, S.-H.H., H.-C.C. and Z.-S.W.; formal analysis, S.-H.H. and Y.-C.C.; resources, H.-C.C. and Z.-S.W.; writing—original draft preparation, S.-H.H., Y.-C.C., Y.-L.W. and H.-C.H.; writing—review and editing, S.-H.H., T.-C.C., H.-C.C. and H.-C.H. All authors have read and agreed to the published version of the manuscript.

Funding

This research and the APC were funded by Taiwan Environmental Protection Administration, grant number 108A372.

Institutional Review Board Statement

Not applicable.

Data Availability Statement

The authors confirm that the data supporting the findings of this study are available within the article and its Supplementary Materials.

Acknowledgments

This study was funded by the Taiwan Environmental Protection Administration. The views or opinions expressed in this article are those of the writers and should not be con-strued as opinions of the Taiwan Environmental Protection Administration.

Conflicts of Interest

The authors declare no conflict of interest.

References

  1. Peng, Y.-P.; Chang, Y.-C.; Chen, K.-F.; Wang, C.-H. A field pilot-scale study on heavy metal-contaminated soil washing by using an environmentally friendly agent-poly-γ-glutamic acid (γ-PGA). Environ. Sci. Pollut. Res. Int. 2020, 27, 34760–34769. [Google Scholar] [CrossRef] [PubMed]
  2. Liaw, C.-H.; Chiang, Y.-C. Framework for Assessing the Rainwater Harvesting Potential of Residential Buildings at a National Level as an Alternative Water Resource for Domestic Water Supply in Taiwan. Water 2014, 6, 3224–3246. [Google Scholar] [CrossRef]
  3. Yen, C.-H.; Chen, K.-F.; Sheu, Y.-T.; Lin, C.-C.; Horng, J.-J. Pollution Source Investigation and Water Quality Management in the Carp Lake Watershed, Taiwan. Clean Soil Air Water 2012, 40, 24–33. [Google Scholar] [CrossRef]
  4. Council of Agriculture, Taiwan. Irrigation Management. Available online: https://www.ia.gov.tw/ (accessed on 6 November 2020).
  5. Environmental Protection Administration, Taiwan. Database of Soil and Groundwater Pollution Sites. Available online: https://sgw.epa.gov.tw/ContaminatedSitesMap/Default.aspx (accessed on 13 November 2020).
  6. Wuana, R.A.; Okieimen, F.E. Heavy Metals in Contaminated Soils: A Review of Sources, Chemistry, Risks and Best Available Strategies for Remediation. ISRN Ecol. 2011, 2011, 1–20. [Google Scholar] [CrossRef] [Green Version]
  7. Adrees, M.; Ali, S.; Rizwan, M.; Ibrahim, M.; Abbas, F.; Farid, M.; Zia-Ur-Rehman, M.; Irshad, M.K.; Bharwana, S.A. The effect of excess copper on growth and physiology of important food crops: A review. Environ. Sci. Pollut. Res. Int. 2015, 22, 8148–8162. [Google Scholar] [CrossRef] [PubMed]
  8. Mourato, M.; Martins, L.; Campos-Andrada, M. Physiological responses of Lupinus luteus to different copper concentrations. Biol. Plant. 2009, 53, 105–111. [Google Scholar] [CrossRef] [Green Version]
  9. Van Zwieten, L.; Rust, J.; Kingston, T.; Merrington, G.; Morris, S. Influence of copper fungicide residues on occurrence of earthworms in avocado orchard soils. Sci. Total Environ. 2004, 329, 29–41. [Google Scholar] [CrossRef] [PubMed]
  10. Yang, X.-E.; Long, X.-X.; Ni, W.-Z.; Ye, Z.-Q.; He, Z.-L.; Stoffella, P.J.; Calvert, D.V. Assessing copper thresholds for phytotoxicity and potential dietary toxicity in selected vegetable crops. J. Environ. Sci. Health B 2002, 37, 625–635. [Google Scholar] [CrossRef] [PubMed]
  11. Mahmood, T.; Islam, K.R.; Muhammad, S. Toxic effects of heavy metals on early growth and tolerance of cereal crops. Pak. J. Bot. 2007, 39, 451–462. [Google Scholar]
  12. Cao, Z.; Hu, Z. Copper contamination in paddy soils irrigated with wastewater. Chemosphere 2000, 41, 3–6. [Google Scholar] [CrossRef]
  13. Xu, J.; Yang, L.; Wang, Z.; Dong, G.; Huang, J.; Wang, Y. Toxicity of copper on rice growth and accumulation of copper in rice grain in copper contaminated soil. Chemosphere 2006, 62, 602–607. [Google Scholar] [CrossRef] [PubMed]
  14. Food and Agriculture Organization. Available online: http://faostat.fao.org/faostat (accessed on 2 March 2021).
  15. Lai, H.-Y.; Juang, K.-W.; Chen, B.-C. Copper concentrations in grapevines and vineyard soils in central Taiwan. Soil Sci. Plant Nutr. 2010, 56, 601–606. [Google Scholar] [CrossRef]
  16. García-Esparza, M.; Capri, E.; Pirzadeh, P.; Trevisan, M. Copper content of grape and wine from Italian farms. Food Addit. Contam. 2006, 23, 274–280. [Google Scholar] [CrossRef] [PubMed]
  17. Mirlean, N.; Roisenberg, A.; Chies, J. Copper-based fungicide contamination and metal distribution in Brazilian grape products. Bull. Environ. Contam. Toxicol. 2005, 75, 968–974. [Google Scholar] [CrossRef] [PubMed]
  18. Zheng, N.; Wang, Q.; Zhang, X.; Zheng, D.; Zhang, Z.; Zhang, S. Population health risk due to dietary intake of heavy metals in the industrial area of Huludao city, China. Sci. Total Environ. 2007, 387, 96–104. [Google Scholar] [CrossRef] [PubMed]
  19. Council of Agriculture, Taiwan. Database of Agriculture. Available online: https://agrstat.coa.gov.tw/sdweb/public/inquiry/InquireAdvance.aspx (accessed on 24 February 2021).
  20. Liu, W.H.; Zhao, J.Z.; Ouyang, Z.Y.; Soderlund, L.; Liu, G.H. Impacts of sewage irrigation on heavy metal distribution and contamination in Beijing, China. Environ. Int. 2005, 31, 805–812. [Google Scholar] [CrossRef] [PubMed]
  21. Cheng, B.-Y.; Fang, W.-T.; Shyu, G.-S.; Chang, T.-K. Distribution of heavy metals in the sediments of agricultural fields adjacent to urban areas in Central Taiwan. Paddy Water Environ. 2013, 11, 343–351. [Google Scholar] [CrossRef]
  22. Chen, Z.-S. Relationship between Heavy Metal Concentrations in Soils of Taiwan and Uptake by Crops; Food and Fertilizer Technology Center: Taiwan, China, 2000. [Google Scholar]
  23. Lin, Y.-P.; Cheng, B.-Y.; Shyu, G.-S.; Chang, T.-K. Combining a finite mixture distribution model with indicator kriging to delineate and map the spatial patterns of soil heavy metal pollution in Chunghua County, central Taiwan. Environ. Pollut. 2010, 158, 235–244. [Google Scholar] [CrossRef] [PubMed]
  24. LeBlanc, L.A.; Schroeder, R.A. Transport and distribution of trace elements and other selected inorganic constituents by suspended particulates in the Salton Sea Basin, California, 2001. In The Salton Sea Centennial Symposium; Springer: Dordrecht, The Netherlands, 2008; pp. 123–135. [Google Scholar]
  25. Council of Agriculture, Taiwan. Protection Program of Agricultural Irrigation Water Quality. Available online: https://law.coa.gov.tw/glrsnewsout/LawContent.aspx?id=GL000497 (accessed on 26 November 2020).
  26. Tukey, J.W. Exploratory Data Analysis. Addison-Wesley Publishing Company Incorporation: Boston, MA, USA, 1977. [Google Scholar]
  27. Environmental Protection Administration, Taiwan. Investigation of Contaminated Farmlands in Taoyuan. 2013. Available online: https://epq.epa.gov.tw/Default.aspx (accessed on 18 January 2021).
  28. Environmental Protection Administration, Taiwan. Control and Investigation Program for National Agricultural Land with High Potential of Heavy Metal Pollution (II). 2014. Available online: https://epq.epa.gov.tw/Default.aspx (accessed on 10 January 2021).
  29. Yadav, R.K.; Goyal, B.; Sharma, R.K.; Dubey, S.K.; Minhas, P.S. Post-irrigation impact of domestic sewage effluent on composition of soils, crops and ground water—A case study. Environ. Int. 2002, 28, 481–486. [Google Scholar] [CrossRef]
  30. Northern Region Water Resources Office, Water Resources Agency, Ministry of Economic Affairs, Taiwan. Development of Diverse Water Resources—Investigation and Feasibility Assessment of Agricultural Return Flows in the Taoyuan and Hsinchu Areas. 2007. Available online: https://www.wranb.gov.tw/3452/24064/27197/ (accessed on 13 January 2021).
  31. Shihmen Management Office, Irrigation Agency, Council of Agriculture, Taiwan. Source of Irrigation Water. Available online: https://www.iasme.nat.gov.tw/view.php?theme=web_structure&id=109 (accessed on 13 January 2021).
  32. Environmental Protection Administration, Taiwan. Wastewater and Sewage of Enterprise and Sewage System Management System. Available online: https://wpmis.epa.gov.tw/WPMIS/Login.aspx (accessed on 13 May 2019).
  33. Ta-Wei, C.; Wei-Sheng, Y.; Cheng-Chang, H. Assessment of Dilution Water Quality for Polluted Irrigation Water-Chung-hwa Irrigation Area as an Example. J. Chin. Agric. Eng. 1999, 45. [Google Scholar]
  34. Environmental Protection Administration, Taiwan. Control and Investigation Project for National Agricultural Land with High Potential of Heavy Metal Pollution (IV). 2017. Available online: https://epq.epa.gov.tw/Default.aspx (accessed on 10 January 2021).
Figure 1. Box-and-whisker plot analysis of sediment quality in irrigation canals, rivers, and reservoirs based on Cu concentration. The number in the parentheses is the number of sampling sites.
Minerals 11 00416 g001
Figure 2. Irrigation canal sediment sampling sites and Cu concentration distribution in Taiwan.
Minerals 11 00416 g002
Figure 3. Box-and-whisker plot analysis of Cu concentration in irrigation canal sediment sampling sites in various counties and cities in Taiwan. The number in the parentheses is the number of sampling sites in a city/county.
Minerals 11 00416 g003
Figure 4. Bar charts of pollutants and concentrations of 25 sediment pollution sites.
Minerals 11 00416 g004
Figure 5. Heavy metal statistics of irrigation canals in Taiwan. The number in the parentheses is the number of metal appearance in the sampled irrigation canals.
Minerals 11 00416 g005
Figure 6. Pie charts of sediment and agricultural land pollution sites containing Cu.
Minerals 11 00416 g006
Figure 7. Sediment and agricultural land pollution sites in Taoyuan and the distribution of possible pollution sources.
Minerals 11 00416 g007aMinerals 11 00416 g007b
Figure 8. Radar charts of heavy metal mass of release at pollution sources near sediment pollution sites in TY4 (Note: Total mass of release of heavy metals during the period 2014–2019, unit: kg).
Minerals 11 00416 g008
Figure 9. Distribution of the sediment and agricultural land pollution sites as well as possible pollution sources in Changhua County.
Minerals 11 00416 g009aMinerals 11 00416 g009b
Table 1. The lower and upper limit values of sediment quality guidelines for heavy metals.
Sediment Quality IndicatorUpper Limit (mg/kg)Lower Limit (mg/kg)
As33.011.0
Cd2.490.65
Cr23376.0
Cu15750.0
Hg0.8700.230
Ni80.024.0
Pb16148.0
Zn384140
Table 2. Summary of pollution characteristics in agricultural land pollution sites containing Cu.
Pollutant
(Cu Included)
YilanPingtungMiaoliTao-yuanKaohsiungNew TaipeiHsinchu
(City)
Chang-huaTaichungTaipeiTainanTotalRatio
As, Cr, Cu, Pb 1 10.02%
As, Cr, Cu, Ni, Zn 1 10.02%
As, Cu 2 2 40.07%
As, Cu, Zn 1 10.02%
As, Cd, Cu, Ni, Pb 1 10.02%
Cr, Cu 16 41725 621.11%
Cr, Cu, Pb, Zn 2 1 30.05%
Cr, Cu, Zn 4 103 2190.34%
Cr, Cu, Ni1 1 913989 2394.28%
Cr, Cu, Ni, Zn 1 15955 60210.8%
Cu 1624001858506127334159.8%
Cu, Hg 2 1 30.05%
Cu, Pb 1 2 30.05%
Cu, Pb, Zn 161 6 1150.27%
Cu, Zn1 154 6 2661 144427.91%
Cu, Ni 13 128512 33055.46%
Cu, Ni, Pb 1 10.02%
Cu, Ni, Pb, Zn 110.02%
Cu, Ni, Zn 3 2465 2544.54%
Cd, Cr, Cu, Pb, Zn 220.04%
Cd, Cr, Cu, Ni 12 120.21%
Cd, Cr, Cu, Ni, Pb, Zn 154 1542.76%
Cd, Cr, Cu, Ni, Zn 2252 741.32%
Cd, Cu 13 1 140.25%
Cd, Cu, Hg 1 10.02%
Cd, Cu, Hg, Ni, Pb, Zn 110.02%
Cd, Cu, Pb 110.02%
Cd, Cu, Pb, Zn 660.11%
Cd, Cu, Zn 4 480.14%
Cd, Cu, Ni 5 50.09%
Cd, Cu, Ni, Pb 3 30.05%
Cd, Cu, Ni, Pb, Zn 220.04%
Cd, Cu, Ni, Zn 8 80.14%
Total2110260571819625012014445589100%
Ratio0.04%0.02%0.18%46.6%0.13%0.32%3.51%44.75%3.60%0.07%0.79%100%
Note: Agricultural land soil pollution was determined according to Soil Pollution Control Standards, in which the criteria for each pollution item are 60 mg/kg for arsenic; 5 mg/kg for cadmium; 250 mg/kg for chromium; 200 mg/kg for copper; 5 mg/kg for mercury; 200 mg/kg for nickel; 500 mg/kg for lead; and 600 mg/kg for zinc.
Table 3. Summary of the sediment and agricultural land pollution sites of different water sources.
Water SourceWu RiverWu River/Yangzicuo Drainage Trunk LineJiuzhuoshui River Drainage Trunk Line/Zhuoshui River
Sediment Pollution Sites NumberSediment Pollution Sites RatioAgricultural Land Pollution Sites NumberAgricultural Land Pollution Sites RatioSediment Pollution Sites NumberSediment Pollution Sites RatioAgricultural Land Pollution Sites NumberAgricultural Land Pollution Sites RatioAgricultural land Pollution Sites NumberAgricultural Land Pollution Sites Ratio
Cu00%28720%00%47363%00%
Cr, Cu, Ni, Zn150%53838%480%223%00%
Cu, Ni00%17512%120%608%00%
Cu, Zn00%685%00%12917%150%
Cu, Ni, Zn00%15911%00%476%00%
Cr, Cu, Ni150%1188%00%10%00%
Cd, Cr, Cu, Ni, Zn00%433%00%00%00%
Cr, Cu,00%81%00%71%150%
Cd, Cr, Cu, Ni00%111%00%00%00%
Cr, Cu, Zn00%81%00%00%00%
Cd, Cu, Ni, Zn00%70%00%10%00%
Cu, Pb, Zn00%00%00%61%00%
Cd, Cu, Ni00%40%00%00%00%
Cd, Cu, Ni, Pb00%10%00%00%00%
As, Cu00%10%00%00%00%
As, Cr, Cu, Ni, Zn00%10%00%00%00%
As, Cu, Zn00%00%00%10%00%
As, Cd, Cu, Ni, Pb00%10%00%00%00%
Cu, Hg00%00%00%00%00%
Cu, Ni, Pb00%10%00%00%00%
Total0100%1431100%0100%747100%2100%
Note: An absence of irrigation water source indicates that no agricultural land pollution site was identified in the irrigation area.
Table 4. The mass of release, the ratio of heavy metal released in single water source, and the ratio of single heavy metal released among water bodies in Changhua.
Mass of Release (kg)
River/Drainage BasinAsCdCrCuHgNiPbZnTotal
Yangzicuo Drainage31928398808813524218257
Others1890573296448055140628718212
Erlin River Drainage00146397076205041810
Wu River00189270021219691640
Yuanlin Drainage11721190012952381283
Wanxing Drainage001221013084131
Jiuzhuoshui River Drainage00261801152299684
Qingshui River SubsidiaryDrainage00170303849
Maoluo River000000000
Total193228327845410,17018210,83932,067
Ratio of Heavy Metal Released in Single Water Source (%)
River/Drainage BasinAsCdCrCuHgNiPbZnTotal
Yangzicuo Drainage0%0%11%48%0%11%0%29%100%
Others1%0%3%16%0%44%1%35%100%
Erlin River Drainage0%0%8%22%0%42%0%28%100%
Wu River0%0%12%16%0%13%0%59%100%
Yuanlin Drainage0%0%56%15%0%10%0%19%100%
Wanxing Drainage0%0%9%16%0%10%0%64%100%
Jiuzhuoshui River Drainage0%0%38%1%0%17%0%44%100%
Qingshui River SubsidiaryDrainage0%0%3%14%0%6%0%77%100%
Maoluo River0%0%0%63%0%0%0%38%100%
Total1%0%9%24%0%32%1%34%100%
Ratio of Single Heavy Metal Released among Water Bodies (%)
River/Drainage BasinAsCdCrCuHgNiPbZnTotal
Yangzicuo Drainage2%41%33%51%0%9%19%22%26%
Others98%9%20%38%100%79%77%58%57%
Erlin River Drainage0%0%5%5%0%7%0%5%6%
Wu River0%0%7%3%0%2%0%9%5%
Yuanlin Drainage0%49%25%2%0%1%3%2%4%
Wanxing Drainage0%1%0%0%0%0%0%1%0%
Jiuzhuoshui River Drainage0%1%9%0%0%1%1%3%2%
Qingshui River SubsidiaryDrainage0%0%0%0%0%0%0%0%0%
Maoluo River0%0%0%0%0%0%0%0%0%
Total100%100%100%100%100%100%100%100%100%
Publisher’s Note: MDPI stays neutral with regard to jurisdictional claims in published maps and institutional affiliations.

