1. Introduction
A crushing plant operation is a dynamic process as the performance varies over time. Monitoring and controlling such process performance are of importance for running the plant at a profitable state which needs decision-making support. The key to the decision-making process is the availability of the right information at the right time. Crushing and screening processes in an aggregates production require continuous supervision of operations for producing various aggregate products based on customer demands. This entails the development of technological solutions to provide a robust and reliable tool to the operators and plant managers which can facilitate useful and proactive decisions.
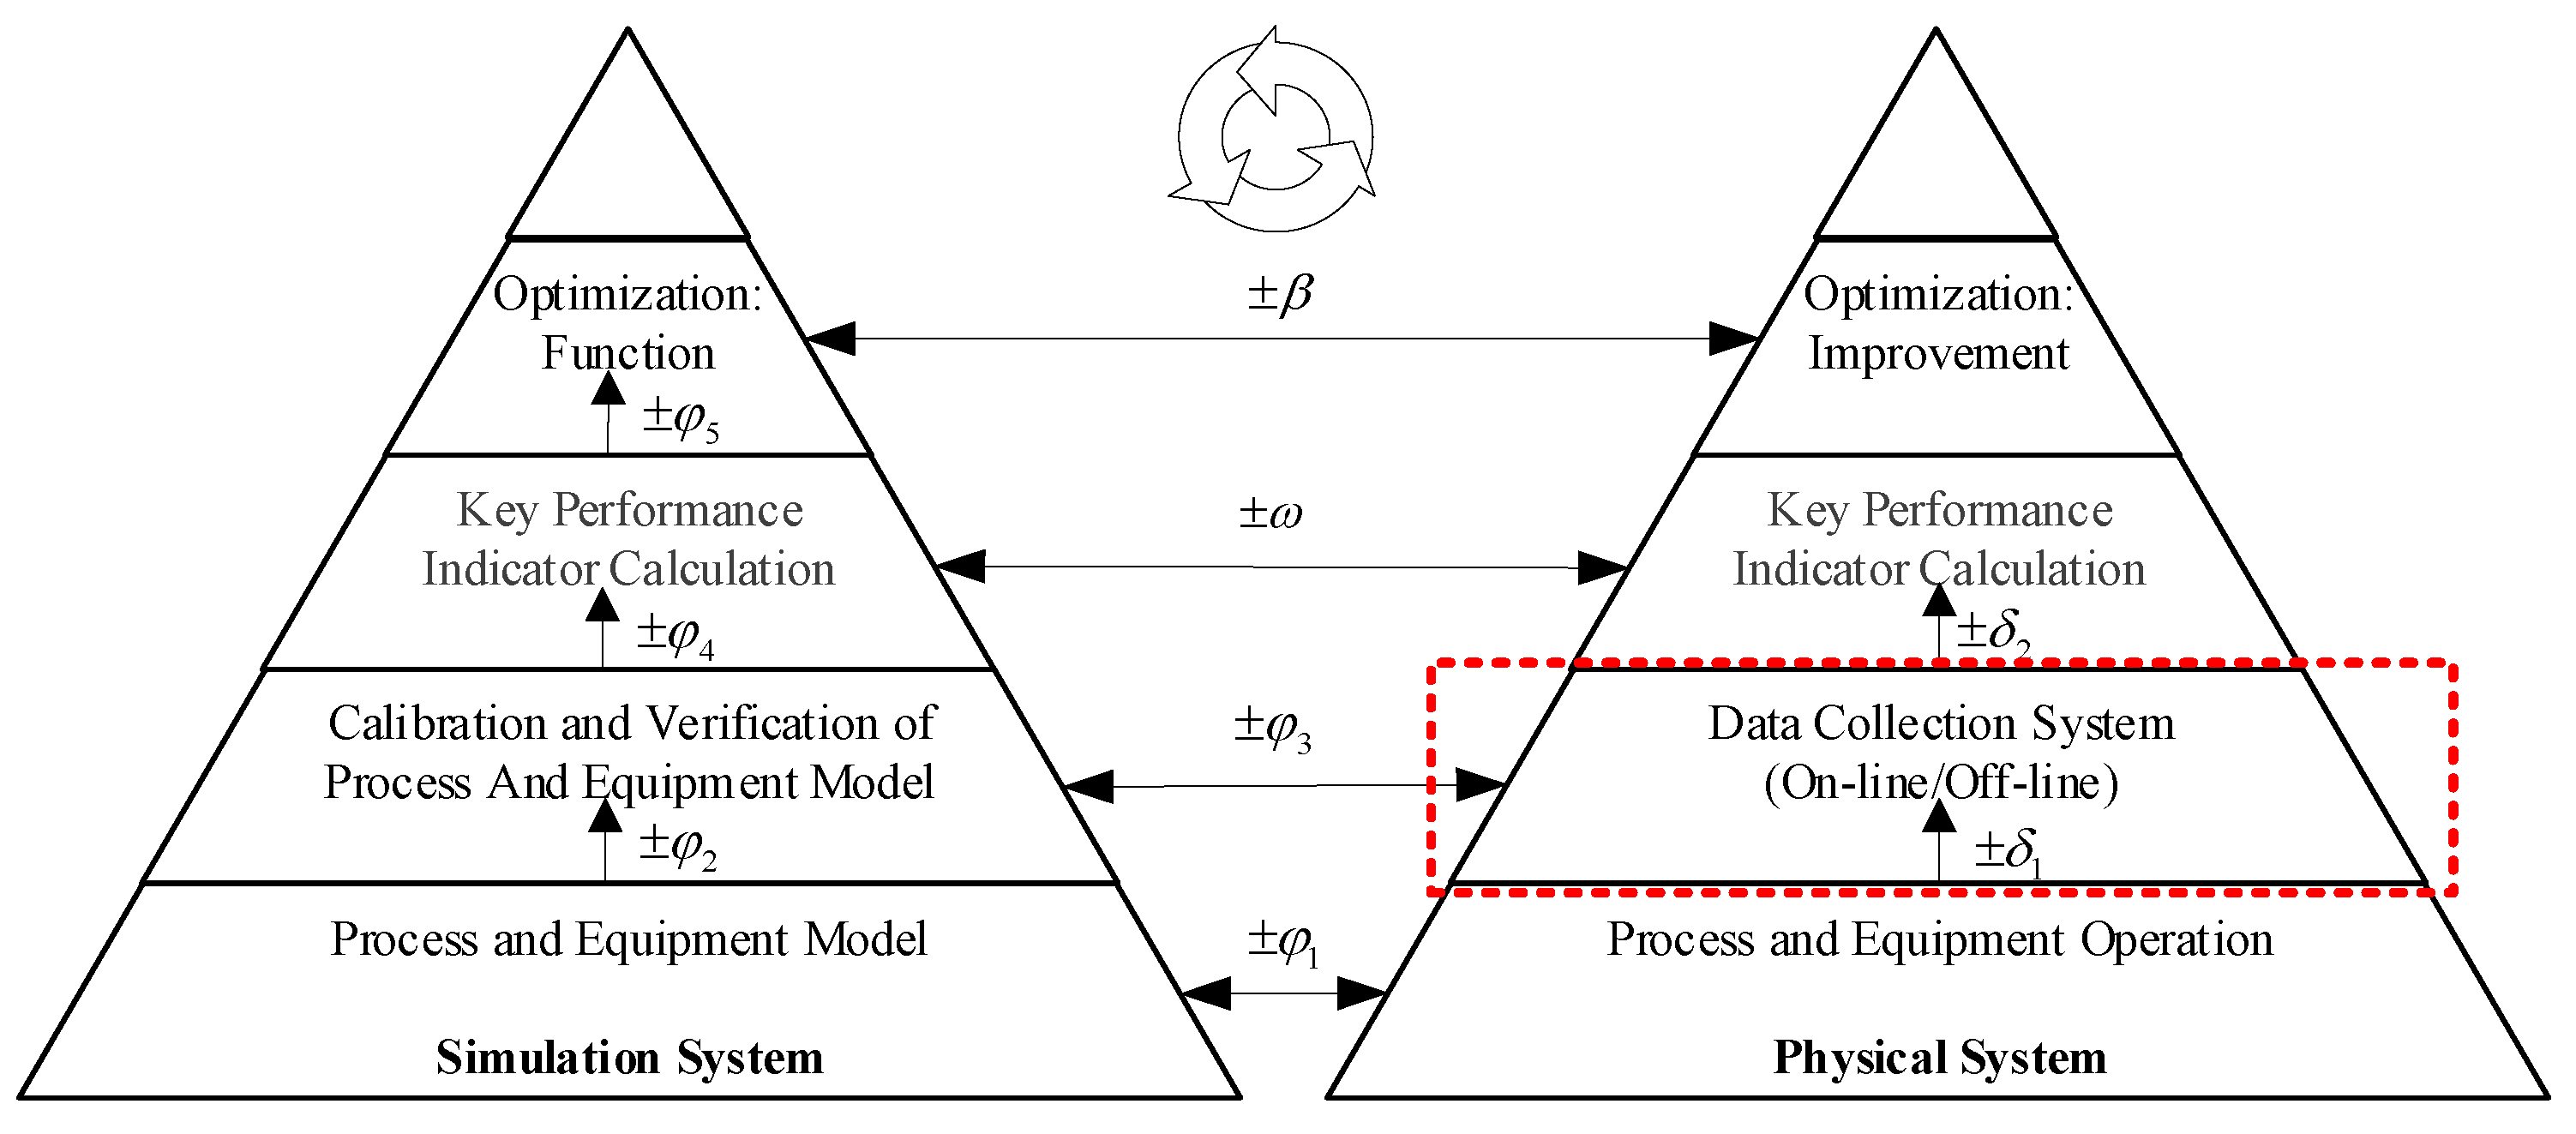
Figure 1 shows a multi-layered development model proposed for the implementation of optimization functionality in a crushing plant [
1]. Various individual research has been performed at different levels of the model presented. For instance, equipment modelling [
2,
3,
4], process modelling [
5,
6], data collection [
7,
8], performance calculation [
9] and process optimization methods [
10,
11,
12,
13,
14,
15]. The decision-making process is based on both plant operational data as well as the results from plant simulation. For such multi-layered implementation of optimization functionality, reliable underlying systems (measurement system, models, etc.) are needed. Based on the choice in the underlying systems, each development stage inherits certain accuracy indicated by its total relative errors (φi, δi, ω, β) [
1].
In particular, the paper focuses on the data collection system for the crushing plant which typically includes continuous process variables such as mass flow, power draw, equipment settings, and control setpoints. The aim is to maintain low error values in the data collection system, particularly, the mass flow system. The mass flow system, in consideration here, uses a power-based belt scale technique developed by Hulthén [
7]. According to the working principle, the power draw from a conveyor belt is a function of the load on the conveyor, the conveyor speed, conveyor geometrical design and its overall efficiency [
16]. The system is a cost-effective solution in terms of installation and can be easily integrated with a cloud solution. However, there is an underlying gap that the system needs frequent physical calibration as the mass flow is a function of power draw in the conveyors. It has been observed that the maintenance status (conveyor alignment, roller and belt contact, jammed material, wear, etc.) of the power-based belt scale varies during different times of operation which creates reliability issues in the mass flow system.
The following paper demonstrates the application of the optimization method for calibration of the off-line data collections system. The application of the optimization method is intended for continuous calibration of the mass flow system. Additionally, a smart maintenance alert system for the conveyors using deviation calculation is proposed. The purpose of the research is to increase reliability within the collected data from the process and equipment operations which can be used for process improvements and process optimization studies.
2. Review of Data Collection System for Aggregate Production
To observe the crushing plant performance, measurements of various input and output variables associated with the process performance are required. The input variables are typically entities such as material properties, equipment settings (e.g., closed-side settings of crushers) and control setpoints. The output variables are typically entities such as power consumption, operational time, bin levels and mass flow at various points in the process. Since a crushing plant has a dynamic characteristic, both the input and output variables are a function of time and exhibit both discrete and gradual changes during operation.
According to the benchmark study by Väyrynen [
17], there are various solutions for a mass flow approximation. Solutions such as load-cell-based, laser profilometer, ultrasonic sensor, and power-based belt scale. These scales vary largely on aspects such as cost, accuracy, and maintenance. The study showed that the power-based belt scale accuracy is within 1% of the cumulative error to the reference mass flow carried out with a load-cell-based scales and it is a cost-effective solution with low maintenance [
17]. Itävuo, et al. [
18] successfully applied the power-based belt scale mass flow as an input in the control algorithm for increasing the utilization of an aggregate production plant. Practical experience shows that there are, independent of the measurement method, a certain number of errors in the mass flow measurements. These typically occur due to either gradual changes over time like e.g., component wear or more instant changes like a rock getting stuck in a load cell or roller.
Hodouin and Vaz Coelho [
19] highlighted sources of variations occurring in the measurements system of wet processes in minerals processing such as heterogeneous nature of the material stream, imperfections in sensors, natural disturbances in ore characteristics and processing conditions. Furthermore, applications of optimization and data-reconciliation methods using material balance for estimating unknown data [
20,
21], or improving data quality [
22,
23,
24] in wet processes of minerals processing circuit are shown. Data reconciliation using a two-tier approach, global multi-nodal mass balance and error minimization function is applied for measuring the performance index, which is a measure of assessing the quality of data [
25,
26]. Extensive work is performed on wet processes for data reconciliation [
27] while there is limited application towards the coarse comminution circuit of the minerals processing. There is scarce work in linking the sensor variables to the mass balancing of the circuit as the changes occurring due to physical deterioration of the equipment affect the sensor recordings. Especially if the sensors are directly linked to the equipment performance, such as in the case of power-based belt scale in conveyors. There is a possibility to continuously update the sensor variables to compensate for the dynamic change occurring during the process operation.
3. Methods
The following chapter first briefly describes the working principle of the power-based belt scale for conveyor mass flow estimation [
16] followed by a description of the calibration process and deviation measurement process. The calibration process uses an optimization method to minimize the error between the estimated value and the stored values. The deviation measurement is based on the correlation matrix to identify the deviating conveyors during process operation. Both the calibration and deviation measurement use the property of mass balancing in the crushing plant operations.
3.1. Theory of Power-Based Belt Scale Conveyors
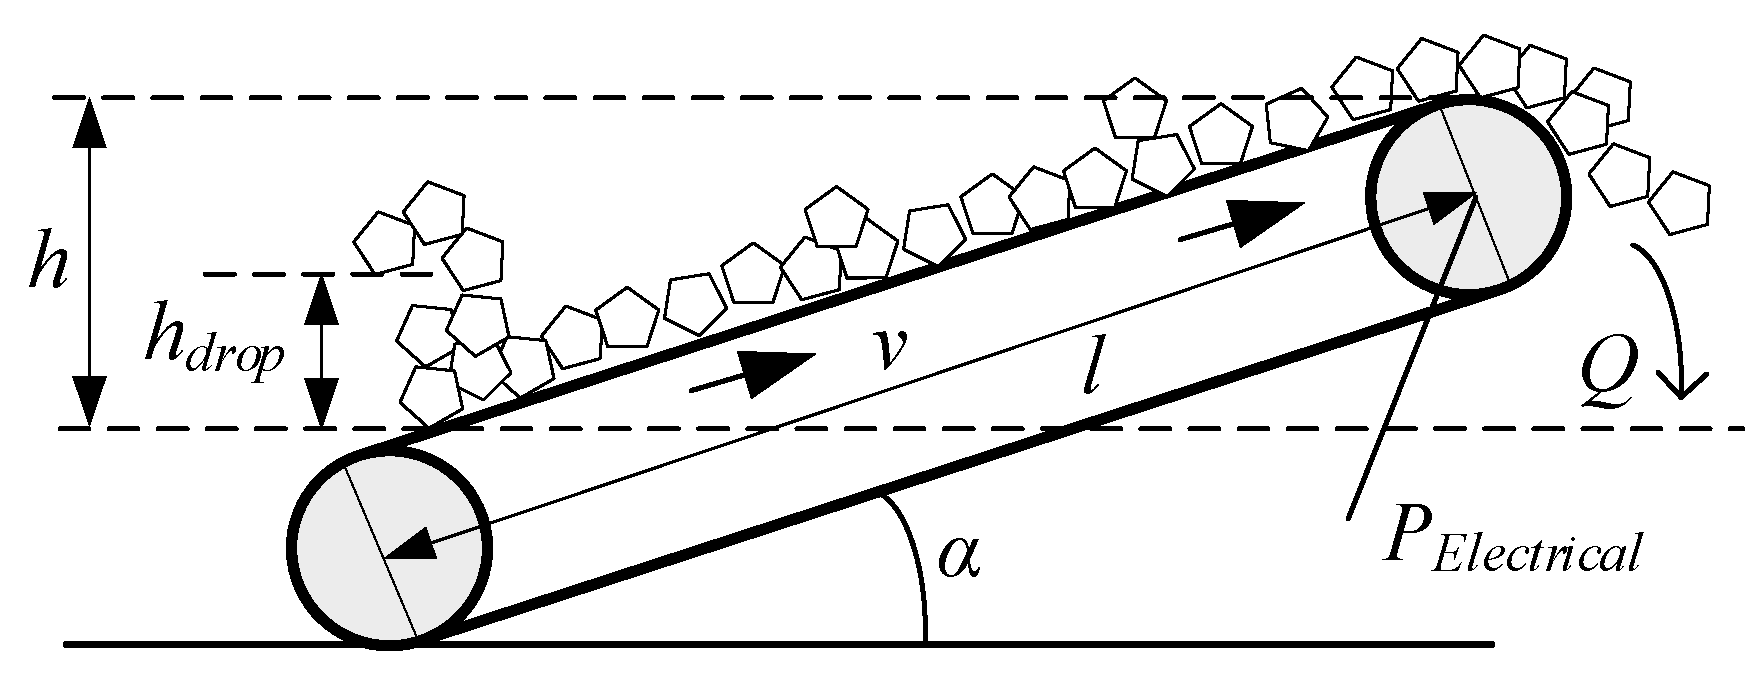
The power draw from a conveyor belt is dependent on the load on the conveyor, the conveyor speed, geometrical design, and the overall efficiency of the conveyor. The working principle of the power-based belt scale is based on equating the mechanical power required to lift the material to a certain height to the corresponding electrical power consumed by the conveyor. A detailed description of the power-based belt scale can be found in Hulthén and Evertsson [
16] and of underlying mechanical principles in Morin [
28], while a summary is presented here.
Figure 2 presents the working principle of conveyor lifting material and the geometrical properties of the conveyor.
The following variables are used:
The total power draw in the conveyor is divided into two components: idle power and load power as shown in Equation (1).
The total power required to lift the material consists of three components: potential energy, acceleration of material and change in momentum of material flow as given in Equation (2).
Combining Equations (1) and (2) and considering the total efficiency (
η) of the conveyor (power losses due to efficiencies of electrical motor, belt transmission, gear stage and flat belt) yields the mass flow rate in the conveyor as shown in Equation (3).
In short, the mass flow rate is a function of electrical and idle power, total efficiency and the geometrical and operational constant for a given conveyor as shown in Equation (4).
3.2. Power-Based Belt Scale Calibration
To calculate the correct mass flow for the power-based belt scale, the value of PIdle and η need to be calibrated.
3.2.1. Idle Power Calibration
The installed power transducers capture the total electrical power drawn during the operation of each conveyor. Idle power is dependent on the size and power rating of the conveyor, temperature, condition and gradually changes as the belt scale is under operation. The gradual changes can include misalignment in rollers, insufficient roller contact, etc. As the crushing process operates, there are power spikes in the conveyor at the beginning of the operation to overcome the cold start condition. As the day progresses, idle power declines as the conveyors become fully operational. Another phenomenon typically occurring in the crushing plant operations are the stops of the crusher for closed-side setting (CSS) change depending on the automatic or manual adjustment for wear. This results in the recording of idle power from the conveyor occurring periodically depending on the material flow on the conveyor.
Using the data-filtering techniques, the data set of idle power is obtained. The data obtained here is fitted to a logarithmic function shown in Equation (5), where
t is the time measurement against the set of points recorded as the idle working of the conveyor.
The fitting of the curve is performed using the model fitting optimization method as shown in Equation (6).
The fitted curve is used to find the idle power as a function of time for the given operational time.
3.2.2. Conveyor Efficiency Calibration
The total efficiency of the conveyor is calibrated depending on the position of the conveyor within a circuit. The conveyors are classified into two segments: accessible conveyors and non-accessible conveyors. The accessible conveyors within a circuit are the ones where it is possible to take physical measurements of the mass flow whereas the non-accessible conveyors are the ones which have limited access to make mass flow measurements or it is too costly to interrupt the ongoing production process. The calibration of the accessible conveyor is performed by physical measurement of accumulated mass using external mass measuring equipment such as a front loader for a specified duration of time. The mass measurement can also be performed using an in-built belt scale based on load cell (with tachometer) if the conveyor is equipped with it.
The generalized error minimization optimization problem for efficiency calibration is given in Equation (7), where
i is the number of test samples,
ei is the relative error function,
QiC is calculated accumulated mass and
QiM is measured accumulated mass for a tested time interval. The value of
t1 and
t2 represents the start and end time for the calibration for one test.
After identifying the efficiencies of the accessible conveyors, the system property of the plant layout is applied to identify a set of mass balancing equations. For a given time of operation, at any node within a crushing circuit, the accumulated incoming material mass is equal to the accumulated outgoing mass as given in Equation (8), where
i and
j represent the number of entities before and after the node.
Based on the number of equations (
k) derived using Equation (8), a set of error functions is formulated as shown in Equation (9), where
n and
m are the number of mass measuring units before and after the selected node in the plant circuit, respectively.
Using the set of Equation (9), an error minimization optimization problem is posed to identify the set of unknown conveyors efficiency (
ηu) for the non-accessible conveyors in the system as shown in Equation (10). The bounds on the conveyor efficiency are set based on the historic data from the considered plant operation and previous calibration values.
If the number of error equations is more than or equal to the number of non-accessible conveyors, a full constrained or an over-constrained optimization problem is formulated. The optimization problems in Equations (7) and (10) can be solved using gradient-based constrained optimization algorithms such as the interior-point algorithm. Although it is possible to use other algorithms depending on the problem status (over-constrained, under-constrained or fully constrained) which in turn depends on the circuit layout. Using the above methods, the efficiencies of all the conveyors are calibrated.
3.3. Power-Based Belt Scale Deviation Calculation Using Correlation Matrix
The next step is to check the reliability of the mass flow measurements over continuous operational time. Due to the dynamic nature of the process operations, deviations are occurring in the measurements. Using the principle of mass balancing of the system, the accumulated mass overtime (incoming and outgoing) at each node within a circuit needs to be in an equilibrium state. The set of equations presented in Equation (9) is used to develop a correlation matrix as shown in
Table 1.
The value of the Apk matrix can be 1 or 0 depending on if the conveyor is associated with the error function εk or not based on Equation (9), where p is the total number of conveyors (CVp) and k is the total number of error equations (εk) for a given plant configuration. Based on the correlation matrix, two values are calculated for each conveyor present in the system: Conveyor Error Factor (CEF) and Conveyor Error Ratio (CER).
Conveyor Error Factor (
CEF): It indicates the total mean error associated with each conveyor with respect to the entire system and is given by Equation (11).
Conveyor Error Ratio (
CER): It indicates the proportion of the error contributed by each conveyor to the entire system and is given by Equation (12).
The value of the CER is ranked, the conveyor with the higher value is investigated first. The value of CEF indicates the magnitude of the deviation. The impact of this magnitude is dependent on the rated capacity of the conveyor. Based on the values of CER and CEF together, decisions are made:
If the values are within allowed statistical limits, retain the efficiency value of the conveyors. If the values are deviating towards a certain direction, create an alert for operators to inspect the conveyor for any change of physical operation.
If the values are above the allowed limit, recompensate the deviating conveyor with a new value of efficiency. This is carried out by modifying Equation (10) depending on the identified deviating conveyor. In this case, the efficiency value of the deviating conveyor is set as unknown variable(s).
4. Application in Crushing Plant
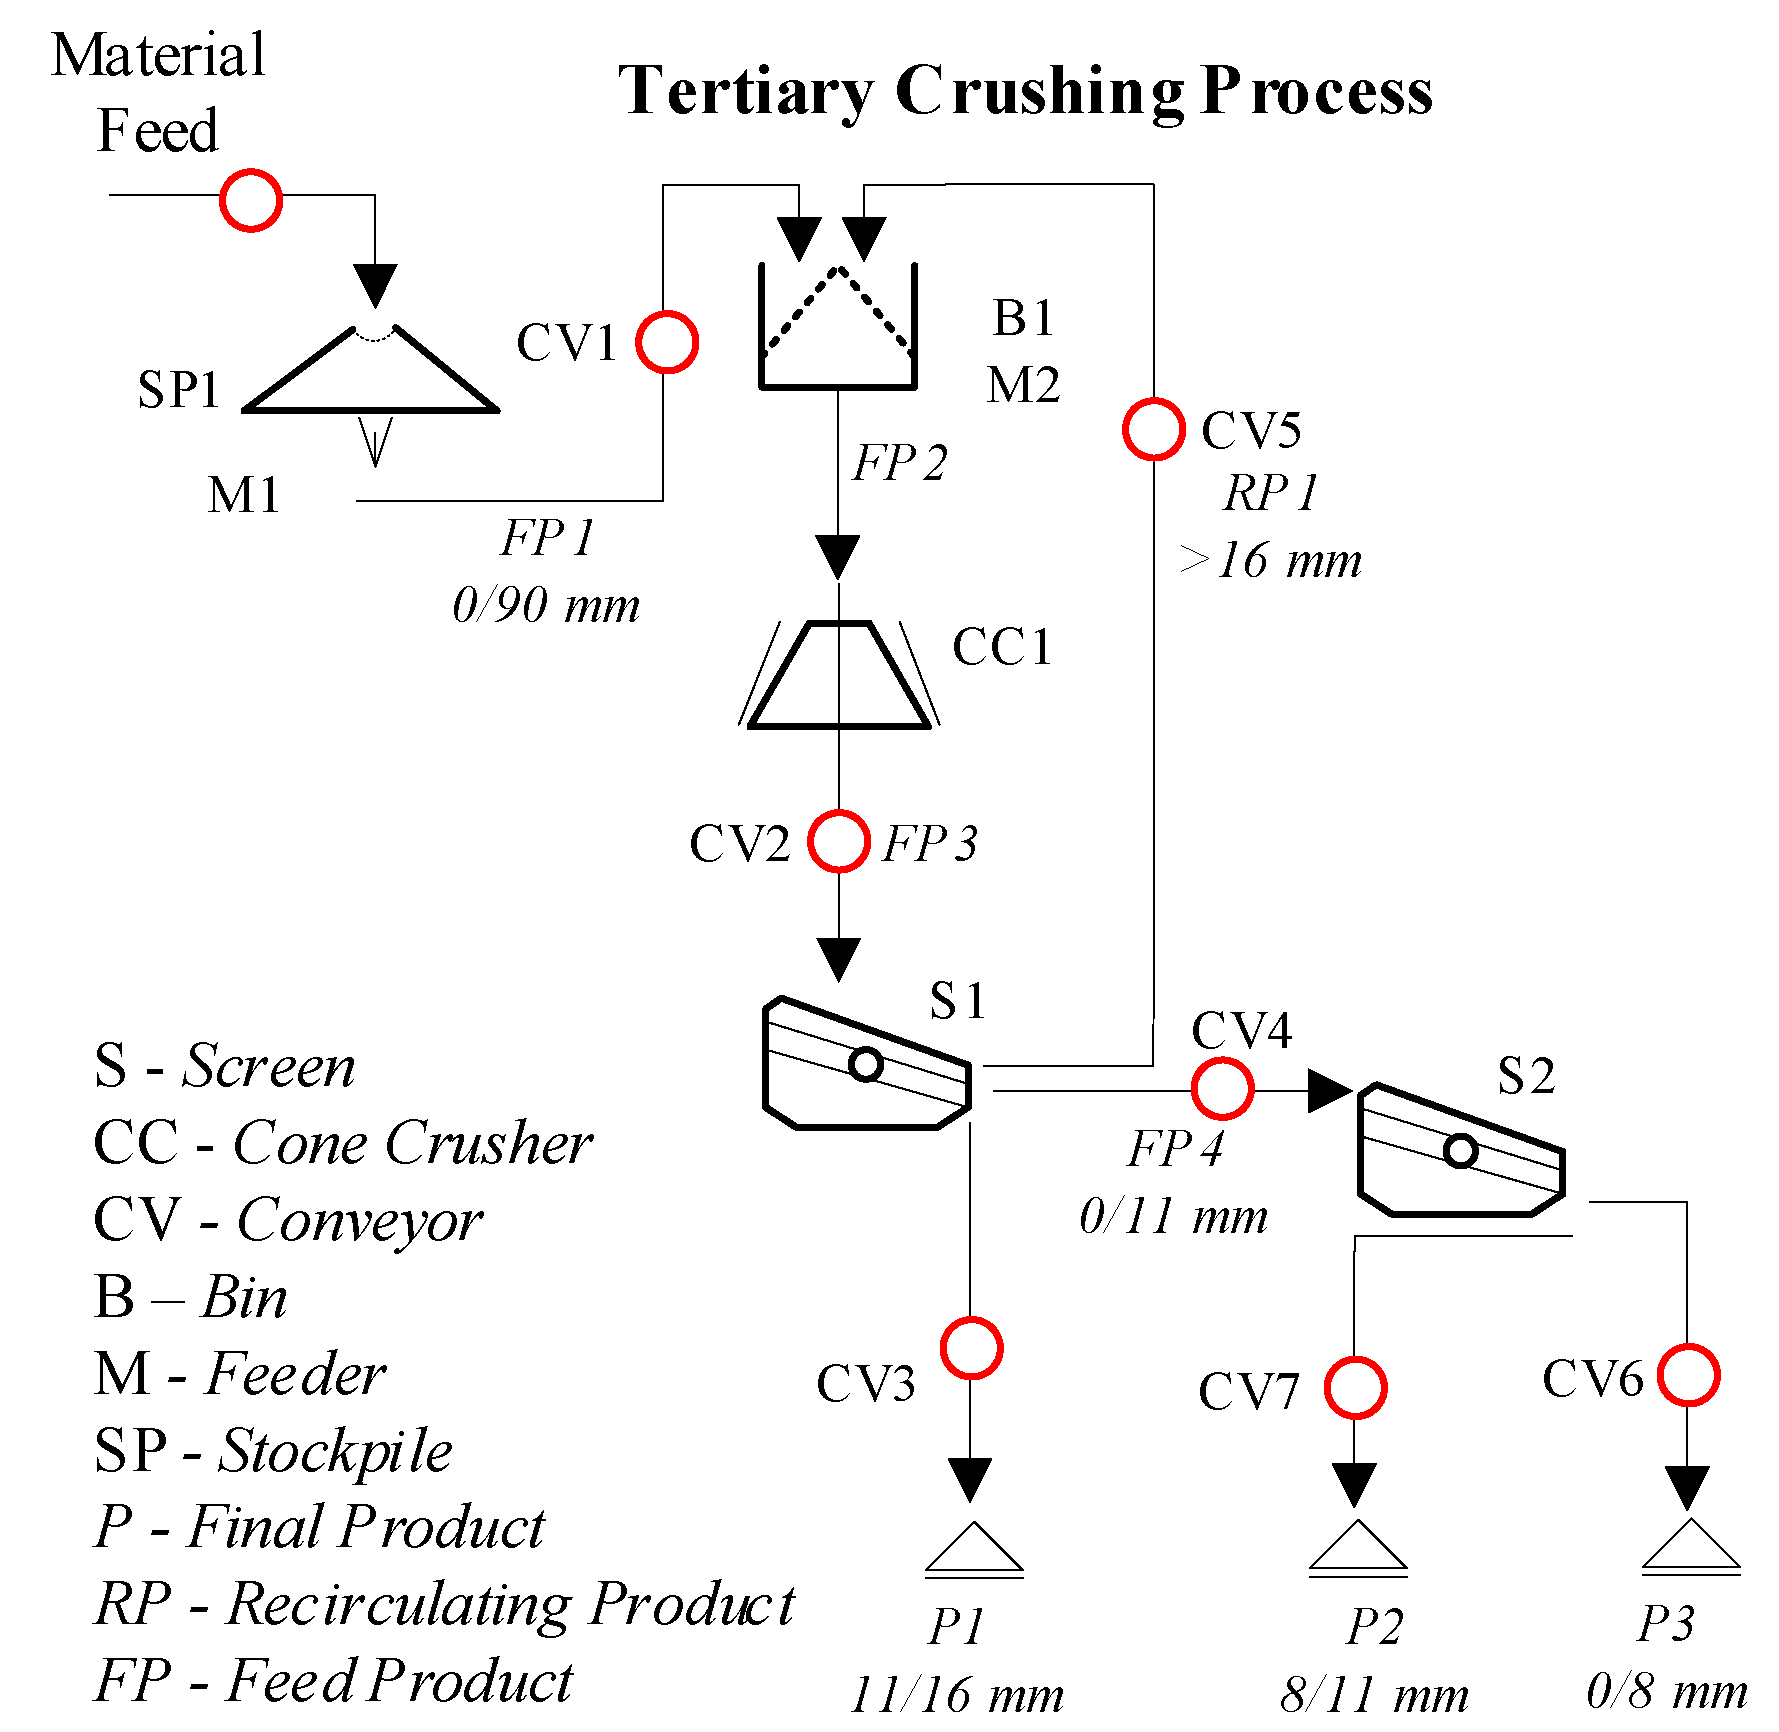
The crushing plant layout used in this research is presented in
Figure 3, which is a tertiary stage of a three-stage aggregate production plant. The crushing plant is operated by NCC Industry and is situated at Uddevalla, Sweden. The material from the stockpile (
SP1) is supplied to the feeder (
M1) to the process, which fills up the bin (
B1) located before the crusher (
CC1—HP4 Crusher). The crusher output is screened by two screens (
S1 and
S2) located sequentially, producing three products (
P1,
P2 and
P3) and one recirculated product (
RP1). The crusher and screens are connected using belt conveyors (
CV1 to
CV7). Each equipment data stream, for example, power draw, machine settings, are centrally connected to the cloud solution [
29]. The data captured are typically recorded at a frequency of 0.1–0.2 Hz. As the process is being operated, the values of the mass flow change with respect to machine settings, material properties, wear, etc.
Table 2 presents the list of various mass measuring units present in the crushing circuit. As presented, the conveyors
CV1 and
CV2 are equipped with the belt scale to measure the mass flow while the conveyors
CV3 and
CV7 rely on power-based belt scales that are calibrated by physical measurement of the mass using a front loader. The conveyor
CV4,
CV5 and
CV6 are also power-based belt scale and are calibrated using mass balancing equations for the circuit.
5. Results
The power-based belt scale calibration and deviation measurement calculations are presented here. A total of 3 days–8 h per day operation data is used. Day 1 data is used for calibration, where controlled data set for calibration was obtained, while Day 2 and Day 3 data is used for verification and deviation calculation.
5.1. Calibration of Accessible Conveyors
The conveyor
CV1 and
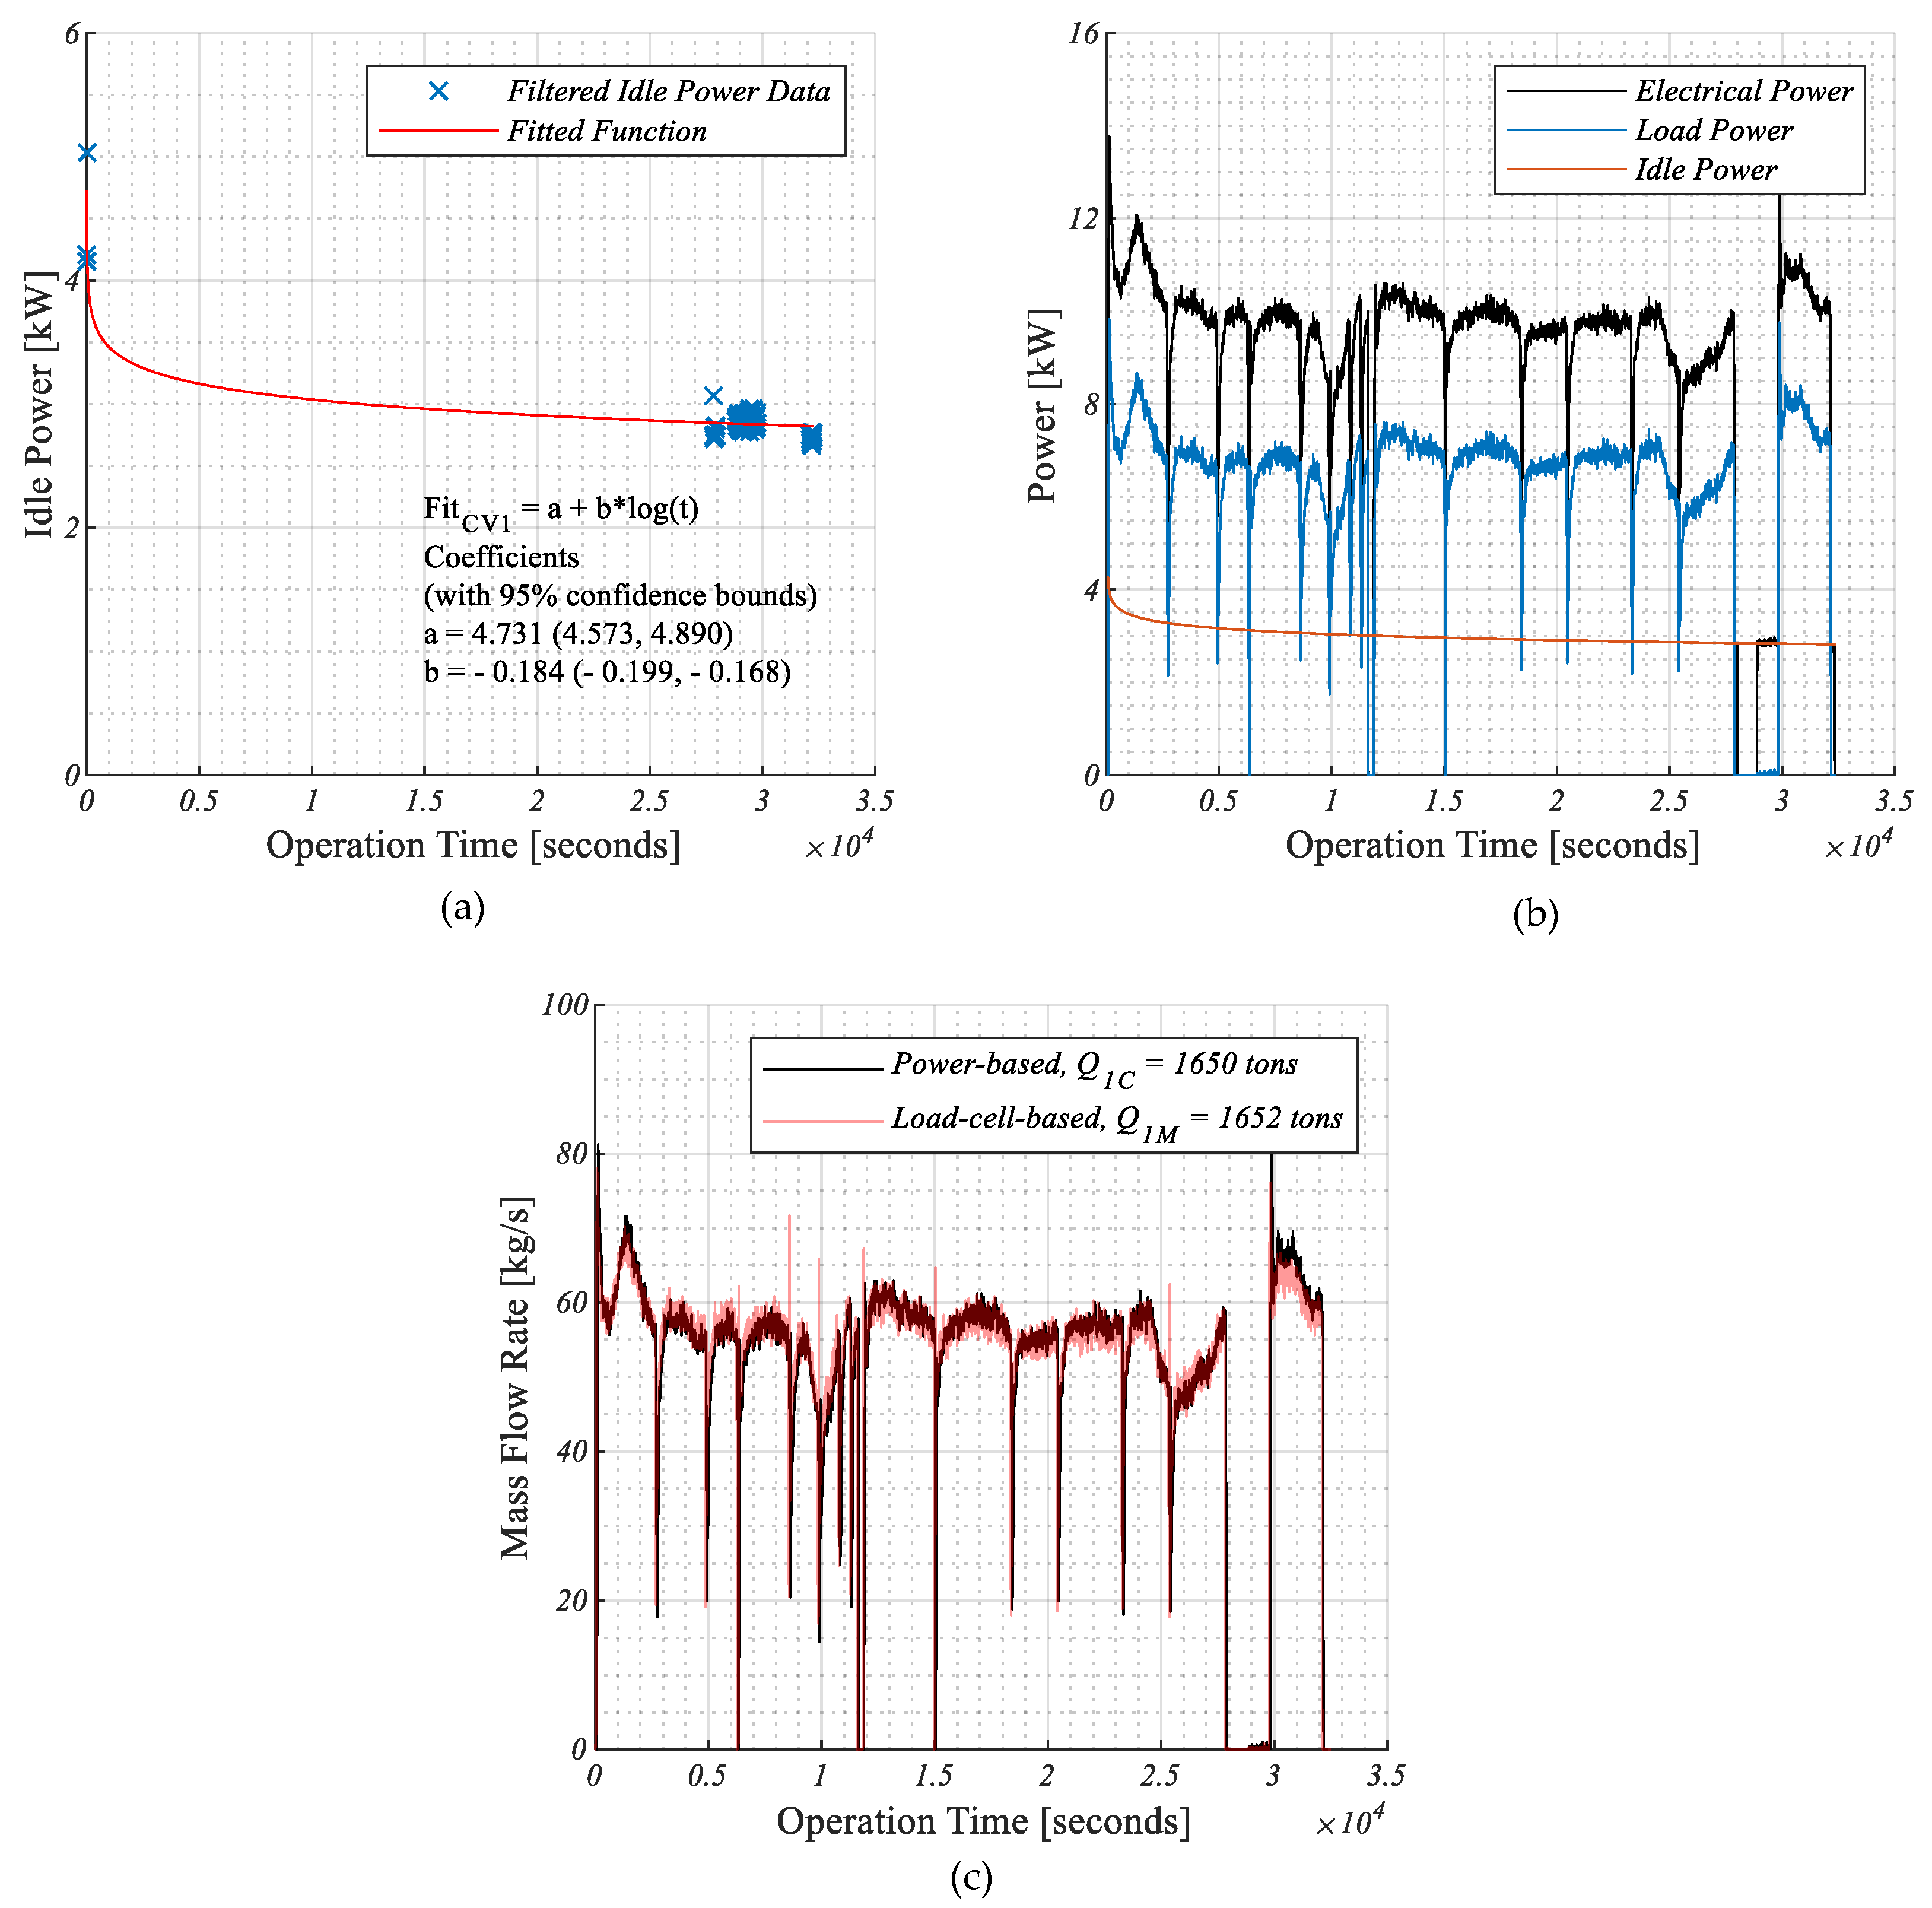
CV2 are calibrated against the reference data of the load-cell-based belt scale. The stepwise calibration process for
CV1 is presented in
Figure 4. The idle power data is filtered from the recorded electrical power signal using a data-filtering algorithm. The idle power data set is used to fit the logarithmic function as shown in
Figure 4a. The fitted function is used to estimate the idle power for the entire day of operation. The recorded electrical power signal and the calculated load power signal are shown in
Figure 4b. Likewise, the load powers for all conveyors are calculated. The load-cell-based reference mass flow data and the calibrated power-based mass flow is shown in
Figure 4c. Similarly, the conveyor
CV2 is calibrated.
The conveyors
CV3 and
CV7 are calibrated against the physical measurement of the accumulated mass for a specified time duration. A front loader was used to collect the mass flow and two samples for each conveyor were obtained. The details of the measured and calculated values are shown in
Table 3. It is observed that the relative error values for these calibrations are in the range of 0–4.5%.
5.2. Calibration of Non-Accessible Conveyors
Using the principle of mass balancing of the circuit, the accumulated mass (
Q) over a given time for each node need to be in an equilibrium state. Six sets of error functions are formulated as shown in Equation (13). The change in bin level at the start to end time is also accounted for in the functions. The total capacity of the bin (
B1) is 30 m
3 and assuming the bulk density of the material as 1.67 tons/m
3, the total capacity of the bin is 50 tons. The material loss during the processing is assumed to be negligible.
The unknown efficiency of conveyor
CV4,
CV5 and
CV6 are obtained by solving the optimization problem shown in Equation (14). The optimization problem was solved using an interior optimum algorithm and the solution converged. It is recommended to start the algorithm at various start points to test if the solution(s) are converging to global minima or not. This can lead to the avoidance of adding preferential errors to the efficiency of the power-based belt scale under calibration. The list of all calibrated conveyor efficiencies is presented in
Table 4.
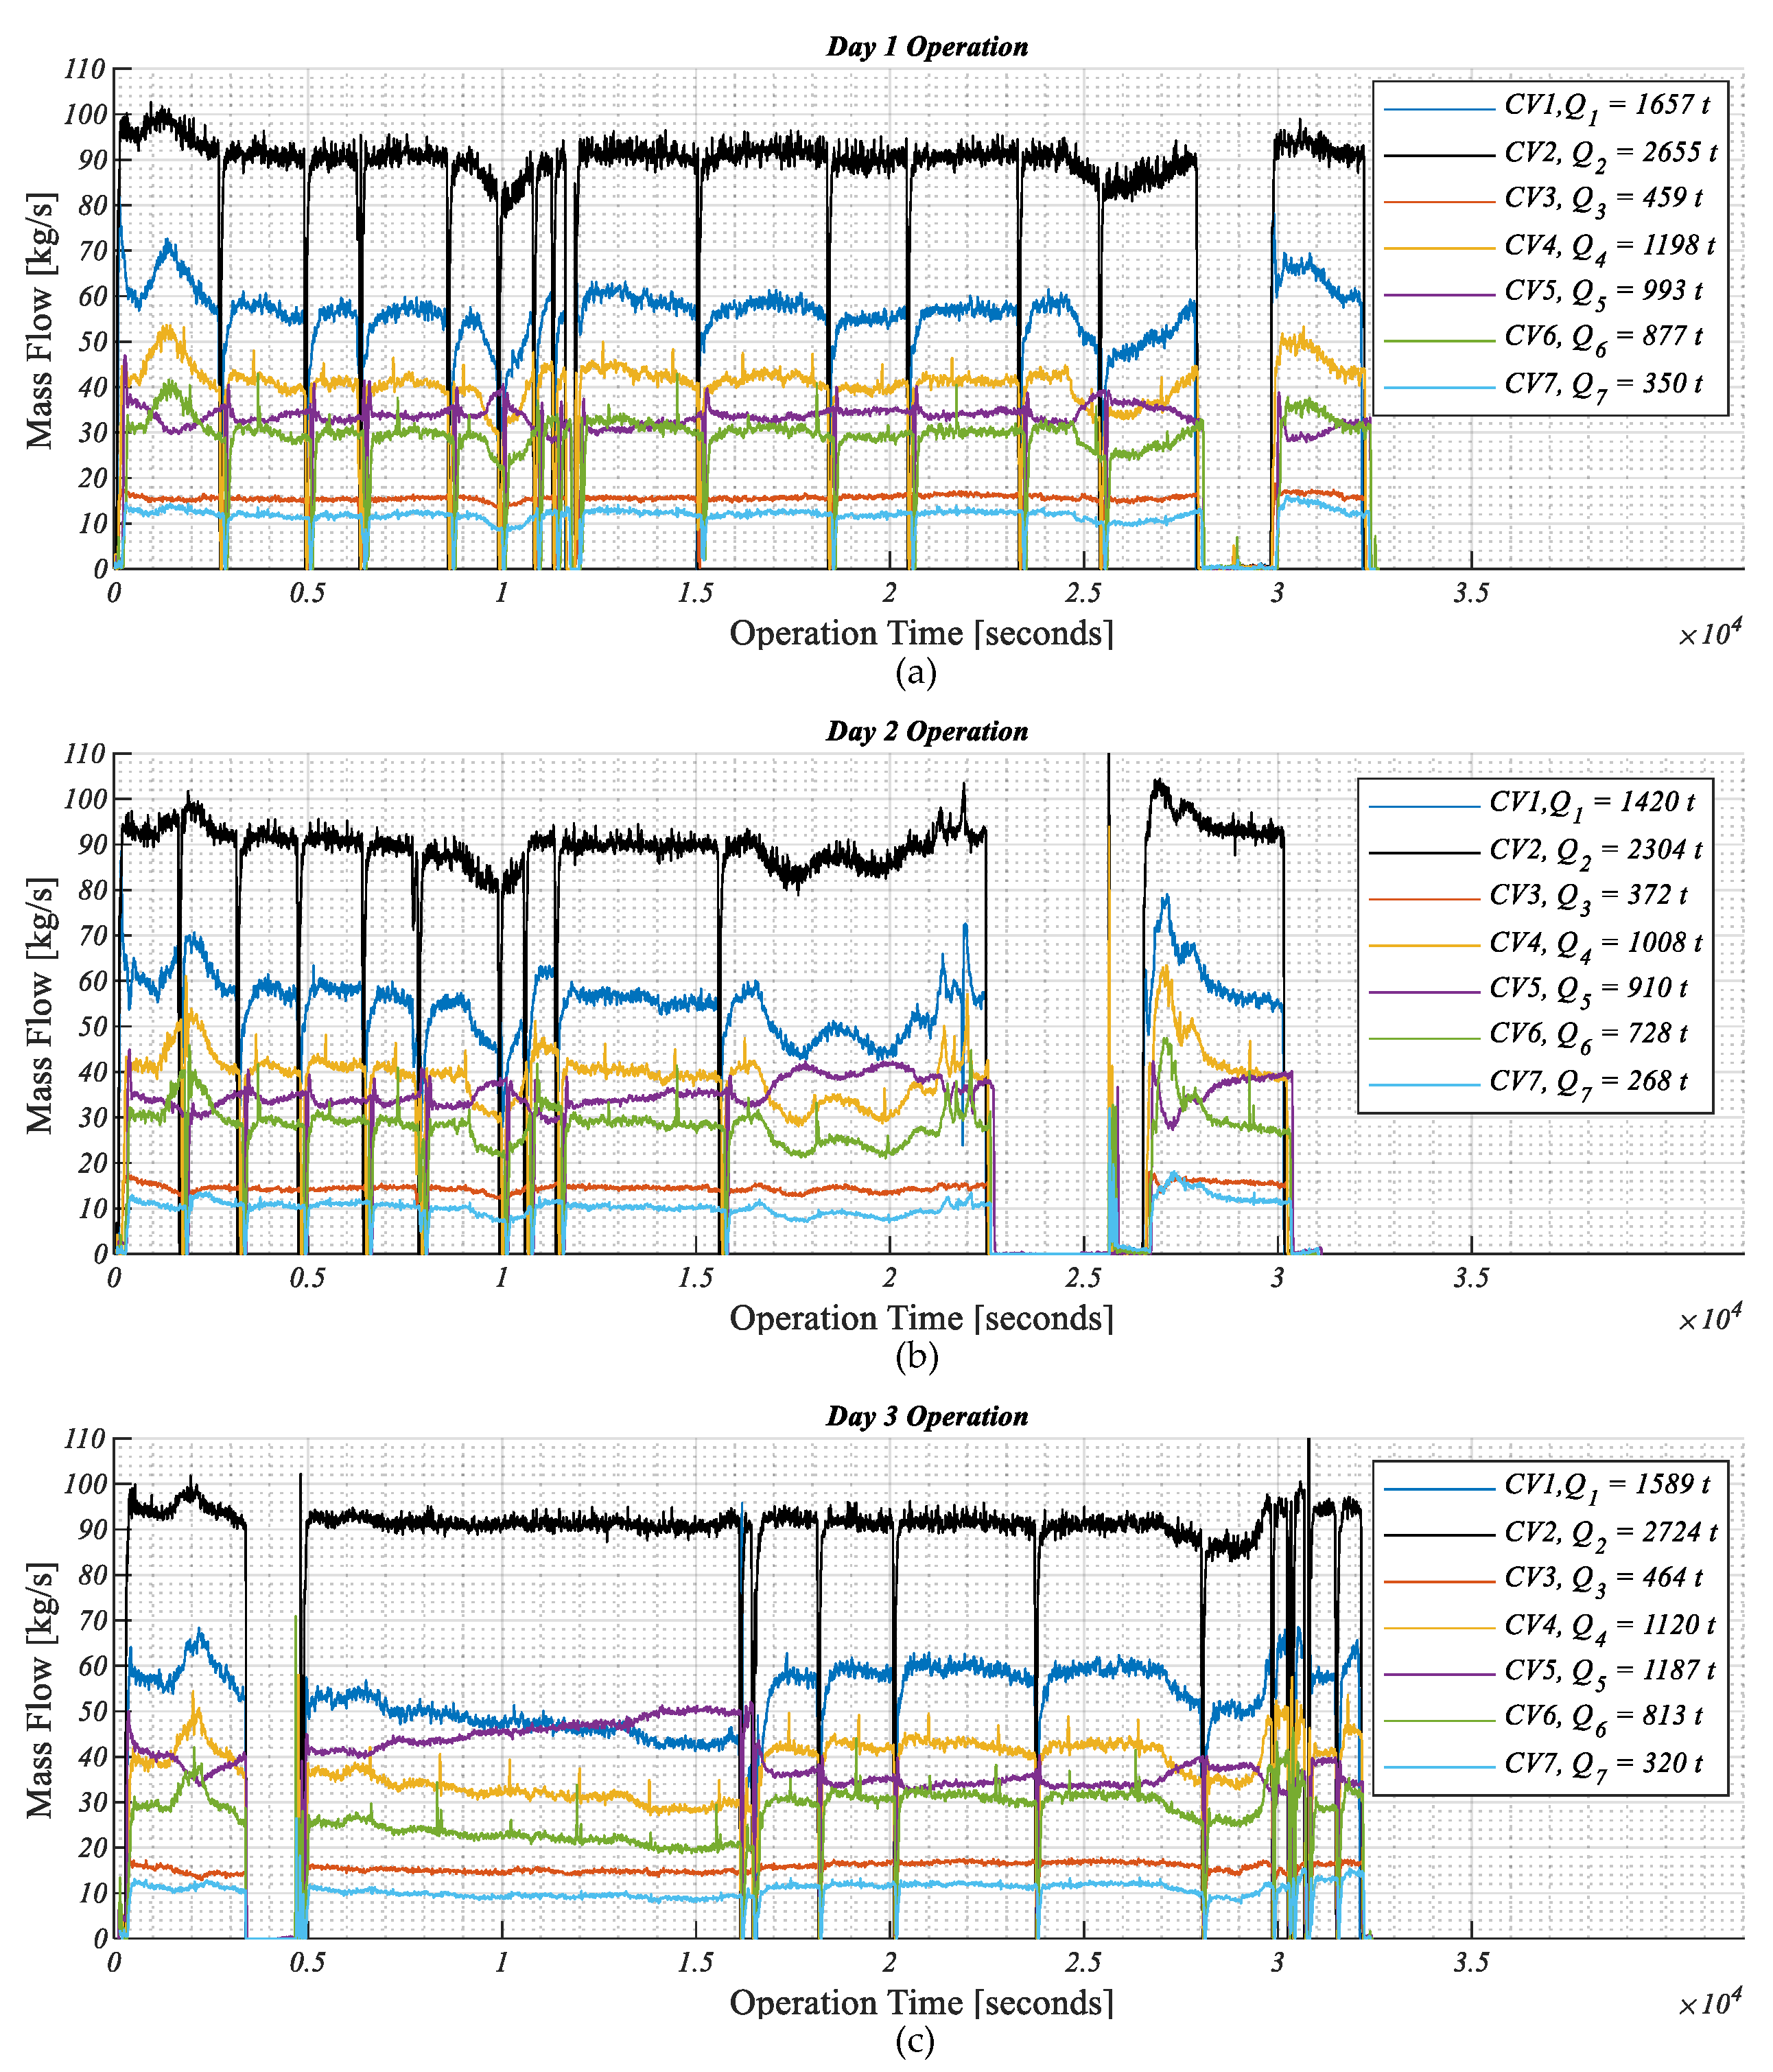
The mass flow recorded from different conveyors for Day 1, 2 and 3 is presented in
Figure 5 respectively. Day 1 data (
Figure 5a) is used to calibrate the efficiencies of the conveyors while Day 2 and Day 3 data (
Figure 5b,c) are used to validate the working of the power-based belt scale. The total accumulated mass for each conveyor is also displayed. It can be noted that there are observable drifts in the mass flow recording on Day 3 which is be related to the crusher operation with regards to the control system.
5.3. Detect Deviation in Mass Flow Measurement
Using the set of mass balancing error functions shown in Equation (13), the correlation matrix
Apk is generated. The correlation matrix (
Apk) together with the value of error functions (ε
k) is used to calculate the
Conveyor Error Factor (
CEF) and the
Conveyor Error Ratio (
CER) as shown in
Table 5.
The CEF and CER provides an initial indication for magnitude and ranking of the deviating conveyor(s), respectively, for starting the investigation process. As it can be noted, the CEF values on Day 1 are low as the data is used for calibration. On Day 2 operational data, the CER indicated the conveyor CV1 and the bin B1 to be contributing to the deviation, although the CEF value is low compared to the total production data and the values are similar to other conveyors. On Day 3, the CER value highlights CV2 and CV5 as top-ranked conveyor contributing to the deviation. Also, the magnitude of CEF is higher than the other conveyors. At this stage, the value of CEF is within 5% of the total accumulated mass of conveyor CV2 and CV5, which can be within the limits of the sensor accuracy (+/−0.5%). Furthermore, longitudinal data of multiple months are needed to set the limit of statistical significance.
To further test the calculation of the correlation matrix, values of
CER and
CEF, two hypothetical test cases were carried out as shown in
Table 6. The efficiency value of the conveyor
CV4 and
CV7 were changed by 10 % in Test 1 and 2, respectively. The method detected
CV4 to be deviating and the magnitude of
CEF was also significantly increased. For Test 2, changing
CV7 resulted in an alert for both
CV6 and
CV7 because of the possible relations which are created using the correlation matrix. This is limited by the virtue of plant layout and conveyor connections. Also, it is observed between Test 1 and 2, the magnitude of
CEF is dependent on the size and capacity of the conveyor as
CV4 is of higher capacity than
CV7 which need to account into the decision for conveyor recalibration.
6. Discussion
The development within the Internet of Things (IoT) is one of the underlying factor attributing towards making digitalization innovation [
30]. The development of a data collection system for the aggregate production industry can drive it towards industry 4.0. The presented methodology of conveyor calibration and deviation measurements is one of the building blocks in achieving a complete digital support system for an aggregate production plant.
The optimization problem formulation for the non-accessible conveyors is based on the circuit property of mass balancing and is also in line with the data-reconciliation methods applied [
19,
22]. However, the problem definition is simpler for aggregates processing compared to minerals processing. The modification of the sensor variables such as the efficiency of the power-based belt scale is proposed using the data reconciliation. The optimization problem (See Equation (10)) can be made more flexible by changing the objective function or by adding error function(s) as constraint(s) to allow for variability in the system. The objective function for error minimization can be posed as a weighted-sum approach based on historical data such as conveyor performance, maintenance, and their associated error function. As the first order error function at nodes (See Equation (13),
ε1 and
ε2) can be of higher importance as compared to the second-order error function derived by a combination of two error functions (See Equation (13),
ε6). Further investigations are needed to check these possibilities and capture longitudinal validation of the mass flow data. The current work is limited to perform statistical analysis of the variance and distribution of the data.
The correlation matrix is a function of the plant layout. The correlation matrix represents a relationship between the conveyors and the error associated with the circuit mass balancing. If the plant layout is highly coupled, based on the mass balancing, several error equations can be formulated. For example, if the circuit is closed with recirculating load, then the set of representative mass balancing equation increases. Depending on the plant configuration, the implementation of the deviation measurements equations needs to be adjusted. The application of the correlation matrix and deviation measurements can also be extended to other mass flow measurement techniques such as load-cell belt scale, laser sensor and ultrasonic sensor. The deviation measurement can also be used as a smart maintenance alert system. This can be used to send a notification to the operator or plant manager to check the physical change in the conveyor operations. The operator can perform checks such as observing conveyor alignment, roller and belt contact, jammed material in conveyor, wear, and so on to investigate the deviating conveyor. Other aspects that can add value to this are feedback from stockpile data of accumulated mass which can further cross-validate the measurements. If there is no reasonable cause for the deviation, the operator can choose to re-calibrate the system for the deviating conveyor. In this case, it is assumed that the deviation is caused by a gradual change in the total efficiency of the conveyor.
From the industrial point of view, the major benefit of the proposed method is that it could create a reliable mass flow measurement with less intervention. That will, in turn, give more accurate follow up of production rates and stock values, giving the possibility to make fact-based decisions on how to set up the production process. A system that detects deviations in the mass flow balance would probably also work well in detecting errors in the process that are normally not detected by the current control system. One example could be a hole in a chute after a screen causing contamination between two products which could generate large costs if it is not detected at once. The next step with the work is to evaluate the statistical limits for the deviation measurements and test the methodology for a longer period (month, year).
The methodology will be evaluated for a real-time/online system, wherein recent historic data can be continuously evaluated (moving deviation measurements) [
31]. One possibility is to reduce the calculation window for deviation measurement from 1 day of accumulated mass to a smaller time window such as 1 h, 30 min or 10 min. Aspects that could be in consideration here are residence time of the material in the various equipment, delays due to stops in the process, etc. This can also enable the controlling of the aggregate production process using Key Performance Index (KPI) such as Overall Equipment Effectiveness (OEE) [
9], wherein the underlying data set are of higher quality and confirms the mass balancing property of the system. The potential advantage with the implementation of such a solution is that it can be a cost-efficient solution that can potentially reduce the number of physical calibrations required for a power-based belt scale. This implies the reduced downtime of the system and can enable condition-based maintenance instead of corrective maintenance. The method needs to be evaluated for its robustness using a longitudinal study.
7. Conclusions
The research paper presented an application of the optimization method for the calibration and maintenance of the power-based belt scales. Furthermore, a novel approach towards tracking deviation in the mass flow measurements using the correlation matrix is presented. The method is dependent on the plant layout and mass flow connections and uses the mass balancing property of the crushing plant operation. The accuracy in the mass flow system is assured by performing a careful calibration process for both accessible and non-accessible conveyors. The reliability of the system is improved by monitoring the deviation in measurement. Periodic calibration of the accessible conveyors is also required to maintain trust within the data collection system. This is a step towards developing a robust mass measurement solution where the system can detect changes. The proposed methodology can lead to design rules for the implementation of an automatic calibrating mass flow system using a power-based belt scale technique.
Author Contributions
Conceptualization, K.B. and G.A.; methodology, K.B., G.A. and E.H.; software, K.B.; validation, K.B.; formal analysis, K.B., G.A., E.H. and M.E.; investigation, K.B. and G.A.; resources, E.H. and K.H.; data curation, K.B. and G.A.; writing—original draft preparation, K.B.; writing—review and editing, G.A., E.H., K.H. and M.E.; visualization, K.B.; supervision, G.A., E.H. and M.E.; project administration, E.H.; funding acquisition, E.H. and K.H. All authors have read and agreed to the published version of the manuscript.
Funding
This research was funded by Svenska Byggbranschens Utvecklingsfond (SBUF), Project Number: 13753 (Development Fund of the Swedish Construction Industry).
Institutional Review Board Statement
Not applicable.
Informed Consent Statement
Not applicable.
Data Availability Statement
Restrictions apply to the availability of these data. Data was obtained from NCC Industry AB and are available from the authors with the permission of NCC Industry AB.
Acknowledgments
This work has been performed under the project: “Optimering av verkliga processer för bergmaterialproduktion” and supported financially by “Svenska Byggbranschens Utvecklingsfond”—SBUF, Project Number: 13753 (Development Fund of the Swedish Construction Industry). NCC Industry and their personnel in Glimmingen, Uddevalla are gratefully acknowledged for all their support and efforts to make this work possible. Support from Roctim AB and their personnel are gratefully acknowledged. This work has been performed within the Sustainable Production Initiative and the Production Area of Advance at Chalmers; this support is gratefully acknowledged.
Conflicts of Interest
The authors declare no conflict of interest. The funders had no role in the design of the study; in the collection, analyses, or interpretation of data; in the writing of the manuscript, or in the decision to publish the results.
References
- Bhadani, K. Optimization Framework for Crushing Plants; Chalmers University of Technology: Gothenburg, Sweden, 2019. [Google Scholar]
- Evertsson, C.M. Cone Crusher Performance; Chalmers University of Technology: Gothenburg, Sweden, 2000. [Google Scholar]
- Whiten, W.J. The simulation of crushing plants with models developed using multiple spline regression. J. S. Afr. Inst. Min. Metall. 1972, 72, 257–264. [Google Scholar]
- Napier-Munn, T.J.; Morrell, S.; Morrison, R.D.; Kojovic, T. Mineral Comminution Circuits: Their Operation and Optimisation; Julius Kruttschnitt Mineral Research Centre, The University of Queensland: Indooroopilly, QLD, Australia, 1996. [Google Scholar]
- Asbjörnsson, G. Crushing Plant Dynamics; Chalmers University of Technology: Gothenburg, Sweden, 2015. [Google Scholar]
- King, R.P. Modeling and Simulation of Mineral Processing Systems; Elsevier Science: Amsterdam, The Netherlands, 2001. [Google Scholar]
- Hulthén, E. Real-Time Optimization of Cone Crushers; Chalmers University of Technology: Gothenburg, Sweden, 2010. [Google Scholar]
- Napier-Munn, T.J. Statistical Methods for Mineral Engineers—How to Design Experiments and Analyse Data; Julius Kruttschnitt Mineral Research Centre, The University of Queensland: Brisbane, Australia, 2014; Volume 5, p. 627. [Google Scholar]
- Bhadani, K.; Asbjörnsson, G.; Hulthén, E.; Evertsson, C.M. Development and implementation of key performance indicators for aggregate production using dynamic simulation. Miner. Eng. 2020, 145, 106065. [Google Scholar] [CrossRef]
- Bhadani, K.; Asbjörnsson, G.; Hulthén, E.; Evertsson, C.M. Application of multi-disciplinary optimization architectures in mineral processing simulations. Miner. Eng. 2018, 128, 27–35. [Google Scholar] [CrossRef]
- Huband, S.; Barone, L.; Hingston, P.; While, L.; Tuppurainen, D.; Bearman, R. Designing comminution circuits with a multi-objective evolutionary algorithm. In Proceedings of the 2005 IEEE Congress on Evolutionary Computation, Edinburgh, UK, 2–5 September 2005; IEEE CEC 2005 Proceedings. pp. 1815–1822. [Google Scholar]
- Huband, S.; Tuppurainen, D.; While, L.; Barone, L.; Hingston, P.; Bearman, R. Maximising overall value in plant design. Miner. Eng. 2006, 19, 1470–1478. [Google Scholar] [CrossRef]
- Svedensten, P. Crushing Plant Performance; Chalmers University of Technology: Gothenburg, Sweden, 2007. [Google Scholar]
- While, L.; Barone, L.; Hingston, P.; Huband, S.; Tuppurainen, D.; Bearman, R. A multi-objective evolutionary algorithm approach for crusher optimisation and flowsheet design. Miner. Eng. 2004, 17, 1063–1074. [Google Scholar] [CrossRef]
- Bhadani, K.; Asbjörnsson, G.; Hulthén, E.; Bengtsson, M.; Evertsson, M. Comparative Study of Optimization Schemes in Mineral Processing Simulations. In Proceedings of the XXIX International Mineral Processing Congress, Moscow, Russia, 17–20 September 2018. [Google Scholar]
- Hulthén, E.; Evertsson, C.M. A cost effective conveyor belt scale. In Proceedings of the 11th European Symposium on Comminution, Budapest, Hungary, 9–12 October 2006. [Google Scholar]
- Väyrynen, T. Mass Flow Estimation in Mineral Processing Applications; Tampere University of Technology: Tampere, Finland, 2013. [Google Scholar]
- Itävuo, P.; Hulthén, E.; Yahyaei, M.; Vilkko, M. Mass balance control of crushing circuits. Miner. Eng. 2019, 135, 37–47. [Google Scholar] [CrossRef]
- Hodouin, D.; Vaz Coelho, S. Mass balance calculations around mineral processing units using composition analyses within particle-size classes. Int. J. Miner. Process. 1987, 21, 65–82. [Google Scholar] [CrossRef]
- Hodouin, D.; Makni, S. Real-time reconciliation of mineral processing plant data using bilinear material balance equations coupled to empirical dynamic models. Int. J. Miner. Process. 1996, 48, 245–264. [Google Scholar] [CrossRef]
- Sadeghi, M.; Hodouin, D.; Bazin, C. Mineral processing plant data reconciliation including mineral mass balance constraints. Miner. Eng. 2018, 123, 117–127. [Google Scholar] [CrossRef]
- Hodouin, D.; Alliot, N.; Flament, F. Redundancy analysis of complex sets of mineral processing data for mass balance computation. Int. J. Miner. Process. 1991, 32, 213–231. [Google Scholar] [CrossRef]
- Hodouin, D.; Flament, F.; Bazin, C. Reliability of material balance calculations a sensitivity approach. Miner. Eng. 1989, 2, 157–169. [Google Scholar] [CrossRef]
- Vasebi, A.; Poulin, É.; Hodouin, D. Selecting proper uncertainty model for steady-state data reconciliation–Application to mineral and metal processing industries. Miner. Eng. 2014, 65, 130–144. [Google Scholar] [CrossRef]
- Kapur, P.C.; Agrawal, M.; Fuerstenau, D.W. A two-tier approach to the mass balance of multi-level mineral processing data. Part 1: Performance index and local balance around a node. Int. J. Miner. Process. 1993, 39, 209–223. [Google Scholar] [CrossRef]
- Kapur, P.C.; Kumar, A.; Fuerstenau, D.W. A two-tier approach to the mass balance of multi-level mineral processing data. Part 2: Splicing of stream flows and global balance over a circuit. Int. J. Miner. Process. 1993, 39, 225–237. [Google Scholar] [CrossRef]
- Crowe, C.M. Data reconciliation—Progress and challenges. J. Process Control 1996, 6, 89–98. [Google Scholar] [CrossRef]
- Morin, D. Introduction to Classical Mechanics: With Problems and Solutions; Cambridge University Press: Cambridge, UK, 2008. [Google Scholar]
- Roctim, A.B. Roctim Cloud. Available online: https://www.roctim.com/cloud (accessed on 1 March 2020).
- Kusiak, A. Smart manufacturing. Int. J. Prod. Res. 2018, 56, 508–517. [Google Scholar] [CrossRef]
- Lu, S.; Tu, Y.C.; Lu, H. Predictive condition-based maintenance for continuously deteriorating systems. Qual. Reliab. Eng. Int. 2007, 23, 71–81. [Google Scholar] [CrossRef]
| Publisher’s Note: MDPI stays neutral with regard to jurisdictional claims in published maps and institutional affiliations. |
© 2021 by the authors. Licensee MDPI, Basel, Switzerland. This article is an open access article distributed under the terms and conditions of the Creative Commons Attribution (CC BY) license (https://creativecommons.org/licenses/by/4.0/).


 ,
, 


