Article

Gold in the Farallones Block of the Shale-Hosted, Clastic-Dominated Castellanos Zinc-Lead Deposit (Northwest Cuba)

1
Department of Geology, Universidad de Pinar del Río Hermanos Saiz Montes de Oca, Pinar del Rio 20100, Cuba
2
Department of Mineralogy and Petrology, Instituto Andaluz de Ciencias de la Tierra (UGR-CSIC), Faculty of Sciences, Universidad de Granada, 18071 Granada, Spain
3
Department of Mineralogy and Petrology, Faculty of Geological Sciences, Universidad Complutense de Madrid, 28040 Madrid, Spain
4
Department of Geodynamics, Faculty of Sciences, Universidad de Granada, 18071 Granada, Spain
*
Author to whom correspondence should be addressed.
Minerals 2021, 11(4), 414; https://doi.org/10.3390/min11040414
Submission received: 9 February 2021 / Revised: 3 April 2021 / Accepted: 12 April 2021 / Published: 14 April 2021

Abstract

:
The Zn-Pb ores of the Castellanos shale-hosted, clastic-dominated deposit in northwest Cuba average nearly 1 g/t Au, with local maximum concentrations up to 34 g/t Au. This deposit is stratiform with respect to the bedding in the host black shales and shows a bottom to top zoning of ore assemblages made up of a stockwork underlying the main orebody, a basal pyrite-rich zone and a disseminated to massive Zn-Pb ore zone capped by a discontinuous, thin barite-rich zone. Petrographic data and textural relations allow distinguishing five textural types of pyrite (framboidal Py I, colloform Py IIa, euhedral Py IIb, massive Py IIc and banded colloform Py III) successively formed during ore deposition. The main Zn-Pb ore formed after the crystallization of disseminated, sedimentary framboidal pyrite (Py I) in black shales by the superimposition of several crystallization events. The crystallization sequence of the main ore-forming stage evolved from the precipitation of colloform sphalerite and pyrite (Py IIa) with skeletal galena and interstitial dolomite-ankerite to similar ore assemblages but showing subhedral to euhedral crystal habits (Py IIb) and interstitial calcite-rich carbonates. This stage ended with the development of massive pyrite (Py IIc), mainly occurring at the base of the stratiform orebody. A late fracturing stage gave way to the development of a new generation of colloform banded pyrite (Py III) just preceding the crystallization of early barite. Au is mainly concentrated in pyrite showing variable contents in the different textural types of pyrite and a bottom to top enrichment trend. Minimum contents occur in massive pyrite (Py IIc) from the basal pyrite-rich zone (0.18 ppm Au average), increasing in pyrite IIa (from 0.29 to 2.86 ppm Au average) and in euhedral pyrite (Py IIb) (from 0.82 to 9.02 ppm Au average), reaching maxima in colloform banded pyrite (Py III) formed just before the crystallization of early barite at the top of the orebody. Au enrichment in pyrite correlates with that of Sb (0.08–4420 ppm), As (0.7–35,000 ppm), Ag (0.03–1560 ppm) and to a lesser extent Cu (3–25,000 ppm), Ni (0.02–1600 ppm) and Mn (0.6–5030 ppm). Au deposition should have taken place by oxidation and, probably cooling, of reduced (H2S-dominated) fluids buffered by organic matter-rich black shales of the host sedimentary sequence. The input of such reduced fluids in the ore-forming environment most probably occurred alternating with that of the main oxidized fluids which leached Zn and Pb from the large volume of sandstones and siltstones making up the enclosing sequence, thus being responsible for the precipitation of the majority Zn-Pb ore. Supply of Au-carrying reduced fluids might progressively increase over the course of ore formation, reaching a maximum at the beginning of the late fracturing stage. This evolution of Au supply is consistent with the early crystallization of barite since Ba can also only be transported at low temperature by highly reduced fluids. These results highlight the potential of medium-sized, shale-hosted, clastic-dominated deposits to contain economic (by product) Au amounts and show that ore-forming fluids can change from oxidized (SO42+ dominated) to reduced (H2S-dominated), and vice versa, throughout the evolutionary history of a single deposit.

1. Introduction

Traditionally, shale-hosted, clastic-dominated Zn-Pb deposits (especially those interpreted as sedimentary exhalative) have not been viewed as metallogenic environments favorable for Au enrichment due to the lack of a magmatic component in the fluids, the low temperature and the fact that this element is usually transported as a bisulfide complex that lowers the solubility of Zn-Pb chloride complexes [1]. There are, however, a few of these deposits worldwide (e.g., Rammelsberg in Germany, Triumph in USA, and Anvil district and Sullivan in Canada) that average ~1ppm Au and have produced the byproduct Au [1]. Additionally, some occurrences in Nevada contain Au enough to be considered as shale-hosted, clastic-dominated-type Au occurrences [2] and a set of sulfide-rich samples of sediments from the Atlantis II Deep in the Red Sea (a modern system with some similarities to sediment-hosted exhalative environment) averages 2.4 ppm Au [3]. Au occurs as native grains and electrum associated with galena and tetrahedrite in Rammelsberg [4]. In the Nevada occurrences, Au occurs as native grains (<1 mm in diameter) in tetrahedrite, pyrite, chalcopyrite and barite, and free in mudstone and barite nodules, as well as in solid solution in chalcopyrite, tetrahedrite and to a lesser extent in pyrite [1].
Varying proportions of base metals, barite, and Au were used by [1] to identify a spectrum of shale-hosted, clastic-dominated, mainly exhalative deposits that includes very large Pb-Zn-Ag deposits, intermediate Pb-Zn-Ag-Ba ± Au deposits, and barite deposits with low base metals ± Au. Ultimately, this spectrum is believed to reflect the concentration and redox state of sulfur in the ore forming brine. For instance, it is well-known that Zn and Pb concentrations in brines decrease by several orders of magnitude in the presence of moderate contents of H2S. Conversely, H2S in sedimentary brines dramatically increases the solubility of Au and Ba [1,2,5].
The Castellanos deposit has many of the characteristics of intermediate shale-hosted, clastic-dominated Pb-Zn-Ag-Ba ± Au deposits, containing around 12 Mt of ore [6] with 6.76% Zn, 3.39% Pb, 0.1% Cu, 53.3 g/t Ag, 0.82 g/t Au on average, and high Ba. Some Au concentration maxima (up to 34 g/t) were measured in ancient core samples drilled in a fractured zone located close to a major fault but no data are available on the spatial distribution of Au in the mineralized zone or on Au speciation in Zn-Pb ores. Thus, this paper aims to solve these two issues through: (1) a deep petrographic study oriented to understand the sequence of ore deposition; (2) a systematic scanning of polished sections of samples representative of the different mineralized zones by means of EDS and environmental electron microscopy, to detect and identify the presence of Au minerals, and (3) a LA-ICP-MS analysis coupled with acquisition of trace element distribution maps on pyrite and, to a lesser extent, sphalerite and galena from a selected set of samples. Since no trace element data on ore-forming sulfides are currently available from shale-hosted, clastic-dominated Zn-Pb deposits, these latter analyses will constitute a novel approach to understand the mineralogy and chemistry of such deposits. Gathering of the expected results will help to reach an additional aim focused on the identification of the physicochemical evolution of this particular ore forming system which may lead to accumulate Au in related deposits.

2. Geological Setting

The Castellanos Zn-Pb deposit is hosted by black shales intercalated in the upper part of a thick siliciclastic sequence, namely the San Cayetano Formation [7,8,9,10], in the Pinar del Río province of northwest Cuba (Figure 1). This formation, together with the Jagua, Guasasa, Esperanza and Pons Formations in the Sierra de Los Órganos area, are part of the so-called Guaniguanico Terrane which includes all slightly metamorphosed and deformed sedimentary rocks of Jurassic-Cretaceous age. All these formations were deposited at the western margin of the Proto-Caribbean basin, thus constituting a portion of the southern passive margin of the North American plate [11].
The San Cayetano Formation is a Lower to Middle Jurassic fluvio-deltaic sequence mainly made up of sandstones and siltstones, with gray, purple and black shale intercalations [7,12,13]. Field work in the Sierra de Los Organos revealed a minimum thickness of ~3400 m, although the real figure could be significantly higher taking into account that the base of this formation does not crop out and its deposition could have started at Triassic time (e.g., [13]). The studied sequence between Minas de Matahambre and Santa Lucía (Figure 1 and Figure 2) is made up of a lower section (~1200 m thick) dominated by sandstones and siltstones with thin shale and locally microconglomerate intercalations. This lower section hosts one of the most important and historic mineral deposit in the region, namely the Matahambre Cu vein-type deposit (Figure 1 and Figure 2) [13,14]. Overlying the lower section, a ~400 m-thick succession of shales crops out which, in turn, underlies the upper 1800 m-thick section, again dominated by sandstones and siltstones but containing numerous and thick black shale intercalations (some of them with nodules of low crystalline carbon and vitrinite). Two of these shale packages host the Castellanos and Santa Lucía Zn-Pb stratiform deposits.
The Upper Jurassic–Upper Cretaceous rocks of the region consist of limestones (locally bituminous) and some dolostones with intercalations of shales, sandstones, siltstones, anhydrite layers and basalts, which are grouped into four formations (from bottom to top): Jagua, Guasasa, Esperanza and Pons (Figure 2). The sedimentary environment of these rocks evolved from a shallow carbonate platform including anoxic lagoons (Jagua Formation) and tidal flats with evaporite precipitation (lower section of Guasasa Formation) to deeper, slope-related settings where carbonate sedimentation predominated over terrigenous supply (upper section of the Guasasa Formation and Pons Formation [15]. These formations are currently overthrusted by the San Cayetano formation (Figure 1).
The San Cayetano Formation was folded during Paleocene-Eocene time giving rise to SE-vergent, hectometric-scale folds [17,18] formed at very low-grade metamorphic conditions (<200 °C [12]). This ductile deformation could also have caused the top-to-SE thrusting that superimposed the San Cayetano over the Jagua, Guasasa and Pons formations. Although brittle deformation in the region deserves a more detailed study, preliminary investigations in the area of the Castellanos Mine show the presence of several fault systems with still undefined age and relative chronology. Nevertheless, it is worth mentioning a set of NW-SE-oriented faults considered synsedimentary by [13]; one of these faults splits the Castellanos Zn-Pb orebody into two mineralized blocks.

3. Methods

The mineralogy and texture of 54 samples from the Castellanos orebody were investigated using plane-polarized, transmitted- and reflected-light microscopy, as well as by means of environmental scanning electron (ESEM) microscope (Quanta 400 by Thermofisher-FEI with EDS XFlash by Bruker, equipped with a XFlash 6/30 detector) and field-emission environmental scanning electron (FE-ESEM) microscope (Qemscan 650FEG by Thermofisher-FEI with Dual EDS XFlash by Bruker, equipped with a XFlash 6/30 detector) at the Center for Scientific Instrumentation of the University of Granada, working under backscattered electron mode combined with systematic EDS analyses.
Au and other trace elements were investigated on different textured pyrite, as well as on some crystals of sphalerite and galena from six samples by in situ laser ablation-inductively coupled plasma-mass spectrometry (LA-ICP-MS). Analyses were performed at the LabMaTer of the Université du Quebec à Chicoutimi, Canada using an Excimer 193-nm RESOlution M-50 laser ablation system (Applied Spectra, West Sacramento, CA, USA) equipped with a double volume cell S-155 (Laurin Technic Pty Ltd., Narrabundah, Australia) and coupled with an Agilent 7900 mass spectrometer (Agilent Technologies, Santa Clara, CA, USA). Samples and reference materials were placed in the chamber together, and the reference materials were run before and after the session. The spectra were collected for 30 s with the laser switched off to determine the base line. Then, spots on individual areas of selected pyrite were made using a laser beam size of 33 μm, a laser frequency of 15 Hz, and a fluence of 3 J/cm2. In some pyrite aggregates and sphalerite and galena crystals, line scans across the entire grain were preferred instead of spots in order to obtain a better representability of element abundances. An argon-helium gas mix was used as carrier gas. The ablated material was then analyzed using the mass spectrometer in time resolution mode using mass jumping and a dwell time of 10 ms/peak. The following isotopes were monitored: 29Si, 34S, 55Mn, 57Fe, 59Co, 60Ni, 65Cu, 66Zn, 75As, 77Se, 95Mo, 107Ag, 111Cd, 115In, 118Sn, 121Sb, 125Te, 197Au, 206Pb, and 209Bi. Si was monitored to ensure that no silicates were included in the analyses. Data reduction was carried out by the Iolite package of Igor Pro 8.0 software [19]. Internal standardization was based on 57Fe for pyrite and 34S for sphalerite using the mean iron and sulfur values of pyrite and sphalerite, respectively, determined by electron microprobe. During data reduction, the entirety of the signal was integrated.
For the calibration of trace elements, we use the certified reference material MASS-1, provided by the USGS, which is a Zn-Cu-Fe-S pressed powder pellet doped with 50–70 ppm of most chalcophile elements. The calibrations were monitored using GSE-1g, provided by USGS, which is a natural basaltic glass fused and doped with most elements at 300–500 ppm, and UQAC-FeS1, which is an in-house Fe-S reference material doped with trace amounts of most chalcophile elements. Analyses of these materials agreed with the certified and working values (Appendix A Table A1). Detection limit for laser analyses were calculated using 3 sigma of the background for the gas blank during each analysis. Individual analyses of pyrite, sphalerite, and galena are listed in the Appendix A (Table A2, Table A3 and Table A4).
Element distribution maps in pyrite were performed using a beam size of 11 μm and a stage movement speed of 12 μm/s. A laser frequency of 15 Hz and a power of 3 J/cm2 were used to map the entire pyrite aggregates. It took between 0.5 and 1 h to map each selected aggregate. The maps were generated using the Iolite 8.0 software package on the basis of the time-resolved composition of each element, and show the relative concentration of the element, i.e., they are semi-quantitative.

4. The Castellanos Zn-Pb Orebody

4.1. Morphology and Internal Structure

The Zn-Pb orebody of the Castellanos Mine is tabular to wedge-shaped and stratiform with respect to the bedding of the host black shales. It is NE-SW oriented (dipping to NW) and extends over 800 m with average thickness of 50 m. The orebody is subdivided into two blocks, the Farallones block to the NE and the Susana block to the SW, separated by a N120°E-striking fault zone that downthrows the Susana block with respect to the Farallones one (Figure 3). Both blocks are characterized by a rough bottom-to-top zoning with a lower pyrite-rich zone, grading upwards into a main pyrite-sphalerite-galena zone (Figure 3) which is locally capped by a highly discontinuous, several meters-thick barite rich ore zone and/or a variably thick (<20 m), quartz-rich horizon (silicification zone). The Farallones block and the NE part of the Susana block (Figure 3) overlie a stockwork of pyrite and pyrite-chalcopyrite veins. Although these veins occur entwined at small scale, the large-scale pattern depicts a N 120° E strike. The veins have maximum thickness of 10 cm and cut the footwall sequence of the orebody which is mainly made up of siltstones with minor intercalations of black shales (Figure 2).

4.2. Mineral Assemblages and Textures

Mineral assemblages and textures allow subdividing the ore-related assemblages into five types: (1) stockwork sulfides, (2) basal pyrite-rich ore, (3) disseminated Zn-Pb ore, (4) semimassive-massive Zn-Pb ore and (5) layered barite.
Stockwork veins are filled by coarse-grained (up to 500 µm across), anhedral to subhedral crystals of pyrite with intergranular quartz. Most pyrite crystals are fractured and locally contain minute (<50 µm) inclusions of sphalerite showing lobate grain boundaries. Sphalerite also occurs as intergranular grains among pyrite fragments, often associated with tiny, anhedral crystals of galena. Some veins also contain chalcopyrite which concentrates along cataclastic-textured bands (Figure 4A) where it contains abundant fragments of pyrite and rare sphalerite. Intergranular quartz is variably recrystallized with grain size ranging from 20 to 250 µm and locally contain tiny inclusions of calcium sulfate (probably anhydrite).
The basal pyrite-rich zone (Figure 3) shows a transitional basal contact characterized by the presence of alternating pyrite and black shale layers; the latter being partly replaced by dolomite-ankerite carbonate. This texture evolves upwards to pyrite-dominant ore zones where pyrite crystals form either massive aggregates containing abundant inclusions of flake-like phyllosilicate crystals, fragments of dolomite-ankerite grains and minor corroded grains of sphalerite (Figure 4B,C), or semi-massive aggregates of pyrite crystals showing laminar crystal habit with intergranular carbonates (dolomite-ankerite and calcite) (Figure 4D). Laminar pyrite formed by pseudomorphic replacement of magnetite which, in turn, forms generated by pseudomorphic replacement of hematite. This Fe-oxides assemblage is locally preserved in unreplaced or partially replaced domains scattered in the orebody.
The disseminated ore occurs as discrete domains of variable dimensions (from tens of centimeters to tens of meters) within the massive ore becoming more abundant and larger towards the SW part of the Susana block. It consists of fine-grained (<10 μm) framboidal to euhedral pyrite with some sphalerite and galena set in a black shale matrix of phyllosilicates, organic matter, phosphate and quartz. These fine-grained sulfides are often enveloped by colloform pyrite and sphalerite, while the matrix becomes replaced by carbonates of the dolomite-ankerite series. Sphalerite also forms larger crystals (few tens to few hundred of micrometers across) containing variably corroded inclusions of framboidal pyrite and minute grains of galena (Figure 4E).
The semi-massive-massive ore is characterized by a significant increase in the modal proportion and grain size (up to 500 μm) of sphalerite, galena and pyrite together with the extensive development of intergranular carbonate crystals showing oscillatory zoning with dolomite-ankerite-dominated cores grading to calcite-rich rims (Figure 4F). Early sphalerite tends to be colloform in shape evolving to euhedral, zoned crystals during the mineralizing process, in which several crystallization events occurred. Pyrite shows a similar morphological evolution forming several generations of colloform aggregates which ends with the development of subhedral pyrite but usually postdates and partly replaces sphalerite in each crystallization event, and in turn becomes partly replaced by each new generation of sphalerite (Figure 4G,H). Galena forms skeletal crystals intergrown with colloform sphalerite (Figure 5A), and follows the growing planes of euhedral, zoned crystal of sphalerite (Figure 5B) or tends to be remobilized and appears filling open spaces and fractures (Figure 4H and Figure 5C).
Layered barite mainly occurs discontinuously at the top of the Susana block and consists of layers of variable thickness (from 50 to 200 µm) made up of elongated barite crystals arranged perpendicular to the layering (Figure 5D). They locally contain minor amounts of sphalerite and galena as well as remains of phosphates and partly replaced, rhombohedral crystals of carbonates.
Zn-Pb ores are variably brecciated near the fault-related, NE and SW contacts of the Farallones block (Figure 3). Brecciation took place at least at three distinct events during which pyrite, sphalerite and galena became variably fractured, with calcite and locally microcrystalline quartz and barite filling fractures. Early barite occurs intergrown with calcite (Figure 5E), is locally associated with anhydrite and often replaces preexisting sulfides (Figure 5F); subsequently, barite filled several generations of fractures (Figure 5G) including some that affected veins of the underlying stockwork. The fractures developed during the last brecciation event are mainly filled by quartz and chalcopyrite showing similar mineral assemblages and textures than the veins of the underlying stockwork (Figure 5H).

4.3. Sequence of Ore Deposition

The described textural relations of major minerals in the Castellanos orebody allow suggesting a paragenetic sequence with three mineralization stages in which the different textural types of pyrite can be framed (Figure 6):
(i.)
Early stage: formation of the fine-grained, framboidal and euhedral pyrite ore disseminated in the host black shale, coeval to or preceding the development of Fe-oxides (presently magnetite)-rich domains. Textural relationships between these Fe sulfides and oxides are not well known yet due to the scattered distribution of the later and the absence of samples where both fine-grained pyrite and Fe oxides coexist.
(ii.)
Main stage: formation of the main ore mineral assemblages as a consequence of the overlap of several events of sulfide crystallization. Early events started with the formation of colloform sphalerite including galena (often skeletal) (Figure 5A) and surrounded by collophorm pyrite (with a tendency to develop subhedral crystals at the outer rims), with intergranular fine-grained dolomite-ankerite. During late events, sulfides and carbonates tended to form euhedral, coarse-grained and zoned crystals (Figure 5B), and carbonates became progressively richer in calcite (Figure 4F). Each individual crystallization event involved partial dissolution of the previous assemblage frequently obliterating early textural relations (Figure 4G,H). The existence of a basal pyrite-rich zone where carbonates, phyllosilicates, minor sphalerite and rarely galena mainly occur as partly dissolved remains in pyrite, points to replacement processes of early Zn–Pb sulfide ores associated with the precipitation and growth of pyrite. These textural relationships are similar to those observed in pyrite filling the cross-cutting veins of the underlying stockwork. Pyrite from the basal pyrite-rich zone also shows pseudomorphic textures after replacement of laminar magnetite (Figure 4D) and becomes recrystallized giving rise to massive aggregates.
(iii.)
Late stage: it is characterized by multiple events (at least three) of fracturing and brecciation. The onset of this stage is marked by the formation of late banded colloform pyrite that cements previous sulfide aggregates shortly followed by the crystallization of early barite, frequently intergrown with calcite (Figure 5E). Later on, remobilization of galena, precipitation of at least three younger generations of barite filling fractures, and a silicification event took place. Finally, crystallization of chalcopyrite occurred along brecciated zones, both in the stratiform orebody (Figure 5H) and within pyrite veins of the stockwork (Figure 4A).
This sequence of deposition allows for the differentiation of five basic types of pyrite ascribed to the three stages of ore formation: (1) fine-grained framboidal and euhedral pyrite (Py I) formed during the early stage; (2) early colloform pyrite of the main stage and pseudomorphic pyrite (Py IIa); (3) late euhedral pyrite of the main stage (Py IIb); (4) massive pyrite formed at the end of the main stage (Py IIc); and 5) early fracture-related, colloform banded pyrite preceding the onset of crystallization of early barite (Py III).

5. Au Distribution

The 6 samples analyzed for trace elements were selected from bottom to top of the orebody at the Farallones block. Taken as a whole, they contain all textural types of pyrite (Table 1) although Py I from samples CE-61 and Cast-001 could not be analyzed since its grain size (<10 µm) is smaller than the diameter of the laser (33 µm). Some of them also contain colloform and subhedral sphalerite as well as skeletal and remobilized galena. It is important to note that barite is increasingly abundant from sample SR-208/5.5–5.8 to CE-61 and Cast-004 and that the sample Cast-004 was collected in a highly fractured area close to the fault zone separating the Farallones and Susana blocks. Cast-001 comes from an isolated discontinuous level of silicified disseminated ore located above the top of the main orebody. Whole-rock chemical data are only available from a reduced set of samples which fortunately includes SR-185/0.6–0.7, SR-208/5.5–5.8 and CE-61. These samples contain 1.18, 1.85 and 1.55 ppm Au respectively, as well as 36.00 wt %, 15.65 wt % and 5.96 wt % Fe corresponding to ~77 wt %, ~33 wt % and ~13 wt % pyrite (assuming all Fe is in pyrite).
The analytical results show preferential concentration of Au in pyrite (0.01–37.3 ppm; Table 1) with respect to sphalerite (<0.76 ppm) and galena (<0.03 ppm) (Appendix A, Table A2, Table A3 and Table A4). Table 1 also shows that distribution of Au contents mainly depends on the textural type of pyrite although a bottom to top enrichment trend in the orebody can also be distinguished. Minimum contents occur in massive pyrite (Py IIc) from the basal pyrite-rich zone (0.18 ppm Au average), increasing from pyrite IIa (from 0.29 to 2.86 ppm Au avg.) to euhedral pyrite (Py IIb) (from 0.82 to 9.02 ppm Au average). Maximum values were measured in colloform banded pyrite (Py III), preceding the crystallization of early barite from sample Cast-004, located on the top of the orebody, in a highly fractured zone. The bottom to top enrichment trend is unclear in pyrite IIa since it shows relatively high Au contents in pseudomorphic crystal aggregates from the basal pyrite-rich zone (0.99 ppm Au average) and significant Au depletion (down to 0.65 ppm Au average) in the sparse disseminated ore sampled in the hanging wall. Nevertheless, the adscription of pseudomorphic pyrite to type Py IIa is doubtful (no textural relationships with typical Py IIa colloform pyrite were observed) since it could also be ascribed to the early stages of formation of pyrite IIb. No systematic core-to-rim variations in Au contents were observed in the analyzed aggregates or crystals in any of the samples.
Au concentration strongly correlates with Sb (r = 0.90), Ag (r = 0.81) and As (r = 0.76), moderately with Cu (r = 0.39), Mn (r = 0.41) and Ni (r = 0.16) (Figure 7), and poorly with Zn, Pb and the other trace elements (Table 2), some of which (e.g., Se, Te and Bi) show abundances close to or below the detection limit of the method (Appendix A, Table A2). These geochemical relationships are supported by element distribution maps obtained on three banded colloform aggregates of sample Cast-004 (Figure 8 and Appendix B, Figure A1 and Figure A2) and on a zoned euhedral crystal from sample SR-208/5.5–5.8 (Figure 9) where Au maxima correlate quite well with those of Sb and, to a lesser extent, with Ag and As. These maps also show that Au distribution is not homogeneous but concentrates in variable proportions in discrete, few tens of micrometers-thick growing bands developed on pyrite nuclei poor in Au. The small thickness of these bands, below the diameter of the laser beam used for the analyses (55 μm), did not allow analyzing single zones and consequently, the values obtained in spot and mainly line analyses show average Au (and the other trace elements) contents of the ablated volumes.
The line scan analyses performed on sphalerite and galena reveal the low capacity of these minerals to concentrate Au (Appendix A, Table A3 and Table A4). Although in a few analyses on sphalerite Au contents are above 0.1 ppm, most of them show abundances below this value. Conversely, all of the analyses performed on galena show Au concentrations below the detection limit. The other trace elements do not show significant correlations with each other, but it is worth mentioning the excellent positive correlation between Ag and Sb in galena (r = 0.99) and their negative correlations with Pb (rPb-Ag = −0.79 y rPb-Sb = −0.8), suggesting that Sb and Ag distribute together in galena, most probably in the form of nano sulfosalt inclusions (e.g., Ag sulfoantimonides).

6. Discussion

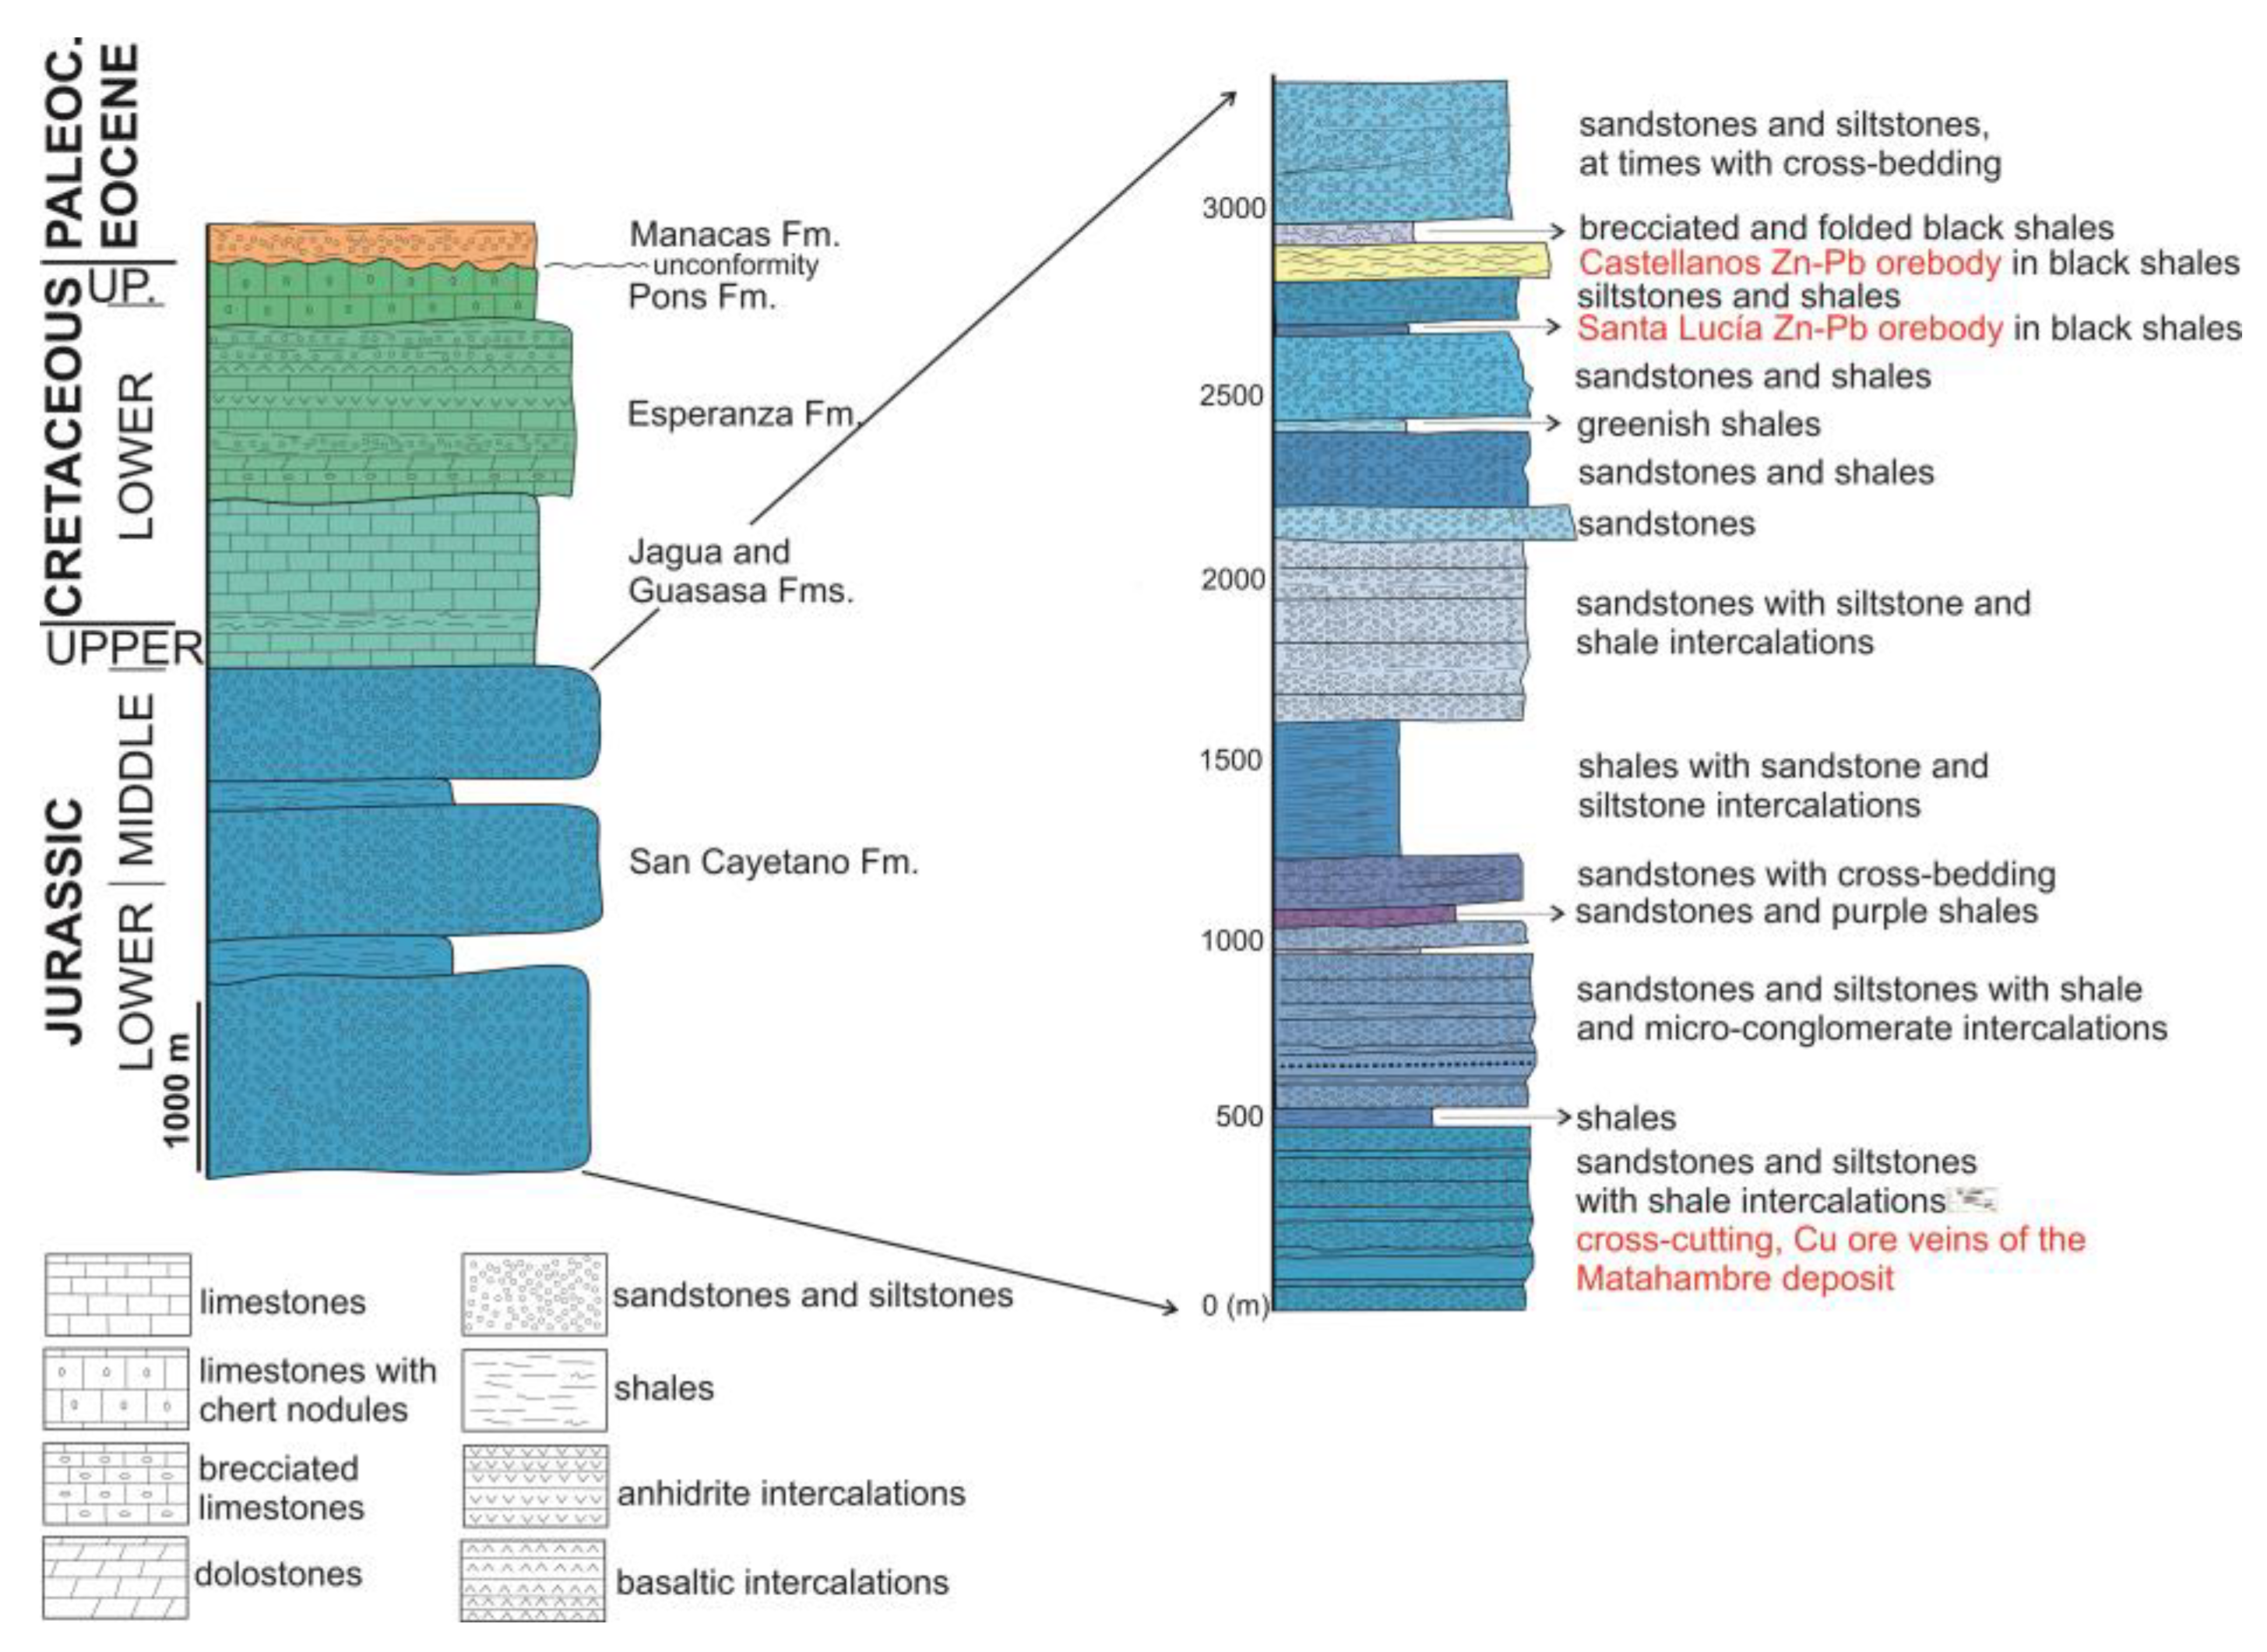
6.1. Ore-Forming Stages

The concentration of fine-grained, framboidal and euhedral pyrite in black shales during the early stage is a rather common sedimentary/diagenetic process [20,21] during which the formation of pyrite requires bacterial reduction of Fe3+ coupled with oxidation of organic matter and marine sulfate reduction [22]. The availability of abundant Fe2+ and SH2 in pore waters at oversaturated concentrations [23] would favor nucleation rather than crystal growth, promoting the formation of pyrite framboids. Nevertheless, this low-oxygen fugacity conditions contrast with the presence of hematite-rich rocks which imply low SH2 and high reactive Fe concentrations. The absence of clear observations on the structural and textural relationships between fine-grained pyrite- and magnetite-rich rocks hinders an appropriate discussion on the genetic relationships and the relative chronology between both types of rocks in terms of physicochemical changes in the sedimentary environment and/or variations in the chemistry of low temperature hydrothermal solutions supplied to the basin with concentrations of H2 and SH2 close to the stability fields of pyrite and hematite [24]. Preliminary petrographic and geochemical data of the siltstones and shales hosting the Castellanos deposit point to chemical changes in the low-temperature hydrothermal system, similar to the proposal by [24,25] for some VMS deposits where similar zones rich in pseudomorphic magnetite formed after hematite occur.
The formation of the Zn-Pb ore during the main stage took place via the superimposition of successive mineralizing events associated with the input of metal-rich brines at increasing temperature and/or decreasing metal saturation degree. Estimations made by [12] on the basis of the reflectance of vitrinite and the crystallinity of clay minerals in the host black shales constrain temperature conditions at <200 °C. The presence of ferroan dolomite alteration at such low temperatures suggests that the fluids responsible for the formation of the main mass of sphalerite and galena ore were oxidized, nearly neutral brines [4]. The described textural sequence also suggests an early input of oxidized, saline hydrothermal fluids capable of transporting Zn and Pb up to oversaturation which, in turn, gave way to colloform precipitation of sphalerite and skeletal galena when the ore fluids encountered reduced (generated thermochemically and/or by means of bacteria) sulfur on or below the seafloor in the host euxinic basin [26,27]. Throughout the mineralizing process, slight increase in temperature and putative metals undersaturation of fluids would promote crystal growth leading to the development of coarse-grained euhedral sulfides. Metals undersaturation of the fluids could also be reached at the end of each one of the individual crystallization events. The formation of colloform sphalerite (+galena) enveloped by colloform pyrite promoted metal depletion in the residual fluids thus giving rise to the development of subhedral pyrite overgrowing the outer colloform pyrite bands of sphalerite-pyrite aggregates.
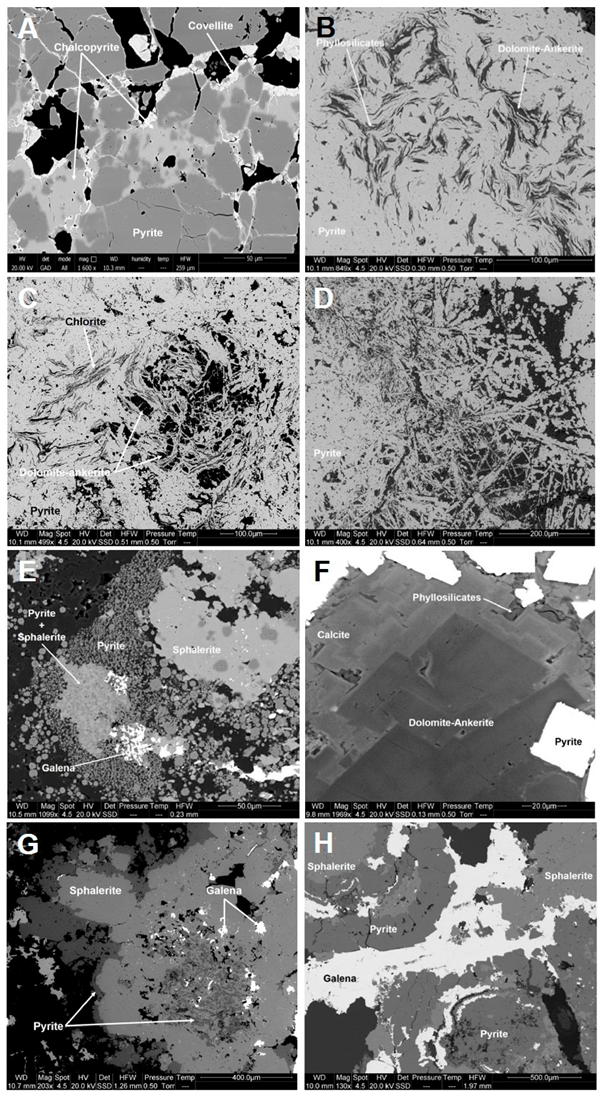
The mineralogy and texture described in the basal pyrite-rich zone support the existence of replacement processes of the early Zn-Pb sulfide ores associated with the precipitation and growth of pyrite. Pyrite also shows pseudomorphic textures after replacement of laminar magnetite, as [25] propose for VMS deposits of the Iberian Pyrite Belt. Since dissolution of sphalerite and galena is favored by heating [24], the formation of the lower pyrite-rich zone can be the consequence of the thermal evolution proposed for the mineralizing process during the main stage of ore formation. During the thermal maximum reached at the end of the main stage (probably slightly above 200 °C), the abundance of H2S generated by the dissolution of sphalerite and galena [24] promoted extensive crystallization of pyrite in the ore and replacement of laminar pseudomorphic magnetite in the host rock. These mineral assemblages and textures have also been observed in the pyrite veins of the underlaying stockwork.
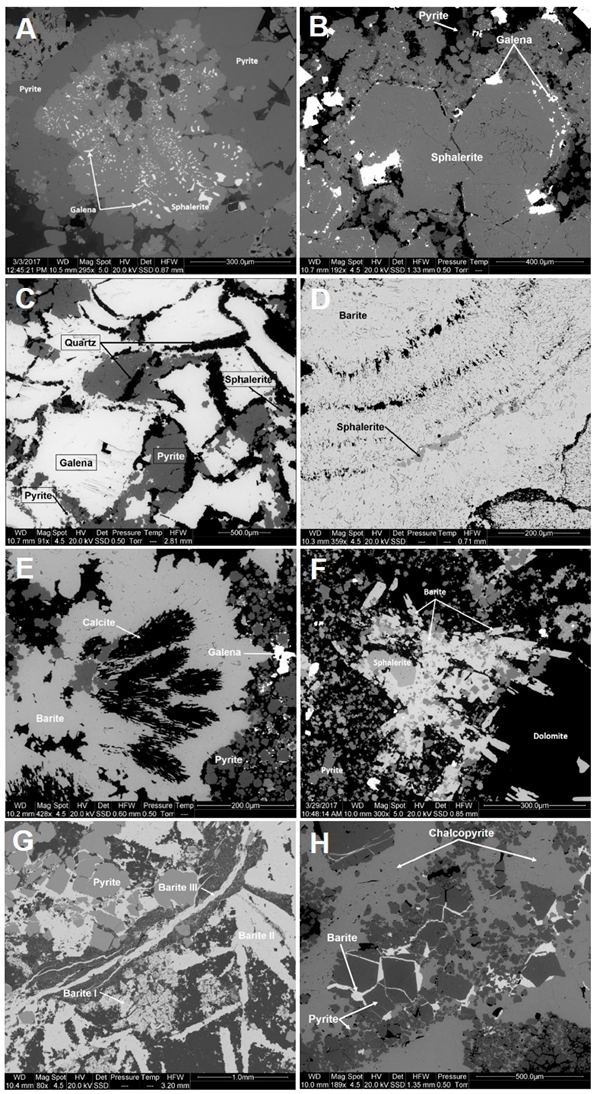
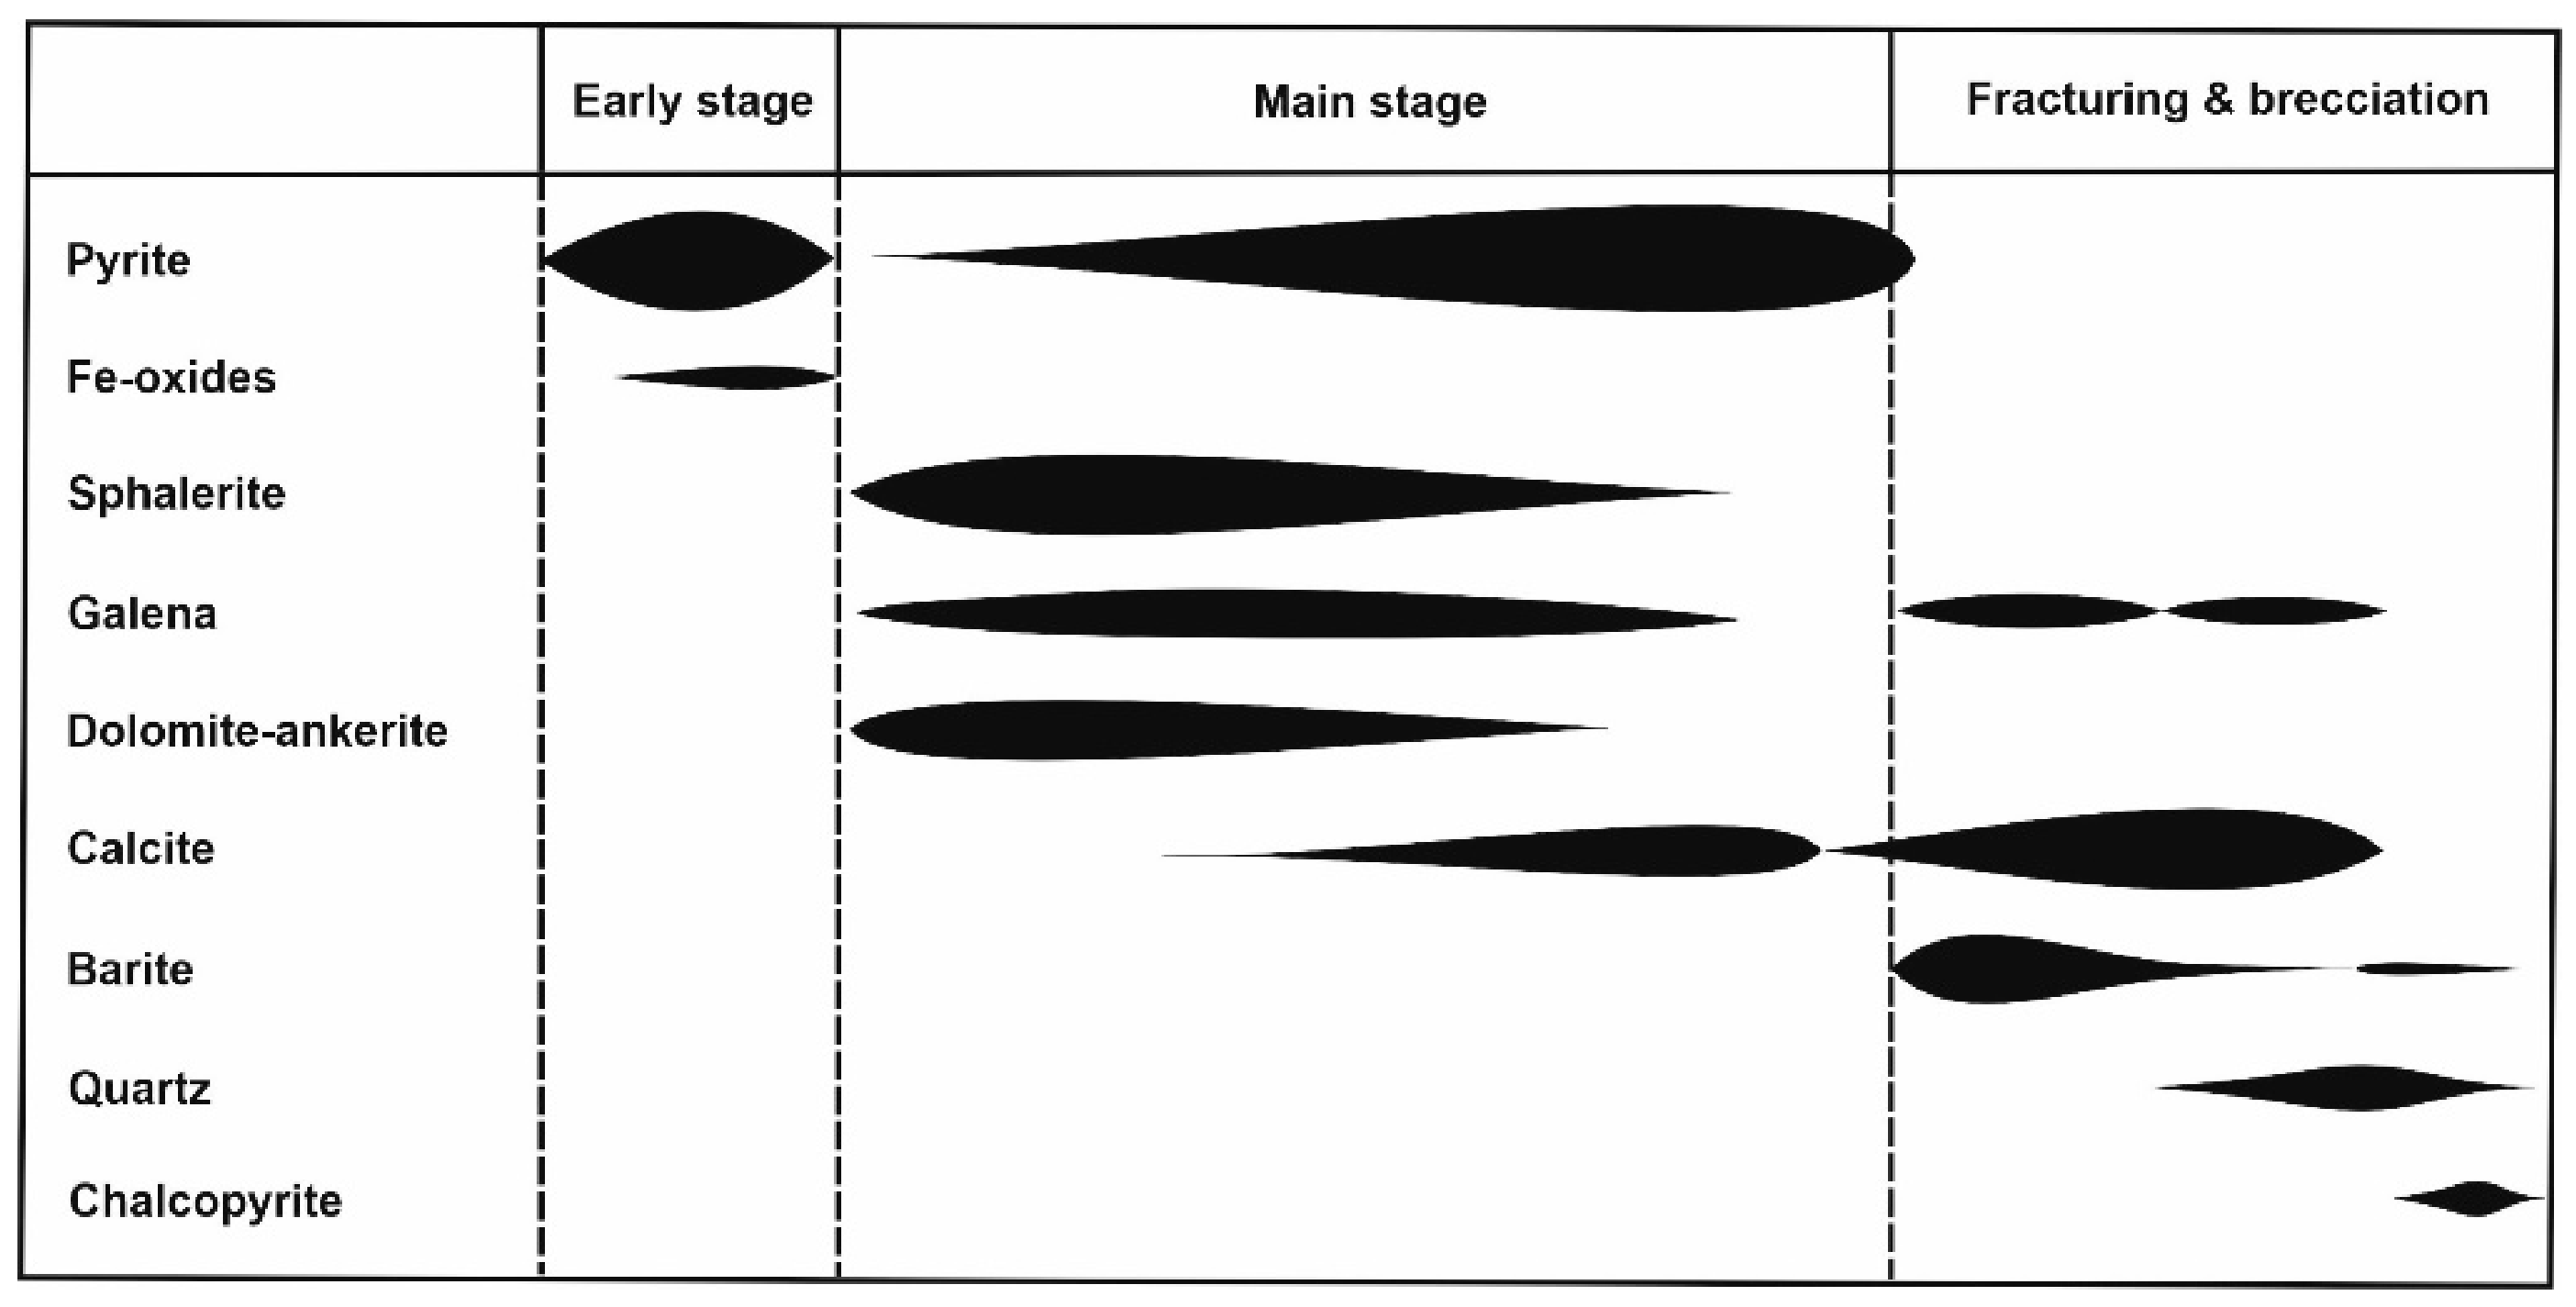
The onset of the fracturing and brecciation stage is marked by the crystallization of a new generation of colloform banded pyrite shortly followed by early barite (Figure 6) which is usually intergrown with calcite (Figure 5E) and locally associated with anhydrite. Later on, remobilization of galena, precipitation of at least three younger generations of barite filling fractures, and a silicification event took place. Finally, crystallization of chalcopyrite occurred at the brecciated zones (even within pyrite veins of the stockwork). The limited mobility of Cu at low temperature (<350 °C) [28,
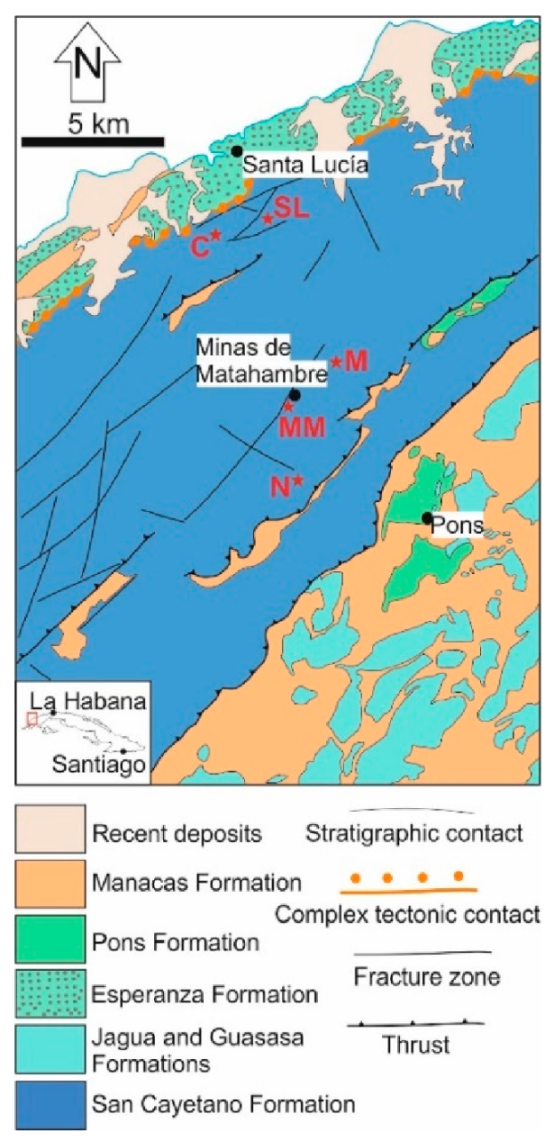
29] suggests that the hydrothermal system created during this stage allowed late supply of deep, high-temperature brines to the ore-forming environment. Although these brines played a minor role in the formation of the Castellanos ore, they might have been predominant in the formation of the Cu vein-type ores of the Matahambre deposit (Figure 1 and Figure 2) [13,14].

6.2. Timing of Au Precipitation

It has been stated that the redox state of sulfur in shale-hosted, clastic-dominated zinc-lead deposits (especially in those interpreted as sedimentary exhalative) can control the proportion of Au and base metals in ore brines at 100–200 °C [1,2,5]. According to these authors, the higher the H2S content in the fluid, the lower the solubility of Zn and Pb. Furthermore, there is a general consensus on transport of base metals (Fe, Cu, Zn and Pb) in these brines at low temperature having taken place predominantly as chloride complexes whereas Au is mobilized as bisulfide complexes [30]. Thus, the formation of the main-stage ore at Castellanos requires the input of highly saline, oxidized hydrothermal fluids with low H2S contents. These fluids could have concentrated zinc and lead by leaching the oxidized fluvial-deltaic clastic sediments of the San Cayetano Formation as has been proposed for other shale-hosted, clastic-dominated deposits elsewhere [1,5]. Conversely, transport of Au and Ba requires more reduced conditions, moderate to high H2S contents and low SO42+ concentration [1,5,31]. The source of such fluids must be linked with organic carbon-rich lithologies such as the black shales occurring intercalated in the San Cayetano Formation, where H2S would have been produced via thermochemical or bacteria sulfate reduction coupled with decomposition of organic matter [22,32].
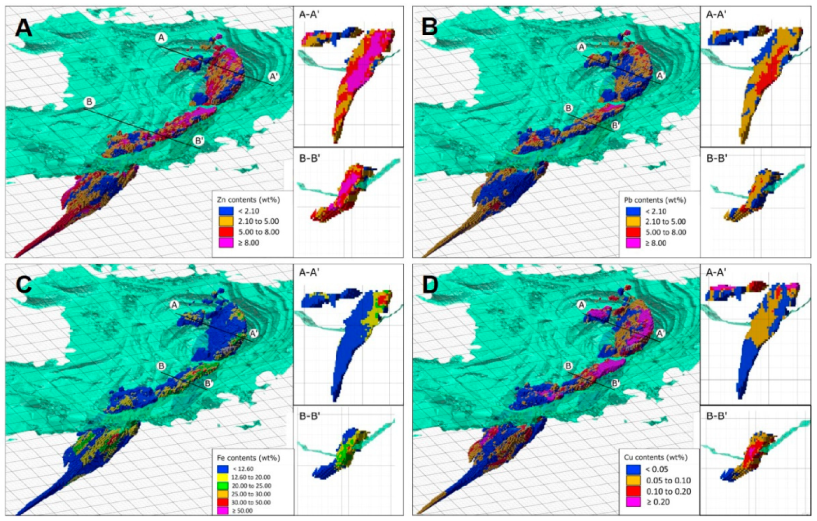
The correlation between Au content maxima and modal amount of early barite suggests that the beginning of the fracturing and brecciation stage implied major change in the redox state of hydrothermal fluids to more reducing conditions, due to the input of slightly deeper brines buffered by black shales. Moreover, the heterogeneous distribution of Au in single samples and textural types of pyrite, as well as at the scale of mineral aggregates and crystals, further suggests variations in the redox state of sulfur in successive fluid batches. Thus, we hypothesize that early supply of small amounts of Au to the ore-forming environment would have coincided with the crystallization of colloform pyrite (Py IIa) at the beginning of the main stage, and that Au input would have become progressively more abundant as the proportion of batches of H2S-rich, reduced fluids increased up to the formation of the banded colloform pyrite (Py III) coeval with the onset of fracturing and prior to the crystallization of early barite. Each colloform band with its own growing layer of euhedral pyrite (Py IIb) would represent single batches of fluids buffered with different country rock levels and, hence, with different budget of dissolved metals. This evolution of fluids chemistry seems to be better recorded in the ore assemblages formed towards the top of the orebody.
As fracturing became a widespread phenomenon, the incoming fluids were progressively more oxidized, promoting the crystallization of calcite and the remobilization of galena. Fracturing also allowed late flow of warmer fluids (>350 °C) from deeper zones of the San Cayetano Formation, which were suitable for transporting Cu and precipitate chalcopyrite in restricted brecciated areas of the Castellanos orebody and in some pyrite veins of the underlying stockwork. Nevertheless, the presence of several generations of barite veins even within the stockwork reveals the existence of discrete inputs of reduced, SO4-free fluids during the late fracturing stage too. These fluids could also supply additional Au transported in the form of chlorite complexes [33].
The comparison of the Castellanos ore with that from similar shale-hosted, clastic-dominated Zn-Pb deposits shows that the former has average whole-rock Au abundances around 1 ppm, similar to the Pb-Zn-Ag-Ba ± Au ores of medium-sized, sedimentary-exhalative deposits [1] whose average grades vary from 0.5 ppm in the Faro deposit (Anvil district, Selwyn Basin) [34] to 2 ppm in the Triumph deposit (Milligen Formation, Central Idaho) [35]. These values are also comparable with those reported for many VMS deposits, since most of them (~78%) have Au grades <2 ppm [36]. Higher Au contents in VMS deposits are generally linked with the calcoalkaline to transitional nature of the associated volcanism as well as the volume of felsic volcanics [36,37], thus highlighting the predominant magmatic origin of Au. The absence or very restricted occurrence of igneous rocks in the stratigraphic successions including shale-hosted, clastic-dominated deposits limits the supply of the ore-forming metals (Zn and Pb but also Au and Ag) to their effective leaching from the terrigenous lithologies that dominate such successions [30]. Black shale intercalations in the stratigraphic sequence can contribute to buffer ore-forming fluids, producing reduced, H2S-rich brines and supplying Au if they content enough amounts of Au-bearing sedimentary pyrite, as is the case of the Selwyn basin [38]. Actually, some of the few shale-hosted, clastic-dominated deposits containing significant amounts of Au are located in the Anvil district, within the Selwyn basin [1].

6.3. Au Distribution in Zn-Pb Ores

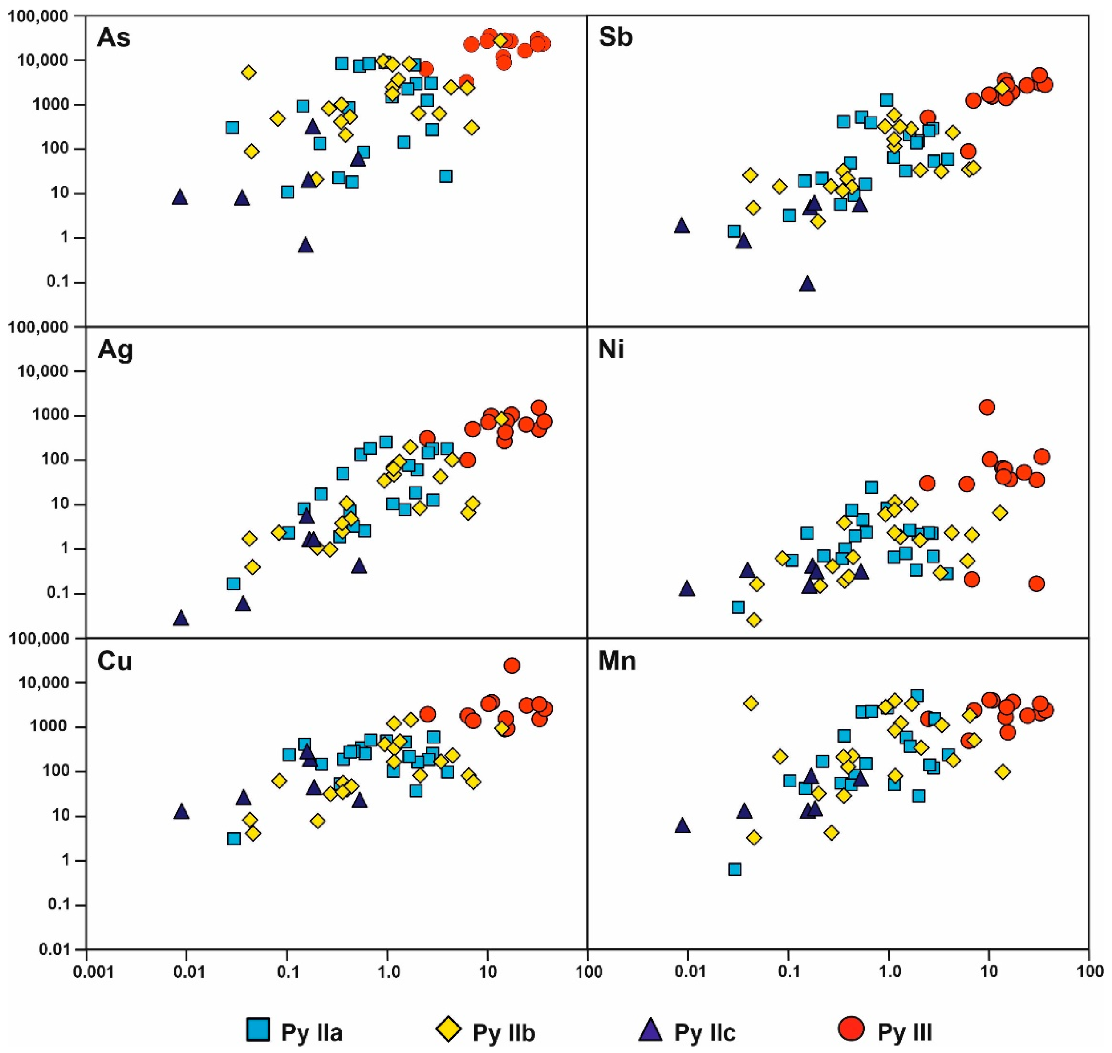
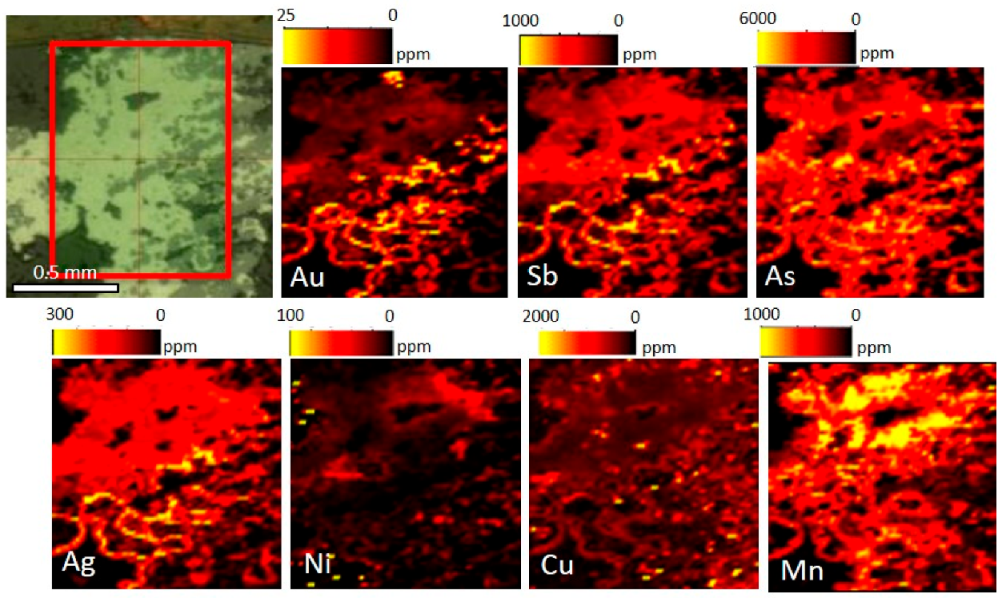
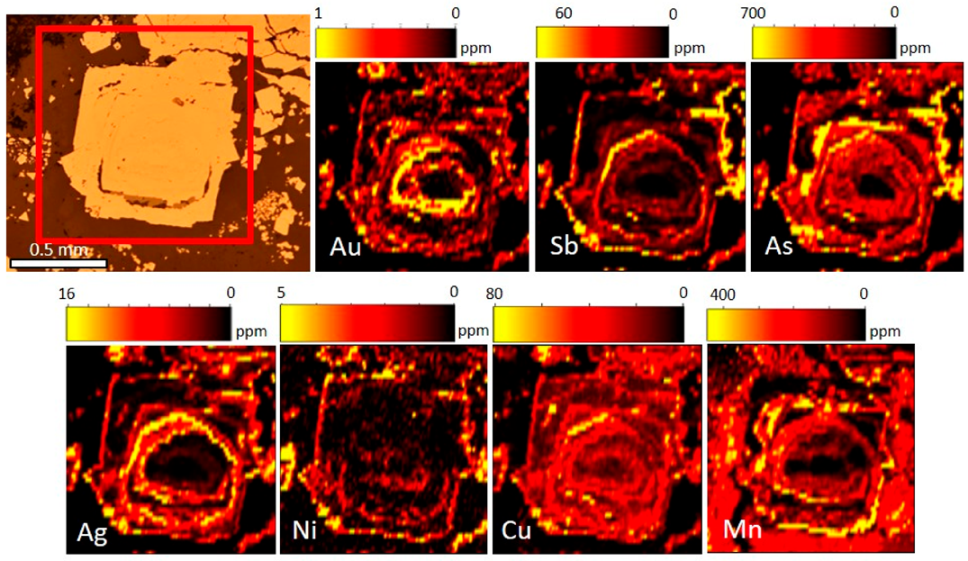
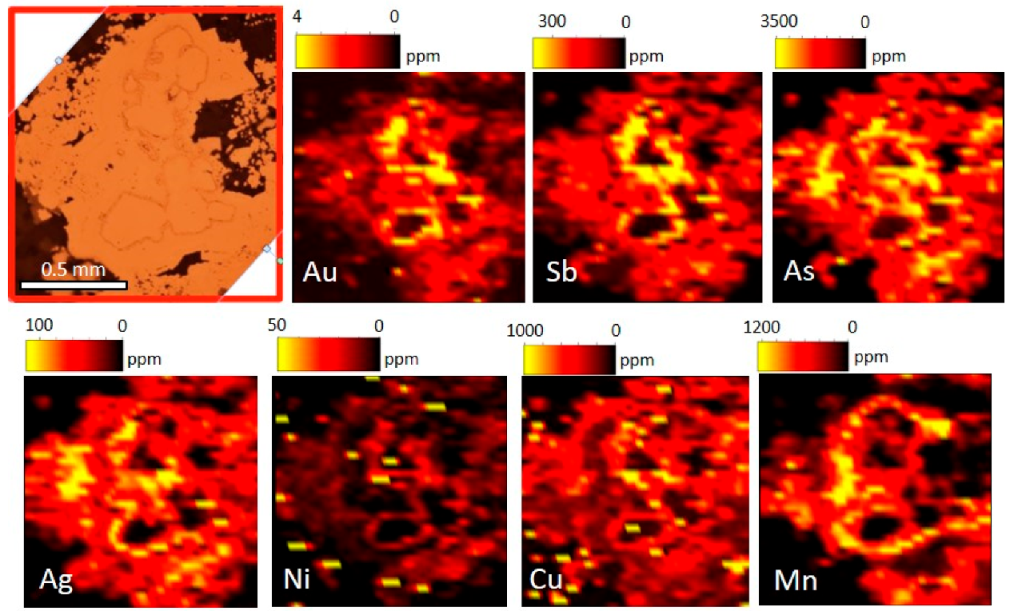
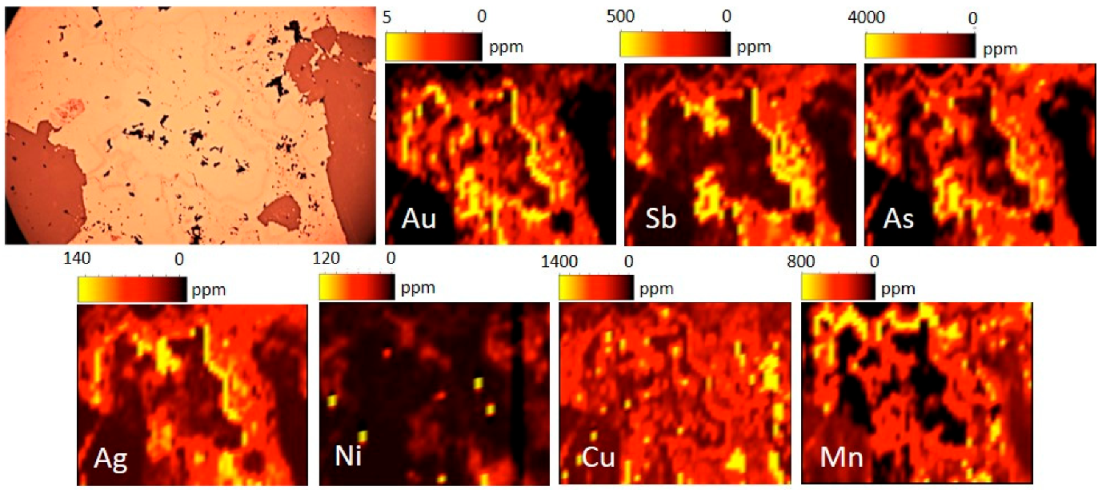
The results presented above point to a preferential concentration of gold in pyrite where Au atoms should become fixed on the Sb-, Ag- and As-rich pyrite growth zones (Figure 8 and Figure 9). The incorporation of such trace elements in pyrite promoted the development of structural distortions and the formation of Fe-deficient surfaces thus favoring the fixation of Au in the pyrite lattice or on its surface via chemisorption processes [39,40]. The substitution of S by As and Sb from the early H2S-bearing fluids resulted in the creation of local reduced surfaces on pyrite [41] thus contributing to destabilize Au-bisulfide complexes and Au deposition. Nevertheless, Au contents in pyrite of samples SR-185/0.6–0.7, SR-208/5.5–5.8 and CE-61 do not account for their whole-rock amounts. Assuming that all Au is hosted by pyrite, that the average Au content of pyrite in these samples is 0.59, 1.66 and 4.97 ppm respectively (Appendix A, Table A2) and that pyrite represents ~77%, ~33% and ~13% respectively of the ore modal composition, the expected whole-rock Au amounts should be around 0.45, 0.54 and 0.65 ppm respectively. Conversely, their respective whole-rock Au contents would be 1.18, 1.85 and 1.55 ppm. Since trace element analyses of sphalerite and galena did not reveal significant Au concentrations, this discrepancy would be explained either by the presence of Au minerals or native Au in the ore assemblage or assuming higher heterogeneity in the distribution of Au in pyrite, having zones with much higher concentrations than those analyzed in this study. Although the first explanation cannot be totally discarded, it is not supported by the results of our systematic EDS analyses performed by ESEM and FE-ESEM on particles with high mean-atomic weight. These particles were detected and analyzed during scanning of the total surface of the 54 polished sections used for petrographic studies and none of them showed any spectrum of Au minerals. In contrast, the heterogeneous distribution of Au in different textural types of pyrite in the analyzed samples and even within single growth bands in colloform aggregates and euhedral crystals (Figure 8 and Figure 9, and Appendix B, Figure A1 and Figure A2) supports the possibility of finding pyrite crystals or aggregates with higher Au contents, which would contribute to balance the trace amounts analyzed in pyrite with whole-rock contents. The superimposition of different events of sulfide crystallization involving dissolution-precipitation processes would promote local Au remobilization and subsequent concentration in preferential sites.
To our current knowledge, there are no data available in the literature on trace Au contents in pyrite, sphalerite and galena from shale-hosted, clastic-dominated deposits. Similarly, only few papers report LA-ICP-MS results on pyrite from VMS deposits [42,43,44], in spite of the important Au endowment of many deposits [36,37] and the need-to-know Au speciation for effective recovery. Average Au content in pyrite from different deposits of the Bathurs Mining Camp varies from 0.07 ppm in Key Anacon East Zone to 1.86 ppm in Louvicourt and always concentrates in As-rich pyrite [43]. Furthermore, in the Brunswick No 12 deposit from the same camp, [42] reports increasing average Au contents in pyrite (from 0.39 ppm to 2.6 ppm) towards the hanging wall of the deposit associated with concentration of As, Sb and Ag in the sulfide ores. This evolution is consistent with similar Au enrichments recognized in other VMS deposits, including Kuroko in Japan [21], Rosebery, Que River and Hellyer in Australia [33] and Neves Corvo, Rio Tinto, Sotiel and Migollas in the Iberian Pyrite Belt [45,46]. Nevertheless, whereas Au contents in arsenian pyrite mostly account for the whole-rock contents of the different sulfide ores at Brunswick No 12 [42], Au mainly occur in the form of native gold and Au-Ag-Hg alloys in the Iberian Pyrite Belt [46,47]. Preliminary LA-ICP-MS results show that pyrite from several deposits of the Iberian Pyrite Belt may contain significant amounts of Au and that different textured-pyrite host variable Au contents [44]. This author shows that average Au content increase from framboidal pyrite (1.26 ppm) to colloform pyrite (1.36 ppm) and significantly decrease in recrystallized pyrite (0.56 ppm), while Au contents in all these textural types of pyrite positively correlate with As, Sb, Ag and Ni.
In absence of published studies on Au distribution in shale-hosted, clastic-dominated Zn-Pb deposits, a comparison of Castellanos with VMS deposits reveals a somewhat similar bottom to top enrichment of Au, As, Ag and Sb in pyrite. However, the described enrichment at Castellanos is more pronounced than in VMS deposits since the average Au contents of recrystallized pyrite (Py IIb) vary from 0.82 ppm to 9.02 ppm, reaching maxima (17.58 ppm average.) in the colloform banded pyrite (Py III) from the top of the orebody. The high Au contents of pyrite from Castellanos in comparison with those from VMS deposits like Brunswick No 12 where it is the principal host for Au also suggest that most Au at Castellanos could be hidden in pyrite.

7. Concluding Remarks

The Castellanos Zn-Pb orebody is a shale-hosted, clastic-dominated deposit formed in the western margin of the proto-Caribbean basin at Upper Jurassic time. The fact that this deposit contains significant amounts of Au (close to 1 g/t on average) enlarges a growing body of evidence that shale-hosted, clastic-dominated Zn-Pb deposits can, in fact, concentrate appreciable Au.
Au concentrates in variable amounts in different textural types of pyrite: 0.03–3.98 ppm in colloform pyrite IIa, 0.04–13.93 ppm in euhedral pyrite IIb, 0.01–0.53 ppm in massive pyrite IIc and 2.53–37.30 ppm in colloform banded pyrite III. These variations define a bottom to top enrichment trend that became more pronounced towards the end of the main stage of mineralization. Au concentration in pyrite reached maxima at the beginning of the late fracturing and brecciation stage, which gave way to crystallization of early barite. Au enrichment in pyrite took place coeval with that of As, Ag and Sb and could account for whole-rock Au contents once the absence of free Au minerals in the ore assemblage has been confirmed by systematic ESEM and FE-ESEM investigations.
Consistent with the geochemical behavior of Au and Ba in low temperature hydrothermal fluids, our data together with previous geochemical modeling, suggest that Au was supplied to the ore-forming environment as bisulfide complexes by H2S-bearing, reduced brines buffered by the black shales intercalated in the terrigenous sedimentary host sequence. The creation of Fe-deficient, local reduced surfaces on growing pyrite as a result of the substitution of S by As and Sb contributed to destabilize Au-bisulfide complexes and hence, producing Au deposition. Our petrographic, paragenetic, and geochemical study reveals processes that accumulate Au in shale-hosted, clastic-dominated deposits and, importantly, documents the physicochemical evolution of an ore forming system that have potentially broader implications for understanding the spectrum of ores that occur in this significant deposit type.

Author Contributions

Conceptualization, D.G.-V. and F.G.; methodology, D.G.-V. and F.G.; software, R.P.; formal analysis, R.P.; investigation, D.G.-V., F.G., R.H.-D. and A.A.; resources, D.G.-V. and R.H.-D.; writing—original draft preparation, D.G.-V., F.G. and A.A.; writing—review and editing, F.G. and A.A.; supervision, F.G.; project administration, D.G.-V. All authors have read and agreed to the published version of the manuscript.

Funding

This research received no external funding.

Acknowledgments

The authors greatly acknowledge Dany Savard and Audrey Lavoie (UQAC) for their assistance during laser ablation analyses and Isabel Sánchez-Almazo (CIC, UGR) for her continuing help during petrographic investigations of samples under FE-ESEM. Fernando Tornos is also thanked for his critical review of an earlier version of the manuscript. We also acknowledge four anonymous reviewers whose comments greatly contributed to improve the final version of this paper.

Conflicts of Interest

The authors declare no conflict of interest.

Appendix A

Table A1. Values for the reference material MASS-1 used in the calibration of LA-ICP-MS and analyses of UQAQ-FeS1 and GSE-1g for monitoring the data quality.
Isotope 34S55Mn59Co60Ni65Cu66Zn75As77Se95Mo107Ag111Cd121Sb125Te197Au206Pb209Bi
ppmppmppmppmppmppmppmppmppmppmppmppmppmppmppmppm
Reference material MASS-1 used for calibration of pyrite analyses
MASS-1Working values276,0002806097134,000210,00065515950606015476860
S.D10008010155005000349579 7
Values obtained for UQAC-FeS1 and GSE-1g
UQAC-FeS1Working values389,56655.0636.225,730.0022,664.00257.51055.00330.0066.0165.6 8.2149.565.090.00120.00
S.D.41,0005.847.01500.001300.0027.5105.0042.003.515.5 8.817.06.59.0020.00
This studyaverage394,75076.7576.520,715.0020,915.00322.51169.50295.5562.45171.252.4573.75192.8562.25100.4136.1
n = 2S.D.92632.83.54235.57205.0672.871.4212.091.113.790.363.56.21.132.042.28
Rel. Diff.1.011.390.910.810.921.251.110.900.951.03 0.851.290.961.121.13
GSE-1gWorking values 590.00380.00440.00380.00460.00260.0020.00390.00200.00160.00450.00 7.00378.00320.00
S.D. 20.0020.0030.0040.0010.0090.0016.0030.0020.0050.00110.00 12.0030.00
This studyaverage3550790.65361.45470.50640.00490.00349.5564.05389.00195.20244.00305.75294.858.51351.45310.15
n = 2S.D.63663.141.258.6914.1470.7119.026.7212.736.933.113.469.690.333.595.87
Rel. Diff. 1.340.951.071.681.071.343.201.00.981.530.68 1.220.930.97
S.D. Standard deviation. Rel. Diff., relative difference of this study/working value.
Table A2. Gold and other trace element contents in different textural types of pyrite obtained by LA-ICP-MS.
197Au75As121Sb107Ag59Co60Ni65Cu66Zn206Pb111Cd55Mn77Se95Mo125Te209Bi
Sample/Spot_Line (Py)ppmppmppmppmppmppmppmppmppmppmppmppmppmppmppm
CAST-001_c1.d (Py IIa)0.378450.00394.0050.000.040.98189.00990.00506.001.87612.000.171.510.01bdl
CAST-001_c2.d (Py IIa)0.557290.00497.00135.000.104.50346.00830.00709.002.312139.000.204.500.01bdl
CAST-001_c3.d (Py IIa)0.688440.00371.00186.300.3724.49512.0011,600.001610.0029.302218.000.4310.360.150.01
CAST-001_c6.d (Py IIa)0.989070.001205.00258.000.158.14491.001200.00719.001.732638.000.213.590.02bdl
Cast-004_C1-2.d (Py III)14.9011,800.003370.00272.002.3567.00910.0055.00340.000.941620.000.806.201.000.02
Cast-004_C1-3.d (Py III)33.0030,100.002900.00500.000.1035.701540.00140.00510.000.502000.000.016.802.000.01
Cast-004_C2-1.d (Py III)37.3023,440.002680.00757.001.30120.002630.0031.10250.000.662330.001.025.401.100.01
Cast-004_C2-2.d (Py III)24.6016,300.002560.00647.000.5653.003130.00360.00210.000.631740.008.004.691.260.01
Cast-004_C2-3.d (Py III)6.403200.0082.00101.000.9629.001830.0068.00240.000.13470.001.004.100.080.02
Cast-004_C3-1.d (Py III)17.6026,900.001820.001080.001.0837.0025,000.00540.001600.000.513620.000.809.800.550.04
Cast-004_C3-2.d (Py III)11.0035,000.001440.001010.004.80104.003700.001600.007600.000.773870.005.709.503.2029.00
Cast-004_C3-3.d (Py III)32.9022,600.004420.001560.000.320.163320.0072.00300.002.903270.002.808.301.060.04
Cast-004_C3-4.d (Py III)7.2022,400.001170.00509.005.500.201410.00730.003100.0013.002320.000.3026.800.130.04
Cast-004_C3-5.d (Py III)10.3027,000.001590.00730.006.201600.003400.001900.001700.000.993960.003.7019.000.380.05
CAST-004-Py.d (Py III)15.6227,890.002587.00771.000.3863.70944.0050,000.0084.00155.00731.002.1257.202.030.03
CAST-004-Py2.d (Py III)15.208720.001350.00436.000.5142.201570.00102,000.00190.00300.002740.001.2521.401.080.02
CAST-004-Py3.d (Py III)2.536310.00481.00315.000.3330.101980.00190.00220.000.791470.000.9813.300.070.03
CE-61c3a.d (Py IIa)2.833070.00275.00184.000.062.21256.203600.002020.0010.40115.000.251.020.050.01
CE-61c2a.d (Py IIa)2.591255.00240.00149.100.212.28187.0029.001310.000.26134.300.291.550.050.01
CE-61c2b.d (Py IIa)3.9824.6054.90183.800.010.2798.5013.20298.000.06229.900.220.020.03bdl
CE-61c3a.d (Py IIa)2.022950.00145.0061.200.122.10163.00680.001332.001.9326.500.100.290.03bdl
CE-61c5.d (Py IIb)13.9327,810.002242.00873.000.116.49947.002590.001648.007.9093.100.747.240.07bdl
CE-61c6.d (Py IIb)4.472470.00221.00103.000.022.30232.006330.001556.0016.10171.000.190.310.05bdl
SR-208-5_50c1a.d (Py IIa)1.662260.00196.0077.201.922.63218.0032.00467.000.12353.000.213.87bdl0.03
SR-208-5_50c2a.d (Py IIa)1.151490.0060.5010.310.220.64102.202.901080.000.0647.900.140.03bdl0.01
SR-208-5_50c2b.d (Py IIa)0.22135.0020.4017.100.810.68147.0037.80228.000.05162.000.060.060.010.03
SR-208-5_50c3a.d (Py IIa)0.03307.001.270.160.010.052.990.4938.60bdl0.570.090.01bdlbdl
SR-208-5_50c3b.d (Py IIa)1.947860.00130.4018.400.560.3336.7020.40940.000.085030.000.020.500.030.03
SR-208-5_50c1b.d (Py IIb)1.343660.00296.0093.400.131.84480.0013.14263.000.071187.00bdl0.70bdl0.06
SR-208-5_50c4a.d (Py IIb)0.0589.004.290.380.040.163.962.39142.000.103.000.010.06bdlbdl
SR-208-5_50c4b.d (Py IIb)0.045280.0023.871.670.010.028.0020.6015.900.073334.000.150.10bdlbdl
SR-208-5_50c6c.d (Py IIb)0.2020.902.131.050.150.147.600.9217.60bdl29.900.020.02bdlbdl
SR-208-5_50c8a.d (Py IIb)0.40210.0019.6010.630.040.2339.208.26289.000.04121.000.011.100.020.01
SR-208-5_50c8b.d (Py IIb)2.13640.0030.908.287.801.5582.0012.50780.000.14328.001.871.17bdl0.21
SR-208-5_50c9a.d (Py IIb)3.43631.0029.2042.800.200.28168.2029.70234.000.041070.000.040.26bdlbdl
SR-208-5_50c9b.d (Py IIb)0.44531.0012.774.750.190.6445.902.93996.000.08214.002.080.010.120.02
SR-208-5_50c10a.d (Py IIb)6.502400.0032.006.500.310.5381.0020.1022.000.071790.000.080.11bdl0.02
SR-208-5_50c10b.d (Py IIb)7.20306.0035.2010.571.612.0558.303.89626.000.07486.000.340.070.050.03
SR-208-5_50c11a.d (Py IIb)1.171750.00156.0064.601.352.29167.0029.90634.000.02815.000.132.760.070.13
SR-208-5_50c11b.d (Py IIb)0.36415.0010.633.745.613.8534.103.15492.000.03203.003.68bdl0.051.17
CAST-018Ac3b.d (Py IIa)0.15920.0017.508.021.052.24417.0056.001337.000.2139.400.200.190.020.15
CAST-018A_c8a.d (Py IIa)0.43860.0044.807.091.117.40276.0025.101620.000.1247.700.150.420.010.03
CAST-018Ac4.d (Py IIb)0.08484.0013.162.2910.100.6061.6026.20392.000.05205.000.380.050.020.58
CAST-018Ac5a.d (Py IIb)0.959560.00303.0034.600.016.09417.0061.100.38bdl2770.000.221.040.02bdl
CAST-018Ac5b.d (Py IIb)1.182510.00108.0048.000.1511.40332.002.71549.000.0576.000.190.380.160.12
CAST-018Ac6a.d (Py IIb)1.728320.00267.30201.000.039.971490.0028.709.220.033230.000.310.870.14bdl
CAST-018Ac6b.d (Py IIb)0.361010.0030.102.450.180.1955.601.20871.000.0326.800.090.05bdl0.04
CAST-018Ac7a.d (Py IIb)1.178030.00552.0070.800.027.551230.0039.608.400.043890.000.281.150.31bdl
CAST-018A_c7b.d (Py IIb)0.27821.0013.490.961.580.4031.000.46405.00bdl3.870.110.010.040.06
SR-185-0_6c1.d (Py IIa)0.3422.905.191.840.580.5953.2030.6049.300.0751.800.100.310.010.02
SR-185-0_6c4a.d (Py IIa)0.1110.902.922.270.500.54242.0020.0035.900.1358.000.130.310.020.03
SR-185-0_6c5.d (Py IIa)2.90274.5049.7012.641.340.67603.00319.00649.001.601486.000.200.840.030.15
SR-185-0_6c6.d (Py IIa)0.6085.5014.972.514.582.34255.10880.00165.402.54143.000.142.670.030.02
SR-185-0_6c8.d (Py IIa)1.52142.8029.907.641.730.78469.00344.00429.001.84566.000.170.900.050.02
SR-185-0_6c9.d (Py IIa)0.4618.208.293.201.341.94286.60271.00125.201.6376.400.140.180.030.13
SR-185-0_6c2.d (Py IIc)0.018.601.760.030.070.1312.7413.601.320.085.800.171.410.03bdl
SR-185-0_6c3.d (Py IIc)0.1720.504.471.640.500.41193.0090.0066.100.2776.000.090.470.030.01
SR-185-0_6c4b.d (Py IIc)0.160.710.085.620.020.15288.9036.803.070.1012.290.10bdl0.01bdl
SR-185-0_6c7a.d (Py IIc)0.19324.005.671.630.140.3144.405.90249.000.0313.900.450.310.050.24
SR-185-0_6c7b.d (Py IIc)0.5362.205.220.420.070.3022.9033.0032.800.0466.000.040.96bdl0.03
SR-185-0_6c10.d (Py IIc)0.048.300.780.060.810.3326.6045.004.400.0512.300.401.100.03bdl
Fe used as internal standard; bdl: below detection limit; Py IIa, Py IIb, Py IIc and Py III in the first column refers to the pyrite type analyzed.
Table A3. Gold and other trace element contents in sphalerite obtained by LA-ICP-MS.
197Au75As121Sb107Ag59Co60Ni65Cu66Zn206Pb111Cd55Mn77Se95Mo125Te209Bi
Sample/Spot_Lineppmppmppmppmppmppmppmppmppmppmppmppmppmppmppm
Cast-004_C1-1.dbdl0.122.906.404.600.43360.0682,000.011.9590.0846.01.590.100.310.03
Cast-004_C2-4.dbdl0.807.508.303.270.702500.0664,000.0220.02750.0808.01.700.120.210.04
SR-208-5_50c5.d0.120.458.4150.900.160.044550.0577,900.0550.01552.0608.00.320.010.03bdl
SR-208-5_50c7a.d0.010.760.466.670.360.02120.0616,300.014.91600.0600.00.520.010.030.01
CAST-001_c4.d0.074.5010.9052.706.182.346010.0568,800.0118.02830.0717.00.300.020.030.01
CAST-001_c5.d0.046.006.6734.705.680.762310.0549,000.0207.02763.0319.00.260.010.260.01
CE-61c4a.d0.051.6040.10125.800.010.134230.0607,800.07500.03152.0203.00.120.010.01bdl
CE-61c7.d0.055.3018.5088.10bdl0.09449.0597,100.0651.02757.0603.00.090.010.02bdl
CE-61c8.d0.3312.0087.20163.000.010.07767.0540,600.0122,000.03283.0890.00.110.010.030.01
SR-208-5_50c6b.d0.7657.00141.00374.007.822.1012,000.07740,000.05100.026,780.06140.06.100.670.200.04
S used as internal standard; bdl: below detection limit.
Table A4. Gold and other trace element contents in galena obtained by LA-ICP-MS.
197Au75As121Sb107Ag59Co60Ni65Cu66Zn206Pb111Cd55Mn77Se95Mo125Te209Bi
Sample/Spot_Lineppmppmppmppmppmppmppmppmppmppmppmppmppmppmppm
SR-208-5_50c6a.dbdl0.23402.00427.00bdl0.010.560.11768,300.08.270.021.300.010.020.21
SR-208-5_50c7b.d0.030.23161.40195.50bdl0.031.370.01787,200.010.920.0232.500.010.070.18
CE-61c1.d0.0210.40349.10383.700.032.304.62142.00724,000.010.295.002.150.060.750.03
CE-61c4b.d0.012.30423.40466.200.010.673.1024.40761,000.016.400.500.860.060.290.03
CAST-018Ac2.d0.010.0892.80114.600.010.011.160.62798,700.017.470.186.56bdl0.121.40
CAST-018Ac3a.dbdl0.1373.90150.400.010.031.060.69790,800.026.130.5231.80bdl1.083.03
CAST-018Ac8b.dbdl0.0693.60108.000.050.091.873.75798,000.022.270.852.610.520.040.45
S used as internal standard; below detection limit.

Appendix B

Figure A1. Au, Ag, As, Sb, Ni, Cu and Mn distribution maps of the colloform banded pyrite (Py III) aggregate 2 from sample Cast-004. The maps show semi-quantitative values.
Minerals 11 00414 g0a1
Figure A2. Au, Ag, As, Sb, Ni, Cu and Mn distribution maps of the colloform banded pyrite (Py III) aggregate 3 from sample Cast-004. The maps show semi-quantitative values.
Minerals 11 00414 g0a2

References

  1. Emsbo, P. Gold in sedex deposits. Rev. Econ. Geol. 2000, 13, 427–437. [Google Scholar]
  2. Emsbo, P.; Hutchinson, R.W.; Hofstra, A.H.; Volk, J.A.; Bettles, K.H.; Baschuk, G.J.; Johnson, C.A. Syngenetic Au on the Carlin trend: Implications for Carlin-Type deposits. Geology 1999, 27, 59–62. [Google Scholar] [CrossRef]
  3. Oudin, E. Geochemistry of submarine sulfides. In Marine Minerals: Advances in Research and Resource Assessment; Teleki, P.G., Dobson, M.R., Moore, J.R., von Stackelberg, U., Eds.; Springer: Dordrecht, The Netherlands, 1987; pp. 349–362. [Google Scholar]
  4. Large, D.E.; Walcher, E. The Rammelsberg massive sulphide Cu-Zn-Pb-Ba-deposit, Germany: An example of sediment-hosted, massive sulphide mineralization. Miner. Depos. 1999, 34, 522–538. [Google Scholar] [CrossRef]
  5. Cooke, D.R.; Bull, S.W.; Large, R.R.; McGoldrick, P.J. The Importance of Oxidized Brines for the Formation of Australian Proterozoic Stratiform Sediment-Hosted Pb-Zn (Sedex) Deposits. Econ. Geol. 2000, 95, 1–18. [Google Scholar] [CrossRef]
  6. Whitehead, R.E.; Davies, J.F.; Valdes-Nodarse, E.L.; Diaz-Carmona, A. Mineralogical and chemical variations, Castellanos shale-hosted Zn-Pb-Ba deposit, northwestern Cuba. Econ. Geol. 1996, 91, 713–722. [Google Scholar] [CrossRef]
  7. Cobiella-Reguera, J.L. Jurassic and Cretaceous Geological History of Cuba. Int. Geol. Rev. 2000, 42, 594–616. [Google Scholar] [CrossRef]
  8. DeGolyer, E. The Geology of Cuban Petroleum Deposits. AAPG Bull. 1918, 2, 133–167. [Google Scholar] [CrossRef]
  9. Haczewski, G. Sedimentological reconnaissance of the San Cayetano Formation: An accumulative continental margin in the Jurassic of western Cuba. Acta Geol. Pol. 1976, 26, 331–353. [Google Scholar]
  10. Meyerhoff, A.A.; Hatten, C.W. Bahamas Salient of North America. Geol. Cont. Margins 1974, 58, 429–446. [Google Scholar] [CrossRef]
  11. García-Casco, A.; Iturralde-Vinent, M.A.; Pindell, J. Latest Cretaceous Collision/Accretion between the Caribbean Plate and Caribeana: Origin of Metamorphic Terranes in the Greater Antilles. Int. Geol. Rev. 2008, 50, 781–809. [Google Scholar] [CrossRef]
  12. Maynard, J.B.; Elswick, E.R.; Hower, J.C. Reflectance of dispersed vitrinite in shales hosting Pb–Zn–Cu ore deposits in western Cuba: Comparison with clay crystallinity. Int. J. Coal Geol. 2001, 47, 161–170. [Google Scholar] [CrossRef]
  13. Valdés-Nodarse, E.L. Pb-Zn “SEDEX” deposits and their copper stockwork roots, western Cuba. Miner. Depos. 1998, 33, 560–567. [Google Scholar] [CrossRef]
  14. Pérez-Valdez, R.G.; Melgarejo, J.C. El yacimiento Matahambre (Pinar del Rio, Cuba): Estructura y mineralogía. Acta Geol. Hisp. 1998, 33, 133–152. [Google Scholar]
  15. Cobiella-Reguera, J.L. Reconstrucción palinspástica del paleomargen mesozoico de América del Norte en Cuba occidental y el sudeste del Golfo de México. Implicaciones para la evolución del SE del Golfo de México. Rev. Mex. Cienc. Geol. 2008, 25, 382–401. [Google Scholar]
  16. Astajov, K.; Solianik, V.; Vasilev, V.; Martínez, D.; Fernández de Lara, R.; Oubiña, J.; Demidov, S.; Santamaría, Z. Informe sobre los trabajos de levantamiento geológico a escala 1: 50,000 en parte noroeste de Pinar del Río (hojas 3484-III—3483-III—3483-IIIa) (unpublished charts). Oficina Nac. de Recur. Miner. Minist. de Energía y Minas La Habana 1980, 497. [Google Scholar]
  17. Gordon, M.; Mann, P.; Cáceres, D.; Flores, R. Cenozoic tectonic history of the North Ameria-Caribbean plate boundary in westetern Cuba. J. Gophys. Res. 1997, 102, 10005–10082. [Google Scholar] [CrossRef]
  18. Bralower, T.; Iturralde-Vinent, M. Micropaleontological dating of the collision between the North America and Caribean plates in western Cuba. Palaios 1997, 12, 133–150. [Google Scholar] [CrossRef] [Green Version]
  19. Paton, C.; Hellstrom, J.; Paul, B.; Woodhead, J.; Hergt, J. Iolite: Freeware for the visualization and processing of mass spectrometric data. J. Anal. At. Spectrom. 2011, 26, 2508–2518. [Google Scholar] [CrossRef]
  20. Sawlowicz, Z. Pyrite framboids and their development: A new conceptual mechanism. Acta Diabetol. 1993, 82, 148–156. [Google Scholar] [CrossRef]
  21. Liu, Z.; Chen, D.; Zhang, J.; Lü, X.; Wang, Z.; Liao, W.; Shi, X.; Tang, J.; Xie, G. Pyrite Morphology as an Indicator of Paleoredox Conditions and Shale Gas Content of the Longmaxi and Wufeng Shales in the Middle Yangtze Area, South China. Minerals 2019, 9, 428. [Google Scholar] [CrossRef] [Green Version]
  22. Taylor, K.G.; Macquaker, J.H.S. Iron Minerals in Marine Sediments Record Chemical Environments. Elements 2011, 7, 113–118. [Google Scholar] [CrossRef]
  23. Ohfuji, H.; Rickard, D. Experimental synthesis of framboids—A review. Earth Sci. Rev. 2005, 71, 147–170. [Google Scholar] [CrossRef]
  24. Ohmoto, H. Formation of volcanogenic massive sulfide deposits: The Kuroko perspective. Ore Geol. Rev. 1996, 10, 135–177. [Google Scholar] [CrossRef]
  25. Almodóvar, G.R.; Yesares, L.; Sáez, R.; Toscano, M.; González, F.; Pons, J.M. Massive Sulfide Ores in the Iberian Pyrite Belt: Mineralogical and Textural Evolution. Minerals 2019, 9, 653. [Google Scholar] [CrossRef] [Green Version]
  26. Lyons, T.W.; Gellatly, A.M.; McAurick, P.J.; Kah, L.C. Proterozoic sedimentary exhalative (SEDEX) deposits andlinks to evolving global ocean chemistry. In Evolution of Early Earth’s Atmosphere, Hydrosphere, and Biosphere—Constraints from ore Deposits; Kesler, S.E., Ohmoto, H., Eds.; Geological Society of America Memoirs: McLean, VA, USA, 2006. [Google Scholar]
  27. Johnson, C.A.; Emsbo, P.; Poole, F.G.; Rye, R.O. Sulfur- and oxygen-isotopes in sediment-hosted stratiform barite deposits. Geochim. et Cosmochim. Acta 2009, 73, 133–147. [Google Scholar] [CrossRef]
  28. Seewald, J.S.; Seyfried, W.E. The effect of temperature on metal mobility in subseafloor hydrothermal systems: Constraints from basalt alteration experiments. Earth Planet. Sci. Lett. 1990, 101, 388–403. [Google Scholar] [CrossRef]
  29. Seward, T.M.; Williams-Jones, A.E.; Migdisov, A.A. The chemistry of metal transport and deposition by ore-forming hydrothermal fluids. In Treatise on Geochemistry, 2nd ed.; Holland, H.D., Turekian, K.K., Eds.; Elsevier-Pergamon: Amsterdam, The Netherland, 2014; Volume 13. [Google Scholar]
  30. Emsbo, P.; Seal, R.R.; Breit, G.N.; Diehl, S.F.; Shah, A.K. Sedimentary Exhalative (Sedex) Zinc-Lead-Silver Deposit Model; U.S. Geological Survey Investigations Report; U.S. Geological Survey: Reston, VA, USA, 2016. [Google Scholar]
  31. Lydon, J.W. Chemical parameters controlling the origin and deposition of sediment-hosted stratiform lead-zinc deposits. In Short Course in Sediment-Hosted Stratiform Lead Zinc Deposits; Sangster, D.F., Ed.; Mineralogical Association of Canada, Short Course Handbook: Toronto, ON, Canada, 1983; Volume 8, pp. 175–250. [Google Scholar]
  32. Hunt, J.M. Petroleum Geochemistry and Geology; Freeman: New York, NY, USA, 1996. [Google Scholar]
  33. Huston, D.L.; Large, R.R. A chemical model for the concentration of gold in volcanogenic massive sulphide deposits. Ore Geol. Rev. 1989, 4, 171–200. [Google Scholar] [CrossRef]
  34. Jennings, D.S.; Jilson, G.A. Geology and sulphide deposits of the Anvil Range, Yukon. In Mineral Deposits of Northern Cordillera; Morin, J.A., Ed.; Canadian Institute of Mining and Metallurgy: Montreal, QC, Canada, 1986; Volume 39, pp. 39–361. [Google Scholar]
  35. Turner, R.J.W.; Otto, B.B. Structural and stratigraphic setting of the Triumph stratiform zinc-lead-silver deposit, Devonian Milligen Formation, Central Idaho. US Geol. Surv. Bull. 1995, 2064, E1–E27. [Google Scholar]
  36. Mercier-Langevin, P.; Hannington, M.D.; Dubé, B.; Bécu, V. The gold content of volcanogenic massive sulfide deposits. Miner. Depos. 2010, 46, 509–539. [Google Scholar] [CrossRef] [Green Version]
  37. Mercier-Langevin, P.; Hannington, M.D.; Dubé, B.; Piercey, S.J.; Peter, J.M.; Pehrsson, S.J. Precious metal enrichment processes in volcanogenic massive sulphide deposits—A summary of key features, with emphasis on TIGI-4 research contributions. In Targeted Geoscience Initiative 4: Contributions to the Understanding of Volcanogenic Massive Sulphide Deposits Genesis and Exploration Methods Development; Peter, J.M., Mercier-Langevin, P., Eds.; Geological Survey of Canada Open File: Ottawa, ON, Canada, 2015; Volume 7853, pp. 117–130. [Google Scholar]
  38. Sack, P.J.; Large, R.R.; Gregory, D.D. Geochemistry of shale and sedimentary pyrite as a proxy for gold fertility in the Selwyn basin area, Yukon. Miner. Depos. 2018, 53, 997–1018. [Google Scholar] [CrossRef]
  39. Palenick, C.S.; Ustunomiya, S.; Reich, M.; Kesler, S.E.; Wang, L.; Ewing, R.C. “Invisible” Au revealed: Direct imagining of Au nanoparticles in a Carlin-type deposit. Am. Miner. 2004, 89, 1359–1366. [Google Scholar] [CrossRef]
  40. Deditius, A.P.; Reich, M.; Kesler, S.E.; Utsunomiya, S.; Chryssoulis, S.L.; Walshe, J.; Rodney, C.; Ewing, R.C. The coupled geochemistry of Au and as in pyrite from hydrothermal ore deposits. Geochim. Cosmichim. Acta 2014, 140, 644–670. [Google Scholar] [CrossRef] [Green Version]
  41. Pokrovski, G.S.; Kara, S.; Roux, J. Stability and solubility of arsenopyrite, FeAsS, in crustal fluids. Geochim. Cosmochim. Acta 2002, 66, 2361–2378. [Google Scholar] [CrossRef] [Green Version]
  42. McClenaghan, S.H.; Lentz, D.R.; Martin, J.; Diegor, W.G. Gold in the Brunswick No. 12 volcanogenic massive sulfide deposit, Bathurst Mining Camp, Canada: Evidence from bulk ore analysis and laser ablation ICP─MS data on sulfide phases. Miner. Depos. 2009, 44, 523–557. [Google Scholar] [CrossRef]
  43. Dehnavi, A.S.; McFarlane, C.R.M.; Lentz, D.R.; Walker, J.A. Assessment of pyrite composition by LA-ICP-MS techniques from massive sulfide deposits of the Bathust Mining Camp, Canada: From textural and chemical evolution to its application as a vectorial tool for the exploration of VMS deposits. Ore. Geol. Rev. 2018, 92, 656–671. [Google Scholar] [CrossRef]
  44. García-Rodríguez, M. Control Textural en la Distribución del oro en Piritas de la Faja Pirítica Ibérica. Master’s Thesis, University of Huelva, Huelva, Spain, 2020. [Google Scholar]
  45. Gaspar, O.C. mineralogy and sulfide mineral chemistry of the neves corvo ores, portugal: Insight into their genesis. Can. Miner. 2002, 40, 611–636. [Google Scholar] [CrossRef]
  46. Leistel, J.M.; Marcoux, E.; Deschamps, Y.; Joubert, M. Antithetic behaviour of gold in the volcanogenic massive sulphide deposits of the Iberian Pyrite Belt. Miner. Depos. 1997, 33, 82–97. [Google Scholar] [CrossRef]
  47. Velasco, F.; Sánchez-España, J.; Yanguas, A.; Tornos, F. The occurrence of gold in the sulfide deposits of the Iberian Pyrite Belt: Evidence of precious metal remobilization. In Volcanic Environments and Massive Sulfide Deposits; Gemmel, J.B., Pontgrats, J., Eds.; Codes and SEG; University of Huelva: Huelva, Spain, 2000; pp. 221–223. [Google Scholar]
Figure 1. Geological map of the north-west (NW) zone of the Sierra de Los Órganos in NW Cuba, showing the location of the most important mineral deposits: C: Castellanos, SL: Santa Lucía, MM: Minas de Matahambre, N: Nieves and M: Mella. Modified from [16].
Minerals 11 00414 g001
Figure 2. Stratigraphic sequence of the Guaniguanico Terrane at the Sierra de Los Órganos (left) with a detailed description of a section of the San Cayetano formation from Minas de Matahambre to Santa Lucía (right) (see location in Figure 1). The stratigraphic location of the most important ore deposits in the region are indicated in the San Cayetano sequence.
Minerals 11 00414 g002
Figure 3. Block model of the Castellanos orebody showing the distribution of Zn (A), Pb (B), Fe (C) and Cu (D). Sections A–A’ and B–B’ show local vertical distribution of Zn, Pb, Fe and Cu in the Farallones (A–A’) and Susana (B–B’) blocks.
Minerals 11 00414 g003
Figure 4. Back-scattered electron images of ore-related assemblages of the Castellanos orebody. (A) Fractured pyrite included in late massive chalcopyrite within a stockwork vein; chalcopyrite is partly replaced by covellite. (B,C) Massive pyrite containing flake-like crystals of phyllosilicates (mainly chlorite) and partly dissolved fragments of carbonates (dolomite-ankerite). (D) Lath-like crystals of pyrite interpreted as pseudomorphs of magnetite formed by pseudomorphic replacement of hematite. (E) Framboidal pyrite enclosed and partly replaced by sphalerite and, at lesser extent, galena. Galena also occurs included in sphalerite. (F) Zoned carbonate crystal with dolomite-dominated core and calcite rim. (G) Colloform aggregate of sphalerite containing galena and abundant corroded, partly dissolved crystals of a previous generation of pyrite and, in turn, enveloped by a new generation of pyrite. (H) Alternating colloform bands of sphalerite and pyrite with some galena which preferentially fill late spaces. Galena contains small, partially dissolved inclusions of pyrite, sphalerite and calcite.
Minerals 11 00414 g004
Figure 5. (A) Colloform sphalerite aggregate containing skeletal galena and surrounded by subhedral pyrite. Pyrite contains rounded, partially dissolved inclusions of sphalerite. (B) Subhedral, zoned crystals of sphalerite containing galena along growing planes and enveloped by a new generation of colloform sphalerite containing skeletal galena. (C) Remobilized galena containing partly dissolved remains of pyrite, sphalerite and quartz. (D) Barite bands made up of tabular crystals growing perpendicular to banding. Thin, discontinuous layers of sphalerite occur along bands boundaries. (E) Radial aggregates of tabular crystals of barite containing calcite nuclei. (F) Aggregate of tabular barite crystals containing abundant, rounded, partly dissolved inclusions of pyrite and sphalerite. (G) Different generations of barite superimposed on the same ore assemblage: early barite containing abundant inclusions of phyllosilicates and sulfides (Barite I), tabular barite (Barite II) and late, vein-filling barite (Barite III). (H) Chalcopyrite including cracked pyrite with barite filling some of the fractures. Note that chalcopyrite postdates barite.
Minerals 11 00414 g005
Figure 6. Paragenetic sequence of major minerals of the Castellanos Zn-Pb deposit.
Minerals 11 00414 g006
Figure 7. Scatter diagrams (log scale) showing the relationships between Au and As, Sb, Ag, Cu, Ni and Mn in different textural types of pyrite.
Minerals 11 00414 g007
Figure 8. Au, Ag, As, Sb, Ni, Cu and Mn distribution maps of colloform banded pyrite (Py III) aggregate 1 from sample Cast-004. The maps show semi-quantitative values.
Minerals 11 00414 g008
Figure 9. Au, Ag, As, Sb, Ni, Cu and Mn distribution maps of a euhedral pyrite crystal (Py IIb) from sample SR-208/5.5–5.8. The maps show semi-quantitative values.
Minerals 11 00414 g009
Table 1. Gold contents (ppm) in different textural types of pyrite.
SampleTextureNMinimumMaximumAverage
Cast-001Colloform (Py IIa)40.370.980.65
Top
Cast-004Colloform, banded (Py III)132.5337.3017.58
CE-61Colloform (Py IIa)42.023.982.86
Subhedral (Py IIb)24.4713.939.02
SR-208/5.5–5.8Colloform (Py IIa)60.031.941.06
Euhedral (Py IIb)110.047.201.99
Interior
Cast-018AColloform (Py IIa)20.150.430.29
Subhedral (Py IIb)70.081.720.82
Bottom
SR-185/0.6–0.7Pseudomorphic (Py IIa)60.112.900.99
Massive (Py IIc)60.010.530.18
N: number of spot or line analyses.
Table 2. Correlation matrix of trace elements in pyrite.
AgAsAuBiCdCoCuMnMoNiPbSbSeTeZn
Ag1
As0.881
Au0.810.761
Bi0.320.390.091
Cd0.210.180.22−0.031
Co0.090.140.000.25−0.061
Cu0.560.480.390.100.020.041
Mn0.520.620.410.260.130.060.401
Mo0.550.620.390.080.610.130.200.281
Ni0.280.360.160.040.010.330.130.320.271
Pb0.400.490.100.82−0.050.310.220.270.180.161
Sb0.870.820.900.110.220.020.360.460.520.210.151
Se0.550.490.450.470.100.320.210.300.290.330.380.471
Te0.690.760.700.640.340.110.260.420.530.120.490.700.601
Zn0.200.180.21−0.021.00−0.070.020.140.590.02-0.050.210.100.341
Bold: correlation values ≥ 0.75.
Publisher’s Note: MDPI stays neutral with regard to jurisdictional claims in published maps and institutional affiliations.

