Article

A Study on the Intersection of Ground Reaction Forces during Overground Walking in Down Syndrome: Effects of the Pathology and Left–Right Asymmetry

1
Institute of Sport Sciences, Friedrich Schiller University Jena, 07749 Jena, Germany
2
Department of Orthopedic Surgery, Klinikum Bayreuth GmbH, 95445 Bayreuth, Germany
3
Dipartimento di Elettronica, Informazione e Bioingegneria, Politecnico di Milano, 20133 Milano, Italy
4
Department of Biomedical Sciences for Health, Università degli Studi di Milano, 20133 Milano, Italy
5
Bayreuth Center of Sport Science, University of Bayreuth, 95440 Bayreuth, Germany
6
IRCCS San Raffaele Pisana Hospital, Tosinvest Sanità, 00163 Roma, Italy
*
Author to whom correspondence should be addressed.
These authors contributed equally to this work.
Symmetry 2023, 15(2), 544; https://doi.org/10.3390/sym15020544
Submission received: 12 January 2023 / Revised: 7 February 2023 / Accepted: 15 February 2023 / Published: 17 February 2023
(This article belongs to the Special Issue Biology and Symmetry/Asymmetry:Feature Papers 2022)

Abstract

:
Motor dysfunctions in patients with Down Syndrome (DS) result in poor locomotion and an altered gait phenotype, characterized by compromised stability management and frequent bilateral asymmetries. Directing ground reaction forces to a point above the center of mass, referred to as the virtual pivot point (VPP), is one means of maintaining stability during walking. This cross-sectional observational study compared the dynamic gait function of 33 individuals with DS (mean age: 17.7 ± 6.4 years, 13 females) to a group of 36 healthy controls (mean age: 15.5 ± 6.1 years, 15 females), using the concept of the VPP. Results showed that the VPP was located more anteriorly in individuals with DS compared to healthy controls, with no differences in the variability (R2) or symmetry of VPP coordinates. This anterior VPP position is likely due to the larger hip moments observed in patients with DS during the propulsive phase of stance. High R2 values in DS suggest that the VPP is strongly related to dynamic stability during walking.

1. Introduction

In patients with Down Syndrome (DS), dysfunctions of the neuropsychomotor and the musculoskeletal system generate impairments in movement planning, organization, and high-order sequencing of the movement patterns involved in locomotion [1]. Such sensorimotor impairments are produced by a combination of ligament laxity, general muscle hypotonia, and altered cognitive function [2,3,4,5]. Motor abnormalities often lead to abnormal postural control, resulting in instability, poor gait function, and higher energy costs of locomotion [5,6,7,8,9,10]. Patients with DS exhibit a gait phenotype characterized by ‘slowness and clumsiness’, namely a low walking speed, large step width, balance deficits, and altered kinematics, often accompanied by joint instability: excessive pelvic tilt; hip adduction and knee flexion; external rotation of the hip, tibia, and foot; and limited mobility of the hip and knee [9,11,12].
In clinical gait analysis, models and specific variables that describe important walking characteristics can help to identify critical impairments that are often hidden within general behavior; the impairments are hardly appraisable under the “overwhelming amount of available motion data” [13,14]. A relevant tool to understand the mechanism of dynamic stability during gait is the virtual pivot point (VPP) [15]. In this framework, the body is conceived as a virtual physical pendulum, whose mechanical stability while walking is achieved by directing the ground reaction forces (GRFs) to a virtual pivot point positioned above (typically 5 to 70 cm) the center of mass (CoM) (Figure 1). The existence of such a spot, underpinning a virtual pendulum movement strategy, was observed in normal and perturbed human [16,17,18,19] and avian gaits, and was applied to achieve walking stability when using exoskeletons and exosuits [20,21,22].
To gain a comprehensive understanding of gait function in individuals with DS, efforts have been made to move beyond the traditional analysis of spatiotemporal parameters and joint angles. Decomposition of gait kinematics revealed that the main locomotor alterations in patients with DS occur in frontal-plane movement patterns associated with stability management, particularly during the transition between single and double support phases [23]. However, to fully understand the motor phenotype of a pathological population, it is key to complement kinematics with an understanding of gait dynamics. In DS, the foot–ground interaction is often impacted by a widespread atypical flat foot condition, impacting the shape of GRFs. Additionally, muscle weakness results in reduced peak plantar flexion in the propulsive phase [9,24], and this might manifest unevenly on the right and left lower limbs due to typical foot rotation asymmetry [25,26]. Additionally, this reduced peak plantar flexion leads to a lower second peak in the horizontal (x) and vertical (y) GRFs [27,28]. These lower forces have actually been reported specifically for DS patients (horizontal GRFs [9], vertical GRFs [29,30]), although there is not a large amount of literature about the GRFs in DS.
The ratio of forces is relevant for determining the position of the virtual pivot point [17]. A lower proportion of horizontal GRFs causes the force vector to become steeper and thus the VPP to move upwards. Since the horizontal GRFs have smaller absolute values than the vertical GRFs, here, absolute differences have more weight as compared to vertical GRFs. To our knowledge, there is no literature describing the forces in the braking phase, so we assume no differences between DS patients and healthy controls here. Thus, we expect a higher VPP in DS relative to controls due to the lower horizontal GRFs in the propulsive phase. Asymmetry in forces, with more braking than propulsion, would result in backward rotation, potentially causing the VPP to move posteriorly, similar to the horizontal VPP position with a forward inclined trunk [16]. Because of the characteristic ‘clumsiness’, a larger spread in the orientation of the GRFs around one point is expected in DS patients. This leads to a set of preliminary hypotheses: (i) the VPP position could be higher and more posterior in DS patients compared to healthy controls, (ii) the spread around the VPP could increase, and (iii) the VPP position during the right and left step may be less symmetric in patients due to morpho-functional abnormalities.
Complete knowledge of postural control, kinematics, and kinetics during the gait cycle might be helpful to design effective therapeutic and rehabilitation protocols [7,9,13,24]. The VPP construct has never been used to examine the dynamic locomotor behavior of individuals with DS. This study aims to fill this gap in the literature by using the virtual pendulum model to reveal dynamic features specific to the pathological condition and potential bilateral asymmetries.

2. Materials and Methods

2.1. Study Design and Participants

This was part of a cross-sectional retrospective observational cohort study conducted on a dataset of 178 patients aged 6–49 years and diagnosed with DS at the IRCCS San Raffaele Pisana Hospital (Rome, Italy). Inclusion criteria were as follows: diagnosed pure trisomy 21, no clinical sign of dementia, no previous surgical interventions or significant orthopedic treatment, ability to understand and perform a gait test independently and without any assisting devices. A control group (CG) of 79 healthy subjects aged 12–31 years was also considered. Selection criteria for these were as follows: no prior history of cardiovascular, neurological, or musculoskeletal disorders; normal range of motion and muscle strength; no sign of postural/motor deficit. Participants or their legal guardians signed a written informed consent form before processing. All data were anonymized before being processed. The study was approved by the Ethics Committee of the IRCCS San Raffaele Hospital (protocol n. 17/17, June 2017) and was conducted according to the World Medical Association Declaration of Helsinki.
For this study, 33 patients with DS (13 females) and 36 healthy controls (CG, 15 females) were selected who showed a preferred walking speed between 0.7 and 1.5 m·s−1. Their anthropometrics are detailed in Table 1.

2.2. Procedures and Gait Data Processing

Before the gait tests, anthropometric data were recorded. Height was measured with a stadiometer to the nearest 1 mm with participants barefoot and standing in an upright position with the head in the Frankfort plane. Weight was measured to the nearest 0.1 kg with a professional medical scale with the subject wearing minimal clothing.
Participants were requested to walk at a self-selected comfortable speed on a 10-m walkway. Routine gait analysis tests were performed with a 12-camera motion capture system (Elite 2002, BTS, Milan, Italy) recording at 100 Hz the three-dimensional position of 22 spherical passive markers (15-mm diameter) positioned according to the Davis protocol [31]. One complete gait cycle (comprising one right and one left step, i.e., from a heel strike to the subsequent heel strike for each leg) per patient was detected by means of two force plates (sampling frequency: 1000 Hz; Kistler, Switzerland) positioned halfway down the walkway and embedded on the floor. The GRF profile during the gait cycle was obtained.
Using the Davis protocol, the hip, knee, and ankle joint centers were calculated based on markers’ coordinates, regression equations, and anthropometric measurements. Similarly, spatial–temporal parameters, joint kinematics, and kinetics were obtained. The CoM position was determined using the segmental centroid method; mass distributions were chosen according to sex and age [32,33].

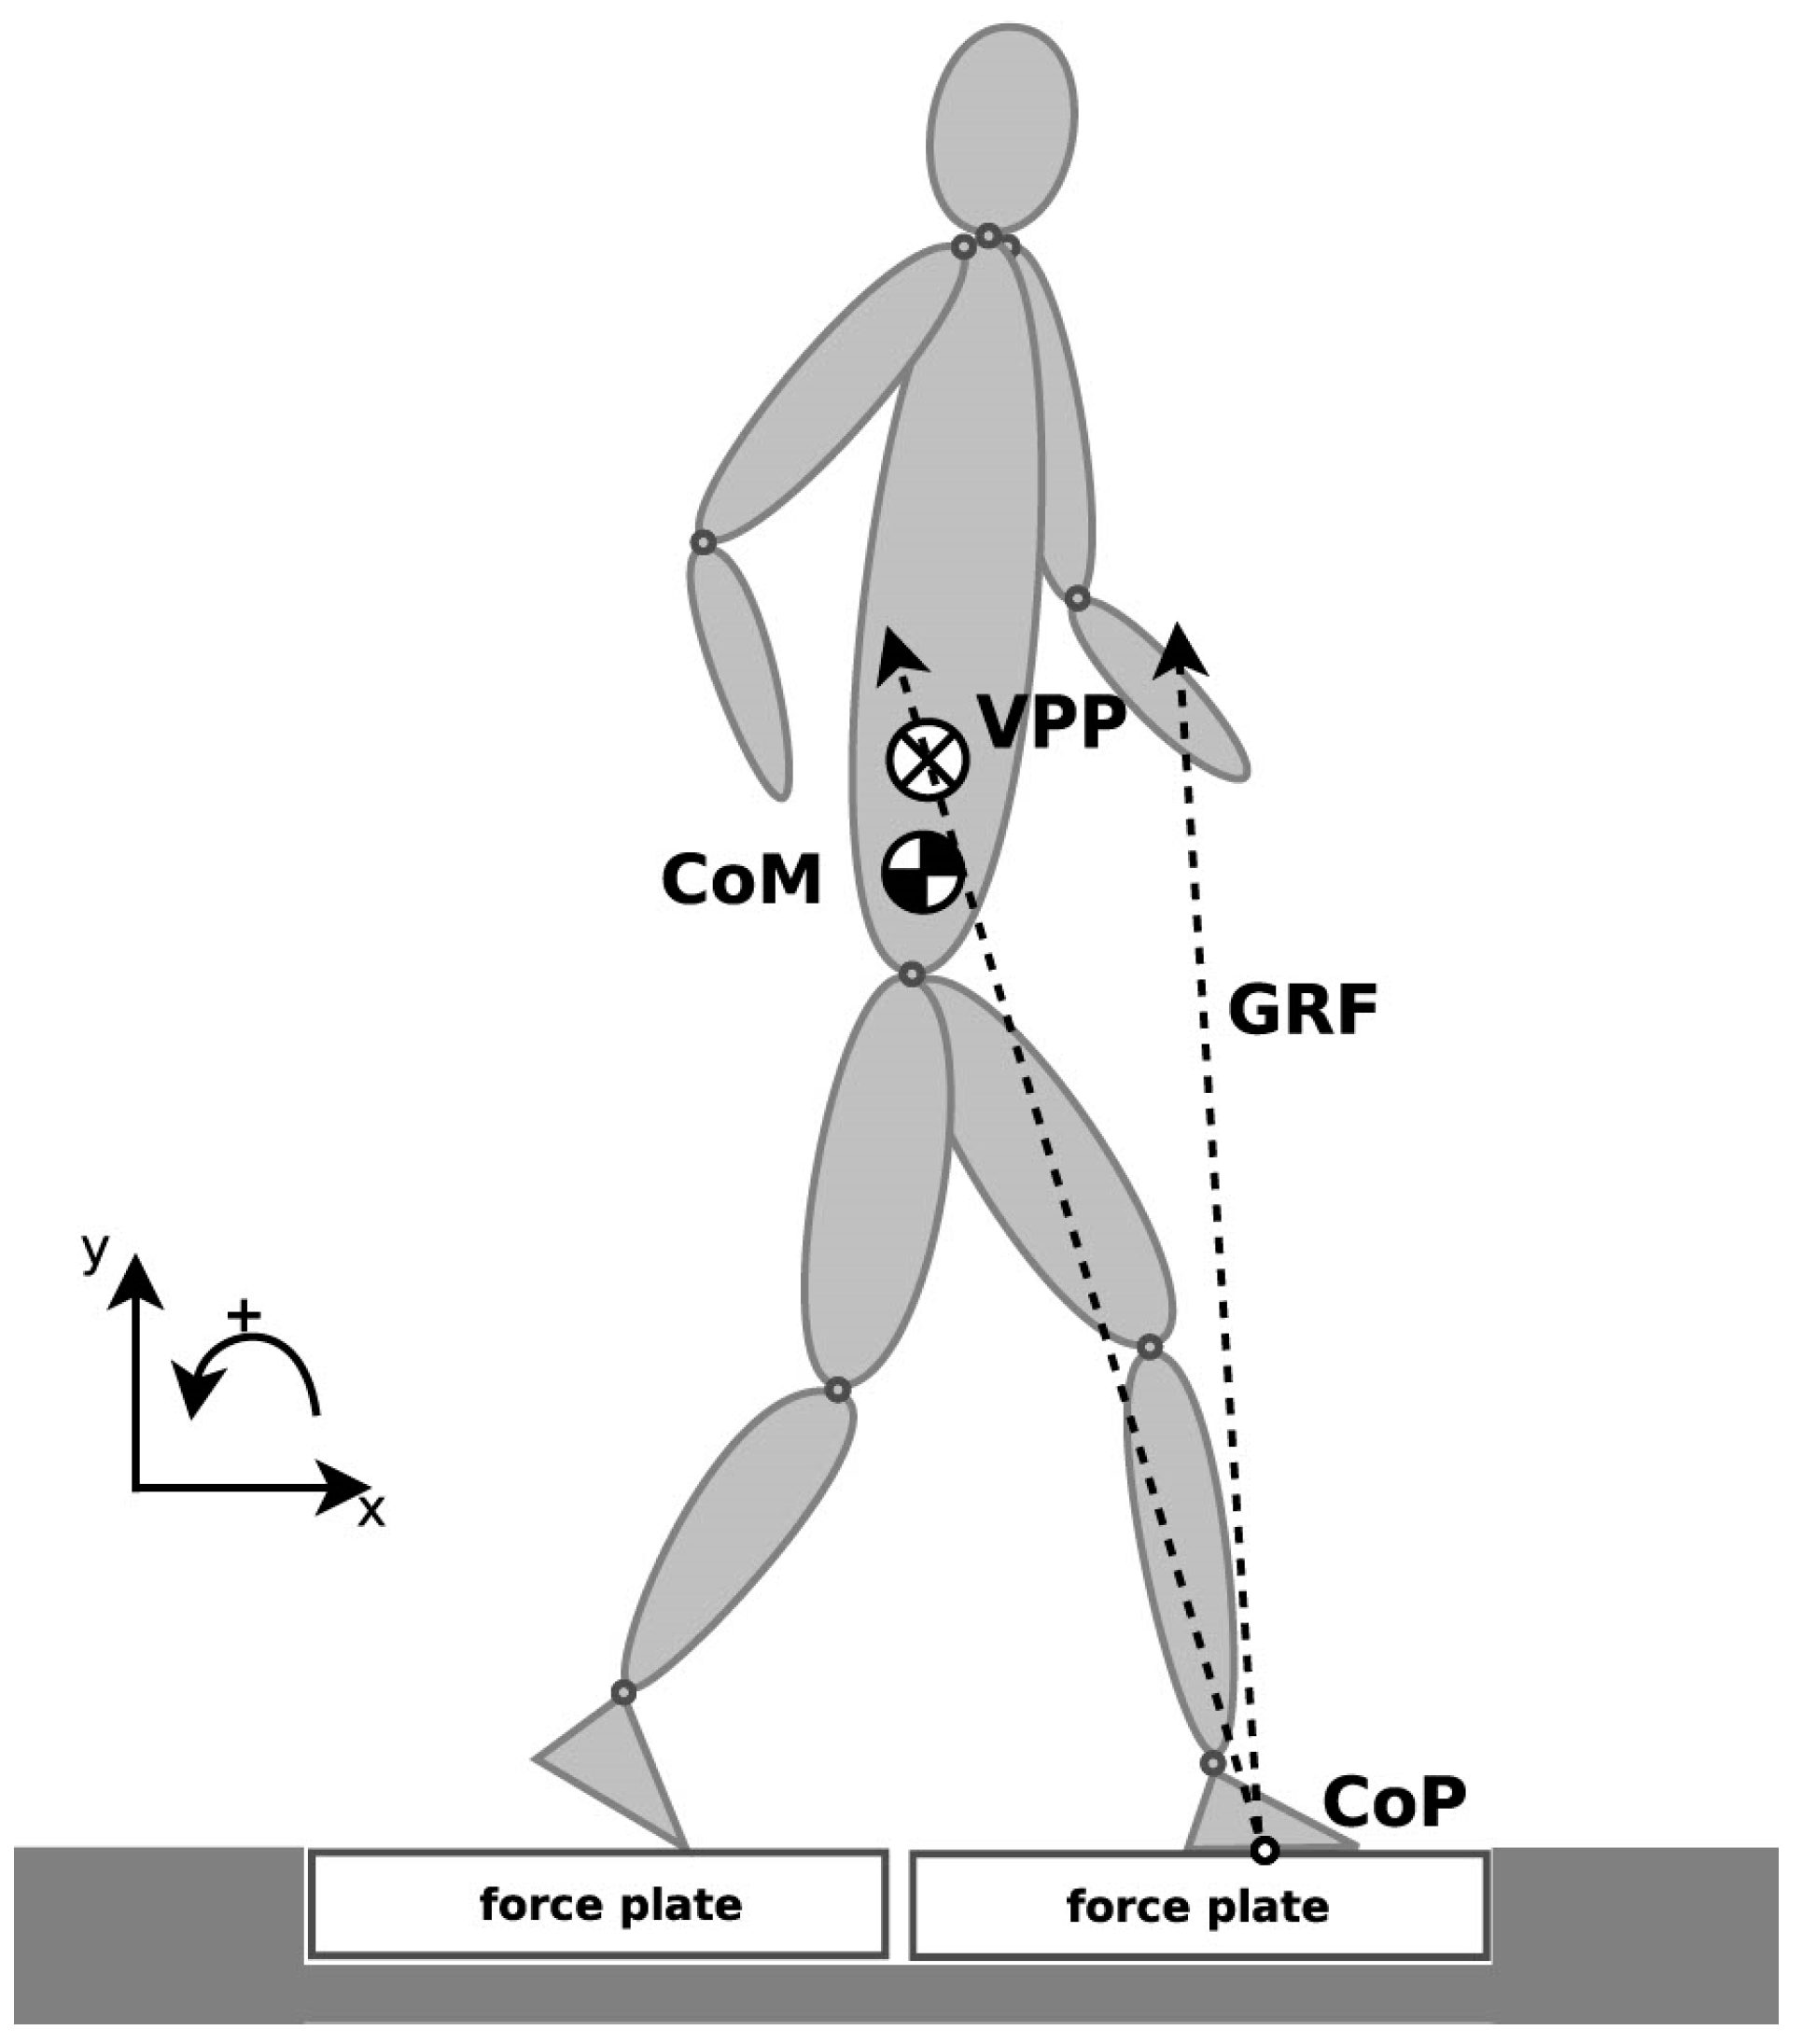
2.3. Virtual Pivot Point Computation

To calculate the VPP, a CoM-centered coordinate system with the vertical axis parallel to gravity and GRFs starting at the center of pressure (CoP) were used for every instance of measurement. The position of the VPP (Figure 1) with respect to the CoM is the point where the sum of the squared perpendicular distances to the GRFs from 10% to 90% of stance time is minimal [15,16,17,19]. The coefficient of determination (R2) was calculated as described by Müller et al. [16]. The VPP position was computed in the anterior–posterior and vertical directions. VPP coordinates were normalized to the body weight and height of each participant, to account for body size mismatches in the two groups. VPP positions were graphically represented in scatter plots reporting the individual normalized coordinates with the related 95% confidence ellipse and group-wise average positions.

2.4. Symmetry Angle

To provide a measure of symmetry on the VPP coordinates, the symmetry angle (SA, expressed as %) was calculated as follows [34]:
S A = 45 ° tan 1 R i g h t   c o o r d i n a t e L e f t   c o o r d i n a t e 90 ° · 100
SA equal to 0% corresponds to perfect symmetry, while SA equal to ± 100% means that the two values are equal and opposite. As we were not biased towards one side in particular, the SA was submitted to statistical analysis as an absolute value.

2.5. Statistical Analysis

We performed a one-sample t-test compared to zero to check for differences in the horizontal VPP coordinate with respect to the CoM (VPPx = 0) position in both groups.
The hypotheses of a change in VPP position were tested by fitting a multivariate general linear model with repeated measures, where (i) the dependent variables were the normalized coordinates of VPPi (where i is x: anterior–posterior, y: vertical); (ii) side (right and left values) were considered as the repeated-measures factor; (iii) sample (DS vs. CG) was the between-group factor; (iv) gait speed was considered as a covariate.
Measures of effect size were provided as partial eta squared ( η 2 ). Values of 0.01 were considered as small effects, 0.06 as medium effects, and 0.14 as large effects [35]. A significance level of α = 0.05 was implemented throughout.

3. Results

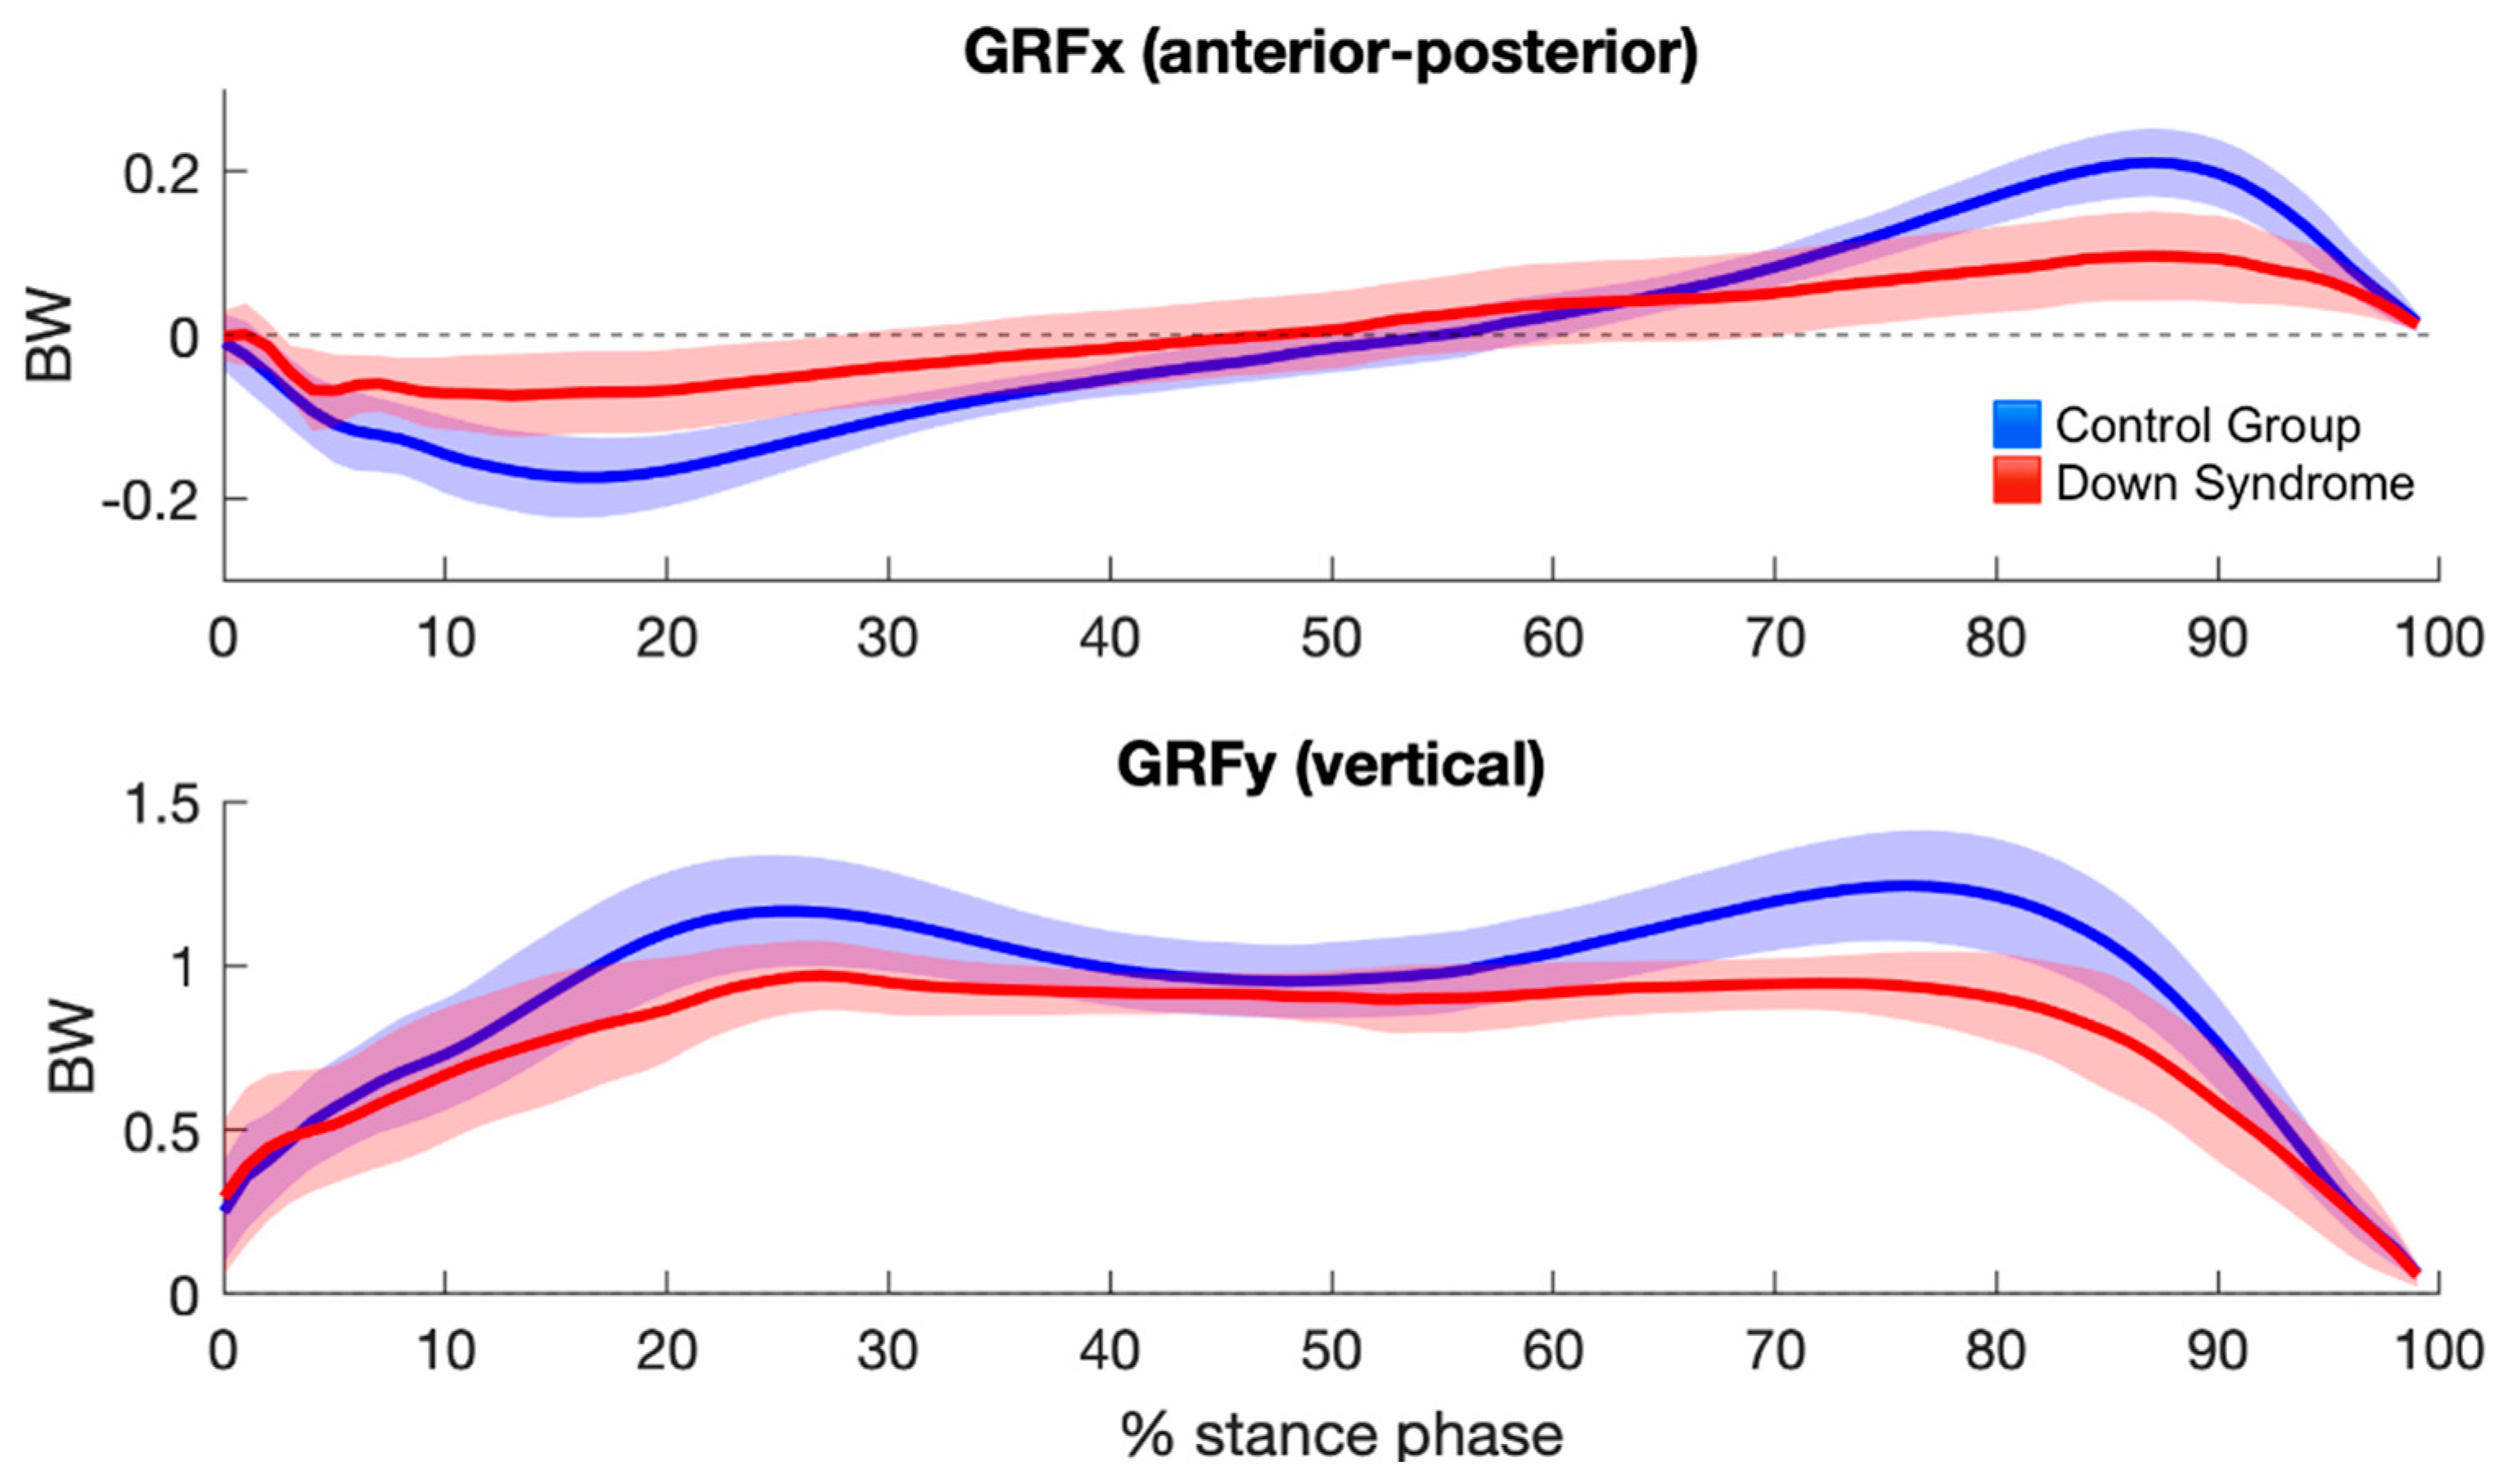
3.1. Ground Reaction Forces

The mean ± standard deviation values of the ground reaction forces are reported in Figure 2. The curve of the horizontal (x) GRFs is flatter for the DS patients than for the healthy controls, and the zero crossing occurs earlier. In the vertical (y) GRFs, the two maxima are lower in the DS than in the CG and it approaches a monomodal profile.

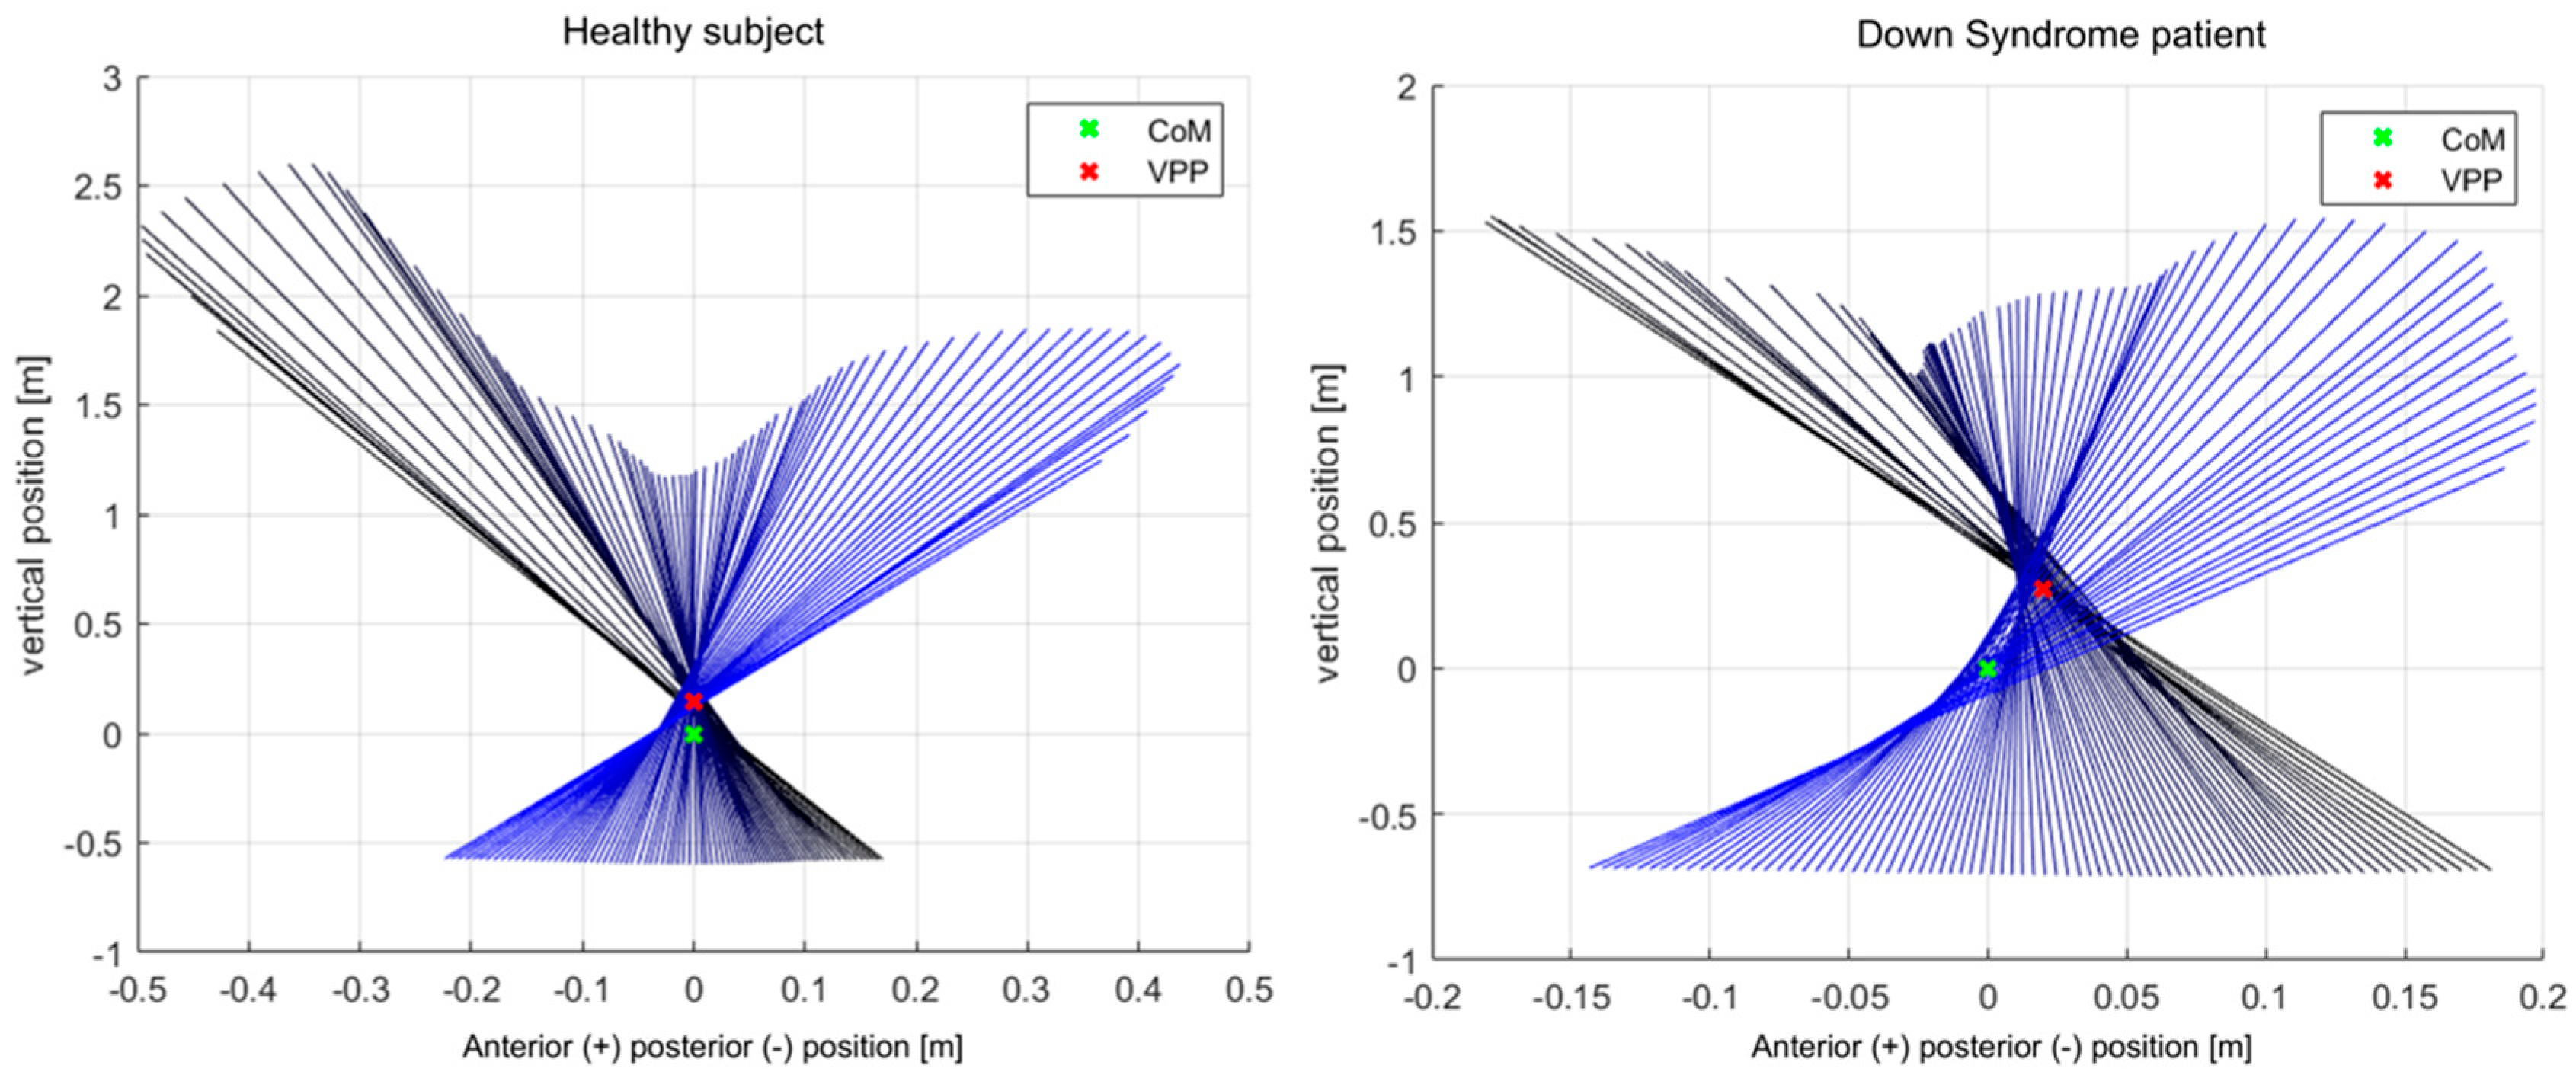
3.2. Virtual Pivot Point Position
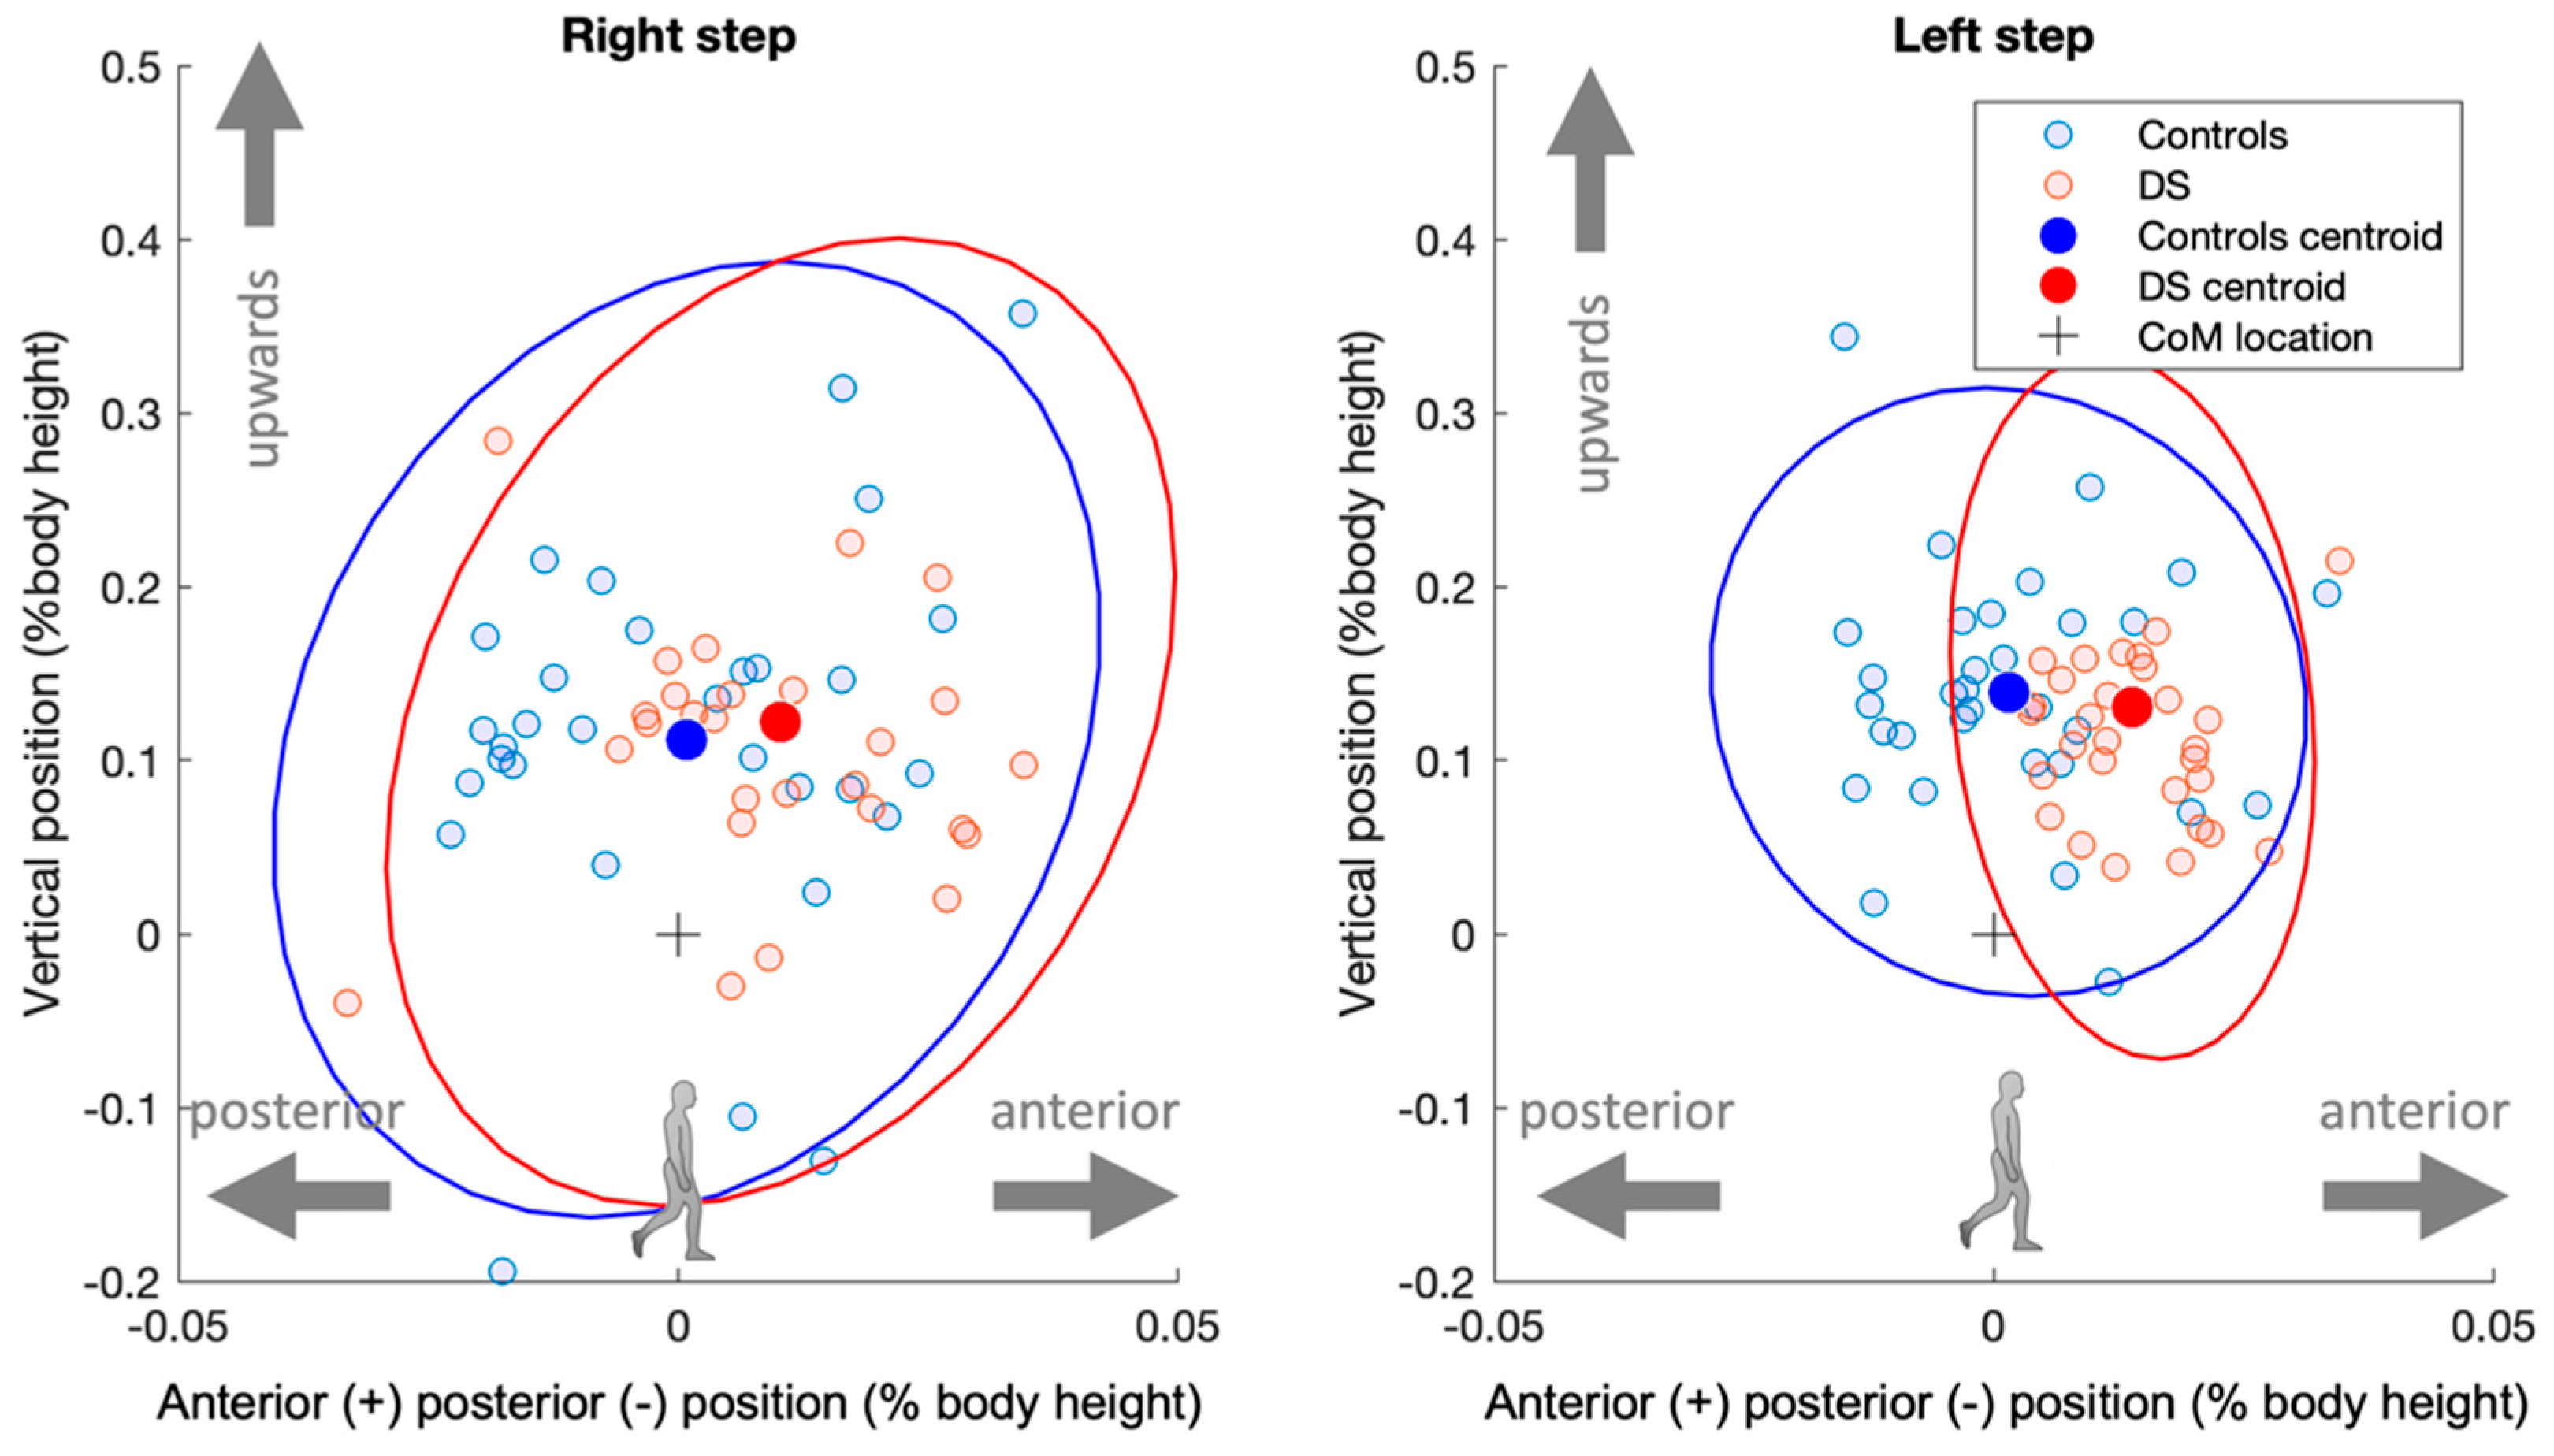
Sample VPP plots are reported in Figure 3. Figure 4 shows the centroid and 95% confidence ellipses for both groups in the sagittal plane. As detailed in Table 2, we did not observe differences in vertical VPP position from zero (p > 0.05, small to medium effects), while, in DS, the VPP was globally located more anteriorly than in CG (p = 0.002, large effect size), and thus it was more anterior than the CoM (Figure 4). Consistently, the position of the horizontal VPP coordinate was statistically different from 0 in DS (p < 0.001, t = 7.276) but not in CG (p = 0.287, t = 0.566).
Concerning R2, no differences between groups could be found (CG: 0.980 ± 0.034, DS: 0.971 ± 0.054; p > 0.05, low effects). Table 2 shows that for all VPP variables (VPPx, VPPy, R2), no speed effects could be observed (p > 0.05, small to medium effects).

3.3. Symmetry

The symmetry angle (SA) is higher for VPPx, with values of 31.3% (DS) and 41.4% (CG). For VPPy, the SA is lower, with values of 20.4% (DS) and 15.6% (CG). No group differences could be found in SA (p > 0.05, low effects), as shown in Table 2.

4. Discussion

The main result of this study is that the intersection of ground reaction forces during walking (VPP) in Down Syndrome is located more anteriorly with respect to healthy controls. This result differs from our expectations (we expected a higher and more posterior position) and might have implications for the interpretation of gait in people with DS. Possible explanations for this deviation will be discussed in the following.

4.1. Virtual Pivot Point Location during Gait

Based on the existing literature, we initially assumed asymmetric bimodal shapes of the vertical GRFs with lower propulsion for DS. However, although the exact ratio of the GRFs is not shown, the collected GRF time series in Figure 2 show that the horizontal and vertical GRFs were almost symmetrical with respect to a vertical line at mid-stance, even in the DS patients, due to lower braking forces.
Several potential explanations exist as to why the observed VPP position resulted from the interaction of VPP input variables. It is possible that these causes may even act in tandem. One possibility is that, as we hypothesized, in the propulsion phase, the lower horizontal GRF in people with Down Syndrome produces steeper force vectors compared to healthy controls. An increase in the horizontal component of the ground reaction forces during the braking phase means that the virtual pivot point (VPP) moves upward and anteriorly during this phase and downward and anteriorly during the propulsion phase. This aligns with the results of the study, as the vertical position of the VPP remained balanced in both phases. It is possible that the ratio of forces was the same in both individuals with DS and healthy controls, despite reduced peaks. The anterior shift in the VPP could be due to an anterior shift in the center of pressure (CoP), as demonstrated by Figure 3 for two representative subjects. Based on the assumed asymmetry in the GRFs, we expected a backward rotation of the body and thus a more posterior VPP position in DS compared to the CG. However, neither clear asymmetry in the GRFs nor a posterior VPP position could be observed. In contrast, the anterior VPP position indicates a forward rotation. The cause of this will be explored further below.
Lewis and Ferris [36] assumed a tradeoff between ankle and hip muscle requirements. This was based on studies with the elderly [37,38] and patients with diabetes mellitus [39], where lower ankle plantar flexion and higher hip moments were observed compared to younger or healthy controls. DS patients have also been reported to have higher hip angle moments [8] and lower ankle plantar flexion moments [6] than healthy controls, which fits with the lower horizontal GRF that we observed in the propulsion phase. Additionally, the horizontal GRF was not balanced around zero, so the propulsion phase lasts longer than the braking phase in DS. A corresponding shift is also found in the hip moments [8]. In addition, the flexion moments are obviously higher than those of the CG [8]. This stronger hip moment increases the energy to propel the trunk clockwise (backwards) and the body counterclockwise [40], which leads to an anterior shift in the VPP [16]. Thus, the VPPx acts asymmetrically in DS and symmetrically in the CG.
The difference in the VPPx position between DS and healthy controls was approximately 1.1% of the body height (mean value, equivalent to 0.02 m with a body stature of 1.5 m). Despite the calculated effect size, these differences are relatively small and should not be overemphasized. This study is also the first to compare the VPP between two groups with a significant difference in body height (t-test, p < 0.001); thus, we decided to normalize the VPP position to the body height. Normalizing the values made them more comparable, but the influence of this normalization on the horizontal direction is not yet fully understood.
In conclusion, the first hypothesis was rejected as the shape of the GRFs differed from our expectations and hip moments appeared to play a significant role in the locomotion of people with DS.

4.2. Spread around One Point

Due to the balance deficits and joint instabilities reported for DS patients [1,25,41], greater variability in gait and thus in the orientation of the GRFs was expected [42]. This would have resulted in a greater spread around the VPP [16,17] and, thus, a lower R2 value in DS patients compared to healthy controls. However, no significant differences were found between the DS patients and the healthy controls in this regard. This could mean that the orientation of the GRFs is strongly controlled even at higher gait variability. Thus, surprisingly, the second hypothesis was also rejected, which further suggests that the VPP could be strongly related to dynamic stability during walking. We argue that we did not observe appraisable alterations in the dynamic expression of the gait function because the gait pattern of the patients involved, although potentially impaired, was established and acquired (see inclusion criteria). This matches with previous observations: in all previous studies on VPP, R2 was similarly high for known gait patterns, but lower when dealing with untrained perturbations [16,17,40].

4.3. Bilateral Asymmetries

In the whole sample (DS and CG), the observed values of SA were higher (>15%) than those computed on traditional gait variables [43] [NO_PRINTED_FORM]. One reason for this could be the comparison of a single step (right vs. left) per subject. A broader view on a larger step count could have yielded more balanced scores, by averaging step-to-step differences into a more representative subject-wise metric.
This issue might have also masked potential differences among groups, which were not observed, contrarily to our initial hypotheses. Based on the current observations, it is not possible to conclude that individuals with DS display a lateral inconsistency between the right and left VPP positions, despite the previously reported unevenness in the peak plantar flexion moments of the right and left limbs, which is a characteristic of the pathological condition [25,26]. What we observed was, however, significant interindividual variability, indicated by large standard deviations and almost doubled asymmetry in the anterior–posterior VPP coordinate compared to the vertical VPP coordinate.

4.4. Conclusions and Perspectives

In this study, a VPP was observed in patients with DS. Here, the VPP was located more anteriorly compared to the CoM and the healthy controls, with no differences in vertical VPP position between the groups. The profiles of the horizontal and vertical GRFs were flatter in DS than in CG, but still nearly symmetrical to a vertical position at mid-stance, which could explain the lack of differences in VPPy. However, the asymmetry in VPPx with respect to the CoM in DS could be caused by several factors: an unequal balance of GRF components, a shifted CoP, or a different cadence. These all contribute, more or less, to DS patients exhibiting lower ankle plantar flexion and, concomitantly, greater hip moments, particularly in the propulsion phase. Together with low braking forces, this rotates the body forward, which in turn implies a forward shift of the VPP. Contrary to our hypothesis, we did not observe significant differences in R2 between CG and DS: values (on average, higher than 0.97) were consistently very high. This suggests that the VPP is strongly related to dynamic stability during walking.
A limitation of the study concerns the comparison of the different groups: factors such as step length, frequency, duty factor, and age could have an influence on the VPP, but were not controlled in detail. Additionally, the sample size was relatively small, so the results need to be validated in future studies with larger samples.
This study marked the first examination of the VPP in individuals with a neurological disorder. Given the potential relationship between the VPP and dynamic stability, further research is warranted to explore its applications in other neurological conditions, such as Parkinson’s disease, stroke, or spasticity. It may even be possible to utilize the VPP as a diagnostic tool to capture dynamic gait features in individuals with pathological conditions.

Author Contributions

Conceptualization, J.V., R.M. and M.Z.; methodology, J.V. and C.S.; software, J.V. and C.S.; validation, R.M., M.G. and J.V.; formal analysis, C.S.; data curation, C.S. and M.Z.; writing—original draft preparation, M.Z. and J.V.; writing—review and editing, M.G., C.S. and R.M.; visualization, M.Z.; supervision, C.C., M.G. and R.M. All authors have read and agreed to the published version of the manuscript.

Funding

This project was supported by the Deutsche Forschungsgemeinschaft (MU 2970/4-2 to R.M.).

Data Availability Statement

Data available on request due to privacy restrictions imposed by the Ethics Committee approval (the data presented in this study are available in anonymized form on request from Manuela Galli and Claudia Condoluci from the San Raffaele Hospital, Via della Pisana 235, 00167 Rome, Italy).

Conflicts of Interest

The authors declare no conflict of interest.

References

  1. Zago, M.; Duarte, N.A.C.; Grecco, L.A.C.; Condoluci, C.; Oliveira, C.S.; Galli, M. Gait and Postural Control Patterns and Rehabilitation in Down Syndrome: A Systematic Review. J. Phys. Ther. Sci. 2020, 32, 303–314. [Google Scholar] [CrossRef] [Green Version]
  2. Wiseman, F.K.; Alford, K.A.; Tybulewicz, V.L.J.; Fisher, E.M.C. Down Syndrome–Recent Progress and Future Prospects. Hum. Mol. Genet. 2009, 18, 75–83. [Google Scholar] [CrossRef] [Green Version]
  3. Anderson-Mooney, A.J.; Schmitt, F.A.; Head, E.; Lott, I.T.; Heilman, K.M. Gait Dyspraxia as a Clinical Marker of Cognitive Decline in Down Syndrome: A Review of Theory and Proposed Mechanisms. Brain Cogn. 2016, 104, 48–57. [Google Scholar] [CrossRef] [Green Version]
  4. Almuhtaseb, S.; Oppewal, A.; Hilgenkamp, T.I.M. Gait Characteristics in Individuals with Intellectual Disabilities: A Literature Review. Res. Dev. Disabil. 2014, 35, 2858–2883. [Google Scholar] [CrossRef]
  5. Galli, M.; Rigoldi, C.; Mainardi, L.; Tenore, N.; Onorati, P.; Albertini, G. Postural Control in Patients with Down Syndrome. Disabil. Rehabil. 2008, 30, 1274–1278. [Google Scholar] [CrossRef]
  6. Rigoldi, C.; Galli, M.; Albertini, G. Gait Development during Lifespan in Subjects with Down Syndrome. Res. Dev. Disabil. 2011, 32, 158–163. [Google Scholar] [CrossRef]
  7. Cimolin, V.; Galli, M.; Grugni, G.; Vismara, L.; Albertini, G.; Rigoldi, C.; Capodaglio, P. Gait Patterns in Prader-Willi and Down Syndrome Patients. J. Neuroeng. Rehabil. 2010, 21, 7–28. [Google Scholar] [CrossRef] [Green Version]
  8. Galli, M.; Rigoldi, C.; Brunner, R.; Virji-Babul, N.; Giorgio, A. Joint Stiffness and Gait Pattern Evaluation in Children with Down Syndrome. Gait Posture 2008, 28, 502–506. [Google Scholar] [CrossRef]
  9. Galli, M.; Cimolin, V.; Rigoldi, C.; Condoluci, C.; Albertini, G. Effects of Obesity on Gait Pattern in Young Individuals with Down Syndrome. Int. J. Rehabil. Res. 2015, 38, 55–60. [Google Scholar] [CrossRef]
  10. Vali Noghondar, N.; Saberi Kakhki, A.; Sohrabi, M.; Alirezaei Noghondar, F. Variability and Coordination Patterns of Walking with Different Speeds in Active and Non-Active Children with Down Syndrome: A Cross-Sectional Case-Control Study. Int. J. Dev. Disabil. 2022, 68, 723–731. [Google Scholar] [CrossRef]
  11. Agiovlasitis, S.; McCubbin, J.A.; Yun, J.; Mpitsos, G.; Pavol, M.J. Effects of Down Syndrome on Three-Dimensional Motion during Walking at Different Speeds. Gait Posture 2009, 30, 345–350. [Google Scholar] [CrossRef]
  12. Salami, F.; Vimercati, S.L.; Rigoldi, C.; Taebi, A.; Albertini, G.; Galli, M. Mechanical Energy Assessment of Adult with Down Syndrome during Walking with Obstacle Avoidance. Res. Dev. Disabil. 2014, 35, 1856–1862. [Google Scholar] [CrossRef]
  13. Benedetti, M.G.; Beghi, E.; de Tanti, A.; Cappozzo, A.; Basaglia, N.; Cutti, A.G.; Cereatti, A.; Stagni, R.; Verdini, F.; Manca, M.; et al. SIAMOC Position Paper on Gait Analysis in Clinical Practice: General Requirements, Methods and Appropriateness. Results of an Italian Consensus Conference. Gait Posture 2017, 58, 252–260. [Google Scholar] [CrossRef]
  14. Malloggi, C.; Zago, M.; Galli, M.; Sforza, C.; Scarano, S.; Tesio, L. Kinematic Patterns during Walking in Children: Application of Principal Component Analysis. Hum. Mov. Sci. 2021, 80, 102892. [Google Scholar] [CrossRef]
  15. Maus, H.M.; Lipfert, S.W.; Gross, M.; Rummel, J.; Seyfarth, A. Upright Human Gait Did Not Provide a Major Mechanical Challenge for Our Ancestors. Nat. Commun. 2010, 1, 70. [Google Scholar] [CrossRef] [Green Version]
  16. Müller, R.; Rode, C.; Aminiaghdam, S.; Vielemeyer, J.; Blickhan, R. Force Direction Patterns Promote Whole Body Stability Even in Hip-Flexed Walking, but Not Upper Body Stability in Human Upright Walking. Proc. R. Soc. A Math. Phys. Eng. Sci. 2017, 473, 20170404. [Google Scholar] [CrossRef] [Green Version]
  17. Vielemeyer, J.; Grießbach, E.; Müller, R. Ground Reaction Forces Intersect above the Center of Mass Even When Walking down Visible and Camouflaged Curbs. J. Exp. Biol. 2019, 222, jeb.204305. [Google Scholar] [CrossRef] [Green Version]
  18. Vielemeyer, J.; Müller, R.; Staufenberg, N.S.; Renjewski, D.; Abel, R. Ground Reaction Forces Intersect above the Center of Mass in Single Support, but Not in Double Support of Human Walking. J. Biomech. 2021, 120, 110387. [Google Scholar] [CrossRef]
  19. Gruben, K.G.; Boehm, W.L. Force Direction Pattern Stabilizes Sagittal Plane Mechanics of Human Walking. Hum. Mov. Sci. 2012, 31, 649–659. [Google Scholar] [CrossRef]
  20. Sharbafi, M.A.; Barazesh, H.; Iranikhah, M.; Seyfarth, A. Leg Force Control Through Biarticular Muscles for Human Walking Assistance. Front. Neurorobot. 2018, 12, 39. [Google Scholar] [CrossRef] [Green Version]
  21. Blickhan, R.; Andrada, E.; Müller, R.; Rode, C.; Ogihara, N. Positioning the Hip with Respect to the COM: Consequences for Leg Operation. J. Theor. Biol. 2015, 382, 187–197. [Google Scholar] [CrossRef]
  22. Andrada, E.; Rode, C.; Sutedja, Y.; Nyakatura, J.A.; Blickhan, R. Trunk Orientation Causes Asymmetries in Leg Function in Small Bird Terrestrial Locomotion. Proc. R. Soc. B Biol. Sci. 2014, 281, 20141405. [Google Scholar] [CrossRef] [Green Version]
  23. Zago, M.; Federolf, P.A.; Levy, S.R.; Condoluci, C.; Galli, M. Down Syndrome: Gait Pattern Alterations in Posture Space Kinematics. IEEE Trans. Neural Syst. Rehabil. Eng. 2019, 27, 1589–1596. [Google Scholar] [CrossRef]
  24. Rigoldi, C.; Galli, M.; Cimolin, V.; Camerota, F.; Celletti, C.; Tenore, N.; Albertini, G. Gait Strategy in Patients with Ehlers-Danlos Syndrome Hypermobility Type and Down Syndrome. Res. Dev. Disabil. 2012, 33, 1437–1442. [Google Scholar] [CrossRef]
  25. Belluscio, V.; Bergamini, E.; Salatino, G.; Marro, T.; Gentili, P.; Iosa, M.; Morelli, D.; Vannozzi, G. Dynamic Balance Assessment during Gait in Children with Down and Prader-Willi Syndromes Using Inertial Sensors. Hum. Mov. Sci. 2019, 63, 53–61. [Google Scholar] [CrossRef]
  26. Valero, C.; Mustacchi, Z.; Bezerra, P.M.; Figueiredo, F.W.S.; Martinelli, P.M.; Carvalho, A.A.S.; Feder, D. Foot Rotation Asymmetry in Down Syndrome and the Relationship with Crawling and Walking Onset: A Crosssectional Study. J. Hum. Growth Dev. 2021, 31, 247–256. [Google Scholar] [CrossRef]
  27. Winter, D.A. Energy Generation and Absorption at the Ankle and Knee during Fast, Natural, and Slow Cadences. Clin. Orthop. Relat. Res. 1983, 175, 147–154. [Google Scholar] [CrossRef]
  28. Liu, M.Q.; Anderson, F.C.; Schwartz, M.H.; Delp, S.L. Muscle Contributions to Support and Progression over a Range of Walking Speeds. J. Biomech. 2008, 41, 3243–3252. [Google Scholar] [CrossRef] [Green Version]
  29. Wu, J.; Ajisafe, T. Kinetic Patterns of Treadmill Walking in Preadolescents with and without Down Syndrome. Gait Posture 2014, 39, 241–246. [Google Scholar] [CrossRef]
  30. Wu, J.; Beerse, M.; Ajisafe, T. Frequency Domain Analysis of Ground Reaction Force in Preadolescents with and without Down Syndrome. Res. Dev. Disabil. 2014, 35, 1244–1251. [Google Scholar] [CrossRef]
  31. Davis, R.B.; Õunpuu, S.; Tyburski, D.; Gage, J.R. A Gait Analysis Data Collection and Reduction Technique. Hum. Mov. Sci. 1991, 10, 575–587. [Google Scholar] [CrossRef]
  32. Ganley, K.J.; Powers, C.M. Anthropometric Parameters in Children: A Comparison of Values Obtained from Dual Energy x-Ray Absorptiometry and Cadaver-Based Estimates. Gait Posture 2004, 19, 133–140. [Google Scholar] [CrossRef]
  33. Muri, J.; Winter, S.L.; Challis, J.H. Changes in Segmental Inertial Properties with Age. J. Biomech. 2008, 41, 1809–1812. [Google Scholar] [CrossRef]
  34. Avrin, R.; Davis, I.; Higginson, J.; Royer, T. The Symmetry Angle: A Novel, Robust Method of Quantifying Asymmetry. Gait Posture 2008, 27, 622–627. [Google Scholar] [CrossRef]
  35. Richardson, J.T.E. Eta Squared and Partial Eta Squared as Measures of Effect Size in Educational Research. Educ. Res. Rev. 2011, 6, 135–147. [Google Scholar] [CrossRef]
  36. Lewis, C.L.; Ferris, D.P. Walking with Increased Ankle Pushoff Decreases Hip Muscle Moments. J. Biomech. 2008, 41, 2082–2089. [Google Scholar] [CrossRef] [Green Version]
  37. DeVita, P.; Hortobagyi, T. Age Causes a Redistribution of Joint Torques and Powers during Gait. J. Appl. Physiol. 2000, 88, 1804–1811. [Google Scholar] [CrossRef] [Green Version]
  38. Judge, J.O.; Davis, R.B.; Öunpuu, S. Step Length Reductions in Advanced Age: The Role of Ankle and Hip Kinetics. J. Gerontol.–Ser. A Biol. Sci. Med. Sci. 1996, 51, M303–M312. [Google Scholar] [CrossRef]
  39. Mueller, M.J.; Minor, S.D.; Sahrmann, S.A.; Schaaf, J.A.; Strube, M.J. Differences in the Gait Characteristics of Patients with Diabetes and Peripheral Neuropathy Compared with Age-Matched Controls. Phys. Ther. 1994, 74, 299–308. [Google Scholar] [CrossRef]
  40. Drama, Ö.; Vielemeyer, J.; Badri-Spröwitz, A.; Müller, R. Postural Stability in Human Running with Step-down Perturbations: An Experimental and Numerical Study: Postural Stability in Human Running. R. Soc. Open Sci. 2020, 7, 200570. [Google Scholar] [CrossRef]
  41. Agiovlasitis, S.; McCubbin, J.A.; Yun, J.; Widrick, J.J.; Pavol, M.J. Gait Characteristics of Adults with Down Syndrome Explain Their Greater Metabolic Rate during Walking. Gait Posture 2015, 41, 180–184. [Google Scholar] [CrossRef]
  42. Masani, K.; Kouzaki, M.; Fukunaga, T. Variability of Ground Reaction Forces during Treadmill Walking. J. Appl. Physiol. 2002, 92, 1885–1890. [Google Scholar] [CrossRef] [Green Version]
  43. Zago, M.; di Giuli, R.; Beltramini, G.; Bolzoni, A.; Baj, A.; Galli, M.; Giannì, A.B.; Sforza, C. Donor-Site Morbidity after Osteocutaneous Free Fibula Transfer: Longitudinal Analysis of Stair Climbing Asymmetry and Functional Outcome. Symmetry 2022, 14, 1888. [Google Scholar] [CrossRef]
Figure 1. Exemplary setup for human walking experiments. Virtual pivot point (VPP) input variables, namely center of mass (CoM), ground reaction force (GRF) and center of pressure (CoP). The theoretical force intersects the CoP and the calculated VPP.
Symmetry 15 00544 g001
Figure 2. Mean and standard deviation of ground reaction force time series (GRF) for the retained participants, normalized to body weight (BW). Horizontal (anterior-posterior, x) GRFs and vertical (y) GRFs are shown.
Symmetry 15 00544 g002
Figure 3. Sample virtual pivot point (VPP) diagrams. Ground reaction forces (GRFs) scaled with factor two originating at the center of pressure in a center of mass (CoM)-centered coordinate system at all considered measurement times are shown for a healthy subject (left) and Down Syndrome patient (right). The illustration of the GRFs starts at 10% of stance time (black) and ends at 90% of stance time (blue). Red crosses indicate the calculated VPP. Green crosses indicate the CoM position, i.e. zero. Note that for better comparability to former studies, this exemplary VPP plot is only normalized to body weight.
Symmetry 15 00544 g003
Figure 4. Virtual pivot point position in the sagittal plane for right (left plot) and left (right plot) step. As a reference, the cross sign indicates the CoM (center of mass) location. DS: Down Syndrome.
Symmetry 15 00544 g004
Table 1. Anthropometrics and gait speed (mean and standard deviation) of the participants retained in the study.
Group
VariableUnitDown SyndromeControl
Ageyears17.7 (6.1)15.5 (6.4)
Heightm1.46 (0.11)1.58 (0.15)
Weightkg56.9 (14.5)55.8 (17.9)
Body mass indexkg·m−225.2 (4.4)21.7 (3.5)
Gait speedm·s−10.94 (0.12)1.00 (0.15)
Table 2. Multivariate repeated-measure statistical output for the main factors (group: Down Syndrome vs. control group; speed: gait velocity). Data are expressed as percentage (SA), percentage of body height (VPP), or as absolute values (R2).
GroupSpeed
VariableGroupMeanSDpFη2pFη2
VPPxCG0.11.40.0068.300.1420.5790.310.006
DS1.21.2
VPPyCG14.07.10.1462.180.0420.8110.060.001
DS12.79.7
R2CG0.9800.0340.4100.690.0140.8100.060.001
DS0.9710.054
SAxCG41.445.30.3370.940.017---
DS31.332.0
SAyCG15.618.50.3570.860.015---
DS20.420.6
CG: control group; DS: Down Syndrome; η2: partial eta-squared effect size; SA: symmetry angle; VPP: virtual pivot point (directions: x, anterior–posterior; y, vertical). Significant p-values in bold.
Disclaimer/Publisher’s Note: The statements, opinions and data contained in all publications are solely those of the individual author(s) and contributor(s) and not of MDPI and/or the editor(s). MDPI and/or the editor(s) disclaim responsibility for any injury to people or property resulting from any ideas, methods, instructions or products referred to in the content.

