
Experimental Evidence Questions the Relationship between Stress and Fluctuating Asymmetry in Plants

 , and
, and
Abstract
:1. Introduction
2. Materials and Methods
2.1. Experimental Design
2.2. Sampling and Sample Processing
2.3. Data Analysis
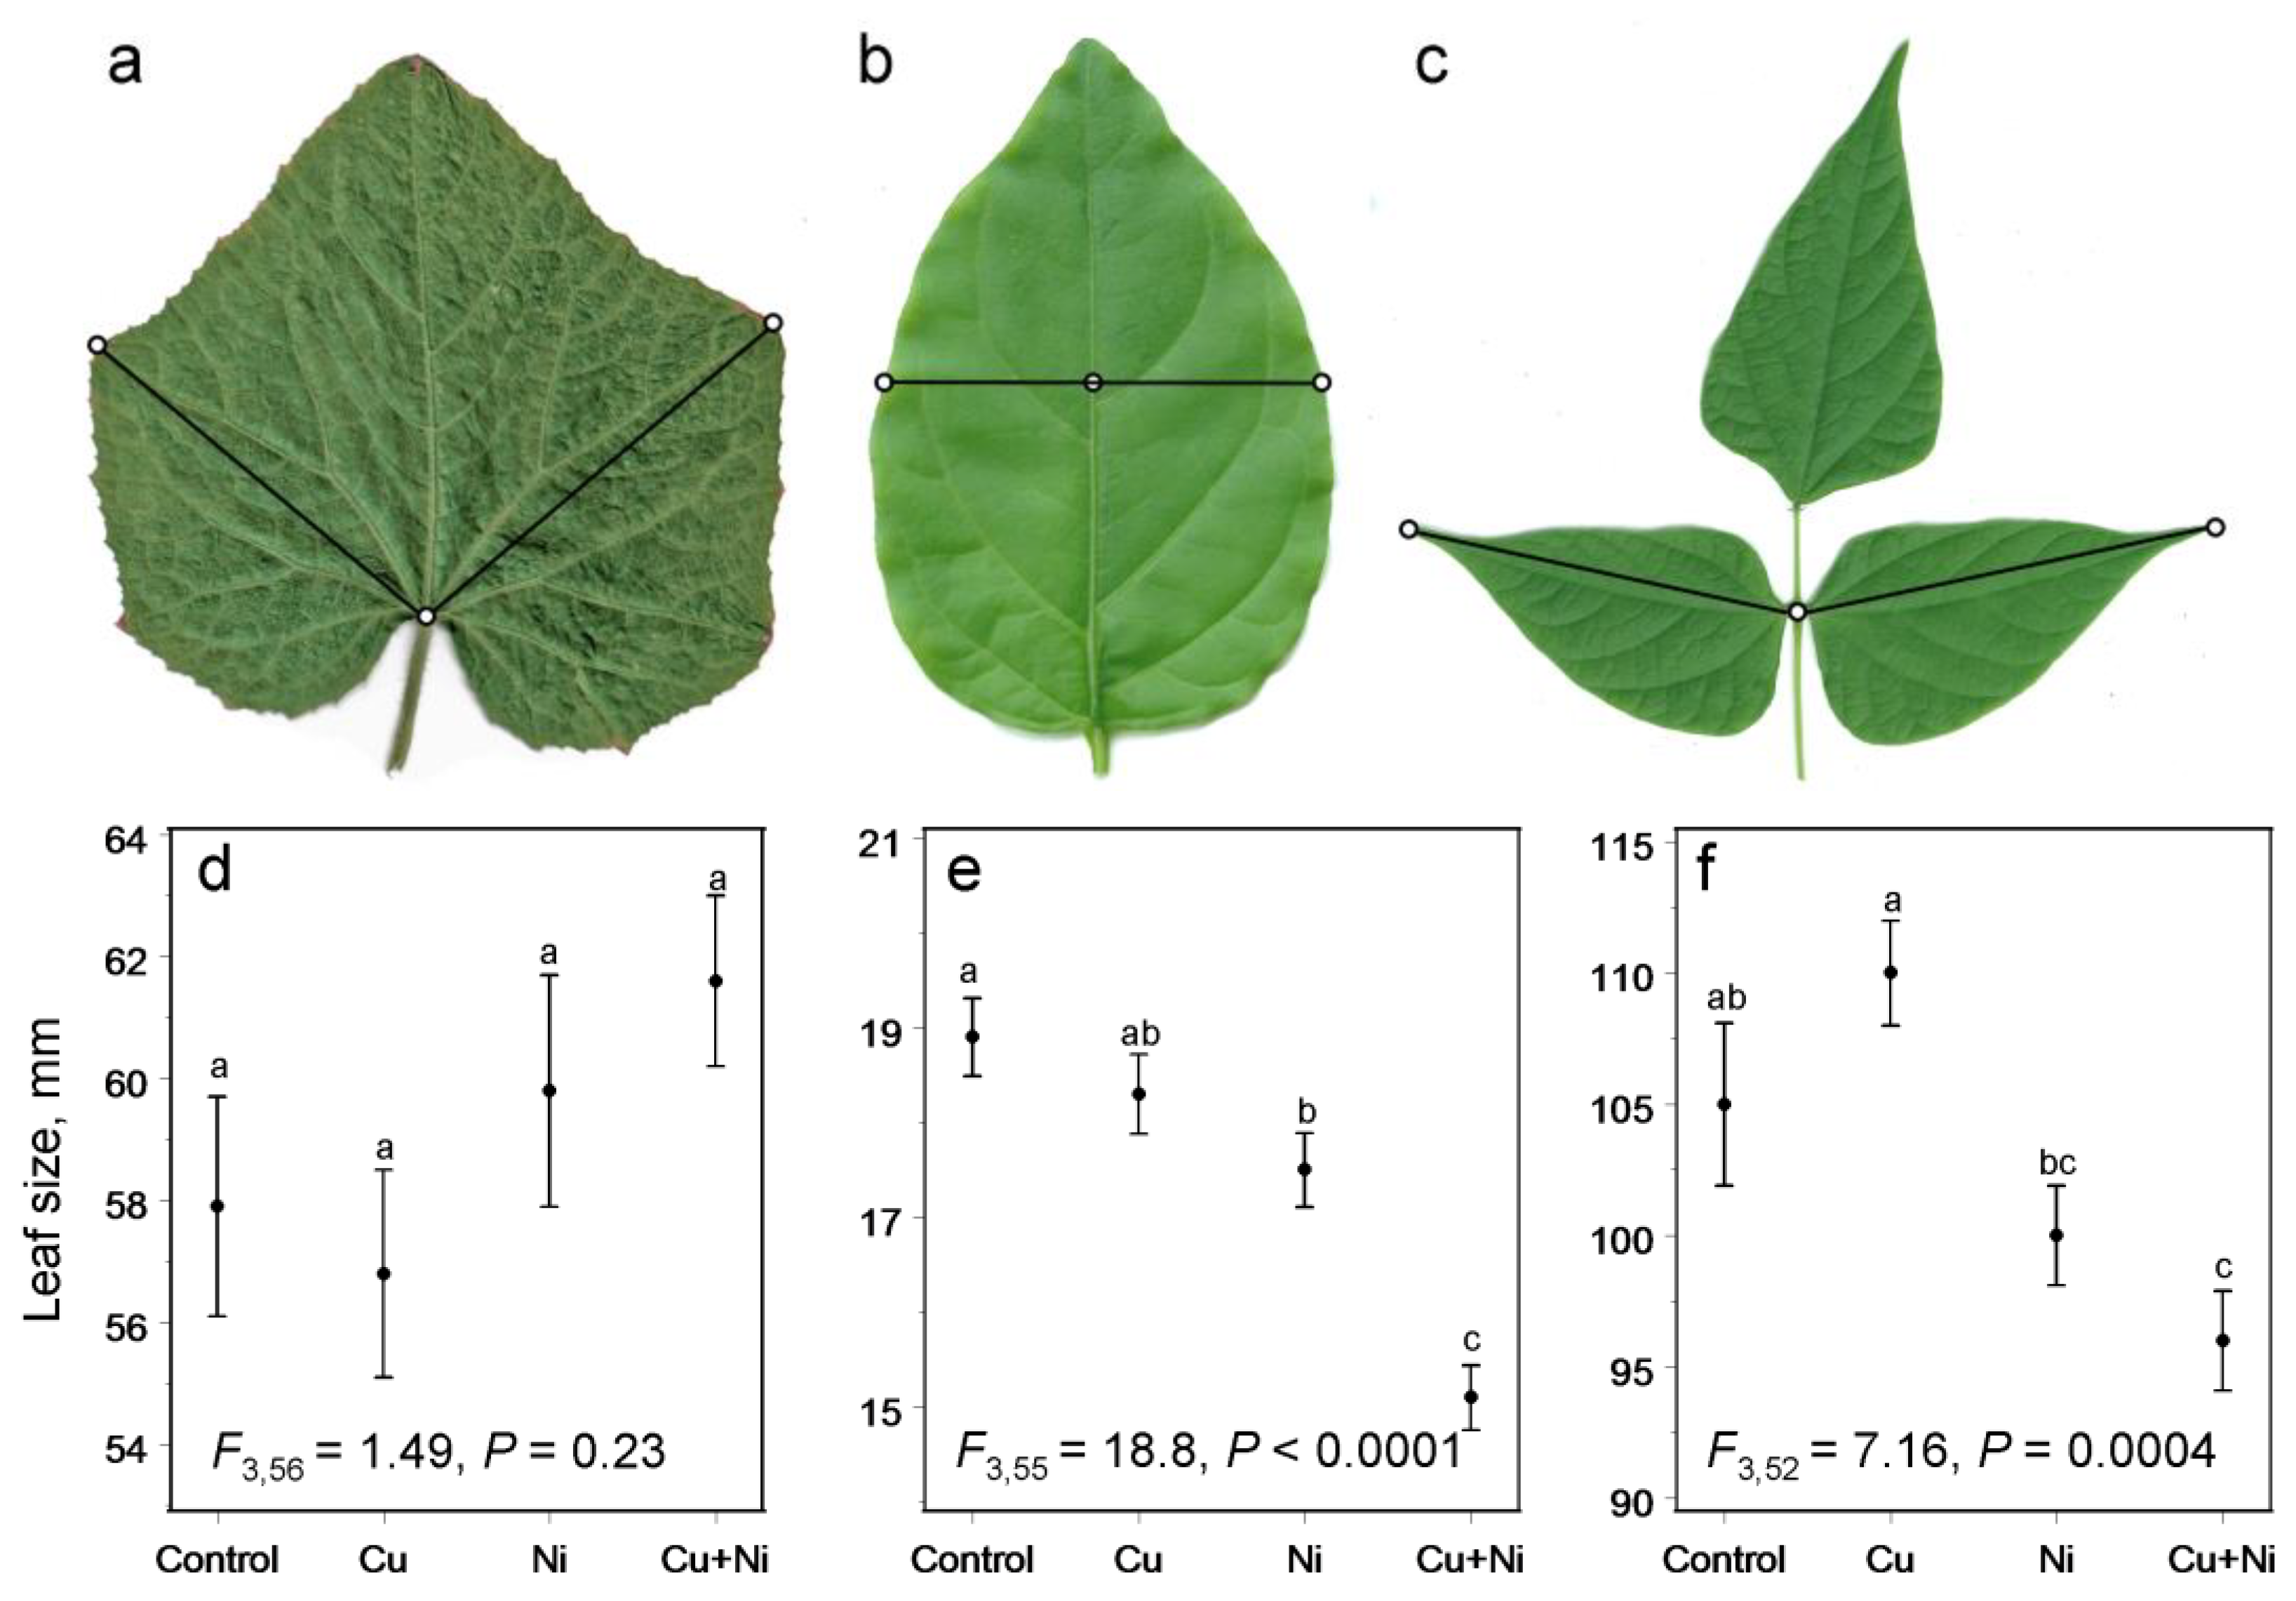
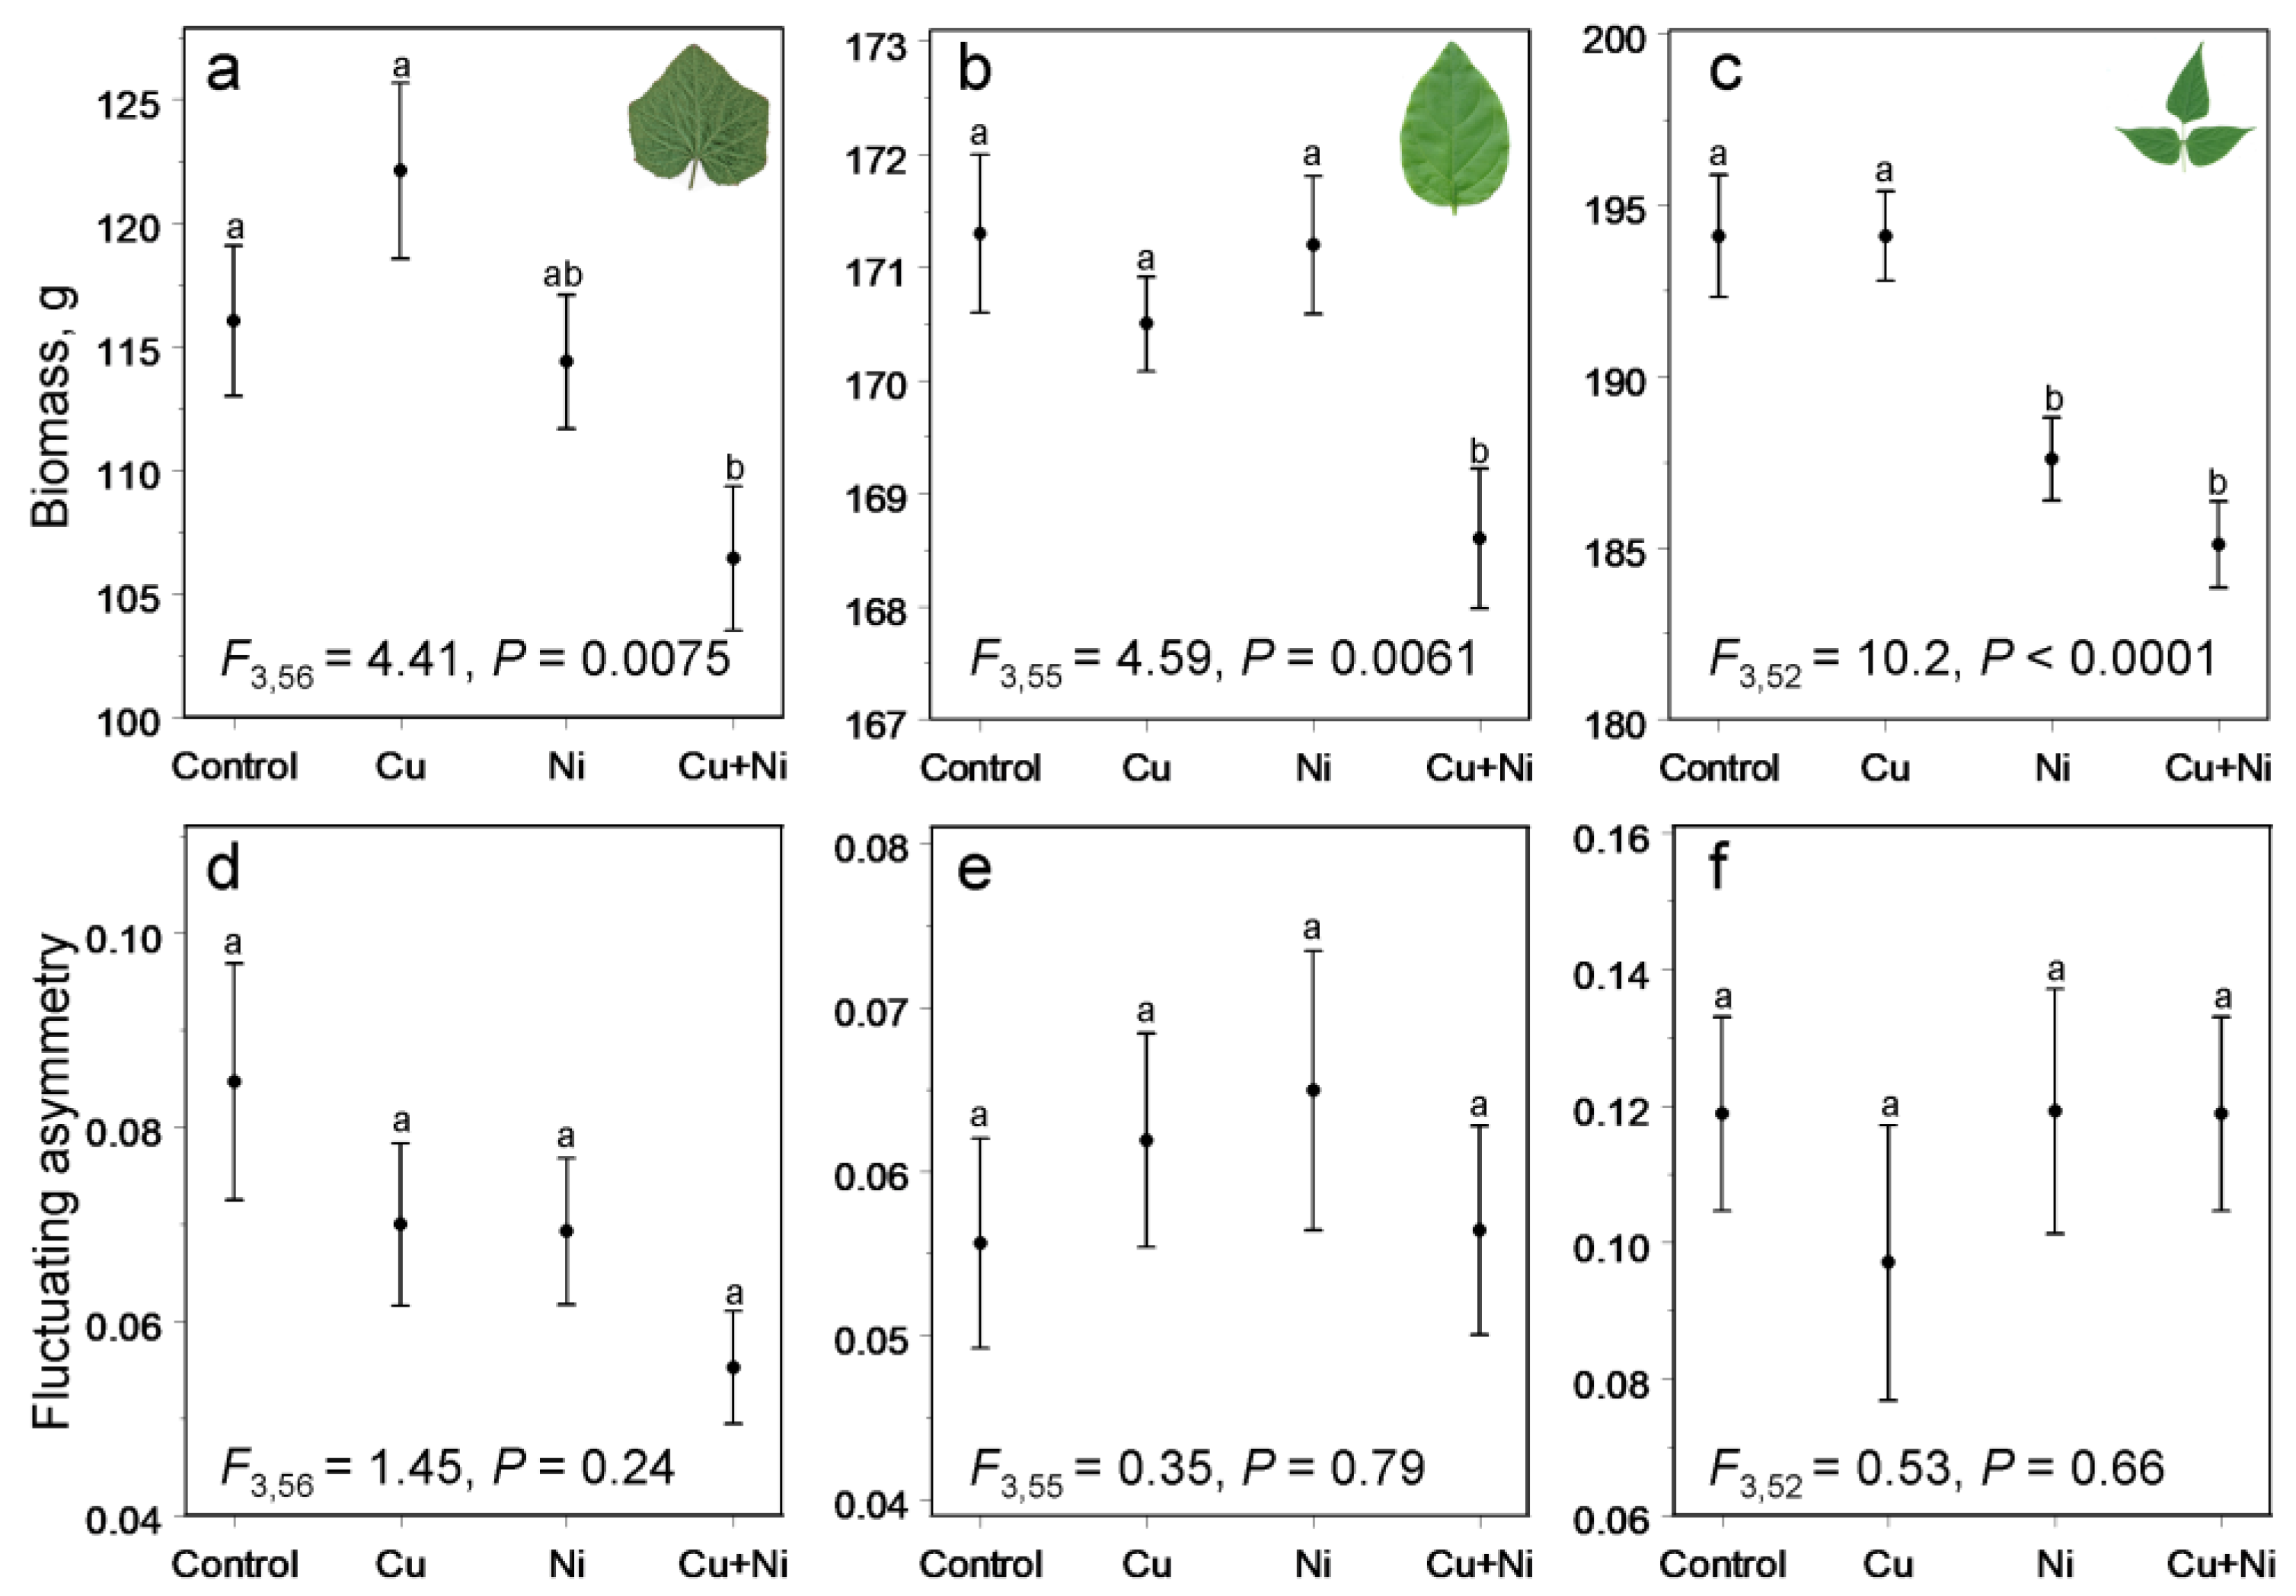
3. Results
4. Discussion
4.1. Does Decrease in Plant Biomass Indicate Plant Stress?
4.2. Fluctuating Asymmetry and Stress
4.3. In Asymmetry We Trust? Methodological Implications
- The samples for FA measurements should be collected either randomly (in the strict statistical sense because haphazard selection is prone of confirmation bias [47]) or blindly with respect to the expected result. In other words, researchers should take precautions against the (unconscious) selection of objects that best fit their expectations.
- The measurements of FA should be conducted blindly: the measurer should not be aware of the object’s origin and/or of the hypothesis being tested. This is easily achieved by the coding of study objects with random numbers prior to measurements.
- At least a portion of the objects should be measured twice, and the FA should be tested against the measurement error.
- We encourage scientists to publish their results obtained using adequate methodology even when these results are “negative” or inconclusive. This is the only way to make the publication portfolio representative of the actual findings.
5. Conclusions
Supplementary Materials
Author Contributions
Funding
Institutional Review Board Statement
Data Availability Statement
Acknowledgments
Conflicts of Interest
References
- Waddington, C.H. Canalization of development and the inheritance of acquired characters. Nature 1942, 150, 563–565. [Google Scholar] [CrossRef]
- Møller, A.P.; Swaddle, J.P. Asymmetry, Developmental Stability, and Evolution; Oxford University Press: Oxford, UK, 1997. [Google Scholar]
- Polak, M. Developmental Instability: Causes and Consequences; Oxford University Press: Oxford, UK, 2003. [Google Scholar]
- Zakharov, V.M.; Trofimov, I.E. Fluctuating asymmetry as an indicator of stress. Emerg. Top. Life Sci. 2022, 6, 295–301. [Google Scholar] [CrossRef] [PubMed]
- Fagerström, T. On theory, data and mathematics in ecology. Oikos 1987, 50, 258–261. [Google Scholar] [CrossRef]
- Palmer, A.R.; Strobeck, C. Fluctuating asymmetry—Measurement, analysis, patterns. Ann. Rev. Ecol. Syst. 1986, 17, 391–421. [Google Scholar] [CrossRef]
- Graham, J.H. Fluctuating asymmetry and developmental instability, a guide to best practice. Symmetry 2021, 13, 9. [Google Scholar] [CrossRef]
- Van Valen, L. Study of fluctuating asymmetry. Evolution 1962, 16, 125–142. [Google Scholar] [CrossRef]
- Kozlov, M.V. Plant studies on fluctuating asymmetry in Russia: Mythology and methodology. Russ. J. Ecol. 2017, 48, 1–9. [Google Scholar] [CrossRef]
- Zverev, V.; Kozlov, M.V. Variation in leaf size and fluctuating asymmetry of mountain birch (Betula pubescens var. pumila) in space and time: Implications for global change research. Symmetry 2020, 12, 1703. [Google Scholar]
- Zverev, V.; Kozlov, M.V. The fluctuating asymmetry of the butterfly wing pattern does not change along an industrial pollution gradient. Symmetry 2021, 13, 626. [Google Scholar] [CrossRef]
- Fey, D.P.; Greszkiewicz, M.; Lejk, A.M. Stress induced by substantial skeletal deformities in pike fry is not reflected in otolith fluctuating asymmetry: An experiment and literature review. Fish. Res. 2022, 254, 106387. [Google Scholar] [CrossRef]
- Mal, T.K.; Uveges, J.L.; Turk, K.W. Fluctuating asymmetry as an ecological indicator of heavy metal stress in Lythrum salicaria. Ecol. Indic. 2002, 1, 189–195. [Google Scholar] [CrossRef]
- Savelyeva, N.A.; Belova, E.E.; Pervova, N.E.; Kolontsov, A.A. Estimation of the effect of lead and cadmium ions on fluctuating asymmetry in leaves of the common bean (Phaseolus vulgaris L.). Mosc. Univ. Soil Sci. Bull. 2013, 68, 192–194. [Google Scholar] [CrossRef]
- Kolbas, A.; Marchand, L.; Herzig, R.; Nehnevajova, E.; Mench, M. Phenotypic seedling responses of a metal-tolerant mutant line of sunflower growing on a Cu-contaminated soil series: Potential uses for biomonitoring of Cu exposure and phytoremediation. Plant Soil 2014, 376, 377–397. [Google Scholar] [CrossRef]
- Nishizaki, M.T.; Barron, S.; Carew, E. Thermal stress increases fluctuating asymmetry in marine mussels: Environmental variation and developmental instability. Ecosphere 2015, 6, 85. [Google Scholar] [CrossRef]
- Sandner, T.M.; Matthies, D. Fluctuating asymmetry of leaves is a poor indicator of environmental stress and genetic stress by inbreeding in Silene vulgaris. Ecol. Indic. 2017, 79, 247–253. [Google Scholar] [CrossRef]
- Zverev, V.; Lama, A.D.; Kozlov, M.V. Fluctuating asymmetry of birch leaves did not increase with pollution and drought stress in a controlled experiment. Ecol. Indic. 2018, 84, 283–289. [Google Scholar] [CrossRef]
- Kozlov, M.V.; Zverev, V.; Zvereva, E.L. Leaf size is more sensitive than leaf fluctuating asymmetry as an indicator of plant stress caused by simulated herbivory. Ecol. Indic. 2022, 140, 108970. [Google Scholar] [CrossRef]
- Symanski, C.; Redak, R.A. Does fluctuating asymmetry of wing traits capture relative environmental stress in a lepidopteran? Ecol. Evol. 2021, 11, 1199–1213. [Google Scholar] [CrossRef]
- Freeman, D.C.; Graham, J.H.; Emlen, J.M. Developmental stability in plants—Symmetries, stress and epigenesis. Genetica 1993, 89, 97–119. [Google Scholar] [CrossRef]
- Smith, M.C. Heavy metal contamination increases fluctuating asymmetry in Rhus glabra L. (Anacardiaceae). Southwest. Nat. 2016, 61, 156–159. [Google Scholar] [CrossRef]
- Shadrina, E.G.; Vol’pert, Y.L. Experience of applying plant and animal fluctuating asymmetry in assessment of environmental quality in terrestrial ecosystems: Results of 20-year studies of wildlife and anthropogenically transformed territories. Russ. J. Dev. Biol. 2018, 49, 23–35. [Google Scholar] [CrossRef]
- Mabrouk, L.; Mabrouk, W.; Ben Lansour, H. High leaf fluctuating asymmetry in two native plants growing in heavy metal-contaminated soil: The case of Metlaoui phosphate mining basin (Gafsa, Tunisia). Environ. Monitor. Assessm. 2020, 192, 406. [Google Scholar] [CrossRef] [PubMed]
- Grime, J.P. Plant Strategies and Vegetation Processes; John Wiley and Sons: Chichester, UK, 1979. [Google Scholar]
- Nagajyoti, P.C.; Lee, K.D.; Sreekanth, T.V.M. Heavy metals, occurrence and toxicity for plants: A review. Environ. Chem. Lett. 2010, 8, 199–216. [Google Scholar] [CrossRef]
- DalCorso, G.; Manara, A.; Furini, A. An overview of heavy metal challenge in plants: From roots to shoots. Metallomics 2013, 5, 1117–1132. [Google Scholar] [CrossRef]
- Palmer, A.R.; Strobeck, C. Fluctuating asymmetry analyses revisited. In Developmental Instability: Causes and Consequences; Polak, M., Ed.; Oxford University Press: New York, NY, USA, 2003; pp. 279–319. [Google Scholar]
- SAS Institute. SAS/Stat. User’s Guide, Version 9.2; SAS Institute: Cary, NC, USA, 2009. [Google Scholar]
- Kenward, M.G.; Roger, J.H. An improved approximation to the precision of fixed effects from restricted maximum likelihood. Computat. Stat. Data Anal. 2009, 53, 2583–2595. [Google Scholar] [CrossRef]
- Graham, J.H.; Raz, S.; Hel-Or, H.; Nevo, E. Fluctuating asymmetry: Methods, theory, and applications. Symmetry 2010, 2, 466–540. [Google Scholar] [CrossRef] [Green Version]
- Penning de Vries, F.W.T. The cost of maintenance processes in plant cells. Ann. Bot. 1975, 39, 77–92. [Google Scholar] [CrossRef]
- Cramer, G.R.; Urano, K.; Delrot, S.; Pezzotti, M.; Shinozaki, K. Effects of abiotic stress on plants: A systems biology perspective. BMC Plant Biol. 2011, 11, 163. [Google Scholar] [CrossRef] [Green Version]
- Wang, P.; Zhao, Y.; Li, Z.; Hsu, C.-C.; Liu, X.; Fu, L.; Hou, Y.-J.; Du, Y.; Xie, S.; Zhang, C.; et al. Reciprocal regulation of the TOR kinase and ABA receptor balances plant growth and stress response. Mol. Cell 2018, 69, 100–112. [Google Scholar]
- Zakharov, V.M. Analysis of fluctuating asymmetry as a method of biomonitoring at the population level. In Bioindications of Chemical and Radioactive Pollution; Krivolutsky, D., Ed.; Mir: Moscow, Russia, 1990; pp. 187–198. (In Russian) [Google Scholar]
- Clarke, G.M. Fluctuating asymmetry: A technique for measuring developmental stress of genetic and environmental origin. Acta Zool. Fenn. 1992, 191, 31–35. [Google Scholar]
- Parsons, P.A. Fluctuating asymmetry—A biological monitor of environmental and genomic stress. Heredity 1992, 68, 361–364. [Google Scholar] [CrossRef] [PubMed] [Green Version]
- Zakharov, V.M.; Clarke, G.M. Biotest: A New Integrated Approach for Assessing the Condition of Natural Environments; International Biotest Foundation: Moscow, Russia, 1993. (In Russian) [Google Scholar]
- Hume, D. Environmental Monitoring and Fluctuating Asymmetry: Study Design; New Zealand Department of Conservation: Wellington, New Zealand, 2001. [Google Scholar]
- Zakharov, V.M.; Chubinishvili, A.T.; Dmitriev, S.G.; Baranov, A.S.; Borisov, V.I.; Valetskii, A.V.; Krysanov, E.Y.; Kryazheva, N.G.; Pronin, A.V.; Chistyakova, E.K. The Health of the Environment: Experience of Assessment; Center for the Health of the Environment: Moscow, Russia, 2001. (In Russian) [Google Scholar]
- Wiener, J.G.; Rago, P.J. A test of fluctuating asymmetry in bluegills (Lepomis macrochirus Rafinesque) as a measure of pH-related stress. Environ. Poll. 1987, 44, 27–36. [Google Scholar] [CrossRef] [PubMed]
- Willig, M.R.; Owen, R.D. Fluctuating asymmetry in the cheetah—Methodological and interpretive concerns. Evolution 1987, 41, 225–227. [Google Scholar] [CrossRef]
- Palmer, A.R. Waltzing with asymmetry. BioScience 1996, 46, 518–532. [Google Scholar] [CrossRef] [Green Version]
- Bjorksten, T.A.; Fowler, K.; Pomiankowski, A. What does sexual trait FA tell us about stress? Trends Ecol. Evol. 2000, 15, 163–166. [Google Scholar] [CrossRef] [PubMed]
- Haila, Y. The multiple faces of ecological theory and data. Oikos 1988, 53, 408–411. [Google Scholar] [CrossRef]
- Rosenthal, R. Experimenter Effects in Behavioural Research; Wiley: New York, NY, USA, 1976. [Google Scholar]
- Zvereva, E.L.; Kozlov, M.V. Biases in studies of spatial patterns in insect herbivory. Ecol. Monogr. 2019, 89, e01361. [Google Scholar] [CrossRef]
- Fanelli, D. Negative results are disappearing from most disciplines and countries. Scientometrics 2012, 90, 891–904. [Google Scholar] [CrossRef]
- Jennions, M.D.; Lortie, C.J.; Rosenberg, M.S.; Rothstein, H.R. Publication and related biases. In Handbook of Meta-Analysis in Ecology and Evolution; Koricheva, J., Gurevitch, J., Mengersen, K., Eds.; Princeton University Press: Princeton, NJ, USA, 2013; pp. 207–236. [Google Scholar]
- Kozlov, M.V.; Zvereva, E.L. Confirmation bias in studies of fluctuating asymmetry. Ecol. Indic. 2015, 57, 293–297. [Google Scholar] [CrossRef]
- Wilkinson, M.D.; Dumontier, M.; Aalbersberg, I.J.; Appleton, G.; Axton, M.; Baak, A.; Blomberg, N.; Boiten, J.-W.; da Silva Santos, L.B.; Bourne, P.E.; et al. The FAIR guiding principles for scientific data management and stewardship. Sci. Data 2016, 3, 160018. [Google Scholar] [CrossRef] [Green Version]


| Source of Variation | Reproducibility | ||||||||
|---|---|---|---|---|---|---|---|---|---|
| Species | DA 1, mm | Side | Side × Individual | ME1, mm | ME5 | ||||
| d.f. | F | P | d.f. | F | P | ||||
| Cucumis sativus | −0.56 | 1, 178 | 2.02 | 0.16 | 178, 358 | 147.1 | <0.0001 | 0.50 | 0.986 |
| Capsicum annuum | −0.08 | 1, 176 | 0.57 | 0.45 | 176, 354 | 163.2 | <0.0001 | 0.12 | 0.988 |
| Phaseolus vulgaris | 1.19 | 1, 164 | 1.31 | 0.25 | 164, 330 | 1143.1 | <0.0001 | 0.40 | 0.998 |
Disclaimer/Publisher’s Note: The statements, opinions and data contained in all publications are solely those of the individual author(s) and contributor(s) and not of MDPI and/or the editor(s). MDPI and/or the editor(s) disclaim responsibility for any injury to people or property resulting from any ideas, methods, instructions or products referred to in the content. |
© 2023 by the authors. Licensee MDPI, Basel, Switzerland. This article is an open access article distributed under the terms and conditions of the Creative Commons Attribution (CC BY) license (https://creativecommons.org/licenses/by/4.0/).
Share and Cite
Gavrikov, D.E.; Zverev, V.; Rachenko, M.A.; Pristavka, A.A.; Kozlov, M.V. Experimental Evidence Questions the Relationship between Stress and Fluctuating Asymmetry in Plants. Symmetry 2023, 15, 339. https://doi.org/10.3390/sym15020339
Gavrikov DE, Zverev V, Rachenko MA, Pristavka AA, Kozlov MV. Experimental Evidence Questions the Relationship between Stress and Fluctuating Asymmetry in Plants. Symmetry. 2023; 15(2):339. https://doi.org/10.3390/sym15020339
Chicago/Turabian StyleGavrikov, Dmitry E., Vitali Zverev, Maksim A. Rachenko, Aleksey A. Pristavka, and Mikhail V. Kozlov. 2023. "Experimental Evidence Questions the Relationship between Stress and Fluctuating Asymmetry in Plants" Symmetry 15, no. 2: 339. https://doi.org/10.3390/sym15020339