Article

Modelling of Phase Diagrams and Continuous Cooling Transformation Diagrams of Medium Manganese Steels

1
TU Dresden/Helmholtz-Zentrum Dresden-Rossendorf, Institut für Ressourcenökologie, 01328 Dresden, Germany
2
Faculty for Engineering and Environmental Sciences, University of Applied Sciences Upper Austria, 4600 Wels, Austria
3
Department of Engineering Materials and Biomaterials, Faculty of Mechanical Engineering, Silesian University of Technology, 18A Konarskiego Street, 44-100 Gliwice, Poland
*
Author to whom correspondence should be addressed.
Symmetry 2023, 15(2), 381; https://doi.org/10.3390/sym15020381
Submission received: 31 December 2022 / Revised: 20 January 2023 / Accepted: 28 January 2023 / Published: 1 February 2023
(This article belongs to the Special Issue Advances in Metallic Material and Symmetry/Asymmetry)

Abstract

:
The aim of this manuscript was to study the influence of alloying elements on the phase transformation behavior in advanced high-strength multiphase steels. Continuous cooling transformation (CCT) and time–temperature–transformation (TTT) diagrams were calculated to analyze the stability of phases at variable time–temperature processing parameters. The analyzed materials were lean-alloyed transformation induced plasticity (TRIP) medium manganese steels. The simulations of the phase diagrams, the stability of the phases during simulated heat treatments, and the chemical composition evolution diagrams were made using Thermo-Calc and JMatPro material simulation softwares. The influence of alloying elements, i.e., Mn and C, were studied in detail. The computational and modelling results allowed the influence of alloying elements on equilibrium and non-equilibrium phase diagrams and microstructural and chemical composition evolutions to be studied. Good symmetry and correlation between computational softwares were achieved. The study allows for future optimization of the heat-treatment temperature and time conditions of modern medium-Mn automotive sheet steels.

1. Introduction

The advanced high-strength steels (AHSS) are today’s material of choice for the lightweight applications in the automotive industry. AHSS are promising materials for lightweight designs, despite the competition of other materials such as aluminum and magnesium alloys. AHSS offer outstanding combinations of strength and ductility [1,2]. TRIP (transformation induced plasticity), DP (dual phase), CP (complex phase), FB (ferritic-bainitic), MS or MART (martensitic), HF (hot-formed), and TWIP (twinning-induced plasticity), are widely used for the body-in-white. First-generation multiphase steels and third-generation medium-Mn steels with strain-induced austenite to martensite transformation are ideally suited for deep-drawing, providing high-strength levels at the same time [3,4]. The most prominent and used processing route for the latest third-generation AHSS steels (medium-Mn steels containing 3–10% Mn) is the so-called intercritical annealing, which involves heating and subsequent holding of the steel at a temperature between the Ac1 and Ac3 in order to obtain partial austenitisation [5]. Most of the time it is done in the two-phase austenite+ferrite region. Afterward, the steel is quenched into room temperature maintaining austenite-ferrite mixture due to the lowering of the Ms temperature by Mn and C partitioning from ferrite to austenite [6,7]. The ferritic-bainitic-austenitic steels (1 gen. AHSS with ~2% Mn) require an additional isothermal step at the bainitic transformation region to stabilize some fraction of retained austenite (RA). After the intercritical annealing, the steel is cooled above the Ms temperature and below the Bs to produce some fraction of carbide-free bainite. When the desired bainite amount has formed, the steel is then quenched to room temperature [8].
Physical experiments can often be time consuming, expensive, and need to be heavily optimized in order to provide the best optimization results [9,10,11,12]. In this situation, it is possible to use numerical simulations to either compare the data with experimental results, optimize the process through adjustments of necessary parameters or fill some gaps in the material property databases and/or predict the material behavior during its life cycle [13,14,15]. In this paper, two material-related softwares were used and compared: Thermo-Calc and JMatPro. Thermo-Calc version 2016b with the provided Database TCFE10.0 was used for the calculation of the phase diagrams, together with the phase evolution diagrams by using the 1 Axis calculation of the DICTRA module. JMatPro allowed for the calculation and modelling of the CCT (Continuous Cooling Transformation) and TTT (Temperature-Time Transformation) diagrams for the temperature ranges, as well as phase evolution diagrams, which can further be used as a model or a base for designing appropriate heat treatment processes [16,17]. The CCT and TTT diagrams themselves provide information about the microstructure produced as a result of phase transformations, as well as non-isothermal transformation of austenite. The results can be applied to produce different types of steels from the AHSS group [18,19,20,21].
The aim of this study is to calculate the CCT and TTT diagrams for model lean-alloyed high-strength steels exhibiting the transformation induced plasticity effect. The diagrams allow the optimization and selection of the appropriate parameters of the heat treatment, which would result from appropriate calculation results [22,23]. The results of the simulation also allow for the analysis of the possible formation of different types of carbides and the examination of increasing retained austenite volume fractions with increasing Mn and C contents for the heat treatment of medium-Mn steels [24,25,26].

2. Modelling Procedure

The designed steel grades were medium-Mn TRIP-aided steels with a Mn content ranging from 2% to 10% and a C content of 0.1% and 0.2%. The Mn content ranging between 2% and 10% was chosen to have the possibility of forming different amounts of retained austenite. The C amount fluctuating at a range of 0.1–0.2% was selected due to its high influence on the mechanical properties, as well as supporting the austenite stability at room temperature. Al and Si contents were stable over all the simulations as this amount of 0.75% was enough to prevent the formation of cementite in the bainitic matrix [27,28,29]. The chemical compositions of the analyzed alloys are shown in Table 1. Within the characterization and simulations made by means of the Thermo-Calc and JMatPro softwares, the influence of the increasing content of Mn (2%, 3.5%, 5%, 8%, 10%) on the equilibrium phases in the Fe-C-Mn-Al-Si pseudo-binary phase diagrams could be analyzed together with the projection and distinction of possible precipitates. The Thermo-Calc version 2016b with the provided Database TCFE10.0 was used for the calculation. The calculation was done with the DICTRA module by usage of the 1 Axis calculation. Thermo-Calc uses the CALPHAD (calculation of phase diagrams) method, which, in short, is an approach of the phenomenological type. It allows for the prediction of different properties of multicomponent systems. CALPHAD works on the basis of phases where everything is modeled as a function of temperature, chemical composition, and in some cases, also pressure. In this way, it is possible to create binary and ternary diagrams/systems, which enable extrapolation of the data and prediction of the properties.
JMatPro V11 was used to determine the kinetics of phase transformation during isothermal and continuous cooling conditions. In addition to the obtained CCT and TTT diagrams, phase evolution diagrams were plotted, which were further used to compare them between two softwares. JMatPro in itself is a JavaScript-based software that allows several modelling methods. JMatPro does not use a designated collection of databases, which are later used to create models for different simulations, but it is built upon physical-based models, which are already incorporated in the software. Thermo-Calc is based on different databases to create, model, and simulate different outcomes. In this work, the phase transformation module was used. Both softwares were used in order to have a possible comparison zone for the phase evolution results and to expand the results for higher understanding of the matter.

3. Results

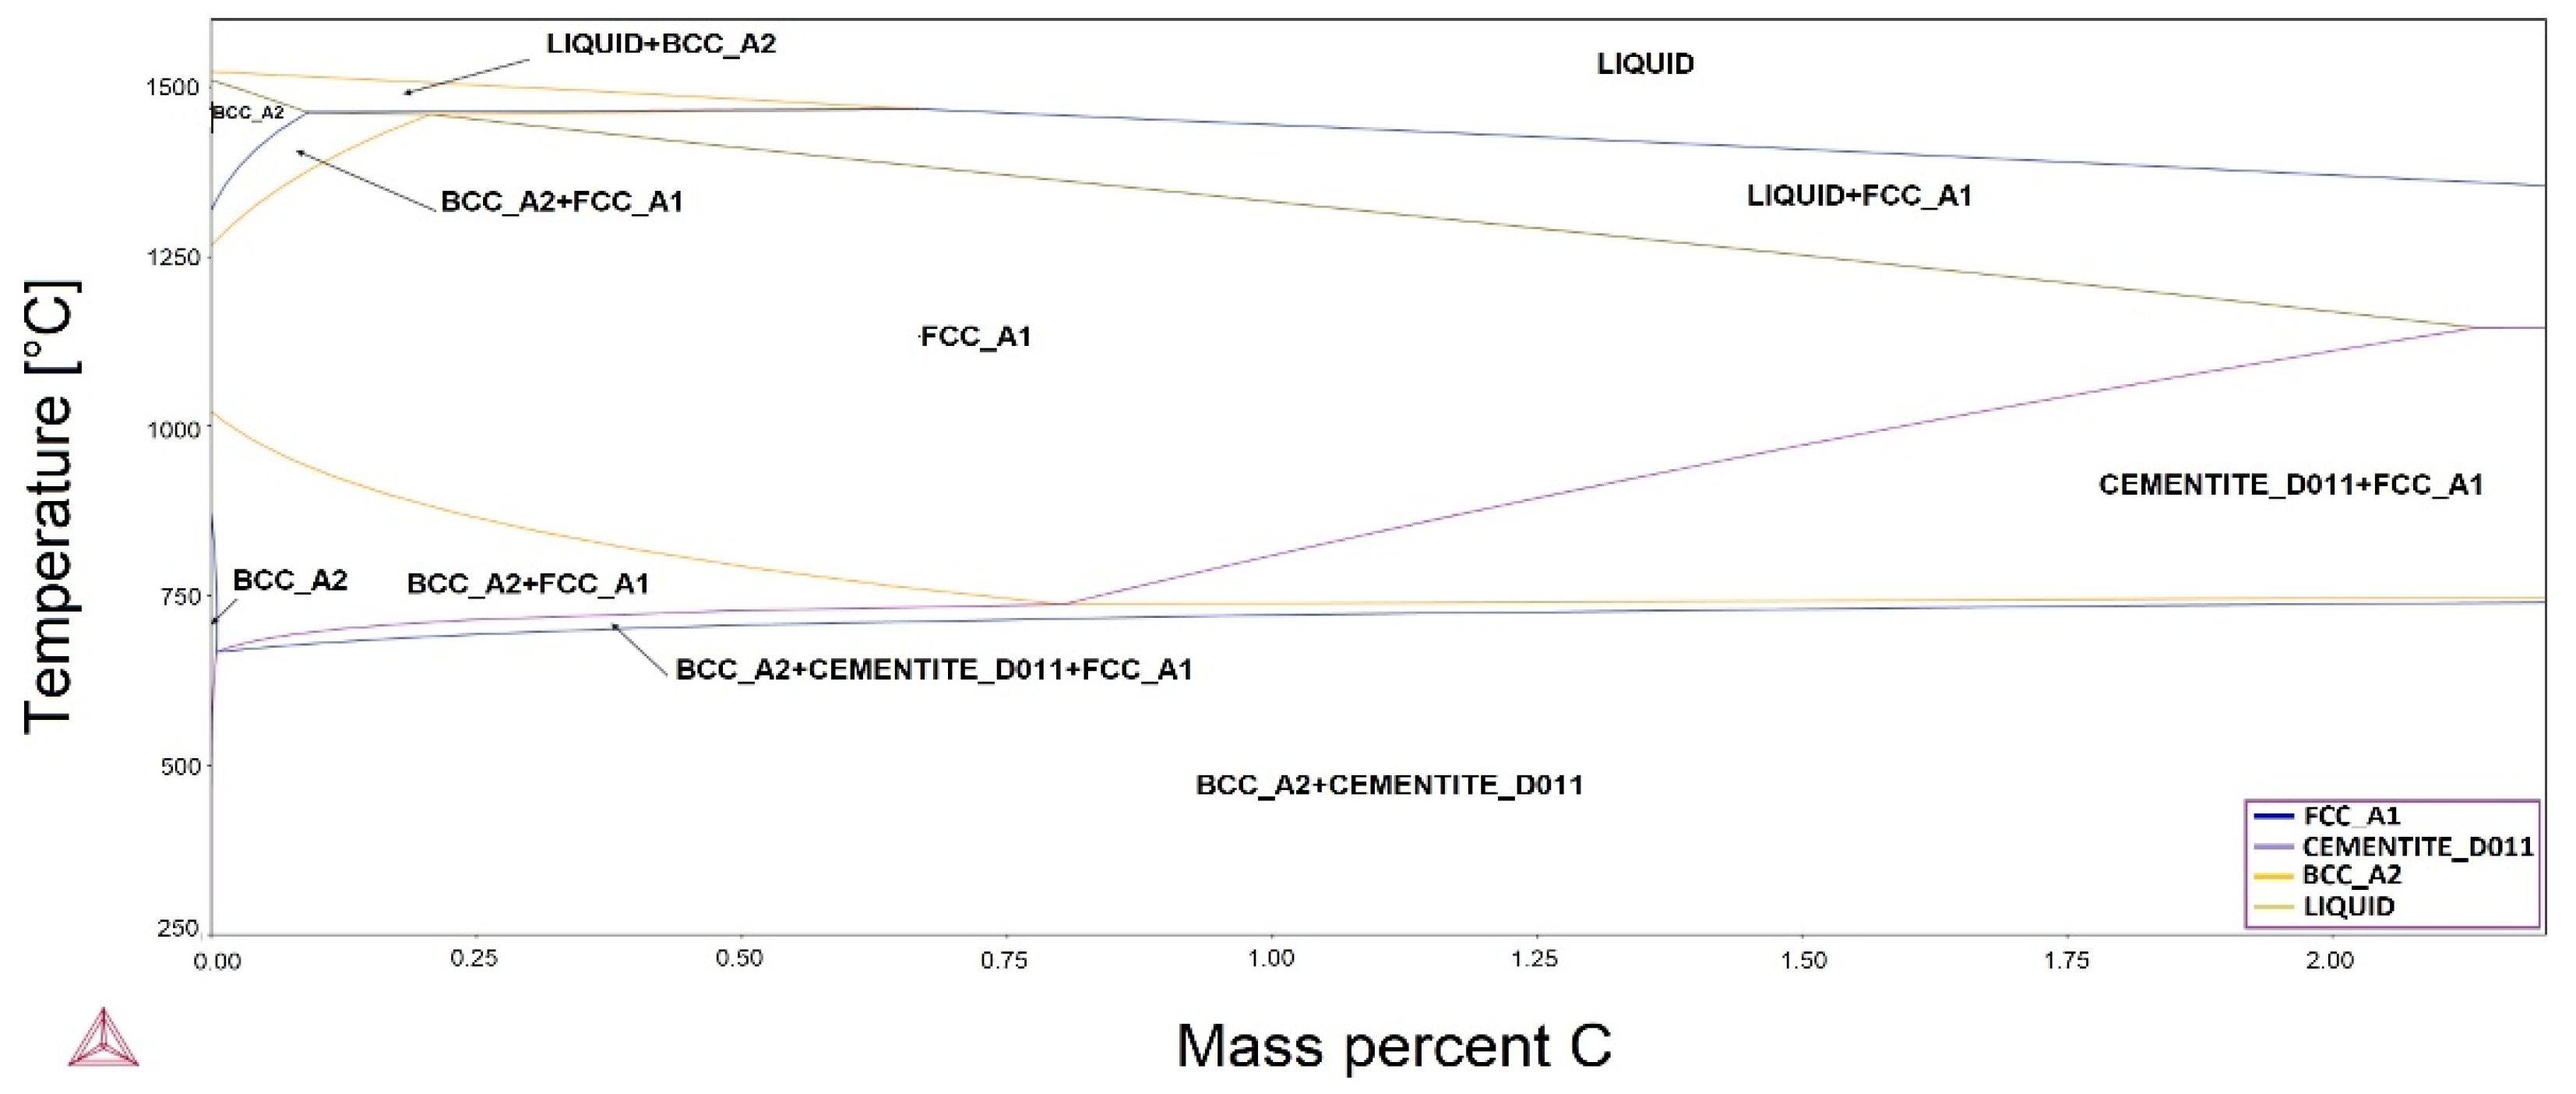
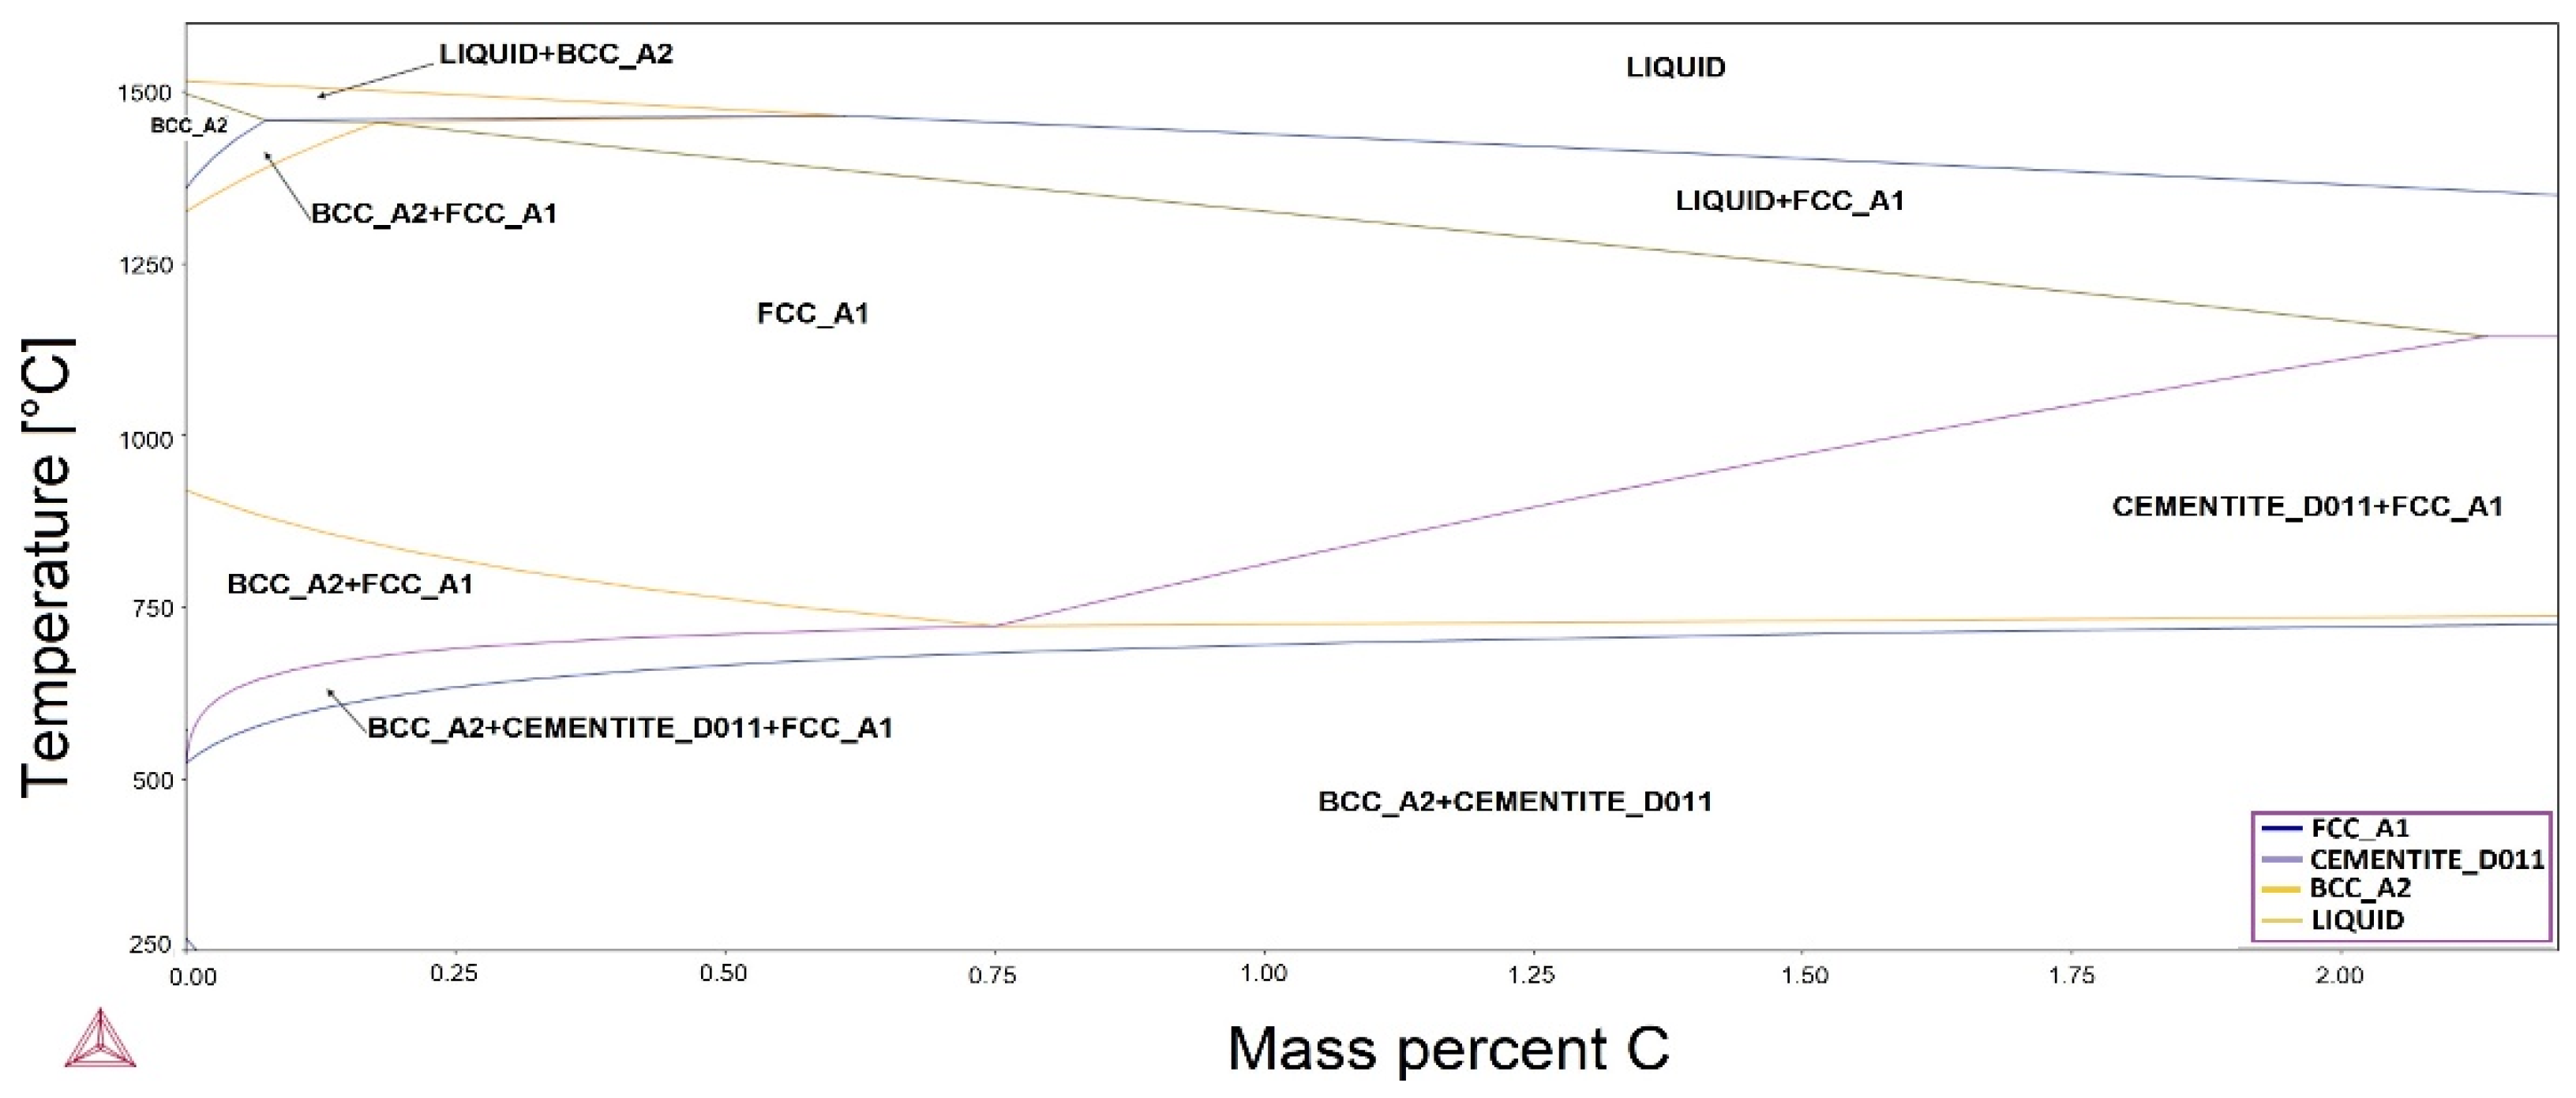
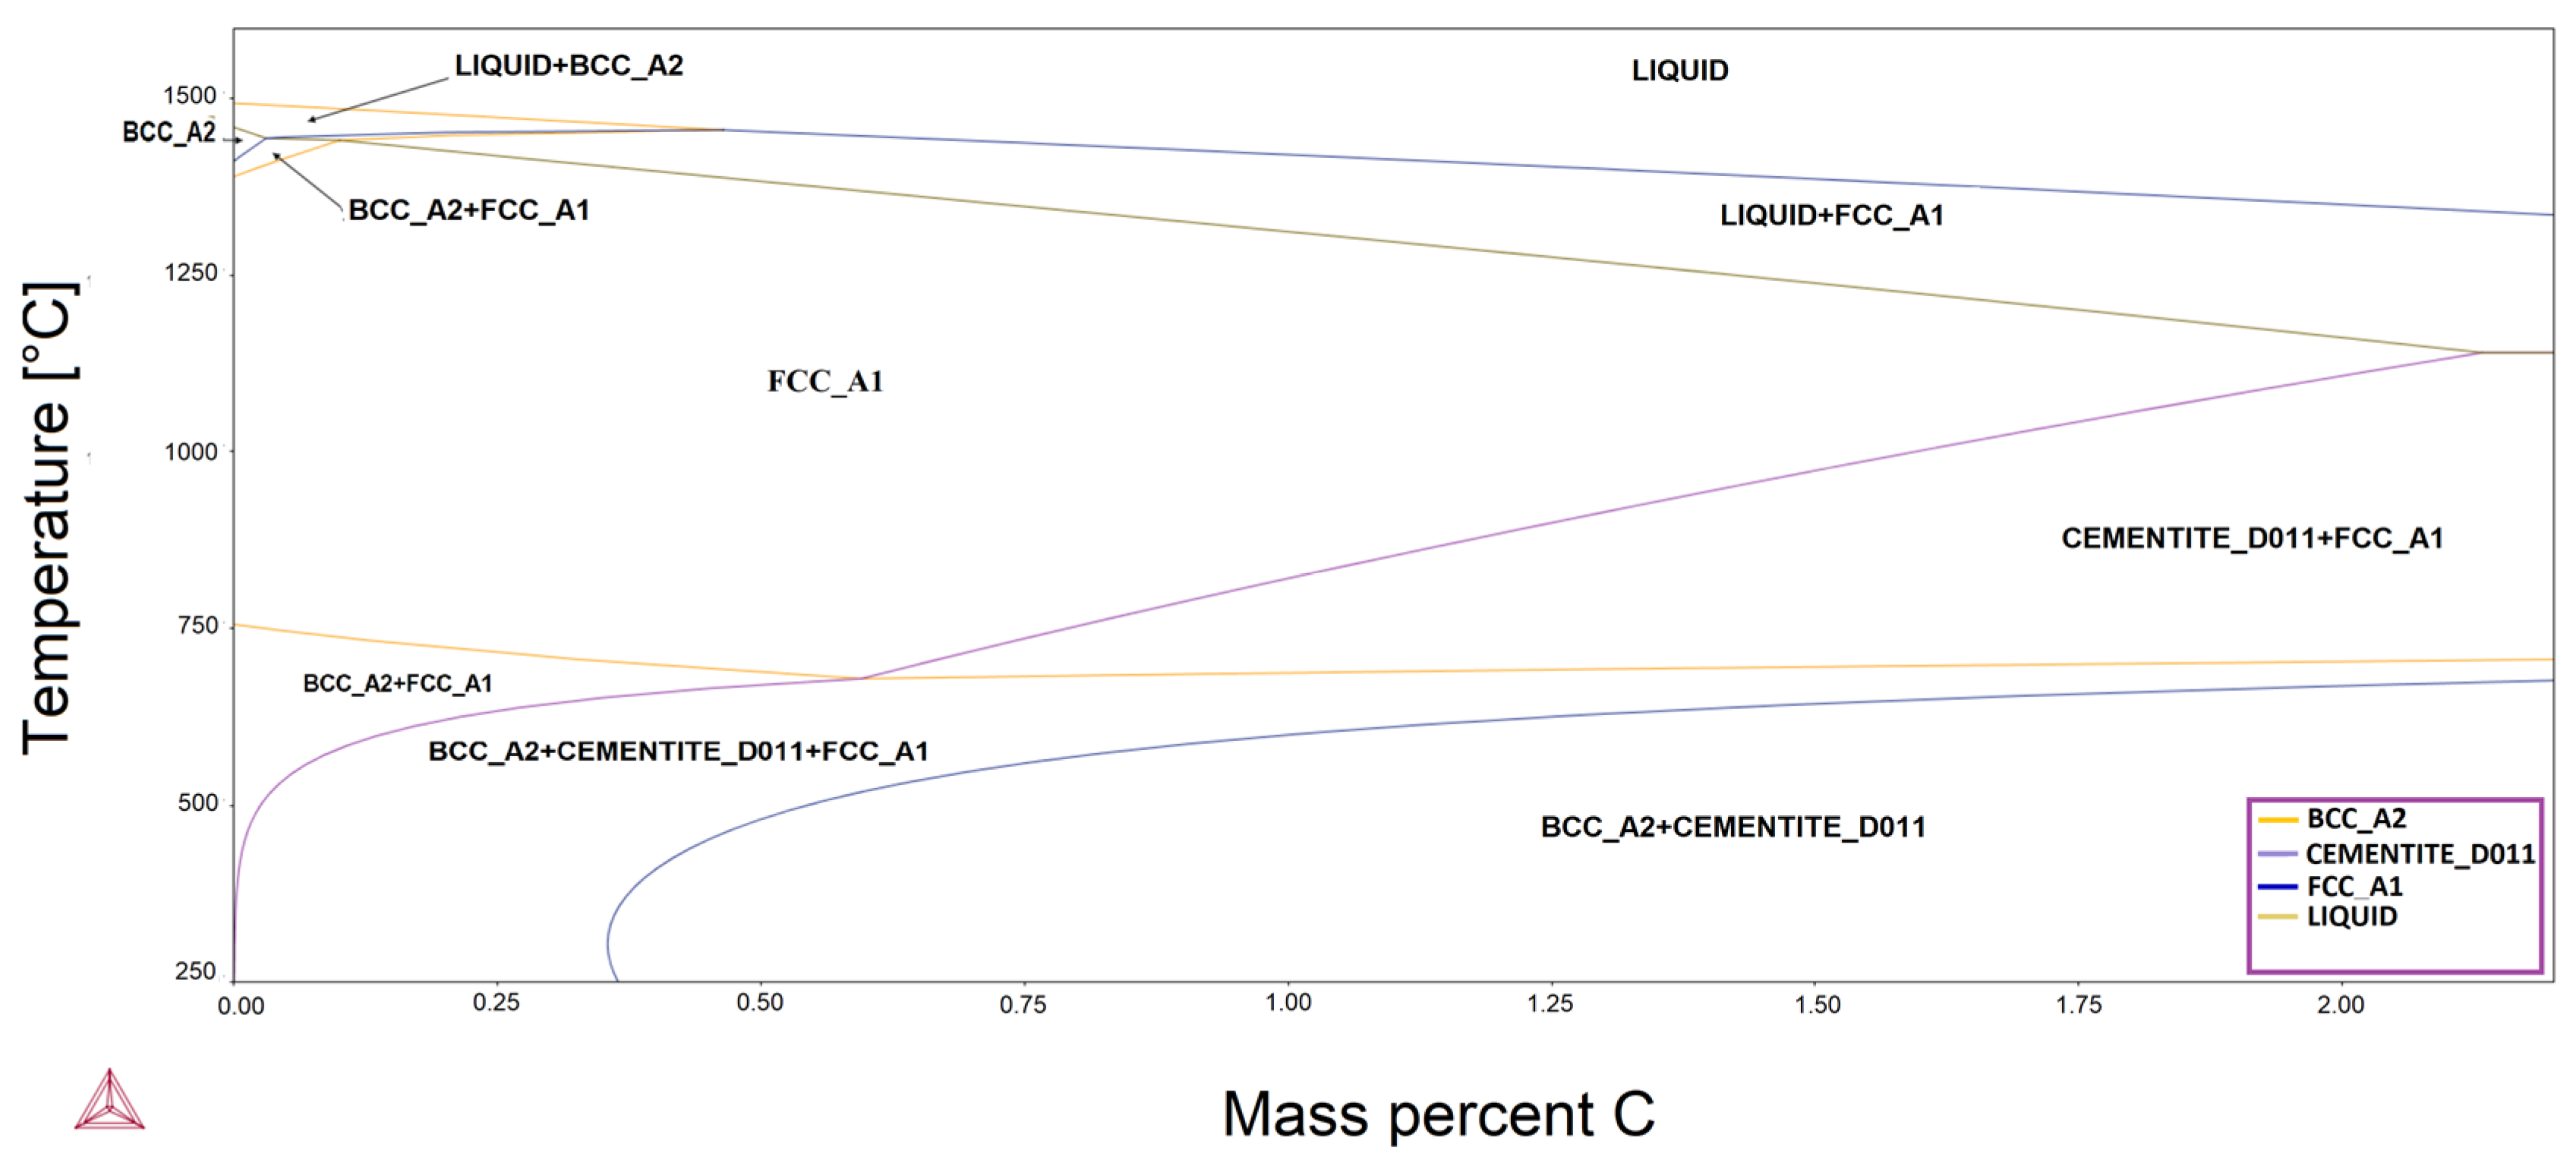
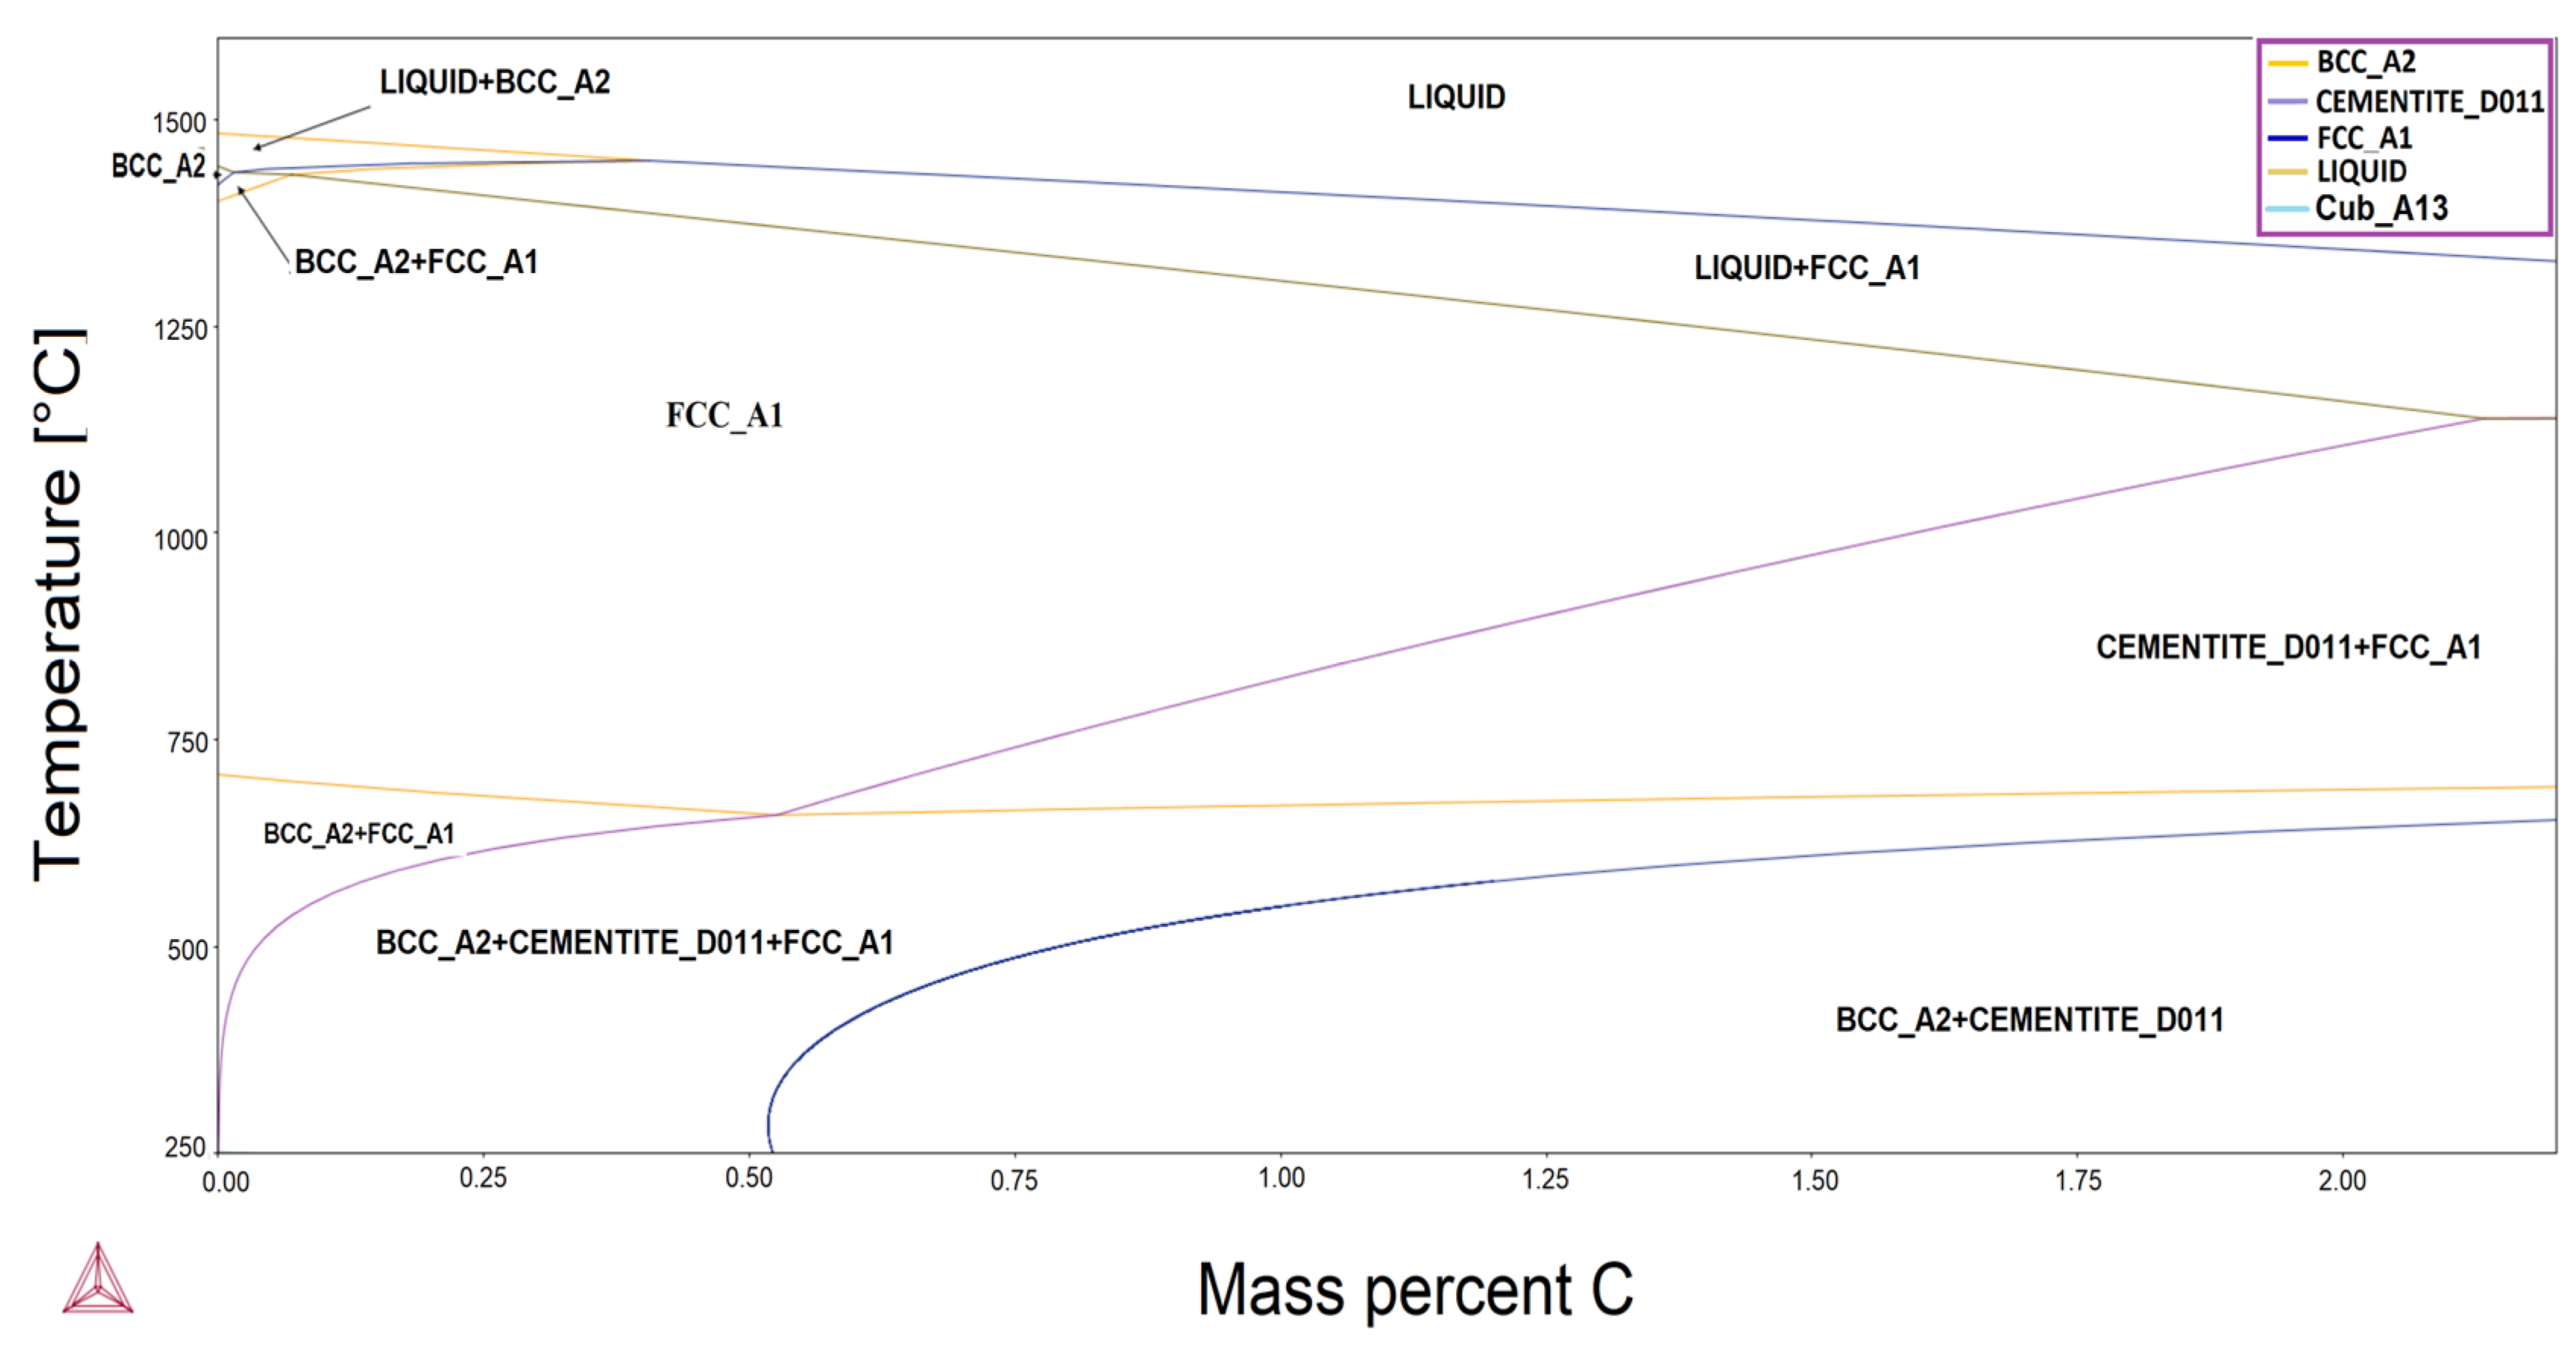
3.1. Phase Diagram Simulations

Figure 1, Figure 2, Figure 3 and Figure 4 show the phase diagrams created for steels containing a Mn content from 2% to 10%, as well as a change in C content from 0.1% to 0.2%. The addition of 2% Mn shows the formation of cementite, ferrite, and austenite (BCC_A2+CEMENTITE_D011+FCC_A1). The increase of the Mn amount to 3.5% shows an increase in the BCC_A2+CEMENTITE_D011+FCC_A1011 phase and a decrease in the temperature at which the phase starts to form from approximately 700 °C to 525 °C, and the required amount of carbon decreases from approximately 0.02% to 0.01%. The increase in size of the BCC_A2+CEMENTITE_D011+FCC_A1 phase regions causes the BCC_A2+CEMENTITE_D011 phase to decrease in size. Analyzing the diagram further, one can see that an increase in the amount of Mn to 3.5% causes the occurrence of the pure BCC_A2 phase to disappear. A decrease in the required temperature of the BCC_A2+CEMENTITE_D011+FCC_A1 phase has also caused a decrease in the temperature at which the BCC_A2+FCC_A1 phase starts, from approximately 700 °C to 525 °C, and the beginning of the pure austenite phase of FCC_A1 from 1100 °C to 900 °C, which results in an increase in the area of FCC_A1 due to the fact that the upper limit ending its occurrence does not change. Through the examination of the three high temperature phases, which contain BCC_A2, it can be observed that the phase in which pure (BCC_A2) occurs decreases. The temperature of its occurrence decreases from 1393–1538 °C to approximately 1400–1500 °C, and the maximum carbon solubility decreases from approximately 0.1% to 0.07%. This is due to the growth from the BCC_A2+FCC_A1 phase, which increases the temperature at which it starts and the LIQUID+BCC_A2 phase, which decreases its starting temperature. The BCC_A2+CEMENTITE_D011+FCC_A1 phase starts already at the starting point of the diagram (0% C and 250 °C) and the phase expands, which results in it being more stable at room temperature. The increase in the area of BCC_A2+CEMENTITE_D011+FCC_A1 phases causes the further decrease in the BCC_A2+CEMENTITE_D011. The BCC_A2+FCC_A1 phase decreased its starting temperature even further to approximately 400 °C, and the pure FCC_A1 phase expands by decreasing its starting temperature to approximately 800 °C without decreasing its upper limit.
δ(BCC_A2) ferritic phase in 5% Mn steel continues to decrease in size due to the same influence of the BCC_A2+FCC_A1 and LIQUID+BCC_A2 phases as in the 3.5% Mn phase diagram (Figure 2). The BCC_A2+FCC_A1 starting temperature increases and LIQUID+BCC_A2 starting temperature decreases. The result is the temperature, at which pure ferrite δ(BCC_A2) occurs, decreases to 1425–1490 °C, and the maximum carbon solubility decreases to around 0.04%. By further increasing the amount of Mn to 8% (Figure 3), the area of the BCC_A2+CEMENTITE_D011+FCC_A1 phase almost doubled. All the other occurrences continue, which means that the starting temperature of the BCC_A2+FCC_A1 decreases to 300 °C and the starting temperature of pure FCC_A1 decreases to 750 °C, again without changing the upper limit, which results in the increase of its size. In addition, the δ(BCC_A2) ferrite phase decreases even further, to around 1425–1475 °C, and the maximum carbon solubility decreases to approximately 0.02%.
Comparing the 10% concentration of Mn (Figure 4) to the starting diagram of 2% Mn, the area of the BCC_A2+CEMENTITE_D011+FCC_A1 phase increased greatly. The 10% Mn content increases the amount of carbon in the low temperature region to 0.54%. With this, the area of the BCC_A2+CEMENTITE_D011 decreases even further, starting at 0.54%. The starting temperature of the BCC_A2+FCC_A1 phase stops to decrease in comparison with the 8% Mn, but the FCC_A1 starting temperature moves to approximately 725 °C. The BCC_A2 phase almost disappeared with the temperature range of around 1450–1460 °C and maximum carbon solubility of around 0.1%.

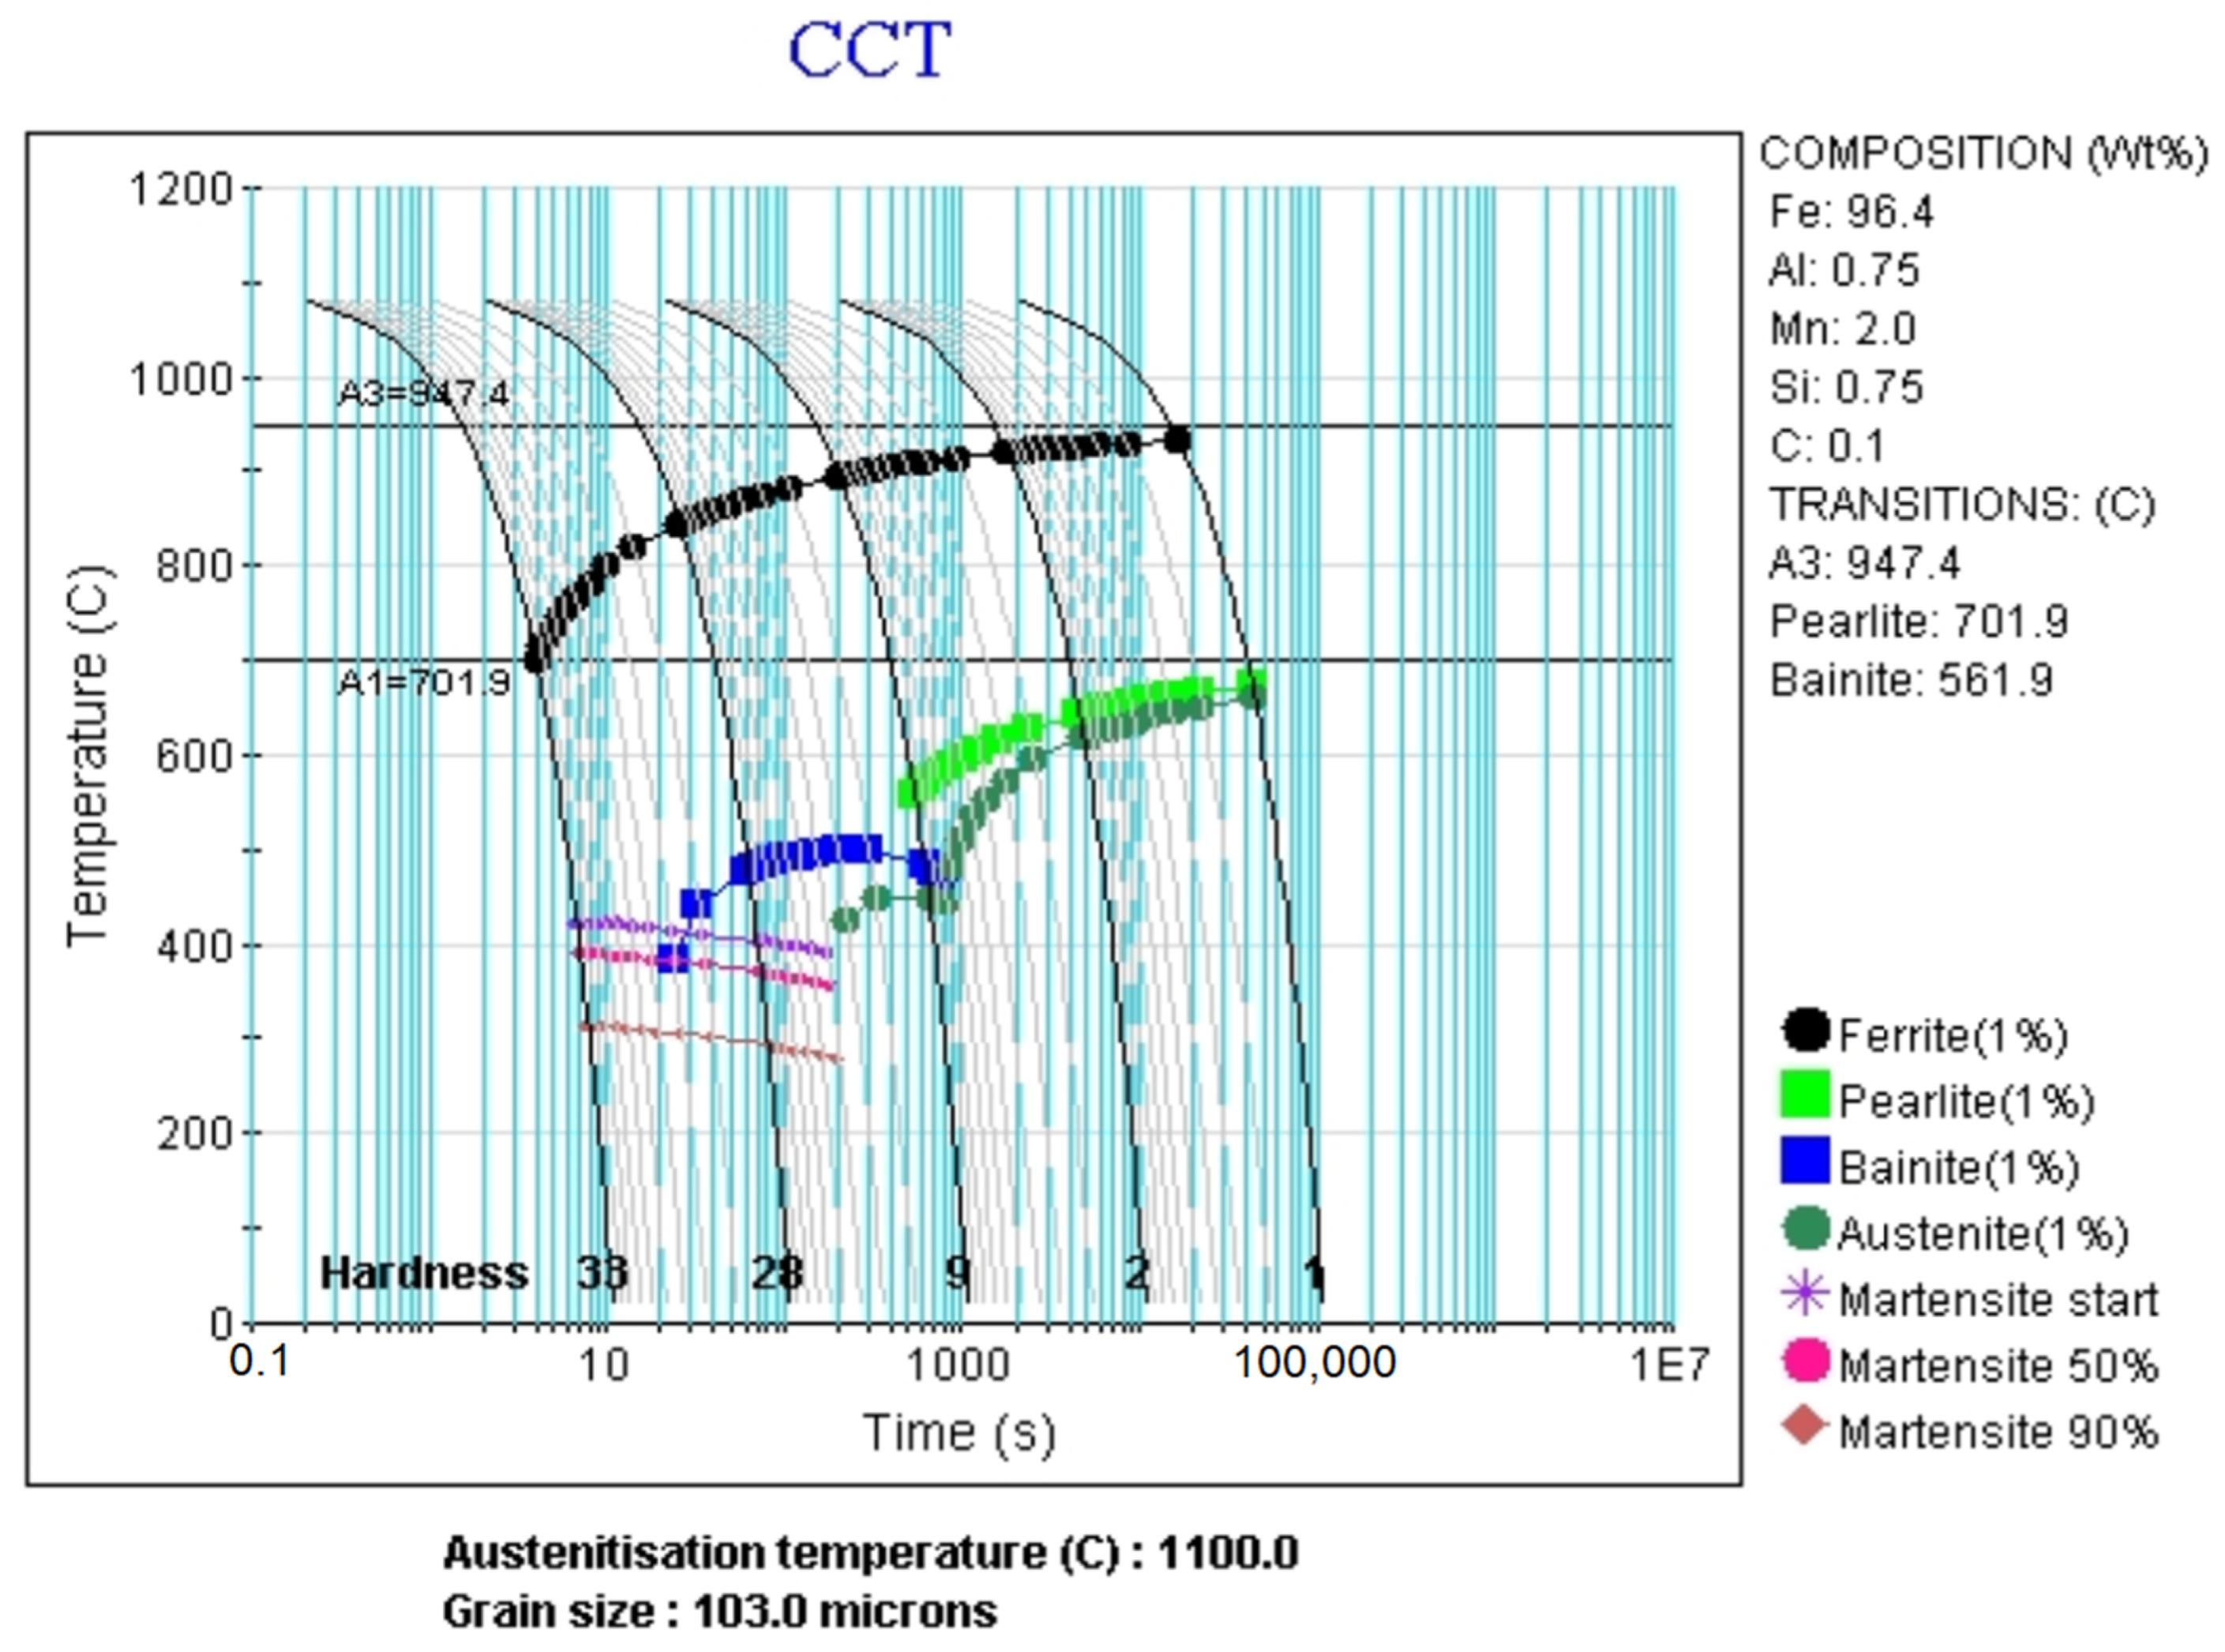
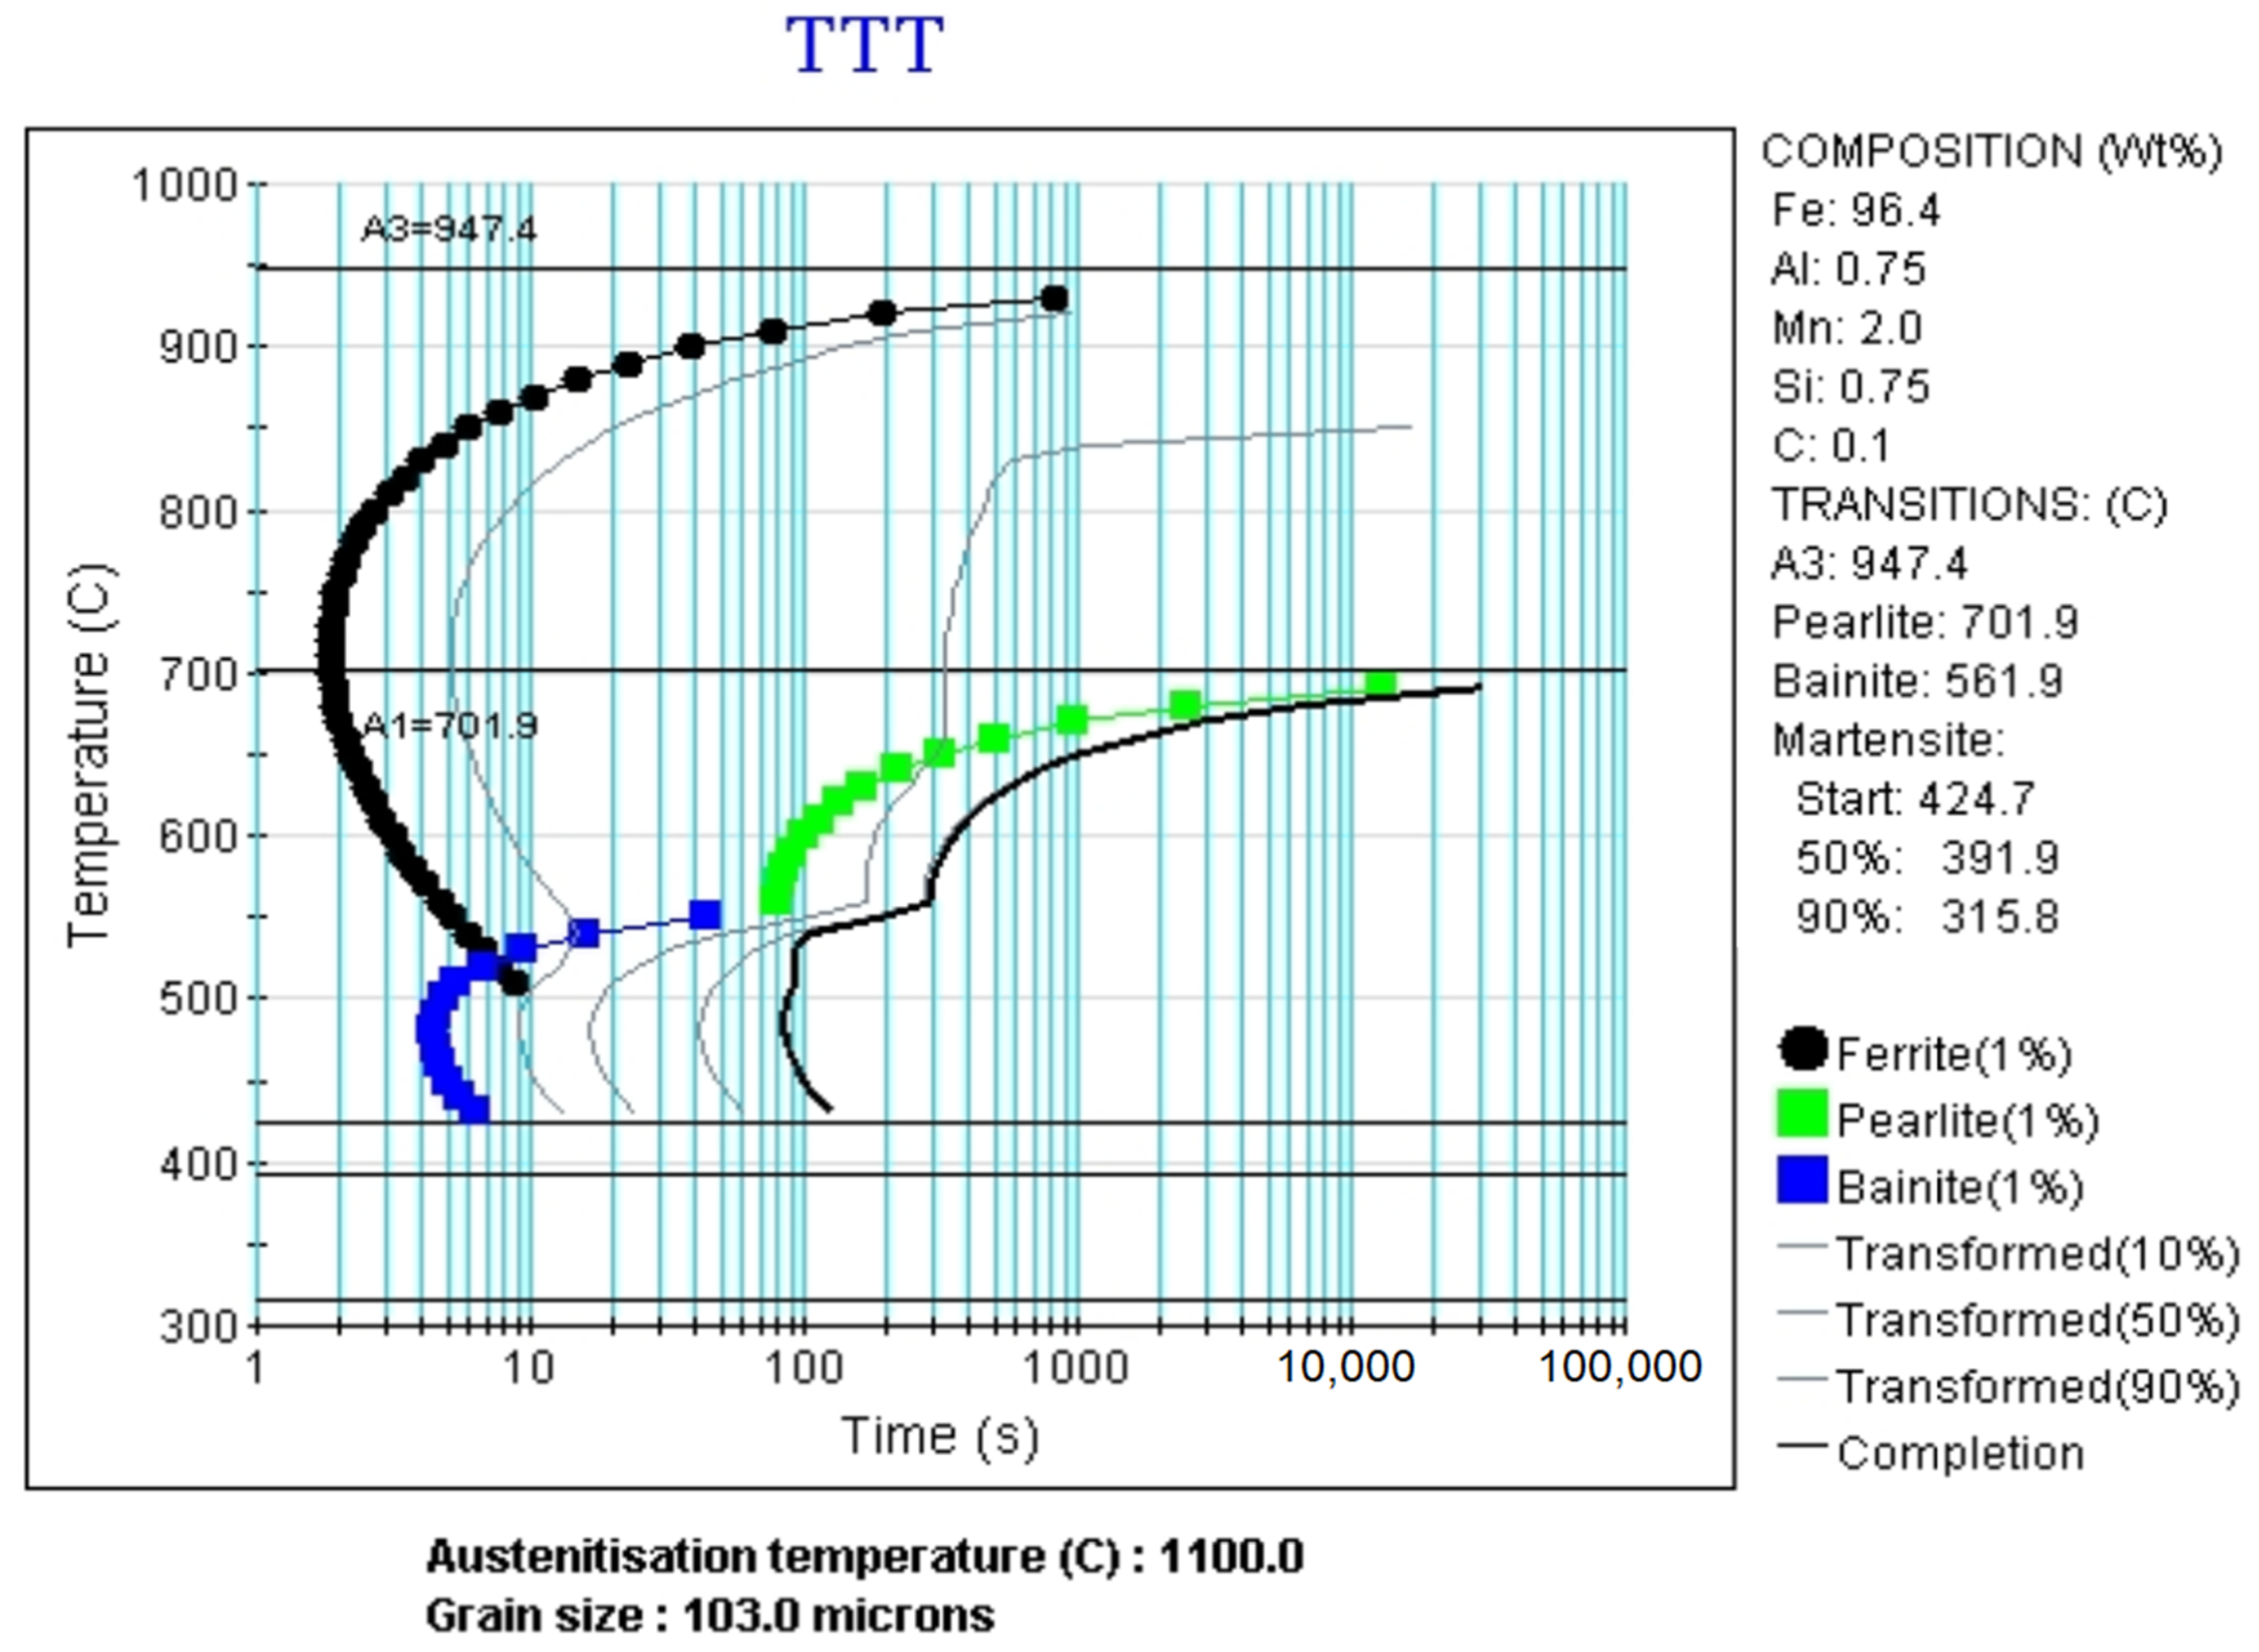
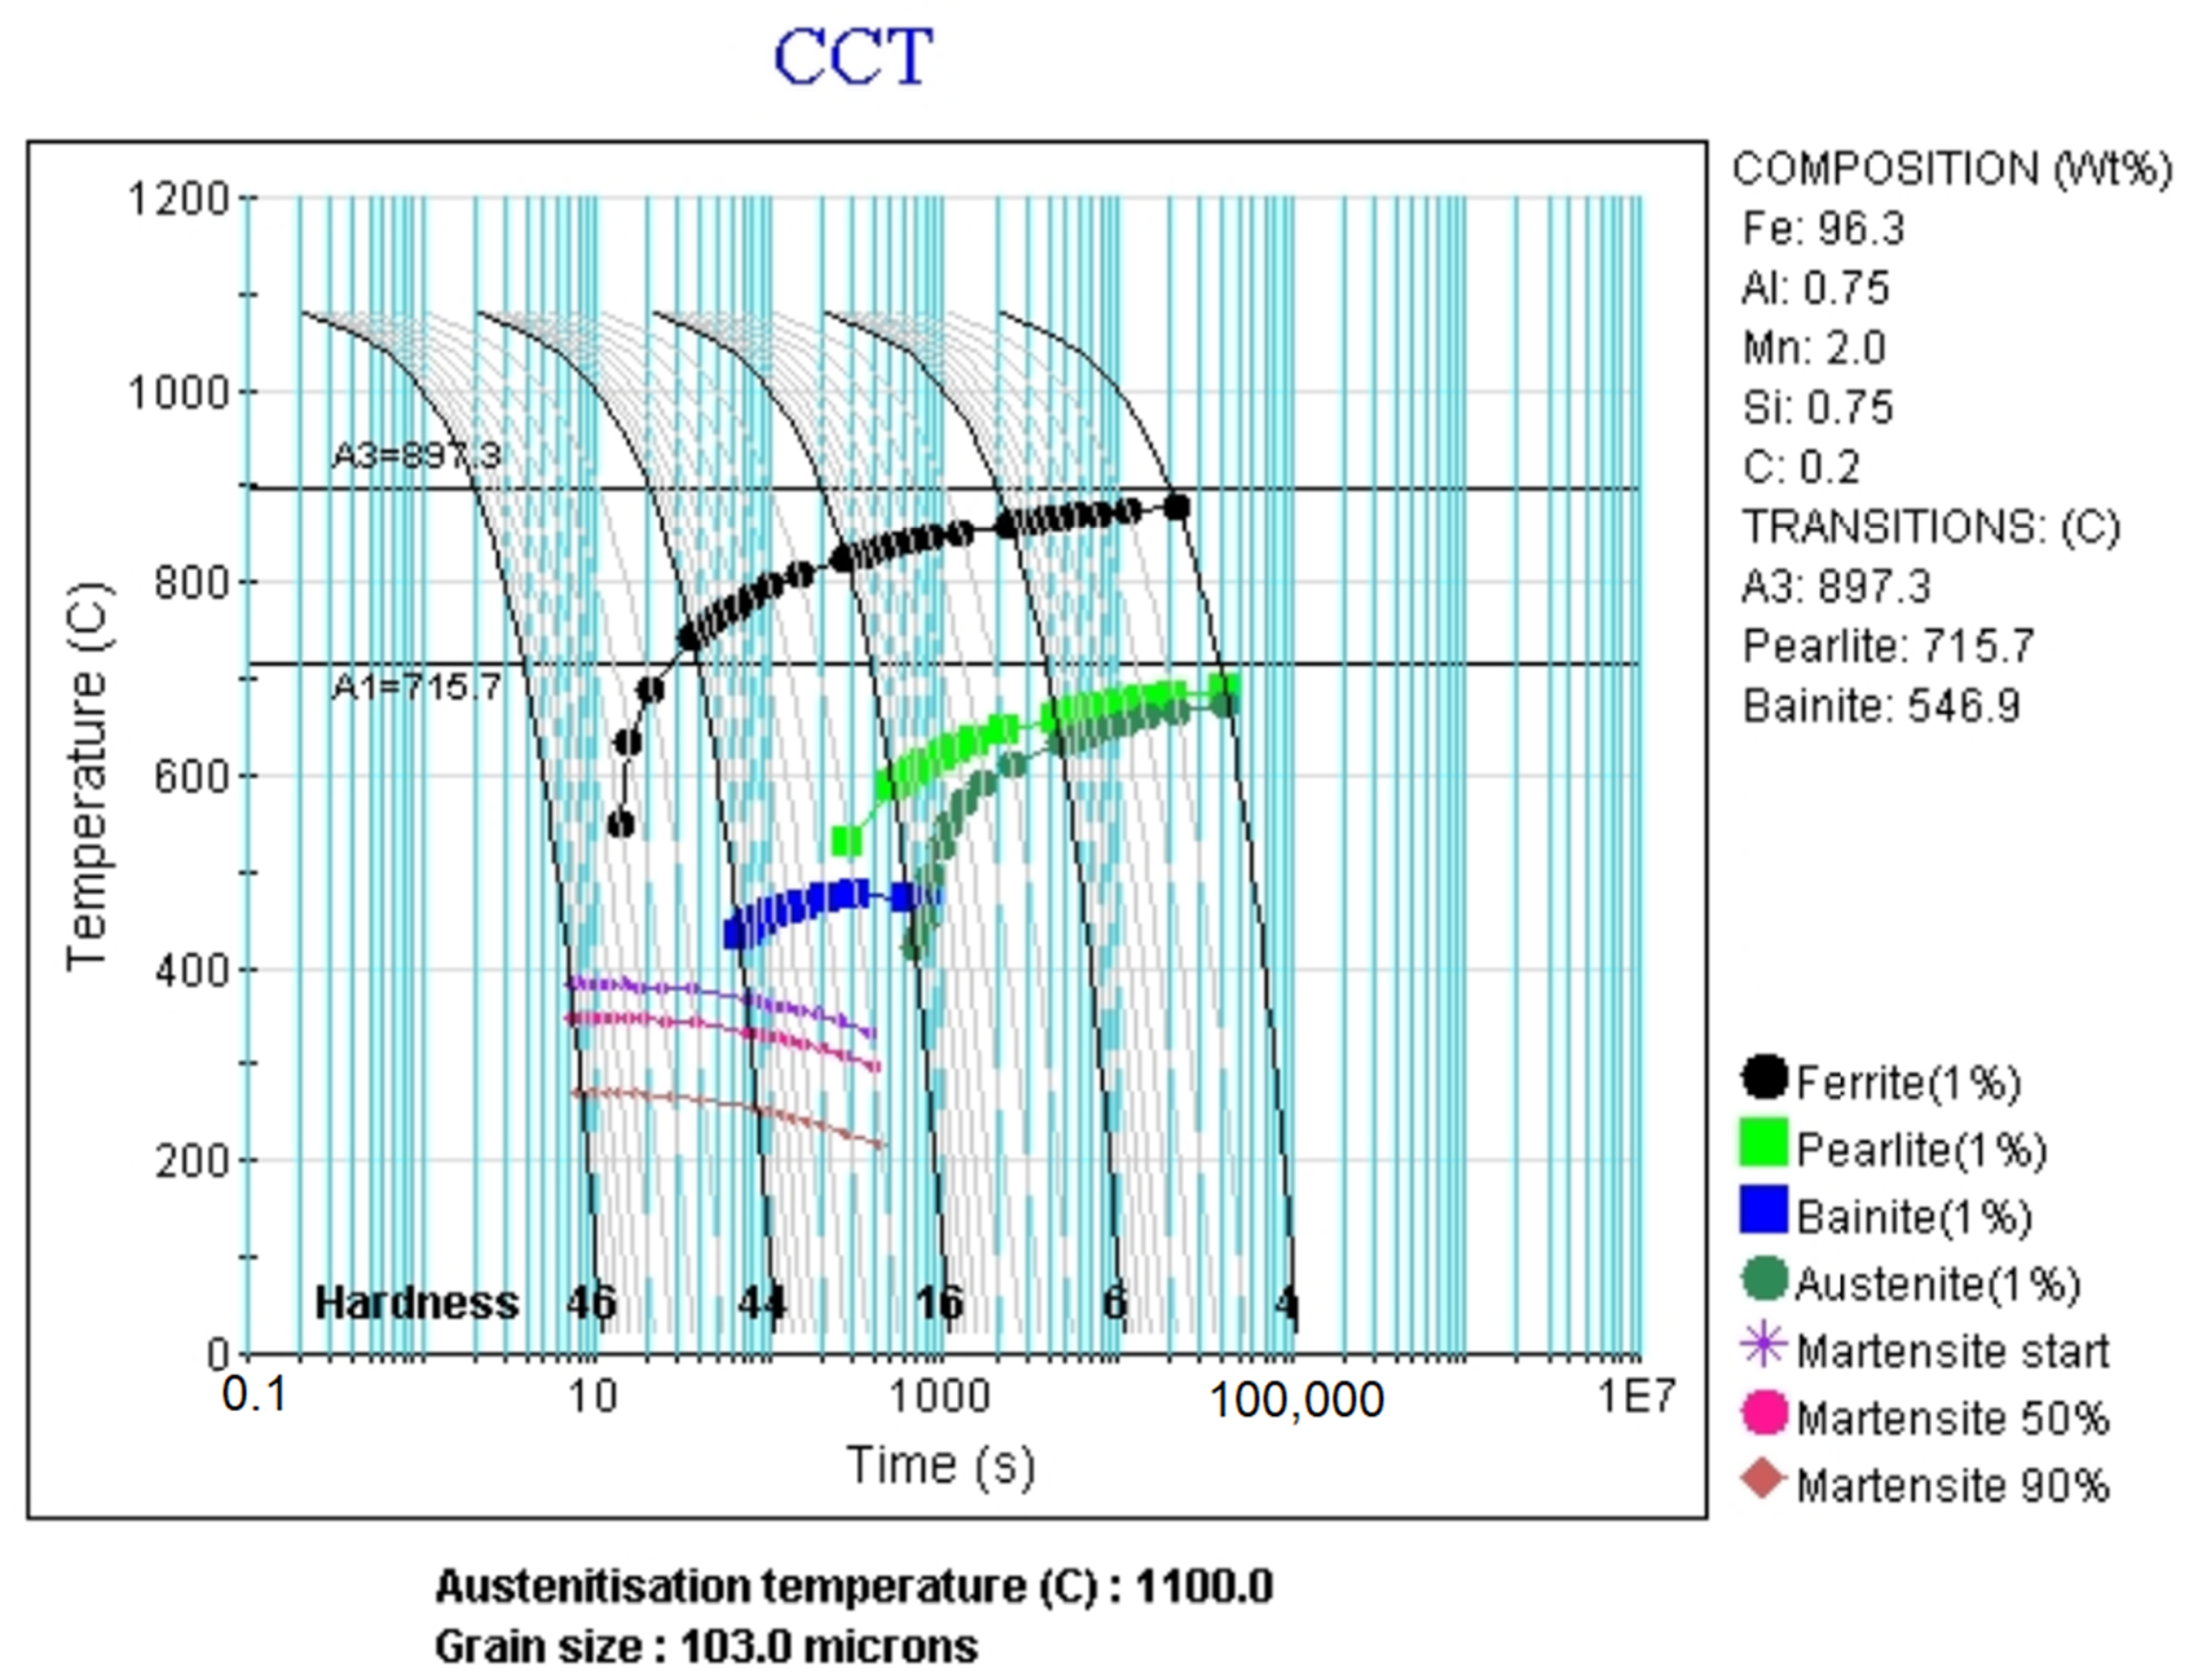
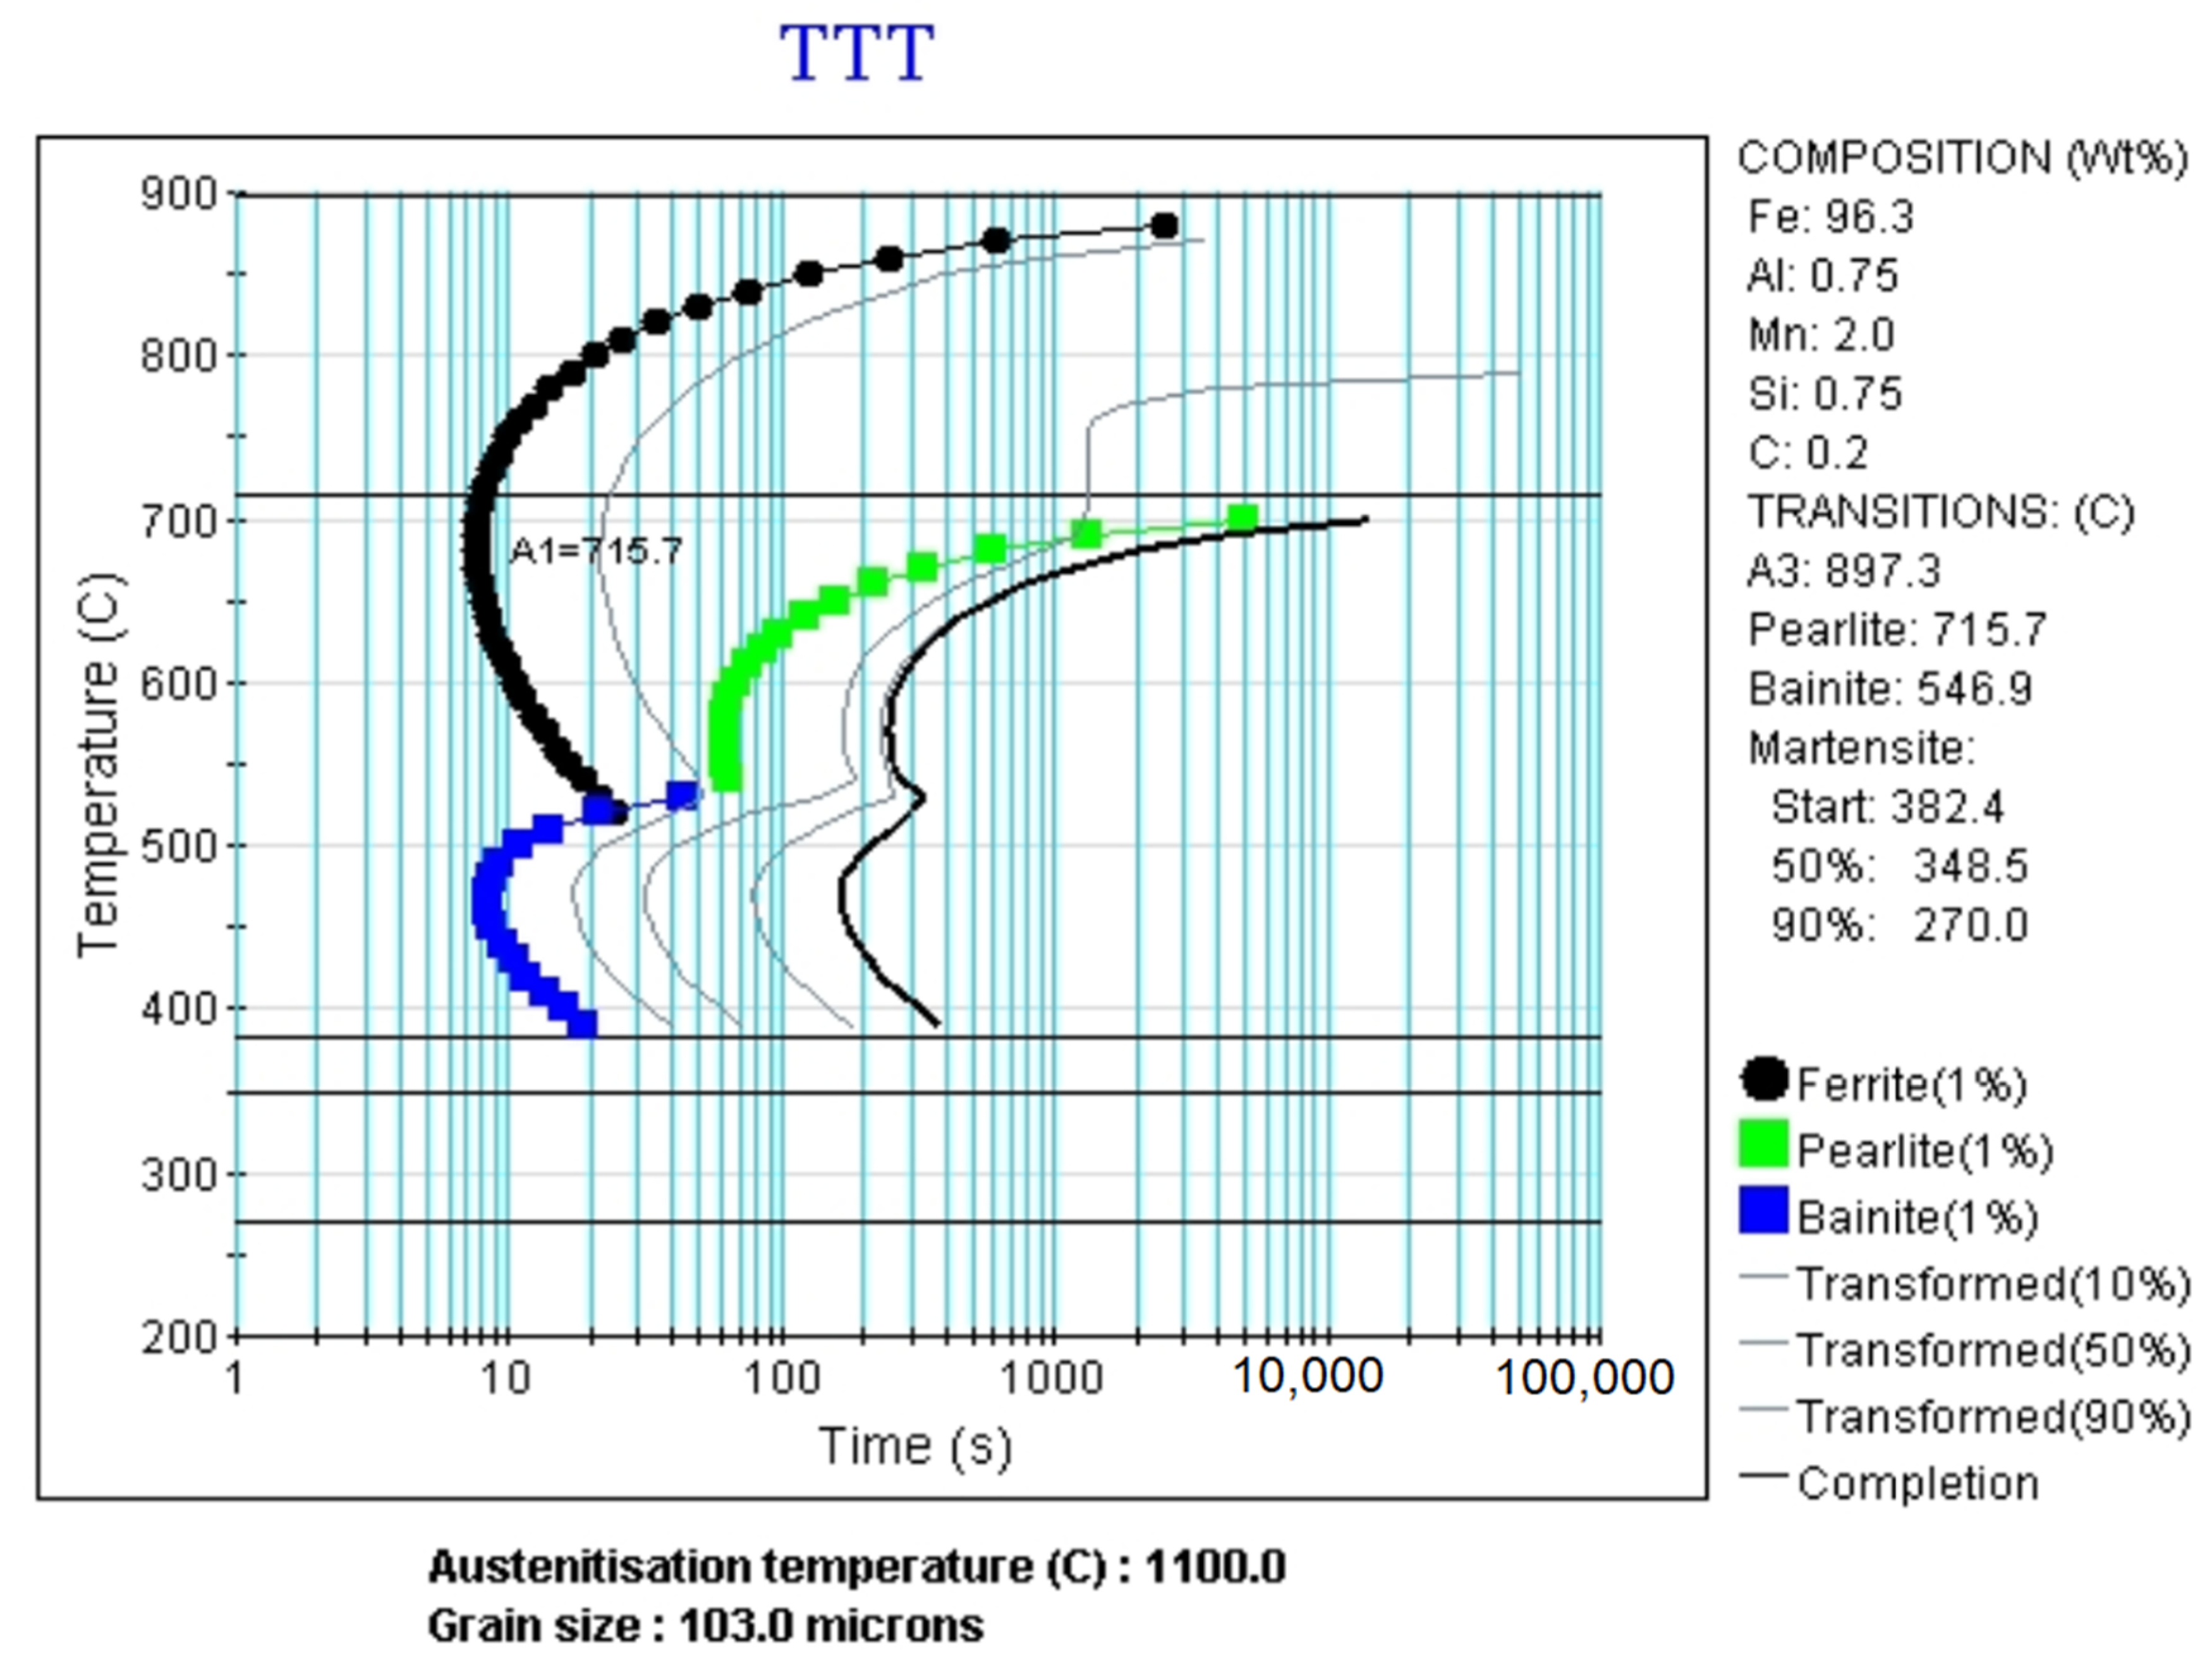
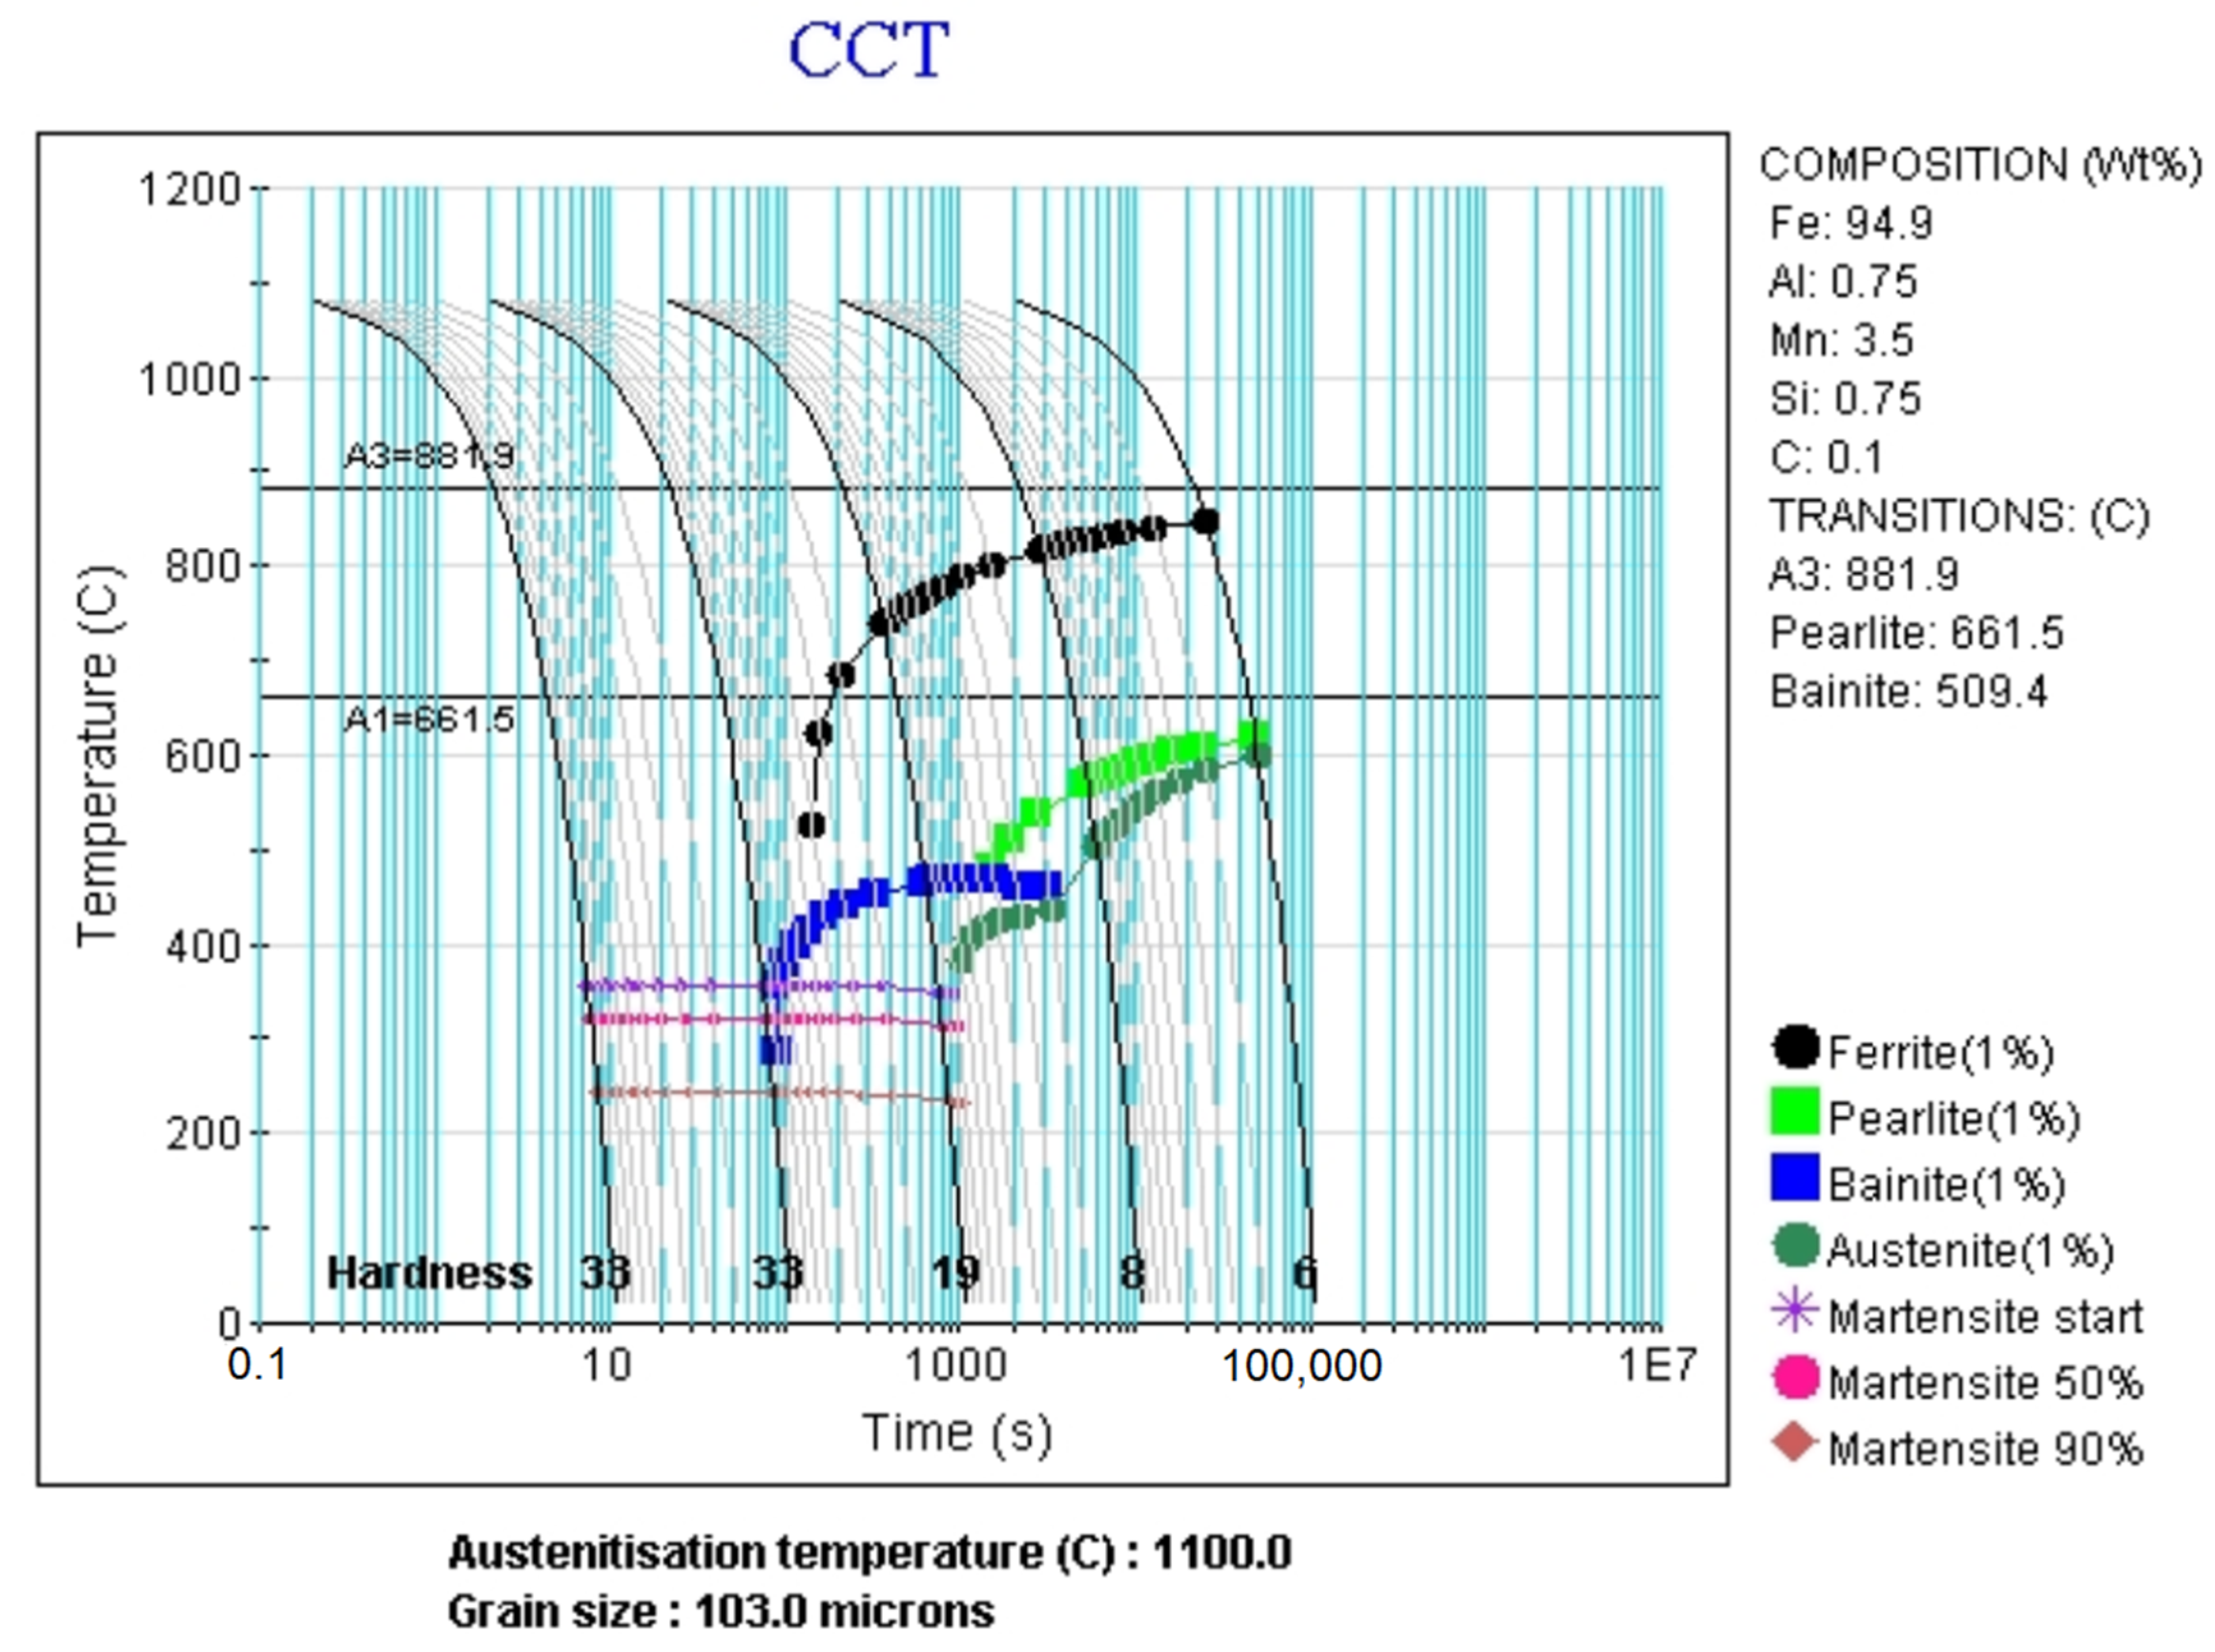
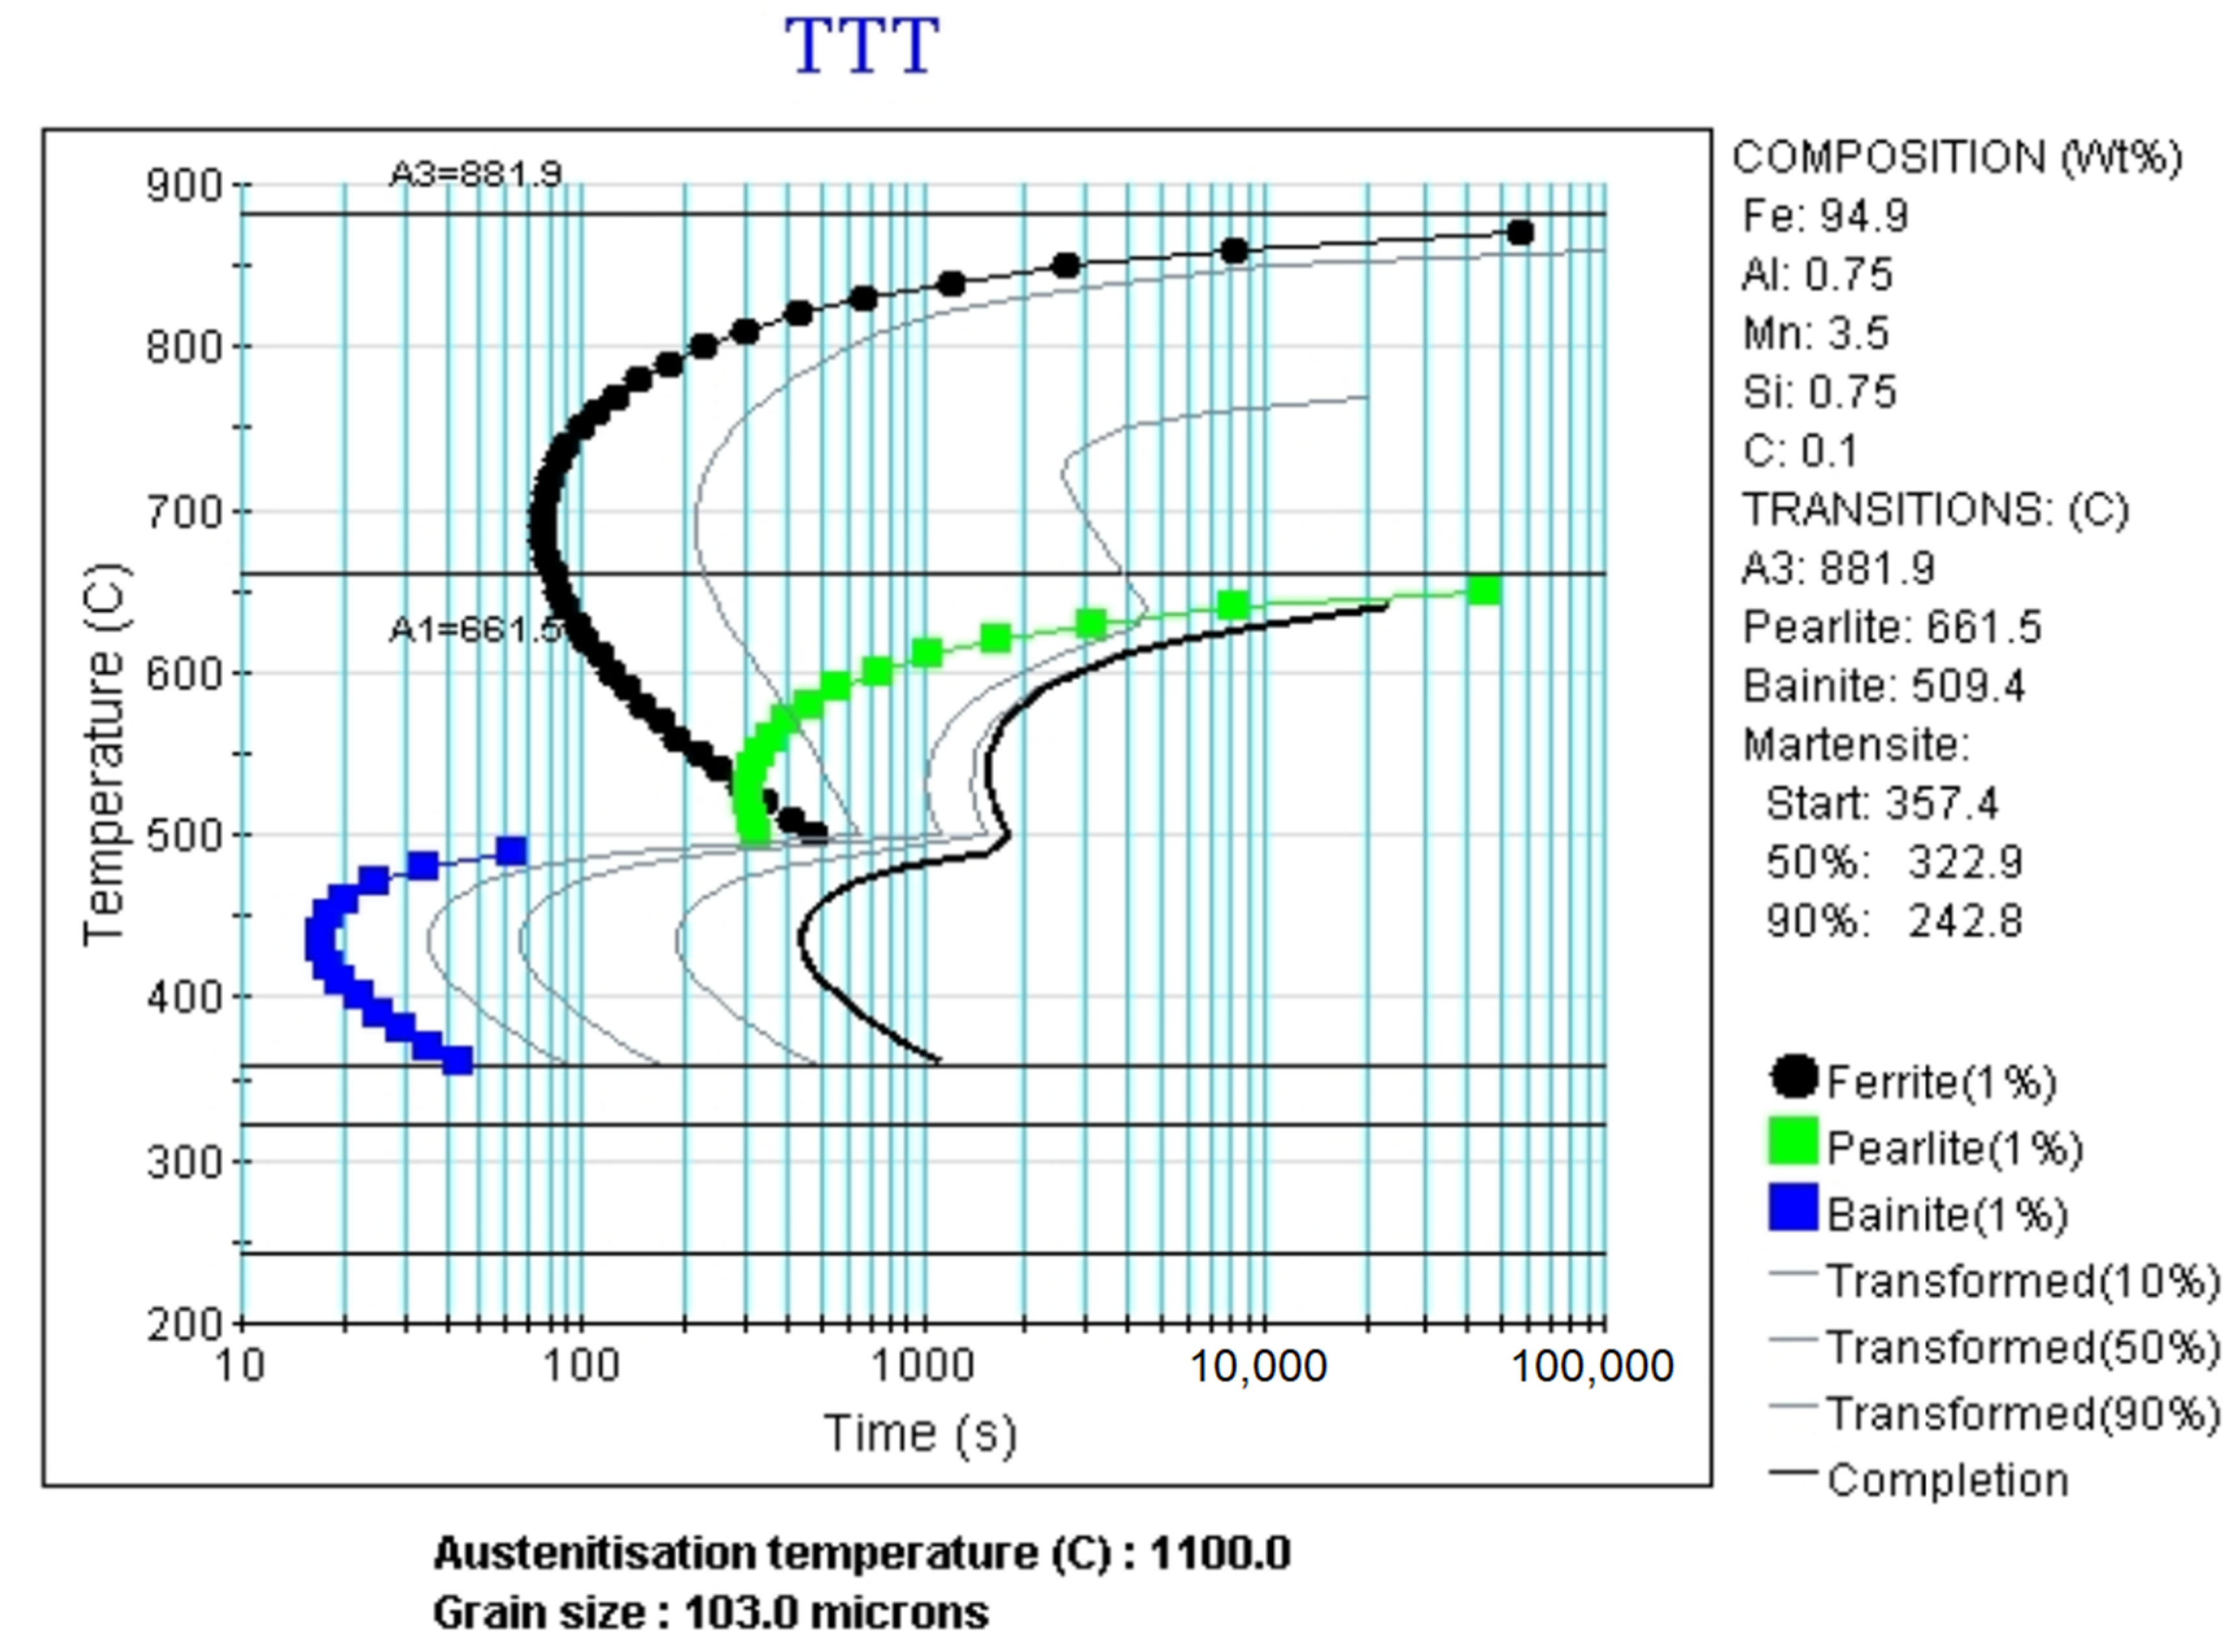
3.2. Continuous Cooling Transformation and Temperature–Time Transformation Diagrams

Figure 5, Figure 6, Figure 7, Figure 8, Figure 9 and Figure 10 show the CCT and TTT diagrams for selected steels. The CCT diagrams created and calculated with the usage of JMatPro software were used to examine the influence of Mn on a change in the transition temperatures of Ac1 and Ac3, as well as on different phases and the martensite start and martensite 50% and 90% temperatures. The TTT diagrams were used for simulations of isothermal treatments. The quenching temperature of 1100 °C and the grain size of 103 µm were chosen for these calculations. The grain size was calculated with the usage of the given austenitization temperature of 1100 °C and a time of 300 s. The cooling rate, which was used for the calculation, was increasing from 0.01 to 100 K/s. The following results show the influence of the increasing Mn amount, as well as the influence of the change in C from 0.1 to 0.2% (wt.%) on the phase transformation diagrams.
The CCT diagram for 2% Mn and 0.1% C containing steel shows the distribution of the ferrite, pearlite, bainite, and austenite, and the martensite start, martensite (50%), martensite (90%) lines, as well as the transition temperatures Ac1 and Ac3. It can be seen that the distribution of ferrite is almost exactly between the Ac1 and Ac3 lines, and within the time 10–100,000 s. Bainite is formed the fastest at a temperature of 561 °C. The transition temperature of pearlite is shown at 701 °C. The martensite start temperature is at around 424 °C, and the 90% martensite is close to 312 °C. After increasing the amount of Mn to 3.5%, 5%, 8%, and 10%, it can be observed that the higher the Mn content, the more the phases are shifting to the right side of the figure, which means that they are going to be formed only at very slow cooling rates. They will be present also at lower temperatures. For 8% Mn steel, the austenite phase disappeared completely, and at 10% Mn only a very small amount of pearlite and a small amount of ferrite are formed. The further increase in Mn content shifts the Ac1, Ac3, Ms, martensite (50%) and martensite (90%) temperatures down, with the percentages representing the state of the martensite transformation. The higher the Mn content, the lower the Ms temperature. When comparing the results from the sample with 10% Mn and 0.1% C to the sample with 10% Mn and 0.2%(wt.%) C, it can be observed that the increase in the C content increases the amount of pearlite. The temperature of ferrite shifts down, the A3 temperature decreases, and the A1 temperature shifts up. The martensite start temperatures are shifted down and the M (90%) shift down to negative temperatures.
The TTT diagrams for 2%, 3.5%, 5%, 8%, and 10% Mn steels containing 0.1% C show very similar results as the CCT diagrams. With the increase of the Mn content, the martensite temperatures are also shifted down, together with the A1 and A3 transition temperatures. The corresponding steels containing 0.2% C have lower temperatures of ferrite, bainite, and pearlite formation. The pearlite nose is shifted to the left. The Ms temperatures decrease, together with the Ac1 and Ac3 temperatures. The martensite 90% temperature decreases to the negative region, the same as for the CCT diagrams.
All the gathered data on the critical transition temperatures are summarized in Table 2. The equilibrium temperatures (Ae1 and Ae3) are listed based on pseudo-binary phase diagrams (Figure 1, Figure 2, Figure 3 and Figure 4), whereas the Ac1, Ac3, and Ms temperatures are calculated based on CCT diagrams (Figure 5, Figure 6, Figure 7, Figure 8, Figure 9 and Figure 10). It is clear that all the temperatures decrease with increasing Mn content from 2 to 10%. The change in C content from 0.1% to 0.2% lowers the Ms, Ae3, and Ac3 temperatures for all the steel grades, regardless of the Mn amount, but increases the Ae1 and Ac1 temperatures.

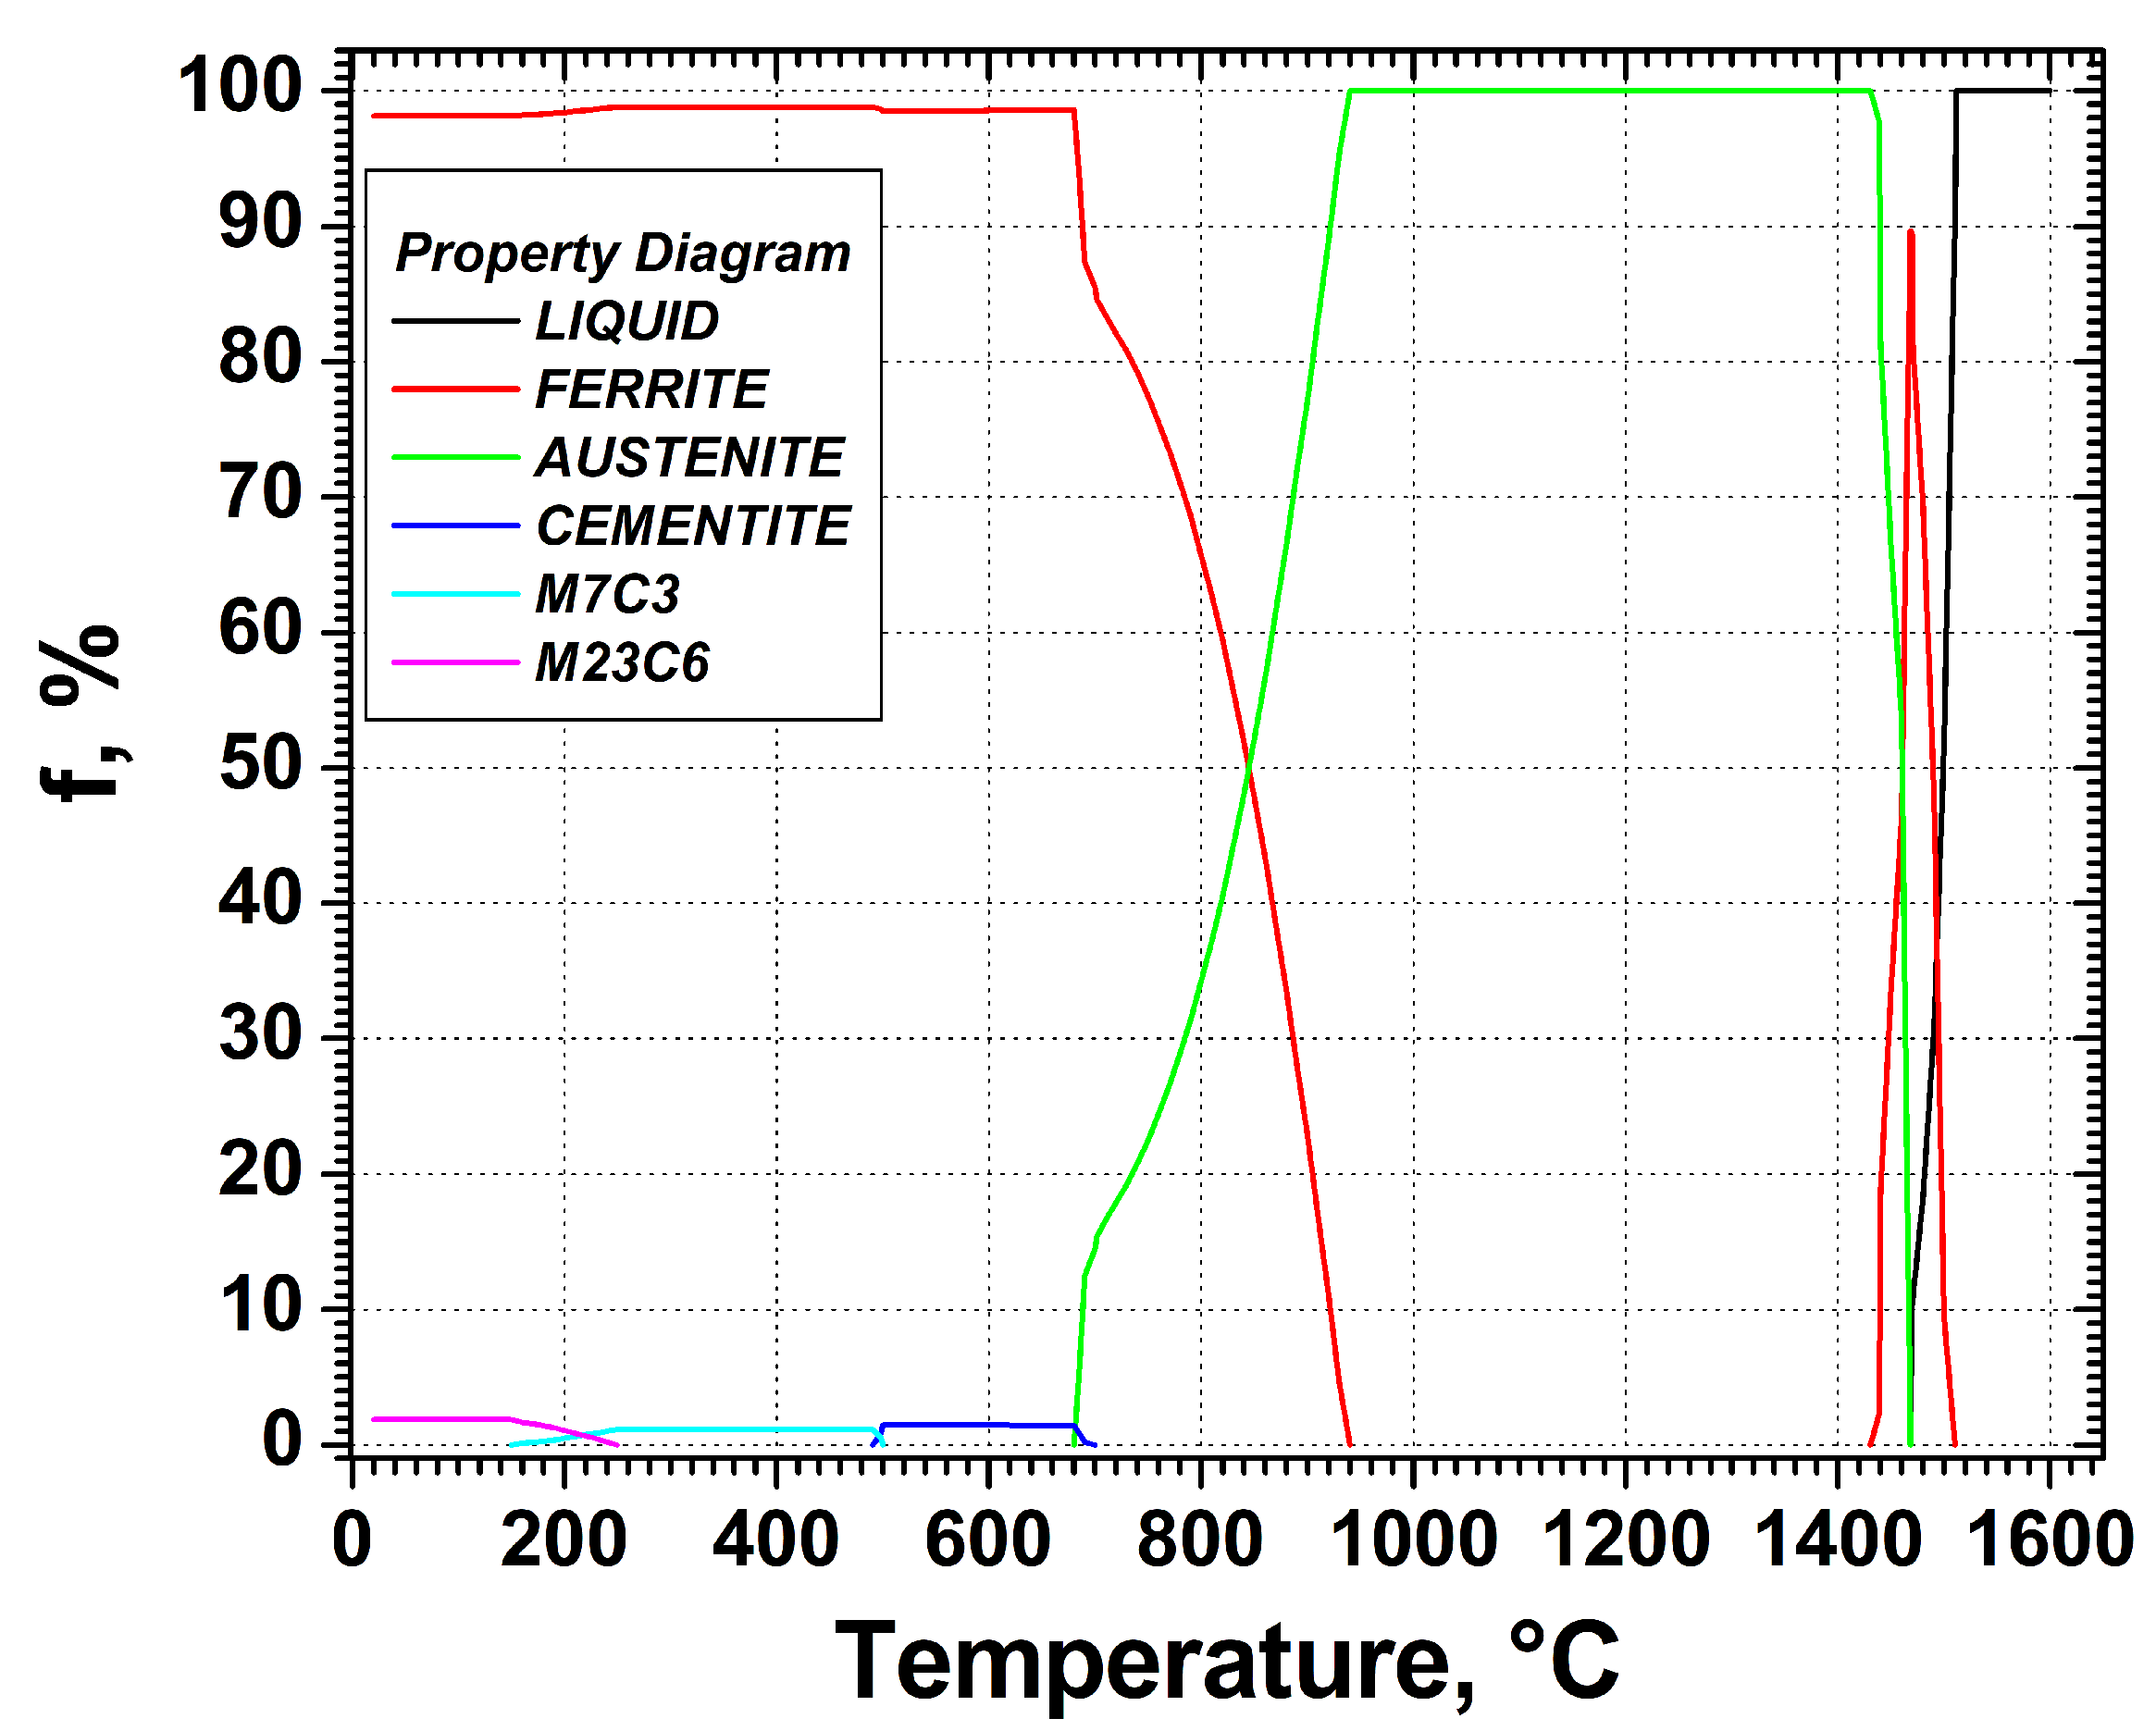
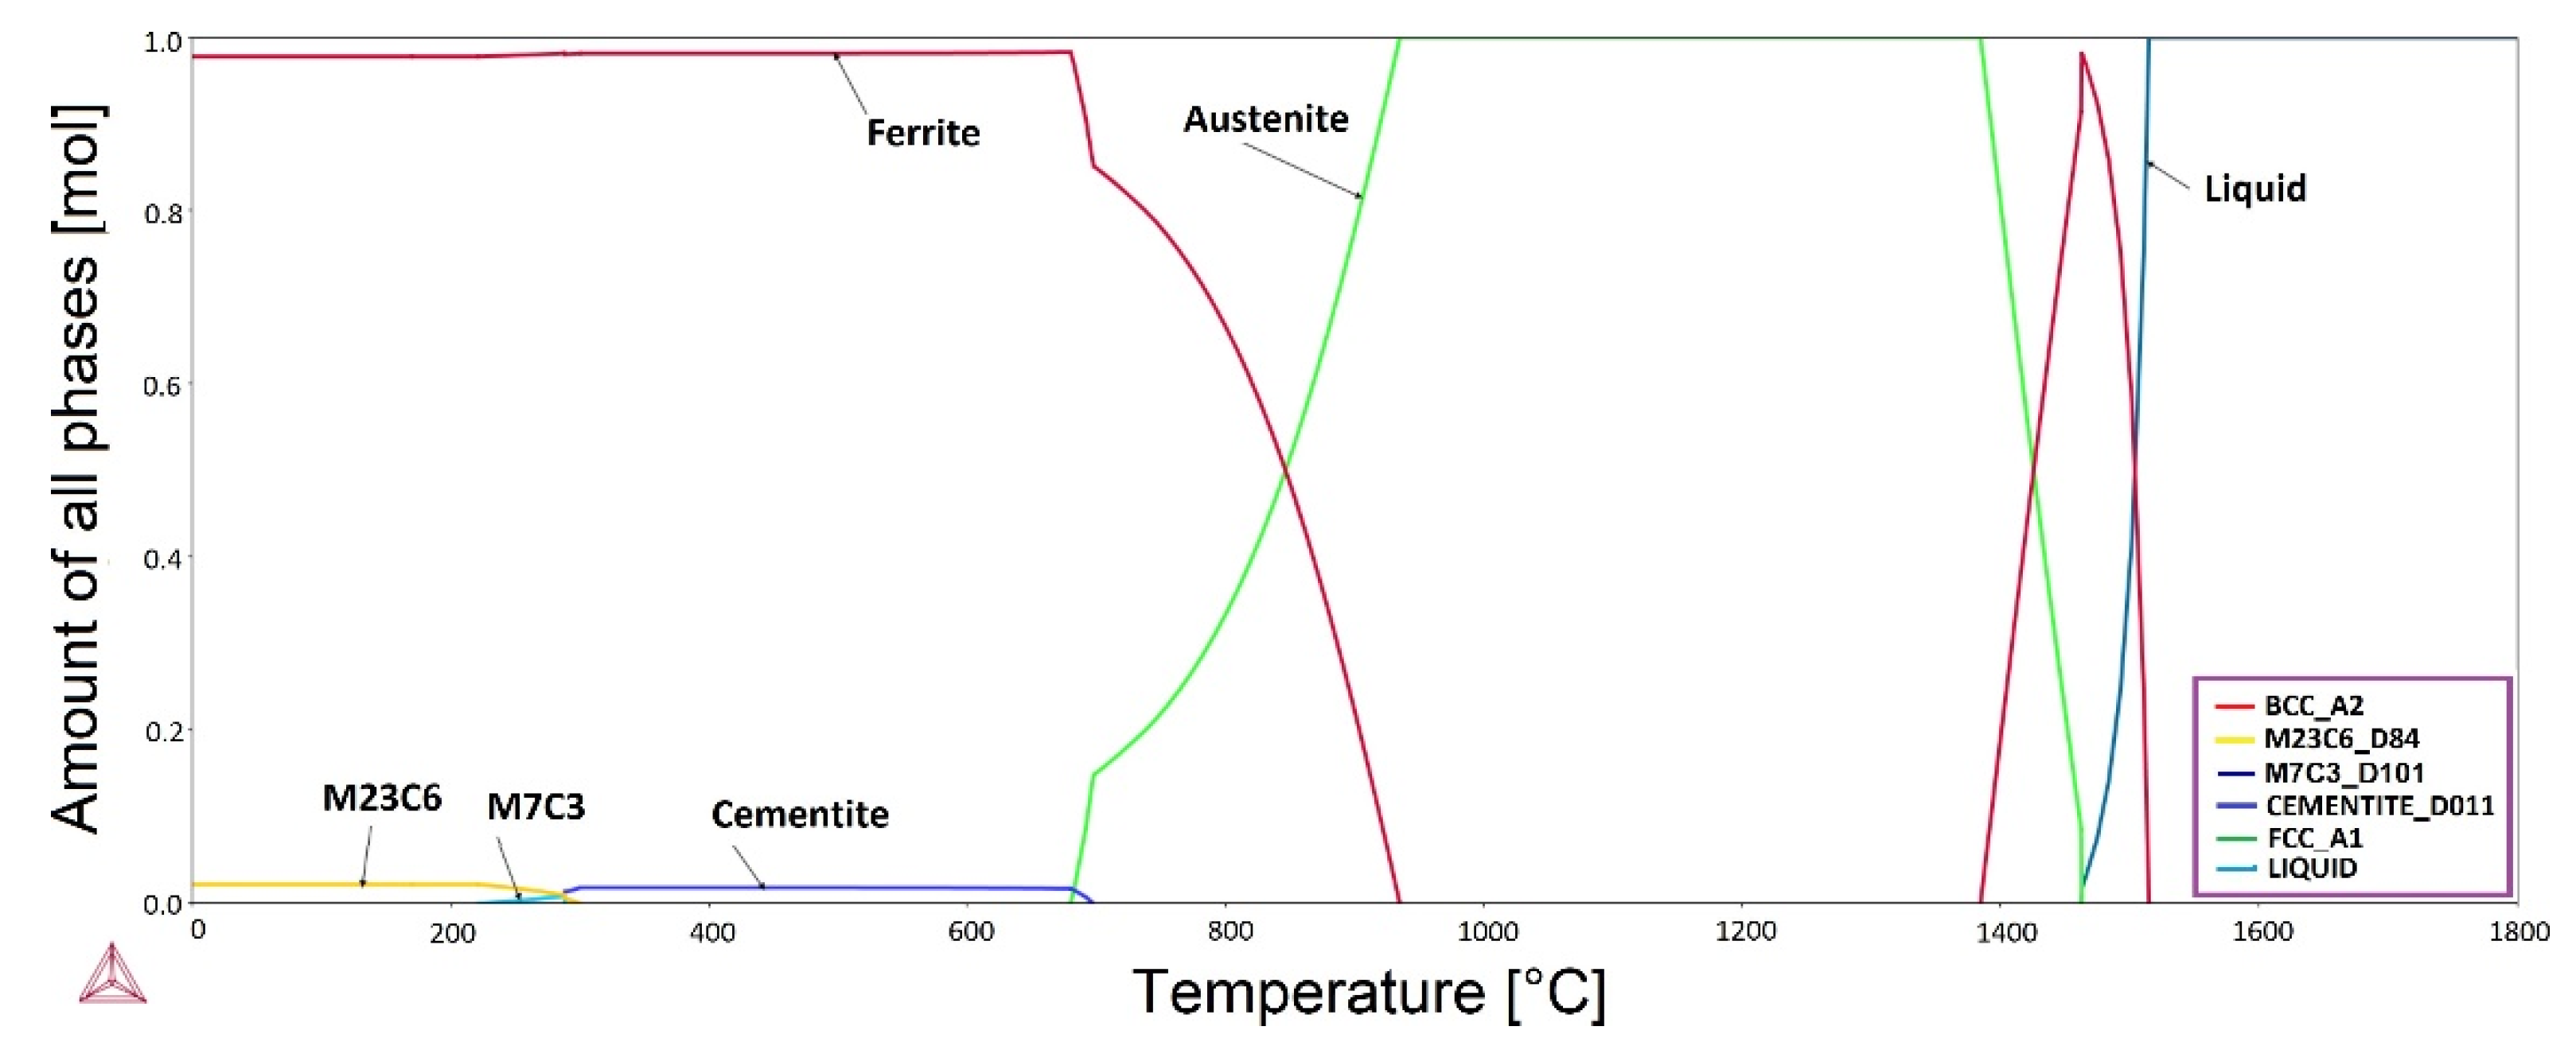
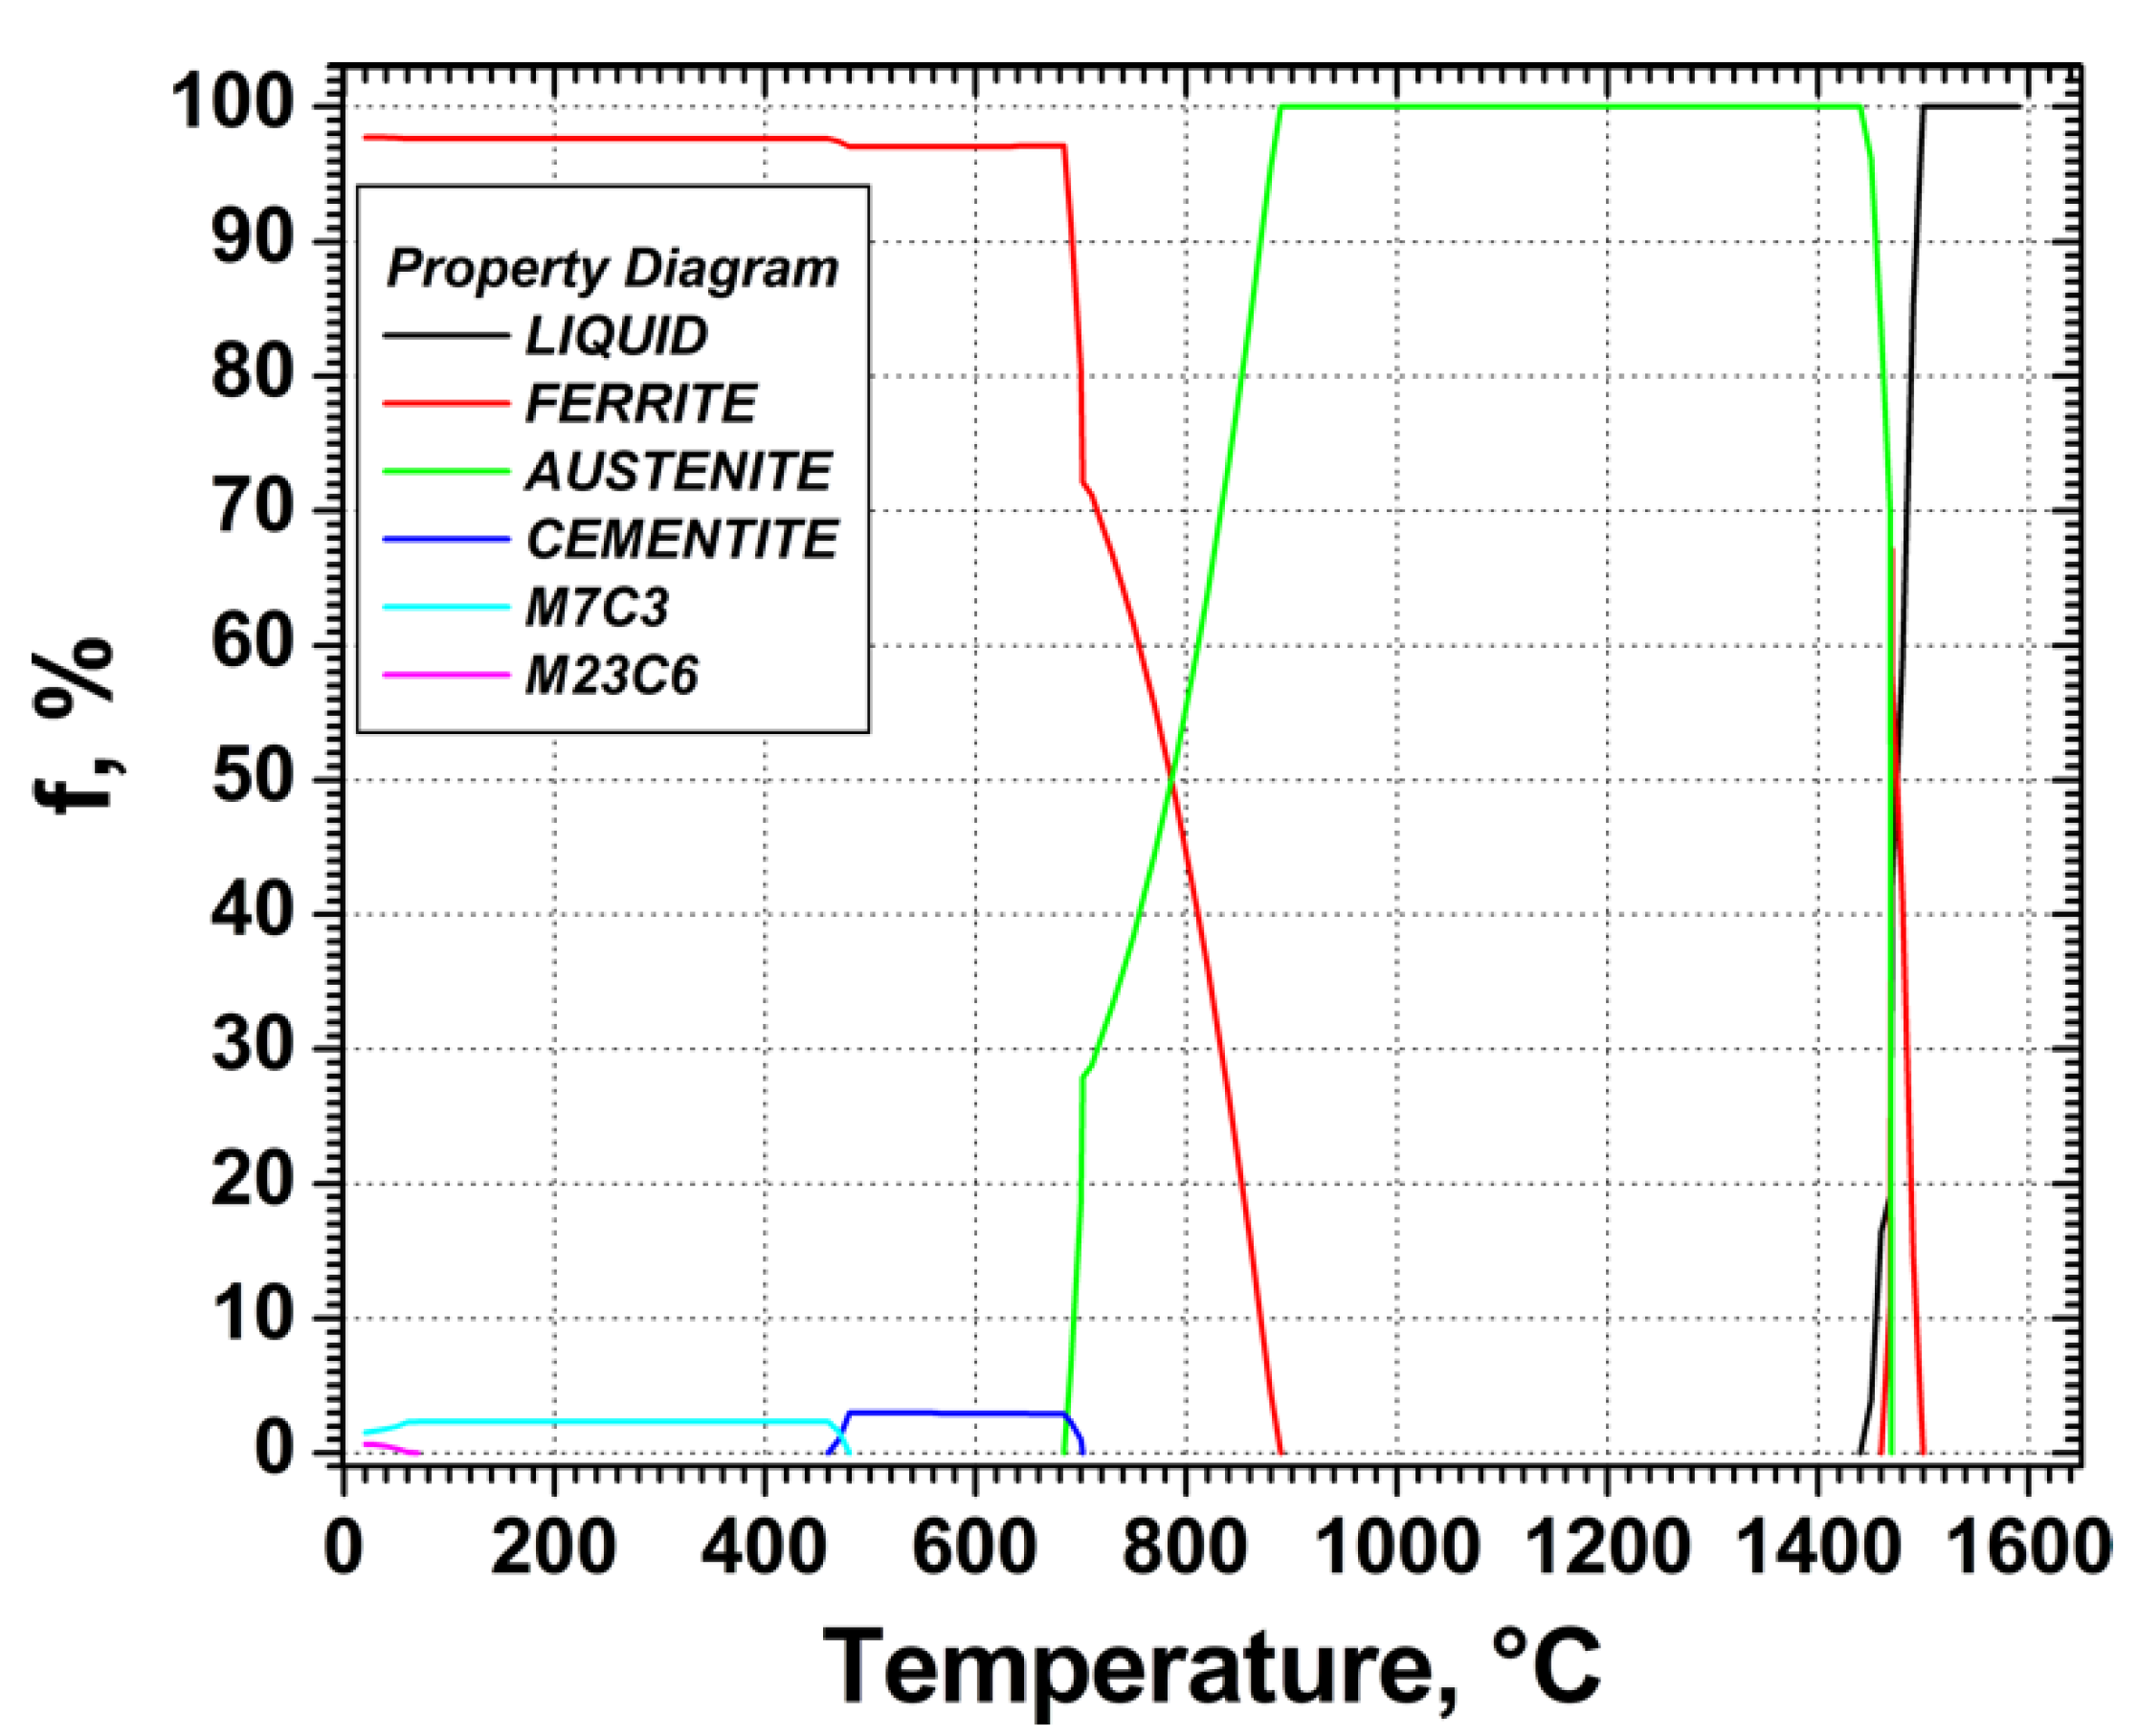
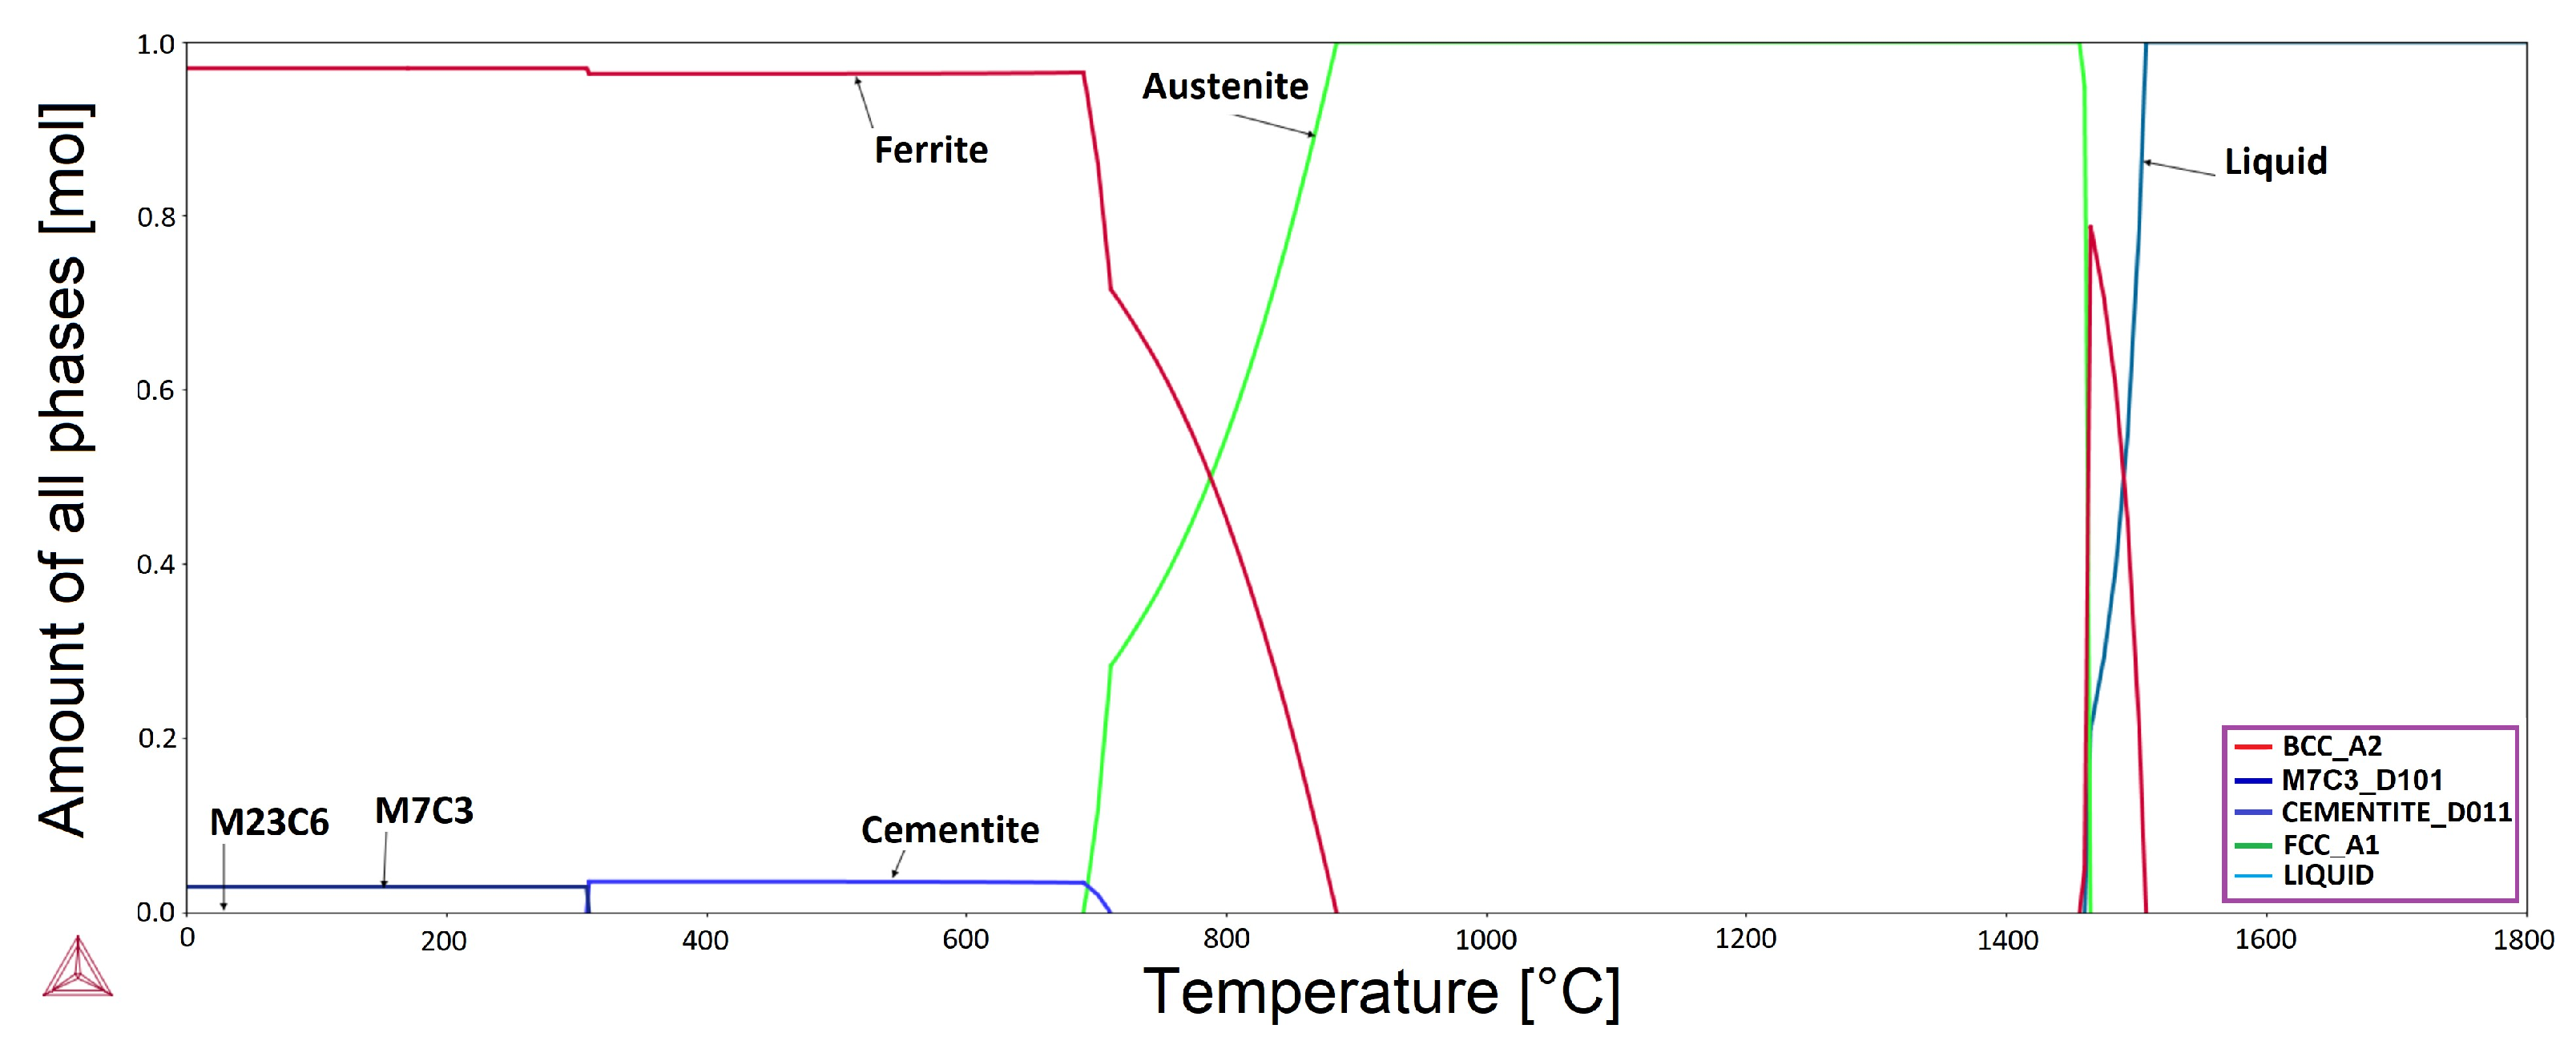
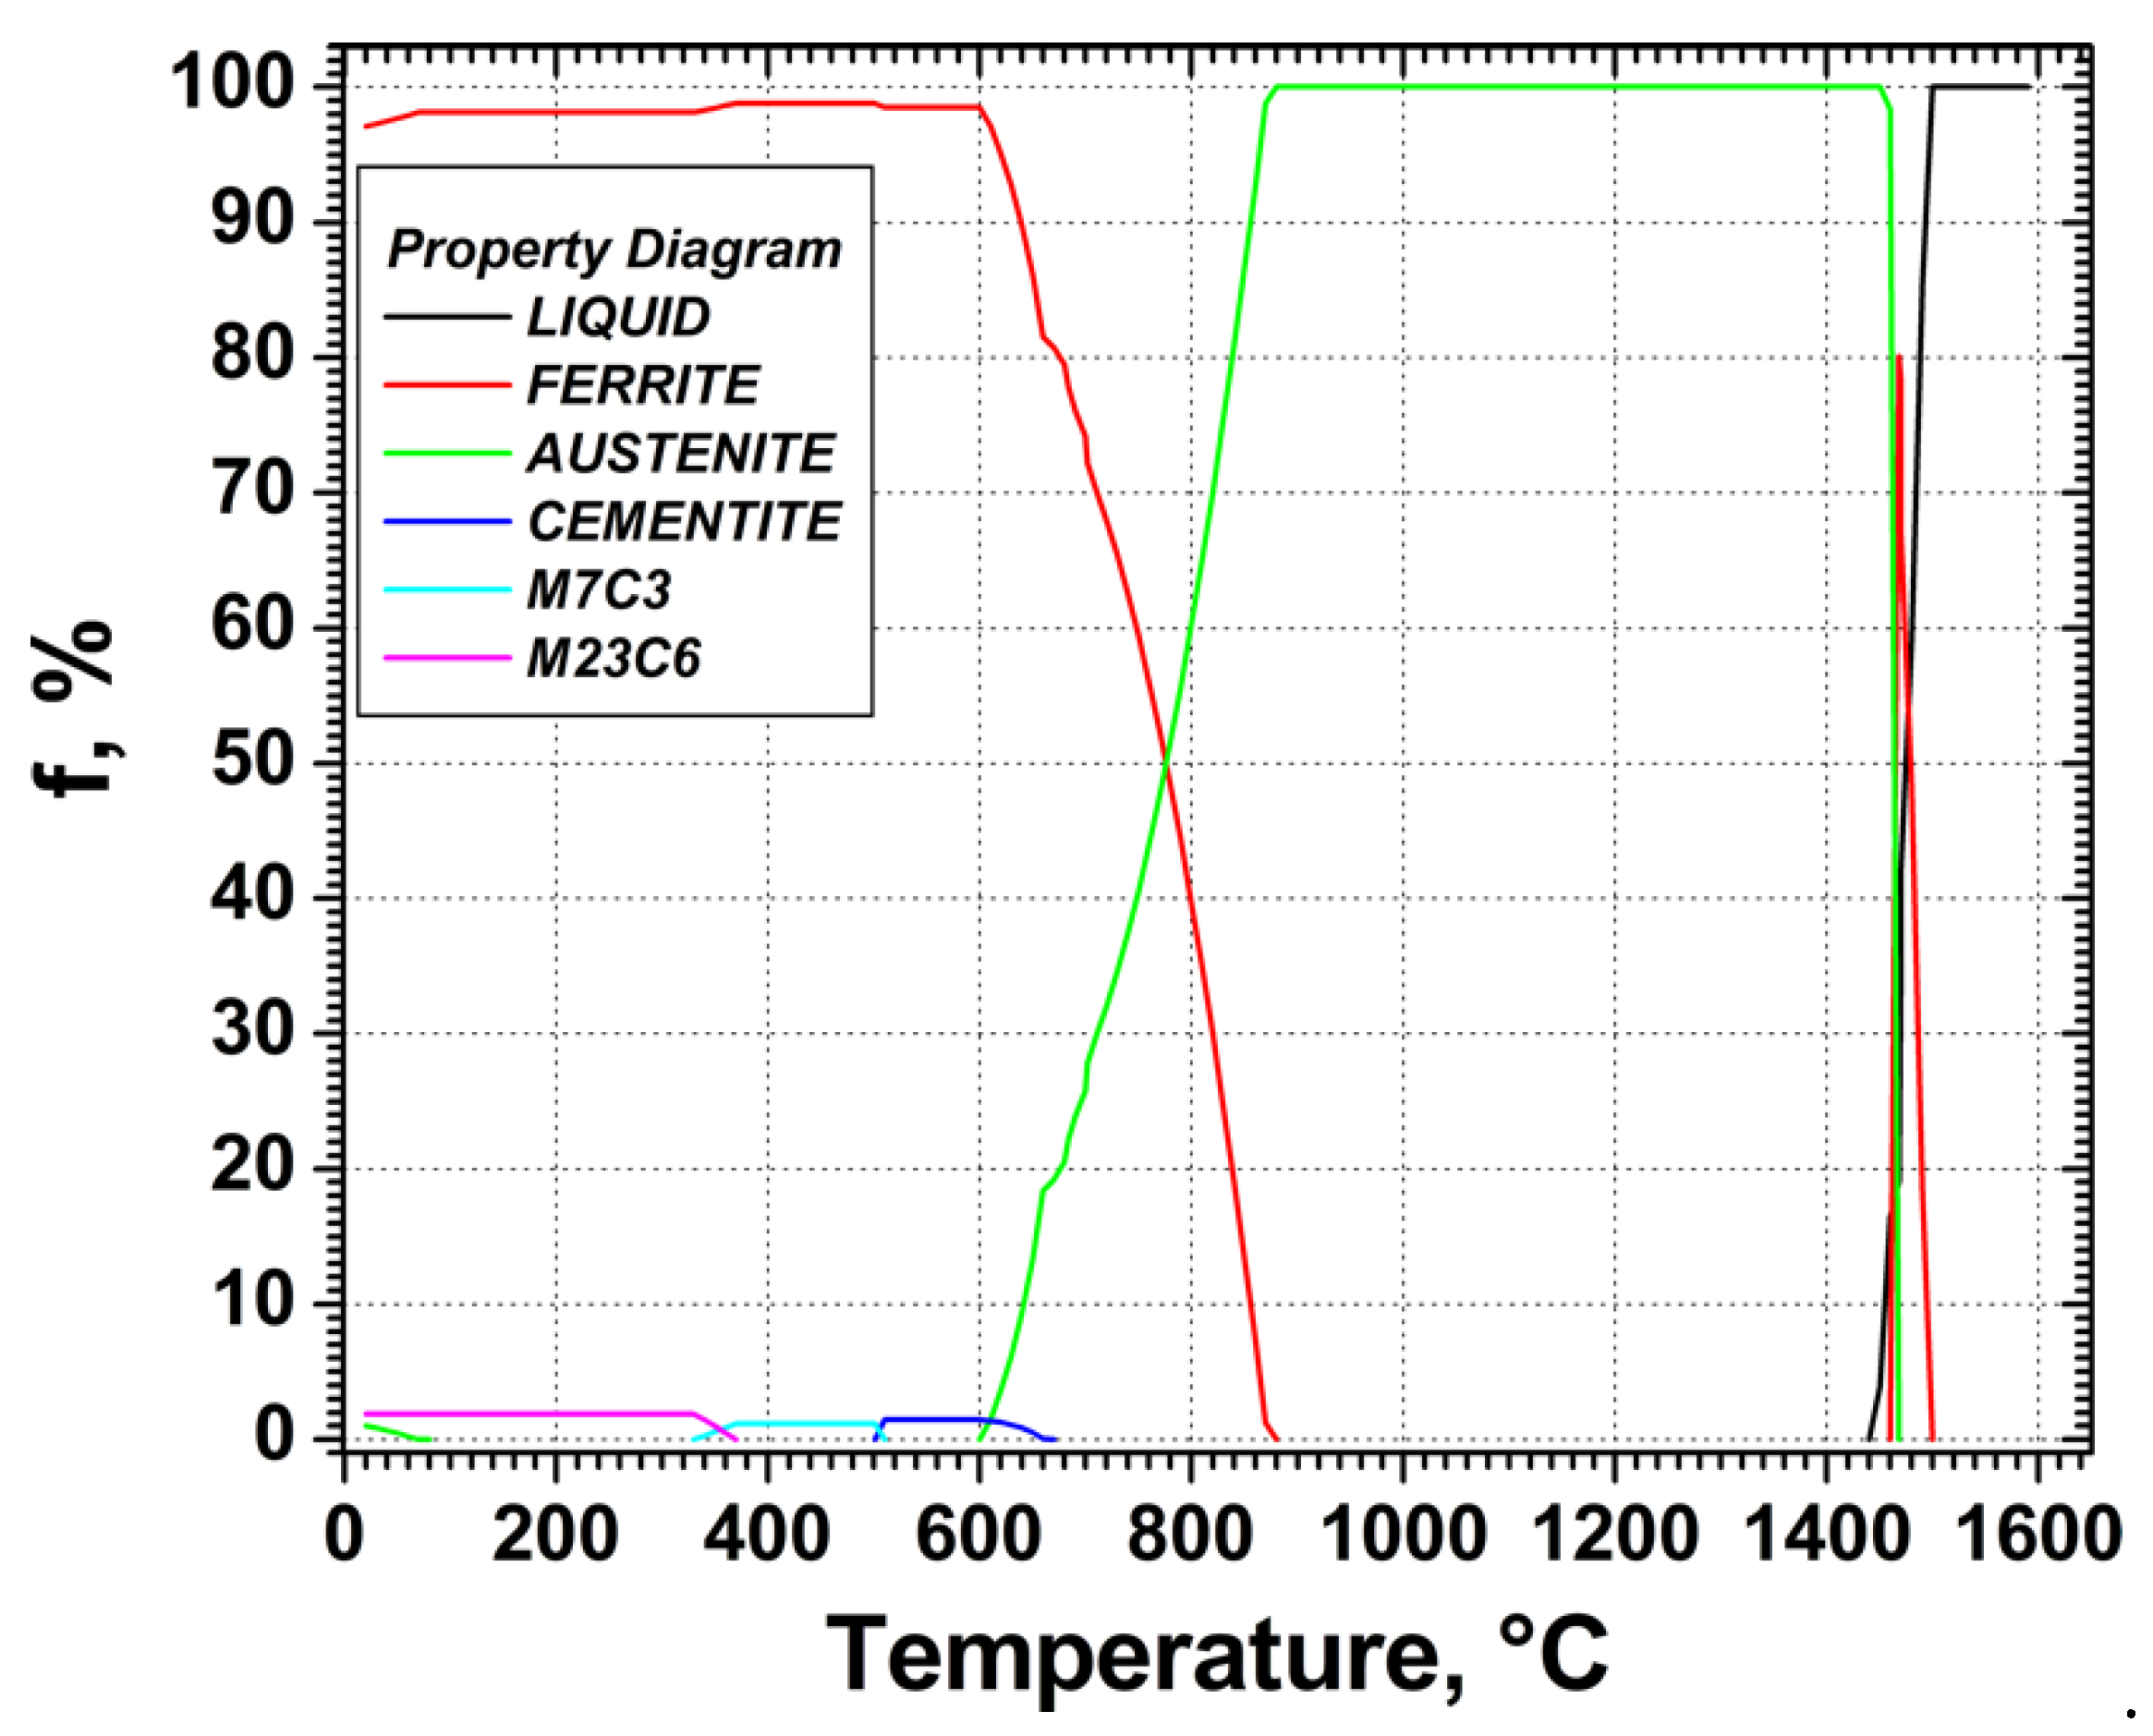
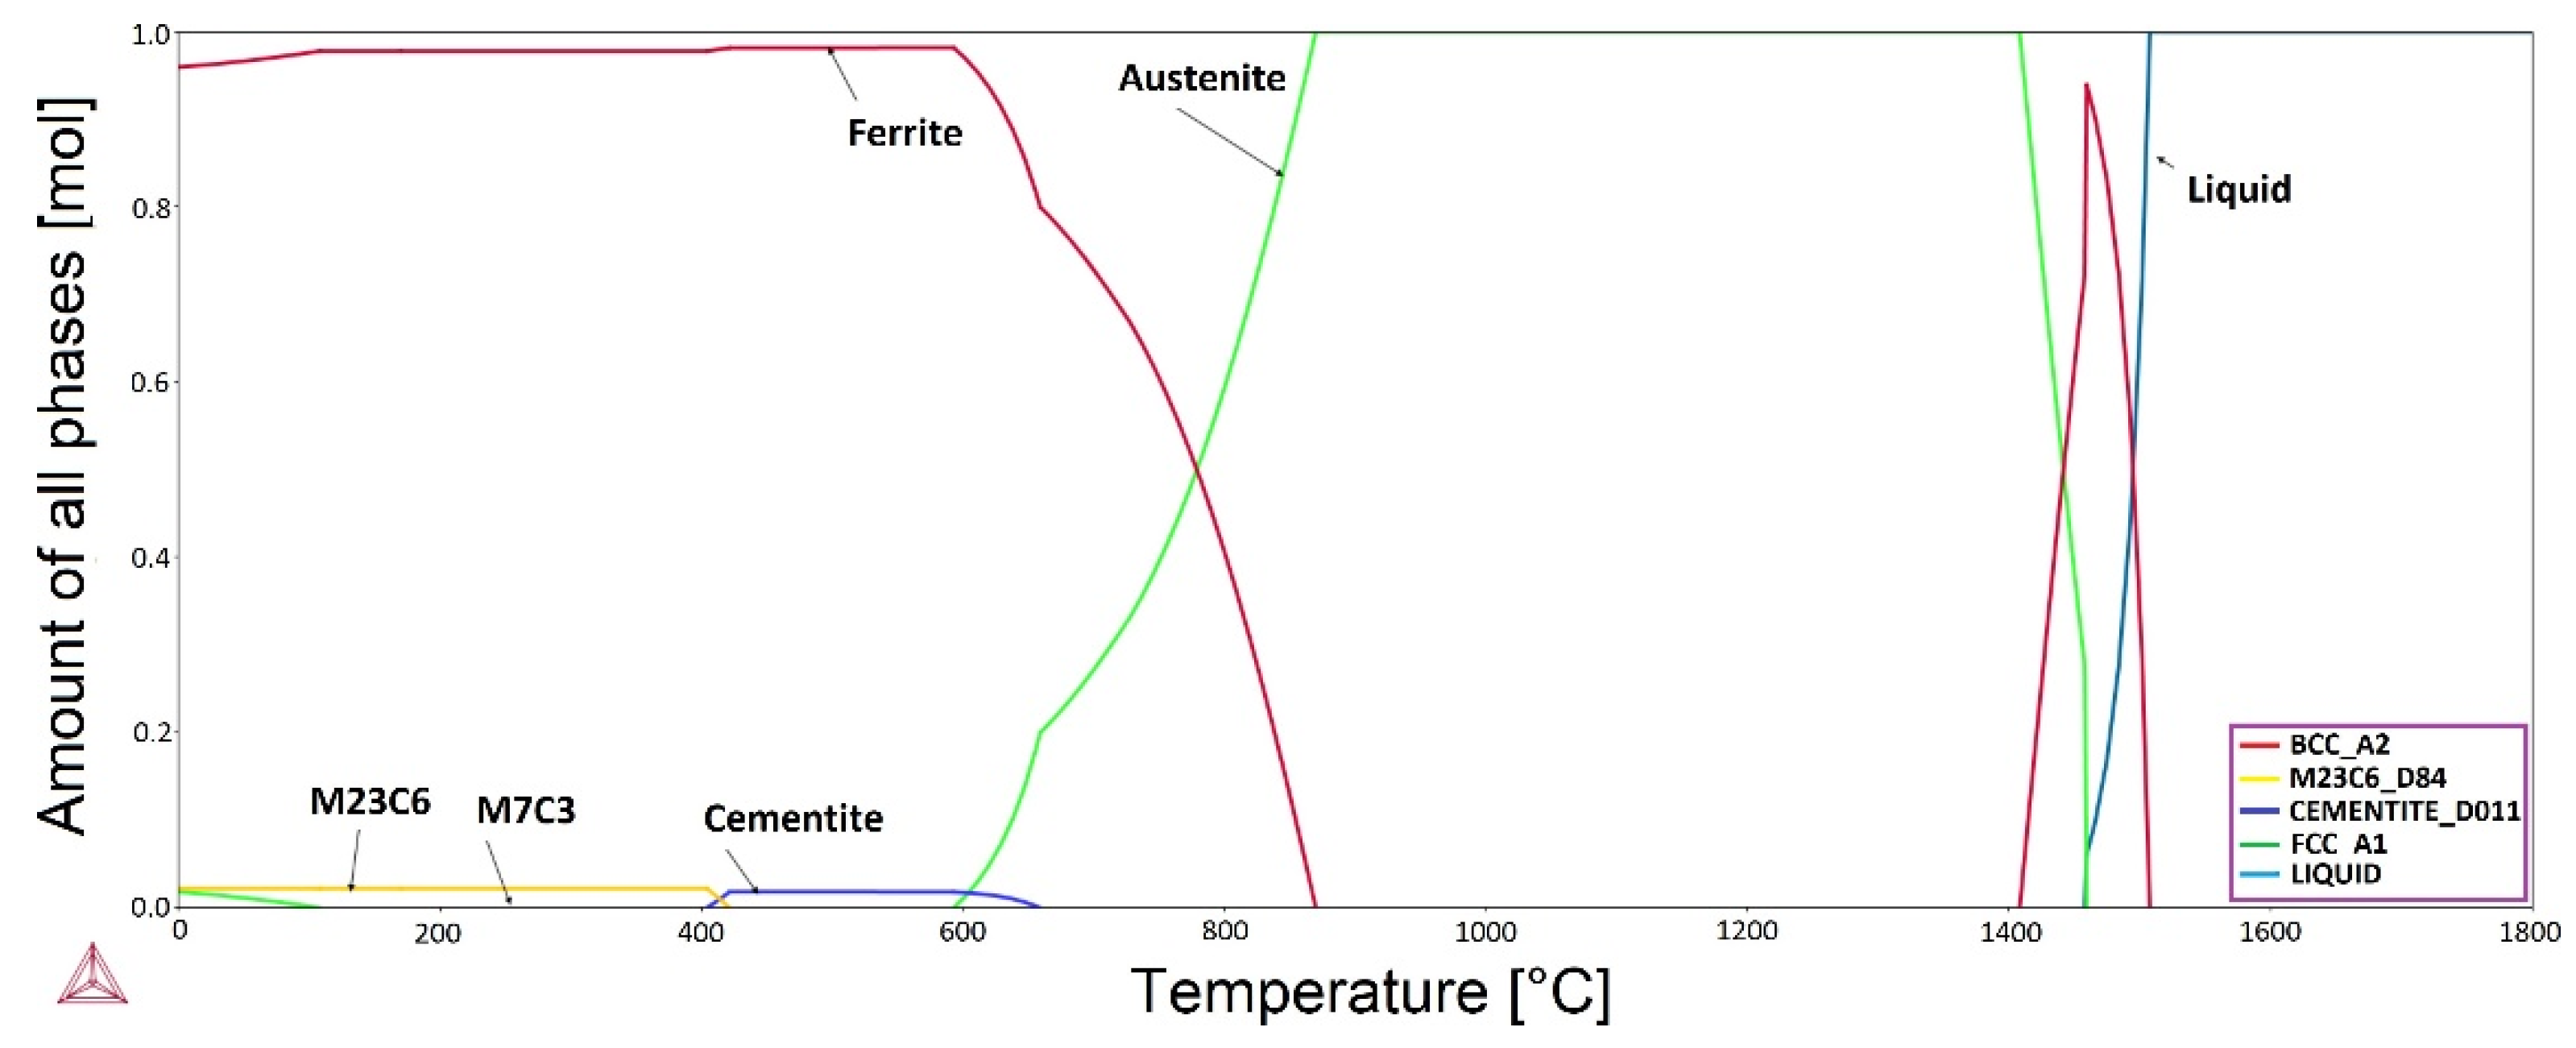
3.3. Phase Evolution Diagrams

Figure 11, Figure 12, Figure 13, Figure 14, Figure 15 and Figure 16 show the evolution of phases for the temperatures up to 1600 °C. The calculations were made with JMatPro, as well as with Thermo-Calc to not only analyze the evolution of phases but also to compare the results received from both softwares [16,17]. The phase evolution diagram for 2% Mn and 0.1% C steel shows that at the lower temperatures, up to 700 °C, four phases occur: cementite, M23C6, and M7C3 at low ranges of around 1.5%, and ferrite at a very high wt.% of 98%. From the temperatures 700–950 °C, a decrease of ferrite is visible to the range of 0% and the increase of the austenite volume to a fully (100%) austenitic structure. After reaching 1400 °C, the delta ferrite phase starts appearing again to a range of 90%, and afterwards it starts to shift down. Austenite starts to decrease down until it disappears. After austenite disappears, the liquid phase starts to show up until it reaches a range of 100%, and it is left as the last phase.
With an increasing amount of Mn to 3.5%, 5%, 8%, and 10% the reduction of the amount of ferrite can be observed from the starting point, respectively, to: 3.5% Mn = 96% ferrite, 5% Mn = 94% ferrite, 8% Mn = 90% ferrite, 10% Mn = 85% ferrite. With the increase of the Mn content to 3.5% and 5%, a small amount of austenite is visible between 0 and 80 °C at around 1%. When the content of Mn is increased to 8% and 10% Mn, the austenite line is visible at 9% and 11%, respectively. The temperature range in which the M23C6 phase is occurring gets larger with the increase in Mn content, and the M7C3 and cementite decrease in size. The line of the step decrease in the ferrite amount to 0%, and an increase of austenite to 100% creates a fully austenitic structure that moves to the left side of the diagram, which results in the necessary temperature for this transition being lower with the increasing Mn content. After shifting to the temperatures 1400–1600 °C, it can be seen that the liquid phase starts to appear before the austenite phase disappears. With the increase in Mn content, the decrease of the austenite line shifted more from the liquid line, and the peak for ferrite in this temperature region is smaller with increasing Mn concentration.
By comparing the 10Mn-0.1C and 10Mn-0.2C phase evolution diagrams, the result of the increase in C by 0.1% can be examined. By analyzing it from left to right, it can be seen that the beginning austenite line shifted down slightly to around 9%, and the ferrite line stayed mostly the same. The increase in the amount of M23C6 to approximately 4% can also be observed. The transition stage to a fully austenitic structure does not change with the increase in C amount. With the examination of the higher temperatures, it can be seen that the beginning of the liquid phase and the decrease of the austenite line shifts to the left. The ferrite phase peak in this temperature region shows a big decrease from 30% to 10%, which means that the increase in C does not change the amount of ferrite at the lower temperature, but highly affects the higher temperature ferrite.
By comparing the diagrams for the 10Mn-0.1C steel from JMatPro and Thermo-Calc, slight asymmetry can be observed. At the lower temperatures, the lines for ferrite and austenite are the same for both diagrams. A small difference can be seen for M7C3 carbides, for which, in the JMatPro software, a small percentage can be identified at around 500 °C, whereas in the Thermo-Calc they are not visible. The temperature for the change to 100% austenite is the same for both graphs. The most important difference can be seen for the ferrite peak at the high temperature range.

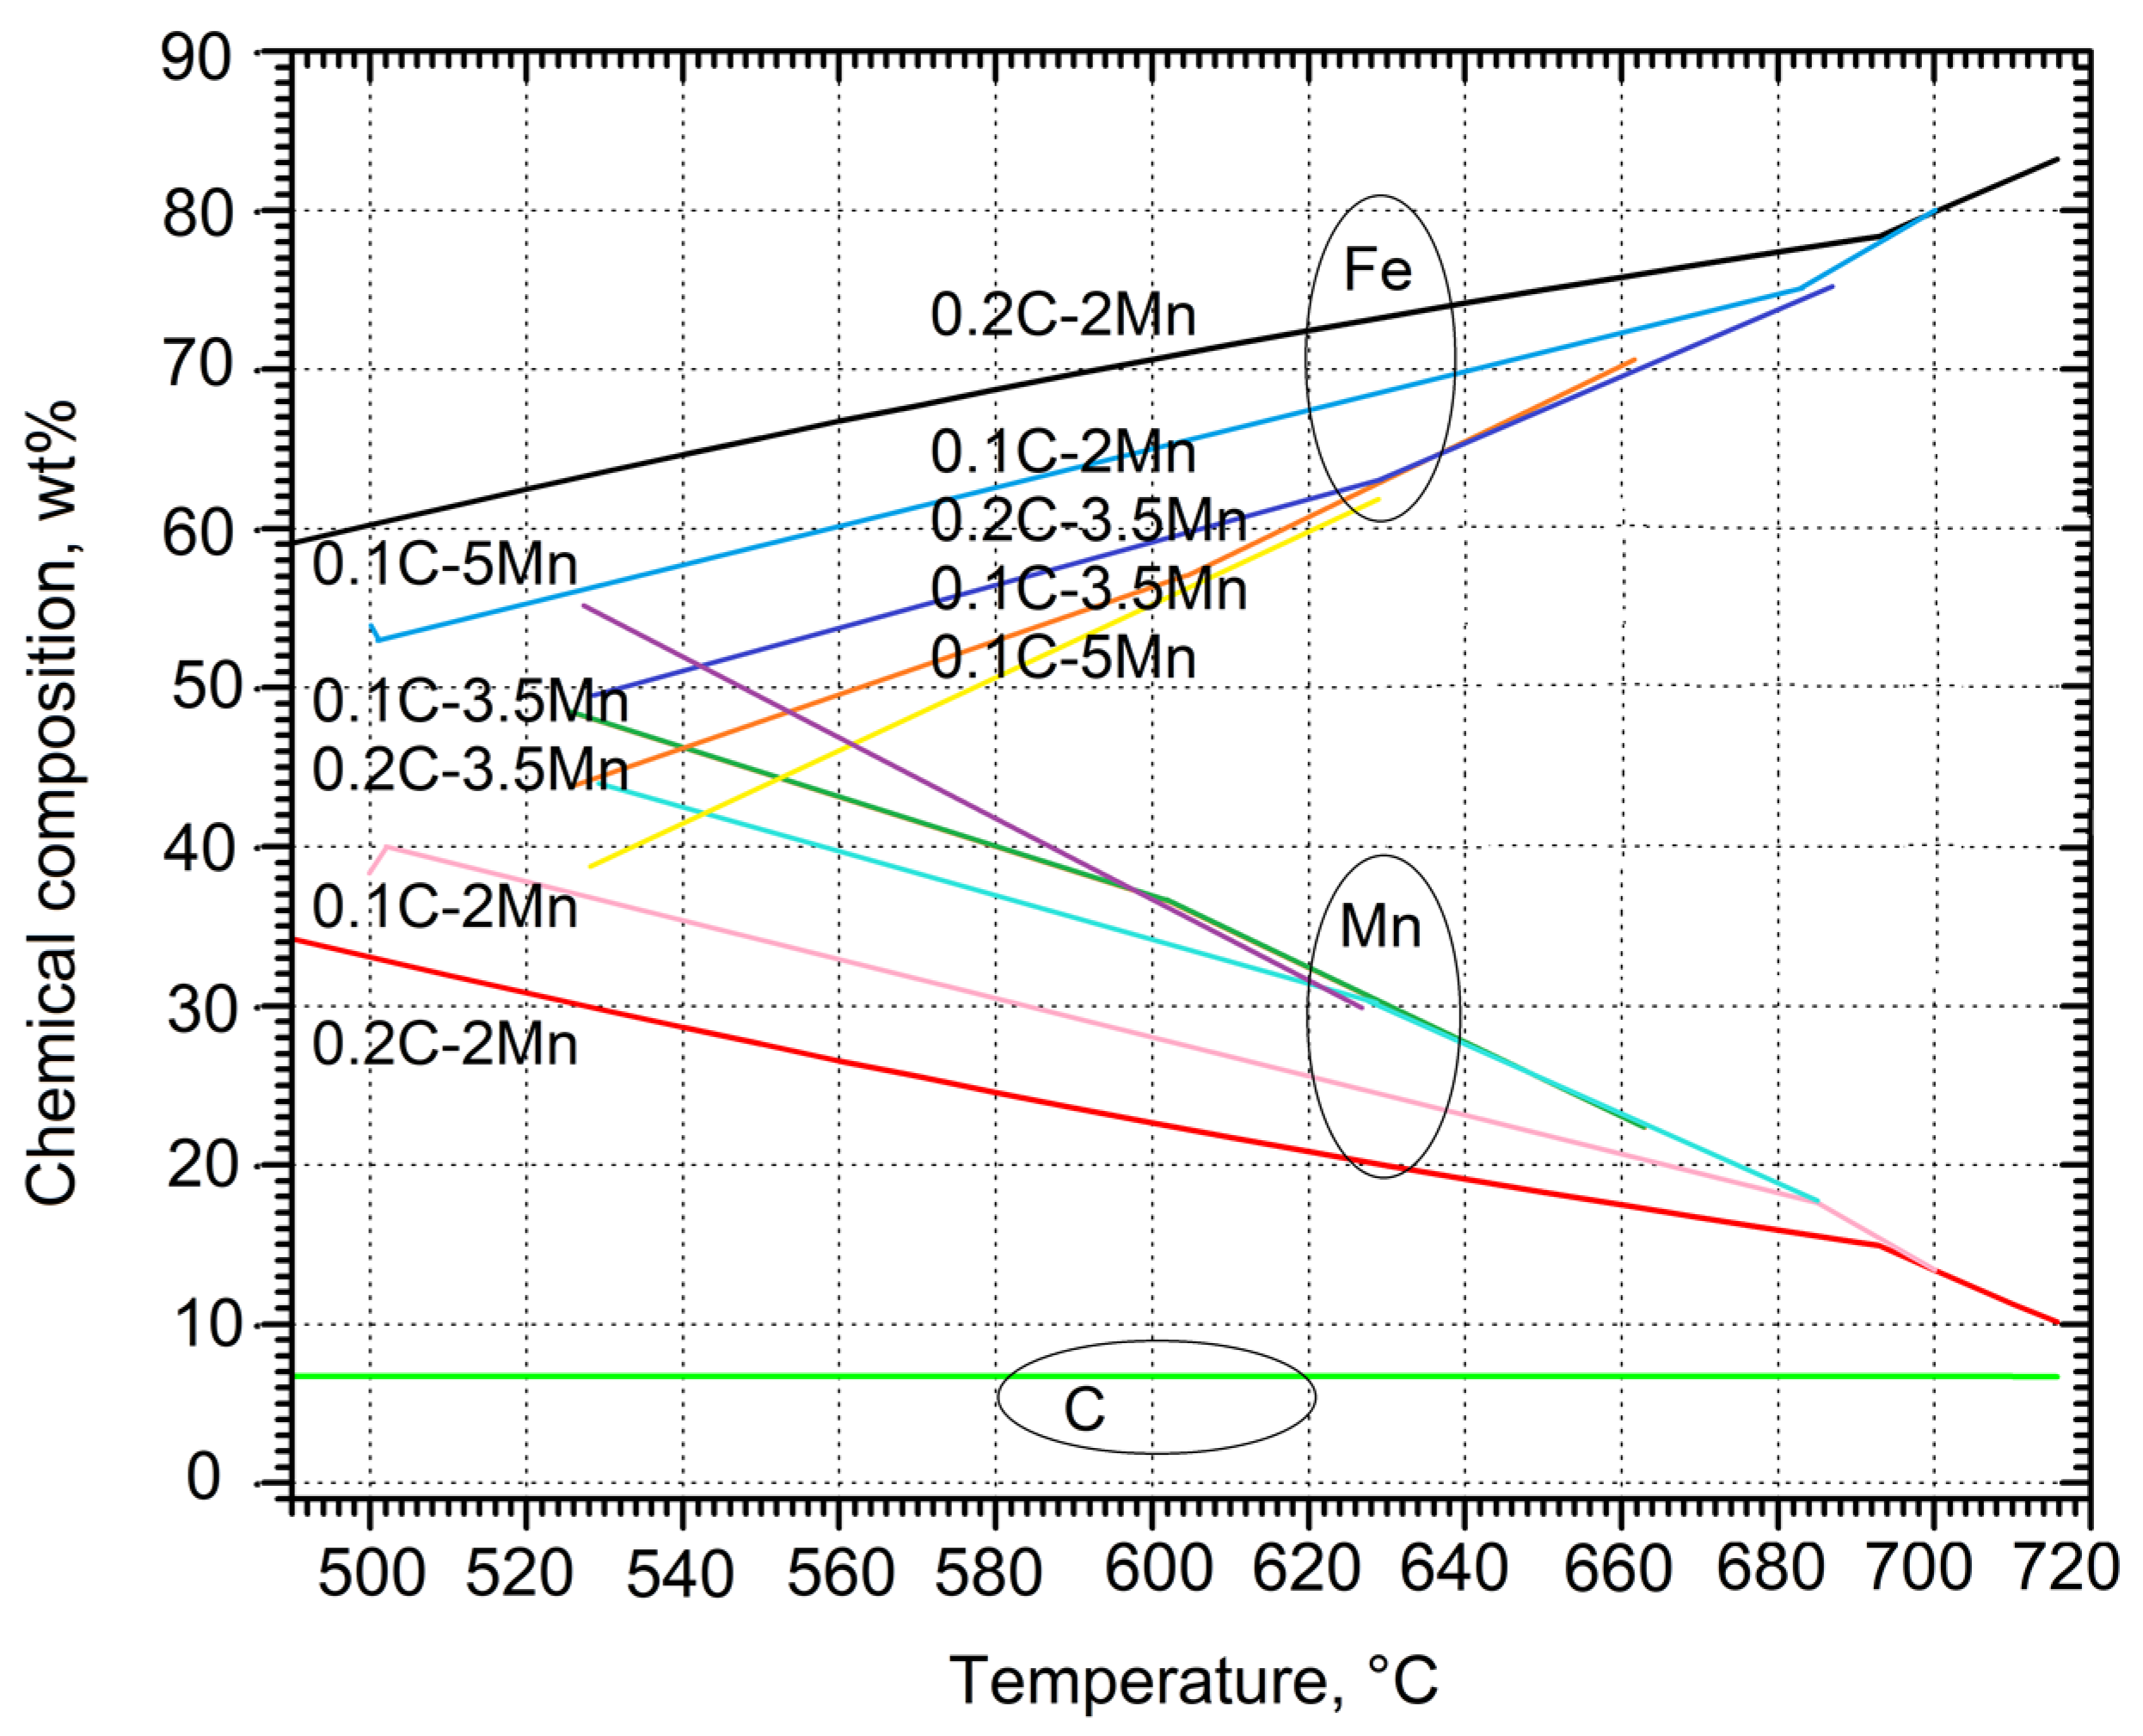
3.4. Chemical Composition Evolution

Figure 17 shows the change in the chemical composition of cementite as a function of temperature for a few selected alloys. The diagram shows how the concentrations of Fe, Mn, and C change as a function of temperature, which corresponds to the change in the chemical composition of the cementite. By analyzing the results for the increasing Mn content and 0.1% C for the samples 1a, 2a, and 3a, it can be seen that, in relation to Mn, the C content does not change. For Mn and Fe, it can be observed that with the temperature rising, the Fe content increases, whereas the Mn content decreases. By analyzing the samples in order of increasing Mn content, it can be seen that the higher the Mn content, the higher its concentration in the cementite. It can be also seen that, with an increase in Mn concentration from 2% to 5%, the temperature stability of cementite changes from 500–700 °C to the 530–620 °C temperature range. Therefore, a general decrease in the temperature stability of cementite with increasing Mn content can be observed.

4. Discussion

Through the calculations made by the use of the JMatPro and Thermo-Calc softwares, it was possible to analyse the influence of the increasing Mn content and the change in carbon content on the phase transformation behavior of several medium-Mn alloys. With the use of two different softwares, the amount of data was extended, together with the comparison ground created. Using the CCT and TTT diagrams, it was possible to understand how Mn influences the phase transformation kinetics and critical temperatures of phase transitions. The CCT diagrams show very similar results to the TTT diagrams. While the Mn content increases, the A1 and A3 temperatures, as well as martensite start temperatures, are shifted down. With the increase of the Mn amount, the martensite start temperatures are also shifted down, together with the A1 and A3 transition temperatures. By comparing the additions of 0.1% C with the steel containing 0.2% C, the shifting of the pearlite nose to the left side can be observed. In addition, with the increase in C content, the transition temperatures of pearlite, bainite, and ferrite shift down. The martensite start temperature lowering indicates the possibility to stabilize some fraction of retained austenite [28]. The Ms temperatures also decrease as a result of the higher C content.
The comparison of the two used softwares indicates some asymmetric tendency. The most significant difference is the one observed within the high temperature ferrite peak, where the difference is at around 20% (for 10% Mn steel, it is almost 100% for Thermo-Calc and around 80% for JMatPro). In the CCT diagrams, an increase in the pearlite amount can be observed at slower cooling rates. Through the simulations, the decrease in the Ms temperature can be observed during the addition of Mn and C [30]. With the increase of the Mn content, a decrease in the phase transition temperature of austenite can be observed. Through the phase evolution diagrams, it was confirmed that the increase in the Mn content decreases the temperature stability of the δ ferrite. The change in the C content by 0.1% lowers the δ ferrite temperature stability even further. The amount of Mn changes the temperatures at which Fe3C is stable, i.e., the temperature range decreases with increasing Mn content. Through further calculations and analyses, it was possible to examine the change in chemical composition of cementite. By analyzing the samples in order of increasing Mn content, it can be seen that the Mn content in the cementite increases, while the Fe continuously decreases, which is in agreement with other works [31,32,33,34]. Through the analysis of the graph shown in Figure 17, it could be also observed that with the change in Mn content for the different steels, the wt.% of C in the cementite does not change throughout all the analyzed steels [6]. For Mn, it can be observed that its content decreases with the temperature increase.

5. Conclusions

Based on the modelling methods used, thermodynamic predictions regarding the influence of Mn and C contents on phase diagrams and phase transformation kinetics in medium manganese steels were determined. The CCT and TTT diagrams provided the needed information and data for further understanding of the Mn content influence on the transition temperature of the different phases. The data gained from the software showed how the Ms temperature decreases with increasing Mn content. With the increase of the C content from 0.1 to 0.2 wt.%, the transition temperatures of ferrite, bainite, and pearlite are shifted down. By comparing the phase evolution data gathered from JMatPro with the ones created through the use of Thermo-Calc, slight asymmetry in the gathered values can be observed. At the lower temperatures, the amount of ferrite and austenite stay consistent through both softwares. A small difference can be seen for the M7C3 phase. In the JMatPro model, it can be seen that, at around 500 °C, a small percentage of the M7C3 phase exists at the given temperature. By examining the same temperature and time for the model gained through the Thermo-Calc software, the M7C3 phase is not visualized. The temperature necessary for the phase change to 100% austenite is the same for both softwares. The difference between the calculated data for both softwares is the highest for the δ ferrite peak. The Thermo-Calc models calculate a higher δ ferrite amount than the JMatPro models. Through the phase diagrams gained from Thermo-Calc, it was confirmed that with the increase of Mn content and corresponding Ms decrease, the partial austenite stability at room temperature is possible, which enables the design of modern multiphase steels containing retained austenite.

Author Contributions

Conceptualization, J.D., L.S. and A.G.; data curation, J.D.; formal analysis, A.G. and A.K.; funding acquisition, A.K.; investigation, J.D. and L.S.; methodology, J.D. and L.S.; project administration, A.G.; resources, L.S.; software, J.D. and L.S.; supervision, L.S. and A.G.; validation, A.K.; visualization, J.D. and A.G.; writing—original draft, J.D. and L.S.; writing—review and editing, A.K. All authors have read and agreed to the published version of the manuscript.

Funding

A. Grajcar and A. Kozłowska acknowledge the financial support through the statutory funds of the Faculty of Mechanical Engineering, Silesian University of Technology, 2023 Gliwice, Poland.

Data Availability Statement

The data are available from the corresponding author upon reasonable request.

Acknowledgments

The authors would like to thank Emmanuel De Moor (Colorado School of Mines, USA) for his contribution in the grammar checking of the manuscript.

Conflicts of Interest

The authors declare no conflict of interest.

References

  1. Matlock, D.K.; Speer, J.G. Third generation of AHSS: Microstructure design concepts. In Microstruct. Texture Steels Other Mater; Suwas, S., Haldar, A., Bhattacharjee, D., Eds.; Springer: Berlin/Heidelberg, Germany, 2009; pp. 185–205. [Google Scholar] [CrossRef]
  2. Baluch, N.; Udin, Z.M.; Abdullah, C.S. Advanced High Strength Steel in Auto Industry: An Overview. Eng. Technol. Appl. Sci. Res. 2014, 4, 686–689. [Google Scholar] [CrossRef]
  3. Grajcar, A.; Zalecki, W.; Burian, W.; Kozłowska, A. Phase Equilibrium and Austenite Decomposition in Advanced High-Strength Medium-Mn Bainitic Steels. Metals 2016, 6, 248. [Google Scholar] [CrossRef]
  4. Opiela, M.; Grajcar, A. Microstructure and Anisotropy of Plastic Properties of Thermomechanically-Processed HSLA-Type Steel Plates. Metals 2018, 8, 304. [Google Scholar] [CrossRef]
  5. Samek, L.; De Moor, E.; Penning, J.; De Cooman, B.C. Influence of alloying elements on the kinetics of strain-induced martensitic nucleation in low-alloy, multiphase high-strength steels. Met. Mater. Trans. A 2006, 37, 109–124. [Google Scholar] [CrossRef]
  6. Zhang, J.; Huang, M.; Sun, B.; Zhang, B.; Ding, R.; Luo, C.; Zeng, W.; Zhang, C.; Yang, Z.; van der Zwaag, S.; et al. Critical role of Lüders banding in hydrogen embrittlement susceptibility of medium Mn steels. Scr. Mater. 2020, 190, 32–37. [Google Scholar] [CrossRef]
  7. Samek, L.; Dykas, J.; De Moor, E.; Grajcar, A. Strain-Ageing of Low-Alloyed Multiphase High-Strength Steels. Metals 2020, 10, 439. [Google Scholar] [CrossRef]
  8. Kaar, S.; Krizan, D.; Schwabe, J.; Hofmann, H.; Hebesberger, T.; Commenda, C.; Samek, L. Influence of the Al and Mn content on the structure-property relationship in density reduced TRIP-assisted sheet steels. Mater. Sci. Eng. A 2018, 735, 475–486. [Google Scholar] [CrossRef]
  9. Wagoner, R.H.; Kim, J.H.; Sung, J.H. Formability of advanced high strength steels. Int. J. Mater. Form. 2009, 2, 359–362. [Google Scholar] [CrossRef]
  10. Kim, J.H.; Seo, E.J.; Kwon, M.-H.; Kang, S.; De Cooman, B.C. Effect of quenching temperature on stretch flangeability of a medium Mn steel processed by quenching and partitioning. Mater. Sci. Eng. A 2018, 729, 276–284. [Google Scholar] [CrossRef]
  11. Gündüz, S. Static strain ageing behaviour of dual phase steels. Mater. Sci. Eng. A 2008, 486, 63–71. [Google Scholar] [CrossRef]
  12. Cottrell, A.H.; A Bilby, B. Dislocation Theory of Yielding and Strain Ageing of Iron. Proc. Phys. Soc. Sect. A 1949, 62, 49–62. [Google Scholar] [CrossRef]
  13. De, A.K.; Vandeputte, S.; De Cooman, B.C. Kinetics of Strain Aging in Bake Hardening Ultra Low Carbon Steel—A Comparison with Low Carbon Steel. J. Mater. Eng. Perform. 2001, 10, 567–575. [Google Scholar] [CrossRef]
  14. Mukherjee, M.; Singh, S.B.; Mohanty, O.N. Microstructural characterization of TRIP-aided steels. Mater. Sci. Eng. A 2008, 486, 32–37. [Google Scholar] [CrossRef]
  15. Xu, F.-Y.; Wang, Y.-W.; Bai, B.-Z.; Fang, H.-S. CCT curves of low-carbon Mn-Si steels and development of water-cooled bainitic steels. J. Iron Steel Res. Int. 2010, 17, 46–50. [Google Scholar] [CrossRef]
  16. Diekmann, U. Calculation of Steel Data Using JMatPro; COMAT 2012: Plzen, Czech Republic, 2012. [Google Scholar]
  17. Saunders, N.; Guo, U.K.Z.; Li, X.; Miodownik, A.P.; Schillé, J.-P. Using JMatPro to model materials properties and behavior. JOM 2003, 55, 60–65. [Google Scholar] [CrossRef]
  18. Grajcar, A.; Morawiec, M.; Zalecki, W. Austenite Decomposition and Precipitation Behavior of Plastically Deformed Low-Si Microalloyed Steel. Metals 2018, 8, 1028. [Google Scholar] [CrossRef]
  19. Morawiec, M.; Skowronek, A.; Król, M.; Grajcar, A. Dilatometric Analysis of the Austenite Decomposition in Undeformed and Deformed Low-Carbon Structural Steel. Materials 2020, 13, 5443. [Google Scholar] [CrossRef]
  20. Geng, X.; Wang, H.; Xue, W.; Xiang, S.; Huang, H.; Meng, L.; Ma, G. Modeling of CCT diagrams for tool steels using different machine learning techniques. Comput. Mater. Sci. 2019, 171, 109235. [Google Scholar] [CrossRef]
  21. Aristeidakis, J.S.; Haidemenopoulos, G.N. Composition and processing design of medium-Mn steels based on CALPHAD, SFE modeling, and genetic optimization. Acta Mater. 2020, 193, 291–310. [Google Scholar] [CrossRef]
  22. Piekarska, W.; Goszczyńska-Króliszewska, D. Analytical Methods of Predicting the Structure and Mechanical Properties of High Tensile Strength Steel. Procedia Eng. 2017, 177, 92–98. [Google Scholar] [CrossRef]
  23. Contreras, A.; López, A.; Gutiérrez, E.; Fernández, B.; Salinas, A.; Deaquino, R.; Bedolla, A.; Saldaña, R.; Reyes, I.; Aguilar, J.; et al. An approach for the design of multiphase advanced high-strength steels based on the behavior of CCT diagrams simulated from the intercritical temperature range. Mater. Sci. Eng. A 2019, 772, 138708. [Google Scholar] [CrossRef]
  24. Soleimani, M.; Kalhor, A.; Mirzadeh, H. Transformation-induced plasticity (TRIP) in advanced steels: A review. Mater. Sci. Eng. A 2020, 795, 140023. [Google Scholar] [CrossRef]
  25. Jeong, M.S.; Park, T.M.; Choi, S.; Lee, S.-J.; Han, J. Recovering the ductility of medium-Mn steel by restoring the original microstructure. Scr. Mater. 2020, 190, 16–21. [Google Scholar] [CrossRef]
  26. Staiger, M.; Brownrigg, A.; Hodgson, P.; Davies, C. Multistage strain aging of low-carbon steels. Mater. Sci. Eng. A 2004, 364, 35–47. [Google Scholar] [CrossRef]
  27. de Meira, R.R.; Dias, F.M.D.S.; Lins, J.F.C. The influence of manganese on the bake hardening of hot dip galvanized low carbon steels. J. Mater. Res. Technol. 2020, 9, 2208–2213. [Google Scholar] [CrossRef]
  28. Speer, J.; Rana, R.; Matlock, D.; Glover, A.; Thomas, G.; De Moor, E. Processing Variants in Medium-Mn Steels. Metals 2019, 9, 771. [Google Scholar] [CrossRef]
  29. Ji, D.; Zhang, M.; Zhu, D.; Luo, S.; Li, L. Influence of microstructure and pre-straining on the bake hardening response for ferrite-martensite dual-phase steels of different grades. Mater. Sci. Eng. A 2017, 708, 129–141. [Google Scholar] [CrossRef]
  30. Li, Z.C.; Li, X.J.; Mou, Y.J.; Misra, R.D.K.; Ding, H.; He, L.F.; Li, H.P. Tuning austenite stability in a medium Mn steel and relationship to structure and mechanical properties. Mater. Sci. Technol. 2020, 36, 1308–1317. [Google Scholar] [CrossRef]
  31. Santofimia, M.; Zhao, L.; Petrov, R.; Kwakernaak, C.; Sloof, W.; Sietsma, J. Microstructural development during the quenching and partitioning process in a newly designed low-carbon steel. Acta Mater. 2011, 59, 6059–6068. [Google Scholar] [CrossRef]
  32. Kaar, S.; Schneider, R.; Krizan, D.; Béal, C.; Sommitsch, C. Influence of the Quenching and Partitioning Process on the Transformation Kinetics and Hardness in a Lean Medium Manganese TRIP Steel. Metals 2019, 9, 353. [Google Scholar] [CrossRef]
  33. Akbary, F.H.; Santofimia, M.J.; Sietsma, J. Optimizing Mechanical Properties of a 0.3C-1.5Si-3.5MnQuenched and Partitioned Steel. Adv. Mater. Res. 2013, 829, 100–104. [Google Scholar] [CrossRef]
  34. Kaar, S.; Schneider, R.; Krizan, D.; Béal, C.; Sommitsch, C. Influence of the Phase Transformation Behaviour on the Microstructure and Mechanical Properties of a 4.5 wt.-% Mn Q&P Steel. HTM J. Heat Treat. Mater. 2019, 74, 70–84. [Google Scholar] [CrossRef]
Figure 1. Phase diagram for the Fe-C-Mn-Al-Si system, Fe-0.1C-2Mn-0.75Si-0.75Al steel (1a).
Symmetry 15 00381 g001
Figure 2. Phase diagram for the Fe-C-Mn-Al-Si system, Fe-0.1C-3.5Mn-0.75Si-0.75Al steel (2a).
Symmetry 15 00381 g002
Figure 3. Phase diagram for the Fe-C-Mn-Al-Si system, Fe-0.2C-8Mn-0.75Si-0.75Al steel (4b).
Symmetry 15 00381 g003
Figure 4. Phase diagram for the Fe-C-Mn-Al-Si system, Fe-0.1C-10Mn-0.75Si-0.75Al steel (5a).
Symmetry 15 00381 g004
Figure 5. Continuous cooling transformation diagram for the Fe-0.1C-2Mn-0.75Si-0.75Al steel (1a).
Symmetry 15 00381 g005
Figure 6. Time–temperature transformation diagram for the Fe-0.1C-2Mn-0.75Si-0.75Al steel (1a).
Symmetry 15 00381 g006
Figure 7. Continuous cooling transformation diagram for the Fe-0.2C-2Mn-0.75Si-0.75Al steel (1b).
Symmetry 15 00381 g007
Figure 8. Time–temperature transformation diagram for the Fe-0.2C-2Mn-0.75Si-0.75Al steel (1b).
Symmetry 15 00381 g008
Figure 9. Continuous cooling transformation diagram for the Fe-0.1-3.5Mn-0.75Si-0.75Al steel (2a).
Symmetry 15 00381 g009
Figure 10. Time–temperature transformation diagram for the Fe-0.1-3.5Mn-0.75Si-0.75Al steel (2a).
Symmetry 15 00381 g010
Figure 11. JMatPro phase evolution diagram for the Fe-0.1C-2Mn-0.75Si-0.75Al steel (1a).
Symmetry 15 00381 g011
Figure 12. Thermo-Calc phase evolution diagram for the Fe-0.1C-2Mn-0.75Si-0.75Al steel (1a).
Symmetry 15 00381 g012
Figure 13. JMatPro phase evolution diagram for the Fe-0.2C-2Mn-0.75Si-0.75Al steel (1b).
Symmetry 15 00381 g013
Figure 14. Thermo-Calc phase evolution diagram for the Fe-0.2C-2Mn-0.75Si-0.75Al steel (1b).
Symmetry 15 00381 g014
Figure 15. JMatPro phase evolution diagram for the Fe-0.1C-3.5Mn-0.75Si-0.75Al steel (2a).
Symmetry 15 00381 g015
Figure 16. Thermo-Calc phase evolution diagram for the Fe-0.1C-3.5Mn-0.75Si-0.75Al steel (2a).
Symmetry 15 00381 g016
Figure 17. Chemical composition of cementite as a function of temperature for selected steels.
Symmetry 15 00381 g017
Table 1. Chemical compositions of the analysed steels, given in weight percent (wt. %).
SteelCMnAlSi
1a0.120.750.75
2a0.13.50.750.75
3a0.150.750.75
4a0.180.750.75
5a0.1100.750.75
1b0.220.750.75
2b0.23.50.750.75
3b0.250.750.75
4b0.280.750.75
5b0.2100.750.75
Table 2. Summarized critical temperature data for the analyzed steels of different C and Mn contents.
Mn, wt%23.55810
C, wt%0.10.20.10.20.10.20.10.20.10.2
Ae1, °C705720640700620670575625520620
Ae3, °C955900875850820780750740730720
Ac1, °C702716661686627660578620557601
Ac3, °C947897882846829802746731703692
Ms, °C425382357315299257206164158116
Disclaimer/Publisher’s Note: The statements, opinions and data contained in all publications are solely those of the individual author(s) and contributor(s) and not of MDPI and/or the editor(s). MDPI and/or the editor(s) disclaim responsibility for any injury to people or property resulting from any ideas, methods, instructions or products referred to in the content.

