1. Introduction
In the field of engineering and manufacturing today, additive manufacturing is one of the most interesting topics. This type of manufacturing involves adding material layer by layer to produce three-dimensional parts.
The additive manufacturing (AM) process offers several advantages over traditional manufacturing methods, particularly in the rapid production of parts. It also offers unprecedented design freedom in its ability to produce a single component (or several) from a wide range of materials [
1,
2]. This has meant that, in recent years, additive manufacturing has been at the forefront of research into manufacturing techniques.
Direct metal deposition is one of those additive manufacturing techniques that has evolved the most in the last decade. This category encompasses different technologies. Its classification varies depending on the format of the material used, the power supply and the energy source [
3]. Within the category of metallic materials and in a first division by energy source, we can find laser metal deposition (LMD), electron beam melting (EBAM) and wire arc additive manufacturing (WAAM).
This article focuses on the study of WAAM technology, which uses an electric arc to melt a metal wire and deposit it layer by layer to create a part. We found different processes [
4], depending on the energy source used to melt the metal. We can classify them into PAW (plasma arc welding), GTAW (gas tungsten arc welding) and GMAW (gas metal arc welding).
The main advantages of this technology over traditional manufacturing processes and over additive manufacturing processes themselves are its ease of free design and customization, reduced costs and production times (due to the deposition rate and cost of the material) and the possibility of having a large work area (part size) [
5]. However, it is important to consider the correct selection of parameters to ensure the quality of the layer geometry and the wall [
6,
7].
This technology has been known by different names over time. For example, in its early stages, it was known as “Solid Freeform Fabrication” (SFF), which refers to the technology’s ability to create complex, free-form shapes in an additive way. It has also been known as shape deposition manufacturing (SDM), which refers to the process of depositing material layer by layer. It is also more crudely referred to as “3D welding”, and this is because WAAM technology uses an electric arc to melt the material and deposit it layer by layer, which may appear like welding. However, WAAM technology involves a more complex and sophisticated process than traditional welding, as it uses precise control of the manufacturing parameters to achieve adequate quality and accuracy.
These parameters refer to the variables that are adjusted during the manufacturing process, such as the deposition rate, the temperature of the electric arc, the material feed rate, the geometry of the molten pool or bead and the distance between the nozzle and the part, among others. These parameters must be carefully controlled and adjusted to obtain the best mechanical properties and dimensional and structural accuracy of the part. In recent times, research on this technology has focused on the control and monitoring of these parameters [
8,
9,
10] and the study of different material deposition techniques and their influence on them [
11,
12,
13,
14,
15].
In this sense, we find deposition techniques such as “Overlapping beads”. It is a term used in WAAM technology and refers to the technique of overlapping layers of welding material. In WAAM, a robot or a wire arc welding machine moves along a predetermined path and deposits a stream of molten wire on the workpiece. Instead of building a part layer by layer, this technique allows each layer to overlap with the previous one, creating a stronger bond between the layers and increasing the strength of the resulting part. By overlapping layers of material, the build time can be reduced, and process efficiency increased, also allowing large, complex parts to be manufactured more efficiently [
16].
Another deposition technique used in WAAM is the oscillating strategy, also known as the zig-zag strategy. This technique involves moving the welding torch back and forth along the weld axis while depositing material. Its importance lies in its ability to improve the uniformity and quality of the weld bead. By moving the torch back and forth, heat is distributed more evenly, reducing the possibility of deformation or cracking in the part. In addition, this strategy can help reduce porosity formation and stress buildup in the part, which can improve part strength and durability [
11].
Both deposition techniques have been studied in recent years [
8,
17,
18,
19,
20,
21,
22], as well as their influence on bead geometry (shape and physical characteristics of the weld bead, including its width, height, penetration, direction and profile) and their direct impact on part quality and final properties [
14,
23]. It has been shown that a weld bead that is too thin can be more prone to failure, while a weld bead that is too wide can be inefficient and can lead to excessive heat buildup. Bead height and penetration can also affect the strength of the part, as well as its ability to withstand loads and stress. In addition, bead geometry can also affect the speed and efficiency of the process. That is why proper bead geometry can enable fast and efficient part manufacturing [
8,
24]. Despite the increasing popularity of additive manufacturing, the exploration of symmetry in this realm has remained relatively limited, often overshadowed by the broader theme of design for additive manufacturing [
2,
25].
The motivation of this paper is to contribute to the development and understanding of the welded layer applied to direct energy deposition additive manufacturing technologies in metallic materials, which has gained a lot of interest in recent years [
26]. The aim of this work is to compare the geometry of the bead of both techniques and to study its symmetry as a quality parameter. The novelty of the work described is centered around two key aspects. Firstly, it introduces a coefficient that is based on moments calculated with respect to the center of the bead. This coefficient serves as a measure or indicator of the geometry and symmetry of the additive layers. Secondly, the research explores the calculation of a symmetry coefficient specifically applied to multispan walls produced using different strategies, such as overlapping and oscillating techniques. By employing these coefficients and analyzing their values, the study aims to provide a quantitative assessment of the geometrical characteristics and symmetry of the fabricated walls. These novel approaches contribute to a better understanding of the additive manufacturing process and offer potential insights for optimizing the quality and performance of manufactured components.
The outcome of this research described in the field of studying symmetry in additive manufacturing processes is to provide a deeper understanding of how symmetry impacts the quality and performance of fabricated components. As researchers, we aim to compare the geometry and symmetry of different techniques, such as overlapping and oscillating strategies.
The application of these insights in industrial settings can lead to advancements in additive manufacturing techniques, enabling more efficient and reliable production of metallic parts with superior quality. Industries that rely on additive manufacturing for their products, such as aerospace [
27], automotive [
28] or medical device [
29] manufacturing, could benefit from the research findings to enhance the performance and reliability of their manufactured components. It is possible to integrate the developed methodology from this research into a machine or robot for additive manufacturing that is equipped with sensors and a control system. The sensors can be used to capture real-time data on the geometry and symmetry of the deposited layers, while the control system can utilize the derived coefficients and parameters from the methodology to make adjustments and optimizations during the manufacturing process.
2. Materials and Experimental Setup
2.1. Equipment and Setup
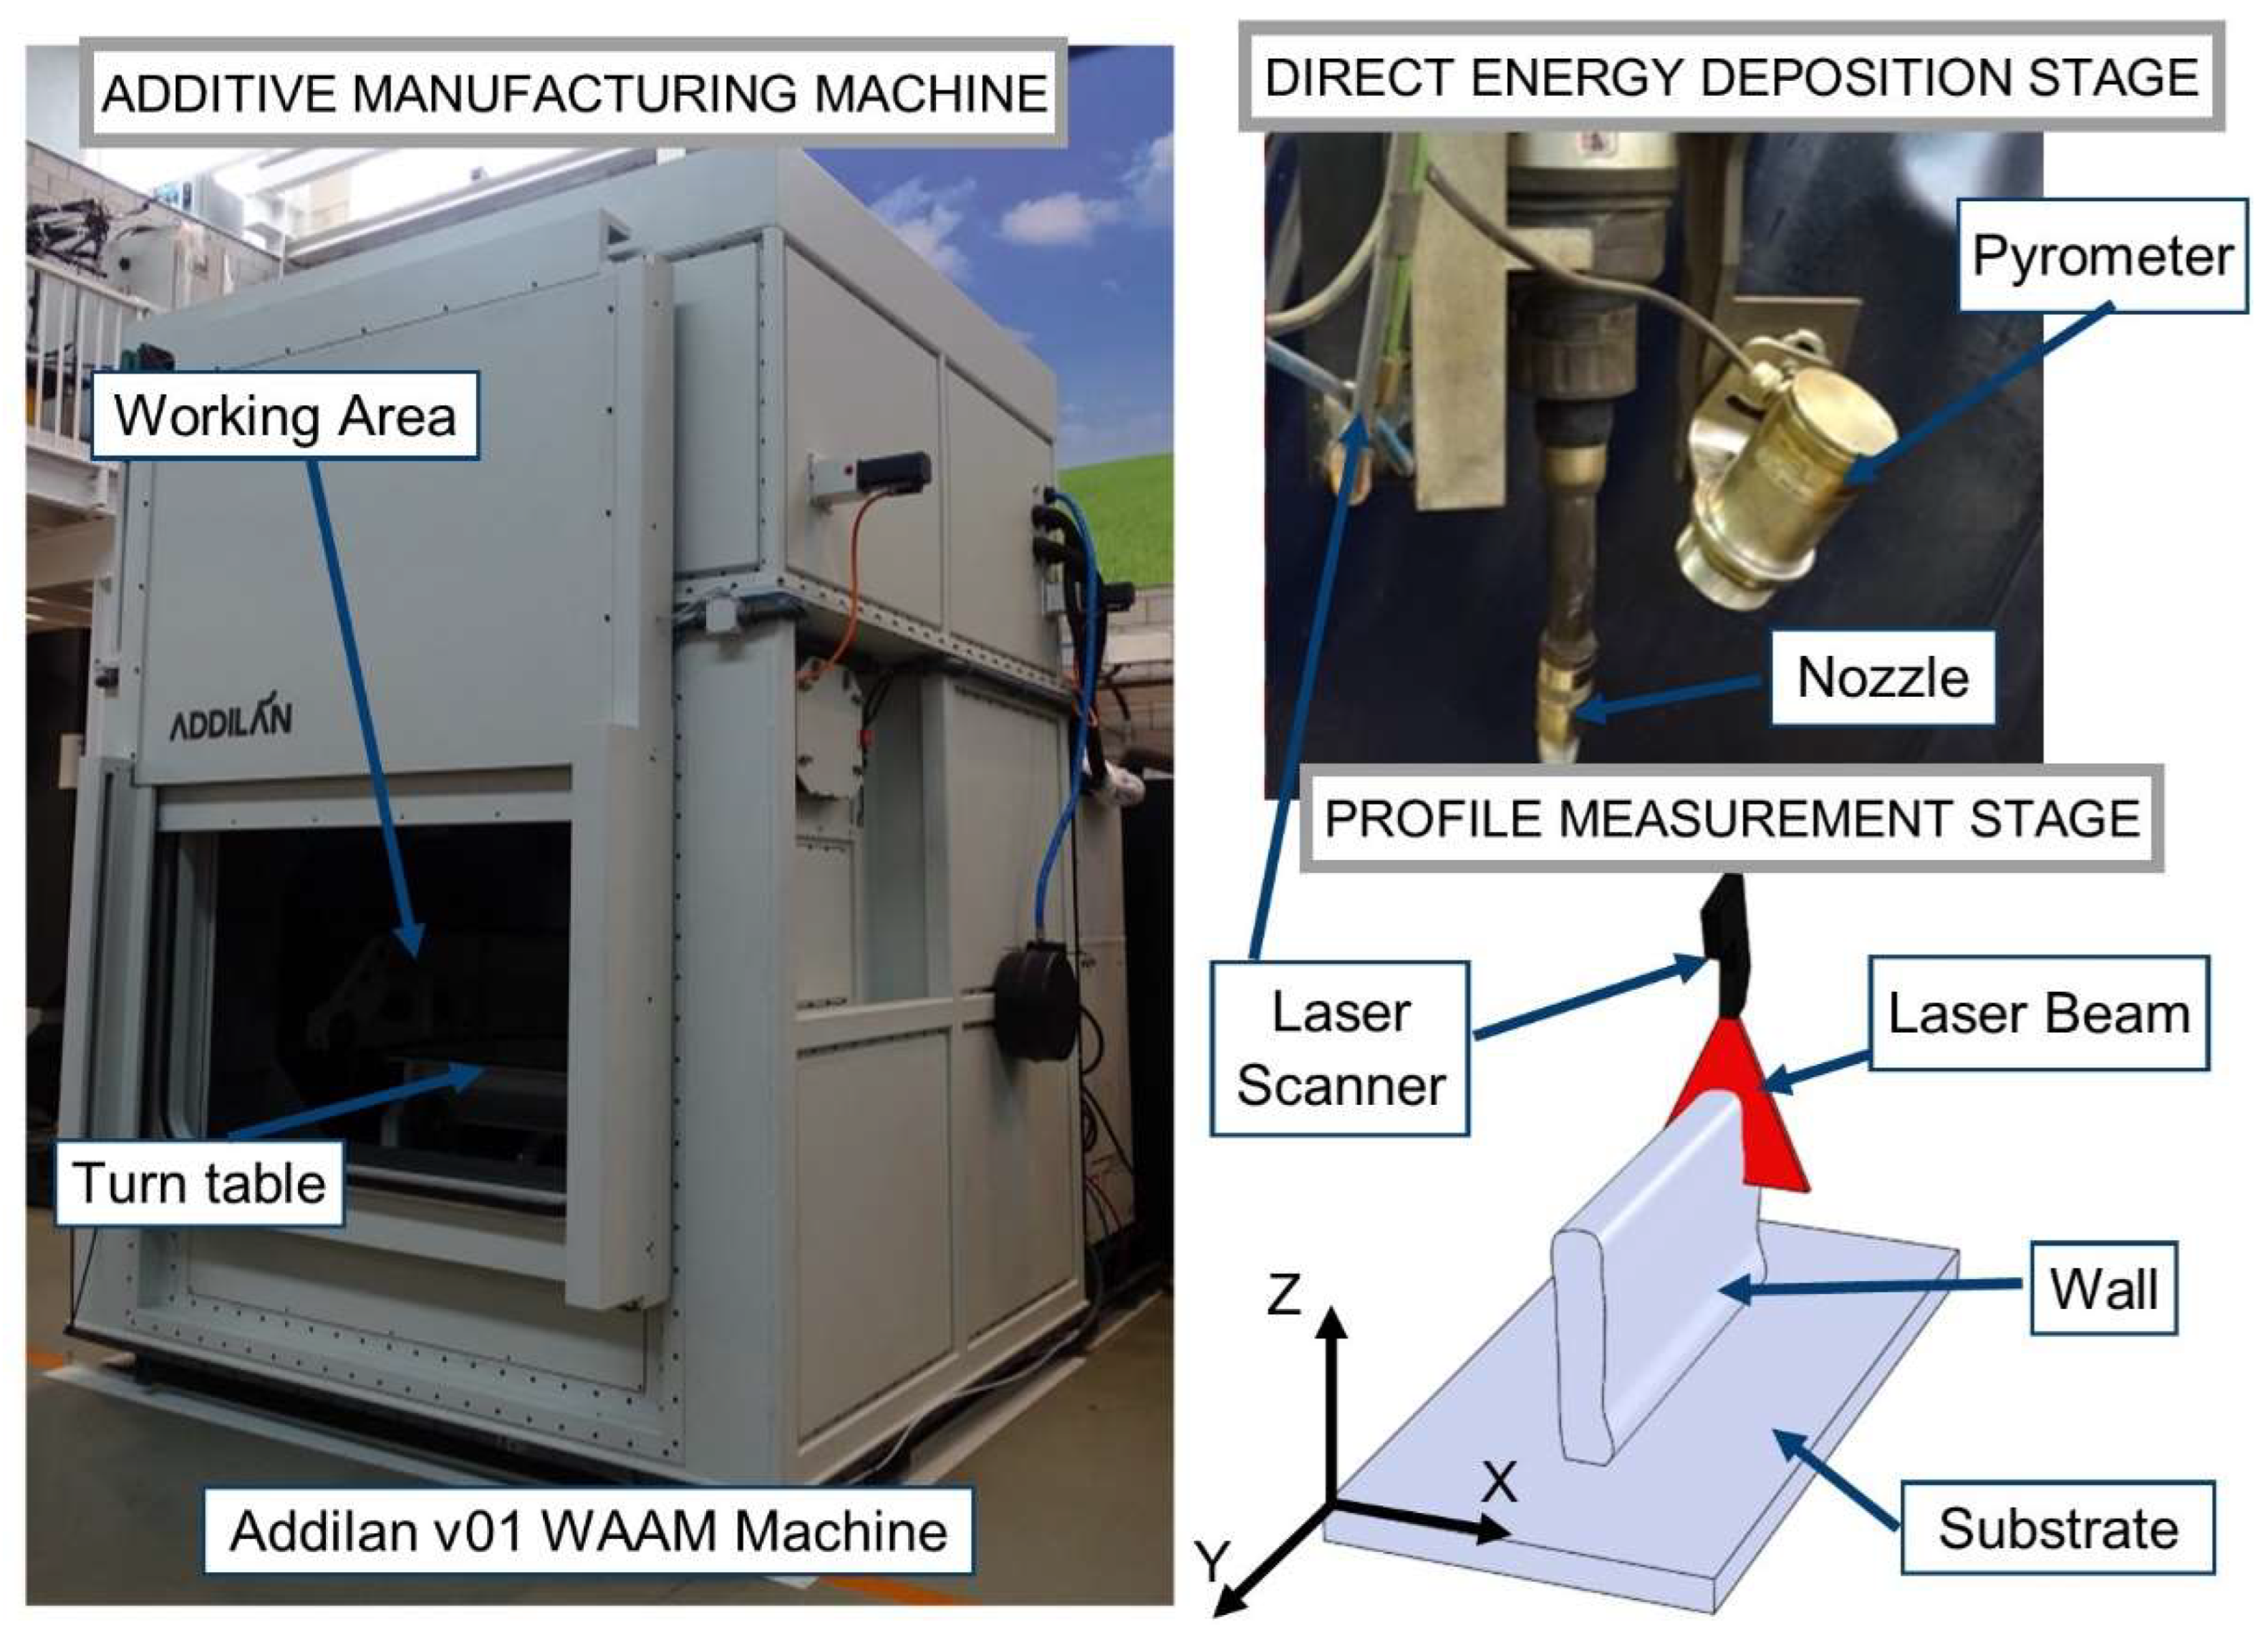
The Addilan WAAM machine (Durango, Spain) used to manufacture two walls was equipped with a tilt table (+2-axis) and a closed chamber with an inert atmosphere, making it suitable for working with reactive materials, such as titanium or aluminium. The machine utilized a GMAW process but also allowed for other processes, such as GTAW or PAW.
During the GMAW process, an electric arc between the wire and the part melted the material, which was then deposited layer by layer on the substrate to build up the wall. The build envelope for parts was 1300 × 900 × 500 mm, with a maximum weight capacity of 300 kg.
The additive manufacturing system comprised an MIG/MAG welding power source (Titan XQ 400 AC puls) and a wire feeder (M drive 4 Rob5 XR RE) from EWM welding manufacturer (Mündersbach, Germany). To monitor the geometry of deposited layers and determine cooling time between layers, an Optris (Berlin, Germany) compact pyrometer and a laser scanner QuellTech Q4 (Munich, Germany) were mounted on the welding torch holder.
A personal computer was used to load and monitor welding parameters during the process, with data sent to a remote database for accessibility.
Figure 1 illustrates the setup of the Addilan AM machine, with the welding torch equipped with sensors.
2.2. Materials
The wire material used in the GMAW process to construct the walls using both overlapping and oscillating techniques was ER70S-6 mild steel (DIN 8559SG2). According to the supplier, the composition of ER70S-6 in weight% is as follows: Mn—1.64, Si—0.94, C—0.06, Cr—0.02, Cu—0.02, Ni—0.02, S—0.016, P—0.013, Mo—0.005, Ti—0.004, Zr—0.002 and Fe—bal. The wire diameter used as raw material for direct energy deposition was 1.2 mm.
2.3. Preliminary Study for Zero Beads
A preliminary study was conducted to select the optimal process parameters for manufacturing the walls. A test battery was designed in which unitary beads were manufactured and scanned with a laser scanner.
Five levels of wire feed speed were chosen within the range of possible values, and a full factorial experiment was completed using three levels of travel speed. The following table presents the test battery used for GMAW-PULS in ER70, along with the coded values for each factor in units of −2, −1, 0, +1 and +2. The factors considered were wire feed speed (WFS) in meters per minute and travel speed (TS) in centimeters per minute. The WFS values tested were 4, 6, 8, 10 and 12 m/min, while the TS values tested were 30, 65 and 100 cm/min.
Table 1 shows a summary of the preliminary tests.
After manufacturing the beads, they were analyzed for homogeneity, continuity, geometrical shape, penetration, dilution and symmetry. Macrographs of the transversal face of the beads were used to determine penetration and dilution.
2.4. Wall Manufacturing Parameters
This section provides an overview of the testing parameters and strategies employed. Two nozzle path strategies were tested to assess their effectiveness in creating a straight wall, one involving a waving (oscillating) motion and the other consisting of overlapping three straight runs with a 65% overlap.
Figure 2 illustrates the machine axis path for both strategies. The first strategy aimed to cover a width of 20 mm by overlapping three weld beads, with each bead occupying 65% (6.9 mm) of the expected width of a single weld pass. In the second strategy, the torch moved in an oscillatory triangular pattern. The oscillation had a peak-to-peak amplitude of 20 mm, which was compensated for by applying a tool offset equal to half the width of the expected weld pass. The oscillation had a wavelength of 1.5 mm. In both strategies, a dwell time was observed before the return trajectory to wait for the pyrometer to indicate a temperature lower than 400 °C. This ensured deposition onto a solidified material. Therefore, in the oscillated strategy, a single dwell time was expected between layers, while in the overlapped strategy, each bead had its own dwell time, totaling three per layer. To compensate for the welding pass’s geometry resulting from process starts and stops, the return trajectories were executed in the opposite direction, starting from the other side of the weld pass.
The walls were manufactured with a height of 100 mm, a width of 30 mm and a length of 300 mm. The welding parameters used for the overlapping strategy were wire feed rate (WFR) of 7 m/min, welding speed (WS) of 50 cm/min, voltage (V) of 25 V and current (I) of 180 A. For the oscillating strategy, the welding parameters were WFR of 7 m/min, WS of 30 cm/min, V of 24 V and I of 180 A.
During the manufacturing process, the geometry of the walls was measured using the laser scanner, and the cooling time was determined using the pyrometer. The cooling time was set to 10 s for both strategies in order to ensure the correct growth of the bead and avoid defects.
The return trajectories were run in the opposite direction to compensate for the geometry of the welding pass created due to the starts and stops of the process. Additionally, the laser scanner was used to represent the geometry of the walls every two layers, determining the Z position for the next layer trajectory manually for both strategies. The transfer mode chosen was the MAG-PULS, which is a synergic pulsed GMAW working mode that employs digitally controlled unit current pulses from the power source for identical droplet formation of molten material, with a predetermined volume correlated to the electrode wire. For the tests, steel was used with 80/20 argon CO
2 shielding gas. All decisions for the set of parameters of the comparative test of both strategies considered the results of the preliminary tests. The parameters for the fabrication of these two walls are summarized in
Table 2.
3. Methodology for Symmetry Calculation
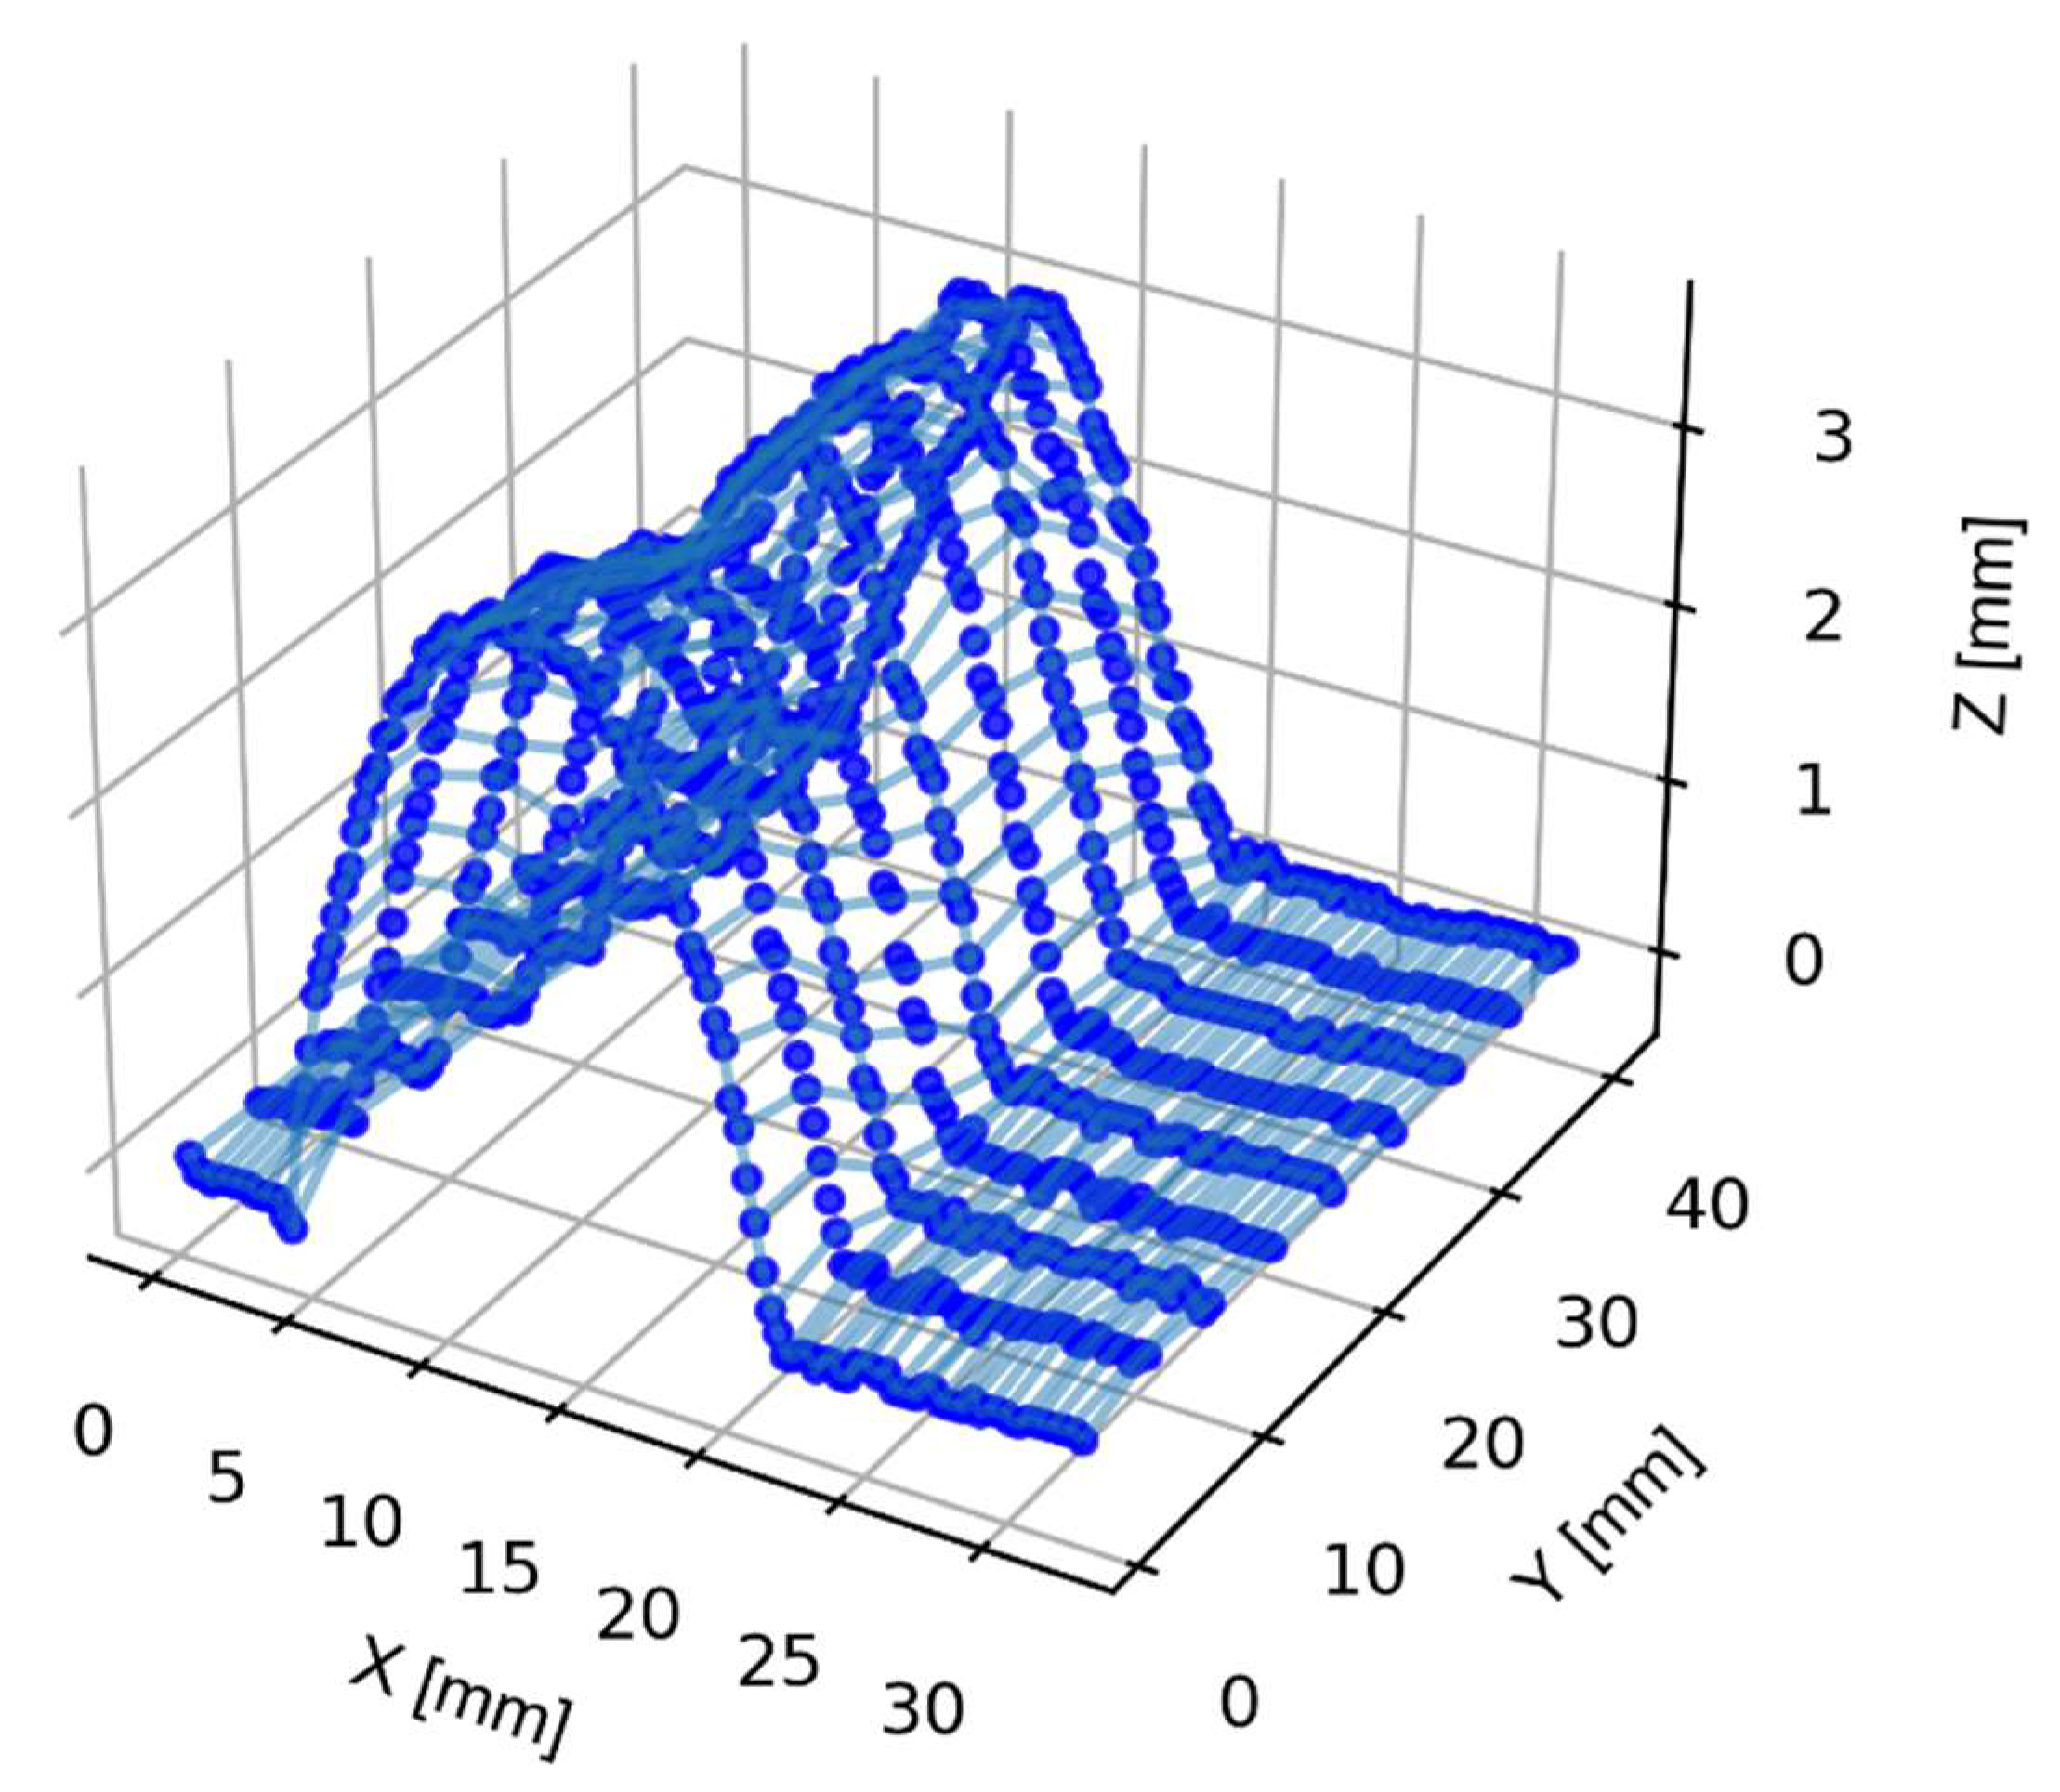
In this section, the method for 3D reconstruction of a layer deposited using wire arc additive manufacturing involving a profilometer scanning the deposited wall is described, as can be seen in
Figure 3. The laser profilometer acquires 2D profiles of the deposited wall and uses them to generate a 3D reconstruction. The algorithm considers sources of uncertainty in defining the trajectory and provides a robust solution. The steps are:
Establishing a device-dependent communication system between the different elements of the welding chain, including the robot, monitoring application, database and laser;
Developing and installing a supervised welding system to produce welds automatically using a robotic system;
Monitoring the process using an open-loop control system, with a laser scanner as an external sensor and collecting internal signals from the welding machine, such as intensity, voltage, wire speed and feed rate. The positions of the robot axes and welding wrist angles with respect to the workpiece coordinates are also monitored;
Performing a scanning sequence before the first pass to seal the joint, and obtaining a 3D reconstruction of the deposited wall based on 2D profiles acquired by the laser profilometer;
Storing and displaying nine profiles of the section on the screen for trajectory generation. The operator supervises the calculation of the point used as the robot’s starting point for the next section of the pass until the joint is completed;
Considering sources of uncertainty in defining the trajectory, such as aberrant brightness in the point cloud that needs to be removed by filtering and misalignment of profiles or sheets on the table, and using an algorithm to provide a robust solution.
The presented algorithm starts removing any possible trends resulting from misalignment of the profilometer laser and then calculates the center of the layer as the position where the area under the curve (AUC) is equal to the left and right sides. The AUC function has a sigmoidal shape, which is characteristic of the logistic function. The logistic function is an S-shaped curve that starts at a minimum value, increases gradually and then flattens out at an asymptote. It is commonly used in modeling growth, decay and saturation in various fields. In this case, the AUC function resembles the logistic function and represents the cumulative distribution of the layer height along the scanned profile.
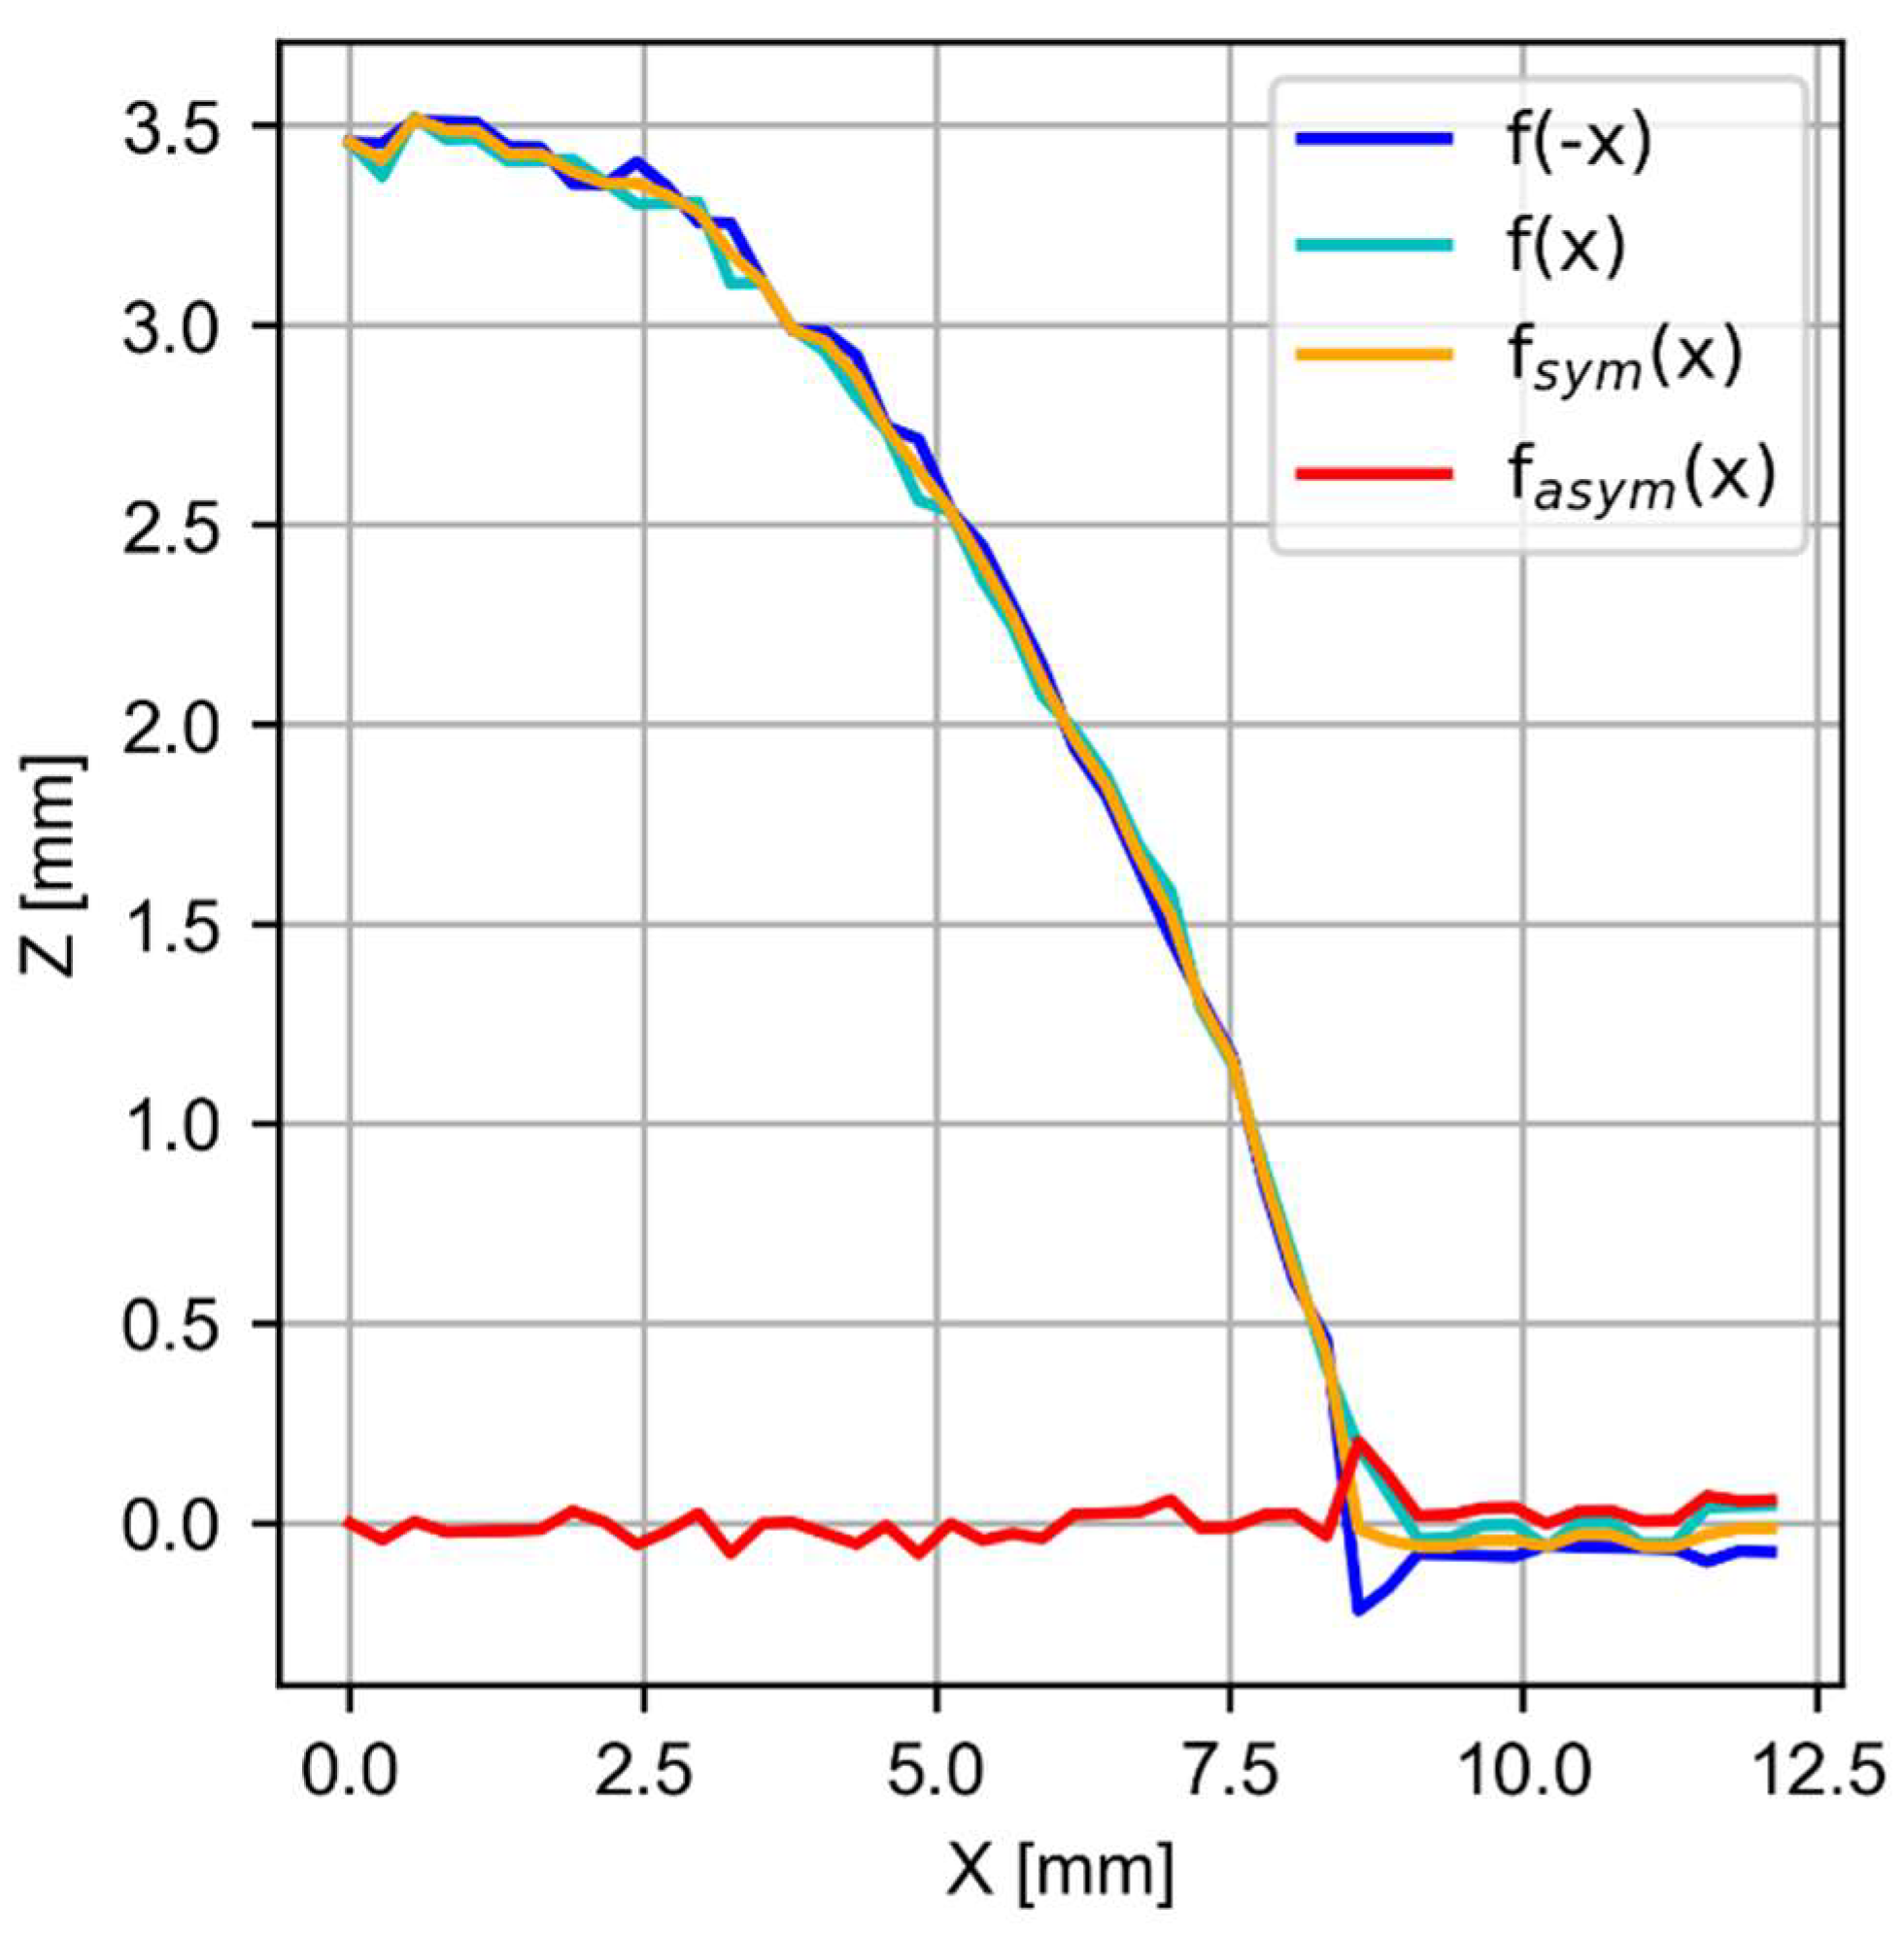
Figure 4 shows the dashed line that represents the center from which symmetry is calculated.
This paper describes an approach for analyzing the symmetry of layer profiles. To illustrate, the first profile in
Figure 4a is taken. The approach is like that used by Veiga et al. [
30], which was applied to macroimages of the bead. The height of the bead (
z) is written as function of the position
x as
z = f(
x).
f(0) is the geometric center of the bead where the area on the left and on the right are equivalent. The function
z = f(
x) gives the profile to the right of the central line, and
z = f(−
x) gives the profile to the left. The layer profile is defined as symmetrical when
f(
x)
= f(−
x). To quantify this symmetry, symmetric and antisymmetric functions (1) are defined through the
x-axis as:
From these two functions, a ratio is established that takes continuous values between (0 and 1). The symmetric ratio takes a maximum value of 1 when the symmetry is pure and 0 when it is purely asymmetric. This ratio is obtained following Equation (2):
In
Figure 5, the asymmetry and symmetry functions are displayed, representing compositions based on the profile function in this particular case. The asymmetry function provides insight into the disparity between
f(−
x) and
f(
x). A value closer to zero indicates a higher level of symmetry in the function being examined, specifically the measured profile. Both functions can have negative or positive values, reflecting the characteristics of the function under study, as determined by Equation (1). As a result, the symmetry coefficient
S, which ranges from 0 to 1, offers a more easily interpretable measure. In the specific plotted profile in
Figure 5, the study determined that the symmetry coefficient (S) at all points is 0.99.
As for the calculation of the shape and in relation to the symmetry of the bead, this article considers the profile as a function. Therefore, a mathematical approach will be used in which the moments of a function are certain quantitative measures related to the shape of the function’s graph. The moment of a function, without further explanation, usually refers to the expression with c = 0. For the second and higher moments, the central moment (moments of the mean, with c being the mean) are usually used rather than the moments about zero because they provide clearer information about the distribution’s shape.
First, the moments of a function are defined as a measure describing the distribution of a continuous variable (3). In the case of a one-dimensional function
f(
x), the
k-th moment is defined as the integral of
x times
k multiplied by
f(
x) over the entire range of values of
x. That is:
The first moment (k = 1) is known as the moment of order 1 or the mean and represents the center of mass of the function. The second moment (k = 2) is known as the moment of order 2 or the variance and measures the dispersion of the function. The third moment (k = 3) is known as the moment of order 3 or the skewness and measures the asymmetry of the function.
Skewness is a measure of how symmetric or asymmetric distribution is. Symmetric distribution has a skewness of zero, while asymmetric distribution has a positive or negative skewness depending on whether the tail of the distribution extends further to the right or to the left.
To calculate the skewness of a function
f(
x), the third central moment divided by the standard deviation cubed is used as Equation (4). The formula is as follows:
where
is the third central moment (5), which is calculated as:
where mu is the mean of the function (i.e.,
).
In addition,
is the variance of the function, which is calculated using (6):
Therefore, to calculate the skewness of a function f(x), we need to first calculate the mean (), the variance () and the third central moment () and then use Formula (4).
4. Results
4.1. Zero Bead Symmetry Evaluation
A preliminary study was conducted to select the optimal process parameters for manufacturing walls, and more details are reported in [
31]. A test battery was designed to manufacture unitary beads and scan them using a laser scanner. The preliminary experiment was designed by choosing five levels within the range of possible wire feed speeds and completing a full factorial with three levels of travel speed. The test battery is shown in
Table 3. After manufacturing the beads, they were analyzed for homogeneity, continuity and geometrical shape. In this paper, we added the symmetry coefficient (S) and the skewness calculation (s). To measure the width and height of the beads, laser scanner results were used to obtain images such as
Figure 3. The table also shows a geometric feature (GF), Equation (7), introduced by [
31] that indicates the level of homogeneity and continuity of the beads. The GF is calculated as the product of the inverse of the standard deviations of height and width, divided by 2, using the following equation:
where
is the standard deviation of the width, and
is the standard deviation of the height. To compute these values, the code uses the formula for the sample standard deviation, where the sum of the squared deviations from the mean is divided by the sample size minus 1 and then takes the square root. The standard deviation of the width,
, is calculated by subtracting the mean width,
, from each width value, squaring the result, summing the squared values, dividing the sum by the sample size and then taking the square root. The standard deviation of the height,
, is calculated in a similar way using the height values.
The best test in terms of symmetry would be the one with the symmetry coefficient (S) closest to 1 and a skewness coefficient (s) closest to 0. Based on
Table 2, in terms of symmetry, Test #10 has the highest coefficient with a value of 0.997, which is closest to 1, indicating a high level of symmetry in the manufactured beads. Test #8 has a lower skewness coefficient of 0.269. Therefore, if the objective is to optimize the process parameters for symmetry and skewness, respectively, Test #10 and Test #8 are the best options. After determining the optimal welding parameters, Test #8 was selected.
4.2. Wall Symmetry Evaluation on Different Path Strategies
In this section, the results obtained in the fabrication of the multibead wall, either using a continuous oscillatory trajectory or a discrete bead overlapped trajectory, are shown and discussed.
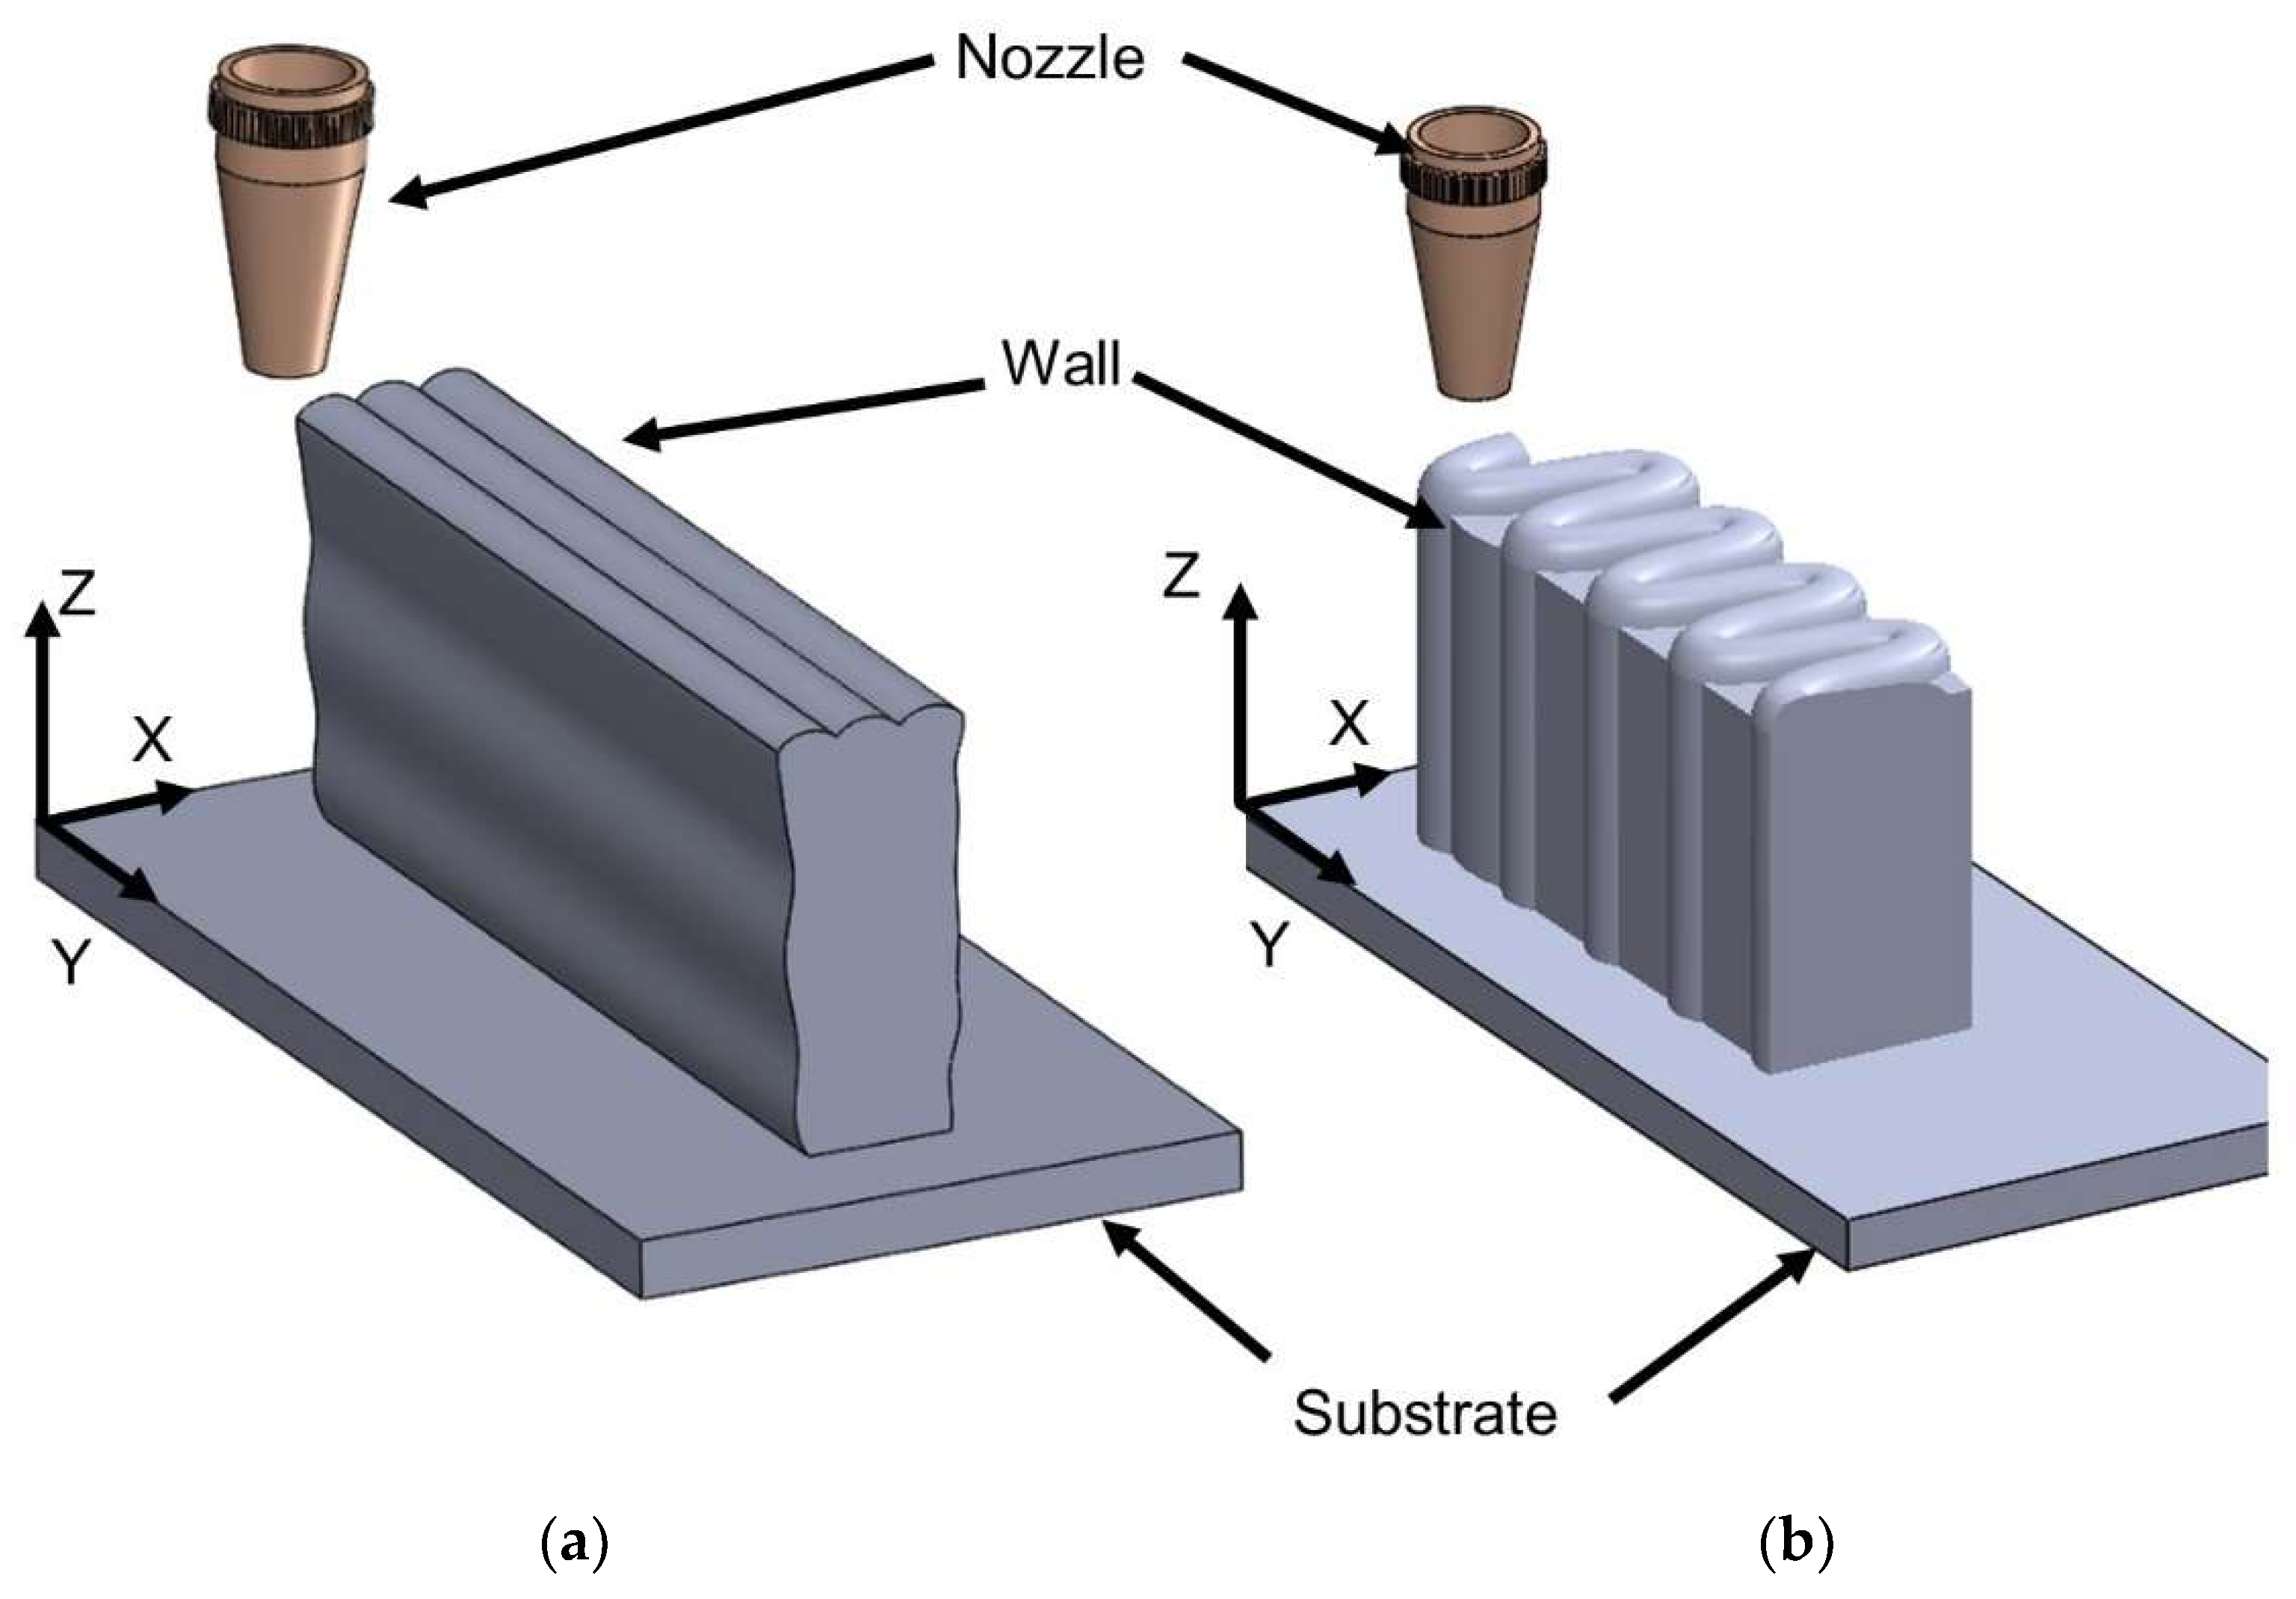
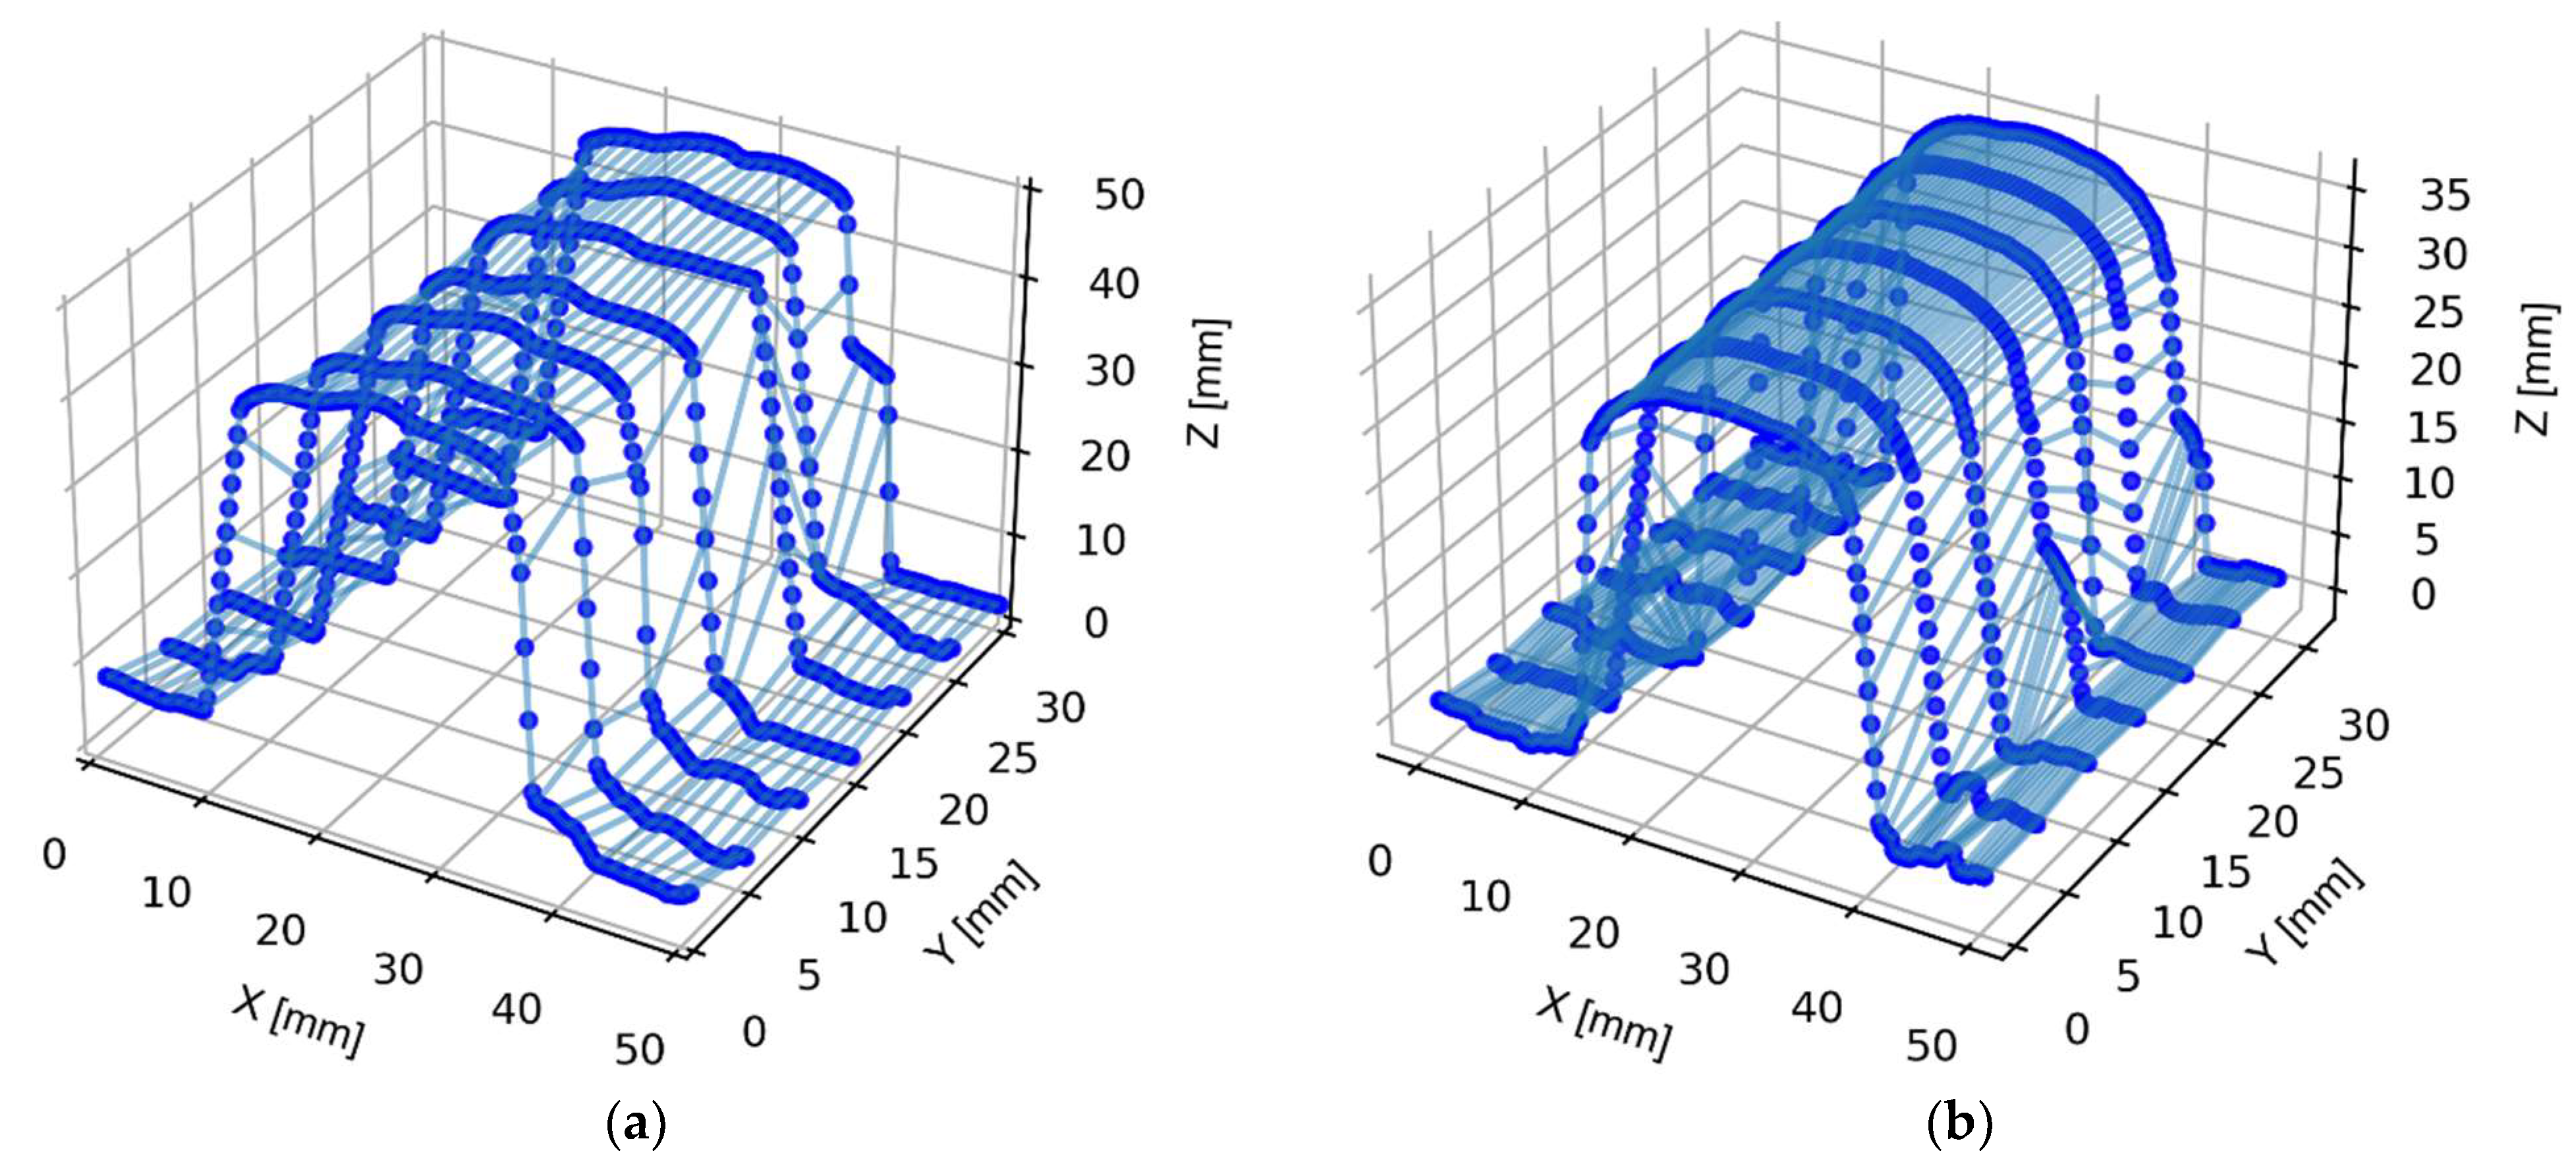
Figure 6 shows a three-dimensional reconstruction of layer 22 in a wall manufactured by two different welding strategies: overlapping (
Figure 6a) and oscillating (
Figure 6b). The wall is divided into layers, and layer 22 is shown in detail in the figure. In both (
Figure 6a) and (
Figure 6b), the layer appears to have a similar overall shape and structure. However, there are some differences in the distribution of material in the layer between the two strategies. In (
Figure 6a), where the overlapping strategy was used, there appear to be more distinct regions of material deposition with three round shapes related to the three beads, showing higher peaks and deeper valleys. In contrast, in (
Figure 6b), where the oscillating strategy was used, the regions of material deposition appear to be more spread out and less distinct, with smoother transitions between them.
Overall, the figure provides a visual representation of the differences in the deposition patterns between the two welding strategies and suggests that the overlapping strategy may lead to a more distinct and pronounced layer structure, while the oscillating strategy may result in a more gradual and smooth transition between the regions of material deposition.
The same process as described in
Section 3 was followed for the monobead wall but this time, for the full wall with different strategies.
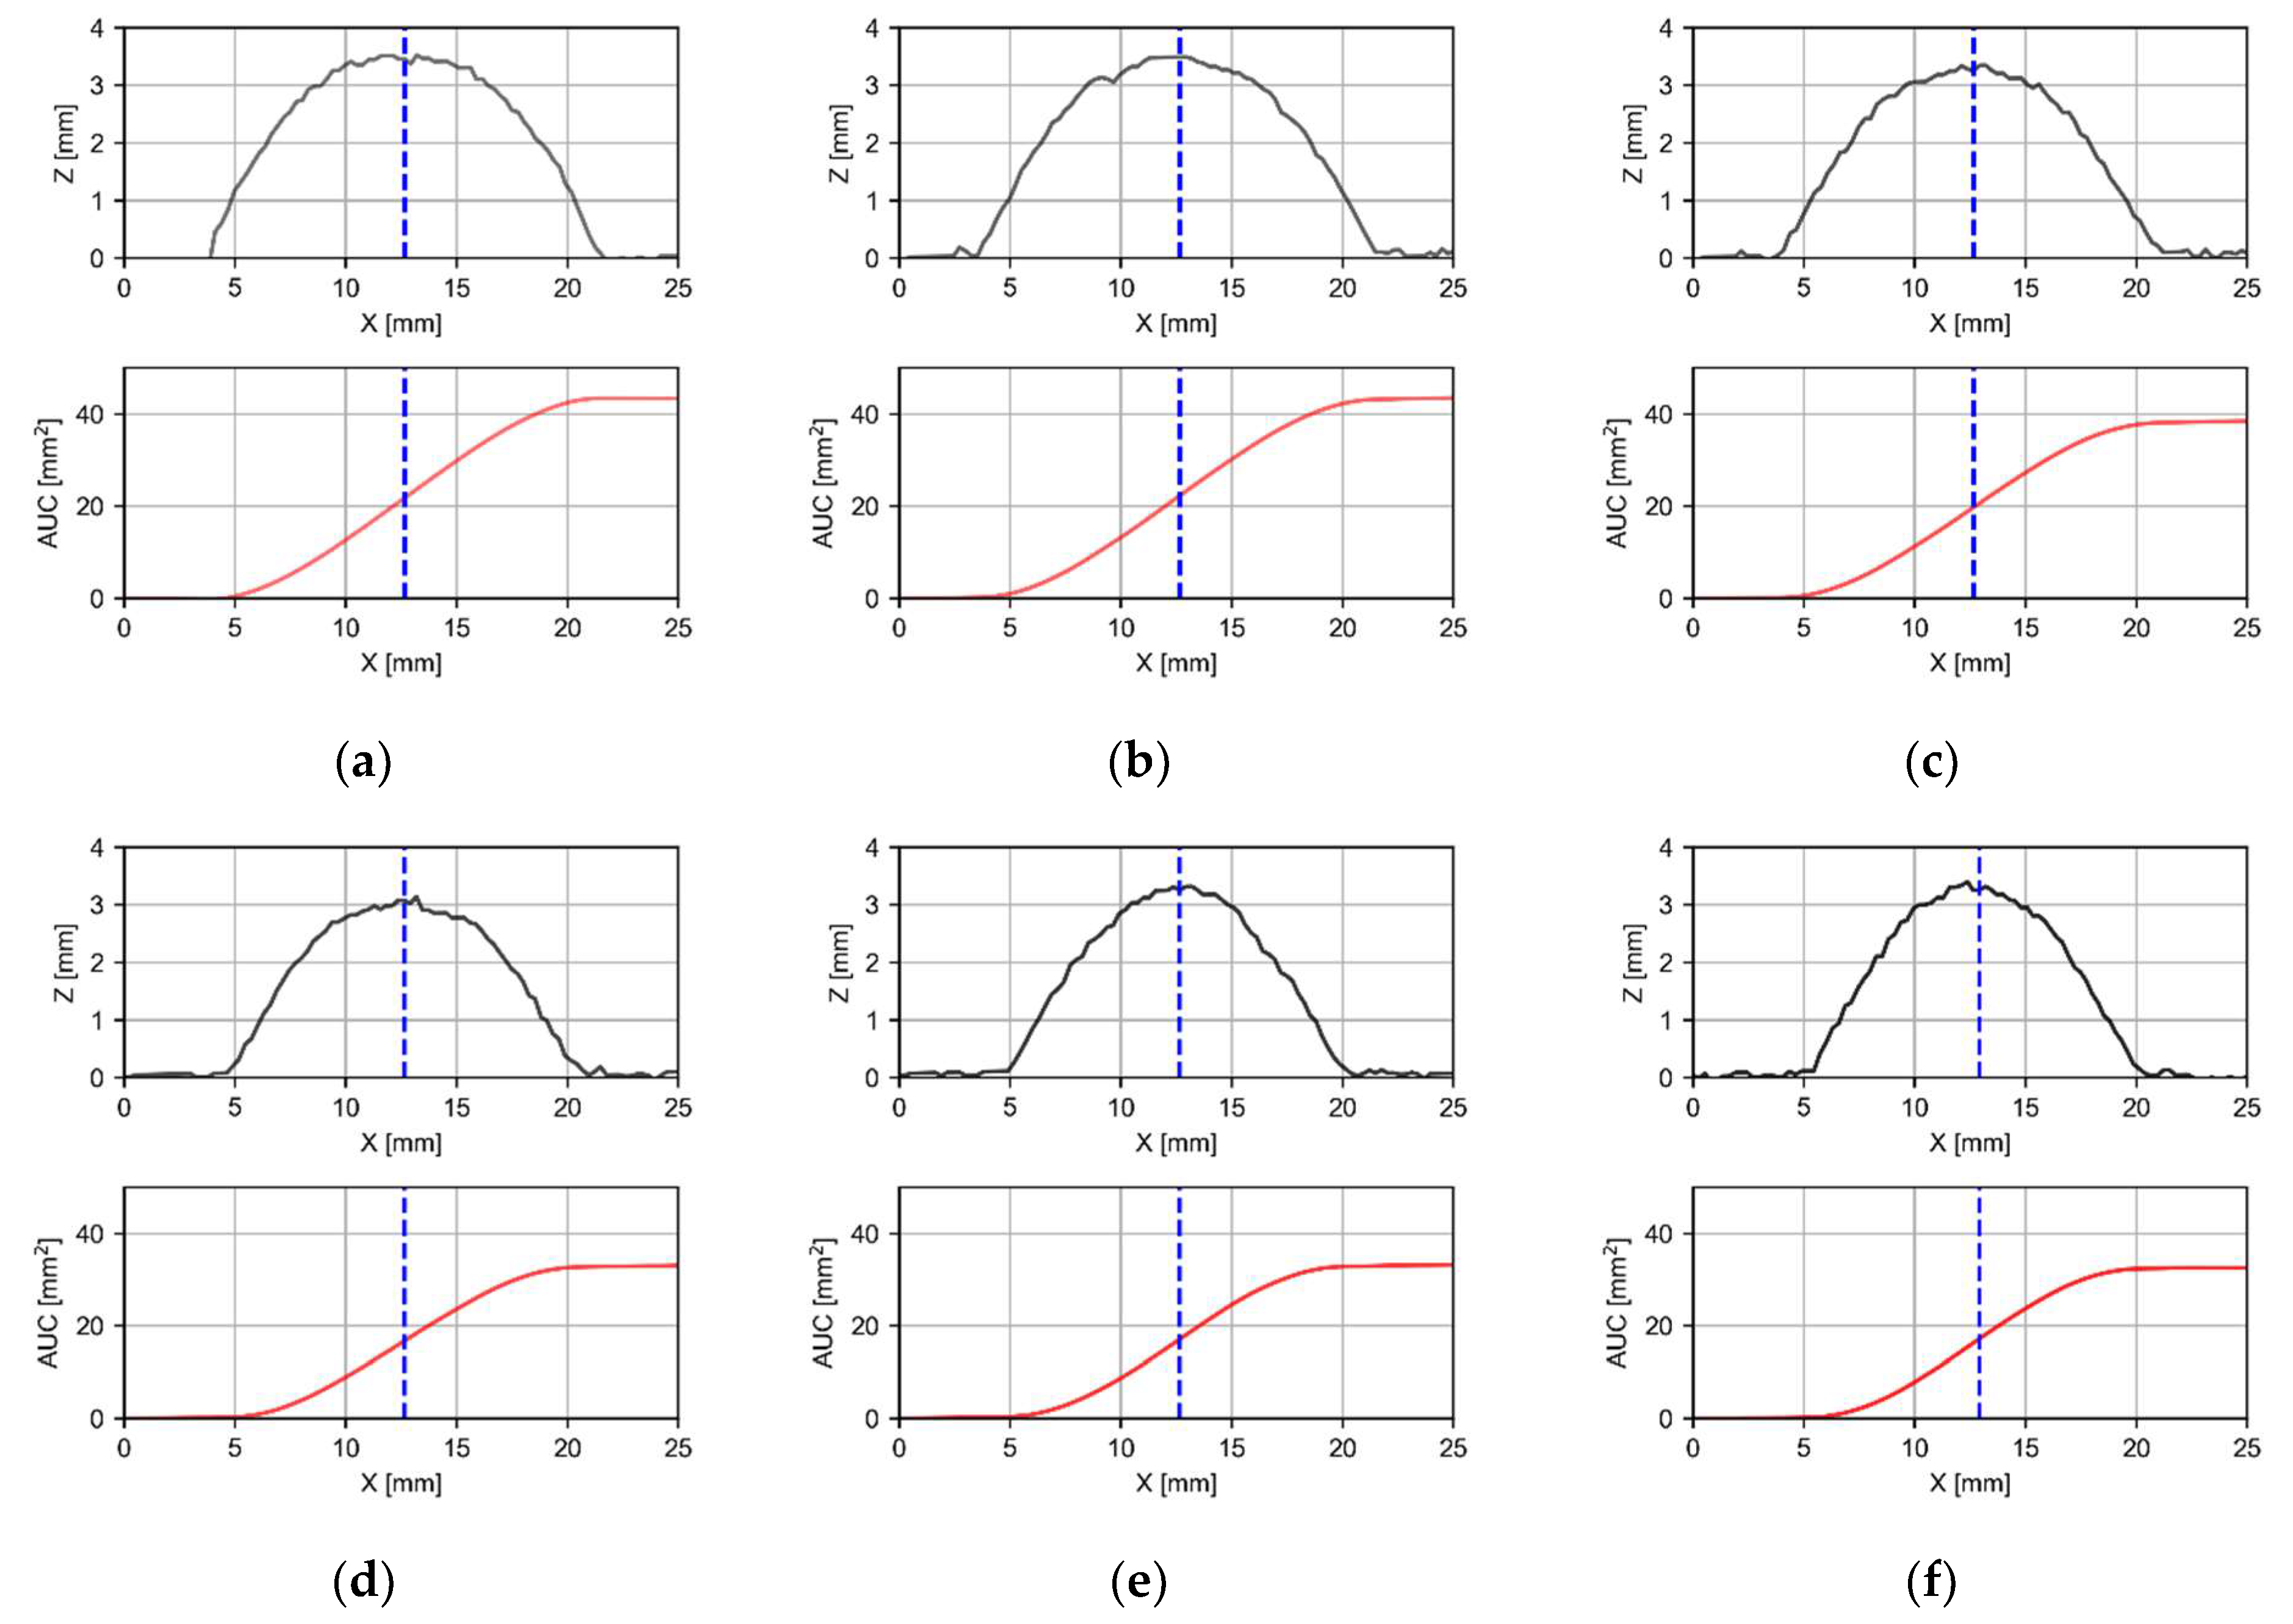
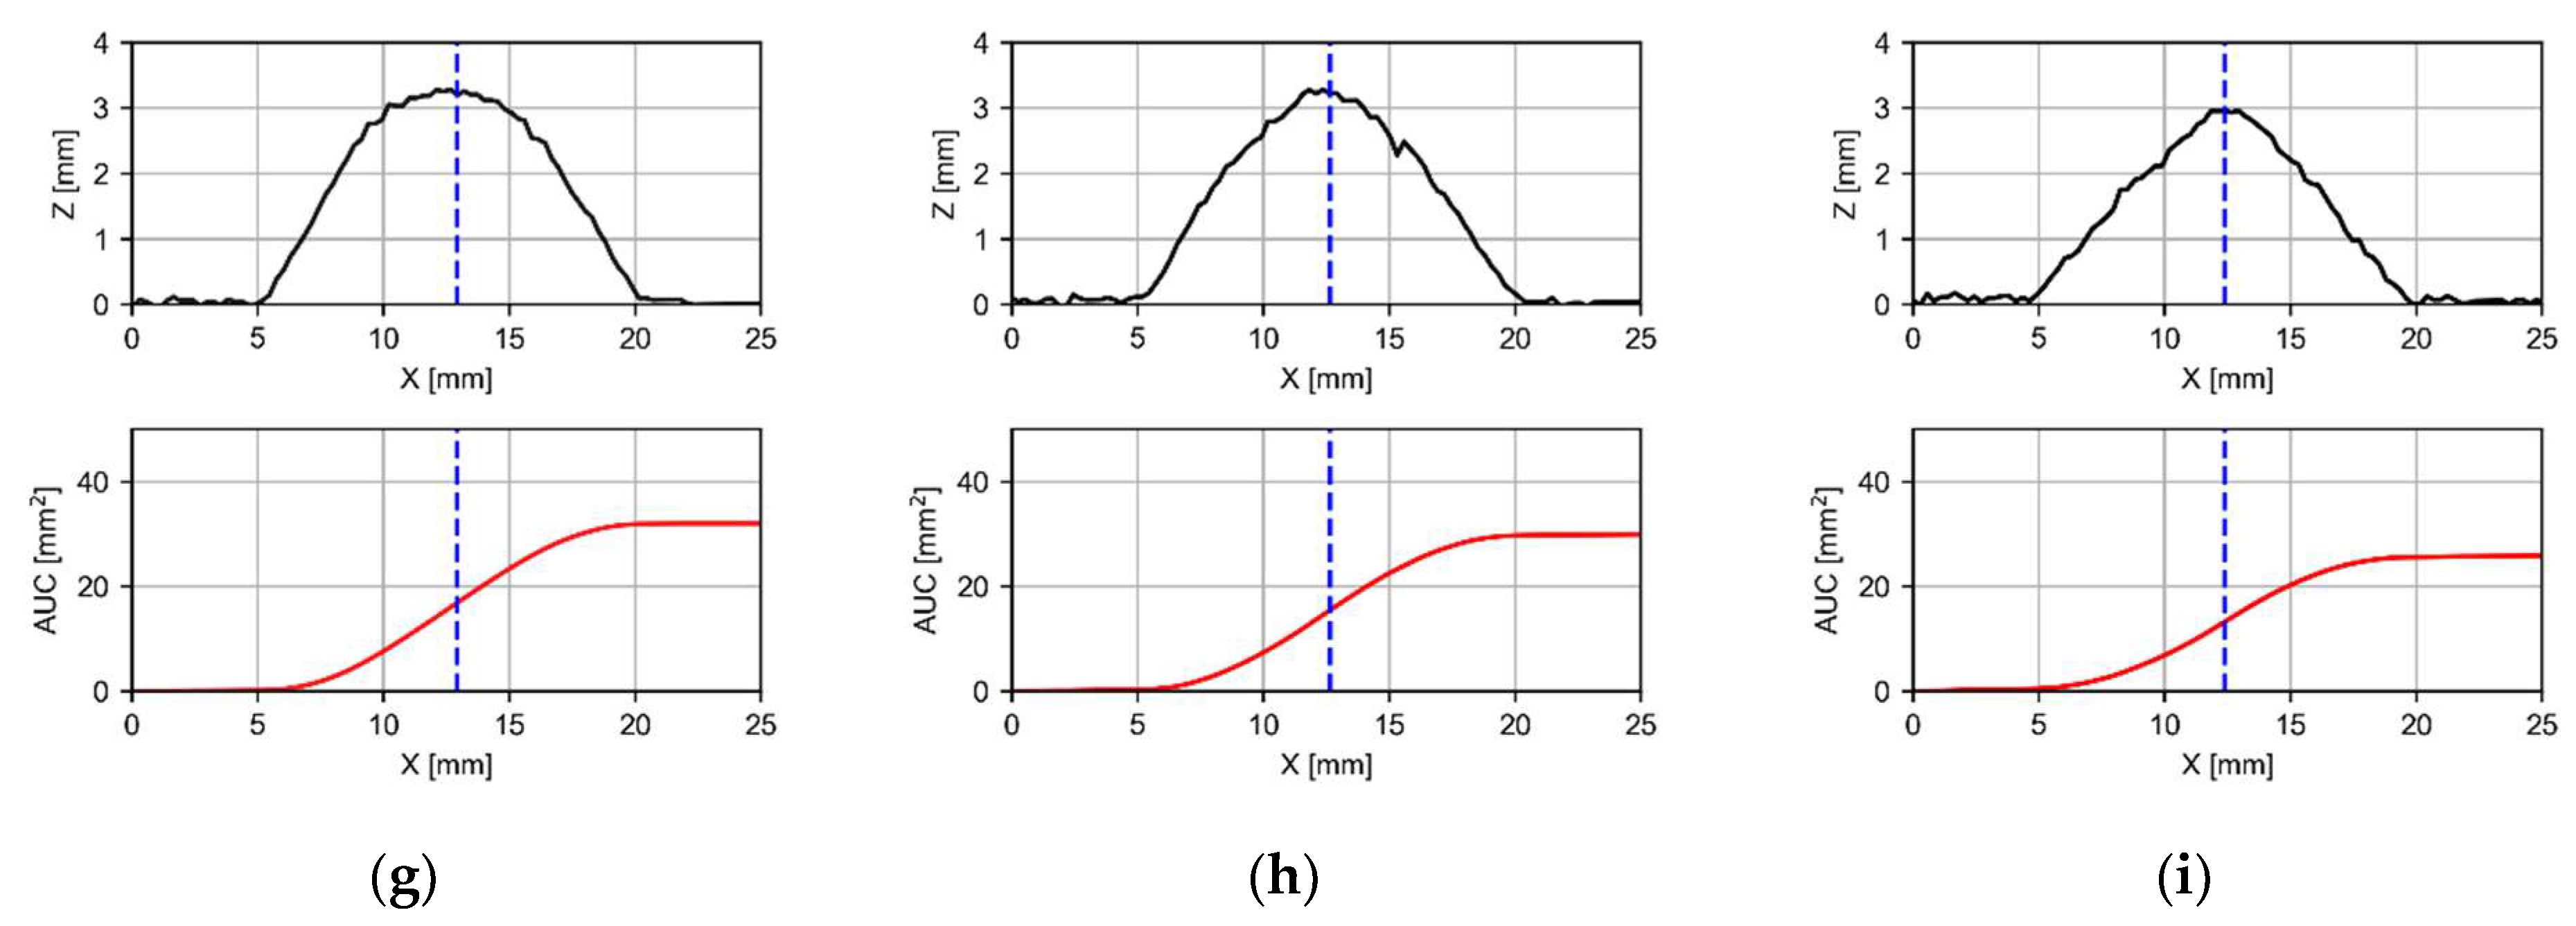
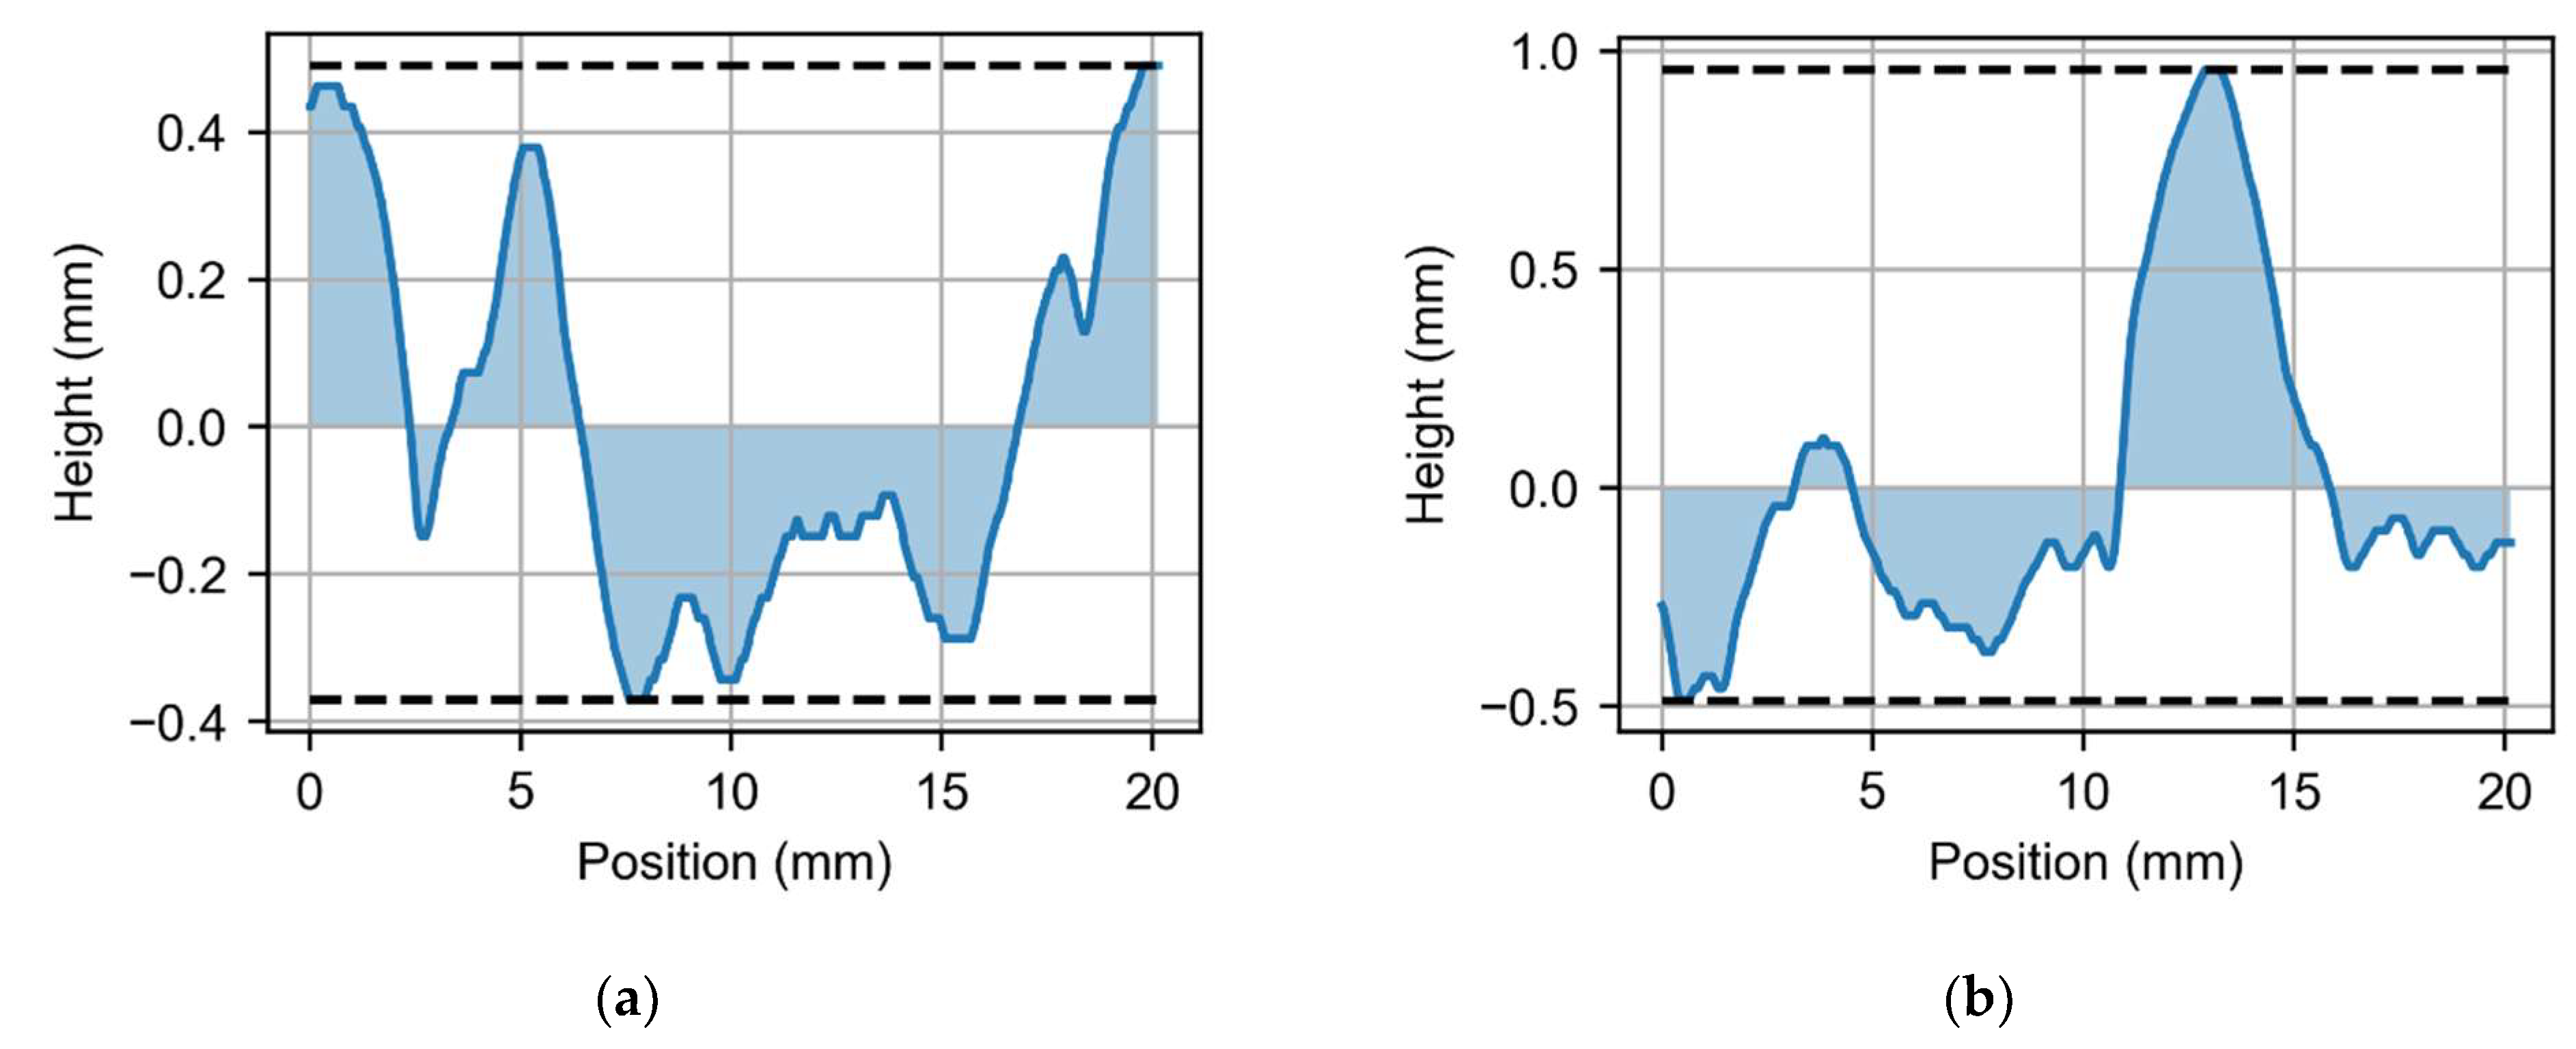
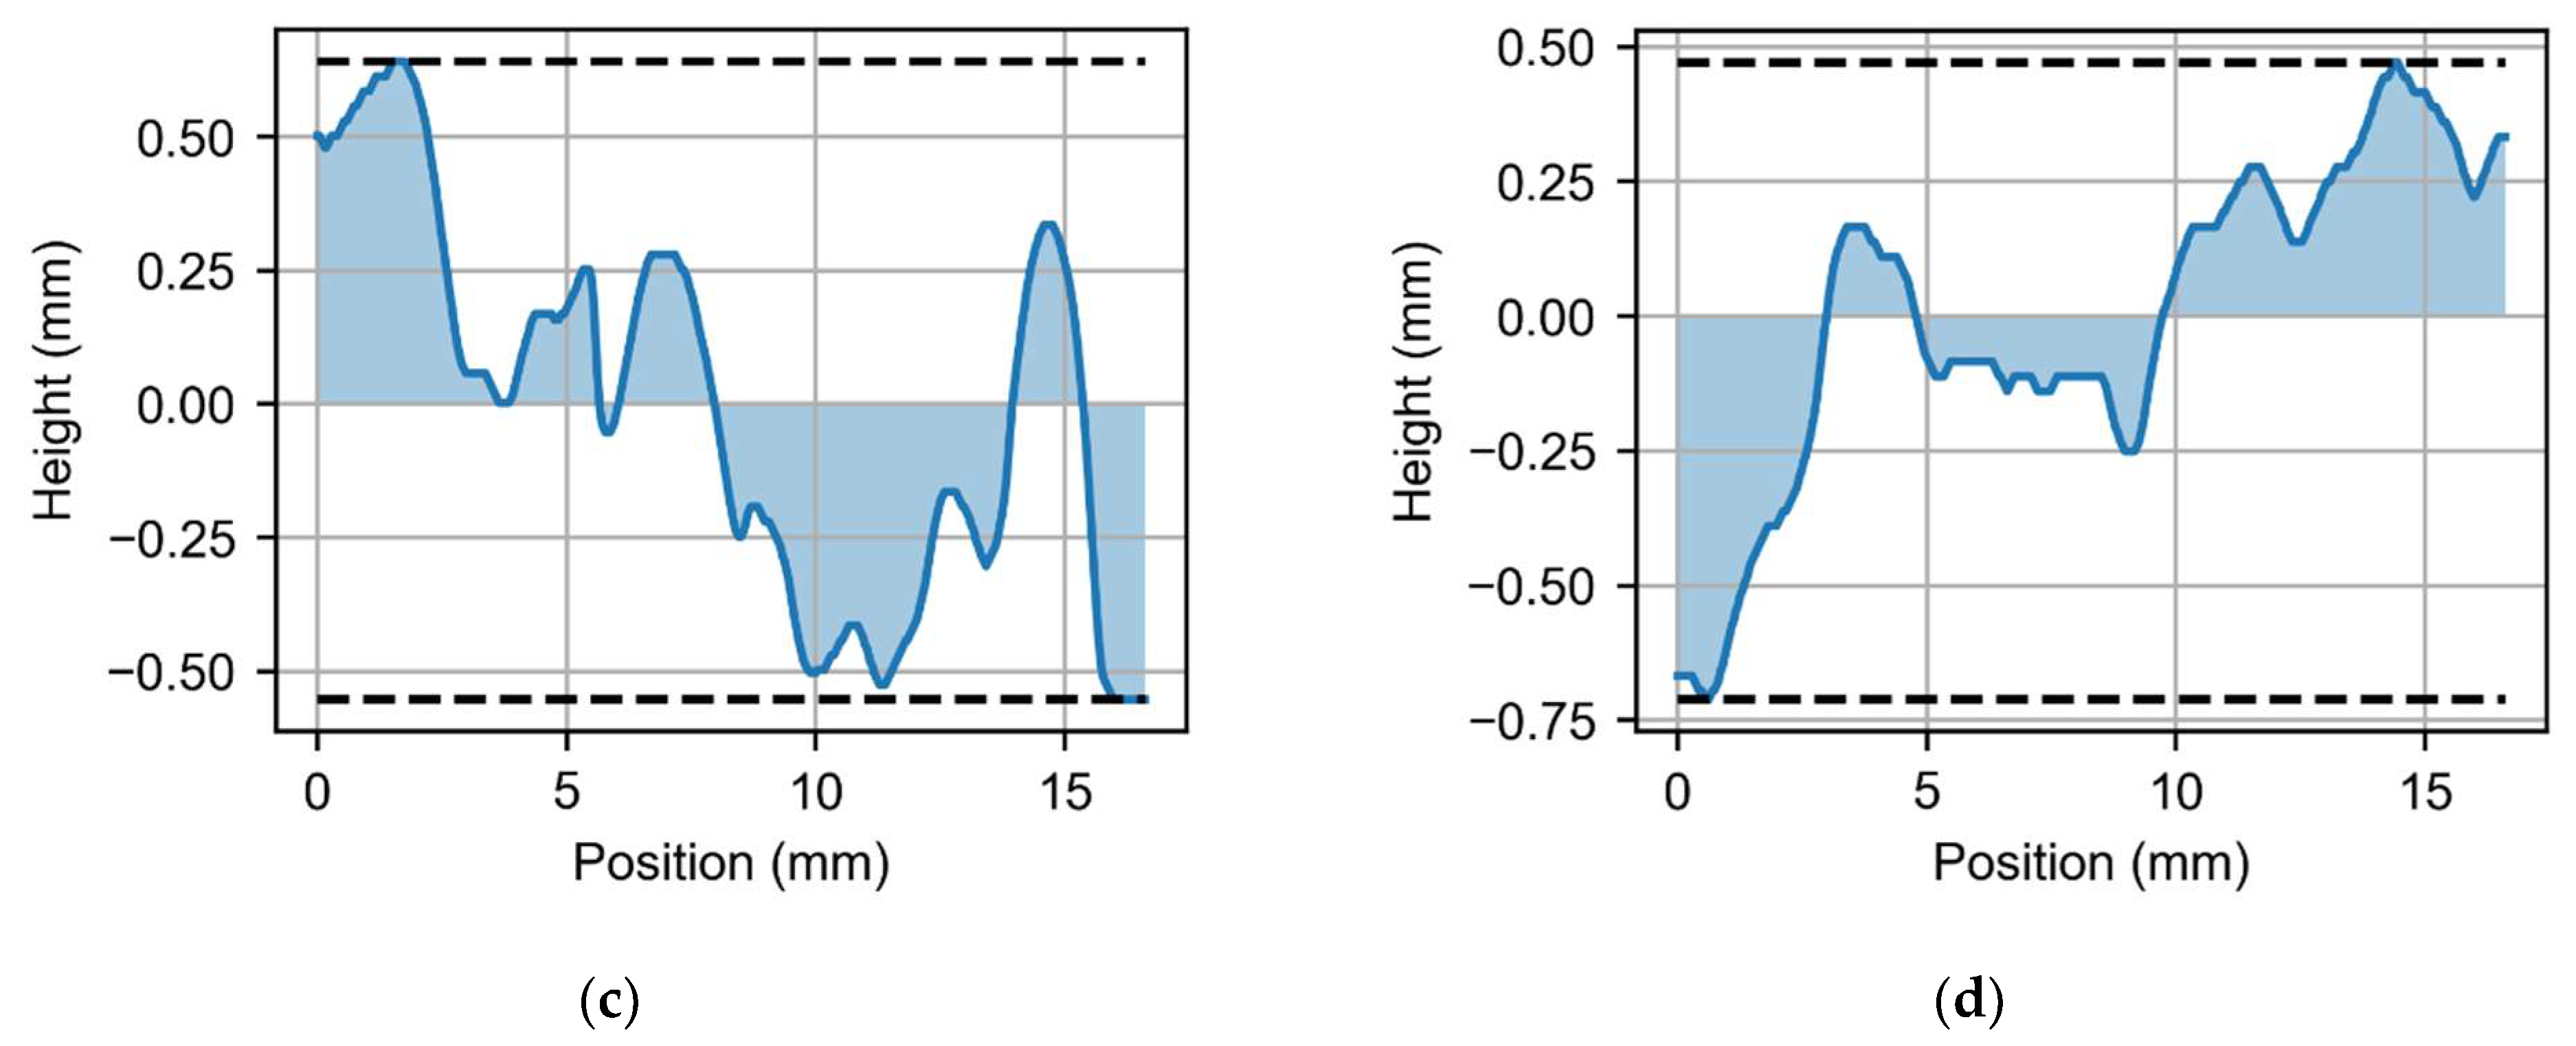
Figure 7 shows the pair bead profile and the area under the curve (AUC) for both the oscillating and overlapping strategies. The bead profile represents the geometrical shape of the deposited bead at different positions along the welding path. The AUC indicates the amount of material deposited by the welding process, which is proportional to the volume of the deposited bead.
In
Figure 7a–c, the pair bead profile and AUC are shown for the oscillating strategy at the first, fourth and seventh profiles, respectively. It can be observed that the beads have a relatively constant width along the deposition path. The profiles at the initial layers show more uncertainty due to the presence of spatter. In
Figure 7d–f, the pair bead profile and AUC are shown for the overlapping strategy at the first, fourth and seventh profiles, respectively. The beads have a more irregular shape, with some sections wider than others.
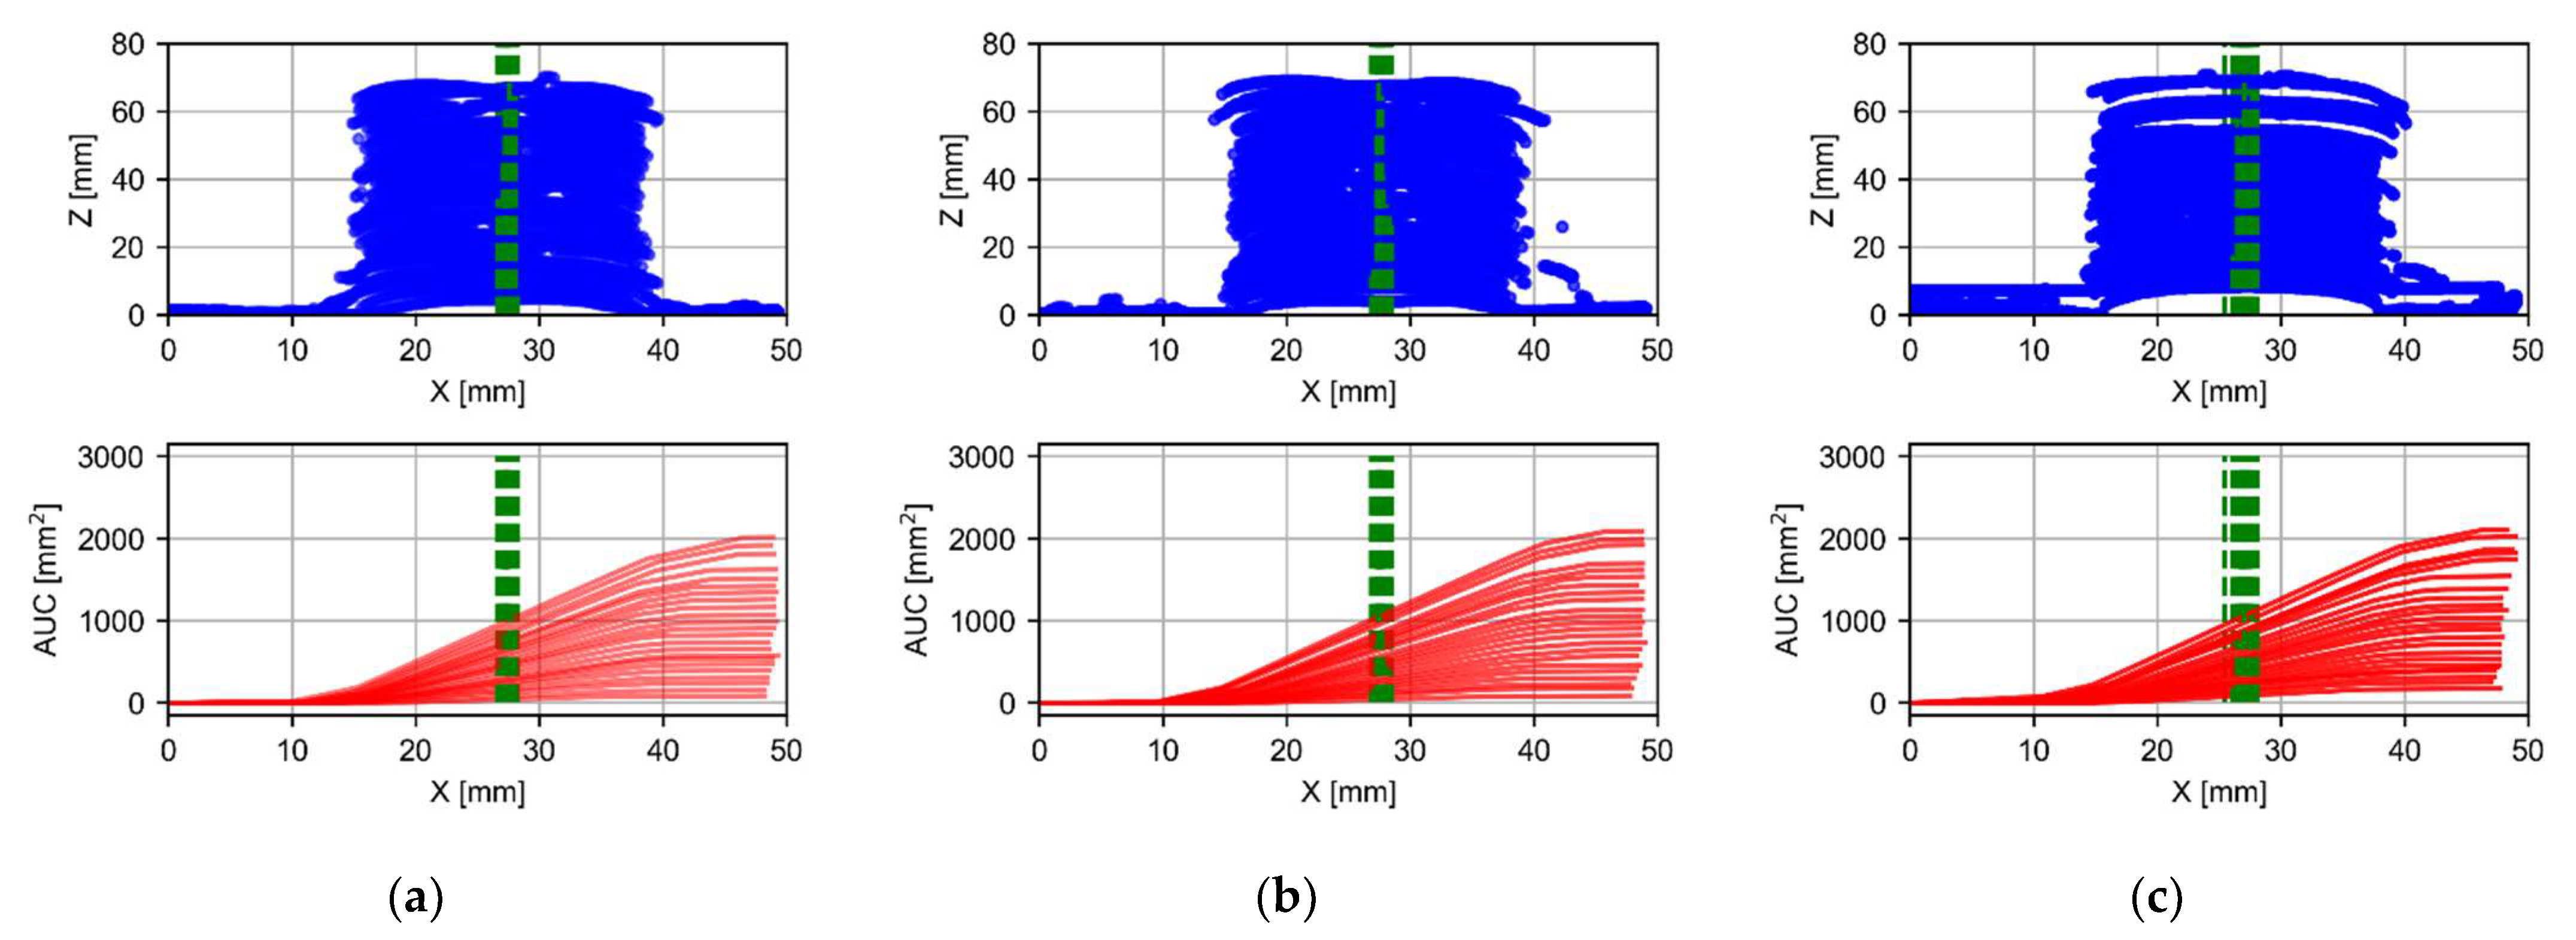
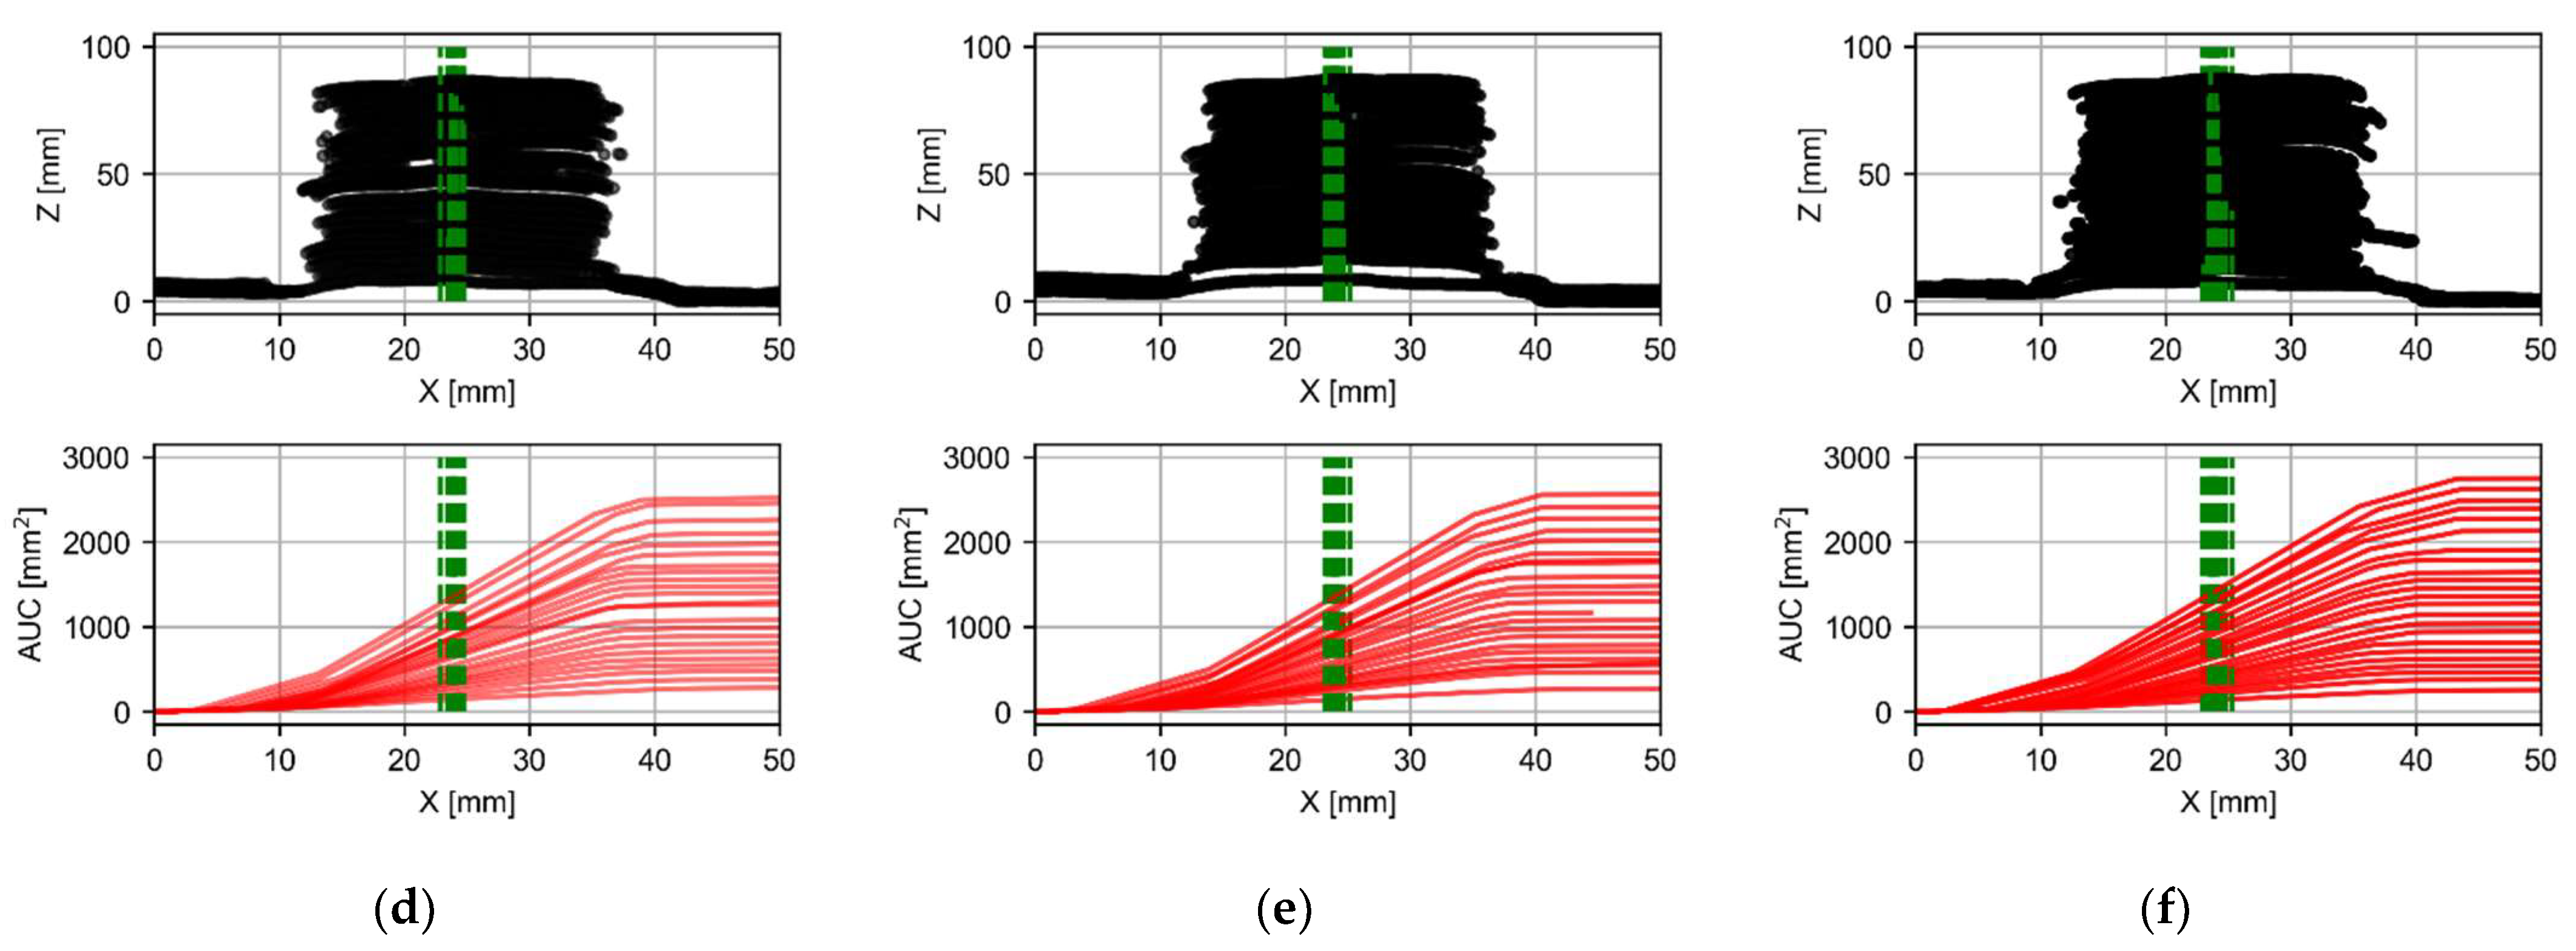
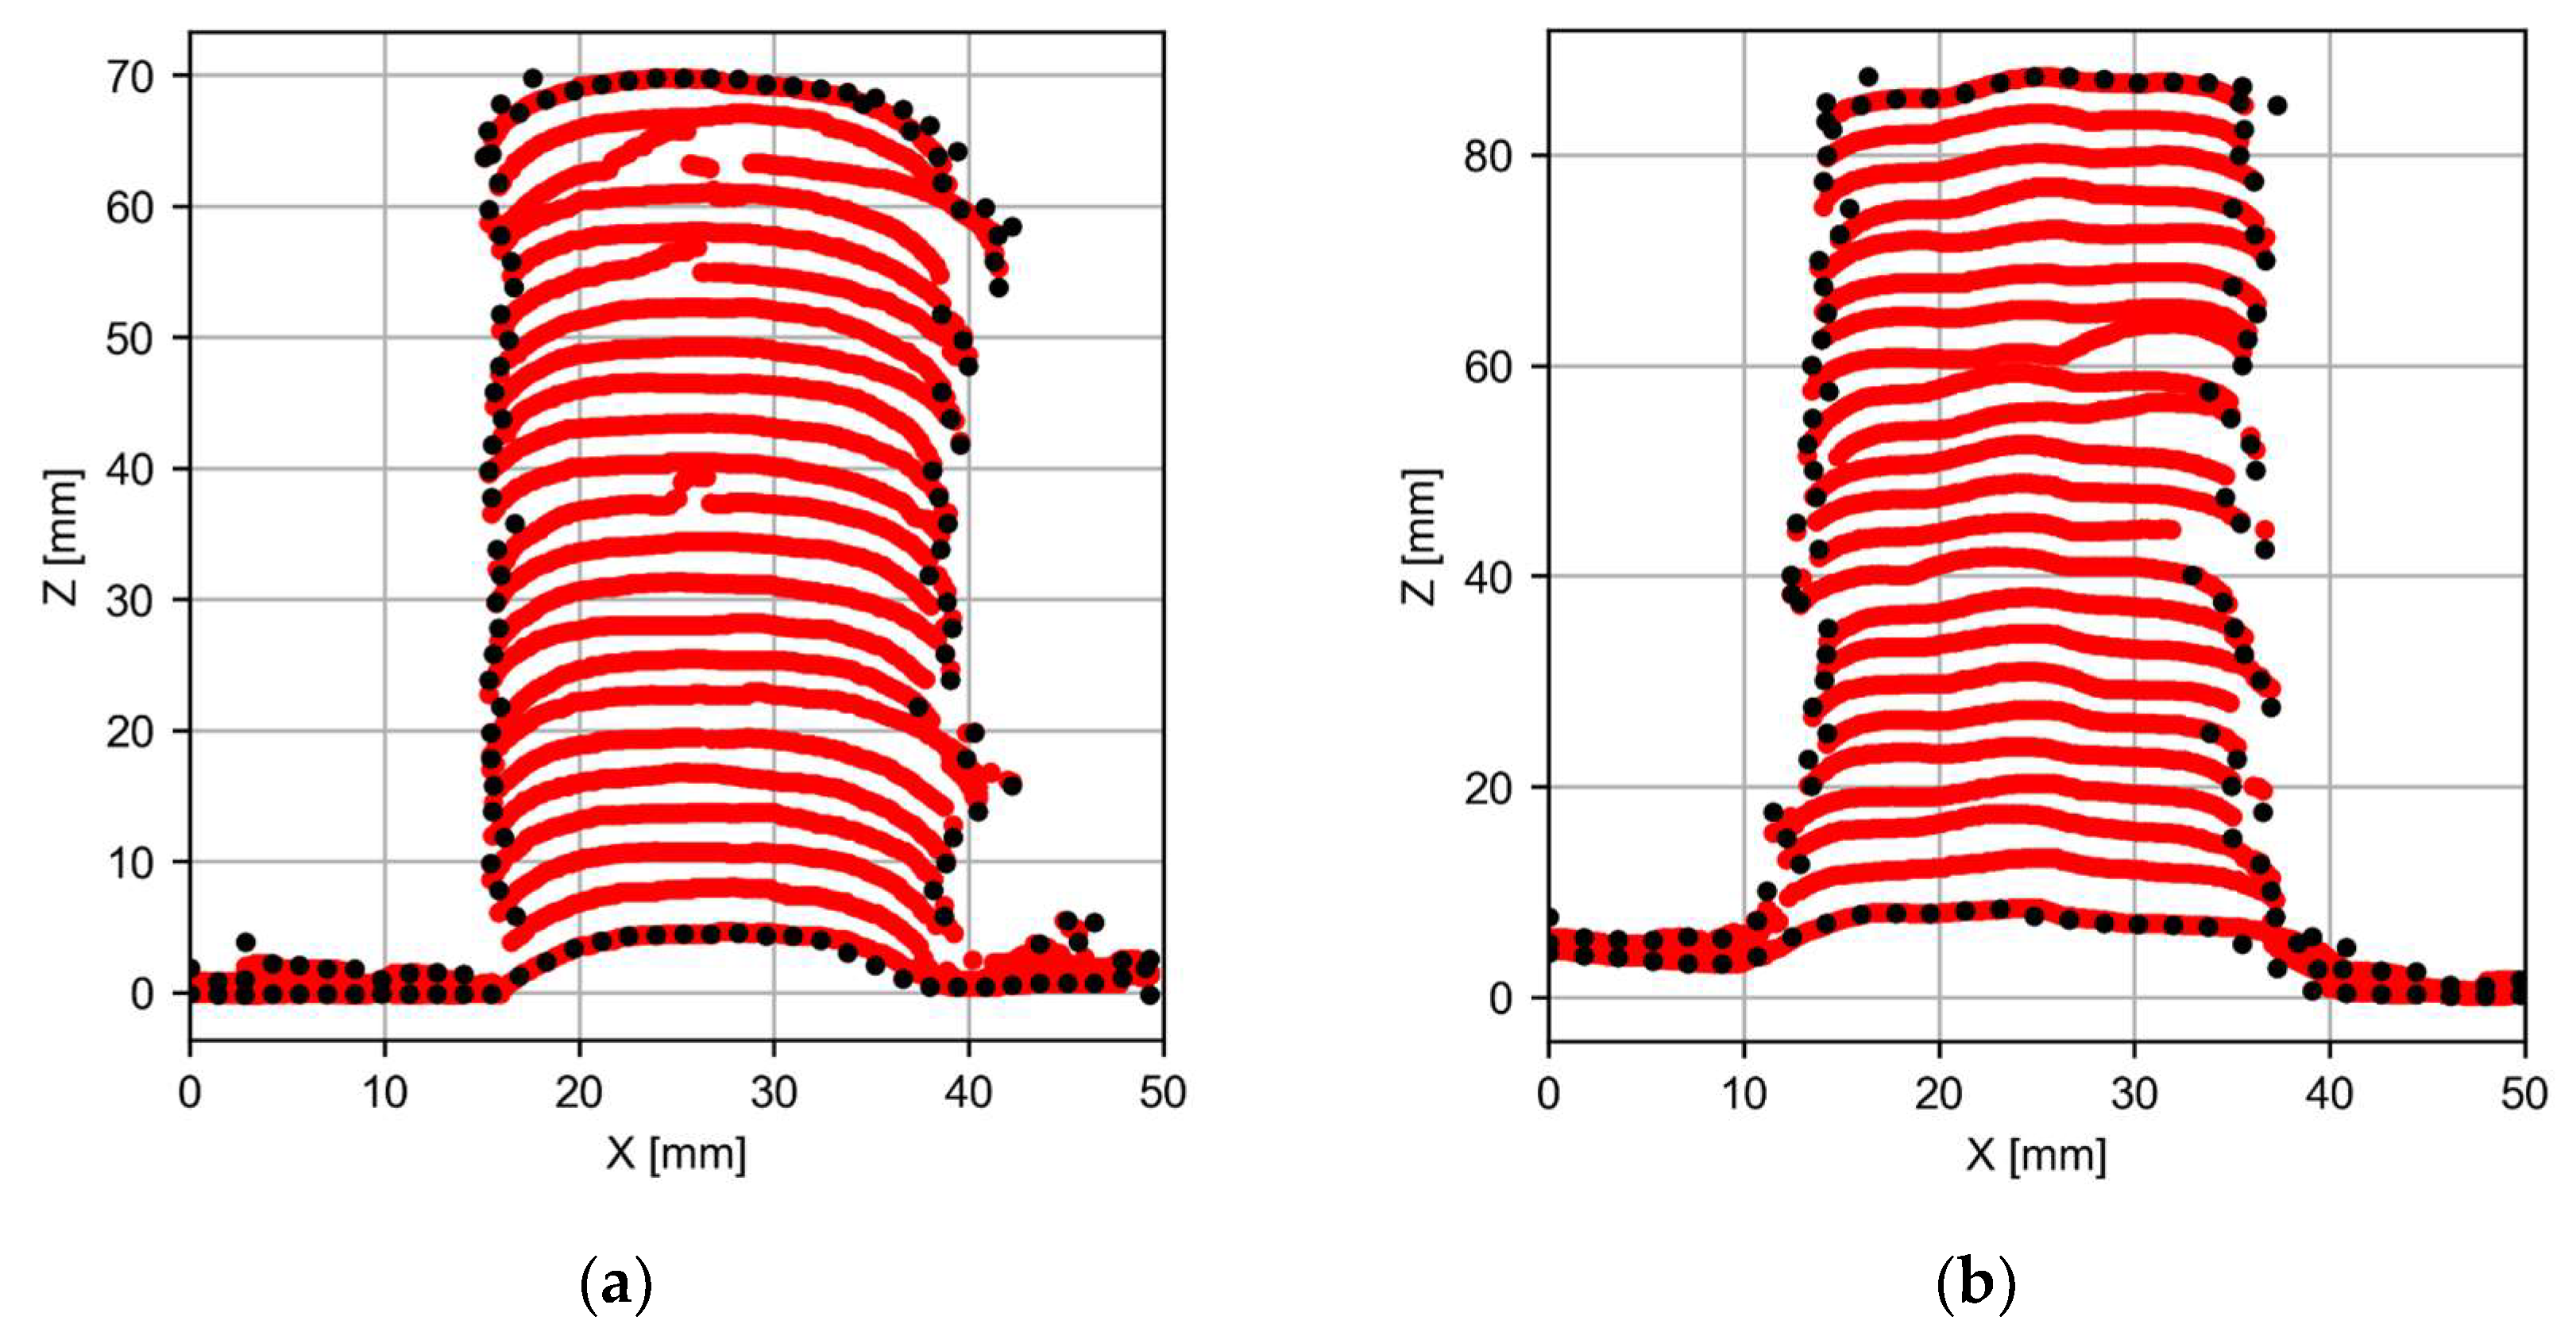
In the following
Figure 8, point clouds representing the geometry of the weld bead in the intermediate profile (fourth profile) for each layer (from the 1st to 46th layer, plotting alternate layers only) are shown for two different welding strategies: oscillating and overlapping. The black dots represent the envelope or boundary of the weld bead geometry, calculated using a mathematical algorithm. The algorithm first calculates the vertical and horizontal limits of the point cloud by dividing the range of Z and X values into a specified number of segments. It then loops through each segment to find the minimum and maximum values of X and Y within that segment. If a minimum or maximum value is found, it is added to a list of lower, upper, left or right points, depending on whether it corresponds to the lower, upper, left or right boundary of the point cloud. Once the algorithm has found all the boundary points, it combines them into a single set of points and removes any duplicate points. It then uses the ConvexHull function from the SciPy library to calculate the convex hull of the point cloud.
The point clouds show the actual shape and dimensions of the weld bead at each layer, while the envelope provides a clear representation of the overall shape and dimensions of the weld bead for the entire weld. Comparing the two strategies, it appears that the oscillating strategy produces a more irregular and nonuniform weld bead, while the overlapping strategy produces a smoother and more uniform weld bead with a well-defined boundary.
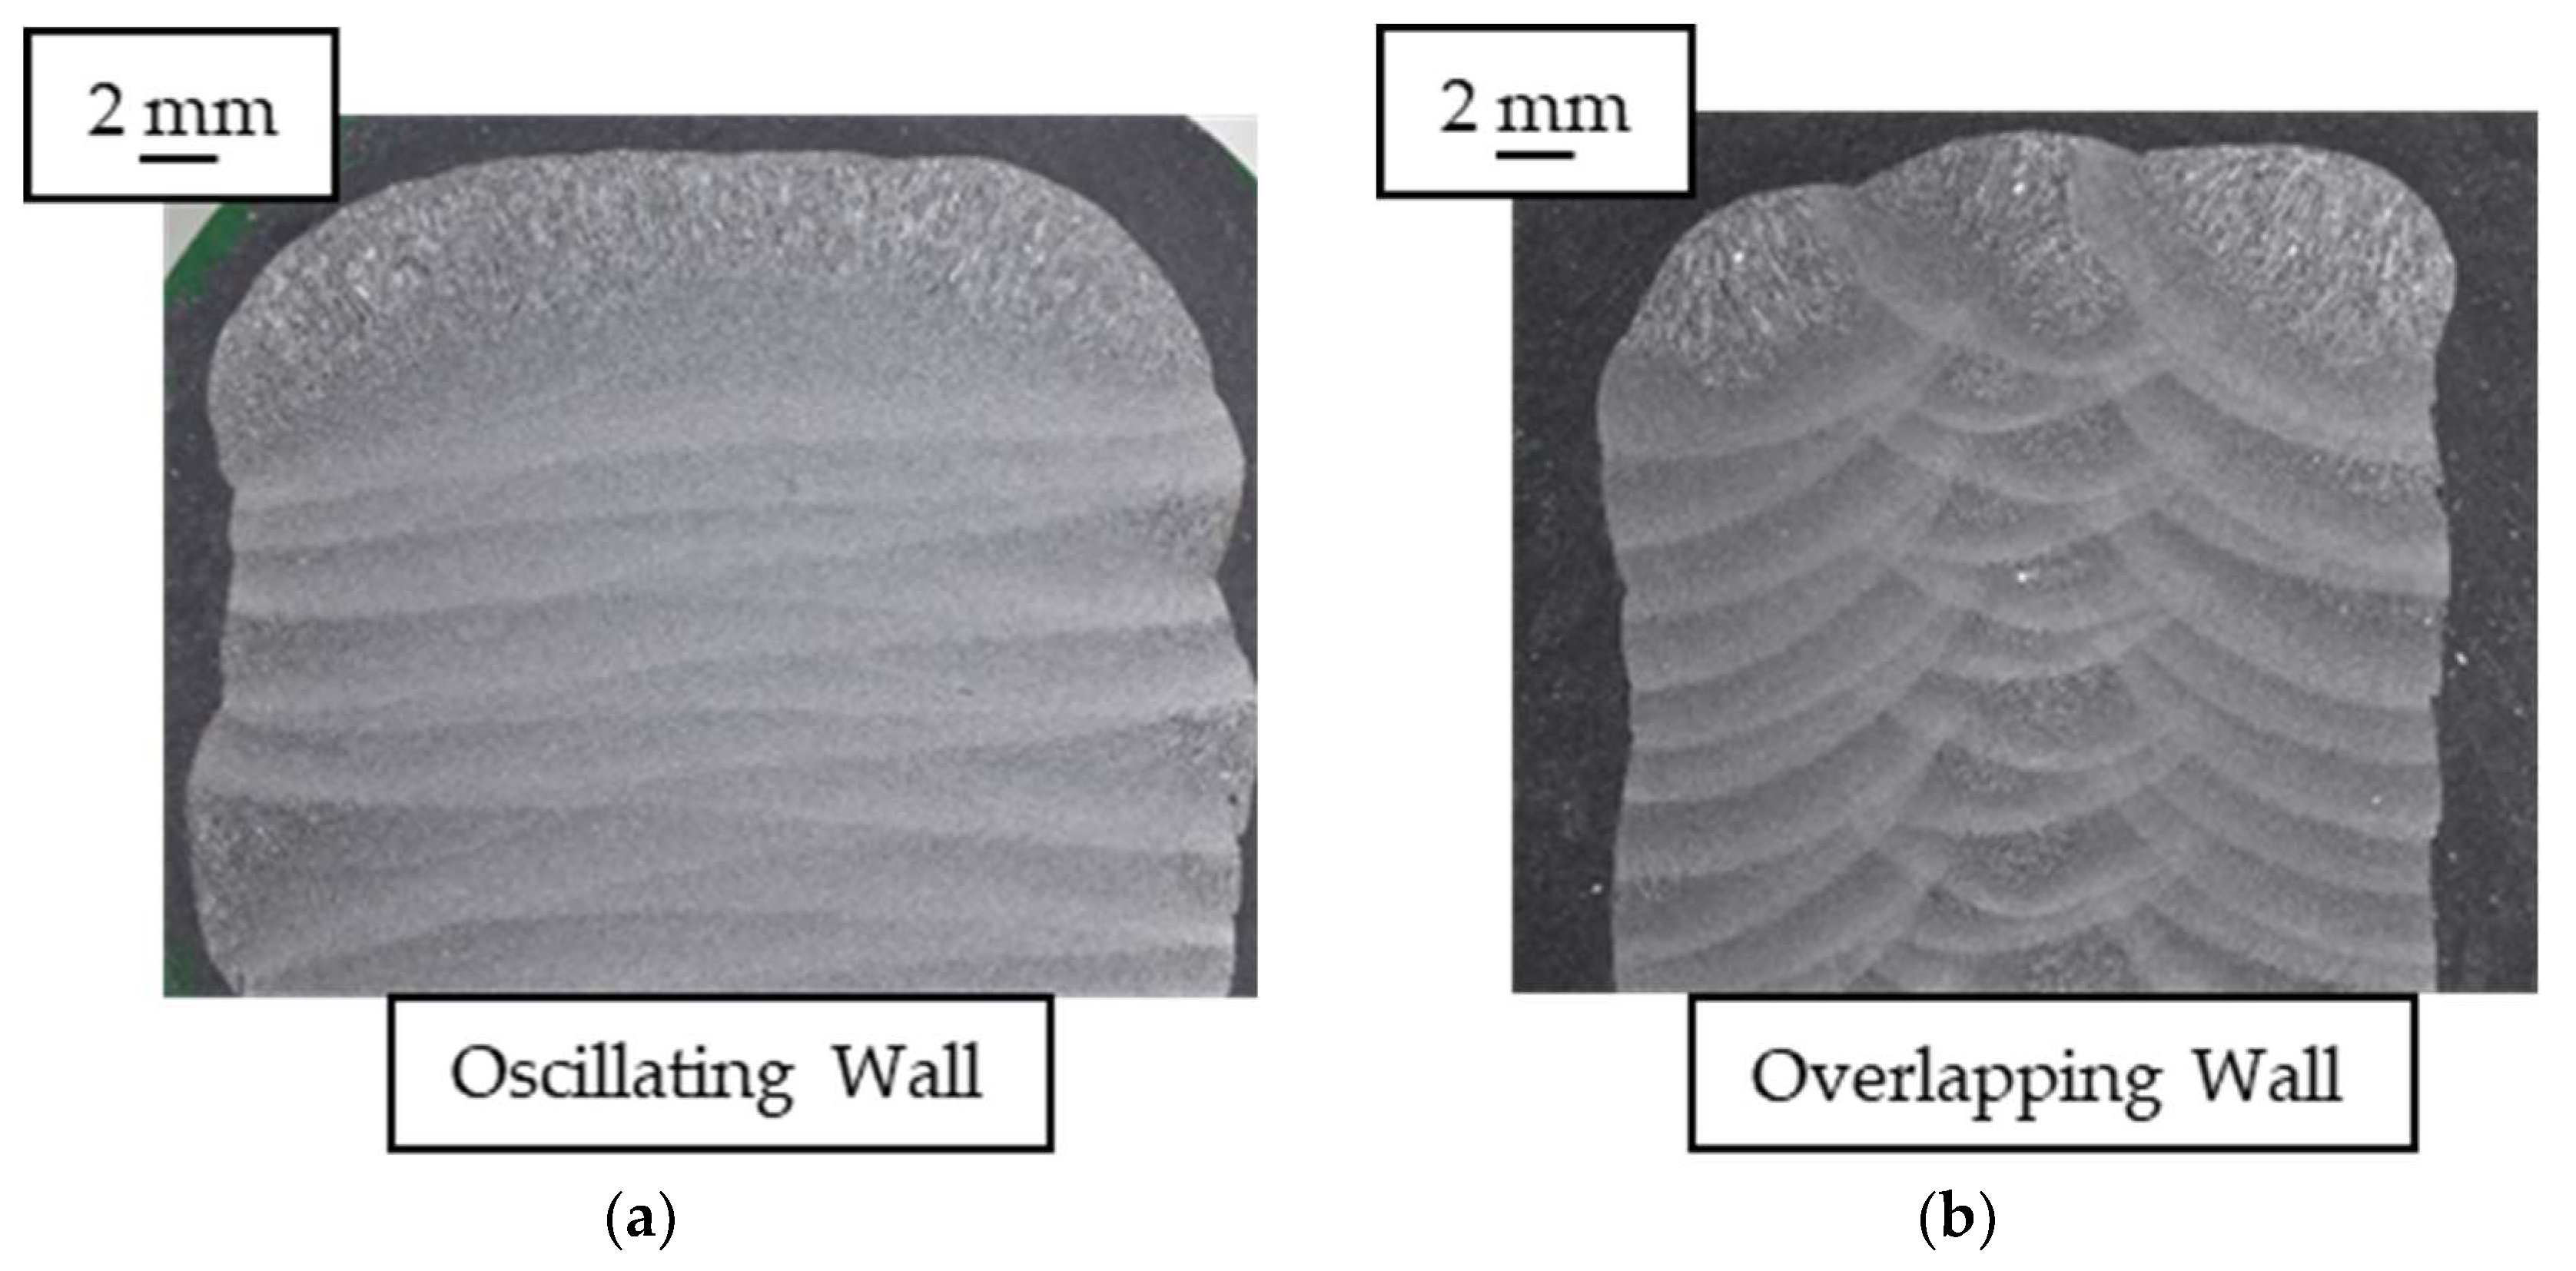
Figure 9 shows the macroscopic image with a comparison of the two walls manufactured using the oscillating and overlapping strategies. The geometric differences between the two strategies that were observed in the three-dimensional reconstruction (
Figure 6) and bead profile analysis (
Figure 8) may also be visible in the macroscopic image. The figure shows the characteristic peaks of the three discrete passes characteristic of the overlapping trajectory and a more fluid arrangement of the wall in the oscillatory trajectory.
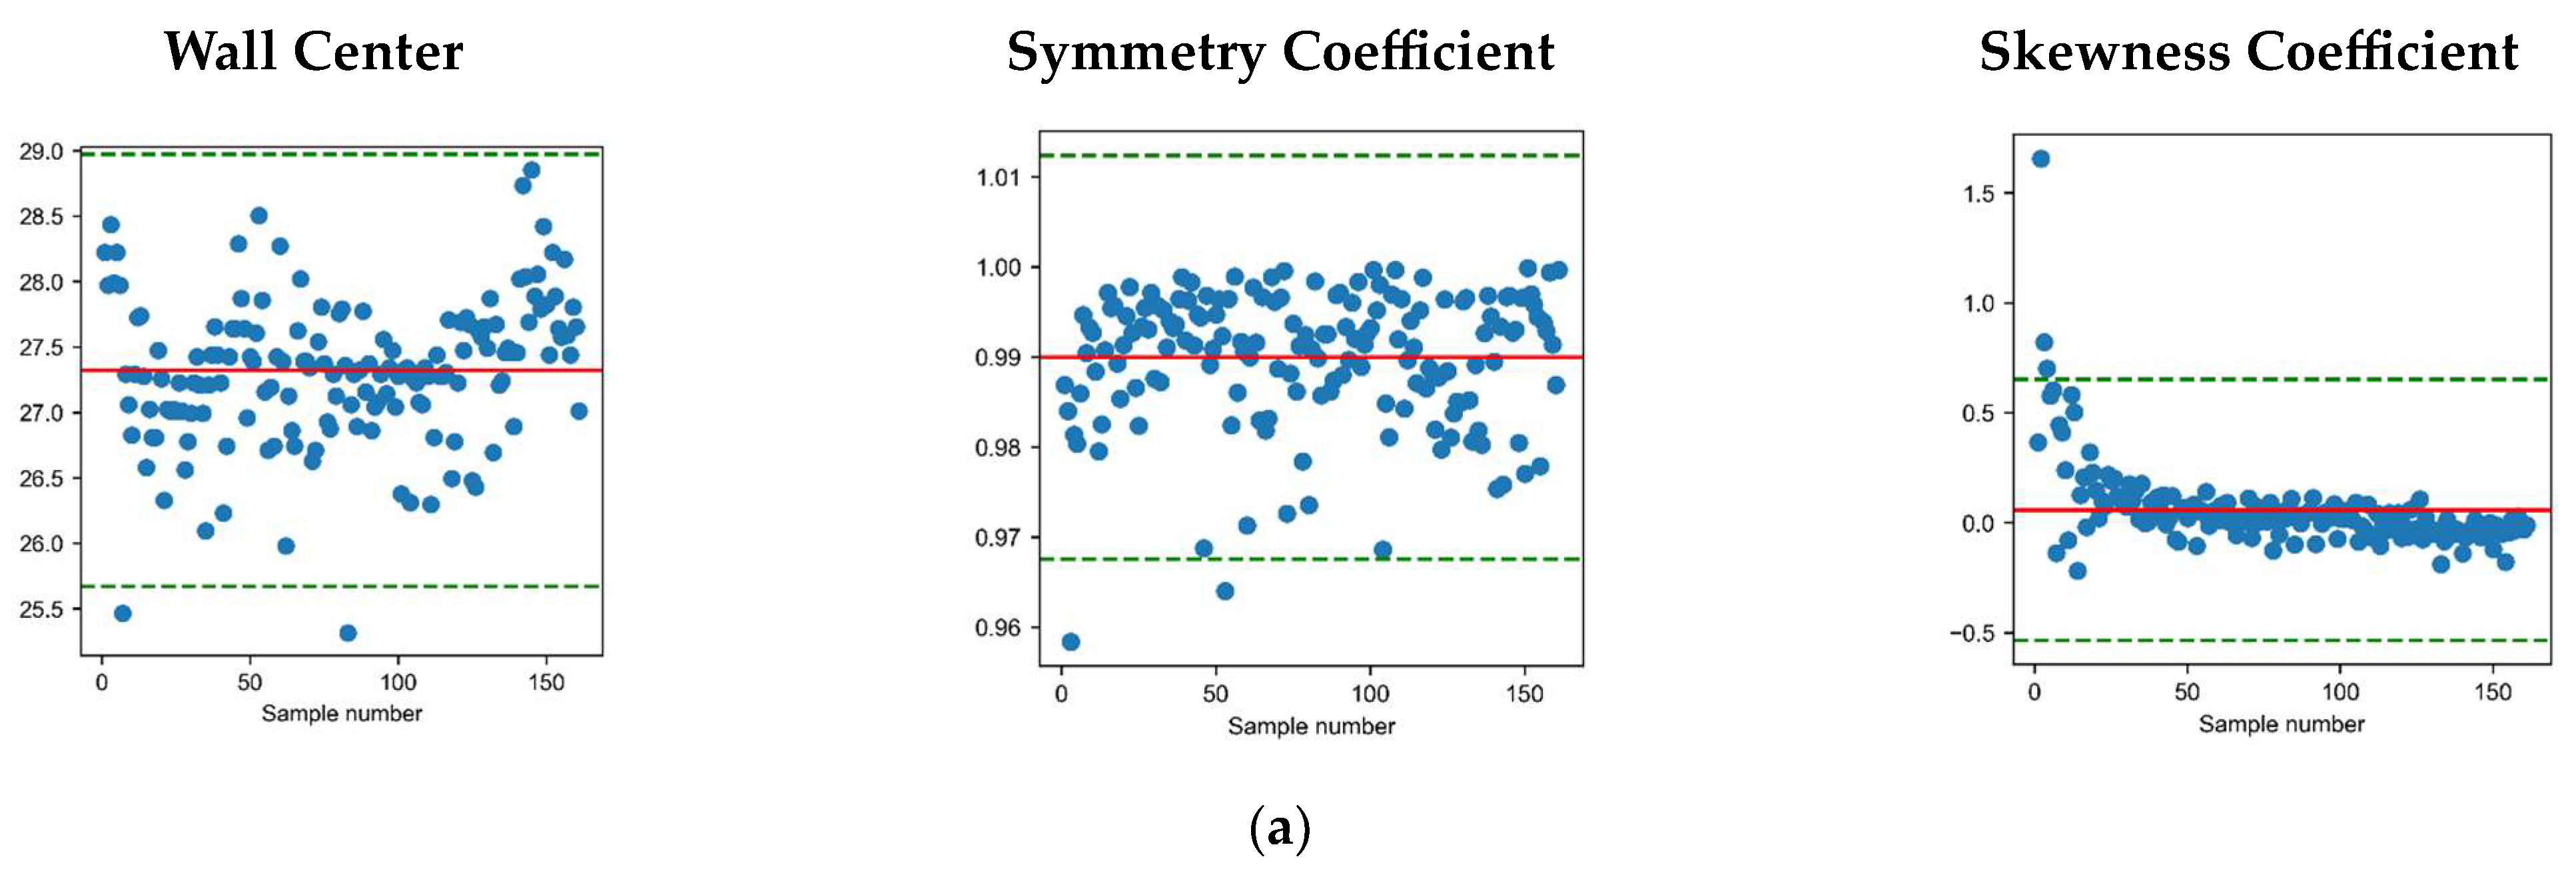
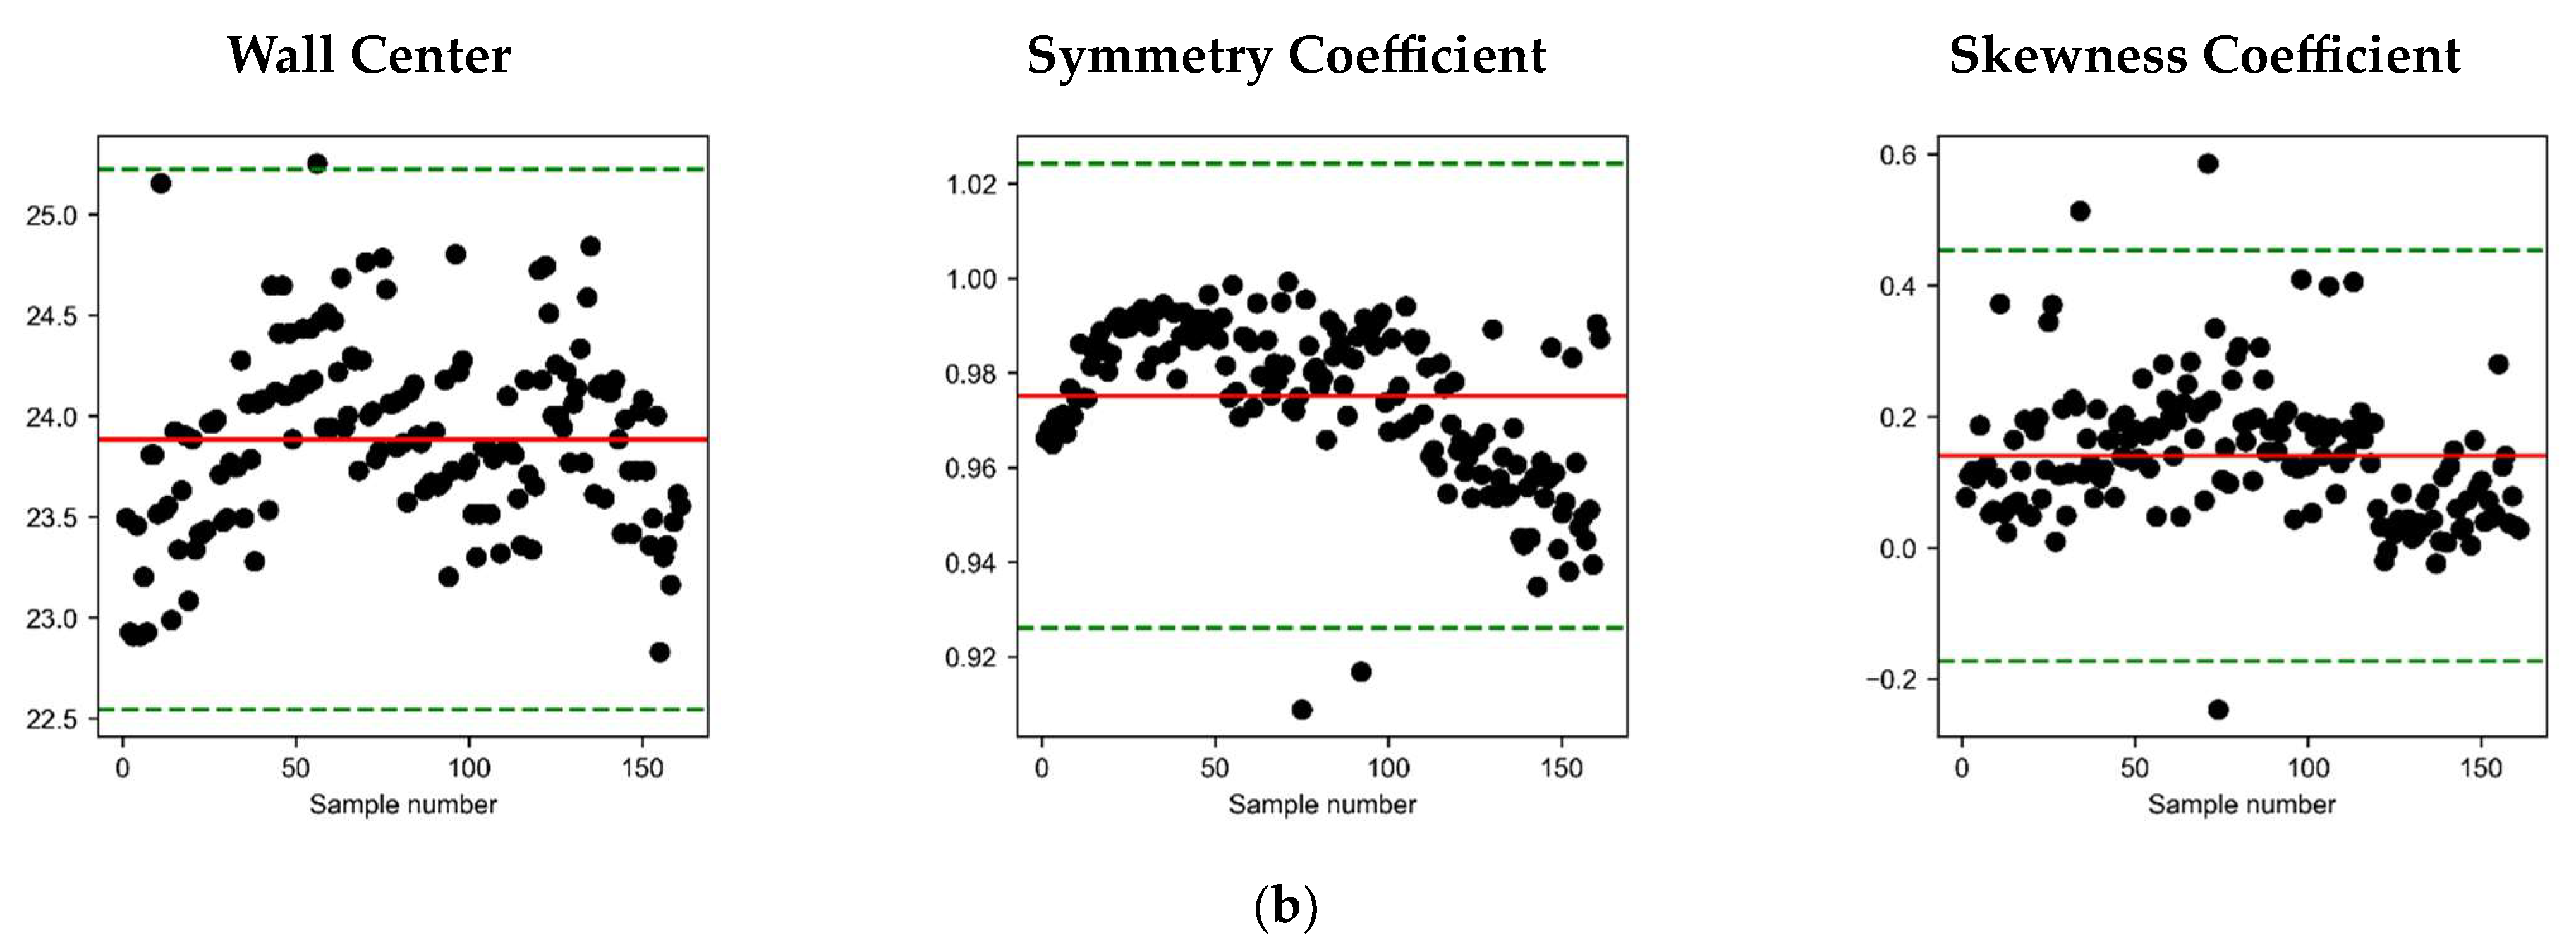
Figure 10 presents a comparison of the descriptive parameters of the wall center, symmetry coefficient and skewness coefficient between the two different strategies used.
Figure 10a shows the results of the oscillatory strategy, where the first profiles show a large skewness coefficient due to the presence of splatter, which is also shown in the symmetry coefficient.
Figure 10b shows the results of the overlapping strategy, where the overall result in terms of symmetry and skewness is the worst. The graphs show that the oscillatory strategy results in a higher symmetry coefficient compared to the overlapping strategy.
Figure 10 shows that the results of the oscillatory strategy show slight advantages in terms of wall symmetry. This finding suggests that employing an oscillatory path strategy can effectively enhance the geometric accuracy and surface quality of fabricated components, making it a valuable technique in additive manufacturing processes. This improvement in the geometry of the fabricated wall has already been suggested by other authors who focused more on lateral waviness [
32].
4.3. Mechanical and Surface Finish Comparison
The walls manufactured using GMAW based on WAAM using both strategies were analyzed. Mechanical tests were carried out to obtain the stress–strain characteristics. For the mechanical characterization of both walls, six tensile specimens were extracted in the vertical direction and six tensile specimens in the horizontal direction. Furthermore, samples from each wall were utilized to analyze the surface quality based on the macrography analysis. Therefore, the selection of specimens at different orientations on the wall was performed. The dimensions of the tensile specimens followed standard ISO 6892-1, with a narrow diameter of 4 mm and a length of 22 mm, with threads at the ends of M-6. The machine where the uniaxial tensile tests were performed at room temperature was the Instron 5585H with a maximum load of 100 kN and equipped with a contact extensometer (Instron EX2620-602).
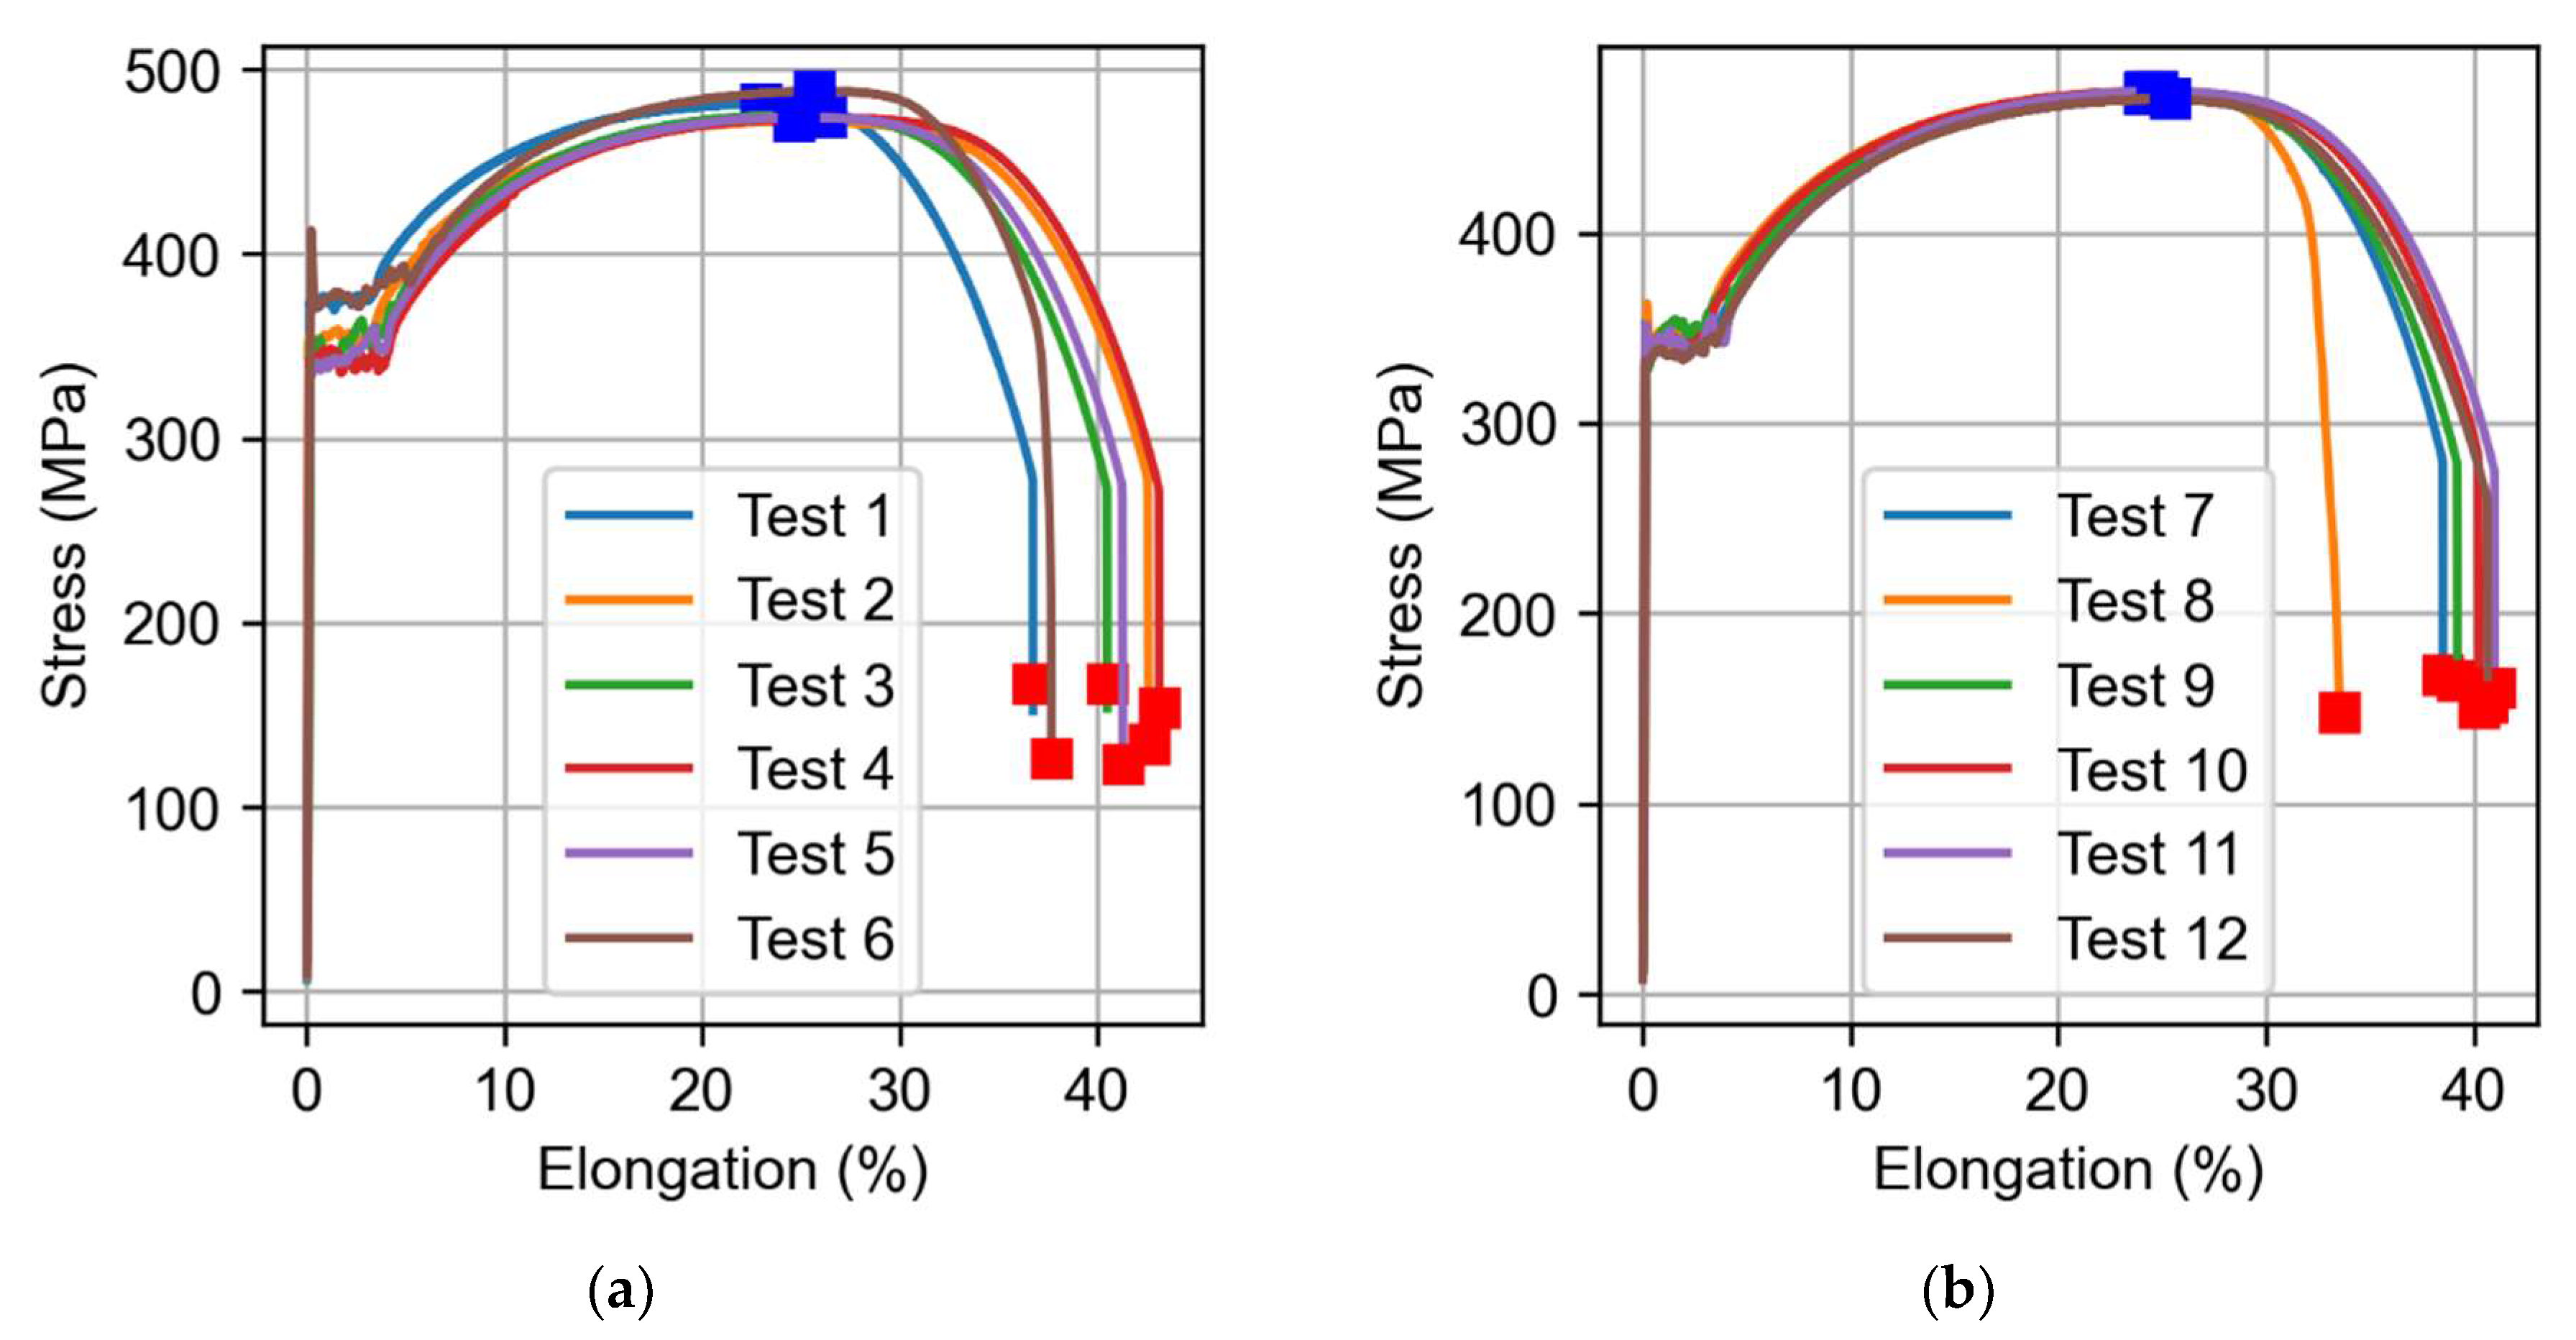
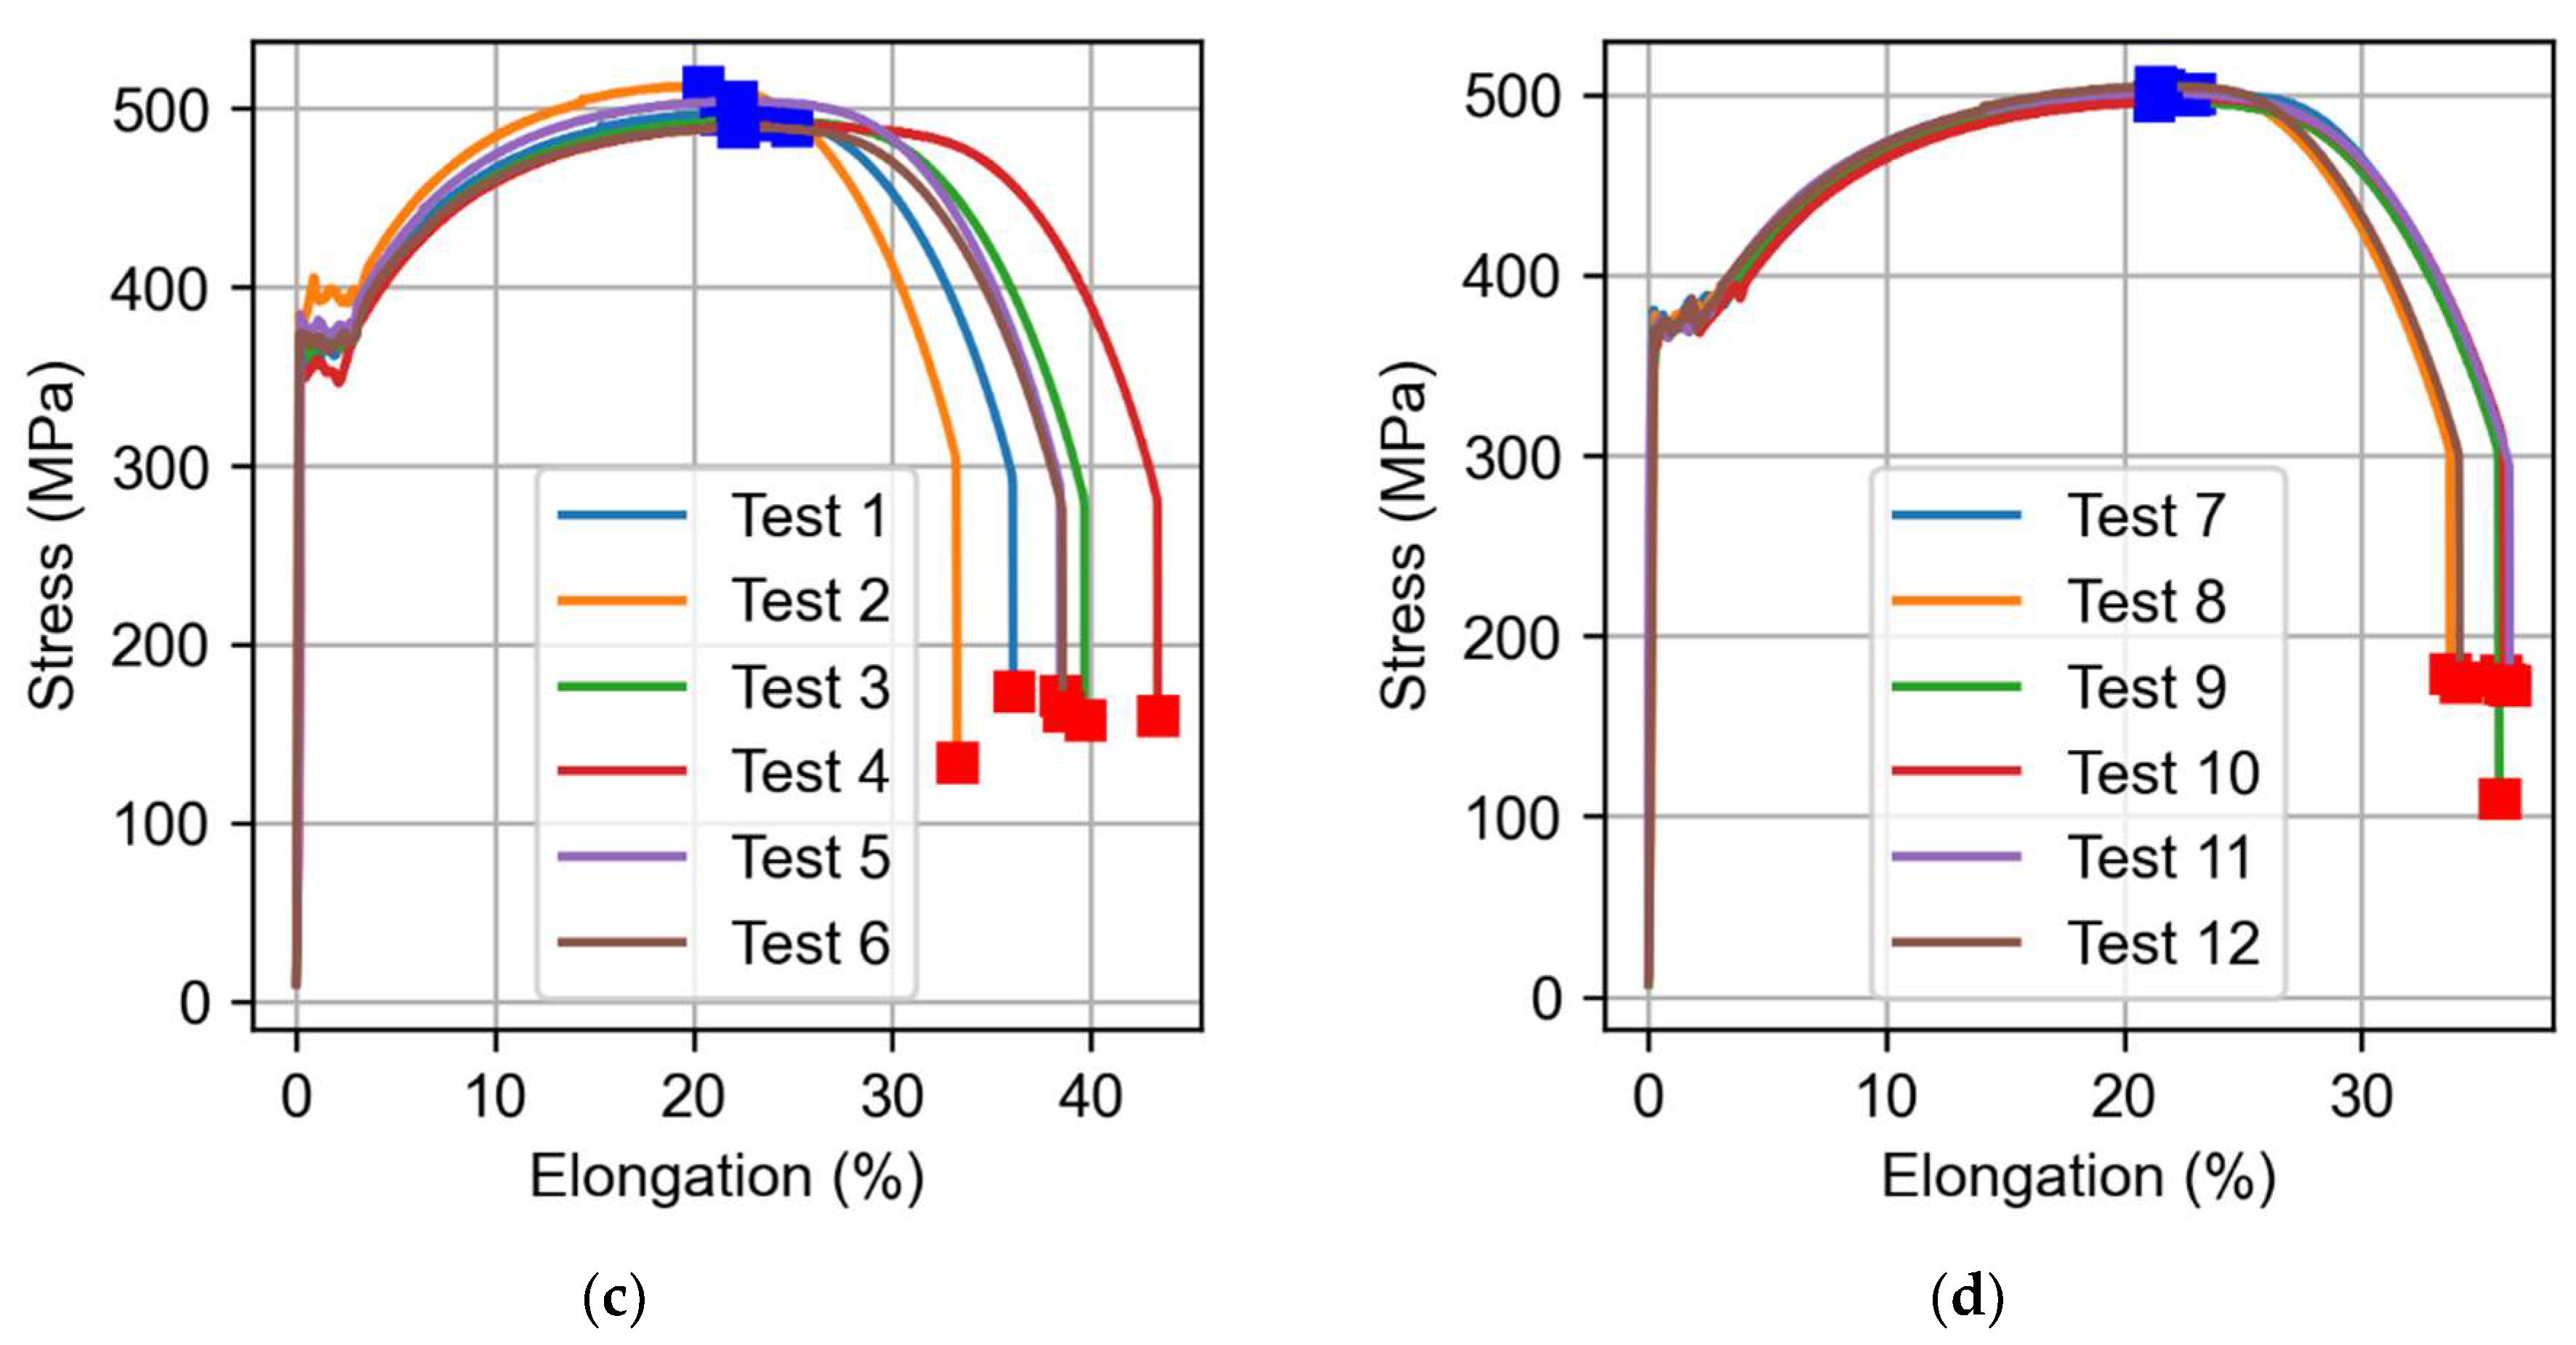
Figure 11 displays the stress–strain curves and the corresponding calculations of ultimate tensile strength (UTS), yield strength (YS) and elongation percentage (Elong.) for each test specimen. The figure is divided into four subplots: overlapped horizontal direction (
Figure 11a), overlapped vertical direction (
Figure 11b), oscillating horizontal direction (
Figure 11c) and oscillating vertical direction (
Figure 11d). In each subplot, the stress–strain curve is depicted, showing the relationship between applied stress and resulting strain for the respective test specimen. Additionally, the UTS, YS and elongation values were calculated and are presented for each specimen.
Figure 11 provides the results of the tensile test for the overlapped and oscillated walls, including the ultimate tensile strength (UTS), yield strength (YS) at 0.2% offset and elongation. For the overlapped wall, in the horizontal direction, the average UTS is 498 MPa with a standard deviation of 9 MPa. The average YS is 368 MPa with a standard deviation of 12 MPa. The average elongation is 36% with a standard deviation of 4%. In the vertical direction, the average UTS is 501 MPa with a standard deviation of 3 MPa. The average YS is 368 MPa with a standard deviation of 4 MPa. The average elongation is 32% with a standard deviation of 1%. For the oscillated wall, in the horizontal direction, the average UTS is 478 MPa with a standard deviation of 6 MPa. The average YS is 354 MPa with a standard deviation of 13 MPa. The average elongation is 38% with a standard deviation of 3%. In the vertical direction, the average UTS is 474 MPa with a standard deviation of 1 MPa. The average YS is 338 MPa with a standard deviation of 4 MPa. The average elongation is 36% with a standard deviation of 2%. Comparing the results, it can be observed that the overlapped wall generally exhibits slightly higher UTS and YS values compared to the oscillated wall. However, the differences are relatively small. In terms of elongation, the oscillated wall shows slightly higher values compared to the overlapped wall. It is important to note that the ER70 as a welded reference material has a UTS range of 500–640 MPa, a YS greater than 420 MPa and a hardness value of 28 HV. These values provide a benchmark for the mechanical properties of the welded material. Overall, the results suggest that both the overlapped and oscillated walls exhibit similar mechanical behaviour, with slightly higher strength values observed in the overlapped wall. In
Table 4, the results of the conducted mechanical tests are presented, along with a summary of the average results obtained for yield strength (YS), elongation and ultimate tensile strength (UTS).
Table 4 displays the measurement results for each sample.
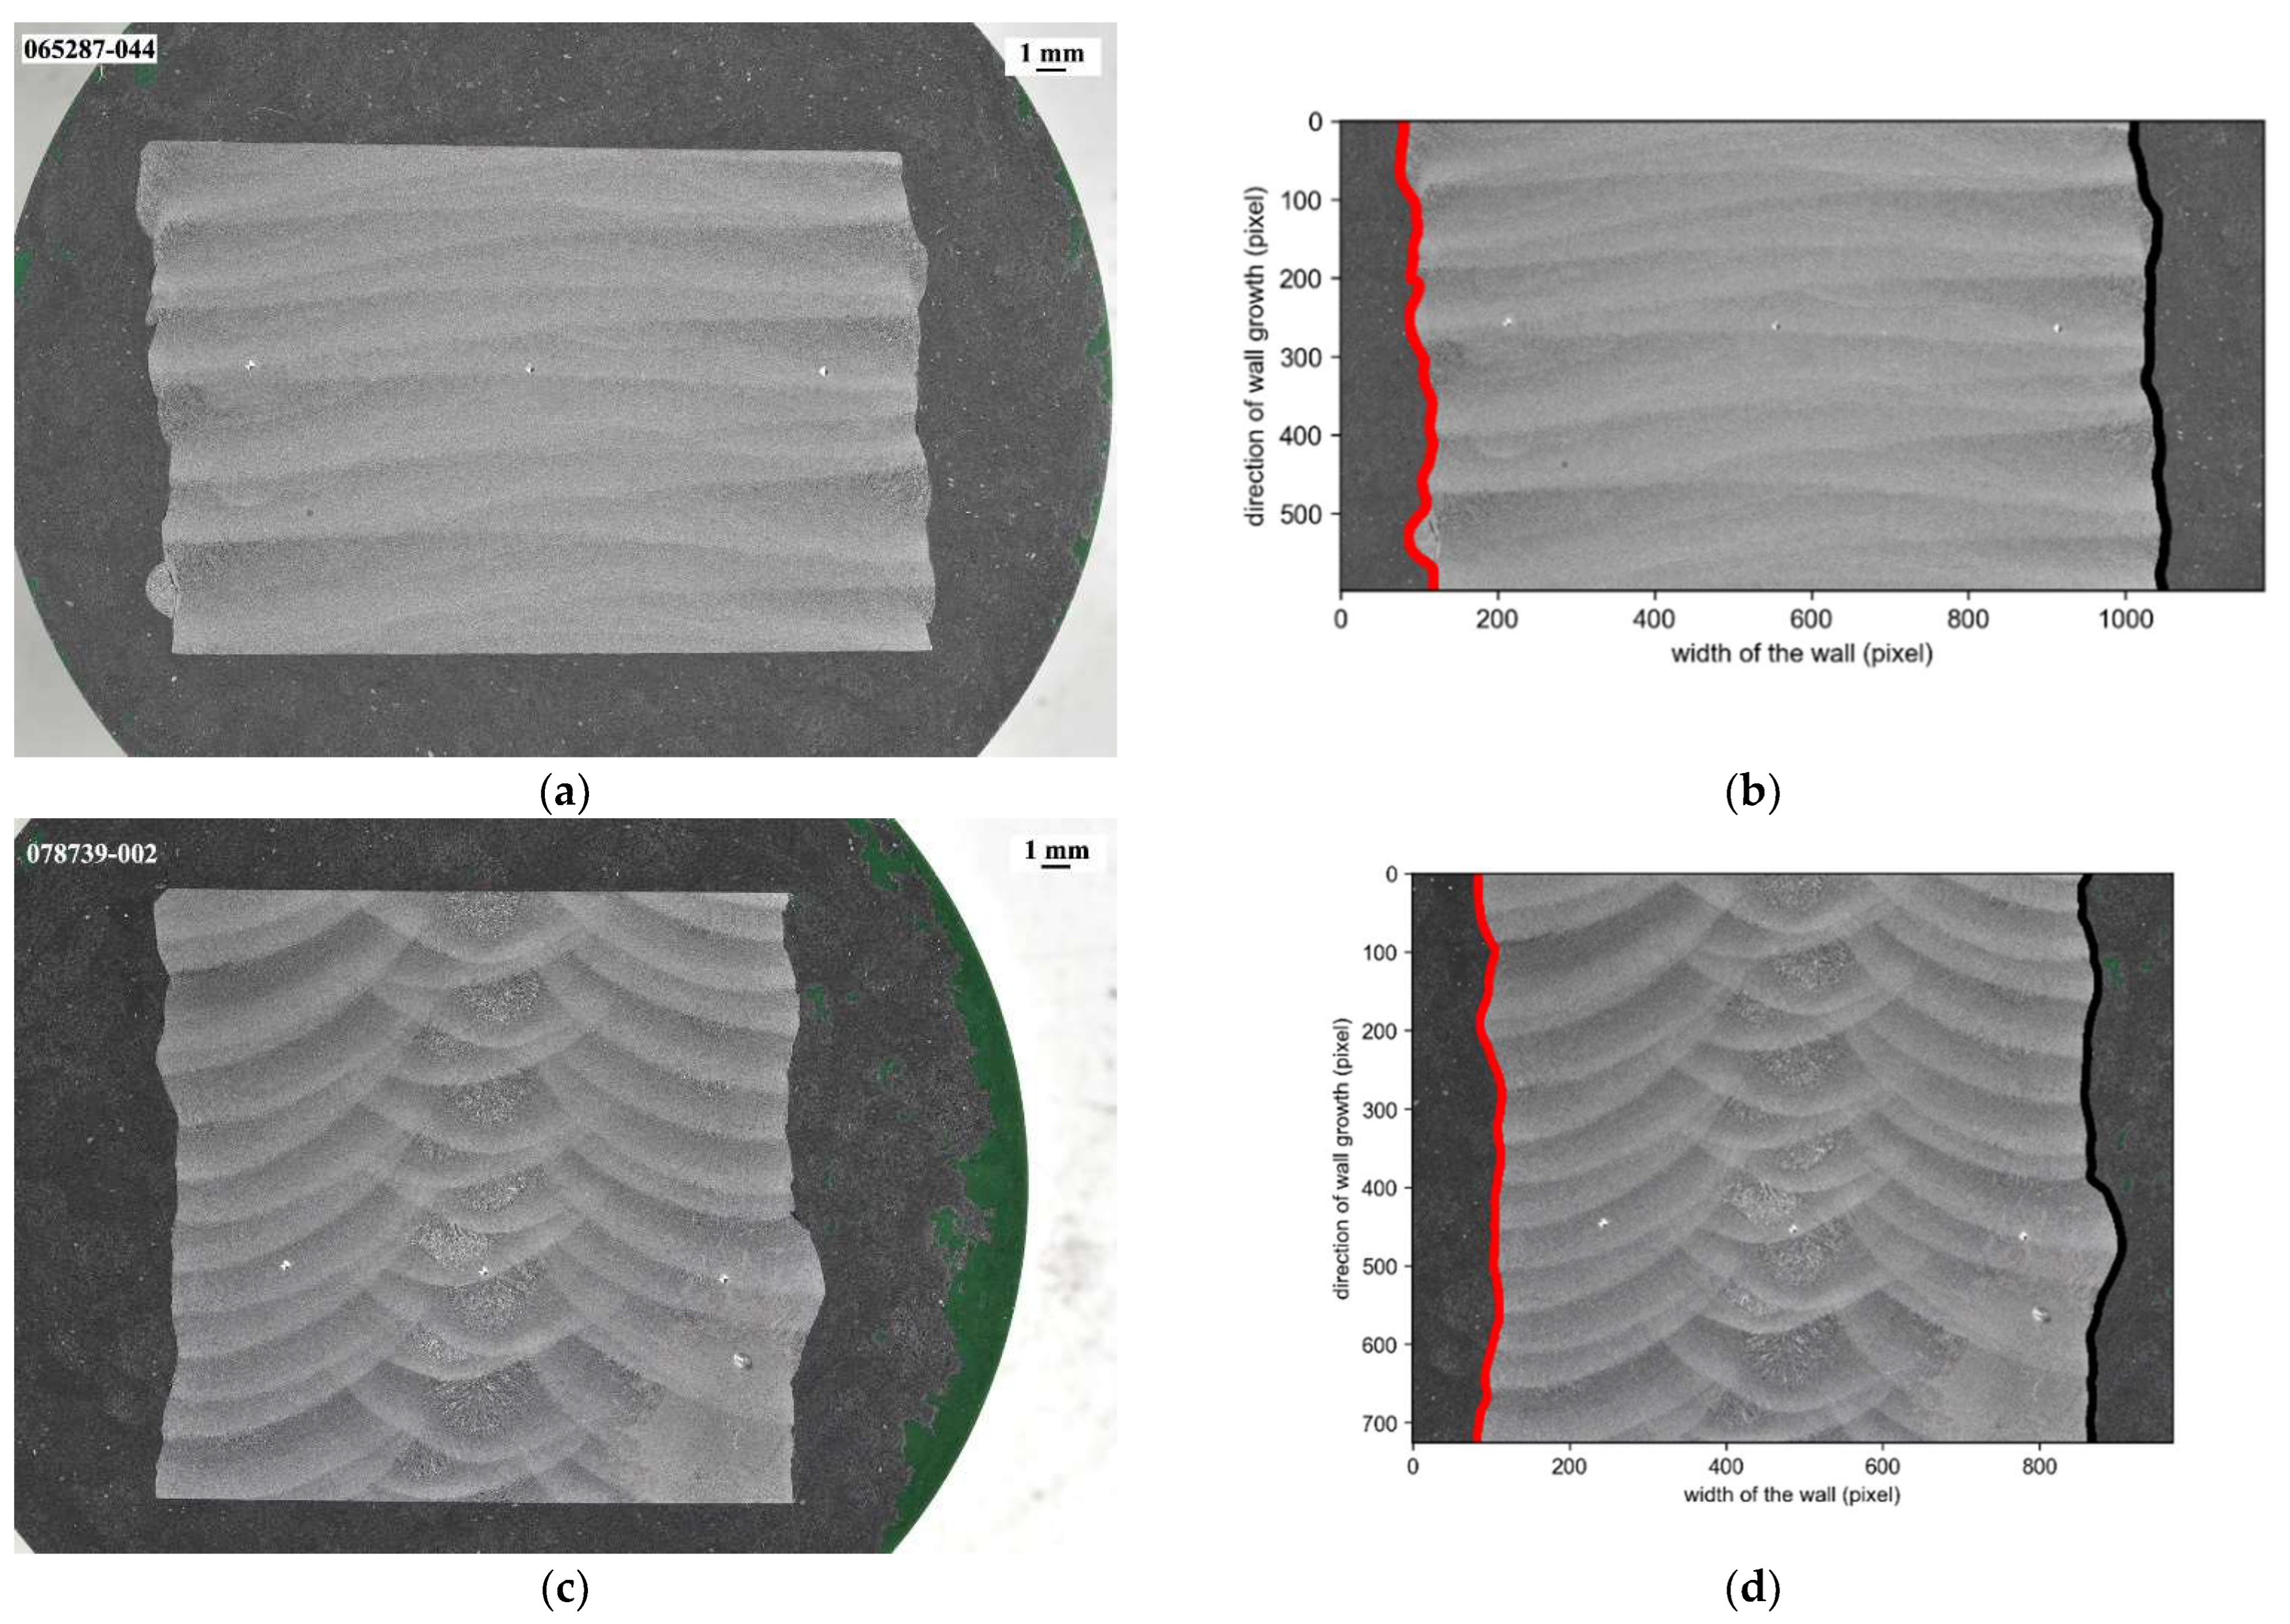
As for the analysis of the quality of the finished surface, in the case of the walls manufactured using direct energy deposition with wire and arc, the profile is very wavy, so it is more common to analyze the profile rather than the surface. Therefore, in this section, we will analyze the topology of the fabricated wall by means of macrographic image analysis. To analyze the surface, metallographic samples were extracted using conventional milling from the inner surface of the additive manufactured walls. Then, the specimens were mechanically polished and finally etched with a solution of 2% Nital—nitric and ethanol acid—to reveal the grain structure. In addition, hardness testing (Vickers hardness) was performed on the same samples at room temperature using a Struers Duramin A-300 machine. In terms of grain distribution, wire arc additive manufacturing shows anisotropy on the macrographic structure (disposition on the wall inner surface) due to the adding of material layer by layer, as shown in
Figure 12a,c. The arrangement of the layers is different in the case of the oscillatory and overlapping strategies. The presence of interlayer boundaries in the case of oscillation is observed as each layer is formed by a single bead, and in the case of the three overlapping beads that form each layer, interbead boundaries are noticed. The existence of an interface between the overlapping weld pass means that there is less continuity inside the wall. The edges of the wall were determined through an analysis of the image after it was transformed into black and white (
Figure 12b,d). The process involved applying a Gaussian filter and conducting an illuminance study, following the methodology outlined by Gil-Del-Val et al. [
33].
Figure 13 illustrates the surface profile obtained through image analysis, showcasing the variations observed in different conditions. The profiles are presented for both the left and right sides, considering oscillating and overlapping path strategies. This analysis provides insights into the geometric characteristics of the surface and aids in understanding the effects of different strategies on the profile properties. Additionally,
Table 5 presents the measurement results of various parameters related to the profile height and deviations for each strategy.
The maximum profile peak height (Wp) for the overlapping left strategy is 0.490, while for the overlapping right strategy, it is slightly higher at 0.957. Similarly, the oscillating left strategy has a maximum peak height of 0.641, while the oscillating right strategy has a slightly lower value of 0.471. In terms of valley depths (Wvs), both the overlapping left and overlapping right strategies exhibit significant irregularities, with values of −0.371 and −0.487, respectively. Similarly, the oscillating left and oscillating right strategies both show substantial valley depths, with values of −0.553 and −0.712, respectively.
The total height of the profile (Wt) for the overlapping left strategy is −0.132, indicating a decrease in surface height. In contrast, the overlapping right strategy has a positive value of 0.0418, indicating a slight increase in surface height. For the oscillating left and oscillating right strategies, the total height of the profile is −0.227 and 0.177, respectively, reflecting similar trends. The maximum height of the profile (Wz) for the overlapping strategies is higher, with the overlapping right strategy reaching 1.444 and the overlapping left strategy reaching 0.861. The oscillating strategies have comparable maximum height values, with the oscillating left strategy at 1.194 and the oscillating right strategy at 1.183. Considering the roughness characteristics, the arithmetical mean deviation (Wa) and root mean square deviation (Wq), the differences between the strategies are not substantial. The overlapping right strategy has slightly higher values compared to the overlapping left strategy, and similarly, the oscillating right strategy has slightly higher values compared to the oscillating left strategy. However, the differences in these values are relatively small.
5. Conclusions
This paper first presents the symmetry analysis for a preliminary test where different deposition conditions for the zero layer were tested. Using these parameters, walls with oscillating and overlapping strategies were fabricated. This paper covers the study using direct energy deposition using wire and arc with mild steel of the ER70 designation commonly used in industry. Some of the conclusions reached are as follows:
When assessing the symmetry and skewness of the preliminary manufactured zero beads, the test that demonstrates a symmetry coefficient (S) closest to 1 and a skewness coefficient (s) closest to 0 is considered the most desirable. Among the tests conducted, Test #10 (WFR = 10 m/min and TS = 30 cm/min) exhibits the highest symmetry coefficient with a value of 0.997, indicating a significantly high level of symmetry in the manufactured beads. On the other hand, Test #8 (WFR = 8 m/min and TS = 65 cm/min) demonstrates a slightly lower skewness coefficient of 0.269;
Both the bead and the walls manufactured using the direct deposition of energy with wire and arc are eminently symmetrical structures. It is very noticeable that as far as the symmetry coefficient is concerned, values lower than 0.9 were not found;
Two symmetry coefficients were used, one based on the value of the function in relation to the center of mass and the other based on the calculation of the moments, more typical of the skewness concept;
In conclusion, the tensile test results for the overlapped and oscillated walls indicate that both strategies exhibit similar mechanical behavior. The overlapped wall generally shows slightly higher ultimate tensile strength (UTS) and yield strength (YS) values compared to the oscillated wall. However, these differences are relatively small. On the other hand, the oscillated wall tends to exhibit slightly higher elongation values compared to the overlapped wall. It is worth noting that the mechanical properties of the welded material, represented by ER70 as the welded reference material, provide a benchmark for comparison. Overall, the results suggest that both strategies result in comparable mechanical performance, with slightly higher strength values observed in the overlapped wall;
When comparing the oscillating and overlapping strategies in terms of the surface analysis, the differences in the arithmetical mean deviation of waviness (Wa) and root mean square deviation of the waviness (Wq) are relatively small. Overall, while there are subtle variations, the disparities between the oscillating and overlapping strategies are not significant, suggesting similar geometric characteristics in the surface profiles obtained from both approaches;
This paper provides important insights into the effects of different welding strategies on the symmetry and skewness of manufactured beads. The oscillatory strategy produces better results in terms of symmetry compared to the overlapping strategy, which results in a lower symmetry coefficient.
This research makes several contributions to the field of direct energy deposition (DED) in additive manufacturing. Firstly, it enhances the understanding of the DED process, specifically in wire and arc additive manufacturing (WAAM) using mild steel. Secondly, it provides guidance for optimizing deposition conditions by evaluating different parameters and identifying the ones that yield higher symmetry coefficients and lower skewness coefficients. Additionally, the study introduces and validates symmetry coefficients based on the function’s value relative to the center of mass and moment calculations, providing a quantitative framework for assessing symmetry and skewness. Lastly, it compares the effects of different welding strategies and demonstrates that the oscillatory strategy produces higher symmetry coefficients, offering valuable insights for selecting welding strategies that improve symmetry and overall quality in DED processes.
The presented algorithm that calculates the center of a wall and its symmetry based on profile measurements online could have a wide range of potential applications in various industries. Overall, the potential applications of an algorithm that can accurately describe the center of a wall and its symmetry based on profile measurements online are numerous and could have significant impacts across a wide range of industries. Expanding this research to other materials would indeed be a promising future direction. While the current study focuses on mild steel in direct energy deposition (DED), exploring the effects of weave path parameters on the geometry of additive manufactured features in various materials could provide valuable insights and extend the applicability of the findings.


 ,
, 


