
Coastal Wetland Restoration Strategies Based on Ecosystem Service Changes: A Case Study of the South Bank of Hangzhou Bay


Abstract
:1. Introduction
2. Literature Review
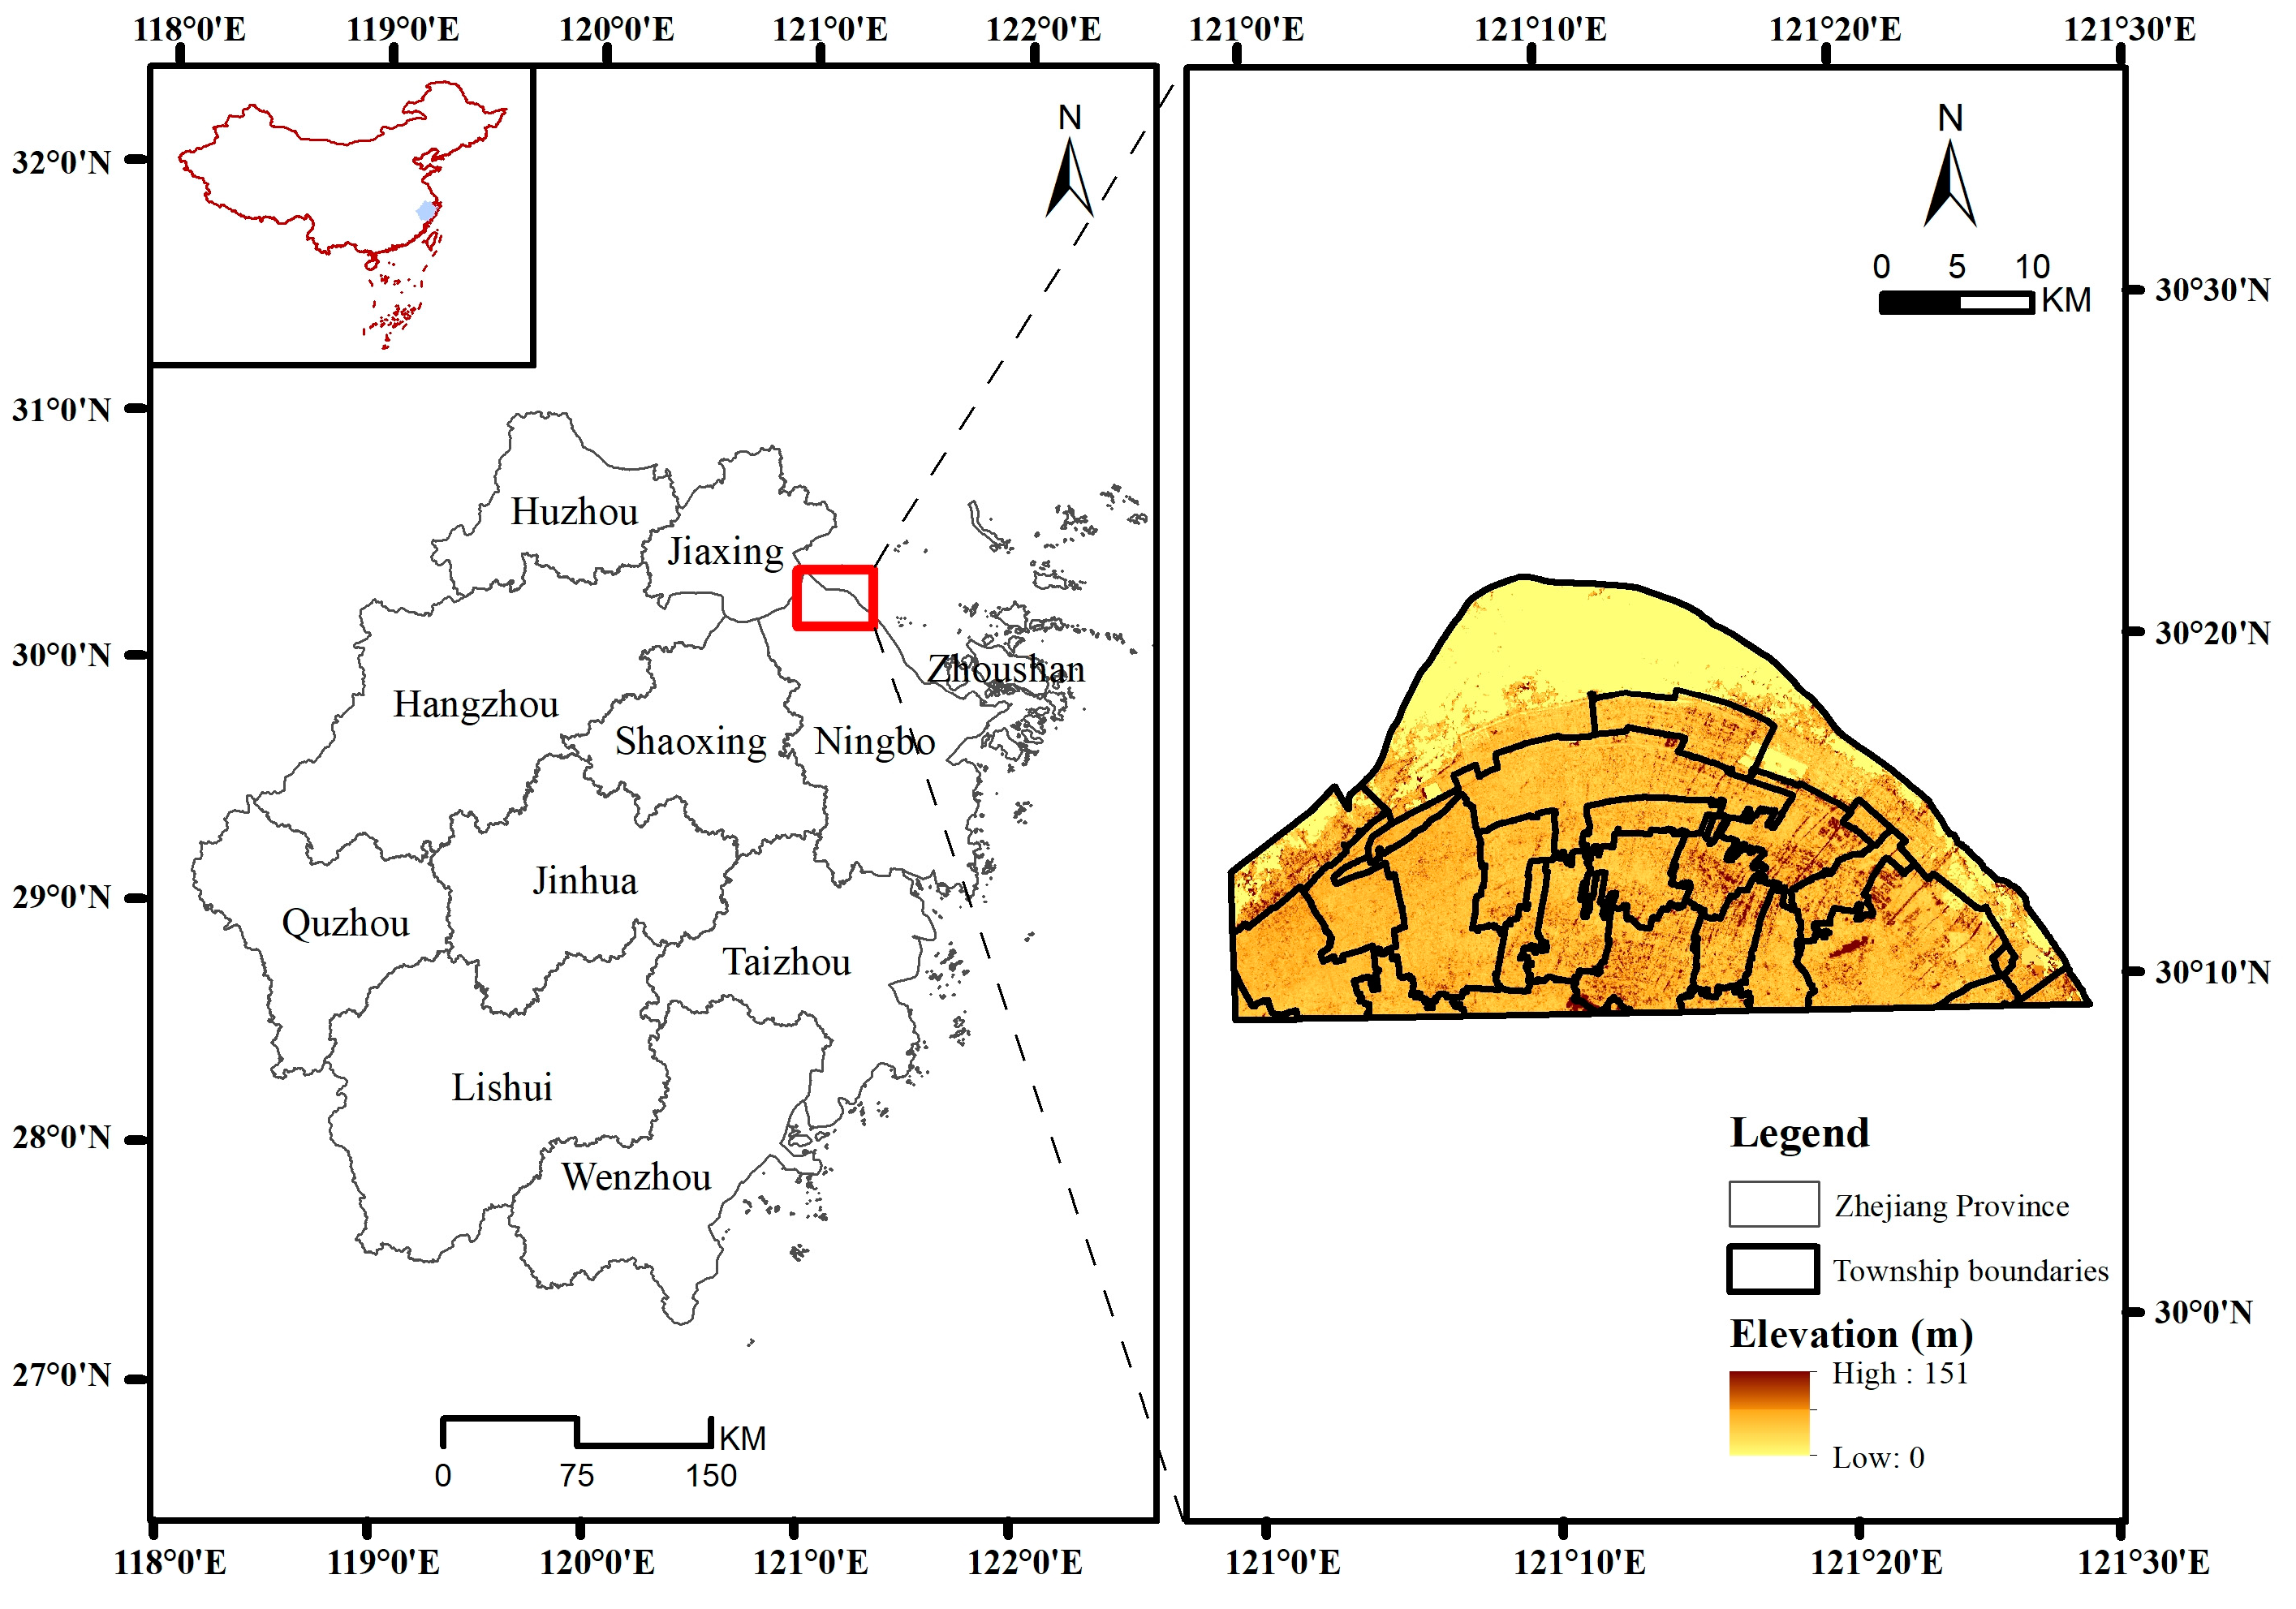
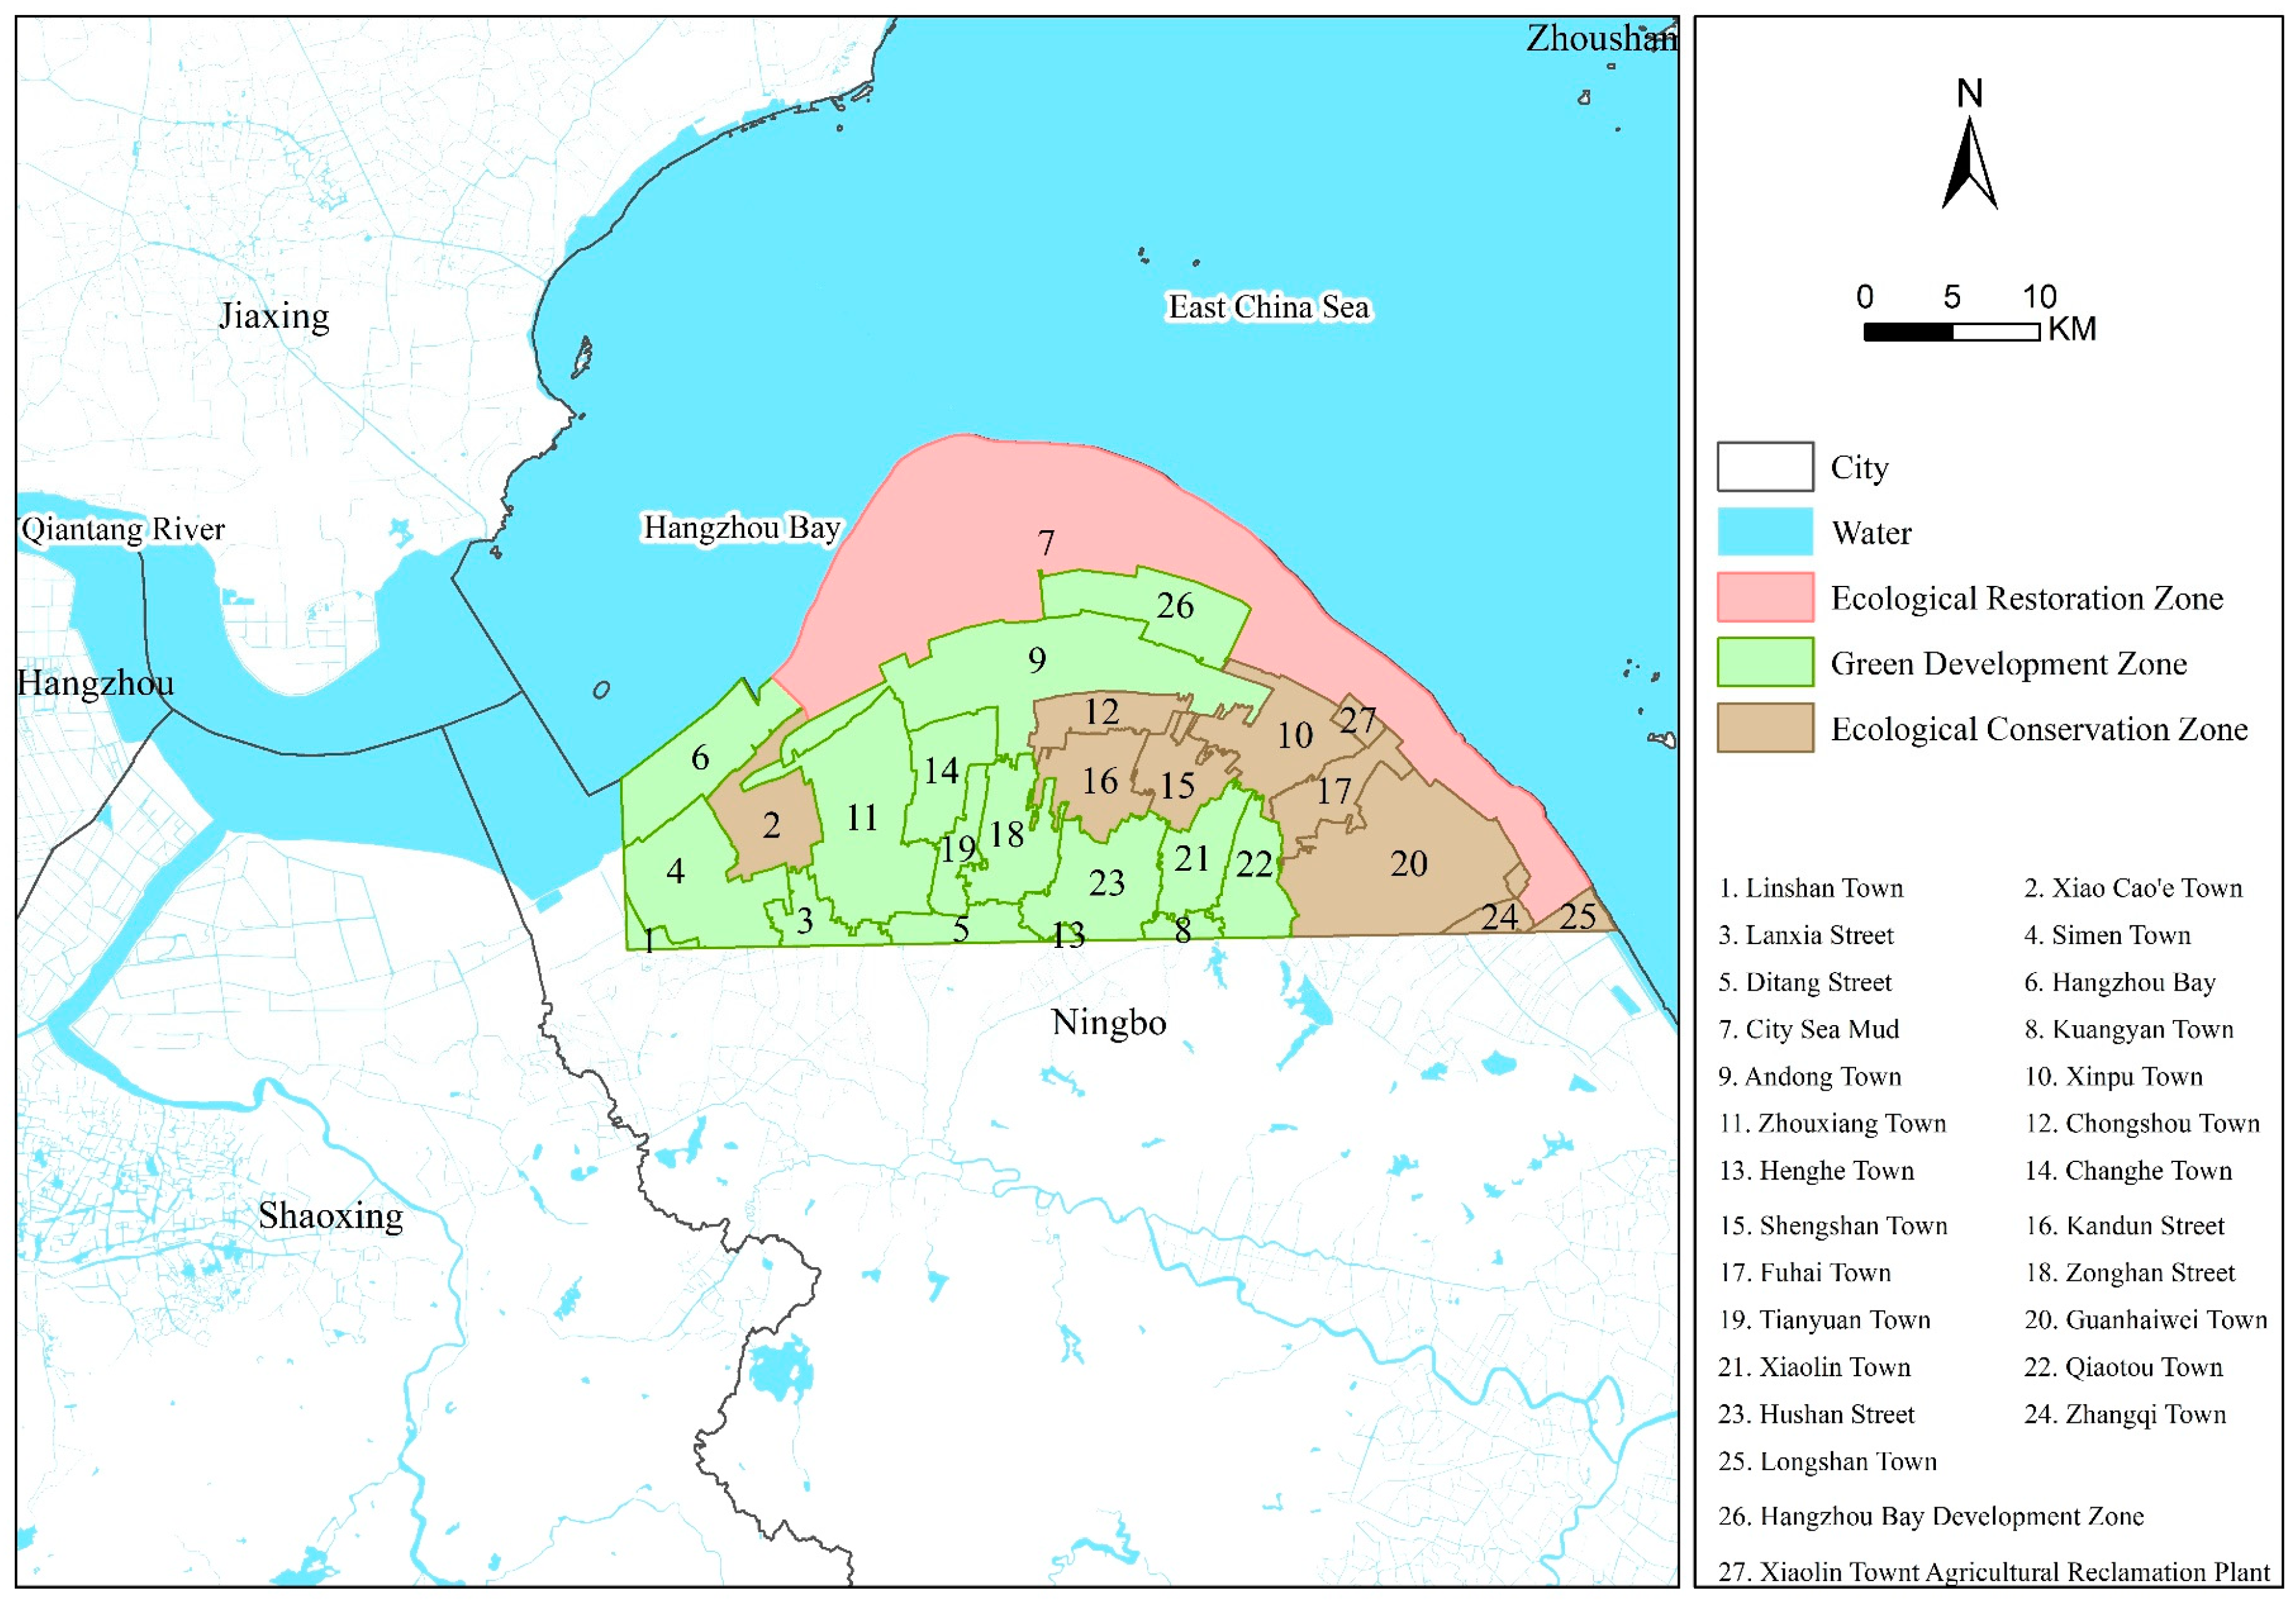
3. Study Area
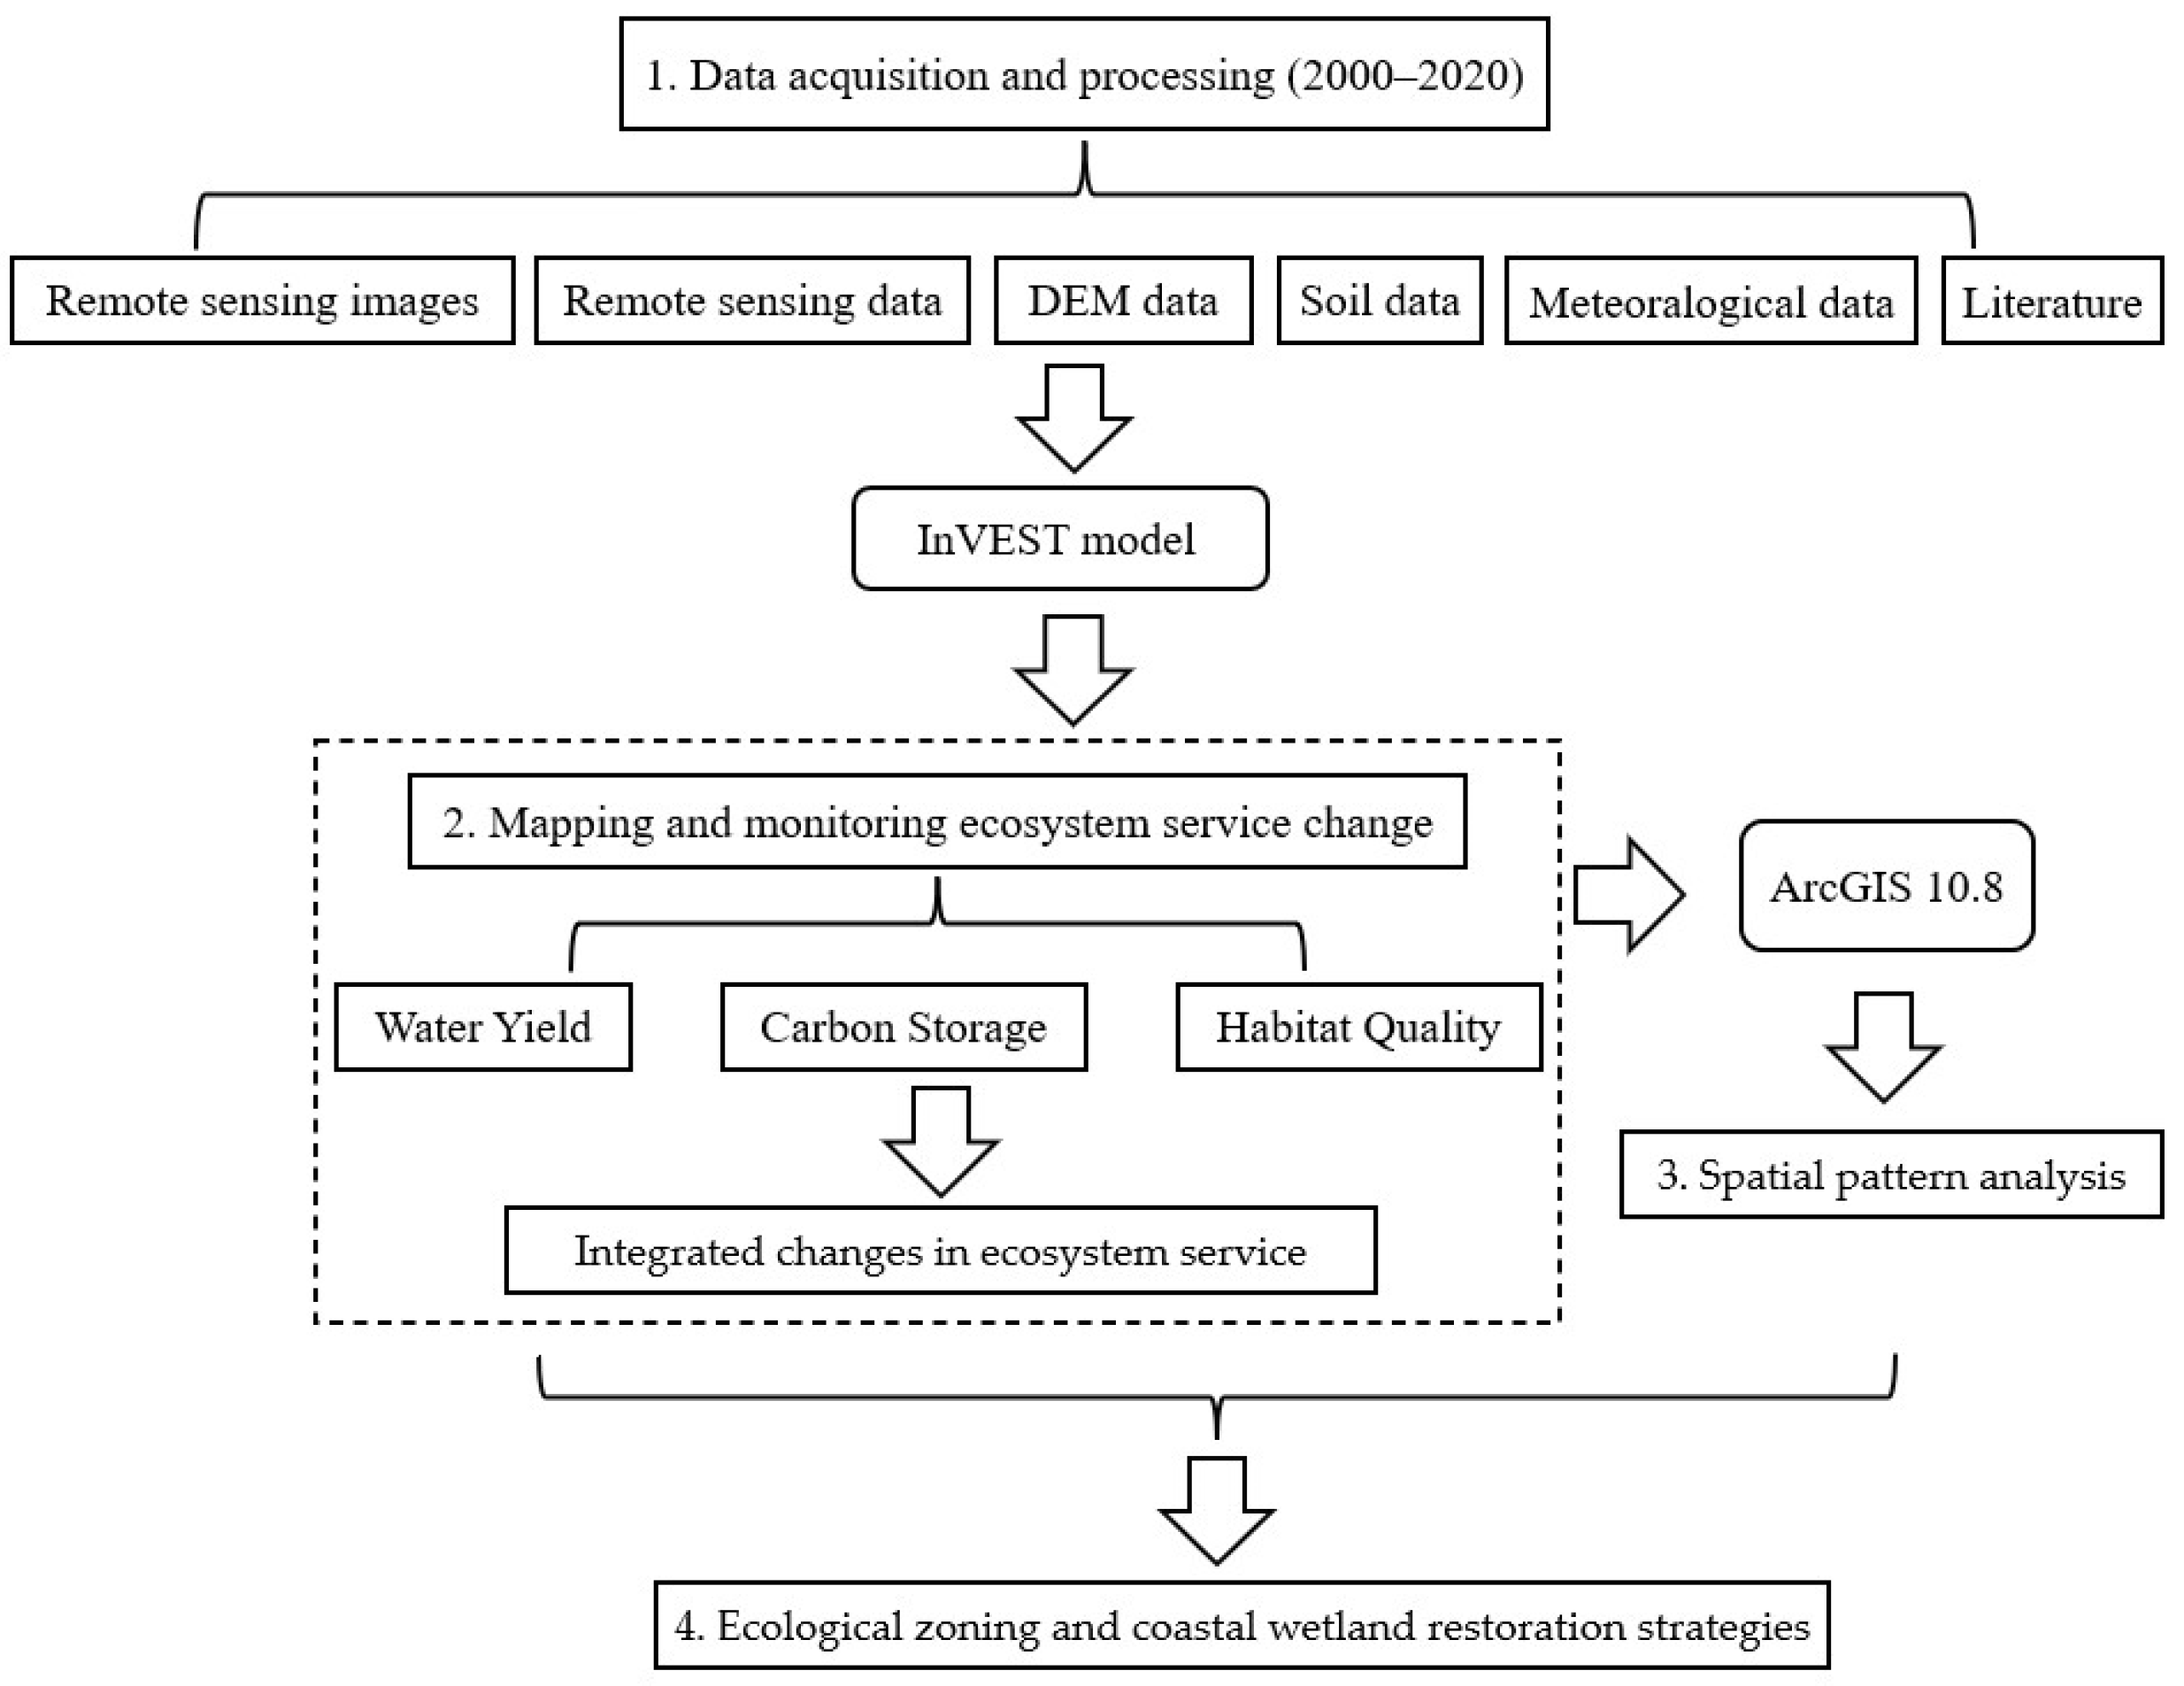
4. Materials and Methods
4.1. Materials
4.2. Methods
4.2.1. Indicator Selection
4.2.2. Water Yield
4.2.3. Carbon Storage
4.2.4. Habitat Quality
4.2.5. Hotspot Analysis
5. Results
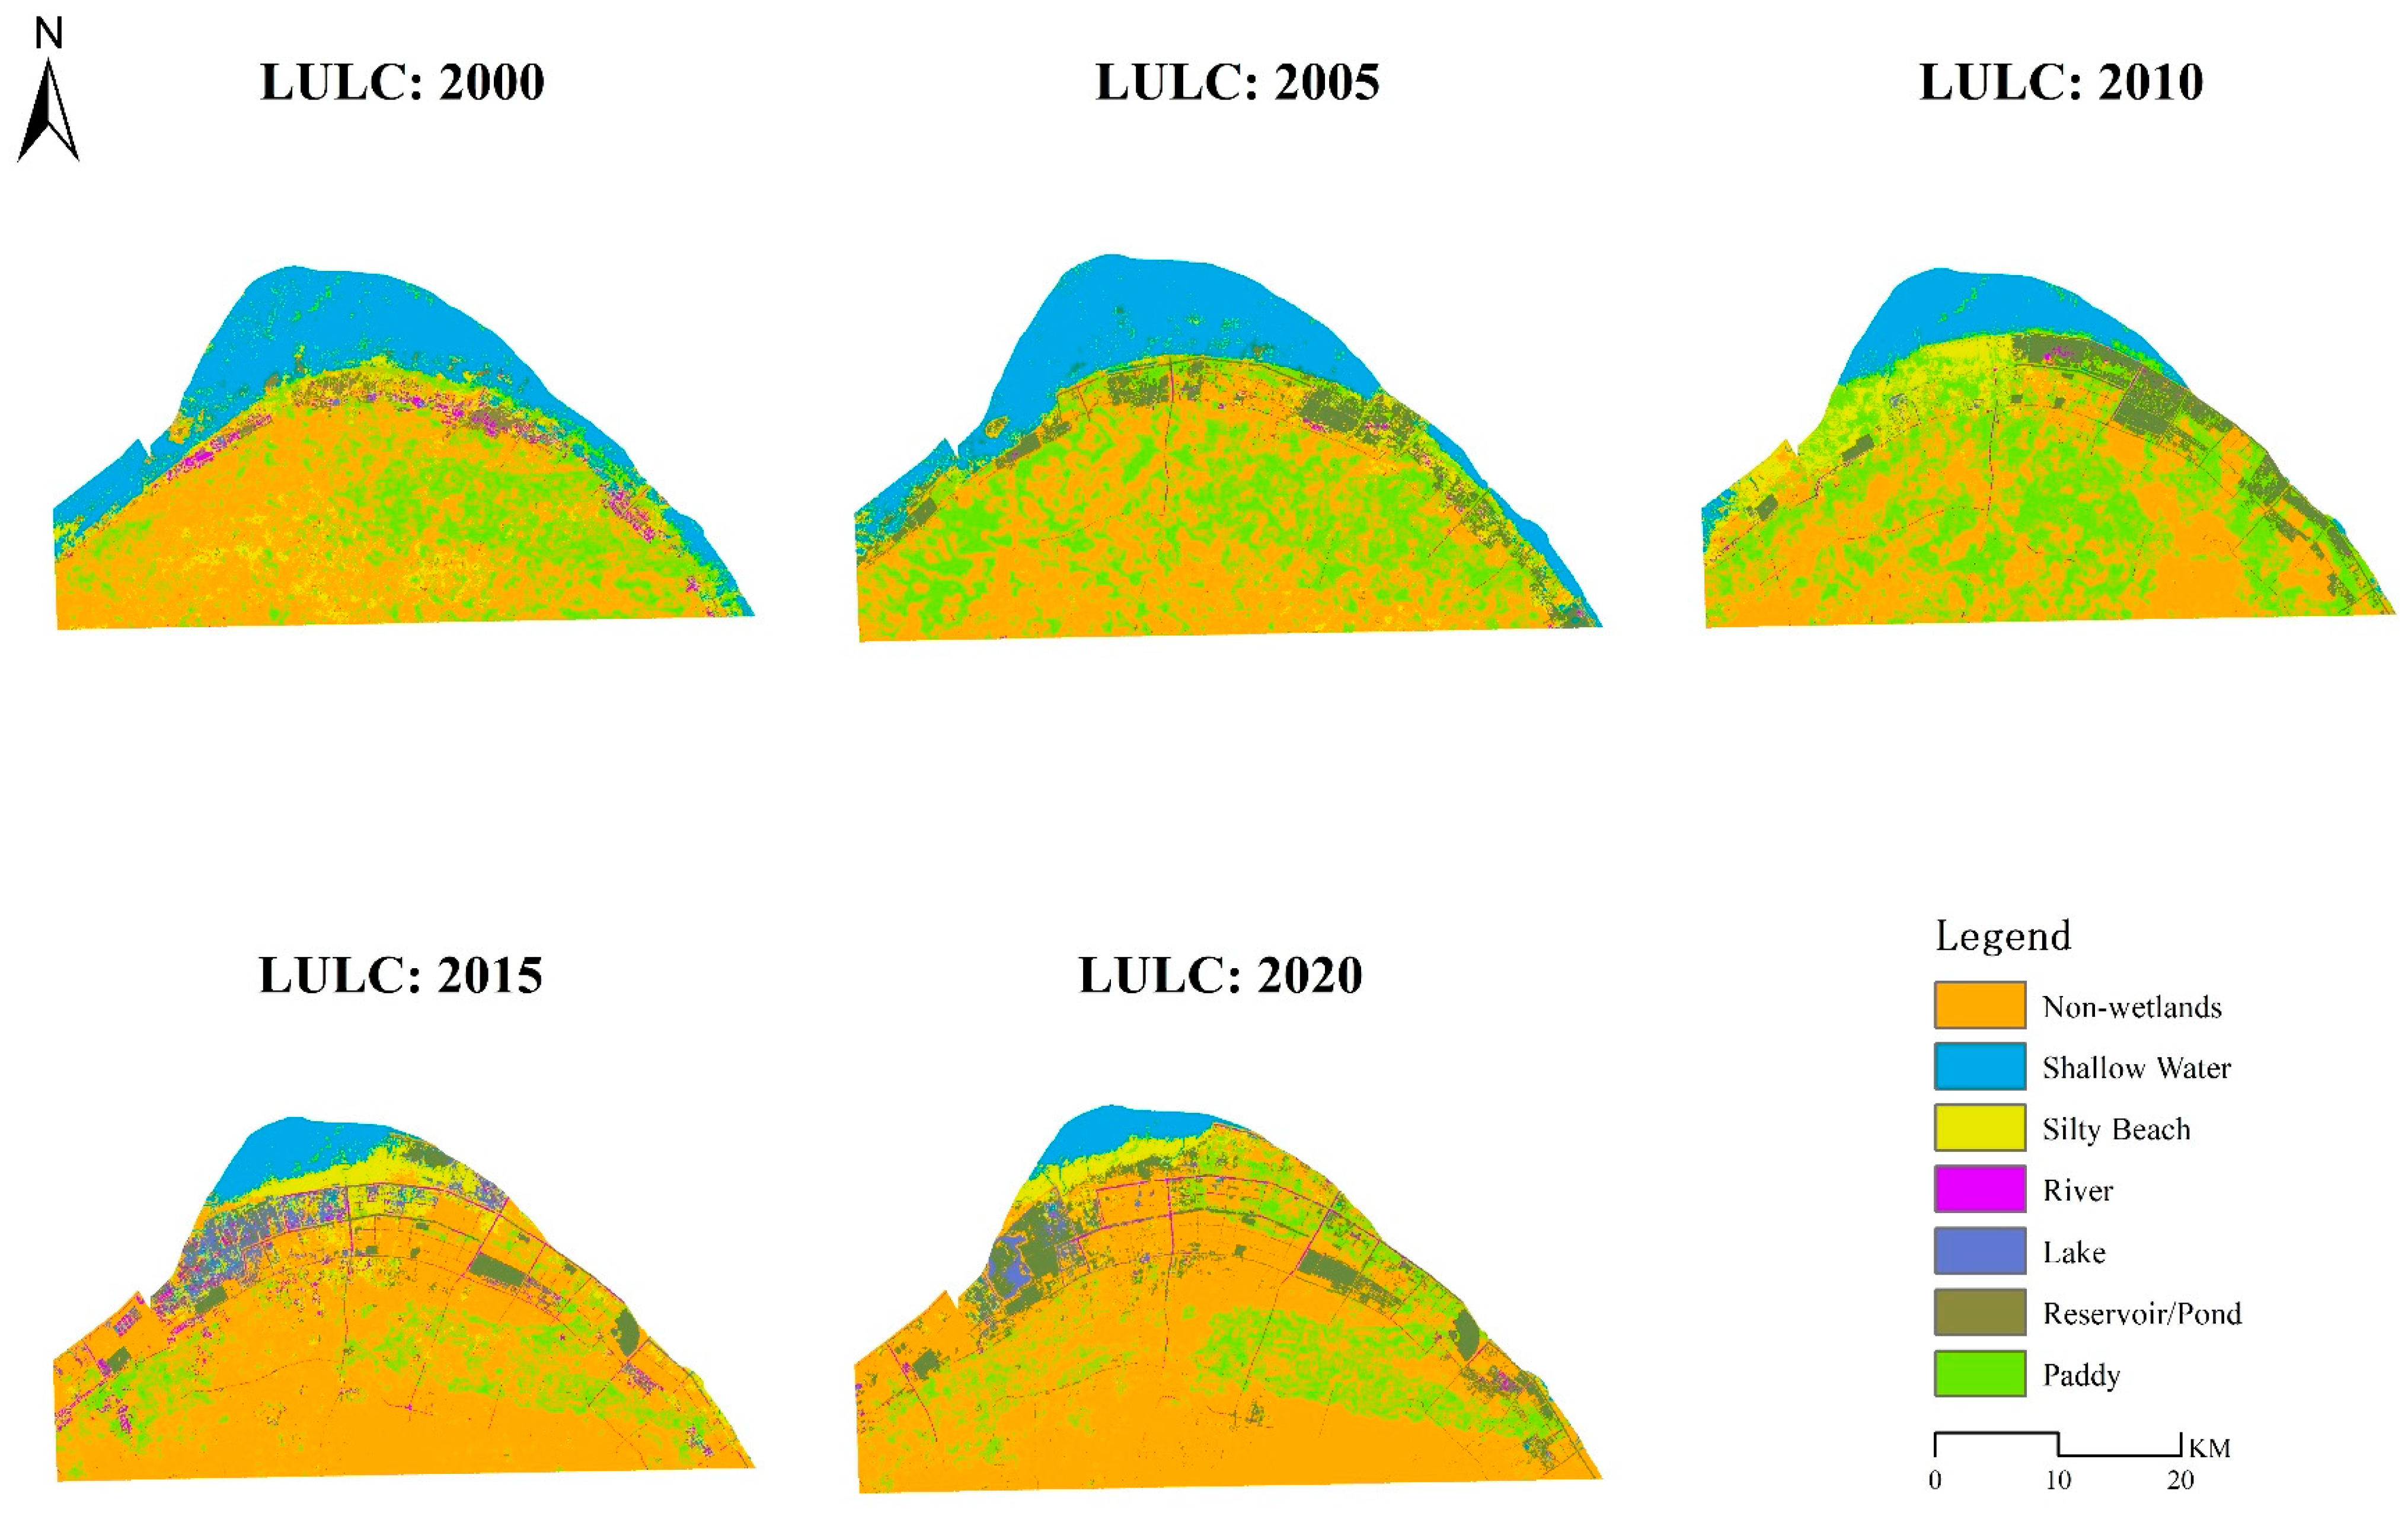
5.1. LULC Change
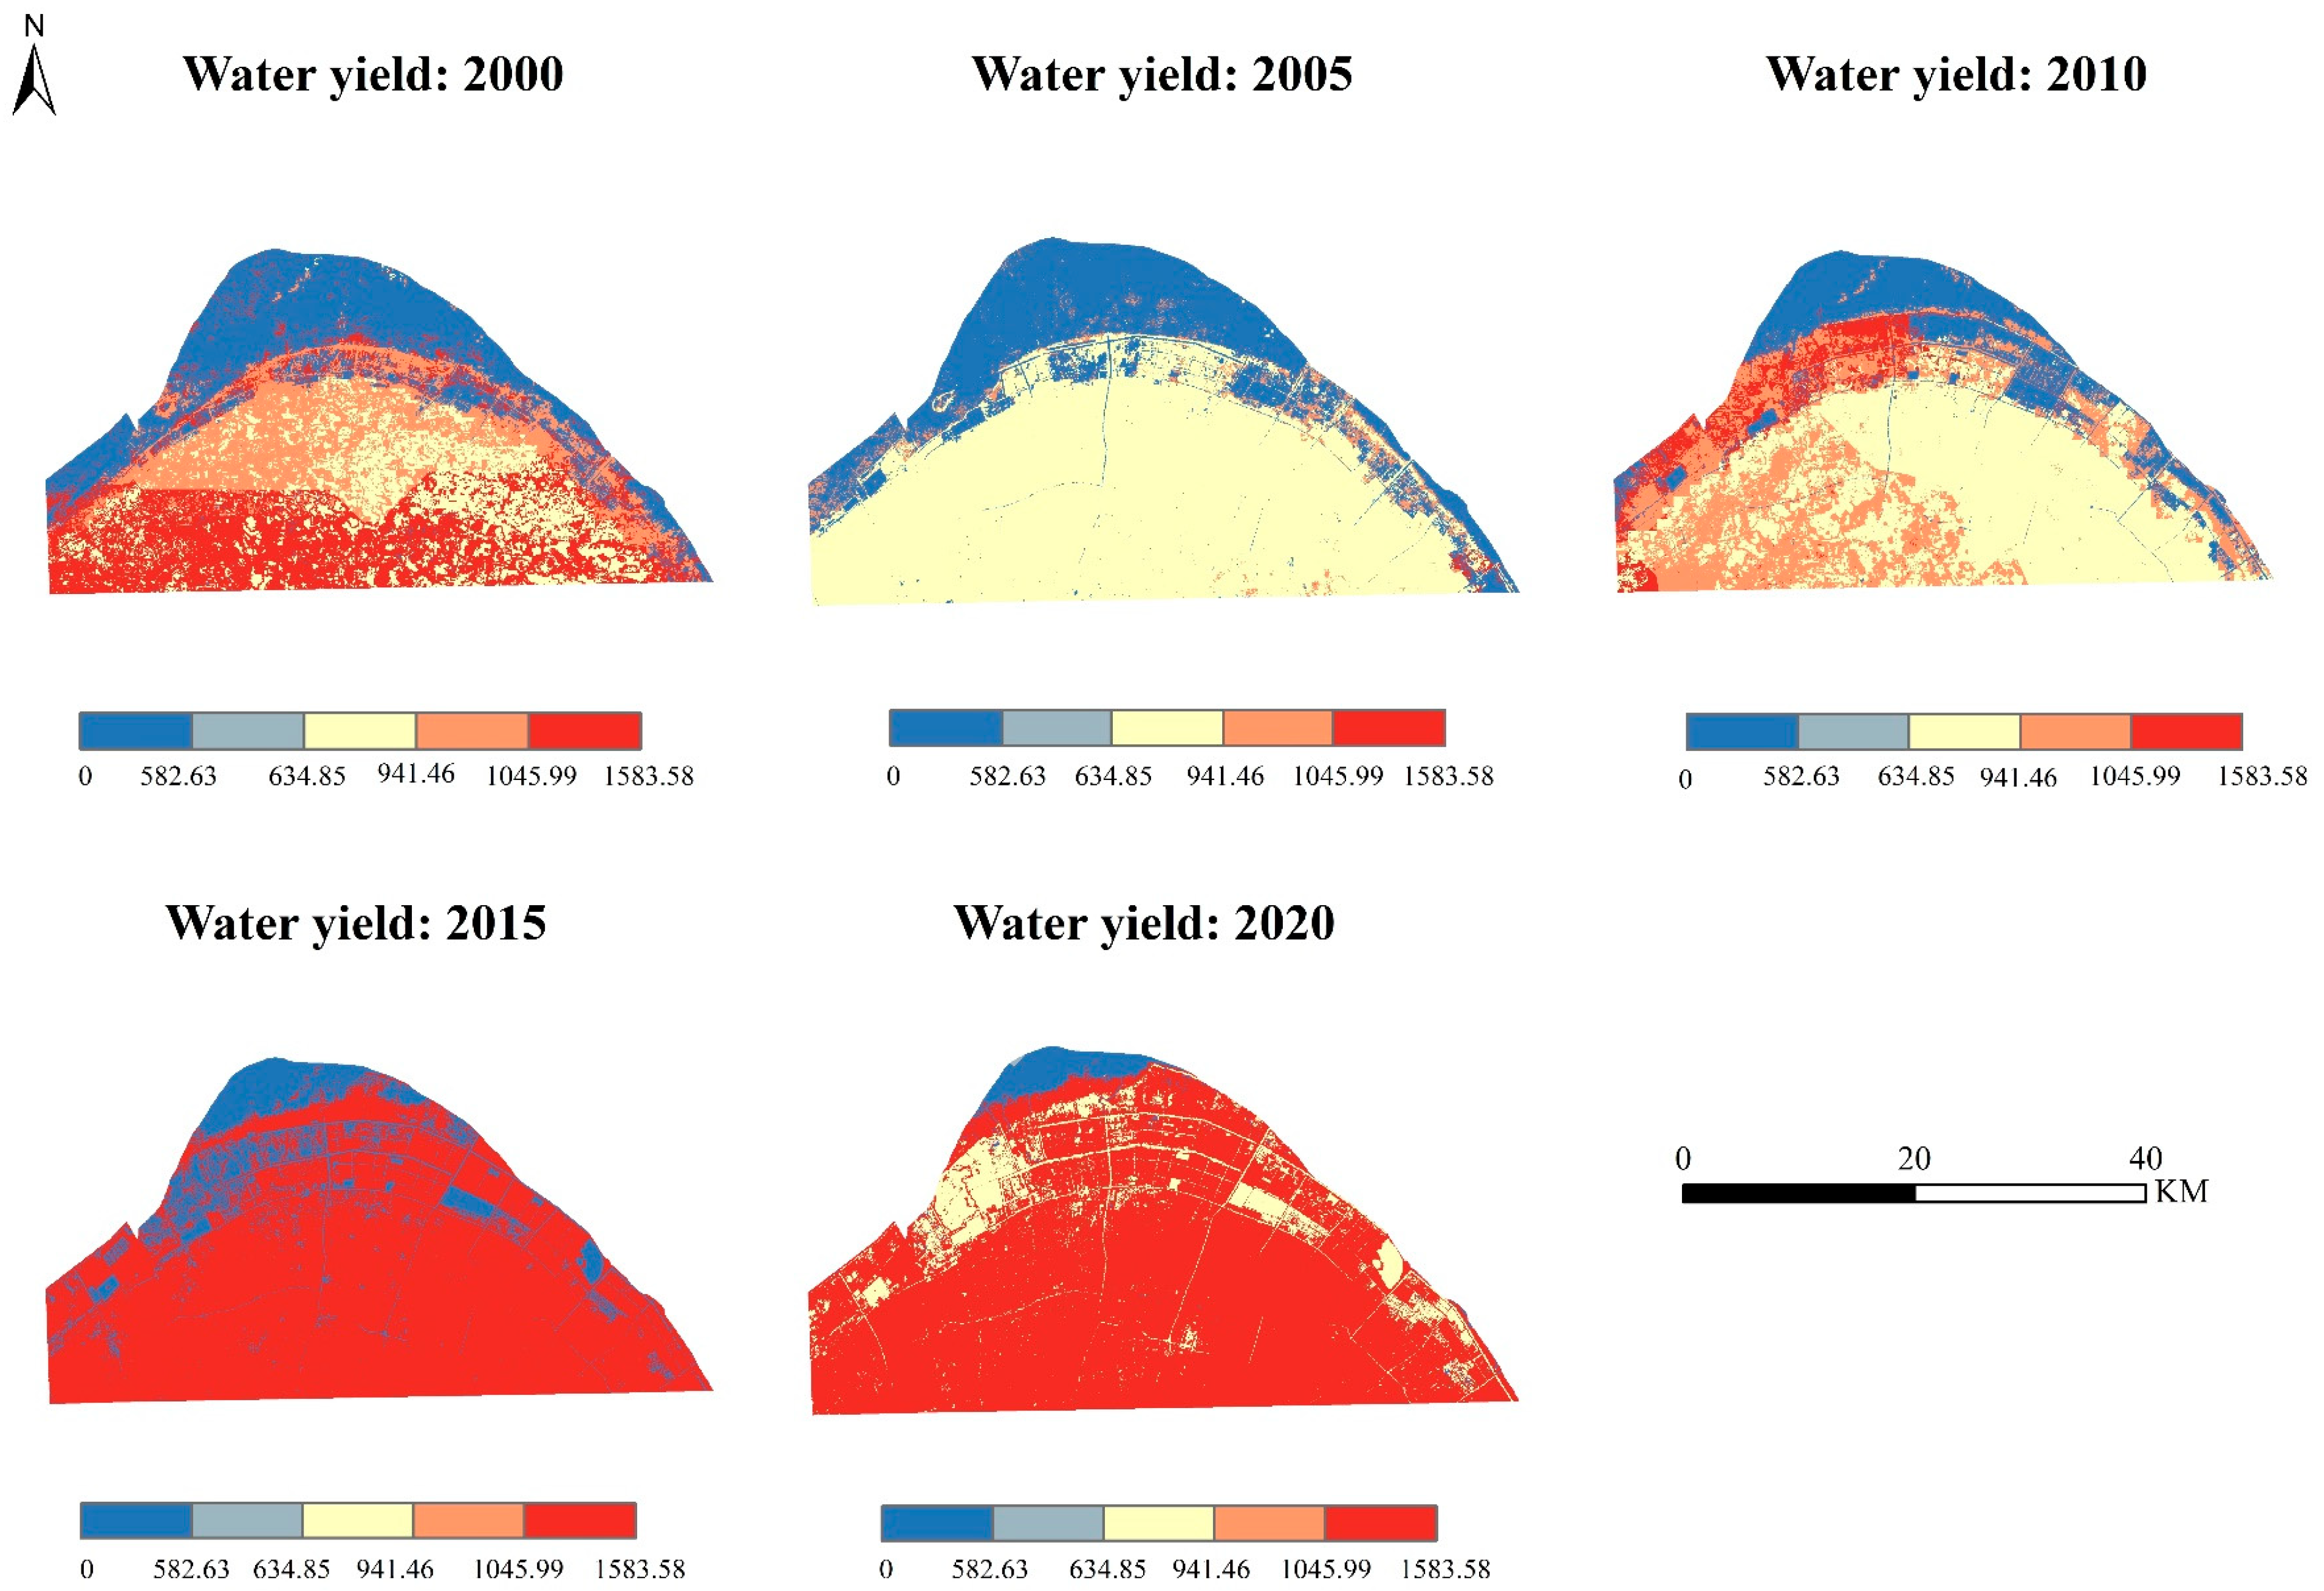
5.2. Change in Water Yield
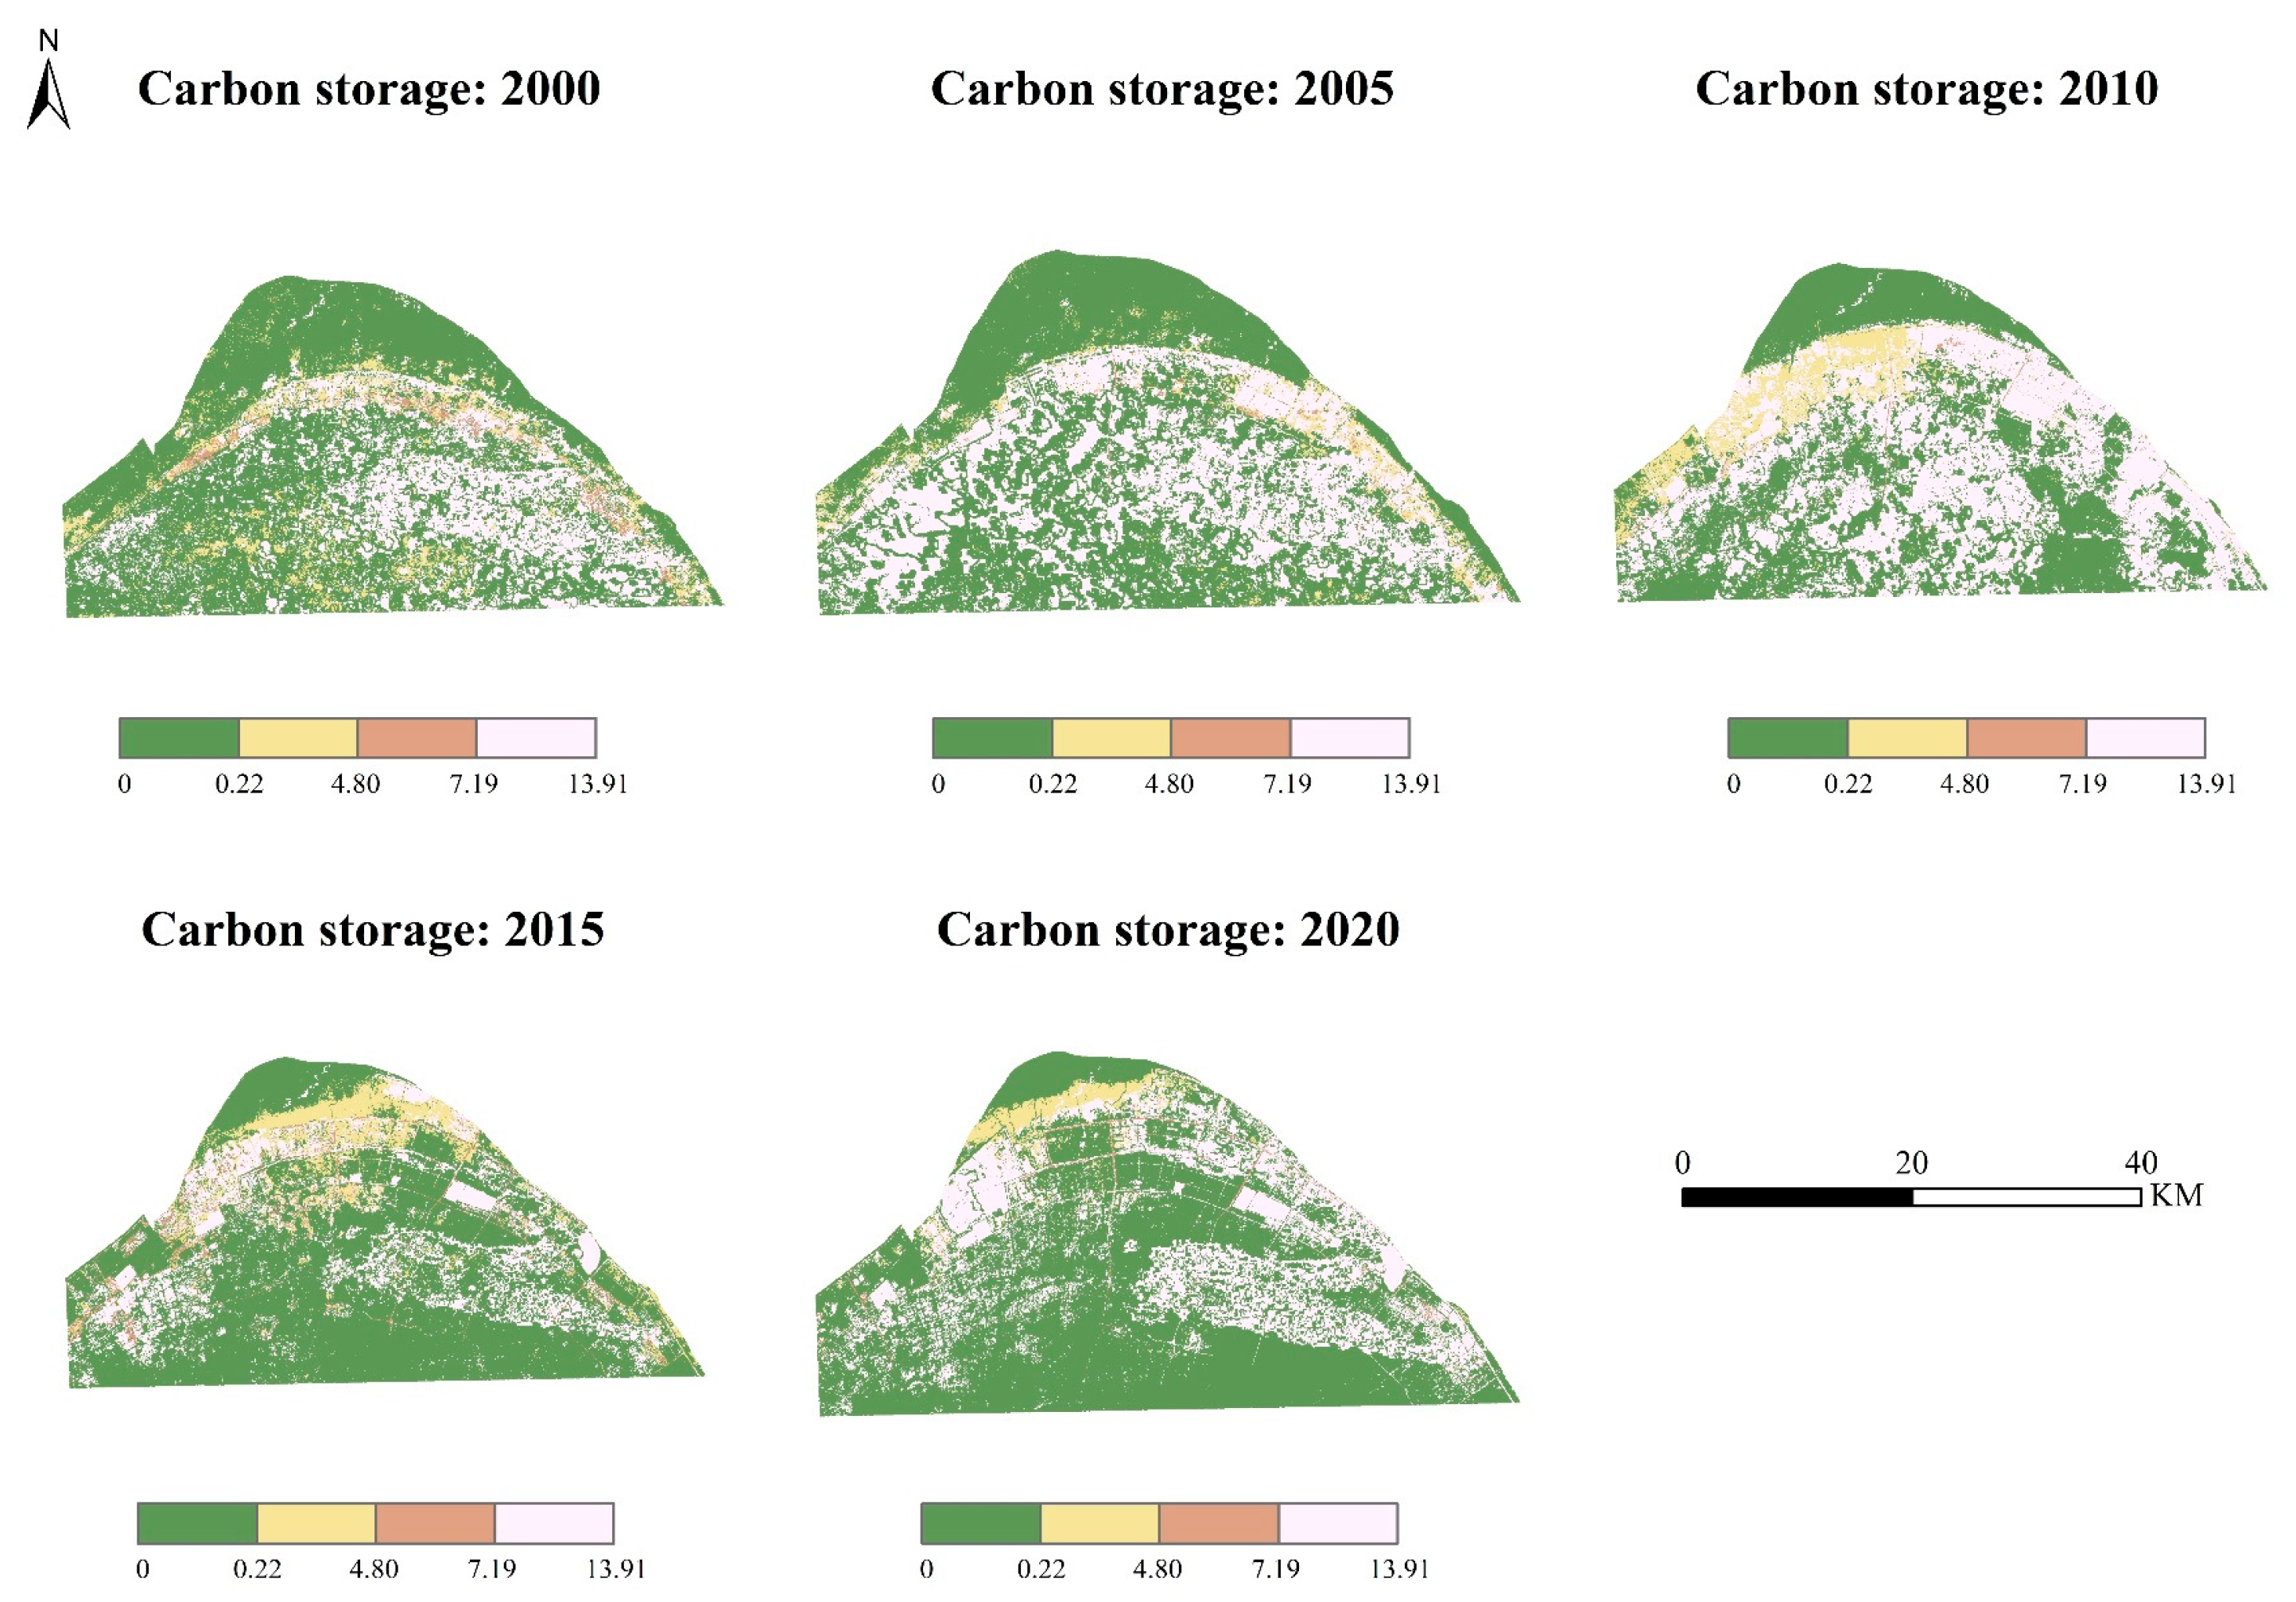
5.3. Change in Carbon Storage
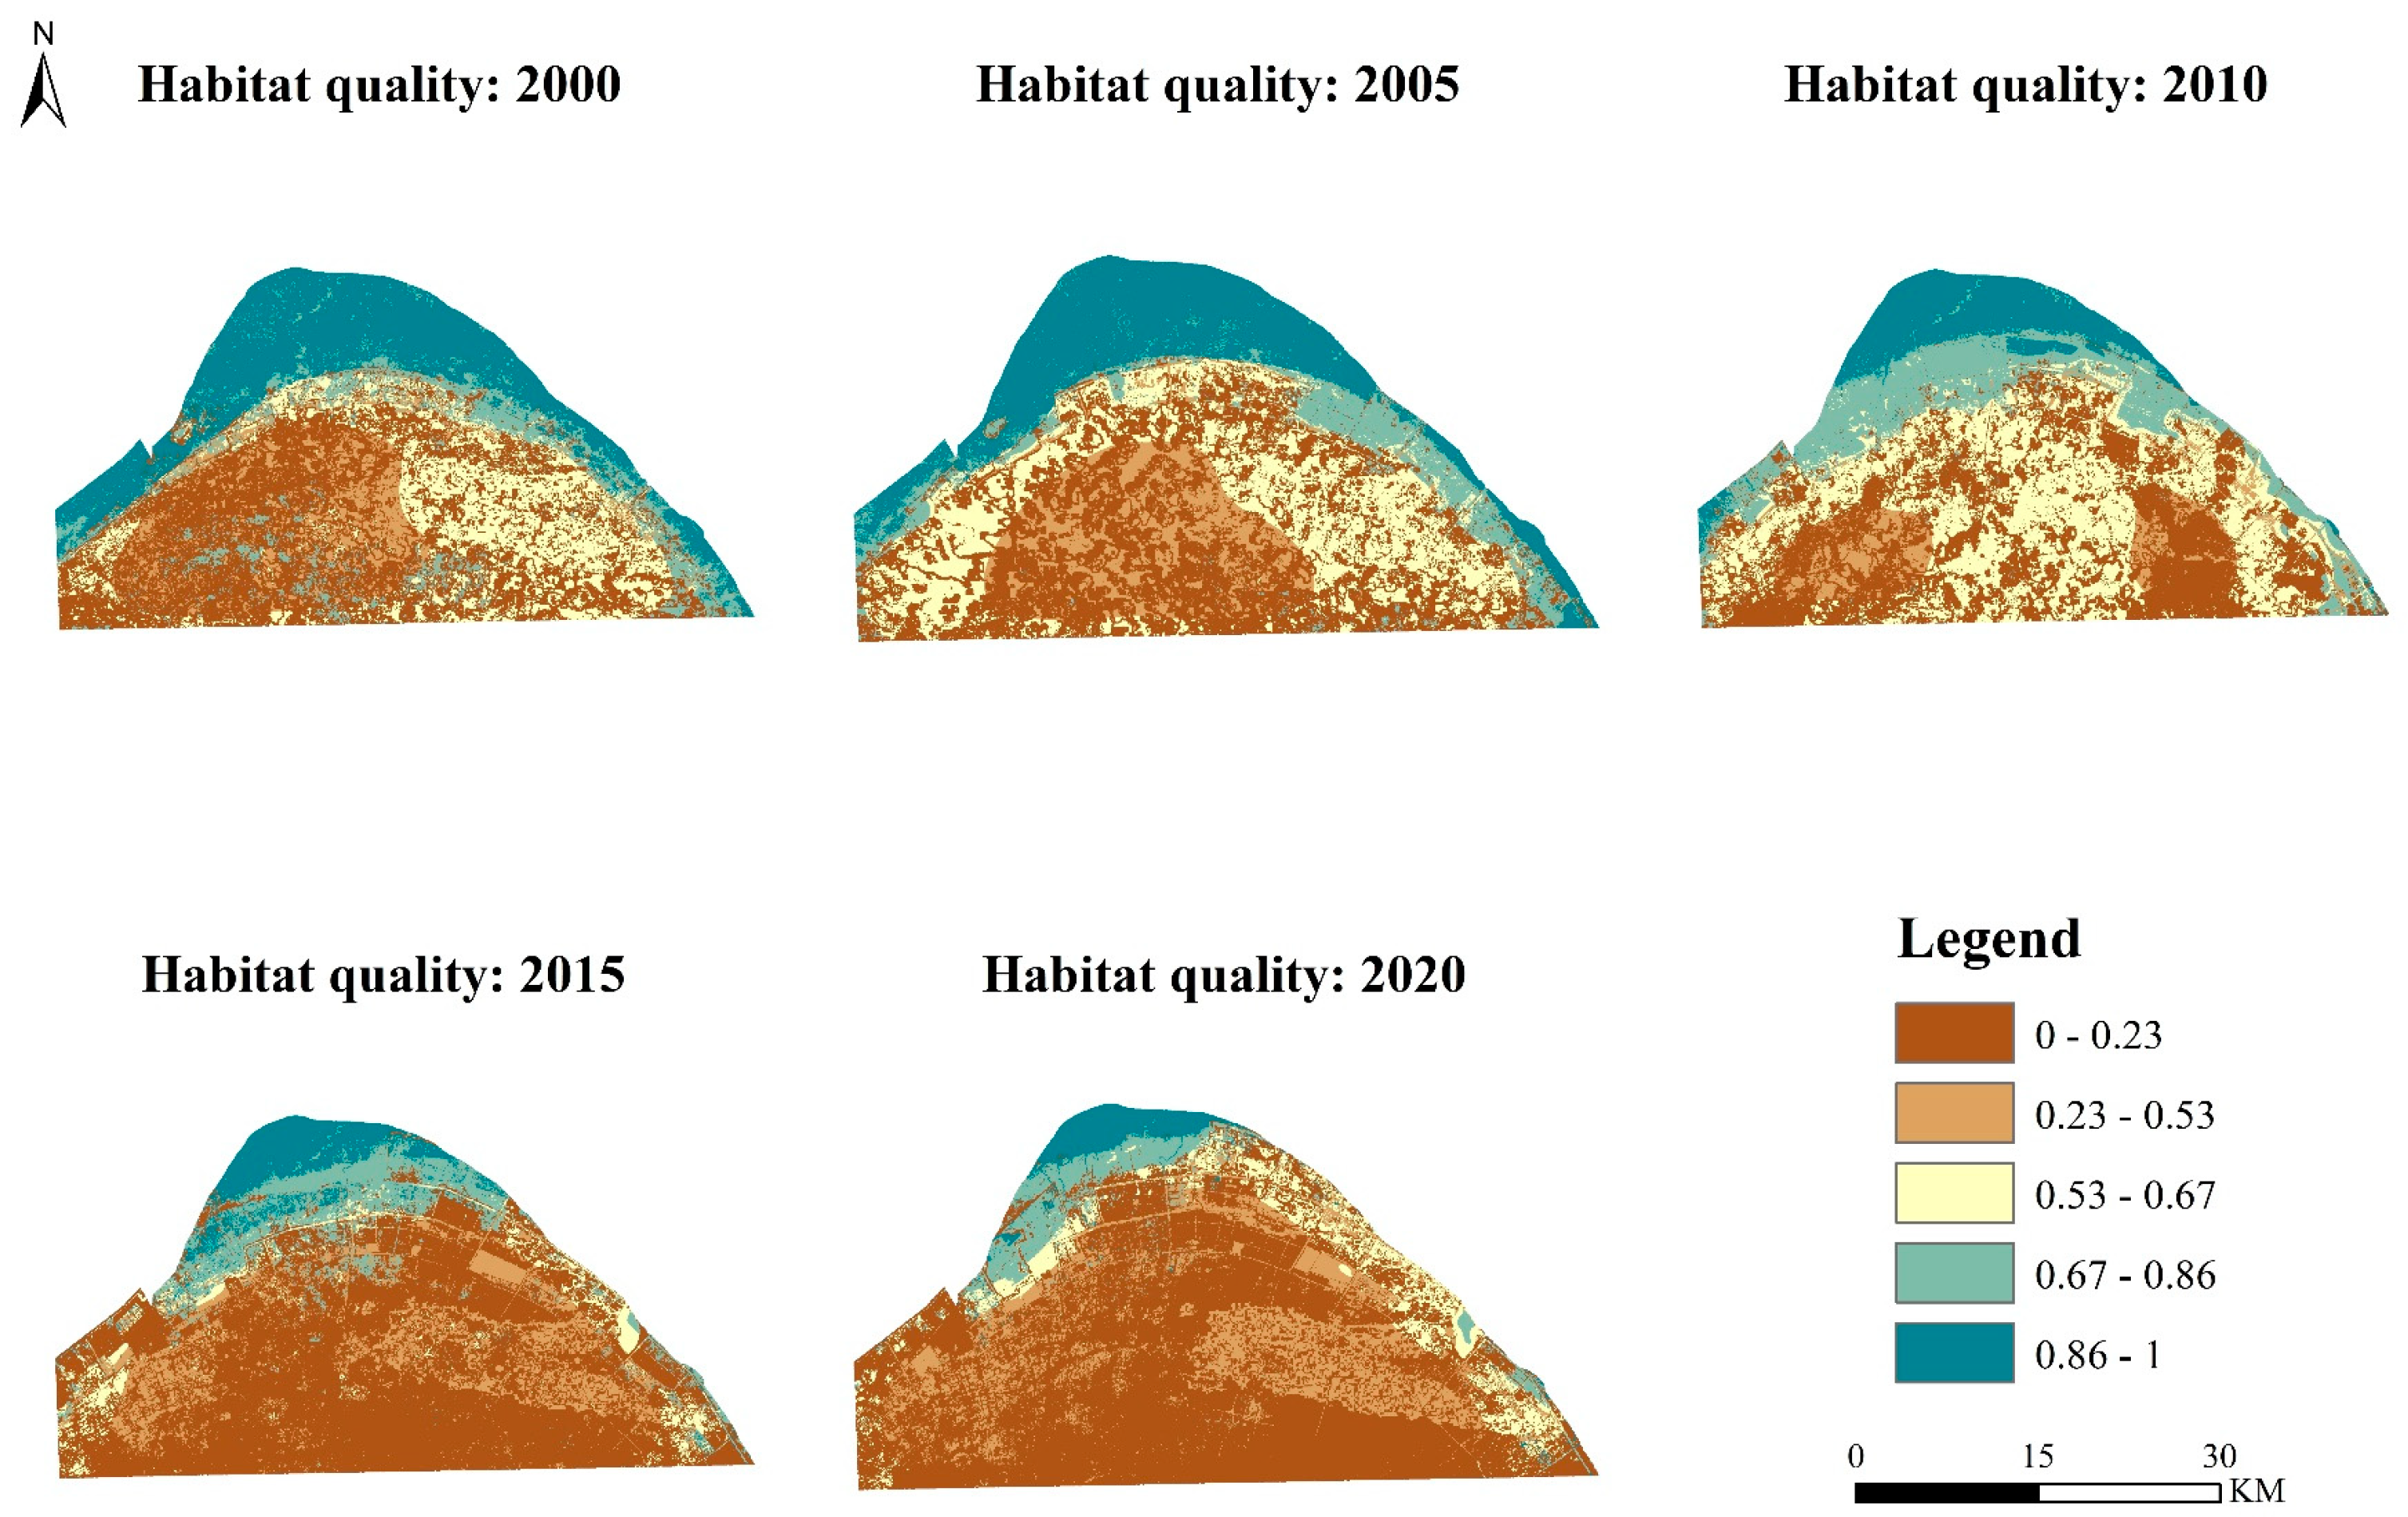
5.4. Change in Habitat Quality
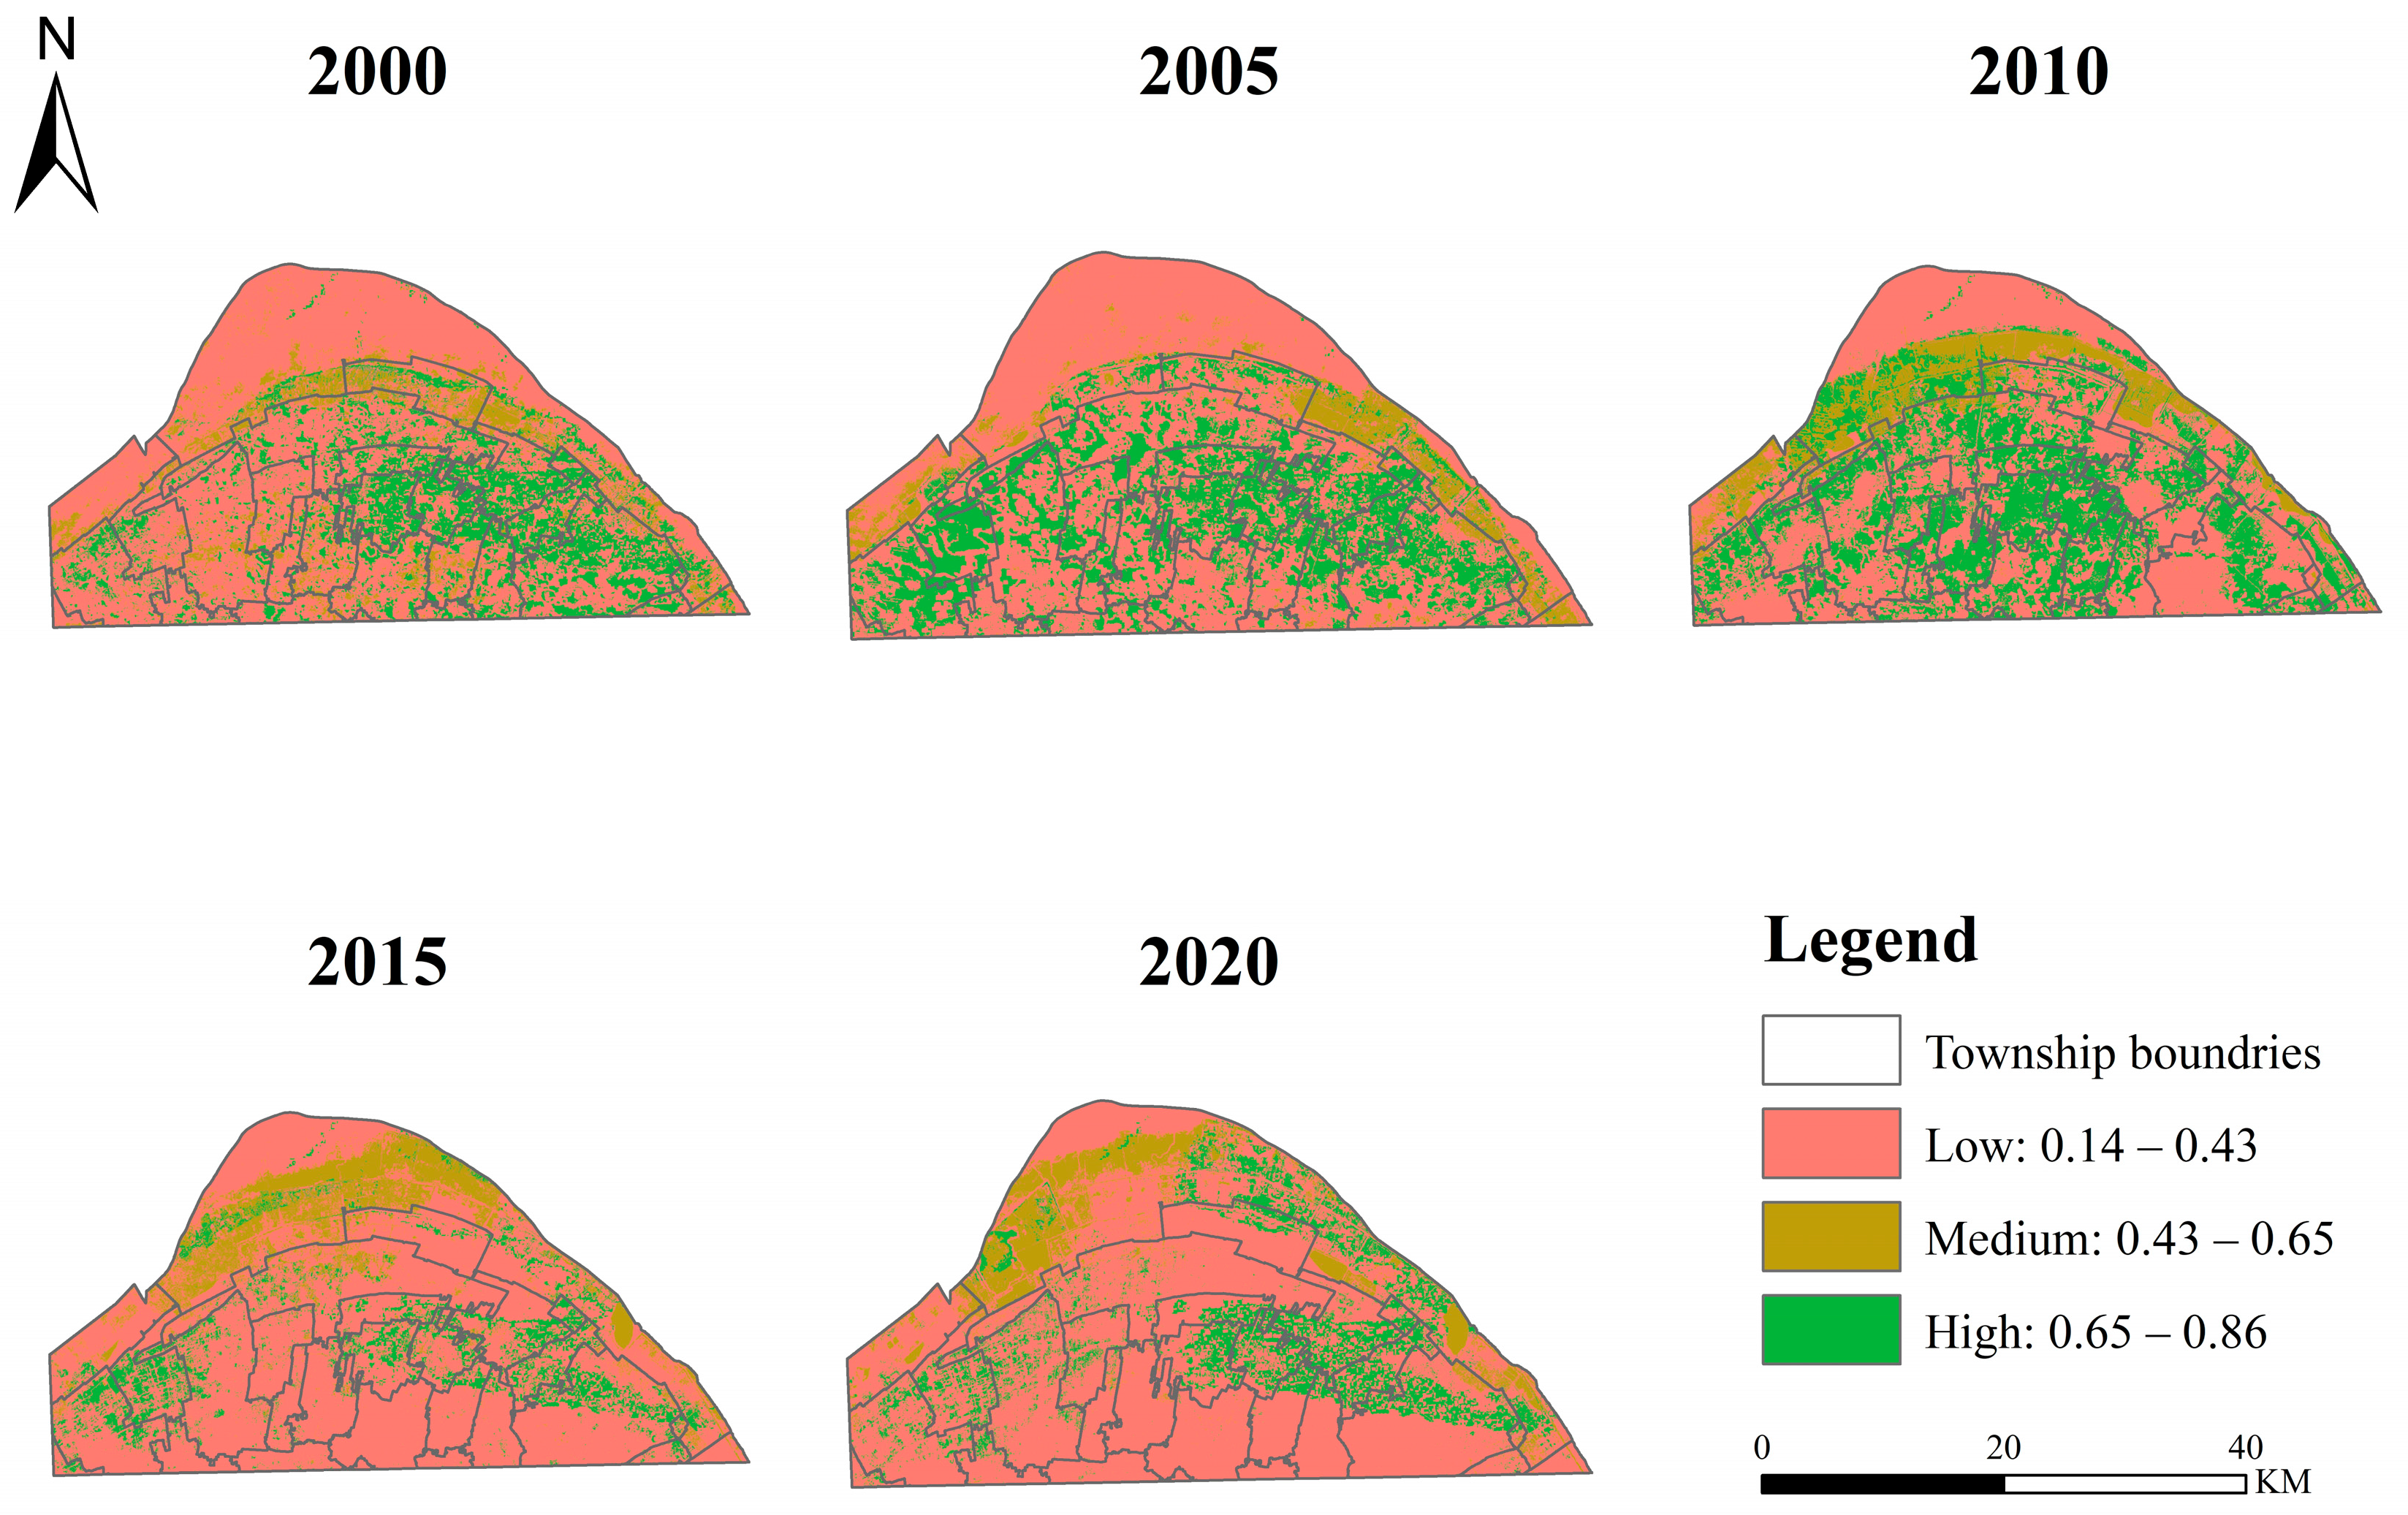
5.5. Comprehensive Analysis of Changes in Ecosystem Service
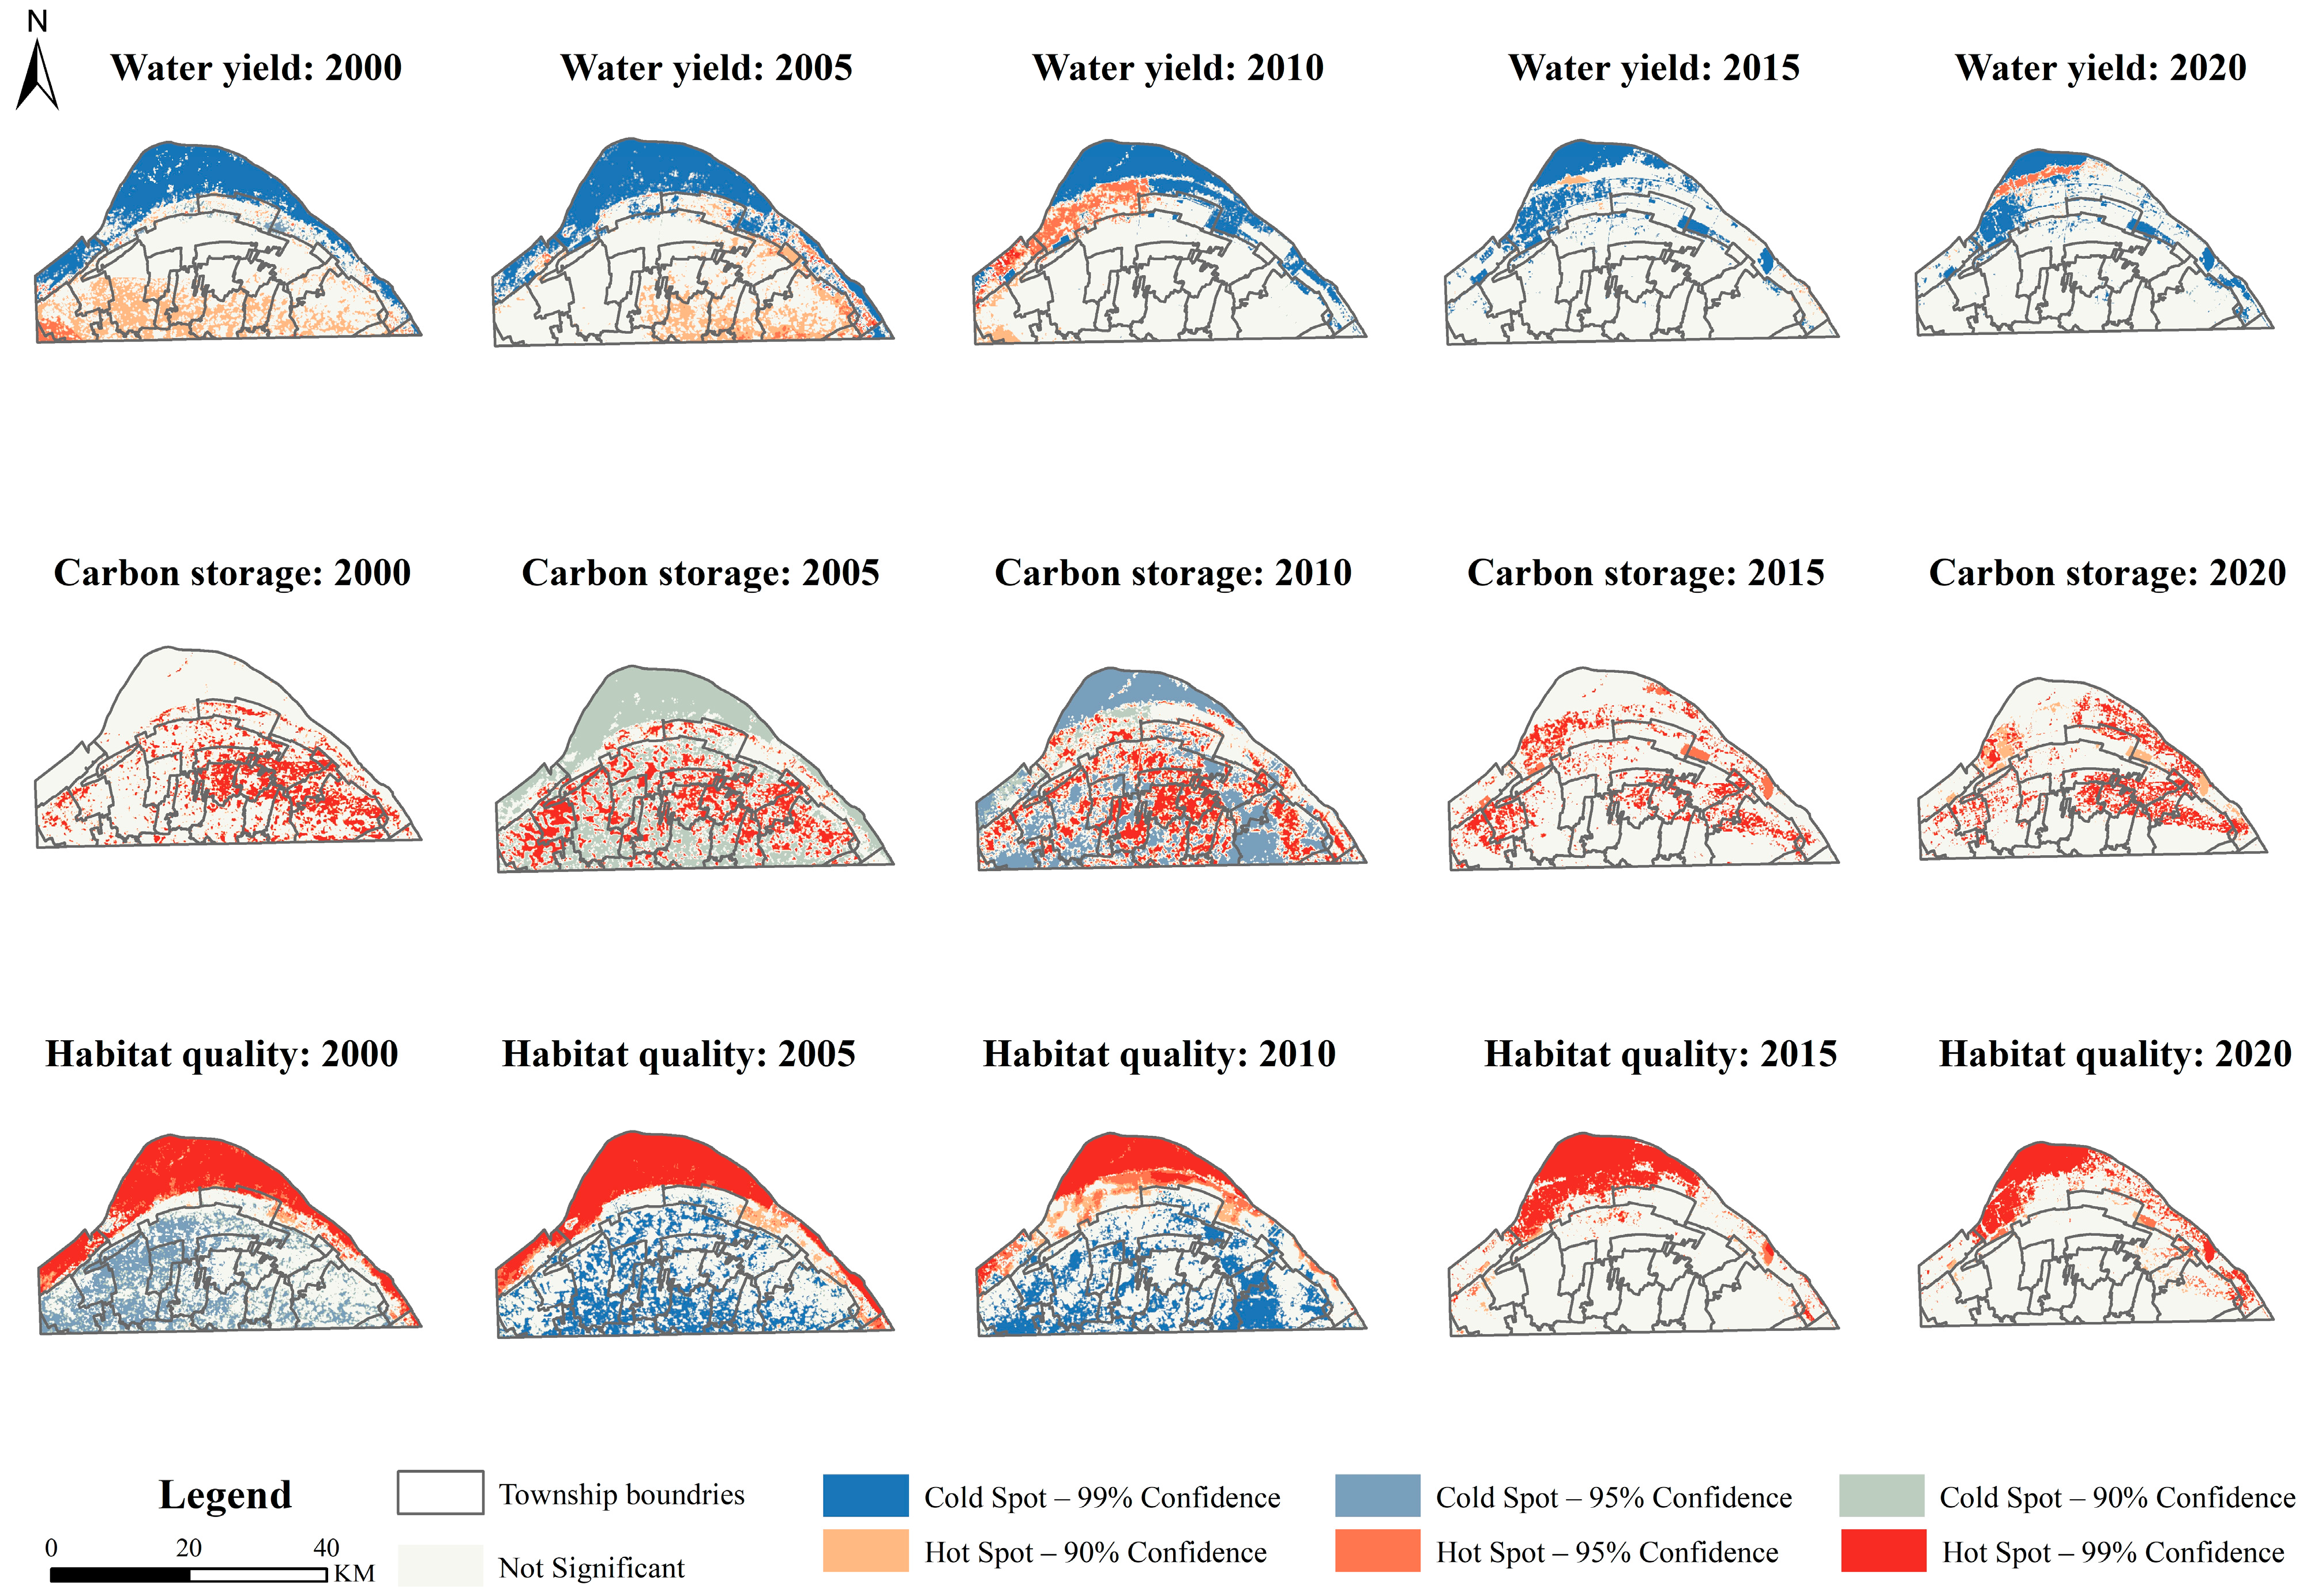
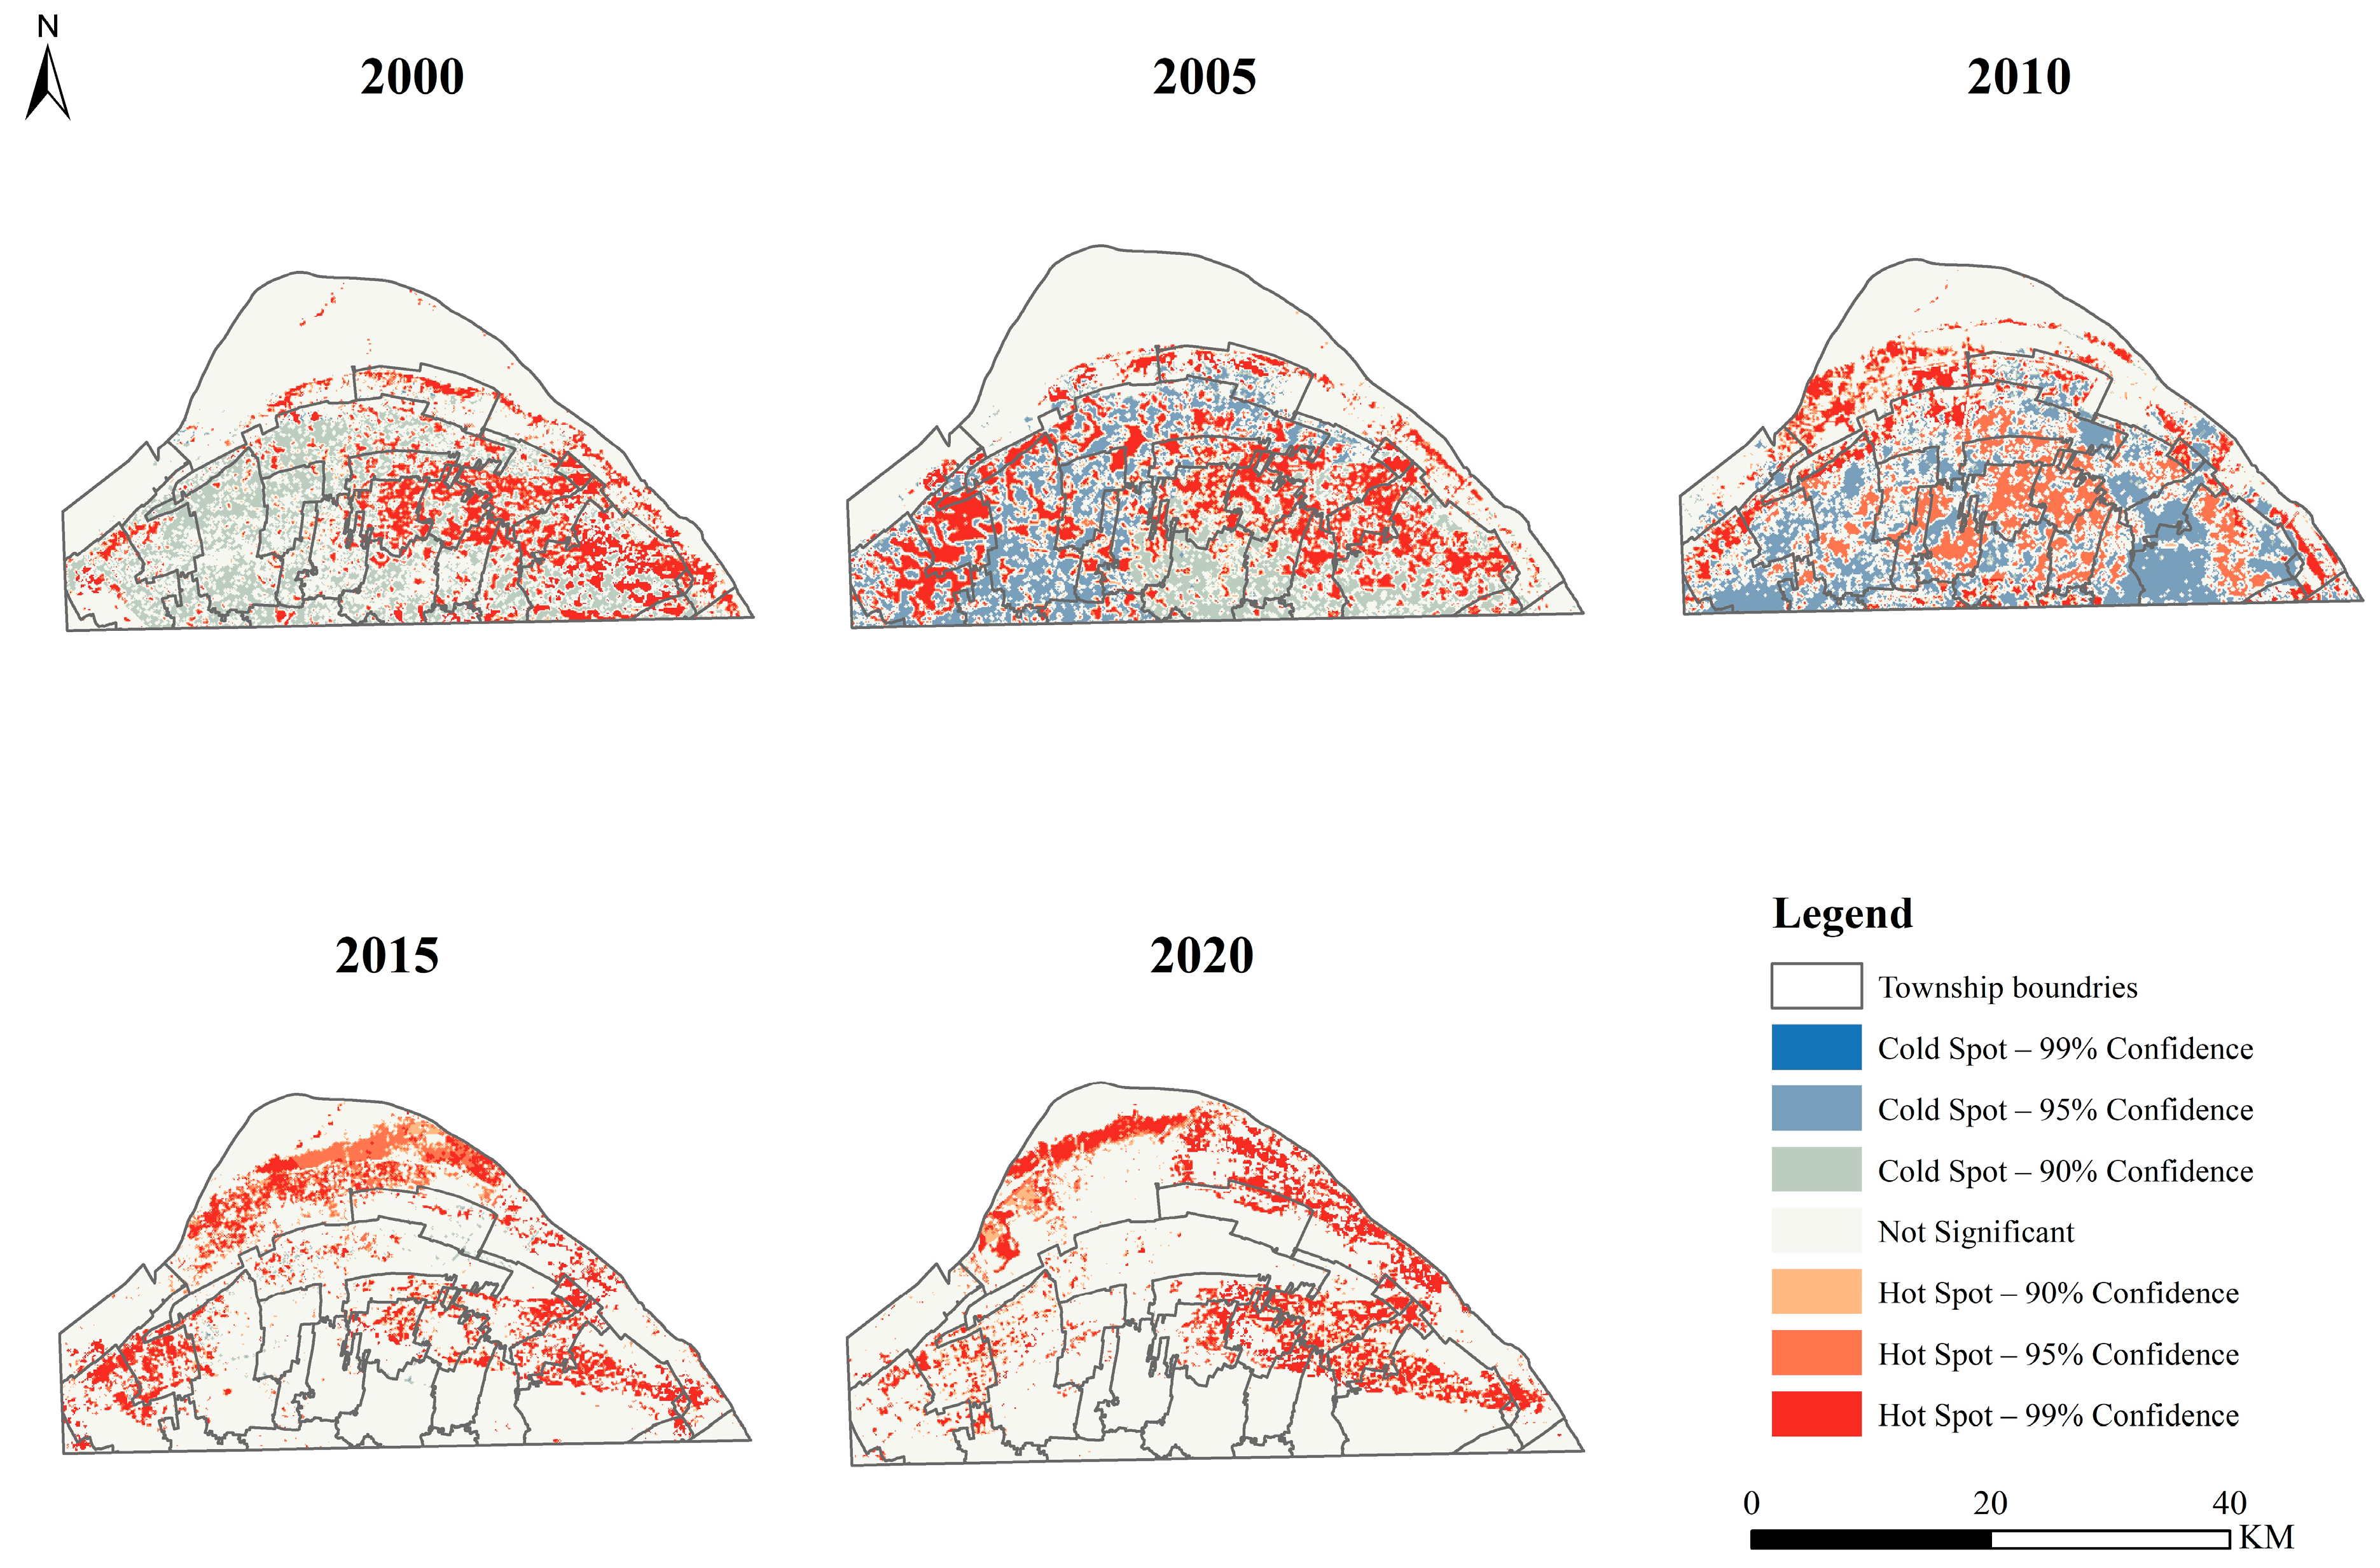
5.6. Hotspot Analysis
5.7. Coastal Wetland Ecological Restoration Zoning
6. Discussion
6.1. Influencing Factors of Ecosystem Service Changes in Coastal Wetlands
6.2. Policy Implications
6.3. Research Limitations
7. Conclusions
Author Contributions
Funding
Data Availability Statement
Acknowledgments
Conflicts of Interest
References
- Chen, Y. Strengthening the basic theoretical research on wetlands to serve the national wetland conservation strategy. Bull. Natl. Nat. Sci. Found. China 2022, 36, 363. [Google Scholar] [CrossRef]
- Mi, C. China’s wetland ecological protection is effective. Ecol. Econ. 2022, 38, 9–12. (In Chinese) [Google Scholar]
- Liu, Z.; Fagherazzi, S.; Cui, B. Success of coastal wetlands restoration is driven by sediment availability. Commun. Earth Environ. 2021, 2, 44. [Google Scholar] [CrossRef]
- Koebsch, F.; Winkel, M.; Liebner, S.; Liu, B.; Bttcher, M.E. Sulfate deprivation triggers high methane production in a disturbed and rewetted coastal peatland. Biogeosci. Discuss. 2019, 16, 1937–1953. [Google Scholar] [CrossRef]
- Chen, Y.; Chen, L.; Cai, T.; Xia, X. Advances in biogeomorpholoogy in coastal wetlands and its application in ecological restoration. Oceanol. Limnol. Sin. 2020, 51, 1055–1065. (In Chinese) [Google Scholar]
- Jankowski, K.; Törnqvist, T.; Fernandes, A. Vulnerability of Louisiana’s coastal wetlands to present-day rates of relative sea-level rise. Nat. Commun. 2017, 8, 14792. [Google Scholar] [CrossRef]
- Schuerch, M.; Spencer, T.; Temmerman, S.; Kirwan, M.; Wolff, C.; Lincke, D.; McOwen, C.; Pickering, M.; Reef, R.; Vafeidis, A.; et al. Future response of global coastal wetlands to sea-level rise. Nature 2018, 561, 231–234. [Google Scholar] [CrossRef]
- Barbier, E.B.; Hacker, S.D.; Kennedy, C.; Koch, E.W.; Stier, A.C.; Silliman, B.R. The value of estuarine and coastal ecosystem services. Ecol. Monogr. 2011, 81, 169–193. [Google Scholar] [CrossRef]
- Ma, Z.; Melville, D.; Liu, J.; Chen, Y.; Yang, H.; Ren, W.; Zhang, Z.-W.; Piersma, T.; Li, B. Rethinking China’s new great wall. Science 2014, 346, 912–914. [Google Scholar] [CrossRef]
- Tian, B.; Wu, W.; Yang, Z.; Zhou, Y. Drivers, Trends, and Potential Impacts of Long-Term Coastal Reclamation in China from 1985 to 2010. Estuar. Coast. Shelf Sci. 2016, 170, 83–90. [Google Scholar] [CrossRef]
- Feng, W.; Wang, X.; Shi, L.; Xiao, H. Protection of wetland resources in China and Research and reflection on the current situation of tenure management. China Land 2022, 434, 8–11. [Google Scholar] [CrossRef]
- Cui, B.; Xie, T.; Wang, Q.; Li, S.; Yan, J.; Yu, S.; Liu, K.; Zheng, J.; Liu, Z. Impact of large-scale reclamation on coastal wetlands and implications for ecological restoration, compensation, and sustainable exploitation framework. Bull. Chin. Acad. Sci. 2017, 32, 418–425. (In Chinese) [Google Scholar]
- Liu, Z.; Cui, B.; He, Q. Shifting paradigms in coastal restoration: Six decades’ lessons from China. Sci. Total Environ. 2016, 566–567, 205–214. [Google Scholar] [CrossRef]
- Li, X.; Bellerby, R.; Craft, C.; Widney, S. Coastal wetland loss, consequences, and challenges for restoration. Anthr. Coasts 2018, 1, 1–15. [Google Scholar] [CrossRef]
- Pang, B.; Cui, B.; Cai, Y.; Xie, T.; Wang, Q.; Ning, Z. Studies on selection method of reference condition for ecological restoration on coastal wetlands in China. Environ. Ecol. 2020, 2, 1–9+25. (In Chinese) [Google Scholar]
- Ling, Y.; Yu, J.; Yang, J.; Yu, Y.; Wang, Z.; Li, Y.; Wang, X.; Zhou, D.; Zou, Y.; Guan, B.; et al. Spatial-temporal changes of land use/coverandits responses to the human activity intensity in the Modern Yellow River Delta during 1991–2021. Chin. J. Ecol. 2023, 1–13. (In Chinese) [Google Scholar]
- Gao, F.; Zhao, X.; Song, X.; Wang, B.; Wang, P.; Niu, Y.; Wang, W.; Huang, C. Connotation and evaluation index system of beautiful China for SDGs. Adv. Earth Sci. 2019, 34, 11. [Google Scholar]
- Cai, H.; Chen, Y.; Zha, D.; Zeng, H.; Shan, H.; Hong, T. Principle and method for ecological restoration zoning of territorial space based on the dominant function. Trans. Chin. Soc. Agric. Eng. 2020, 36, 261–270+325. (In Chinese) [Google Scholar]
- Jackson, L.L.; Lopoukhine, N.; Hillyard, D. Ecological Restoration: A Definition and Comments. Restor. Ecol. 1995, 3, 71–75. [Google Scholar] [CrossRef]
- Li, X.; Li, M.; Liang, C.; ZhuGe, H. On the current key issues in wetland restoration. J. Nat. Resour. 2014, 29, 1257–1269. (In Chinese) [Google Scholar]
- Hobbs, R. Spontaneous Succession versus Technical Reclamation in the Restoration of Disturbed Sites. Restor. Ecol. 2008, 16, 363–366. [Google Scholar] [CrossRef]
- Diefenderfer, H.; Adkins, J. Systematic Approach to Coastal Ecosystem Restoration; NOAA Coastal Services Center: Charleston, SC, USA, 2003. [Google Scholar]
- Gann, G.D.; McDonald, T.; Walder, B.; Aronson, J.; Nelson, C.R.; Jonson, J.; Hallett, J.G.; Eisenberg, C.; Guariguata, M.R.; Liu, J.; et al. International principles and standards for the practice of ecological restoration. Second edition. Restor. Ecol. 2019, 27, S1–S46. [Google Scholar] [CrossRef]
- Ruiz-Jaen, M.; Aide, T.M. Restoration Success: How Is It Being Measured? Restor. Ecol. 2005, 13, 569–577. [Google Scholar] [CrossRef]
- Cadier, C.; Bayraktarov, E.; Piccolo, R.; Adame, M.F. Indicators of Coastal Wetlands Restoration Success: A Systematic Review. Front. Mar. Sci. 2020, 7, 600220. [Google Scholar] [CrossRef]
- Zhang, Z.; Liu, X.; Mao, X.; Wei, X. A 5-year cross-section health-data based ecological restoration assessment of Huangshui National Wetland Park in Xining. For. Resour. Manag. 2019, 2, 30–38. (In Chinese) [Google Scholar]
- Huang, H.; Chen, B.; Yu, W.; Sun, Y.; Zheng, C.; Lin, J.; Chen, G.; Ma, Z. Evaluation of the coastal wetland onWuyuan Bay of Xiamen. J. Appl. Oceanogr. 2015, 34, 501–508. (In Chinese) [Google Scholar]
- Shao, X.; Xing, M.; Wang, J.; Yang, H.; Wang, Y.; Liu, H.; Zhou, B.; Wang, N. Evaluation on the ecological restoration effect of returning fishpond to wetland: A case study in Qilihai wetland, Tianjin, China. Chin. J. Environ. Eng. 2022, 16, 3102–3112. (In Chinese) [Google Scholar]
- Tong, C.; Feagin, R.A.; Lu, J.; Zhang, X.; Zhu, X.; Wei, W.; He, W. Ecosystem service values and restoration in the urban Sanyang wetland of Wenzhou, China. Ecol. Eng. 2007, 29, 249–258. [Google Scholar] [CrossRef]
- Jiang, B.; Xu, X.B. China needs to incorporate ecosystem services into wetland conservation policies. Ecosyst. Serv. 2019, 37, 100941. [Google Scholar] [CrossRef]
- Khoshkar, S.; Hammer, M.; Borgström, S.; Dinnetz, P.; Balfors, B. Moving from vision to action- integrating ecosystem services in the Swedish local planning context. Land Use Policy 2020, 97, 104791. [Google Scholar] [CrossRef]
- Yang, H.; Wei, Q.; Chen, J. Ecosystem services optional capacity value: A new indicator for valuation of ecosystem services. Acta Ecol. Sin. 2020, 40, 3155–3167. (In Chinese) [Google Scholar]
- Liu, N.; Liu, H.; Wu, P.; Luo, G.; Li, X. Accumulation characteristics and ecological risk assessment of heavy metals in typical karst soils. J. Agric. Resour. Environ. 2021, 38, 797–809. [Google Scholar] [CrossRef]
- Chen, C.; Lv, Y.; Wang, T.; Shi, Y.; Hu, W.; Li, J.; Zhang, X.; Geng, J. Emerging issues and prospects for regional ecological risk assessment. Acta Ecol. Sin. 2010, 30, 808–816. (In Chinese) [Google Scholar]
- Martínez-López, J.; Bagstad, K.; Balbi, S.; Magrach, A.; Voigt, B.; Athanasiadis, I.; Pascual, M.; Willcock, S.; Villa, F. Towards globally customizable ecosystem service models. Sci. Total Environ. 2018, 650, 2325–2336. [Google Scholar] [CrossRef]
- Wang, Y.; Ye, C.; Zhu, L.; Li, A.; Liang, Y.; Zou, Y. Impact of land use change on ecosystem service function in Dongzhai Bay Area. J. Yangtze River Sci. Res. Inst. 2023, 1–9. (In Chinese) [Google Scholar]
- Zhang, J. Wetlands Convention Compliance Guide. Chin. For. Publ. House 2001. (In Chinese) [Google Scholar]
- Wang, R.; Zhang, M.; Wu, H.; Li, Y. Analysis on wetland definition and classification of the Wetland Conservation Law of the People’s Republic of China. Wetl. Sci. 2022, 20, 404–412. [Google Scholar] [CrossRef]
- Liu, H.; Zhao, Z.; Lv, X. A study on wetland resources and protection in China. Resour. Sci. 1999, 21, 34–37. (In Chinese) [Google Scholar]
- Liu, Y.; Xi, M.; Zhang, X.; Yu, Z.; Kong, F. Carbon storage distribution characteristics of wetlands in China and its influencing factors. Chin. J. Appl. Ecol. 2019, 30, 2481–2489. [Google Scholar] [CrossRef]
- Gibbs, J. Wetland Loss and Biodiversity Conservation. Conserv. Biol. 2000, 14, 314–317. [Google Scholar] [CrossRef]
- Lehner, B.; Doell, P. Development and Validation of a Global Database of Lakes, Reservoirs and Wetlands. J. Hydrol. 2004, 296, 1–22. [Google Scholar] [CrossRef]
- Liang, H.; Chen, C.; Wang, K.; Ye, G. Long-Term Spatiotemporal Changes in Ecosystem Services Caused by Coastal Wetland Type Transformation in China’s Hangzhou Bay. J. Mar. Sci. Eng. 2022, 10, 1781. [Google Scholar] [CrossRef]
- Zhang, Y.; Jin, R.; Zhu, W.; Zhang, D.; Zhang, X. Impacts of Land Use Changes on Wetland Ecosystem Services in the Tumen River Basin. Sustainability 2020, 12, 9821. [Google Scholar] [CrossRef]
- Hu, W.; Li, G.; Gao, Z.; Jia, G.; Wang, Z.; Li, Y. Assessment of the impact of the Poplar Ecological Retreat Project on water conservation in the Dongting Lake wetland region using the InVEST model. Sci. Total Environ. 2020, 733, 139423. [Google Scholar] [CrossRef]
- Zhou, R.; Lin, M.; Wu, Z.; Gong, J. Responses of ecosystem carbon stocks to land use change on the west side of the Pearl River. Ecol. Sci. 2018, 37, 175–183. [Google Scholar] [CrossRef]
- Fang, J.; Huang, Y.; Zhu, J.; Sun, W.; Hu, H. Carbon budget of forest ecosystems and its driving forces. China Basic Sci. 2015, 17, 20–25. (In Chinese) [Google Scholar]
- Li, J.; Yan, D.; Yao, X.; Liu, Y.; Siying, X.; Sheng, Y.; Luan, Z. Dynamics of Carbon Storage in Saltmarshes Across China’s Eastern Coastal Wetlands From 1987 to 2020. Front. Mar. Sci. 2022, 9, 885. [Google Scholar] [CrossRef]
- An, X.; Jin, W.; Long, X.; Chen, S.; Qi, S.; Zhang, M. Spatial and temporal evolution of carbon stocks in Dongting Lake wetlands based on remote sensing data. Geocarto Int. 2022, 37, 1–27. [Google Scholar] [CrossRef]
- Bao, Y.; Liu, K.; Li, T.; Hu, S. Effects of land use change on habitat based on InVEST model—Taking Yellow River wetland nature reserve in Shaanxi. Arid. Zone Res. 2015, 32, 622–629. (In Chinese) [Google Scholar]
- Sharp, R.; Chaplin-Kramer, R.; Wood, S.; Guerry, A.; Douglass, J. InVEST User’s Guide; The Natural Capital Project: Stanford, CA, USA, 2018. [Google Scholar]
- Zhang, H.; Han, W.; Song, J.; Li, M. Spatial-temporal variations of habitat quality in Qilian Mountain National Park. Chin. J. Ecol. 2021, 40, 1419–1430. (In Chinese) [Google Scholar]
- Li, N.; Li, L.; Lu, D.; Zhang, Y.; Wu, M. Detection of coastal wetland change in China: A case study in Hangzhou Bay. Wetl. Ecol. Manag. 2019, 27, 103–124. [Google Scholar] [CrossRef]
- Wang, Y.; Dai, E.; Ma, L.; Yin, L. Spatiotemporal and influencing factors analysis of water yield in the Hengduan Mountain region. J. Nat. Resour. 2020, 35, 371–386. (In Chinese) [Google Scholar]
- Han, N.; Zhang, Y.; Zhang, W. Simulation of temporal and spatial changes of land use and water yield in Hainan Island. Water Resour. Prot. 2022, 38, 119–127. (In Chinese) [Google Scholar]
- Liu, Y.; Wei, J.; Bi, Y.; Yue, H.; He, X. Evaluation of ecosystem service function in Shandong mining area. J. China Coal Soc. 2021, 46, 1599–1613. [Google Scholar] [CrossRef]
- Liu, J.; Hu, T.; Pan, X.; Zhang, D.; Zhang, L.; Li, Y. Simulating coastal wetland changes in Hangzhou Bay using Markov-ClUES coupling model. Ecol. Environ. Sci. 2018, 27, 1359–1368. [Google Scholar] [CrossRef]
- Tian, P.; Li, J.; Cao, L.; Pu, R.; Gong, H.; Liu, Y.; Zhang, H.; Chen, H. Impacts of reclamation derived land use changes on ecosystem services in a typical gulf of eastern China: A case study of Hangzhou bay. Ecol. Indic. 2021, 132, 108259. [Google Scholar] [CrossRef]
- Sun, T.; Lin, W.; Chen, G.; Guo, P.; Zeng, Y. Wetland ecosystem health assessment through integrating remote sensing and inventory data with an assessment model for the Hangzhou Bay, China. Sci. Total Environ. 2016, 566–567, 627–640. [Google Scholar] [CrossRef]
- Wang, T.; Hu, M.; Song, L.; Yu, J.; Liu, R.; Wang, S.; Wang, Z.; Sokolova, I.M.; Huang, W.; Wang, Y. Coastal zone use influences the spatial distribution of microplastics in Hangzhou Bay, China. Environ. Pollut. 2020, 266, 115137. [Google Scholar] [CrossRef]
- Sinclair, M.; Vishnu Sagar, M.K.; Knudsen, C.; Sabu, J.; Ghermandi, A. Economic appraisal of ecosystem services and restoration scenarios in a tropical coastal Ramsar wetland in India. Ecosyst. Serv. 2021, 47, 101236. [Google Scholar] [CrossRef]


| Class I | Class II | Description |
|---|---|---|
| Natural Wetlands | Shallow Water | Permanently vegetation-free offshore waters with a water level of less than 6 m at low tide. |
| Silty Beach | Muddy shoals and various marshy areas on the coast. | |
| River | The water surface between the shoreline of a naturally formed or artificially excavated river at the normal water level. | |
| Lake | The water surface is enclosed by the shoreline of the naturally formed standing water area. | |
| Artificial Wetlands | Reservoir/Pond | Artificial lakes, including coastal seashore reservoirs, agricultural ponds, and outflow ponds. |
| Paddy | Rice fields that can be planted for one, two, or three seasons or agricultural fields that store water or are wet in winter. | |
| Non-wetlands | Non-wetlands | Buildings for people’s daily residence and use, construction projects being developed, or land used for access, etc. |
| LULC | Kc | Root_Depth (mm) | Vegetation |
|---|---|---|---|
| Shallow Water | 1.2 | 200 | 0 |
| Silty Beach | 0.5 | 4500 | 1 |
| River | 1 | 1000 | 0 |
| Lake | 1 | 1 | 0 |
| Reservoir/Pond | 1 | 1000 | 0 |
| Paddy | 1.2 | 2000 | 1 |
| Non-wetlands | 0.3 | 200 | 0 |
| LULC | Ci-above (t/ha) | Ci-below (t/ha) | Ci-soil (t/ha) | Ci-dead (t/ha) |
|---|---|---|---|---|
| Shallow Water | 0.00 | 0.00 | 0.00 | 0.00 |
| Silty Beach | 1.00 | 1.00 | 0.99 | 0.00 |
| River | 0.00 | 0.00 | 53.70 | 0.00 |
| Lake | 0.00 | 0.00 | 144.13 | 0.00 |
| Reservoir/Pond | 0.00 | 0.00 | 88.14 | 0.00 |
| Paddy | 5.42 | 1.96 | 146.2 | 1.00 |
| Non-wetlands | 0.00 | 0.00 | 0.00 | 0.00 |
| Threat | Max_Dist (km) | Weight | Decay |
|---|---|---|---|
| Paddy | 1 | 0.7 | Linear |
| Non-wetlands | 3 | 1 | Exponential |
| LULC | Habitat | Threat | |
|---|---|---|---|
| Paddy | Non-Wetlands | ||
| Shallow Water | 1 | 0.2 | 0.2 |
| Silty Beach | 0.8 | 0.4 | 0.2 |
| River | 0.9 | 0.7 | 0.9 |
| Lake | 1 | 0.7 | 0.7 |
| Reservoir/Pond | 0.9 | 0.6 | 0.7 |
| Paddy | 0.7 | 0 | 0.5 |
| Non-wetlands | 0 | 0 | 0 |
| LULC | 2000 (before) (ha) | 2005 (Implementation Started) (ha) | 2020 (after) (ha) |
|---|---|---|---|
| Shallow Water | 25,152.89 | 22,298.77 | 3710.61 |
| Silty Beach | 8943.39 | 4494.51 | 3703.64 |
| River | 1670.58 | 544.05 | 1113.03 |
| Lake | 247.32 | 1.53 | 1281.78 |
| Total Natural Wetlands | 36,014.18 | 27,338.86 | 9813.06 |
| Reservoir/Pond | 2687.94 | 7567.47 | 11,040.93 |
| Paddy | 27,091.18 | 33,789.55 | 19,024.20 |
| Total Artificial Wetlands | 29,779.12 | 41,357.02 | 30,065.13 |
| Non-wetlands | 43080.99 | 40,178.29 | 68,996.03 |
| Total non-wetlands | 43,080.99 | 40,178.29 | 68,996.03 |
| Total Wetlands | 65,793.30 | 68,695.88 | 39,878.19 |
| 2005 | Shallow Water | Silty Beach | River | Lake | Reservoir/Pond | Paddy | Non-Wetlands | Total |
|---|---|---|---|---|---|---|---|---|
| 2000 | ||||||||
| Shallow Water | 18.31% | 1.65% | 0.06% | 0.00% | 1.71% | 0.78% | 0.60% | 23.11% |
| Mudflat | 1.21% | 0.67% | 0.08% | 0.00% | 1.53% | 1.77% | 2.95% | 8.21% |
| River | 0.03% | 0.20% | 0.07% | 0.00% | 0.73% | 0.15% | 0.35% | 1.53% |
| Lake | 0.00% | 0.02% | 0.01% | 0.00% | 0.14% | 0.02% | 0.04% | 0.23% |
| Reservoir/Pond | 0.32% | 0.20% | 0.09% | 0.00% | 1.12% | 0.33% | 0.41% | 2.47% |
| Paddy | 0.32% | 0.66% | 0.09% | 0.00% | 0.89% | 13.20% | 9.72% | 24.88% |
| Non-wetlands | 0.30% | 0.73% | 0.10% | 0.00% | 0.83% | 14.79% | 22.83% | 39.57% |
| Total | 20.48% | 4.13% | 0.50% | 0.00% | 6.95% | 31.04% | 36.90% | 100.00% |
| 2020 | Shallow Water | Silty Beach | River | Lake | Reservoir/Pond | Paddy | Non-Wetlands | Total |
|---|---|---|---|---|---|---|---|---|
| 2005 | ||||||||
| Shallow Water | 3.27% | 2.94% | 0.38% | 0.79% | 4.03% | 2.63% | 6.44% | 20.48% |
| Mudflat | 0.06% | 0.06% | 0.11% | 0.07% | 0.98% | 0.46% | 2.38% | 4.13% |
| River | 0.00% | 0.00% | 0.05% | 0.01% | 0.17% | 0.05% | 0.21% | 0.50% |
| Lake | 0.00% | 0.00% | 0.00% | 0.00% | 0.00% | 0.00% | 0.00% | 0.00% |
| Reservoir/Pond | 0.02% | 0.11% | 0.29% | 0.15% | 2.45% | 0.79% | 3.13% | 6.95% |
| Paddy | 0.02% | 0.14% | 0.09% | 0.06% | 1.07% | 9.97% | 19.69% | 31.04% |
| Non-wetlands | 0.03% | 0.16% | 0.09% | 0.10% | 1.43% | 3.58% | 31.51% | 36.90% |
| Total | 3.41% | 3707.64 | 1.02% | 1.18% | 10.14% | 17.43% | 63.37% | 100.00% |
| LULC | 2000 | 2005 | 2010 | 2015 | 2020 |
|---|---|---|---|---|---|
| Shallow Water | 313.25 | 0 | 0 | 0.02 | 572.40 |
| Silty Beach | 1077.70 | 991.90 | 1146.67 | 1479.29 | 1390.55 |
| River | 495.98 | 15.95 | 0 | 249.56 | 715.50 |
| Lake | 490.41 | 1.83 | 0 | 222.70 | 734.15 |
| Reservoir/Pond | 487.45 | 10.62 | 0 | 230.64 | 716.71 |
| Paddy | 890.73 | 725.55 | 852.78 | 1208.97 | 1138.86 |
| Non-wetlands | 1053.81 | 856.92 | 949.41 | 1362.87 | 1296.57 |
Disclaimer/Publisher’s Note: The statements, opinions and data contained in all publications are solely those of the individual author(s) and contributor(s) and not of MDPI and/or the editor(s). MDPI and/or the editor(s) disclaim responsibility for any injury to people or property resulting from any ideas, methods, instructions or products referred to in the content. |
© 2023 by the authors. Licensee MDPI, Basel, Switzerland. This article is an open access article distributed under the terms and conditions of the Creative Commons Attribution (CC BY) license (https://creativecommons.org/licenses/by/4.0/).
Share and Cite
Jing, X.; Zhuo, Y.; Xu, Z.; Chen, Y.; Li, G.; Wang, X. Coastal Wetland Restoration Strategies Based on Ecosystem Service Changes: A Case Study of the South Bank of Hangzhou Bay. Land 2023, 12, 1110. https://doi.org/10.3390/land12051110
Jing X, Zhuo Y, Xu Z, Chen Y, Li G, Wang X. Coastal Wetland Restoration Strategies Based on Ecosystem Service Changes: A Case Study of the South Bank of Hangzhou Bay. Land. 2023; 12(5):1110. https://doi.org/10.3390/land12051110
Chicago/Turabian StyleJing, Xin, Yuefei Zhuo, Zhongguo Xu, Yang Chen, Guan Li, and Xueqi Wang. 2023. "Coastal Wetland Restoration Strategies Based on Ecosystem Service Changes: A Case Study of the South Bank of Hangzhou Bay" Land 12, no. 5: 1110. https://doi.org/10.3390/land12051110