
The Impact of Expressway Development on Industrial Structure in Rugged Terrain: The Case of Sichuan Province, China


Abstract
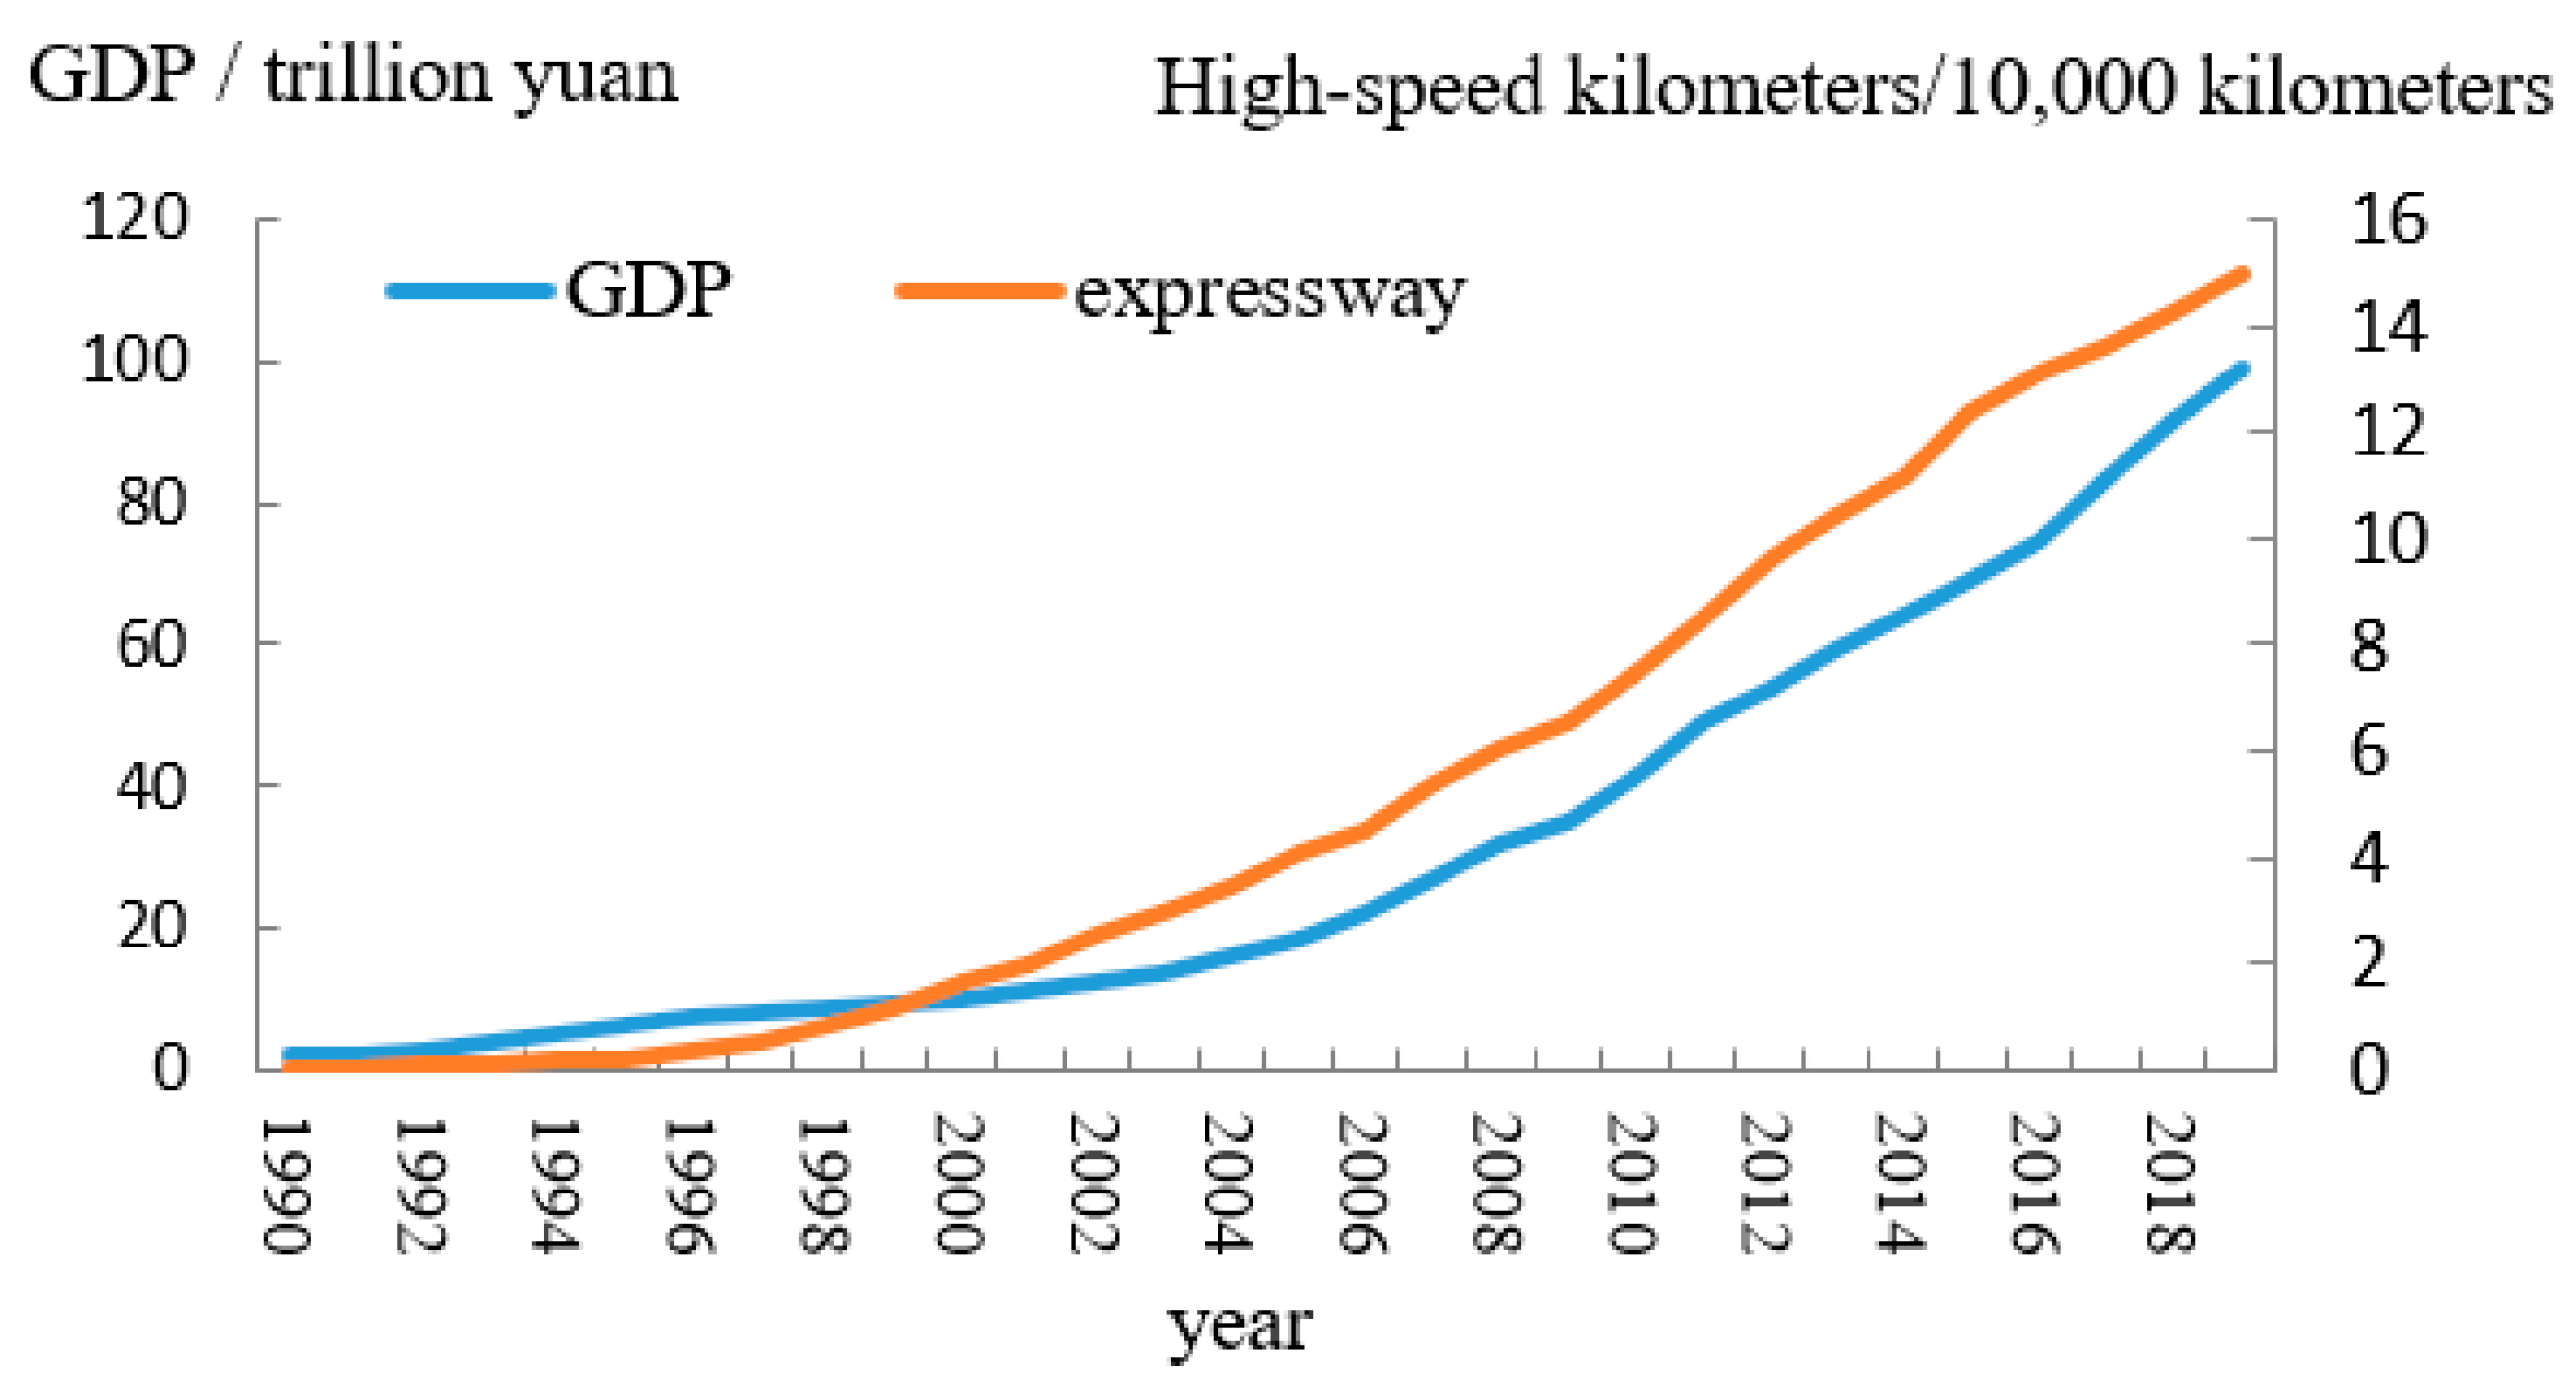
:1. Introduction
2. Study Area and Data Processing
3. Research Methodology
3.1. Industrial Structure Optimization Index
3.2. Difference-in-Differences (DID) Model
3.3. Expressway Impact Model
4. Analysis of Results
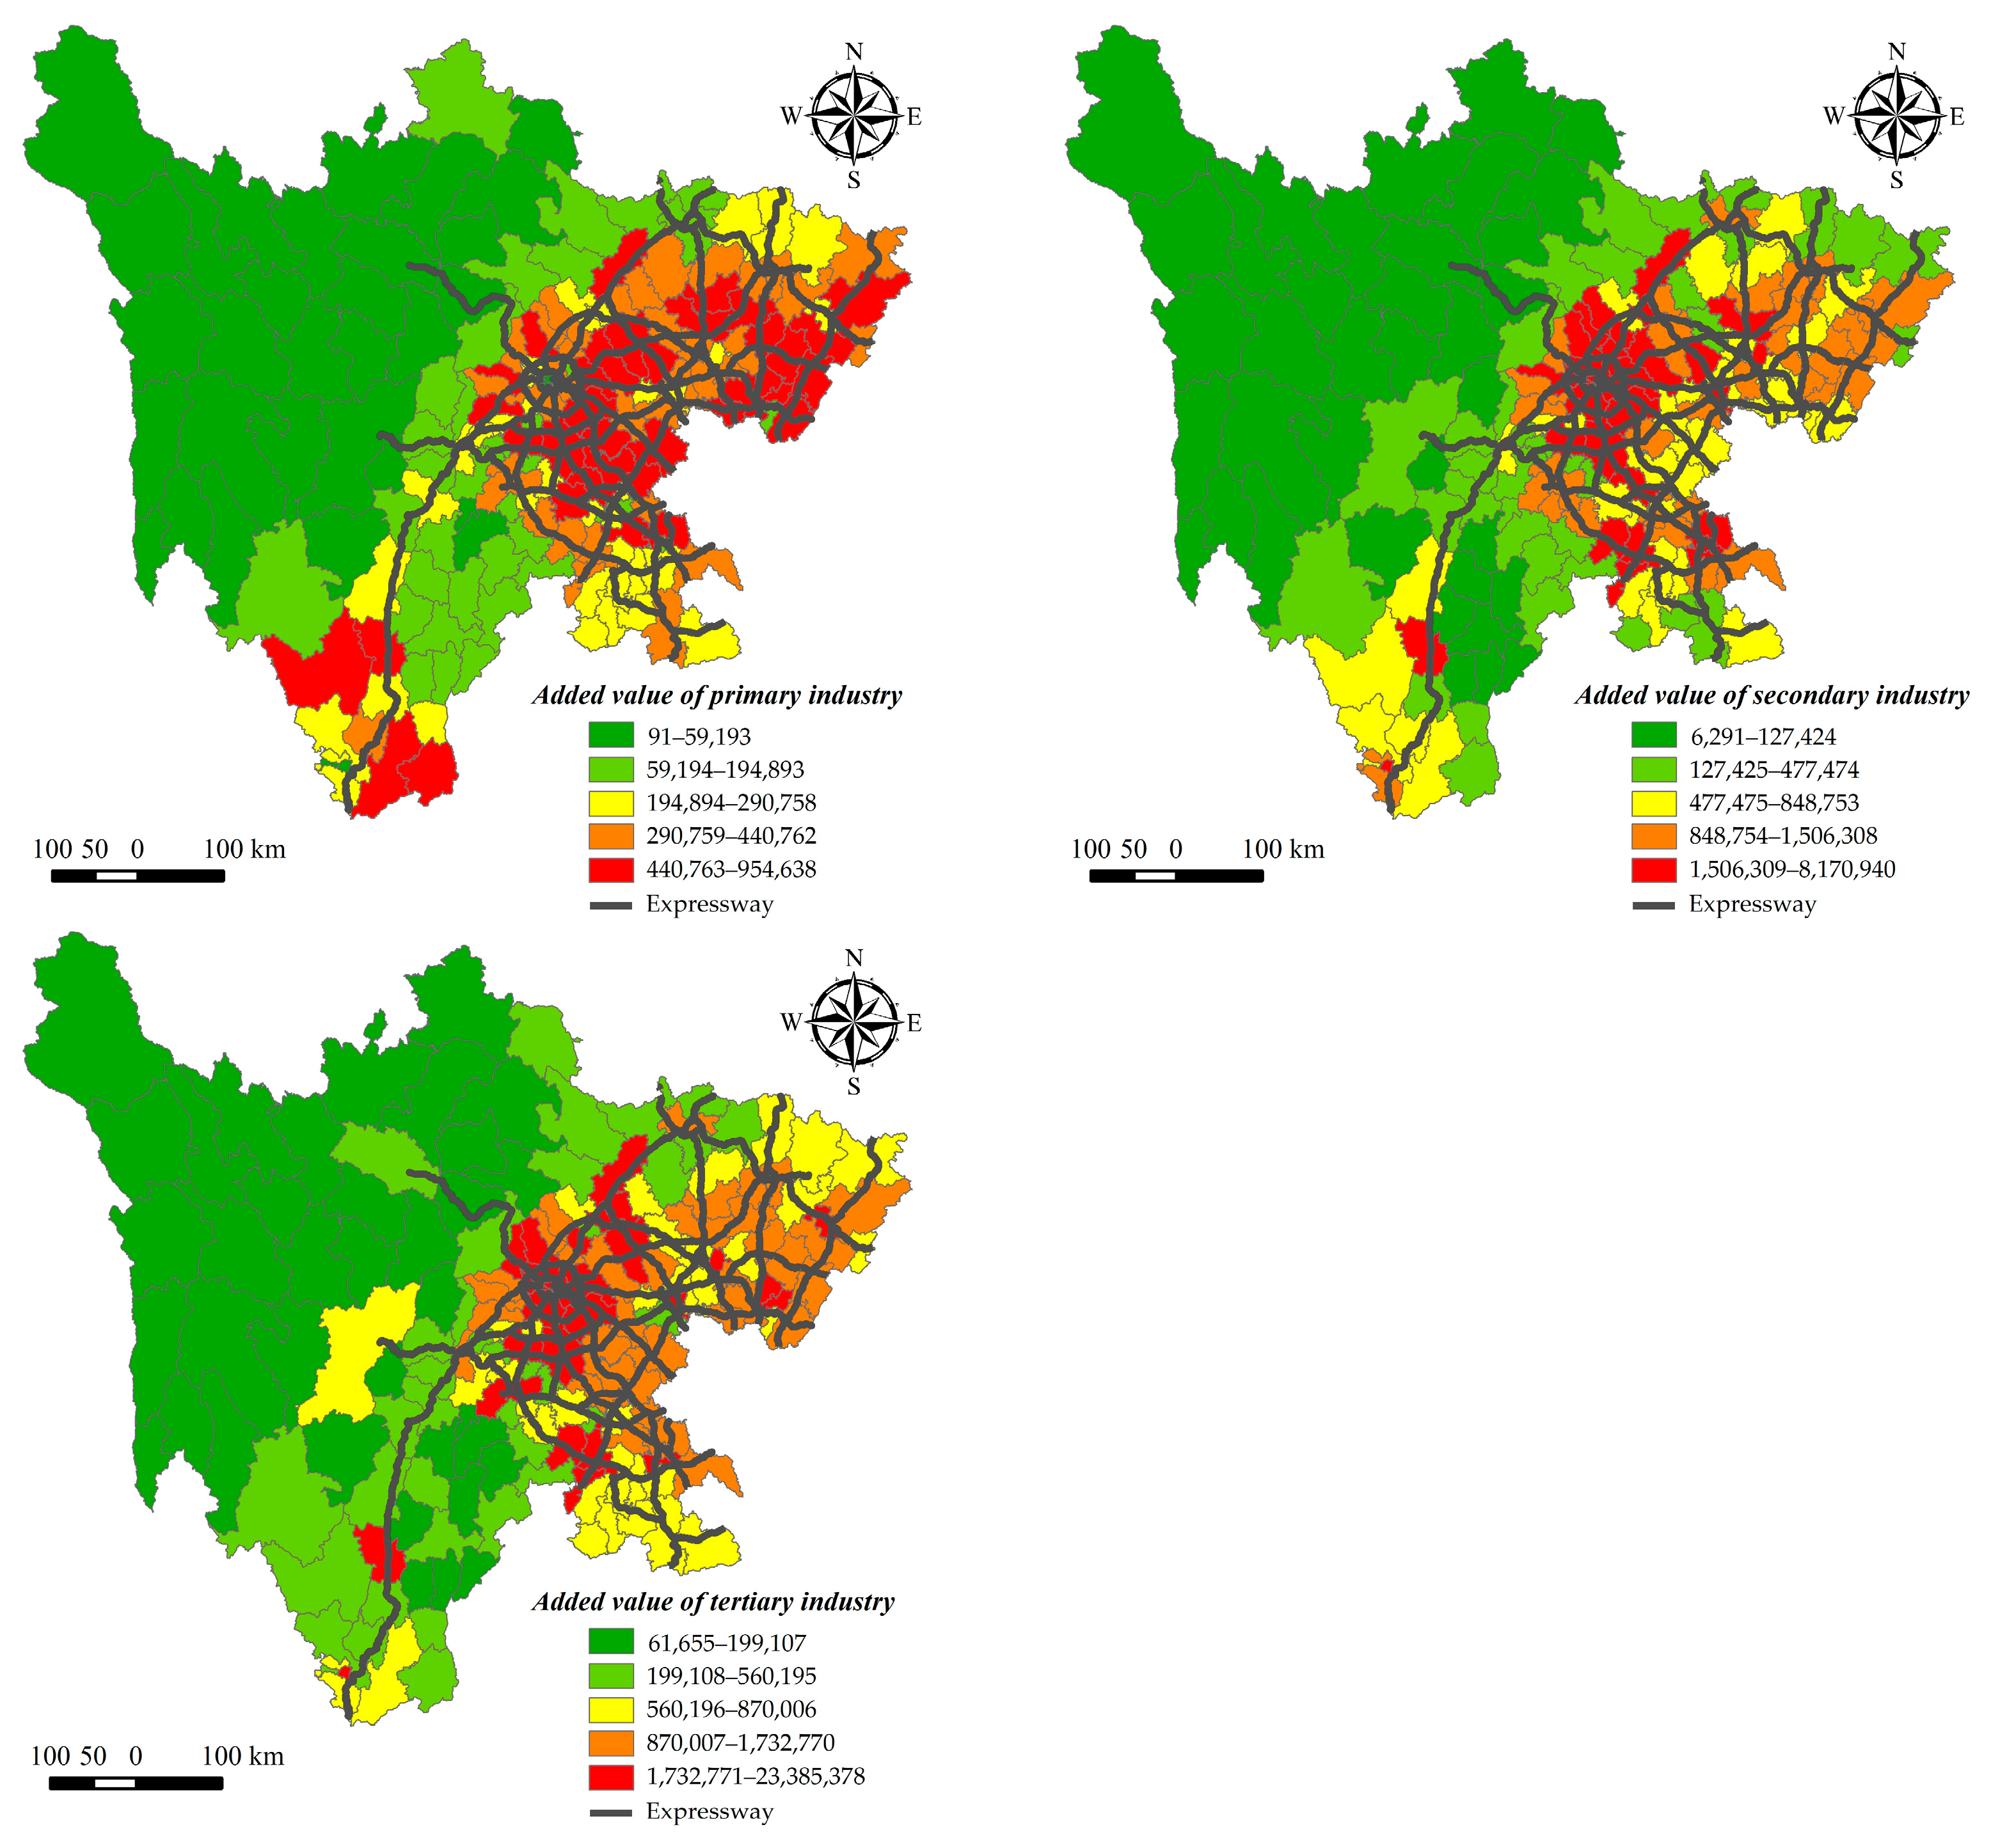
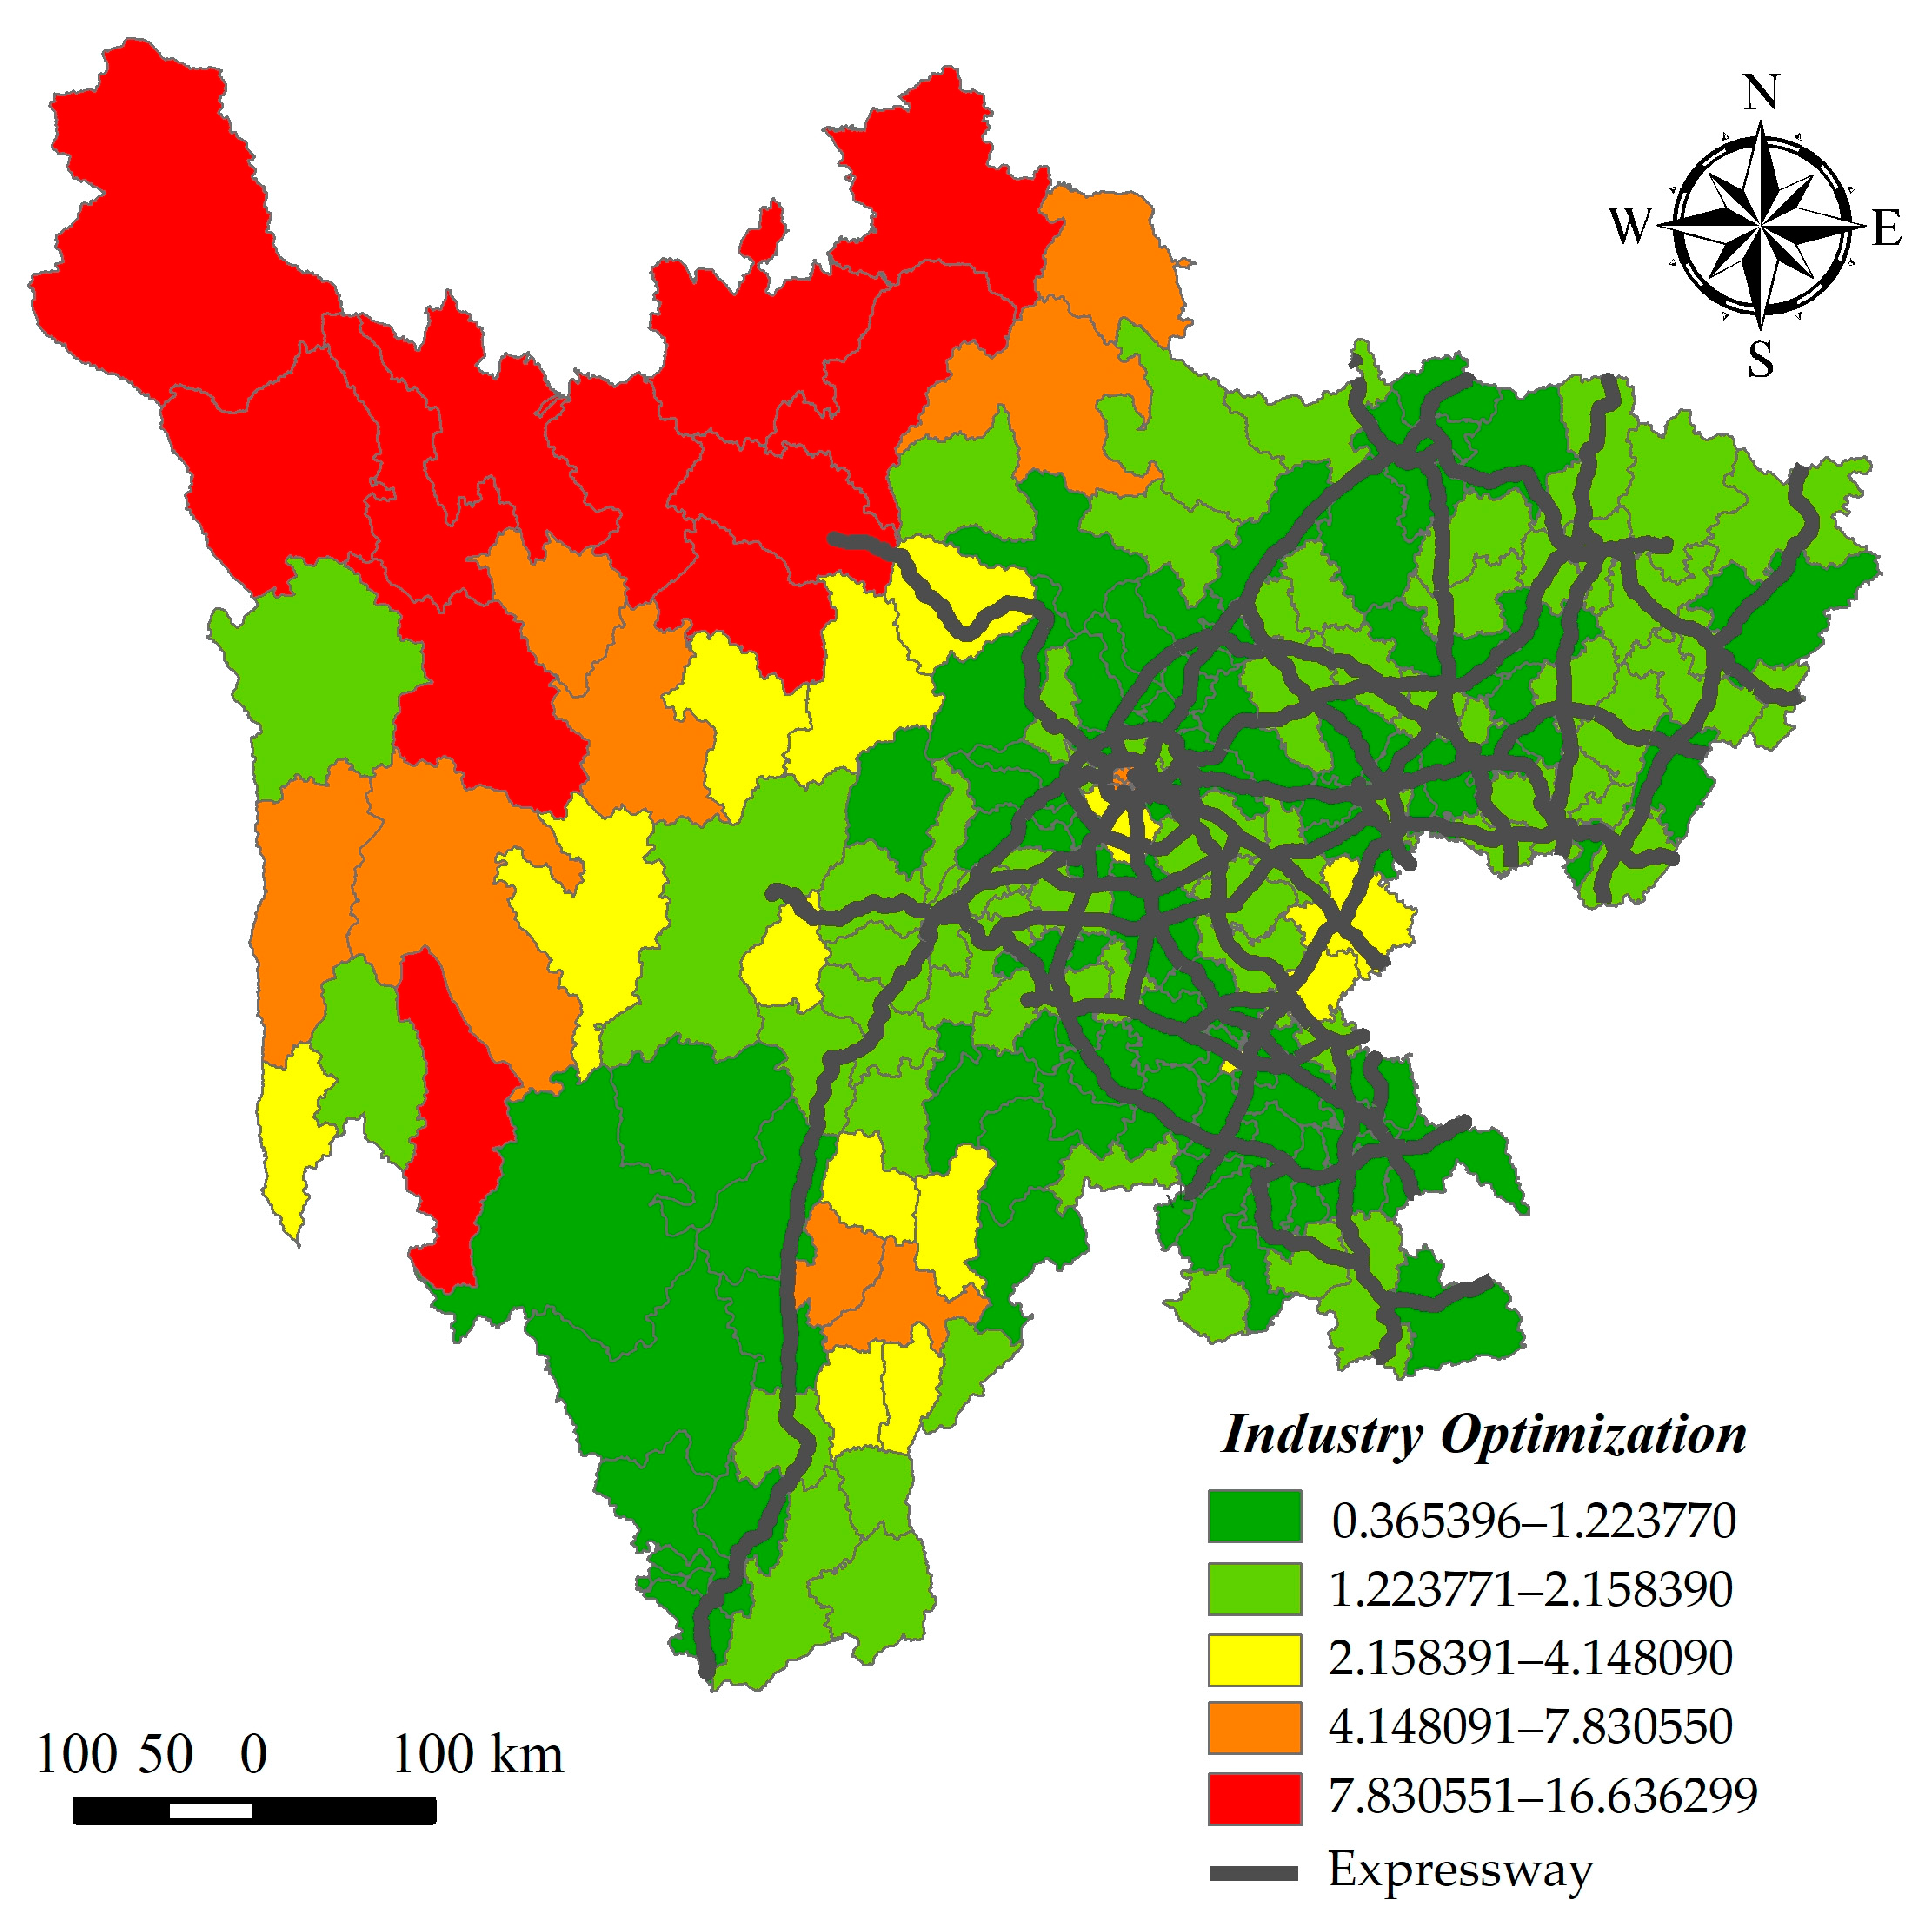
4.1. Spatial Distribution
4.2. Analysis of the Regression Results of the Expressway Impact Model
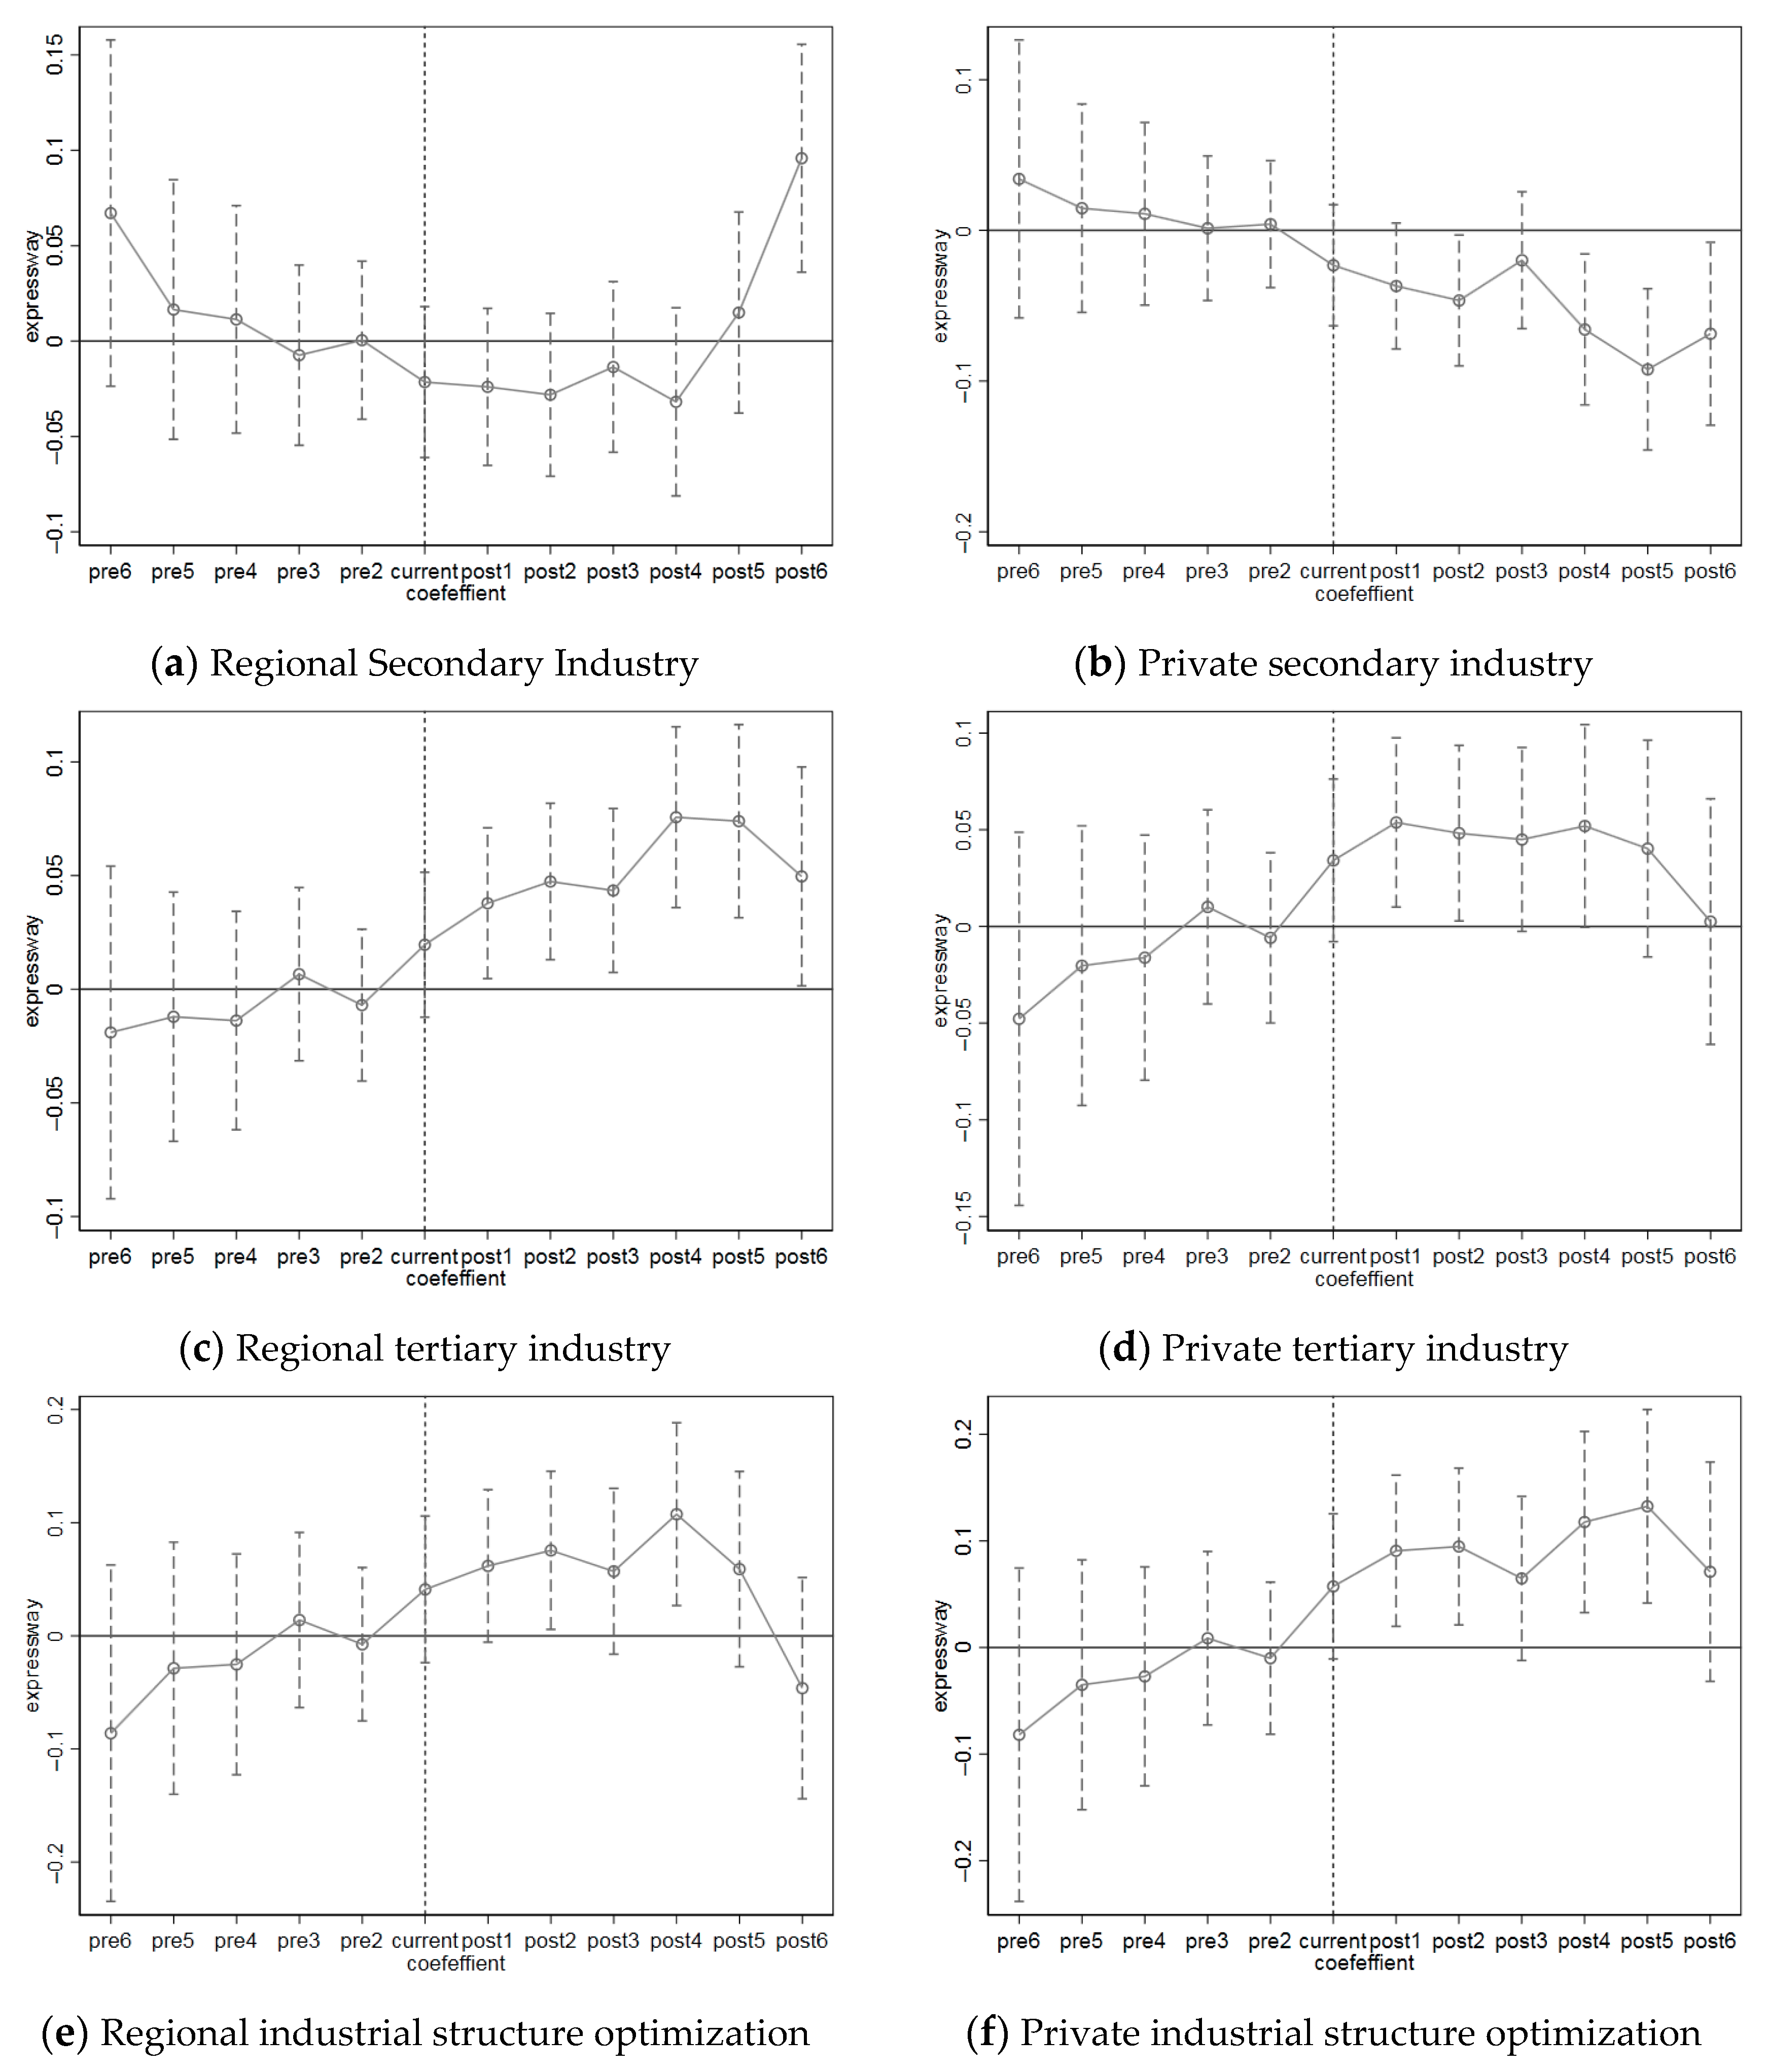
4.2.1. Parallel Trend Test
4.2.2. Analysis of Regression Results
5. Discussion and Conclusions
Author Contributions
Funding
Data Availability Statement
Conflicts of Interest
References
- Zhang, X.; Hu, Y.; Lin, Y. The influence of highway on local economy: Evidence from China’s Yangtze River Delta region. J. Transp. Geogr. 2020, 82, 102600. [Google Scholar] [CrossRef]
- Chen, Z.; Li, Y.; Wang, P. Transportation accessibility and regional growth in the Greater Bay Area of China. Transp. Res. Part D Transp. Environ. 2020, 86, 102453. [Google Scholar] [CrossRef]
- Hou, S.; Long, W. The Relationship Between Transportation Infrastructure Investment and Economic Growth—Based on Provincial Spatial Panel Data Model. Adv. Econ. Bus. Manag. Res. 2019, 76, 78–83. [Google Scholar]
- Sun, J. Research on the Impact of transportation Infrastructure on Industrial Structure. E3S Web Conf. 2021, 253, 2055. [Google Scholar] [CrossRef]
- Jiang, X.; He, X.; Zhang, L.; Qin, H.; Shao, F. Multimodal transportation infrastructure investment and regional economic development: A structural equation modeling empirical analysis in China from 1986 to 2011. Transp. Policy 2017, 54, 43–52. [Google Scholar] [CrossRef]
- Li, H.; Liu, Y.; Peng, K. Characterizing the relationship between road infrastructure and local economy using structural equation modeling. Transp. Policy 2018, 61, 17–25. [Google Scholar] [CrossRef]
- Sahoo, P.; Dash, R.K.; Nataraj, G. Infrastructure Development and Economic Growth in China. Inst. Dev. Econ. 2010, 261, 1–33. [Google Scholar]
- Cigu, E.; Agheorghiesei, D.T.; Gavriluță, A.F.; Toader, E. Transport Infrastructure Development, Public Performance and Long-Run Economic Growth: A Case Study for the Eu-28 Countries. Sustainability 2019, 11, 67. [Google Scholar] [CrossRef]
- Baum-Snow, N.; Henderson, J.V.; Turner, M.A.; Zhang, Q.; Brandt, L. Does investment in national highways help or hurt hinterland city growth? J. Urban Econ. 2020, 115, 103124. [Google Scholar] [CrossRef]
- Jubiz-Diaz, M.; Saltarin-Molino, M.; Arellana, J.; Paternina-Arboleda, C.; Yie-Pinedo, R. Effect of Infrastructure Investment and Freight Accessibility on Gross Domestic Product: A Data-Driven Geographical Approach. J. Adv Transp. 2021, 2021, 22. [Google Scholar] [CrossRef]
- Shanhe, J.; Jun, Y.; Enxu, W.; Jun, L. The influence of high-speed rail on ice–snow tourism in northeastern China. Tour Manag. 2020, 78, 104070. [Google Scholar]
- Kim, K.S. High-speed rail developments and spatial restructuring: A case study of the Capital region in South Korea. Cities 2000, 17, 251–262. [Google Scholar] [CrossRef]
- Yang, J.; Guo, A.; Li, X.; Huang, T. Study of the Impact of a High-Speed Railway Opening on China’s Accessibility Pattern and Spatial Equality. Sustainability 2018, 10, 2943. [Google Scholar] [CrossRef]
- Xu, X.; Liu, C. Research on the Impact of Expressway on the County Economy Based on a Spatial DID Model: The Case of Three Provinces of China. Math. Probl. Eng. 2021, 2021, 4028236. [Google Scholar] [CrossRef]
- Dong-Jie, G.; Zi-Hui, L.; Xin-Yu, L.; Yan-Jun, Z. Evaluation of the Yangtze River Economic Belt Road Network Guided by Expressways. Highway 2021, 66, 246–253. [Google Scholar]
- Bian, F.; Yeh, A.G.O. Spatial–economic impact of missing national highway links on China’s regional economy. Transp. Res. Part D Transp. Environ. 2020, 84, 102377. [Google Scholar] [CrossRef]
- Xu, H.; Nakajima, K. Highways and industrial development in the peripheral regions of China. Pap. Reg. Sci. 2015, 96, 325–356. [Google Scholar] [CrossRef]
- Song, M.; Wang, S.; Fisher, R. Transportation, iceberg costs and the adjustment of industrial structure in China. Transp. Res. Part D Transp. Environ. 2014, 32, 278–286. [Google Scholar] [CrossRef]
- Amitabh, C.; Eric, T. Does public infrastructure affect economic activity?: Evidence from the rural interstate highway system. Reg. Sci. Urban Econ. 2000, 30, 457–490. [Google Scholar]
- Muvawala, J.; Sebukeera, H.; Ssebulime, K. Socio-economic impacts of transport infrastructure investment in Uganda: Insight from frontloading expenditure on Uganda’s urban roads and highways. Res. Transp. Econ. 2021, 88, 100971. [Google Scholar] [CrossRef]
- Coşar, A.K.; Demir, B. Domestic road infrastructure and international trade: Evidence from Turkey. J. Dev. Econ. 2016, 118, 232–244. [Google Scholar] [CrossRef]
- Bottasso, A.; Conti, M.; Porto, P.C.D.S.; Ferrari, C.; Tei, A. Roads to growth: The Brazilian way. Res. Transp. Econ. 2021, 90, 101086. [Google Scholar] [CrossRef]
- Qin, Y. ‘No county left behind?’ The distributional impact of high-speed rail upgrades in China. J. Econ. Geogr. 2017, 17, 489–520. [Google Scholar] [CrossRef]
- Holl, A. Highways and productivity in manufacturing firms. J. Urban Econ. 2016, 93, 131–151. [Google Scholar] [CrossRef]
- Ahmed, K.; Bhattacharya, M.; Qazi, A.Q.; Ghumro, N.A. Transport infrastructure and industrial output in Pakistan: An empirical investigation. Res. Transp. Econ. 2021, 90, 101040. [Google Scholar] [CrossRef]
- Kim, H.; Ahn, S.; Ulfarsson, G.F. Transportation infrastructure investment and the location of new manufacturing around South Korea’s West Coast Expressway. Transp. Policy 2018, 66, 146–154. [Google Scholar] [CrossRef]
- Zhou, J.T. The impacts of highways on firm size distribution: Evidence from China. Growth Chang. 2022, 1–25. [Google Scholar] [CrossRef]
- Guy, M. The Effect of Trade on the Demand for Skill: Evidence from the Interstate Highway System. Rev. Econ. Stat. 2008, 90, 683–701. [Google Scholar]
- Jiwattanakulpaisarn, P.; Noland, R.B.; Graham, D.J. Causal linkages between highways and sector-level employment. Transp. Res. Part A Policy Pract. 2010, 44, 265–280. [Google Scholar] [CrossRef]
- Zhang, F.; Graham, D.J.; Wong, M.S.C. Quantifying the substitutability and complementarity between high-speed rail and air transport. Transp. Res. Part A Policy Pract. 2018, 118, 191–215. [Google Scholar] [CrossRef]
- Gan, C.H.; Zheng, R.G.; Yu, D.F. An empirical study on the effects of industrial structure on economic growth and fluctuations in China. Econ. Res. J. 2011, 5, 4–16. [Google Scholar]
- Wooldridge, J.M. Introductory Econometrics: A Modern Approach; Nelson Education: Toronto, ON, Canada, 2015. [Google Scholar]
- Wooldridge, J.M. Econometric Analysis of Cross Section and Panel Data; The MIT Press: Cambridge, MA, USA, 2010. [Google Scholar]
- Su, M.; Hu, B.; Luan, W.; Tian, C. Effects of COVID-19 on China’s civil aviation passenger transport market. Res. Transp. Econ. 2022, 96, 101217. [Google Scholar] [CrossRef]


| Control | N | Mean | Sd. | Min. | Max. |
|---|---|---|---|---|---|
| IndustryOptimization | 504 | 1.514 | 1.829 | 0.129 | 14.185 |
| SecondaryIndustry | 504 | 39.638 | 19.419 | 4.386 | 85.677 |
| TertiaryIndustry | 504 | 34.866 | 12.245 | 10.801 | 75.128 |
| Privately_IndustryOptimization | 504 | 0.96 | 0.956 | 0.099 | 5.48 |
| LNPrivately_SecondaryIndustry | 504 | 10.705 | 1.635 | 7.139 | 13.834 |
| LNPrivately_TertiaryIndustry | 504 | 10.284 | 1.183 | 8.026 | 13.896 |
| AGDP | 504 | 25,138.28 | 19,076.407 | 5670 | 124,312 |
| PopulationDensity | 504 | 128.342 | 336.921 | 3.255 | 2298.802 |
| Employees | 504 | 10.283 | 8.771 | 1.49 | 47.7 |
| SocialConsumptionProportion | 504 | 31.514 | 11.189 | 5.489 | 70.505 |
| FixedAssetsInvestmentProportion | 504 | 1.424 | 1.323 | 0.167 | 23.619 |
| UrbanizationRate | 504 | 29.146 | 17.083 | 4.587 | 99.1 |
| Treaded | |||||
| IndustryOptimization | 936 | 0.754 | 0.752 | 0.158 | 16.636 |
| SecondaryIndustry | 936 | 50.7 | 11.775 | 5.192 | 82.406 |
| TertiaryIndustry | 936 | 32.62 | 10.277 | 13.012 | 86.384 |
| Privately_IndustryOptimization | 936 | 0.585 | 0.428 | 0.133 | 7.412 |
| LNPrivately_SecondaryIndustry | 936 | 13.101 | 0.810 | 9.074 | 15.087 |
| LNPrivately_TertiaryIndustry | 936 | 12.406 | 0.903 | 8.907 | 14.897 |
| AGDP | 936 | 36,789.091 | 18,238.644 | 9379 | 121,034 |
| PopulationDensity | 936 | 473.243 | 388.182 | 8.812 | 3431.39 |
| Employees | 936 | 34.672 | 18.408 | 0 | 95.86 |
| SocialConsumptionProportion | 936 | 39.497 | 12.730 | 9.891 | 122.445 |
| FixedAssetsInvestmentProportion | 936 | 0.915 | 0.385 | 0.225 | 3.633 |
| UrbanizationRate | 936 | 41.598 | 16.043 | 7.729 | 99.41 |
| Variables | LNSecondaryIndustry | LNPrivately_SecondaryIndustry | LNSecondaryIndustry | LNPrivately_SecondaryIndustry |
|---|---|---|---|---|
| Coef. | Coef. | Coef. | Coef. | |
| expressway | −0.042 | −0.053 * | −0.028 * | −0.032 * |
| (−1.56) | (−1.71) | (−1.75) | (−1.68) | |
| LNAGDP | 1.417 *** | 1.555 *** | ||
| (15.44) | (13.27) | |||
| LNPopulationDensity | 1.123 *** | 1.239 *** | ||
| (6.57) | (7.04) | |||
| LNEmployees | −0.177 *** | −0.275 *** | ||
| (−3.50) | (−3.83) | |||
| SocialConsumptionProportion | −0.001 | −0.002 | ||
| (−0.68) | (−1.42) | |||
| FixedAssetsInvestmentProportion | 0.017 * | 0.015 * | ||
| (1.75) | (1.86) | |||
| UrbanizationRate | −0.002 * | −0.003 ** | ||
| (−1.69) | (−2.43) | |||
| 2012.Year | 0.174 *** | 0.184 *** | −0.012 | −0.019 |
| (19.98) | (23.00) | (−0.85) | (−1.14) | |
| 2013.Year | 0.284 *** | 0.329 *** | −0.014 | 0.016 |
| (18.05) | (20.09) | (−0.47) | (0.47) | |
| 2014.Year | 0.368 *** | 0.429 *** | −0.037 | 0.002 |
| (16.48) | (18.14) | (−1.00) | (0.05) | |
| 2015.Year | 0.396 *** | 0.468 *** | −0.088 ** | −0.043 |
| (15.64) | (17.78) | (−2.05) | (−0.84) | |
| 2016.Year | 0.447 *** | 0.535 *** | −0.138 *** | −0.085 |
| (14.57) | (15.74) | (−2.75) | (−1.38) | |
| 2017.Year | 0.471 *** | 0.532 *** | −0.241 *** | −0.225 *** |
| (13.44) | (13.84) | (−3.98) | (−2.99) | |
| 2018.Year | 0.543 *** | 0.618 *** | −0.272 *** | −0.253 *** |
| (14.23) | (14.52) | (−4.00) | (−3.01) | |
| 2019.Year | 0.385 *** | 0.559 *** | −0.640 *** | −0.543 *** |
| (9.43) | (12.46) | (−8.87) | (−5.43) | |
| _cons | 12.408 *** | 11.879 *** | −6.627 *** | −8.768 *** |
| (838.21) | (770.31) | (−4.46) | (−4.98) | |
| N | 1440 | 1440 | 1439 | 1439 |
| R2 | 0.425 | 0.491 | 0.676 | 0.738 |
| Variables | LNTertiaryIndustry | LNPrivately_TertiaryIndustry | LNTertiaryIndustry | LNPrivately_TertiaryIndustry |
|---|---|---|---|---|
| Coef. | Coef. | Coef. | Coef. | |
| expressway | 0.038 ** | 0.046 ** | 0.036 ** | 0.047 ** |
| (2.39) | (2.23) | (2.19) | (2.17) | |
| LNAGDP | 0.602 *** | 0.592 *** | ||
| (10.10) | (7.66) | |||
| LNPopulationDensity | 0.584 *** | 0.560 *** | ||
| (5.07) | (4.21) | |||
| LNEmployees | 0.031 | 0.092 | ||
| (0.62) | (1.21) | |||
| SocialConsumptionProportion | 0.003 *** | 0.002 | ||
| (2.68) | (1.35) | |||
| FixedAssetsInvestmentProportion | −0.001 | −0.006 | ||
| (−0.21) | (−1.05) | |||
| UrbanizationRate | 0.001 | 0.000 | ||
| (0.70) | (0.28) | |||
| 2012.Year | 0.118 *** | 0.127 *** | 0.034 *** | 0.043 *** |
| (46.59) | (34.06) | (3.99) | (3.82) | |
| 2013.Year | 0.229 *** | 0.235 *** | 0.074 *** | 0.087 *** |
| (45.19) | (33.77) | (3.56) | (3.66) | |
| 2014.Year | 0.341 *** | 0.347 *** | 0.128 *** | 0.144 *** |
| (42.25) | (28.05) | (4.90) | (4.65) | |
| 2015.Year | 0.451 *** | 0.453 *** | 0.195 *** | 0.210 *** |
| (45.37) | (31.78) | (6.43) | (5.86) | |
| 2016.Year | 0.588 *** | 0.578 *** | 0.282 *** | 0.286 *** |
| (41.70) | (28.64) | (7.64) | (6.65) | |
| 2017.Year | 0.814 *** | 0.799 *** | 0.449 *** | 0.451 *** |
| (41.49) | (32.08) | (10.12) | (8.52) | |
| 2018.Year | 0.917 *** | 0.902 *** | 0.508 *** | 0.511 *** |
| (44.42) | (34.51) | (10.40) | (8.87) | |
| 2019.Year | 1.282 *** | 1.389 *** | 0.785 *** | 0.913 *** |
| (66.24) | (52.47) | (14.03) | (13.74) | |
| _cons | 11.879 *** | 11.107 *** | 2.834 *** | 2.142 * |
| (1865.17) | (1344.47) | (2.86) | (1.79) | |
| N | 1440 | 1440 | 1439 | 1439 |
| R2 | 0.925 | 0.894 | 0.937 | 0.905 |
| Variables | LNIndustryOptimization | LNPrivately_IndustryOptimization | LNIndustryOptimization | LNPrivately_IndustryOptimization |
|---|---|---|---|---|
| Coef. | Coef. | Coef. | Coef. | |
| expressway | 0.080 ** | 0.100 *** | 0.064 ** | 0.079 ** |
| (2.49) | (2.65) | (2.25) | (2.35) | |
| LNAGDP | −0.815 *** | −0.962 *** | ||
| (−6.28) | (−6.17) | |||
| LNPopulationDensity | −0.539 ** | −0.679 *** | ||
| (−2.43) | (−2.89) | |||
| LNEmployees | 0.208 *** | 0.366 *** | ||
| (2.70) | (3.43) | |||
| SocialConsumptionProportion | 0.003 * | 0.003 * | ||
| (1.83) | (1.70) | |||
| FixedAssetsInvestmentProportion | −0.018 | −0.020 * | ||
| (−1.62) | (−1.69) | |||
| UrbanizationRate | 0.003 | 0.003 | ||
| (1.35) | (1.57) | |||
| 2012.Year | −0.056 *** | −0.058 *** | 0.046 ** | 0.062 *** |
| (−6.40) | (−6.94) | (2.37) | (2.75) | |
| 2013.Year | −0.055 *** | −0.093 *** | 0.087 ** | 0.072 |
| (−3.52) | (−5.35) | (2.08) | (1.54) | |
| 2014.Year | −0.027 | −0.082 *** | 0.165 *** | 0.142 ** |
| (−1.15) | (−3.04) | (3.14) | (2.36) | |
| 2015.Year | 0.055 ** | −0.015 | 0.283 *** | 0.253 *** |
| (2.10) | (−0.53) | (4.66) | (3.62) | |
| 2016.Year | 0.140 *** | 0.043 | 0.419 *** | 0.372 *** |
| (4.22) | (1.17) | (5.83) | (4.47) | |
| 2017.Year | 0.344 *** | 0.267 *** | 0.690 *** | 0.676 *** |
| (7.98) | (5.39) | (7.89) | (6.52) | |
| 2018.Year | 0.373 *** | 0.283 *** | 0.780 *** | 0.764 *** |
| (7.97) | (5.26) | (7.98) | (6.62) | |
| 2019.Year | 0.897 *** | 0.830 *** | 1.425 *** | 1.456 *** |
| (21.28) | (17.38) | (13.51) | (10.86) | |
| _cons | −0.529 *** | −0.773 *** | 9.461 *** | 10.910 *** |
| (−32.76) | (−44.64) | (4.68) | (4.59) | |
| N | 1440 | 1440 | 1439 | 1439 |
| R2 | 0.653 | 0.603 | 0.690 | 0.659 |
Disclaimer/Publisher’s Note: The statements, opinions and data contained in all publications are solely those of the individual author(s) and contributor(s) and not of MDPI and/or the editor(s). MDPI and/or the editor(s) disclaim responsibility for any injury to people or property resulting from any ideas, methods, instructions or products referred to in the content. |
© 2023 by the authors. Licensee MDPI, Basel, Switzerland. This article is an open access article distributed under the terms and conditions of the Creative Commons Attribution (CC BY) license (https://creativecommons.org/licenses/by/4.0/).
Share and Cite
Su, M.; Guo, M.; Luan, W.; Pian, F. The Impact of Expressway Development on Industrial Structure in Rugged Terrain: The Case of Sichuan Province, China. Land 2023, 12, 1071. https://doi.org/10.3390/land12051071
Su M, Guo M, Luan W, Pian F. The Impact of Expressway Development on Industrial Structure in Rugged Terrain: The Case of Sichuan Province, China. Land. 2023; 12(5):1071. https://doi.org/10.3390/land12051071
Chicago/Turabian StyleSu, Min, Miaomiao Guo, Weixin Luan, and Feng Pian. 2023. "The Impact of Expressway Development on Industrial Structure in Rugged Terrain: The Case of Sichuan Province, China" Land 12, no. 5: 1071. https://doi.org/10.3390/land12051071