
The Function of Money in Water–Energy–Food and Land Nexus


Abstract
:1. Introduction
“If a group of hunter-gatherers went to colonize an isolated island, first they had to act as primitive engineers and find water, after that they had to organize their production to produce food as farmers and, if they could stabilize the prosperity of the new society, after thousands of years they would need an economist”.
2. The Role of Money
The word “money”, as it is used in economics, has two very different meanings.
[…] a unit of measurement, denoting the value in exchange of all goods and services.
[…] a means of payment and, as such, money is also a medium of exchange.
The particular commodity, with whose bodily form the equivalent form is thus socially identified, now becomes the money commodity, or serves as money. It becomes the special social function of that commodity, and consequently its social monopoly, to play within the world of commodities the part of the universal equivalent.
Since all commodities are merely particular equivalents of money, the latter being their universal equivalent, they, with regard to the latter as the universal commodity, play the parts of particular commodities (ibid.).
Capital is not the sum of the material and produced means of production. Capital is rather the means of production transformed into capital, which in themselves are no more capital than gold or silver in itself is money.
The world has been living without an international standard of value for decades, a situation which should be considered as inefficient as operating without standard of length or weight.
3. Incorporation of the Social System into Water–Energy–Food and Land Nexus
3.1. Water
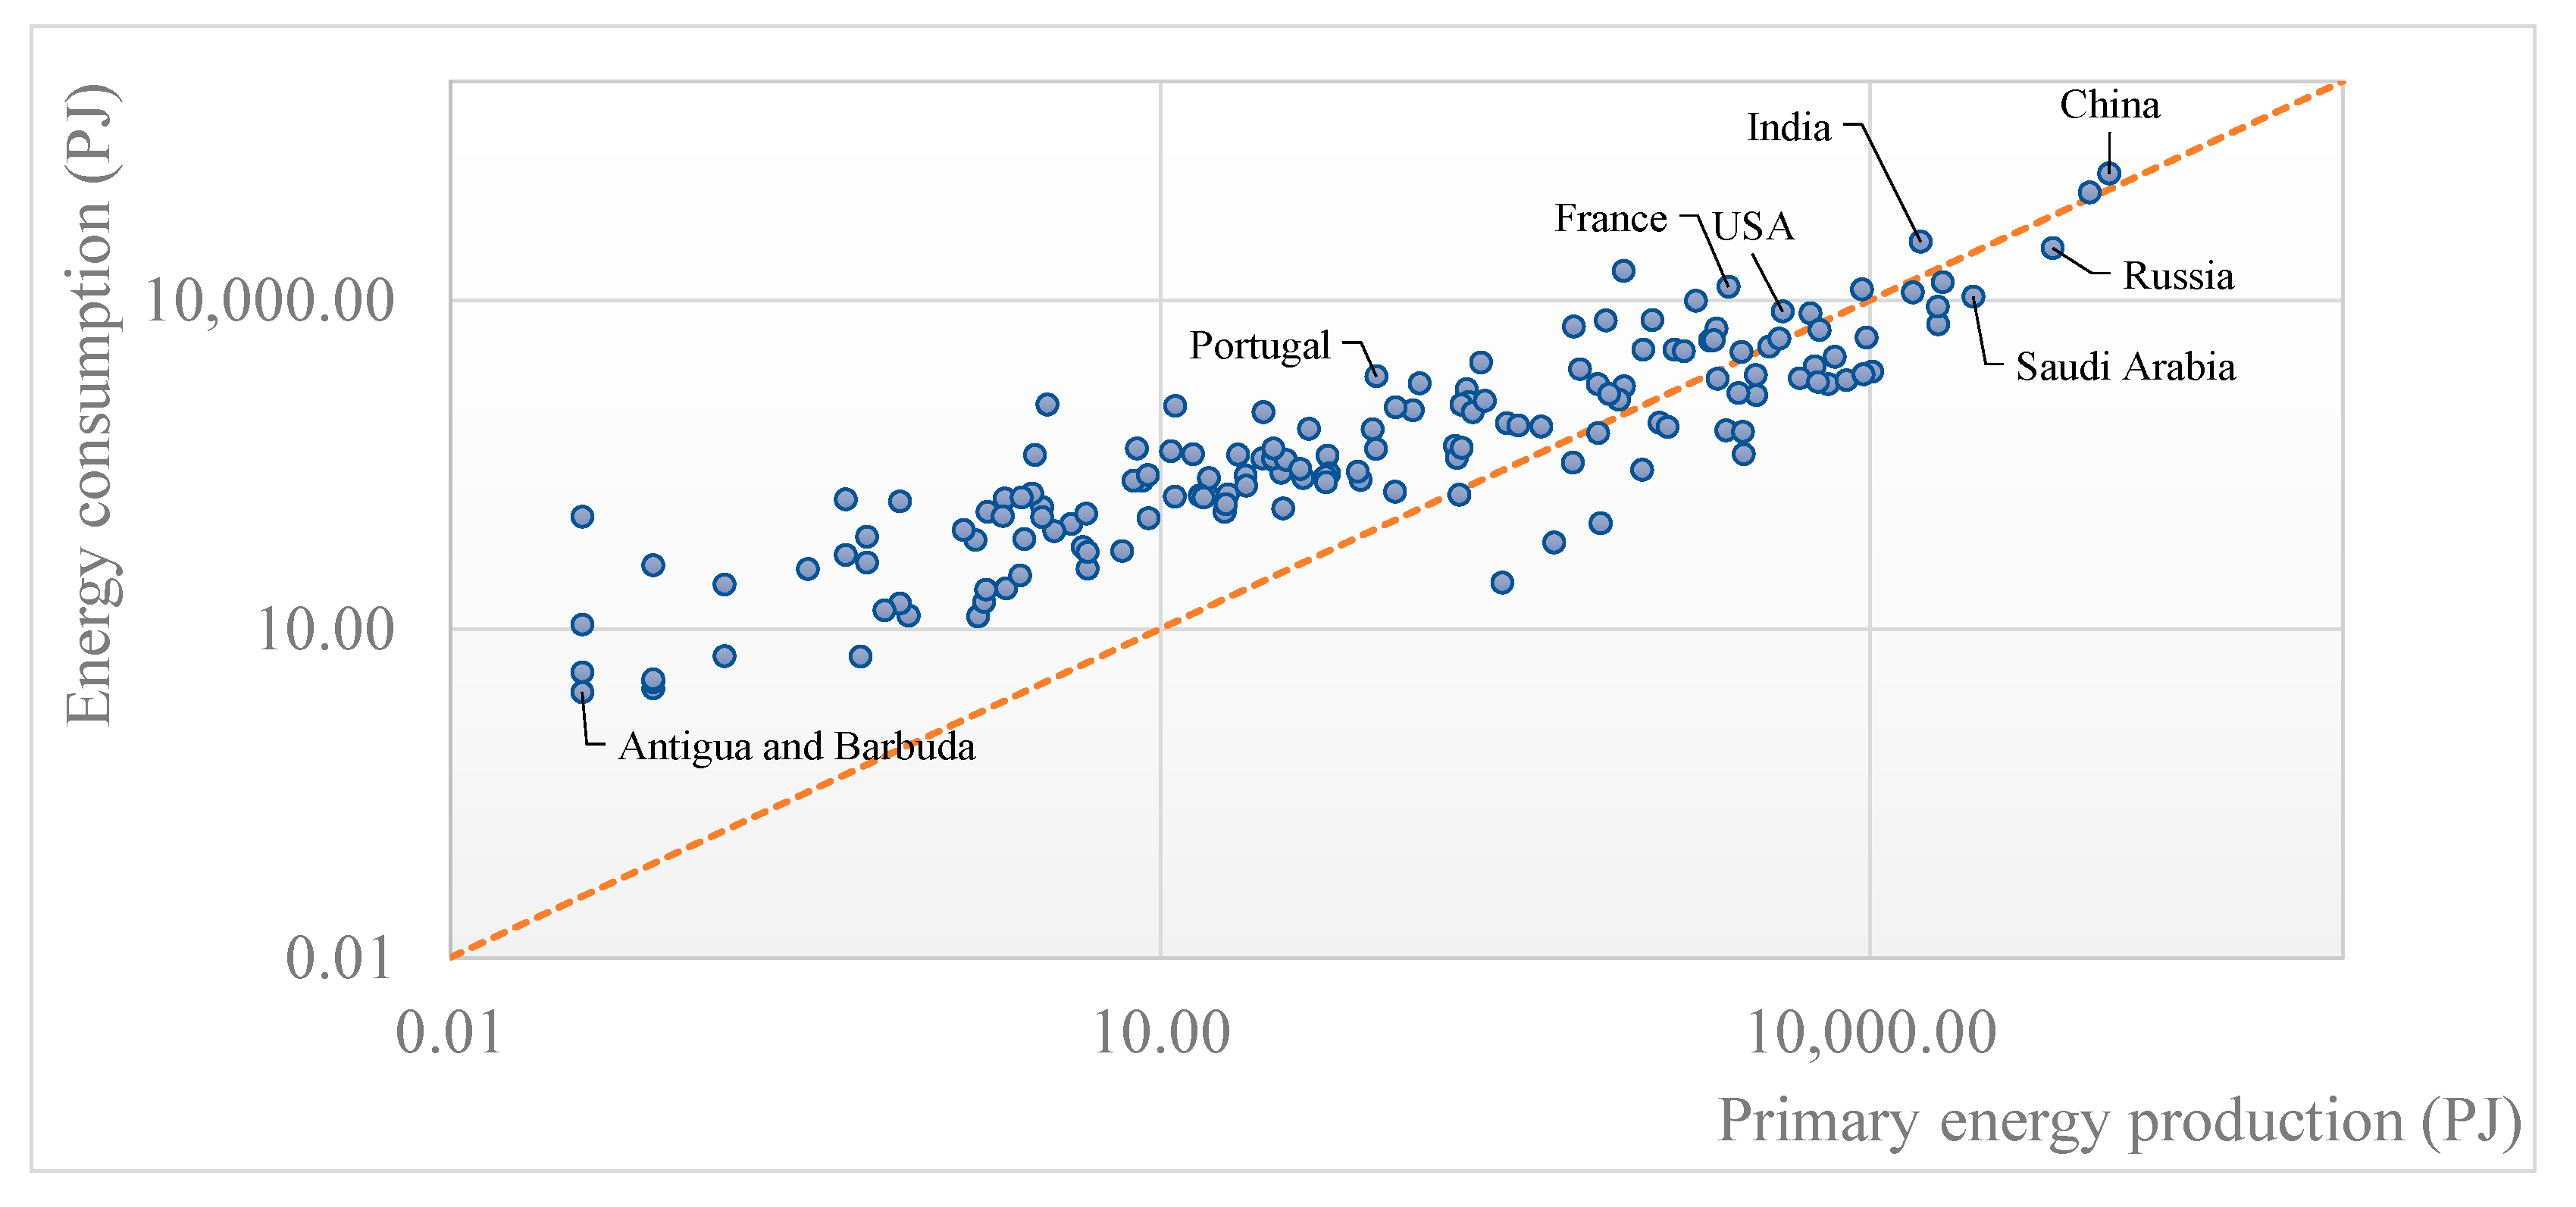
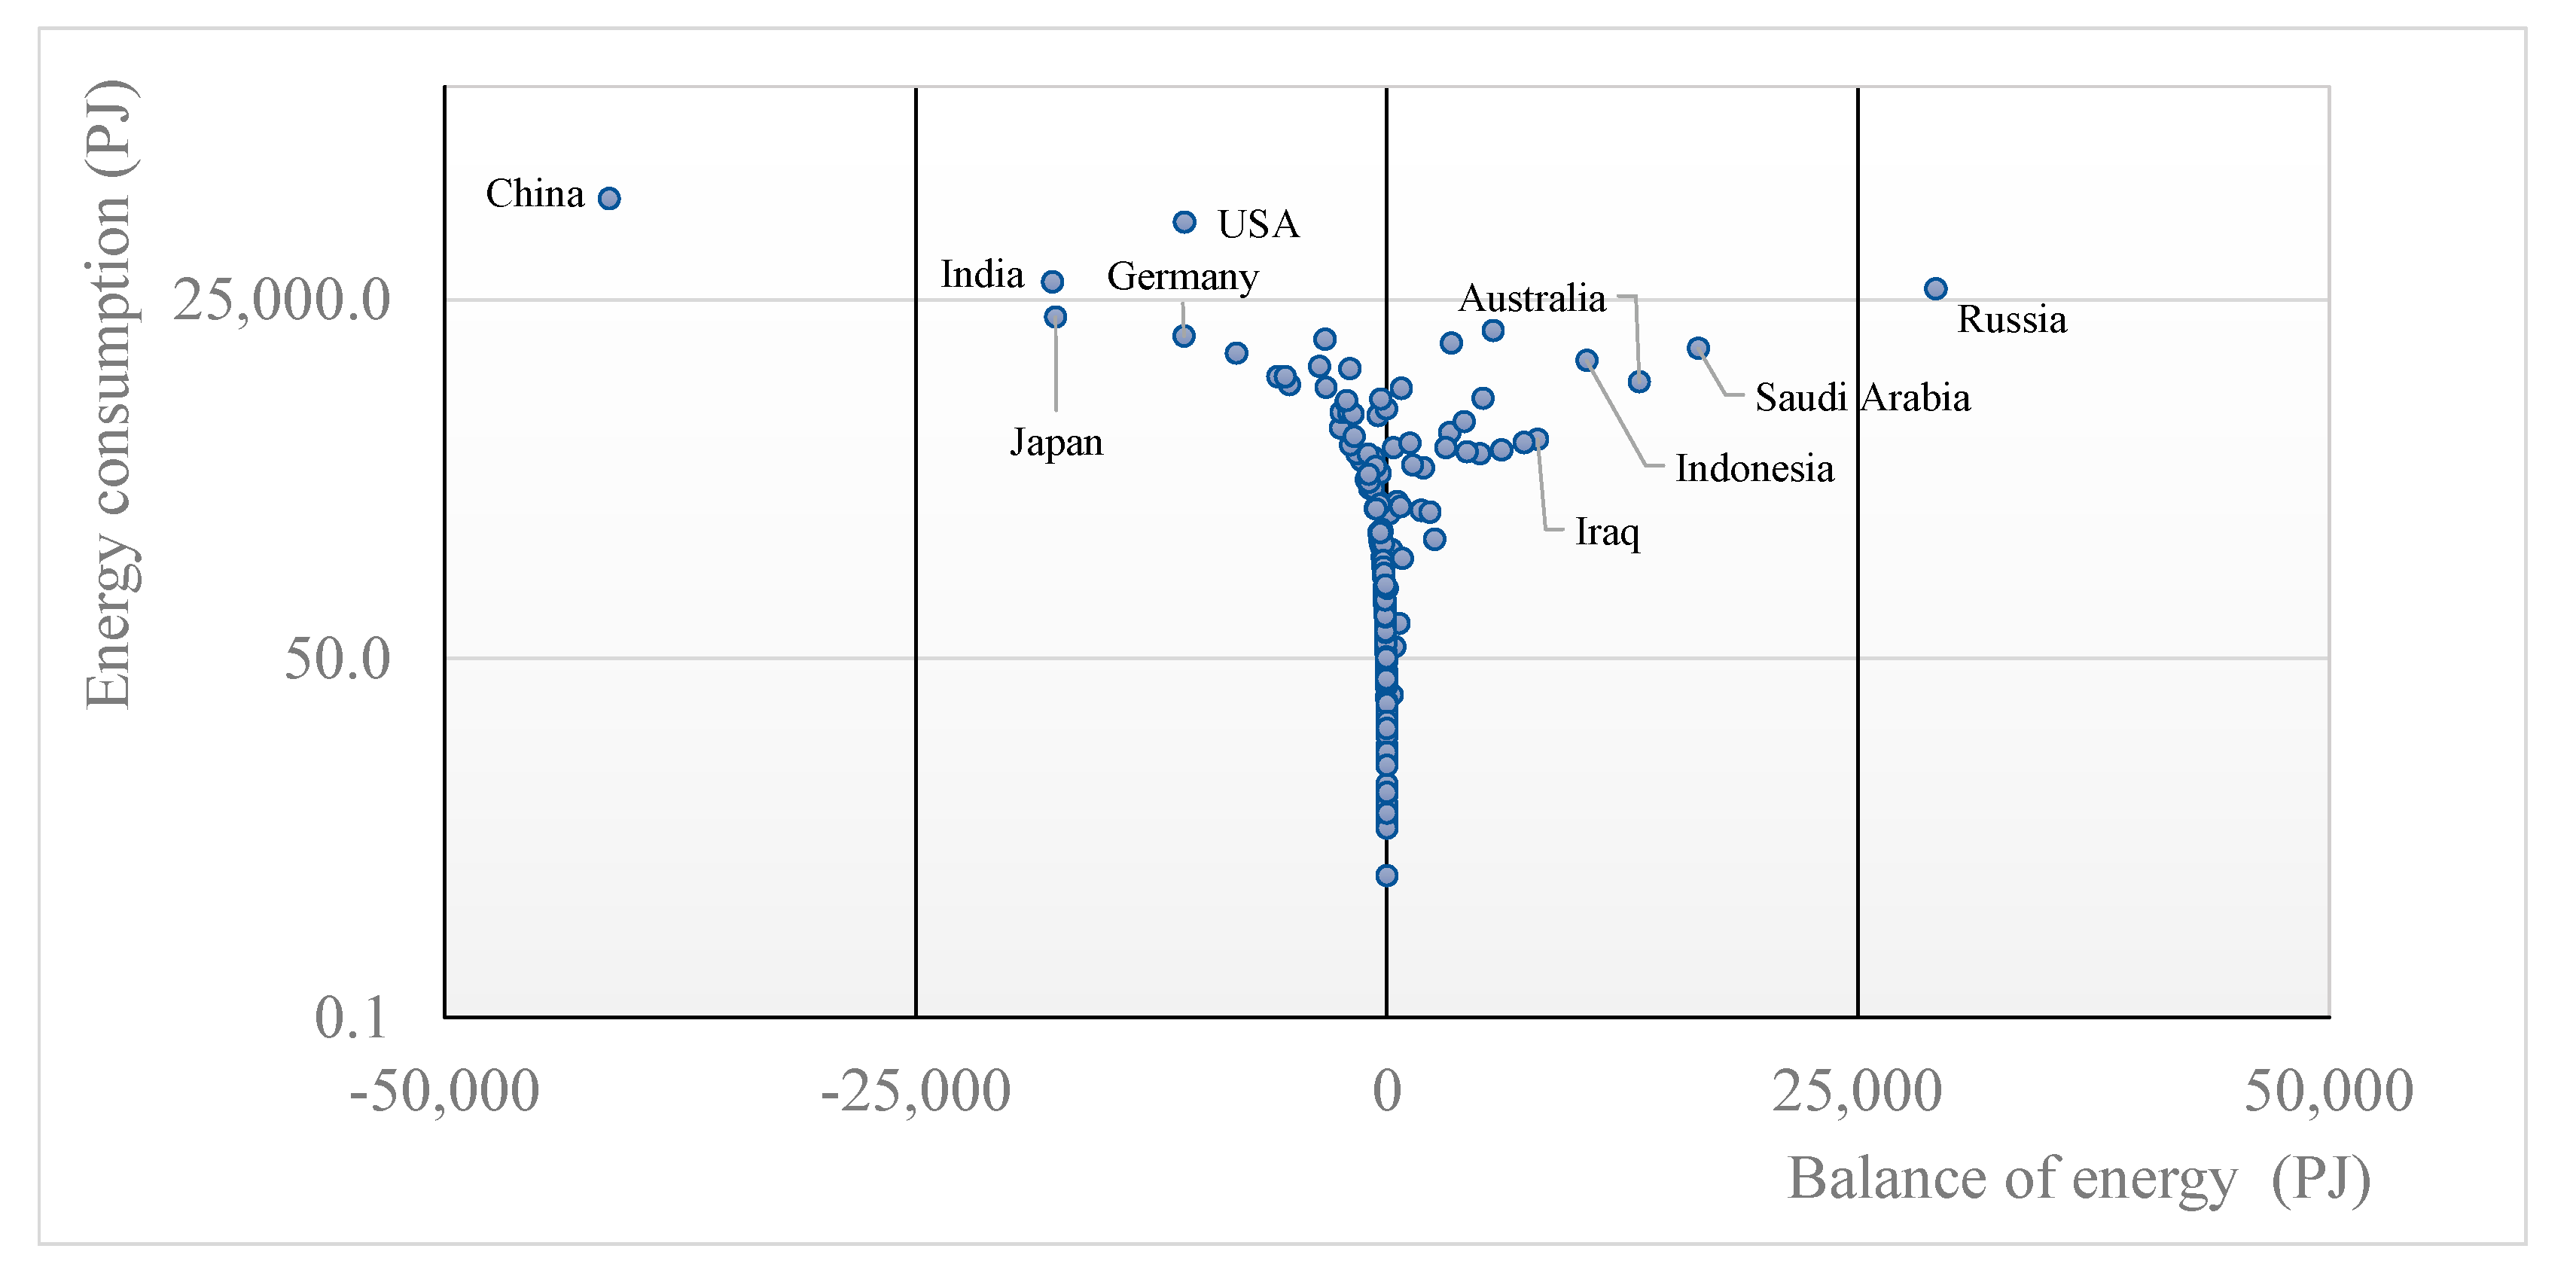
3.2. Energy
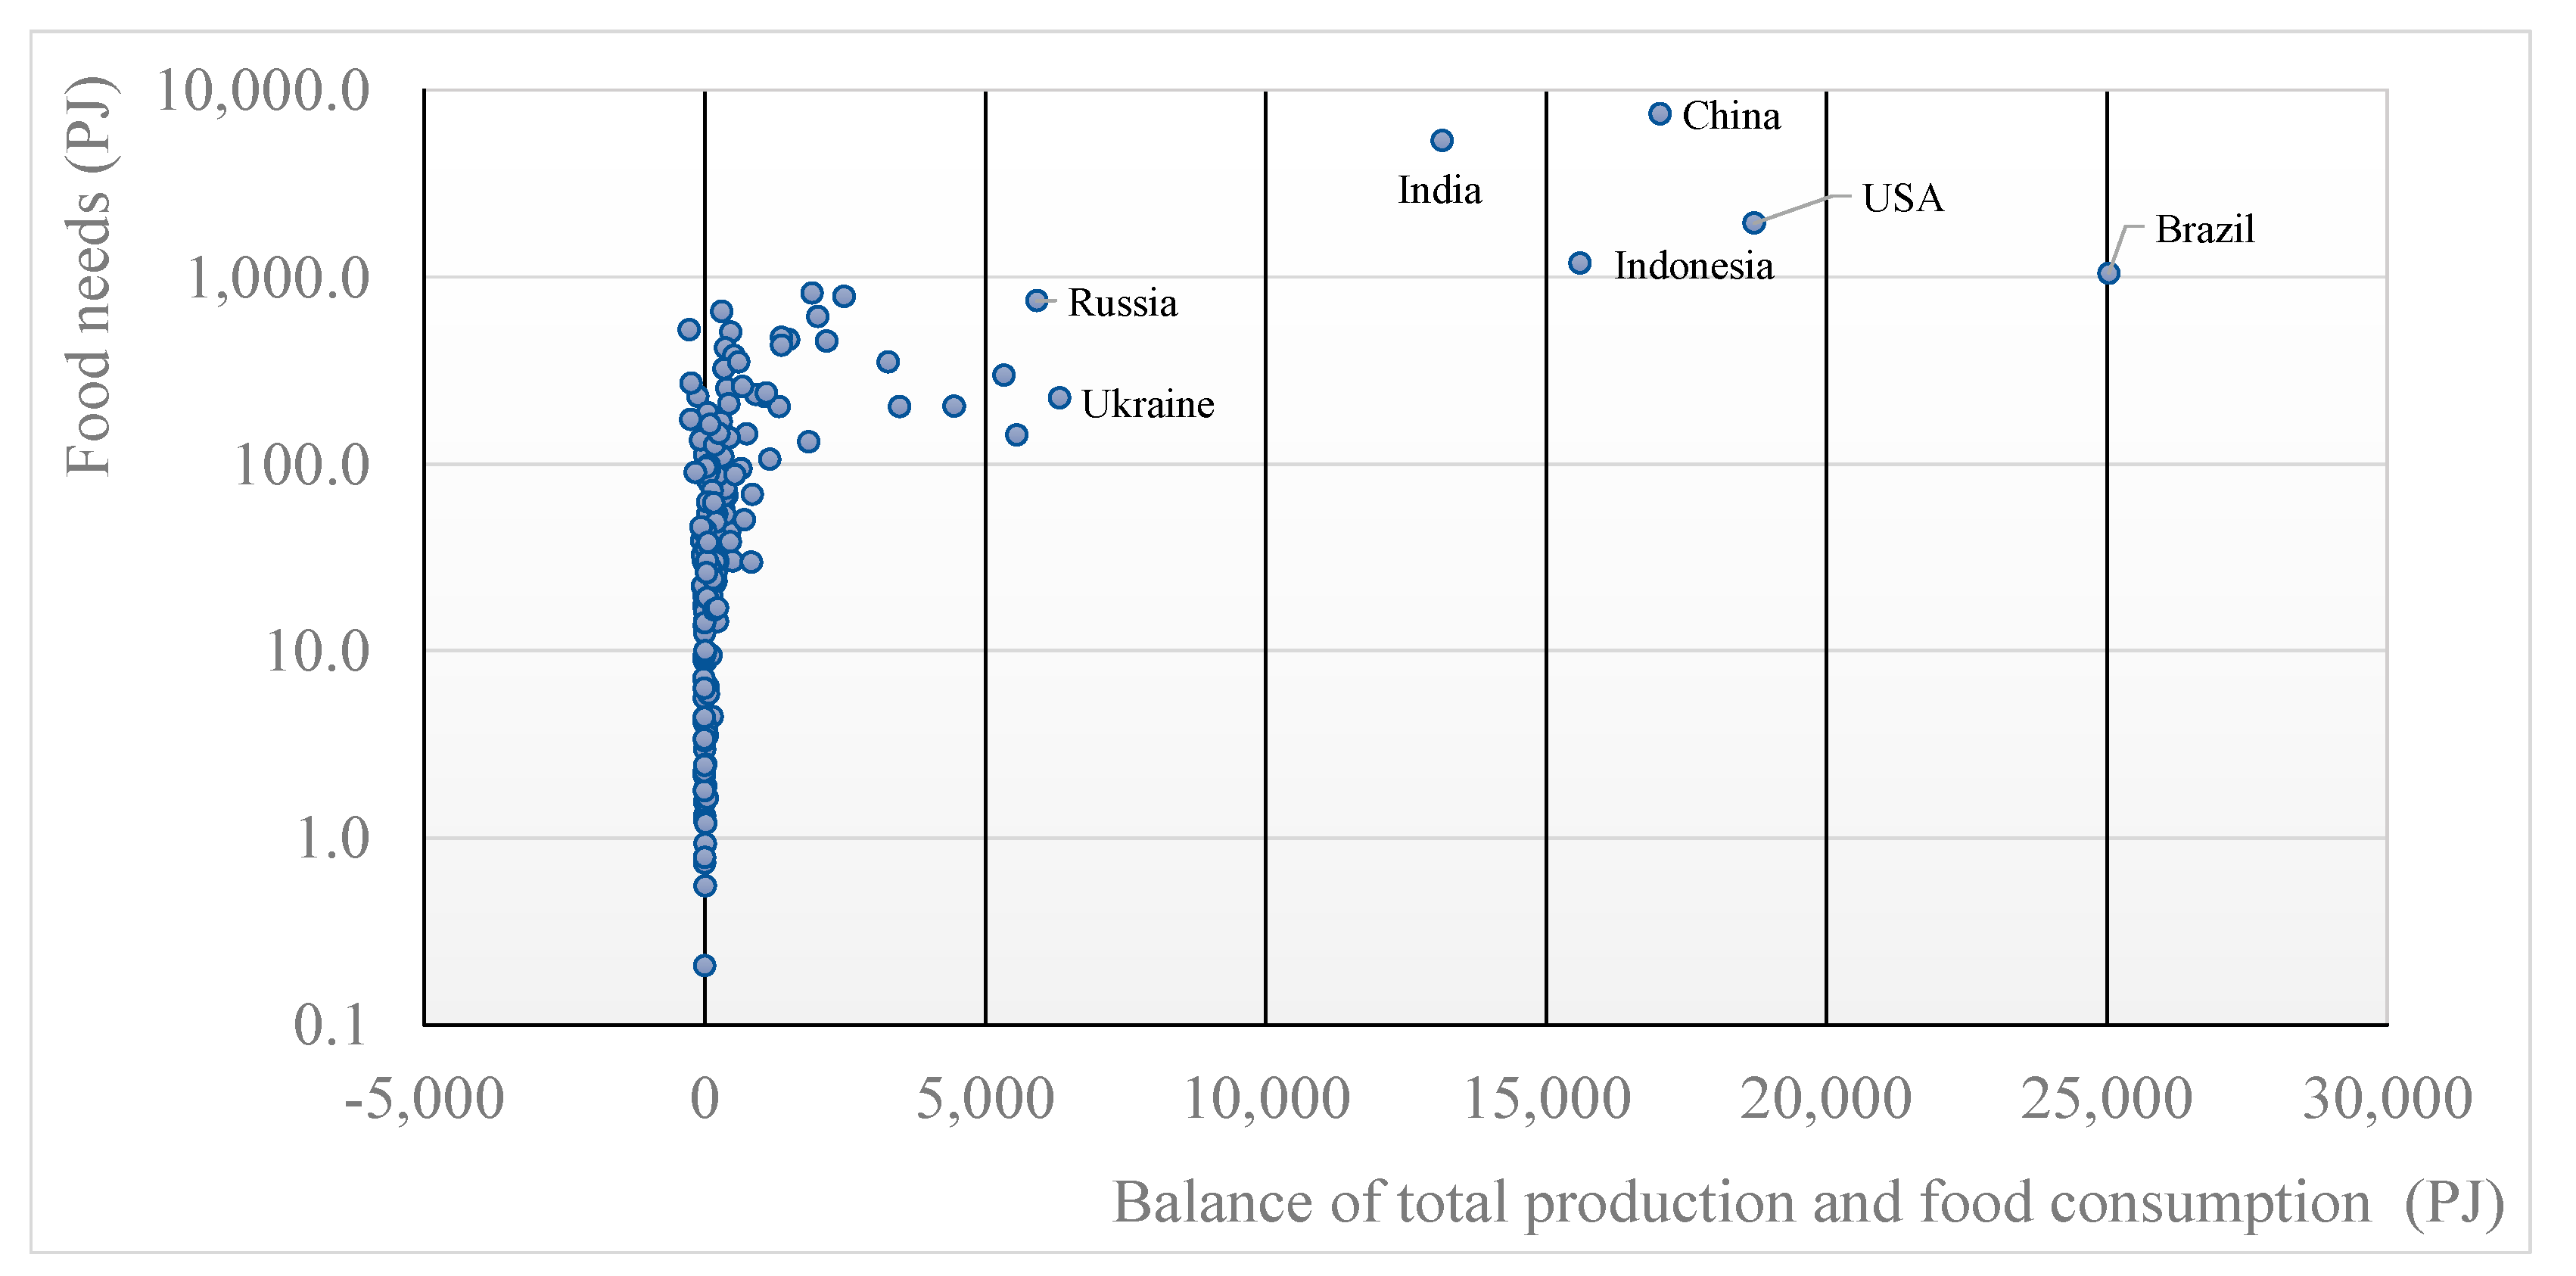
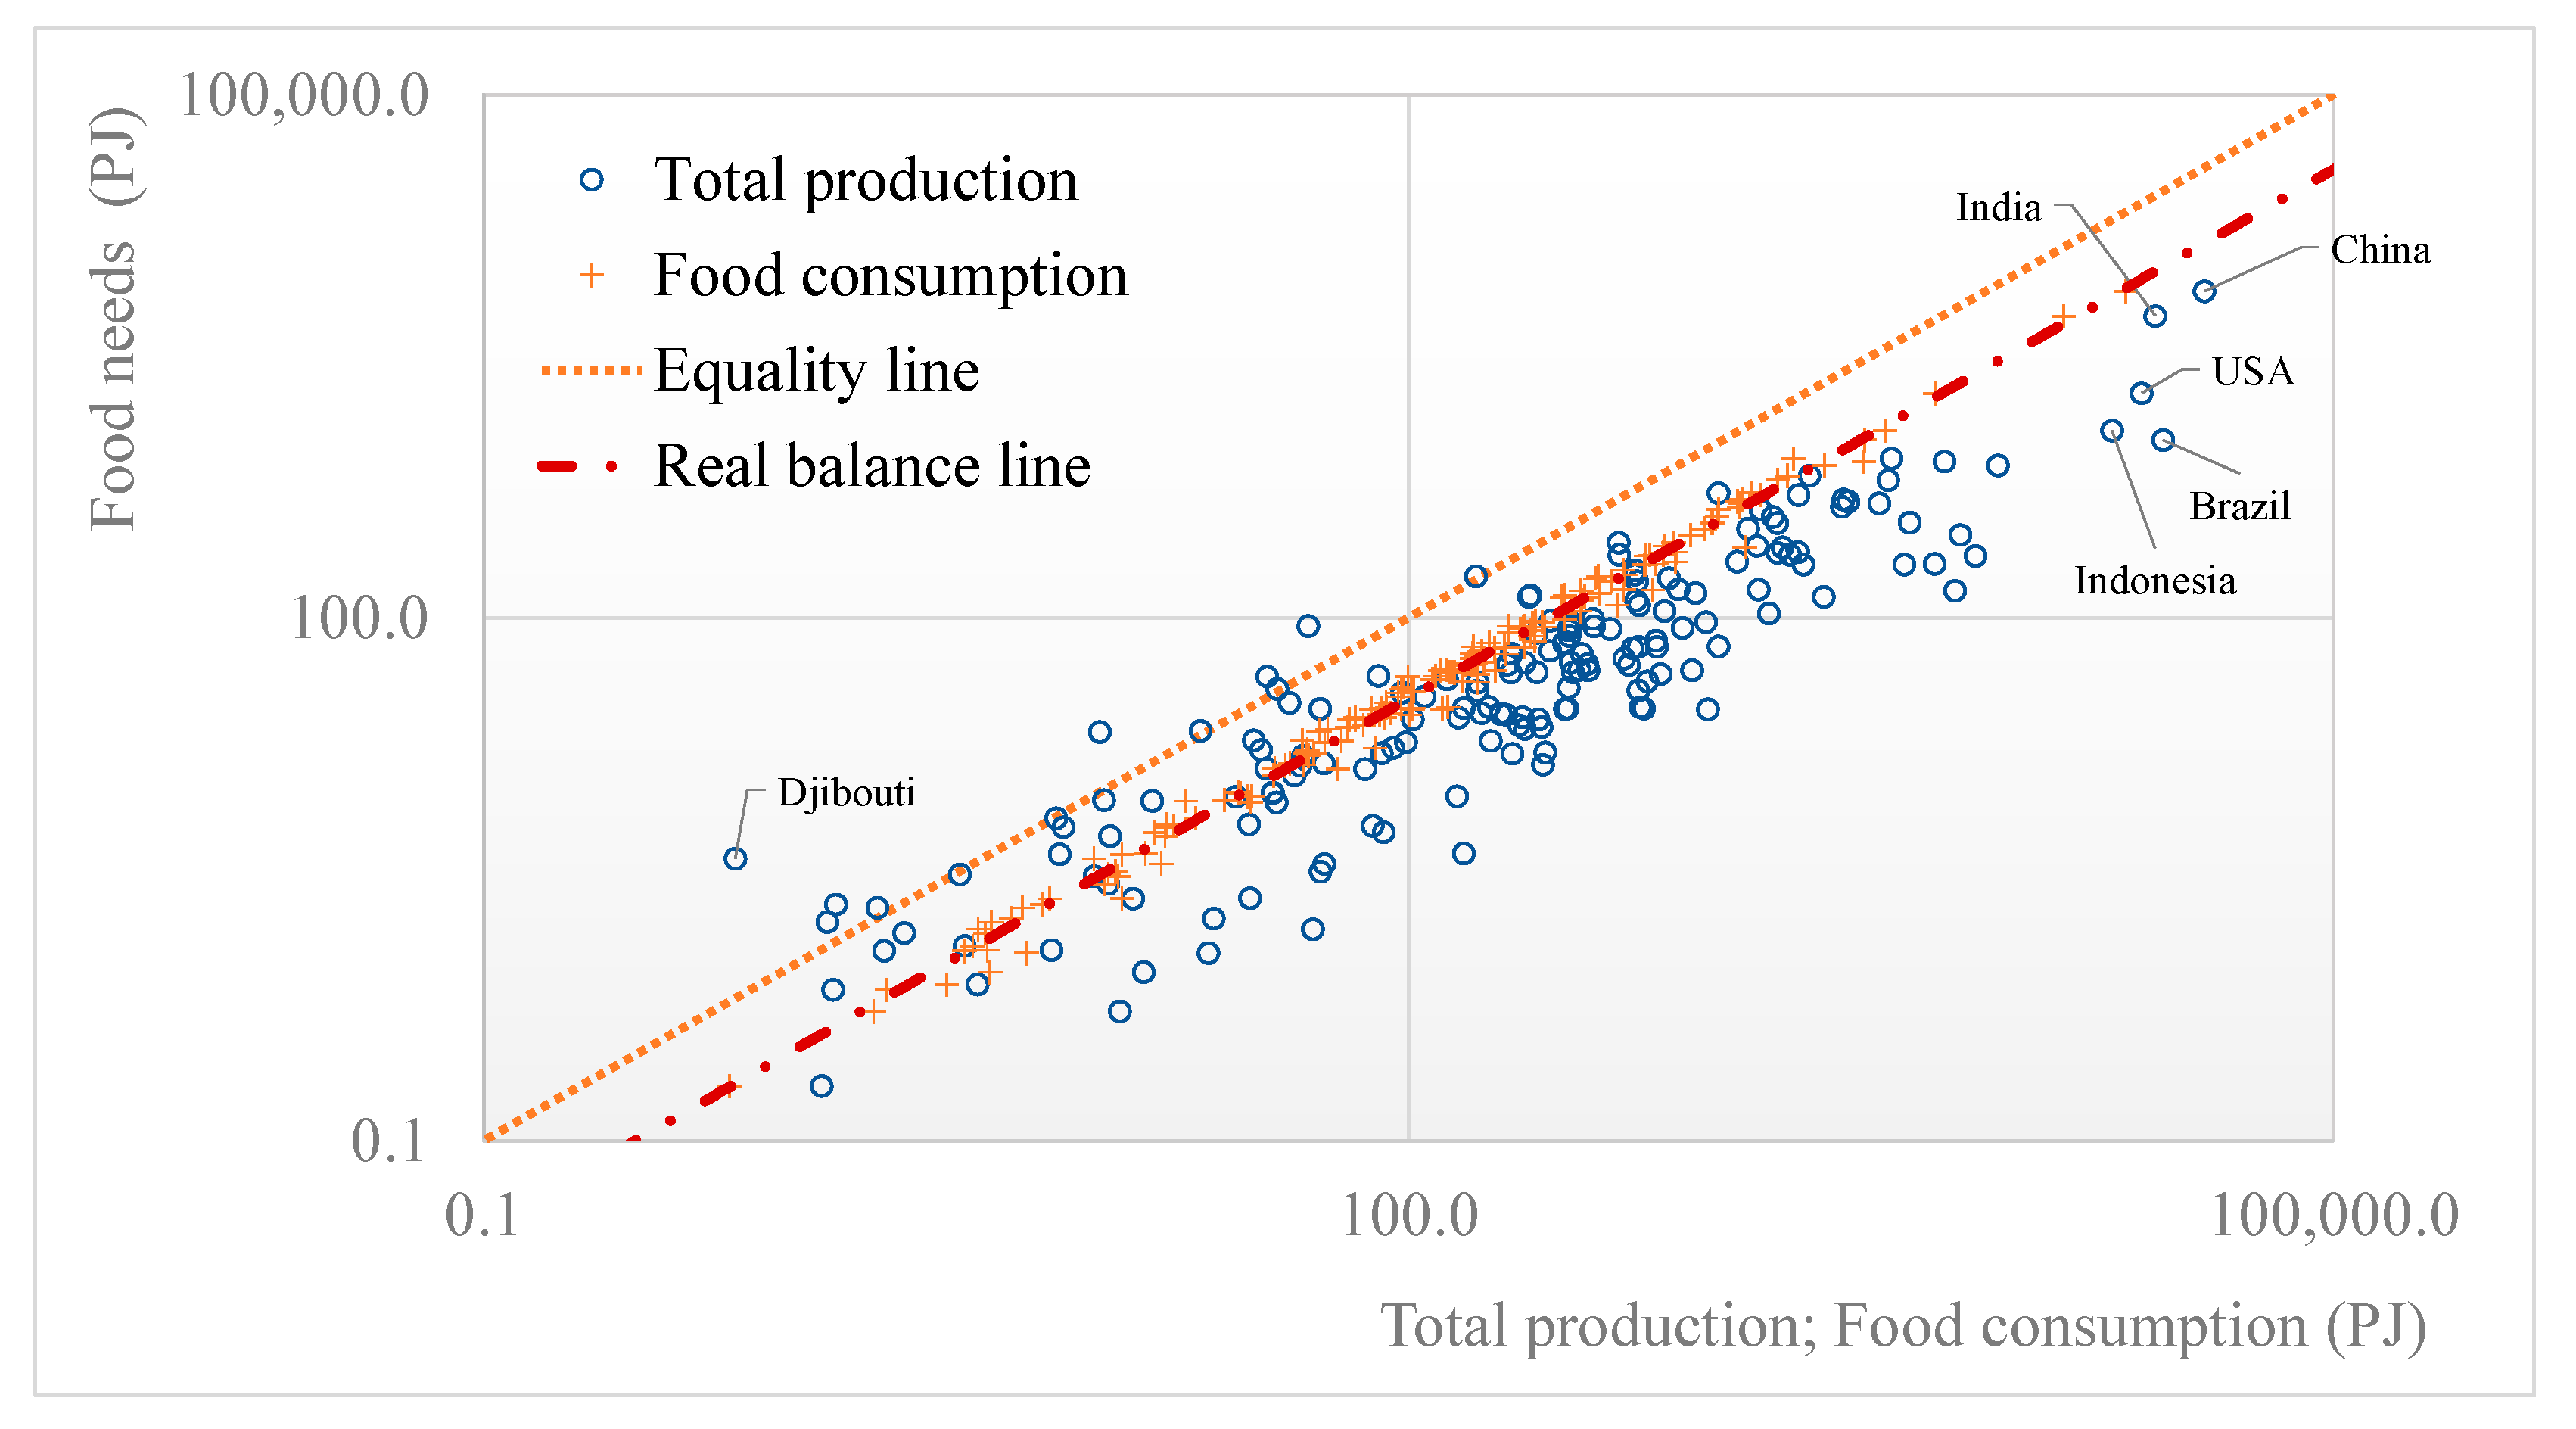
3.3. Food
3.4. The Conflicts of WEF Nexus and Land in Modern Era
4. WEF Nexus and Land: The Key for Prosperity
- For the production of food.
- For water supply and/or hydropower.
- As a field for energy production by RE installations or for the cultivation of energy crops.
5. Discussion
- They are capital-intensive to achieve economies of scale in order to minimize the unit cost.
- They need energy, water, and other natural resources.
6. Conclusions
Author Contributions
Funding
Data Availability Statement
Acknowledgments
Conflicts of Interest
References
- Sackett, R. Time, Energy, and the Indolent Savage. A Quantitative Cross-Cultural Test of the Primitive Affluence Hypothesis. Ph.D. Thesis, University of California, Los Angeles, CA, USA, 1996. [Google Scholar]
- Sargentis, G.-F.; Iliopoulou, T.; Dimitriadis, P.; Mamassis, N.; Koutsoyiannis, D. Stratification: An Entropic View of Society’s Structure. World 2021, 2, 153–174. [Google Scholar] [CrossRef]
- Smith, A. Ancient and Traditional Agriculture, Pastoralism, and Agricultural Societies in Sub-Saharan Africa. Oxf. Res. Encycl. Environ. Sci. 2019. [Google Scholar] [CrossRef]
- Jiang, Y.; Zhang, Q.; Niu, J.; Wu, J. Pastoral Population Growth and Land Use Policy Has Significantly Impacted Livestock Structure in Inner Mongolia—A Case Study in the Xilinhot Region. Sustainability 2019, 11, 7208. [Google Scholar] [CrossRef] [Green Version]
- Davis, J.; Hatfield, R. The Economics of Mobile Pastoralism: A Global Summary. Nomadic Peoples 2007, 11, 91–116. Available online: www.jstor.org/stable/43123794 (accessed on 23 February 2023). [CrossRef]
- Coughenour, M.B.; Ellis, J.E.; Swift, D.M.; Coppock, D.L.; Galvin, K.; McCabe, J.T.; Hart, T.C. Energy extraction and use in a nomadic pastoral ecosystem. Science 1985, 230, 619–625. [Google Scholar] [CrossRef]
- Smil, V. Conversion of Energy: People and Animals. In Encyclopedia of Energy; Cleveland, C.J., Ed.; Elsevier: Amsterdam, The Netherlands, 2004; pp. 697–705. ISBN 9780121764807. [Google Scholar] [CrossRef]
- Smil, V. World History and Energy. In Encyclopedia of Energy; Cleveland, C.J., Ed.; Elsevier: Amsterdam, The Netherlands, 2004; pp. 549–561. ISBN 9780121764807. [Google Scholar] [CrossRef]
- Singh, H.; Mishra, D.; Nahar, N.M. Energy use pattern in production agriculture of a typical village in arid zone, India. Energy Convers. Manag. 2002, 43, 2275–2286. [Google Scholar] [CrossRef]
- Canakci, M.; Topakci, M.; Akinci, I.; Ozmerzi, A. Energy use pattern of some field crops and vegetable production: Case study for Antalya Region, Turkey. Energy Convers. Manag. 2005, 46, 655–666. [Google Scholar] [CrossRef]
- Kander, A.; Warde, P. Energy Availability from Livestock and Agricultural Productivity in Europe, 1815–1913: A New Comparison. Econ. Hist. Rev. 2011, 64, 1–29. [Google Scholar] [CrossRef]
- Schnepf, R. Energy Use in Agriculture: Background and Issues. CRS Report for Congress, Received through the CRS Web. 2004. Available online: https://nationalaglawcenter.org/wp-content/uploads/assets/crs/RL32677.pdf (accessed on 23 February 2023).
- Vreni, J.-R.; Crump, L.; Abicho, A.A.; Abakar, A.A.; Mahamat, A., II; Bechir, M.; Eckert, S.; Engesser, M.; Schelling, E.; Zinsstag, J. Estimating population and livestock density of mobile pastoralists and sedentary settlements in the south-eastern Lake Chad area. Geospat. Health 2015, 10, 307. [Google Scholar] [CrossRef] [Green Version]
- Sargentis, G.-F.; Iliopoulou, T.; Sigourou, S.; Dimitriadis, P.; Koutsoyiannis, D. Evolution of Clustering Quantified by a Stochastic Method—Case Studies on Natural and Human Social Structures. Sustainability 2020, 12, 7972. [Google Scholar] [CrossRef]
- Goldewijk, K.; Beusen, A.; van Drecht, G.; de Vos, M. The HYDE 3.1 spatially explicit database of human-induced global land-use change over the past 12,000 years. Glob. Ecol. Biogeogr. 2011, 20, 73–86. [Google Scholar] [CrossRef]
- Sargentis, G.-F.; Siamparina, P.; Sakki, G.-K.; Efstratiadis, A.; Chiotinis, M.; Koutsoyiannis, D. Agricultural Land or Photovoltaic Parks? The Water–Energy–Food Nexus and Land Development Perspectives in the Thessaly Plain, Greece. Sustainability 2021, 13, 8935. [Google Scholar] [CrossRef]
- Daher, B.T.; Mohtar, R.H. Water–energy–food (WEF) Nexus Tool 2.0: Guiding integrative resource planning and decision-making. Water Int. 2015, 40, 748–771. [Google Scholar] [CrossRef]
- Daher, B.; Hannibal, B.; Mohtar, R.H.; Portney, K. Toward understanding the convergence of researcher and stakeholder perspectives related to water-energy-food (WEF) challenges: The case of San Antonio, Texas. Environ. Sci. Policy 2019, 104, 20–35s. [Google Scholar] [CrossRef]
- Lee, S.-H.; Assi, A.T.; Daher, B.; Mengoub, F.E.; Mohtar, R.H. A Water-Energy-Food Nexus approach for conducting trade-off analysis: Morocco’s phosphate industry in the Khouribga region. Hydrol. Earth Syst. Sci. 2020, 24, 4727–4741. [Google Scholar] [CrossRef]
- Mamassis, N. Personal Communication; American Psychological Association: Washington, DC, USA, 2023. [Google Scholar]
- WEF Background. Available online: www.water-energy-food.org/mission (accessed on 23 February 2023).
- IRENA. Global Energy Transformation: A Roadmap to 2050. 2019. Available online: https://www.irena.org/publications/2019/Apr/Global-energy-transformation-A-roadmap-to-2050-2019Edition (accessed on 23 February 2023).
- Al-Saidi, M.; Elagib, N.A. Towards understanding the integrative approach of the water, energy and food nexus. Sci. Total Environ. 2017, 574, 1131–1139. [Google Scholar] [CrossRef]
- Al-Saidi, M.; Hussein, H. The water-energy-food nexus and COVID-19: Towards a systematization of impacts and responses. Sci. Total Environ. 2021, 779, 146529. [Google Scholar] [CrossRef]
- Siganou, A.; Nikolinakou, M.; Markantonis, D.; Moraiti, K.; Sargentis, G.-F.; Iliopoulou, T.; Dimitriadis, P.; Ciotinis, M.; Mamassis, N.; Koutsoyiannis, D. Stochastic simulation of hydrological timeseries for data scarce regions—Case study at the Municipality of Western Mani. In Proceedings of the EGU22, the 24th EGU General Assembly, Vienna, Austria, 23–27 May 2022. [Google Scholar] [CrossRef]
- Waughray, D. (Ed.) Water Security, the Water-Food-Energy-Climate Nexus: The World Economic Forum Water Initiative; Island Press: Washington, DC, USA, 2011. [Google Scholar]
- Koutsoyiannis, D.; Makropoulos, C.; Langousis, A.; Baki, S.; Efstratiadis, A.; Christofides, A.; Karavokiros, G.; Mamassis, N. Climate, hydrology, energy, water: Recognizing uncertainty and seeking sustainability. Hydrol. Earth Syst. Sci. 2009, 13, 247–257. [Google Scholar] [CrossRef] [Green Version]
- Sargentis, G.-F.; Lagaros, N.D.; Cascella, G.-L.; Koutsoyiannis, D. Threats in Water–Energy–Food–Land Nexus by the 2022 Military and Economic Conflict. Land 2022, 11, 1569. [Google Scholar] [CrossRef]
- Zhang, C.; Chen, X.; Li, Y.; Ding, W.; Fu, G. Water-energy-food nexus: Concepts, questions and methodologies. J. Clean. Prod. 2018, 195, 625–639. [Google Scholar] [CrossRef]
- Food and Agriculture of the United Nations. The Water-Energy-Food Nexus. A New Approach in Support of Food Security and Sustainable Agriculture. 2014. Available online: http://www.fao.org/3/bl496e/bl496e.pdf (accessed on 23 February 2023).
- Leck, H.; Conway, D.; Bradshaw, M.; Rees, J. Tracing the water–energy–food nexus: Description, theory and practice. Geogr. Compass 2015, 9, 445–460. [Google Scholar] [CrossRef] [Green Version]
- Yang, J.; Yamazaki, A. Water and energy nexus: A literature review. Water West Stanford. Univ. 2013, 1, 146. [Google Scholar]
- Chang, Y.; Li, G.; Yao, Y.; Zhang, L.; Yu, C. Quantifying the Water-Energy-Food Nexus: Current Status and Trends. Energies 2016, 9, 65. [Google Scholar] [CrossRef] [Green Version]
- Endo, A.; Tsurita, I.; Burnett, K.; Orencio, P.M. A review of the current state of research on the water, energy, and food nexus. J. Hydrol. Reg. Stud. 2017, 11, 20–30. [Google Scholar] [CrossRef] [Green Version]
- WEF Nexus Index. Available online: https://wefnexusindex.org/ (accessed on 12 February 2023).
- Hamidov, A.; Daedlow, K.; Webber, H.; Hussein, H.; Abdurahmanov, I.; Dolidudko, A.; Seerat, A.; Solieva, U.; Woldeyohanes, T.; Helming, K. Operationalizing water-energy-food nexus research for sustainable development in social-ecological systems: An interdisciplinary learning case in Central Asia. Ecol. Soc. 2022, 27, 12. [Google Scholar] [CrossRef]
- Albrecht, T.R.; Crootof, A.; Christopher, S. The Water-Energy-Food Nexus: A systematic review of methods for nexus assessment. Environ. Res. Lett. 2018, 13, 043002. [Google Scholar] [CrossRef]
- Tainter, J. The Collapse of Complex Societies; Cambridge University Press: London, UK, 1988. [Google Scholar]
- Middleton, G.D. Understanding Collapse; Cambridge University Press: Cambridge, UK, 2017. [Google Scholar] [CrossRef] [Green Version]
- Krasner, S.D. US commercial and monetary policy: Unravelling the paradox of external strength and internal weakness. Int. Organ. 1977, 31, 635–671. [Google Scholar] [CrossRef]
- Beaudreau, B.C.; Pokrovskii, V.N. On the energy content of a money unit. Phys. A Stat. Mech. Its Appl. 2010, 389, 2597–2606. [Google Scholar] [CrossRef]
- Cottell, F. Energy & Society (Revised); AuthorHouse: Bloomington, IN, USA, 2009; ISBN 978-1-4490-3168-8. [Google Scholar]
- Hall, C.; Linderberger, D.; Kummel, R.; Krooeger, T.; Eichhorn, W. The Need to Reintegrate the Natural Sciences with Economics: Neoclassical economics, the dominant form of economics today, has at least three fundamental flaws from the perspective of the natural sciences, but it is possible to develop a different, biophysical basis for economics that can serve as a supplement to, or a replacement for, neoclassical economics. BioScience 2001, 51, 663–673. [Google Scholar] [CrossRef] [Green Version]
- Beaudreau, B.C. Engineering and economic growth. Struct. Change Econ. Dyn. 2005, 16, 211–220. [Google Scholar] [CrossRef]
- Odum, H.T. Energy, Hierarchy and Money. In Understanding Complexity; Ragsdell, G., Wilby, J., Eds.; Springer: Boston, MA, USA, 2001. [Google Scholar] [CrossRef]
- Kosmo, M. Money to Burn. The High Costs of Energy Subsidies. United States. 1987. Available online: https://www.osti.gov/biblio/5290761 (accessed on 12 February 2023).
- Hajko, V.; Sebri, M.; Al-Saidi, M.; Balsalobre-Lorente, D. The energy-growth nexus: History, development, and new challenges. In The Economics and Econometrics of the Energy-Growth Nexus; Academic Press: Cambridge, MA, USA, 2018; pp. 1–46. [Google Scholar] [CrossRef]
- Evans, M. The Continental School of Strategy: The Past, Present and Future of Land Power; Land Warfare Studies Centre: Duntroon, Australia, 2004. Available online: https://researchcentre.army.gov.au/sites/default/files/sp305_continental_school_of_strategy-michael_evans.pdf (accessed on 12 February 2023).
- Von Clausewitz, C. On War; Princeton University Press: Princeton, NJ, USA, 2008. [Google Scholar] [CrossRef]
- Lorenz, M.O. Methods of measuring the concentration of wealth. Publ. Am. Stat. Assoc. 1905, 9, 209. [Google Scholar] [CrossRef]
- Bellù, L.G.; Liberati, P.; Charting Income Inequality. The Lorenz Curve. Food and Agriculture Organization of the United Nations, FAO. 2005. Available online: http://www.fao.org/3/a-am391e.pdf (accessed on 12 February 2023).
- Richard, W. Tresch, Chapter 4—The Social Welfare Function in Policy Analysis. In Public Finance, 3rd ed.; Tresch, R.W., Ed.; Academic Press: Cambridge, MA, USA, 2015; pp. 57–78. ISBN 9780124158344. [Google Scholar] [CrossRef]
- Ross, S.M. Chapter 2—Descriptive statistics. In Introduction to Probability and Statistics for Engineers and Scientists, 6th ed.; Ross, S.M., Ed.; Academic Press: Cambridge, MA, USA, 2021; pp. 11–61. ISBN 9780128243466. [Google Scholar] [CrossRef]
- Bellù, L.G.; Liberati, P.; Inequality Analysis. The Gini Index. Food and Agriculture Organization of the United Nations, FAO. 2006. Available online: http://www.fao.org/3/a-am352e.pdf (accessed on 12 February 2023).
- Income Inequality. Available online: https://ourworldindata.org/income-inequality (accessed on 23 February 2023).
- Gini Index. Available online: https://www.investopedia.com/terms/g/gini-index.asp (accessed on 23 February 2023).
- Pierce, D.G.; Tysome, P.J. Monetary Economics: Theories, Evidence and Policy; Butterworth-Heinemann: Woburn, MA, USA, 2014. [Google Scholar]
- Marx, K. Capital—A Critique of Political Economy, Volume I—The Process of Production of Capital, 1867/1887. Available online: https://www.marxists.org/archive/marx/works/download/pdf/Capital-Volume-I.pdf (accessed on 23 February 2023).
- Spindt, P.A. Money is what money does: Monetary aggregation and the equation of exchange. J. Politi-Econ. 1985, 93, 175–204. [Google Scholar] [CrossRef]
- Marx, K. Capital—A Critique of Political Economy, Volume IΙΙ—The Process of Capitalist Production as a Whole. 1894. Available online: https://www.marxists.org/archive/marx/works/download/pdf/Capital-Volume-III.pdf (accessed on 23 February 2023).
- Lietaer, B.; The Future of Money. Random House. 2013. Available online: https://modernmoneynetwork.org/sites/default/files/biblio/Future.pdf (accessed on 23 February 2023).
- Butcher, K.; Ponting, M. The Beginning of the End? The Denarius in the Second Century. Numis. Chron. (1966-) 2012, 172, 63–83. [Google Scholar]
- Adam, K.; Junyi, Z. Price Level Changes and the Redistribution of Nominal Wealth Across the Euro Area. J. Eur. Econ. Assoc. 2014, 14, 871–906. [Google Scholar] [CrossRef] [Green Version]
- Banton, C.; Interest Rate. Investopedia, 6 July 2022. Available online: https://www.investopedia.com/terms/i/interestrate.asp (accessed on 23 February 2023).
- Markantonis, D.; Sargentis, G.-F.; Dimitriadis, P.; Iliopoulou, T.; Siganou, A.; Moraiti, K.; Nikolinakou, M.; Meletopoulos, I.T.; Mamassis, N.; Koutsoyiannis, D. Stochastic Evaluation of the Investment Risk by the Scale of Water Infrastructures—Case Study: The Municipality of West Mani (Greece). World 2023, 4, 1–20. [Google Scholar] [CrossRef]
- Murad, A. The Nature of Money. South. Econ. J. 1943, 9, 217. [Google Scholar] [CrossRef]
- Zelmanovitz, L. The Ontology and Function of Money: The Philosophical Fundamentals of Monetary Institutions; Lexington Books: Lanham, MA, USA, 2016. [Google Scholar]
- Sako, Μ.; Tsoli, E.; Ioannidis, R.; Frangedaki, E.; Sargentis, G.-F.; Koutsoyiannis, D. Optimizing the size of Hilarion dam with technical, economical and environmental parameters. Geophys. Res. Abstr. 2019, 21, 1. [Google Scholar]
- Moraiti, K.; Markantonis, D.; Nikolinakou, M.; Siganou, A.; Sargentis, G.-F.; Iliopoulou, T.; Dimitriadis, P.; Meletopoulos, I.T.; Mamassis, N.; Koutsoyiannis, D. Optimizing water infrastructure solutions for small-scale distributed settlements—Case study at the Municipality of Western Mani. In Proceedings of the EGU22, the 24th EGU General Assembly, Vienna, Austria, 23–27 May 2022. EGU22-3055. [Google Scholar] [CrossRef]
- Markantonis, D.; Siganou, A.; Moraiti, K.; Nikolinakou, M.; Sargentis, G.-F.; Iliopoulou, T.; Dimitriadis, P.; Meletopoulos, I.T.; Mamassis, N.; Koutsoyiannis, D. Determining optimal scale of water infrastructure considering economical aspects with stochastic evaluation—Case study at the Municipality of Western Mani. In Proceedings of the EGU22, the 24th EGU General Assembly, Vienna, Austria, 23–27 May 2022. EGU22-3039. [Google Scholar] [CrossRef]
- Sargentis, G.-F.; Ioannidis, R.; Karakatsanis, G.; Koutsoyiannis, D. The scale of infrastructures as a social decision. Case study: Dams in Greece. In Proceedings of the European Geosciences Union General Assembly 2018, Vienna, Austria, 8–13 April 2018; Volume 20. EGU2018-17082. [Google Scholar]
- van Wees, H. Mass and elite in Solon’s Athens: The property classes revisited. In Solon of Athens; Blok, J., Leiden, A.L., Eds.; Leiden: Brill, The Netherlands, 2006. [Google Scholar] [CrossRef] [Green Version]
- Scheidel, W. Real Wages in Early Economies: Evidence for Living Standards from 1800 BCE to 1300 CE. J. Econ. Soc. Hist. Orient 2010, 53, 425–462. [Google Scholar] [CrossRef]
- Milanovic, B.; Lindert, P.H.; Williamson, J.G. Measuring Ancient Inequality; NBER Working Paper No. 13550; JEL No. D3,N3,O1.; National Bureau of Economic Research: Cambridge, UK, 2007. [Google Scholar] [CrossRef] [Green Version]
- Jursa, M. Aspects of the Economic History of Babylonia in the First Millennium BC; Ugarit-Verlag: Münster, Germany, 2010. [Google Scholar]
- Loomis, W.T. Wages, Welfare Costs, and Inflation in Classical Athens; University of Michigan Press: Ann Arbor, MI, USA, 1998. [Google Scholar]
- International Institute of Social History. Value of the Guilder versus Euro. A comparison of the Purchasing Power of the Guilder from the Year 1450 to Another Year. Available online: https://iisg.amsterdam/en/research/projects/hpw/calculate.php#Europe (accessed on 23 February 2023).
- Milanovic, B. An Estimate of Average Income and Inequality in Byzantium Around Year 1000. Rev. Income Wealth 2006, 52, 449–470. [Google Scholar] [CrossRef]
- Van Zanden, J. Wages and the standard of living in Europe, 1500–1800. Eur. Rev. Econ. Hist. 1999, 3, 175–197. [Google Scholar] [CrossRef] [PubMed]
- Malanima, P. When did England overtake Italy? Medieval and early modern divergence in prices and wages. Eur. Rev. Econ. Hist. 2013, 17, 45–70. [Google Scholar] [CrossRef]
- Sargentis, G.-F.; Defteraios, P.; Lagaros, N.D.; Mamassis, N. Values and Costs in History: A Case Study on Estimating the Cost of Hadrianic Aqueduct’s Construction. World 2022, 3, 260–286. [Google Scholar] [CrossRef]
- Koutsoyiannis, D. Scale of water resources development and sustainability: Small is beautiful, large is great. Hydrol. Sci. J. 2011, 56, 553–575. [Google Scholar] [CrossRef]
- Rivers in Crisis. Available online: https://riverthreat.net//data.html (accessed on 23 February 2023).
- Wittfogel, K. Oriental Despotism; A Comparative Study of Total Power; Random House: New York, NY, USA, 1957; ISBN 978-0-394-74701-74709. [Google Scholar]
- West, L.C. The Cost of Living in Roman Egypt. Class. Philol. 1916, 11, 293–314. [Google Scholar] [CrossRef]
- Hopkins, K. Conquerors and Slaves; Cambridge University Press: Cambridge, UK, 1978. [Google Scholar]
- Jongman, W.M.; Jacobs, J.; Goldewijk, G.M.K. Health and wealth in the Roman Empire. Econ. Hum. Biol. 2019, 34, 138–150. [Google Scholar] [CrossRef]
- Fochesato, M.; Bogaard, A.; Bowles, S. Comparing ancient inequalities: The challenges of comparability, bias and precision. Antiquity 2019, 93, 853–869. [Google Scholar] [CrossRef]
- Shaer, M. The Archaeology of Wealth Inequality. Available online: https://www.smithsonianmag.com/history/aracheology-wealth-inequality-180968072/ (accessed on 15 January 2023).
- Kander, A.; Warde, P. Number, Size and Energy Consumption of Draught Animals in European Agriculture, Working Paper, March 2009. Available online: https://histecon.fas.harvard.edu/energyhistory/data/warde_kander_working_paper_animals-mar09.pdf (accessed on 23 February 2023).
- Kohler, T.; Smith, M.; Bogaard, A.; Feinman, G.M.; Peterson, C.E.; Betzenhauser, A.; Pailes, M.; Stone, E.C.; Prentiss, A.M.; Dennehy, T.J.; et al. Greater post-Neolithic wealth disparities in Eurasia than in North America and Mesoamerica. Nature 2017, 551, 619–622. [Google Scholar] [CrossRef] [PubMed] [Green Version]
- Heather, P. The Restoration of Rome: Barbarian Popes and Imperial Pretenders; Oxford University Press: Oxford, UK, 2016. [Google Scholar]
- Ellickson, R.C.; Thorland, C.D. Ancient Land Law: Mesopotamia, Egypt, Israel. Chi.-Kent Law Rev. 1995, 71, 321. [Google Scholar]
- Young, A.T. The political economy of feudalism in medieval Europe. Const. Politi-Econ. 2020, 32, 127–143. [Google Scholar] [CrossRef]
- Sutt, C. Lords, Peasants and Slaves. In The Routledge Handbook of East Central and Eastern Europe in the Middle Ages, 500–1300; Curta, F., Ed.; Routledge: London, UK, 2021. [Google Scholar] [CrossRef]
- Wickham, C. The Other Transition: From the Ancient World to Feudalism. Past Present 1984, 103, 3–36. Available online: http://www.jstor.org/stable/650723. (accessed on 23 February 2023). [CrossRef]
- Fukuyama, F. The Origins of Political Order: From Prehuman Times to the French Revolution, Farrar, Straus and Gigoux, New York. 2011. Available online: https://books.google.gr/books?hl=en&lr=&id=eyEONn0WUmMC (accessed on 23 February 2023).
- Campbell, B. Shaping the Rural Environment: Surveyors in Ancient Rome. J. Rom. Stud. 1996, 86, 74–99. [Google Scholar] [CrossRef]
- Marx, K.; Engels, F. The German Ideology; International Publishers: New York, NY, USA, 1970; Volume 1. [Google Scholar]
- Gowdy, J. Hunter-Gatherers and the Mythology of the Market. The Cambridge Encyclopedia of Hunters and Gatherers; Cambridge University Press: Cambridge, UK, 2006; pp. 391–393. ISBN 0-521-60919-4. [Google Scholar]
- Smith, E.A.; Hill, K.; Marlowe, F.; Nolin, D.; Wiessner, P.; Gurven, M.; Bowles, S.; Borgerhoff Mulder, M.; Hertz, T.; Bellj, A. Wealth transmission and inequality among hunter-gatherers. Curr. Anthropol. 2010, 51, 19–34. [Google Scholar] [CrossRef] [Green Version]
- Atkinson, A.B. Inequality; Harvard University Press: Cambridge, MA, USA, 2015. [Google Scholar]
- Koutsoyiannis, D.; Sargentis, G.-F. Entropy and Wealth. Entropy 2021, 23, 1356. [Google Scholar] [CrossRef]
- Angle, J. The Surplus Theory of Social Stratification and the Size Distribution of Personal Wealth. Soc. Forces 1986, 65, 293–326. [Google Scholar] [CrossRef]
- Cleveland, C.J.; Costanza, R.; Hall, C.A.S.; Kaufmann, R.K. Energy and the US economy: A biophysical perspective. Science 1984, 225, 890–897. [Google Scholar] [CrossRef] [Green Version]
- Wankeun, O.; Kihoon, L. Causal relationship between energy consumption and GDP revisited: The case of Korea 1970–1999. Energy Econ. 2004, 26, 51–59. [Google Scholar] [CrossRef]
- Yang, H.-Y. A note on the causal relationship between energy and GDP in Taiwan. Energy Econ. 2000, 22, 309–317. [Google Scholar] [CrossRef]
- Griffin, J.M.; Gregory, P.R. An intercountry translog model of energy substitution responses. Am. Econ. Rev. 1976, 66, 845–857. [Google Scholar]
- Berndt, E.R.; Wood, D.O. Engineering and economic interpretation of energy-capital complementarity. Am. Econ. Rev. 1979, 69, 343–354. Available online: http://www.jstor.org/stable/1807369 (accessed on 5 March 2023).
- Berndt, E.R. Energy use, technical progress and productivity growth: A survey of economic issue. J. Product. Anal. 1990, 2, 67–83. [Google Scholar] [CrossRef] [Green Version]
- Kraft, J.; Kraft, A. On the relationship between energy and GNP. J. Energy Dev. 1978, 401–403. [Google Scholar]
- Gordon, S.W. The American Revolution: A History; Modern Library: New York, NY, USA, 2002; ISBN 9781588367585. [Google Scholar]
- Carlyle, T. The French Revolution; Oxford University Press: Oxford, UK, 2019; ISBN 978-0-19-254755-2. [Google Scholar]
- Fitzpatrick, S. The Russian Revolution; Oxford University Press: Oxford, UK, 2017; ISBN 978-0-19-880670-7. [Google Scholar]
- Sargentis, G.-F.; Koutsoyiannis, D.; Angelakis, A.; Christy, J.; Tsonis, A.A. Environmental Determinism vs. Social Dynamics: Prehistorical and Historical Examples. World 2022, 3, 357–388. [Google Scholar] [CrossRef]
- Niemi, S. Great Power Relations. Available online: https://greatpowerrelations.com/ir-theory-and-great-powers/collapsism/ (accessed on 5 March 2023).
- Food and Agriculture Organization of the United Nations (FAO). Food Balances (2010-). Available online: https://www.fao.org/faostat/en/#data/FBS/metadata (accessed on 23 February 2023).
- U.S. Department of Agriculture, Agricultural Research Service. Download Food Data Central Data. Available online: https://fdc.nal.usda.gov/download-datasets.html (accessed on 23 February 2023).
- Berners-Lee, M.; Kennelly, C.; Watson, R.; Hewitt, C.N. Current global food production is sufficient to meet human nutritional needs in 2050 provided there is radical societal adaptation. Elementa Sci. Anthr. 2018, 6, 52. [Google Scholar] [CrossRef]
- Bahadur, K.; Dias, G.; Veeramani, A.; Swanton, C.J.; Fraser, D.; Steinke, D.; Lee, E.; Wittman, H.; Farber, J.M.; Dunfield, K.; et al. When too much isn’t enough: Does current food production meet global nutritional needs? PLoS ONE 2018, 13, e0205683. [Google Scholar] [CrossRef] [Green Version]
- Nestle, M.; Nesheim, M. Why Calories Count: From Science to Politics; University of California Press: Oakland, CA, USA, 2012; Volume 33, ISBN 978-0-520-26288-1. [Google Scholar]
- Global Agriculture. Availability of Calories. Available online: https://www.globalagriculture.org/transformation-of-our-food-systems/book/infographics/availability-of-calories.html (accessed on 23 February 2023).
- Cassidy, E.; West, P.C.; Gerber, J.S.; Foley, J.A. Redefining agricultural yields: From tonnes to people nourished per hectare. Environ. Res. Lett. 2013, 8, 034015. [Google Scholar] [CrossRef]
- The Complete Our World in Data Energy Dataset. Available online: https://github.com/owid/energy-data (accessed on 23 February 2023).
- WorldData.info. Energy Consumption in Mali. Available online: https://www.worlddata.info/africa/mali/energy-consumption.php (accessed on 23 February 2023).
- U.S. Energy Information Administration. Independent Statistics and Analysis. Available online: https://www.eia.gov/tools/faqs/faq.php?id=97&t=3 (accessed on 23 February 2023).
- Food and Agriculture Organization of the United Nations (FAO). Energy. Available online: https://www.fao.org/energy/home/en/ (accessed on 23 February 2023).
- Ostwald, W. Energetische Grundlagen der Kulturwissenschaft; Creative Media Partners, LLC.: Sacramento, CA, USA, 2015. [Google Scholar]
- Food and Agriculture Organization of the United Nations. Aquastat. Available online: https://tableau.apps.fao.org/views/ReviewDashboard-v1/country_dashboard?%3Aembed=y&%3AisGuestRedirectFromVizportal=y (accessed on 23 February 2023).
- DESWARE, Encyclopedia of Desalination and Water Resources. Available online: http://www.desware.net/Energy-Requirements-Desalination-Processes.aspx (accessed on 23 February 2023).
- Antonyan, M. Energy Footprint of Water Desalination. Master’s Thesis, University of Twente, The Netherlands, 26 June 2019. Available online: https://essay.utwente.nl/78100/1/Antonyan%2C%20M.%201817078%20_openbaar.pdf (accessed on 23 February 2023).
- García-Rodríguez, L.; Delgado-Torres, A.M. Renewable Energy-Driven Desalination: New Trends and Future Prospects of Small Capacity Systems. Processes 2022, 10, 745. [Google Scholar] [CrossRef]
- IEA-ETSAP and IRENA. Water Desalination Using Renewable Energy. Technology Brief. 2012. Available online: www.irena.org/-/media/Files/IRENA/Agency/Publication/2012/IRENA-ETSAP-Tech-Brief-I12-Water-Desalination.pdf (accessed on 23 February 2023).
- The World Bank. GDP. Available online: https://data.worldbank.org/indicator/NY.GDP.MKTP.CD (accessed on 23 February 2023).
- The World Bank. GovData360. Getting Electricity: Price of Electricity. Available online: https://govdata360.worldbank.org/indicators/h6779690b?country=AFG&indicator=42573&countries=NPL,PAK,IND,BGD,BTN,LKA,MDV&viz=bar_chart&years=2019&compareBy=region (accessed on 23 February 2023).
- Food and Agriculture Organization of the United Nations (FAO). Land Use. Available online: https://www.fao.org/faostat/en/#data/RL (accessed on 23 February 2023).
- Ioannidis, R.; Mamassis, N.; Efstratiadis, A.; Koutsoyiannis, D. Reversing Visibility Analysis: Towards an Accelerated a Priori Assessment of Landscape Impacts of Renewable Energy Projects. Renew. Sustain. Energy Rev. 2022, 161, 112389. [Google Scholar] [CrossRef]
- Ioannidis, R.; Koutsoyiannis, D.; Sargentis, G.-F. Landscape Design in Infrastructure Projects-Is It an Extravagance? A Cost-Benefit Investigation of Practices in Dams. Landsc. Res. 2022, 47, 370–387. [Google Scholar] [CrossRef]
- Ioannidis, R.; Koutsoyiannis, D. A Review of Land Use, Visibility and Public Perception of Renewable Energy in the Context of Landscape Impact. Appl. Energy 2020, 276, 115367. [Google Scholar] [CrossRef]
- De Maria, M. Understanding Land in the Context of Large-Scale Land Acquisitions: A Brief History of Land in Economics. Land 2019, 8, 15. [Google Scholar] [CrossRef] [Green Version]
- Braund, D. Black Sea Grain for Athens? From Herodotus to Demosthenes. Black Sea Antiq. Reg. Interreg. Econ. Exch. 2007, 6, 39. Available online: https://antikmuseet.au.dk/fileadmin/www.antikmuseet.au.dk/Pontosfiler/BSS_6/BSS6_03_braund.pdf (accessed on 23 February 2023).
- Garnsey, P. Grain for Athens. Hist. Political Thought 1985, 6, 62–75. [Google Scholar]
- Hussein, H.; Lambert, L.A. A Rentier State under Blockade: Qatar’s Water-Energy-Food Predicament from Energy Abundance and Food Insecurity to a Silent Water Crisis. Water 2020, 12, 1051. [Google Scholar] [CrossRef] [Green Version]
- D’Odorico, P.; Carr, J.A.; Laio, F.; Ridolfi, L.; Vandoni, S. Feeding humanity through global food trade. Earth’s Future 2014, 2, 458–469. [Google Scholar] [CrossRef]
- EU Sanctions against RUSSIA Explained. Available online: https://www.consilium.europa.eu/en/policies/sanctions/restrictive-measures-against-russia-over-ukraine/sanctions-against-russia-explained/ (accessed on 23 February 2023).
- Nussbaum, A. The Law of the Dollar; Columbia Law Review Association, Inc.: New York, NY, USA, 1937; Volume 37, pp. 1057–1091. [Google Scholar] [CrossRef]
- Ghizoni, S.K. Creation of the Bretton Woods System. Available online: https://www.federalreservehistory.org/essays/bretton-woods-created (accessed on 23 February 2023).
- Irwin, D. The Nixon shock after forty years: The import surcharge revisited. World Trade Rev. 2012, 12, 29–56. [Google Scholar] [CrossRef] [Green Version]
- Nixon and the End of the Bretton Woods System, 1971–1973. Available online: https://history.state.gov/milestones/1969-1976/nixon-shock (accessed on 23 February 2023).
- The U.S.-Saudi Arabian Joint Commission on Economic Cooperation. Available online: https://www.gao.gov/products/id-79-7 (accessed on 23 February 2023).
- Lissovolik, Y.D. Boosting the USE of National Currencies among BRICS. Russia in Global Affairs. 14 September 2018. Available online: https://eng.globalaffairs.ru/articles/boosting-the-use-of-national-currencies-among-brics/ (accessed on 23 February 2023).
- Escobar, P. Global South: Gold-Backed Currencies to Replace the US Dollar. The Cradle. 19 January 2023. Available online: https://thecradle.co/article-view/20532/global-south-gold-backed-currencies-to-replace-the-us-dollar (accessed on 23 February 2023).
- Koutsoyiannis, D.; Mamassis, N. From mythology to science: The development of scientific hydrological concepts in Greek antiquity and its relevance to modern hydrology. Hydrol. Earth Syst. Sci. 2021, 25, 2419–2444. [Google Scholar] [CrossRef]
- Chatzimpiros, P.; Lagos, G.; Sargentis, G.-F. Man and City. Myth and Vision. In Proceedings of the 10th International Conference on Environmental Science and Technology, Kos Island, Greece, 5–7 September 2007. [Google Scholar] [CrossRef]
- Roller, L.E. The Legend of Midas. Class. Antiq. 1983, 2, 299–313. [Google Scholar] [CrossRef]
- Clark, C.; The Sleepwalkers: How Europe Went to War in 1914. Penguin Books. 2012. Available online: https://books.google.gr/books?hl=en&lr=&id=unxCQH3LKBcC&oi (accessed on 23 February 2023).
- United Nations. Global impact of the war in Ukraine: Billions of People Face the Greatest Cost-of-Living Crisis in a Generation. 8 June 2022. Available online: https://news.un.org/pages/wp-content/uploads/2022/06/GCRG_2nd-brief_Jun8_2022_FINAL.pdf (accessed on 23 February 2023).
- Guterres, A.; Secretary-General of United Nations. Act Now to End Food, Energy and Finance Crisis, Guterres Urges World Leaders. Available online: https://news.un.org/en/story/2022/06/1119962 (accessed on 23 February 2023).
- International Monetary Fund. A Looming Food CRISIS. Available online: https://www.imf.org/en/Publications/fandd/issues/2022/09/Cafe-Econ-a-looming-Food-Crisis (accessed on 23 February 2023).
- Ministry of Foreign Affairs of the People’s Republic of China. US Hegemony and Its Perils. 20 February 2023. Available online: https://www.fmprc.gov.cn/mfa_eng/wjbxw/202302/t20230220_11027664.html (accessed on 23 February 2023).
- La Monica, P.R.; The CEO of America’s Second-Largest Bank Is Preparing for Possible US Debt Default. CNN, Updated 1:44 PM EST, Mon 6 February 2023. Available online: https://edition.cnn.com/2023/02/06/investing/bank-of-america-ceo-brian-moynihan-debt-default/ (accessed on 23 February 2023).
- Escobar, P. Putin’s ‘Civilizational’ Speech Frames Conflict between East and West. 22 February 2022. Available online: https://thecradle.co/article-view/21772/putins-civilizational-speech-frames-conflict-between-east-and-west (accessed on 23 February 2023).


Disclaimer/Publisher’s Note: The statements, opinions and data contained in all publications are solely those of the individual author(s) and contributor(s) and not of MDPI and/or the editor(s). MDPI and/or the editor(s) disclaim responsibility for any injury to people or property resulting from any ideas, methods, instructions or products referred to in the content. |
© 2023 by the authors. Licensee MDPI, Basel, Switzerland. This article is an open access article distributed under the terms and conditions of the Creative Commons Attribution (CC BY) license (https://creativecommons.org/licenses/by/4.0/).
Share and Cite
Sargentis, G.-F.; Koutsoyiannis, D. The Function of Money in Water–Energy–Food and Land Nexus. Land 2023, 12, 669. https://doi.org/10.3390/land12030669
Sargentis G-F, Koutsoyiannis D. The Function of Money in Water–Energy–Food and Land Nexus. Land. 2023; 12(3):669. https://doi.org/10.3390/land12030669
Chicago/Turabian StyleSargentis, G.-Fivos, and Demetris Koutsoyiannis. 2023. "The Function of Money in Water–Energy–Food and Land Nexus" Land 12, no. 3: 669. https://doi.org/10.3390/land12030669