
Multidimensional Role of Agrovoltaics in Era of EU Green Deal: Current Status and Analysis of Water–Energy–Food–Land Dependencies


Abstract
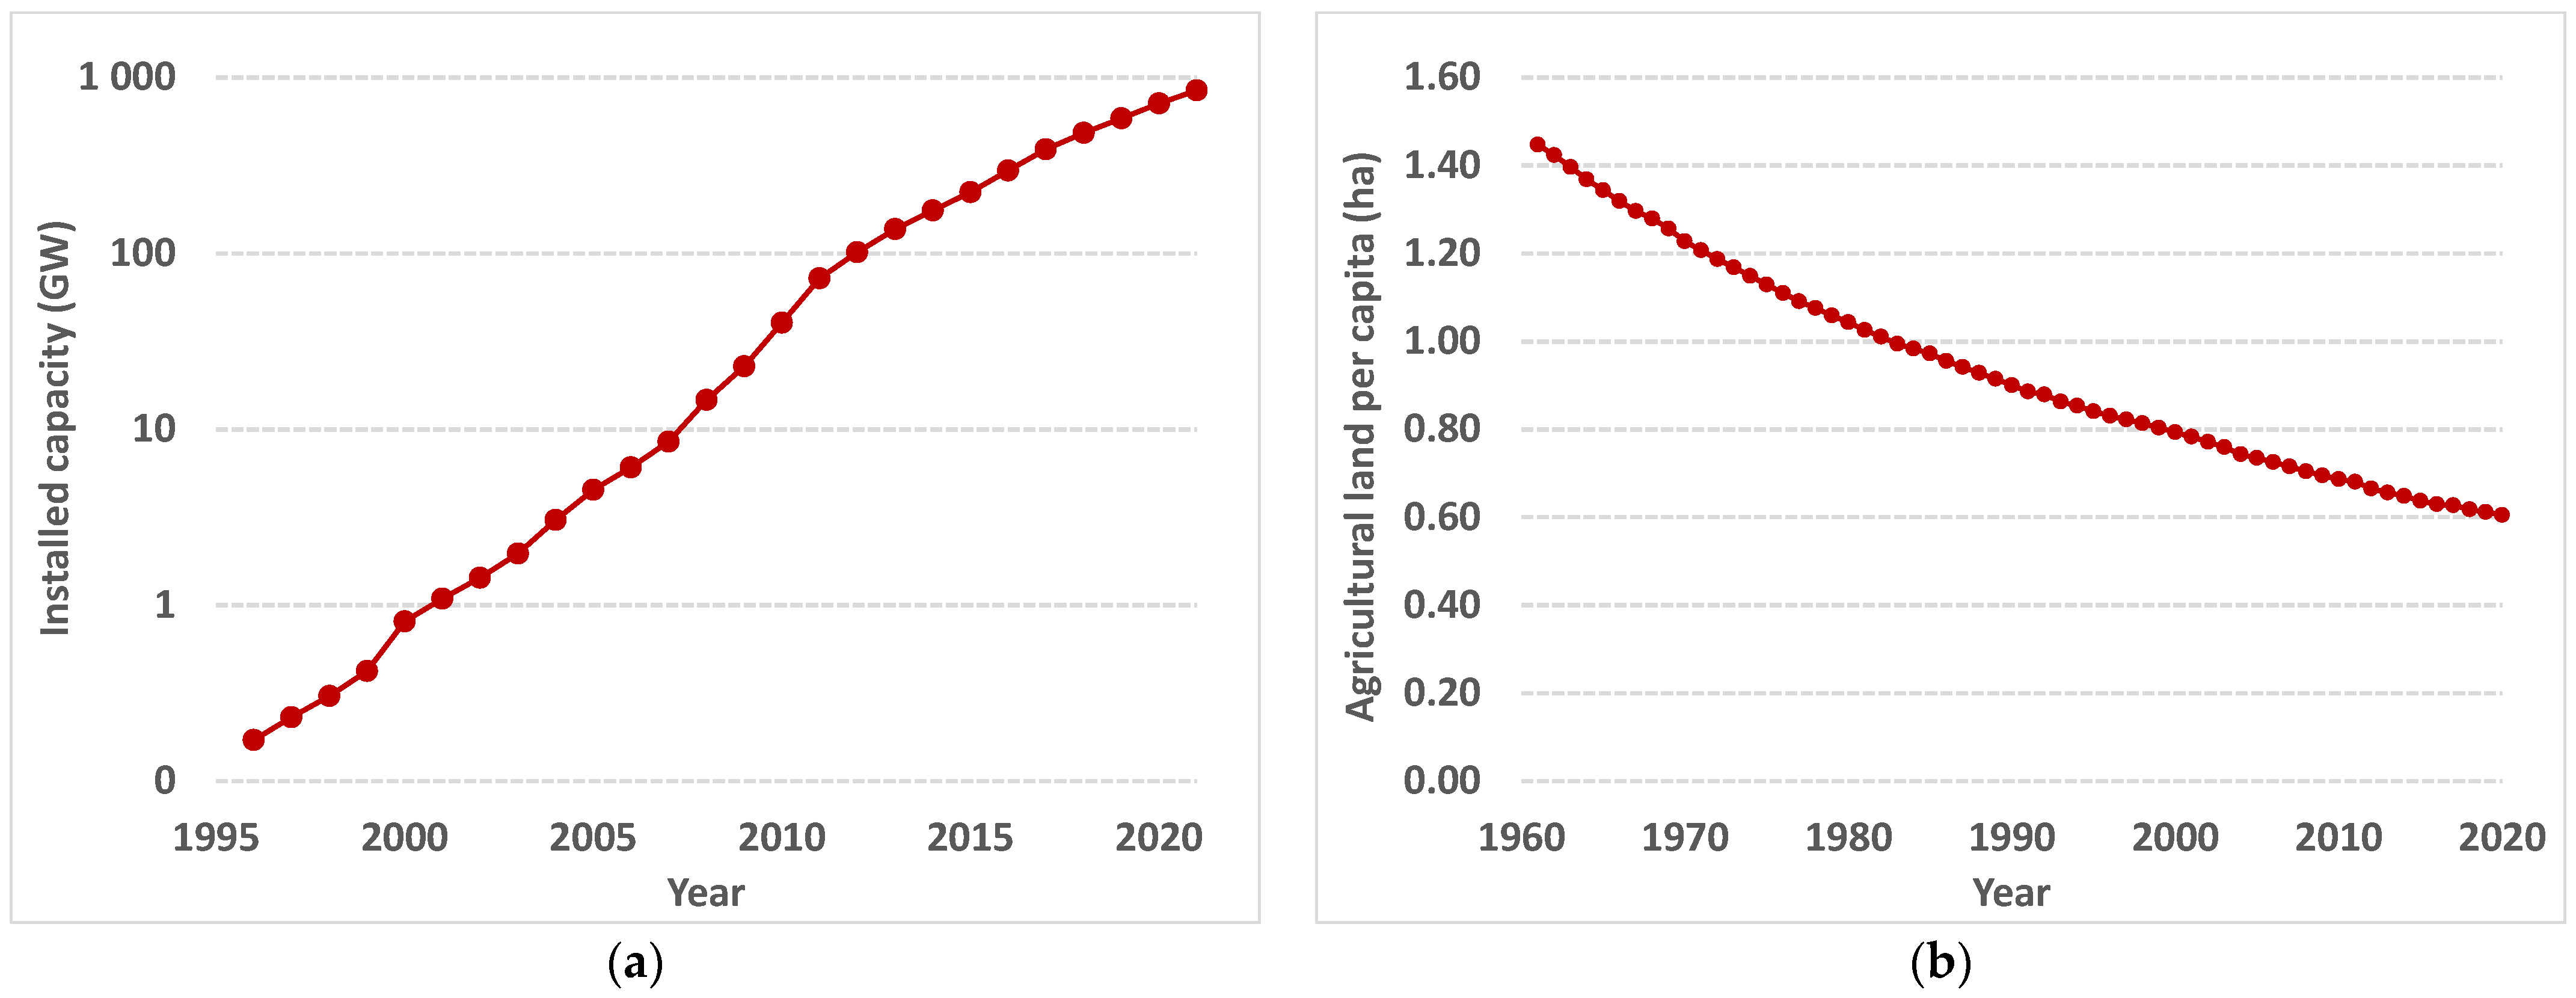
:1. Introduction

2. Historical Development of Agrovoltaic Systems
3. Technological Advances
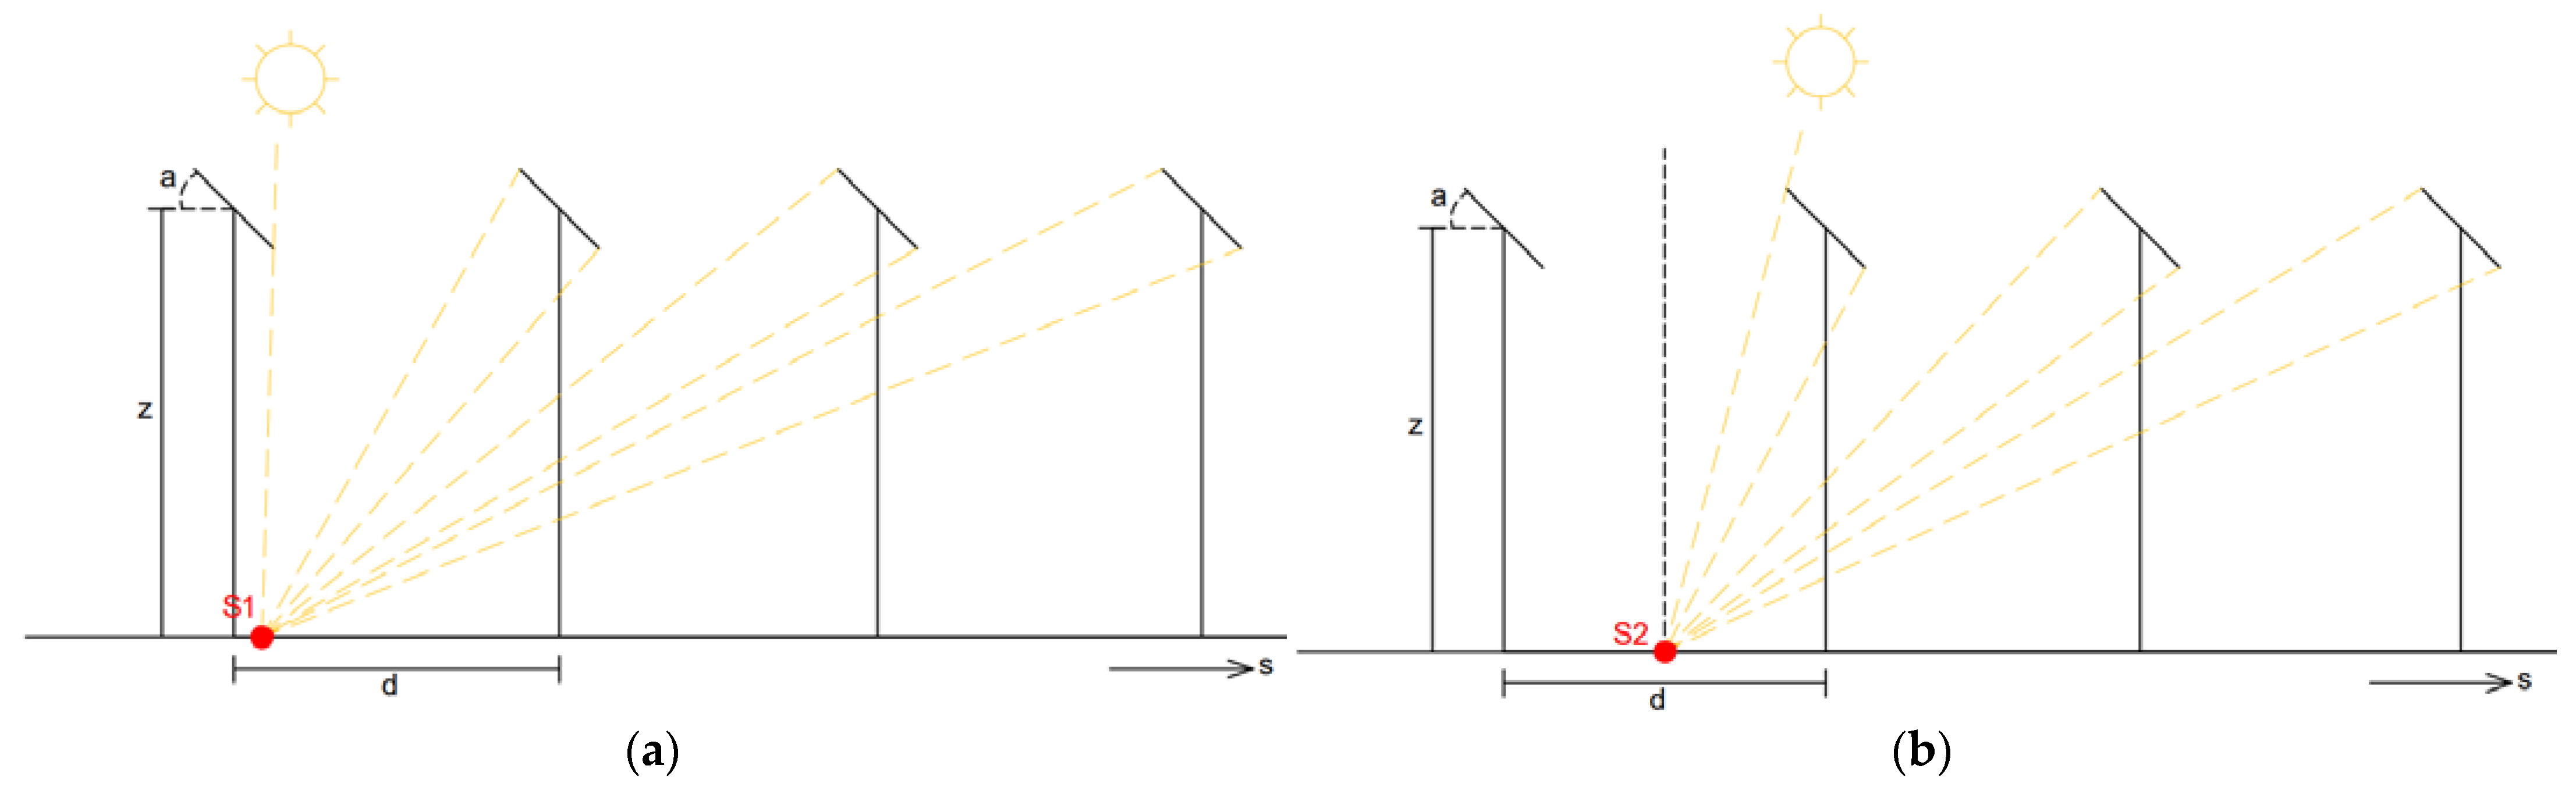
4. Design Parameters
4.1. Panel Height
4.2. Panel Tilt Angle and Orientation
4.3. Array Density
4.4. Other Situational Factors That Influence the Operation of an AV System
5. Performance and Evaluation of AV Systems
5.1. Performance Metrics
5.1.1. Ground Coverage Ratio (GCR)
5.1.2. Agricultural and Energy Yield
5.1.3. Water Usage Efficiency
5.1.4. Land Equivalent Ratio (LER)
5.2. Economic Indicators
5.2.1. Price Performance Ratio (PPR)
5.2.2. Levelized Cost of Electricity (LCOE)
6. Proof of Concept: Arta Plain, Western Greece
6.1. Problem Setting
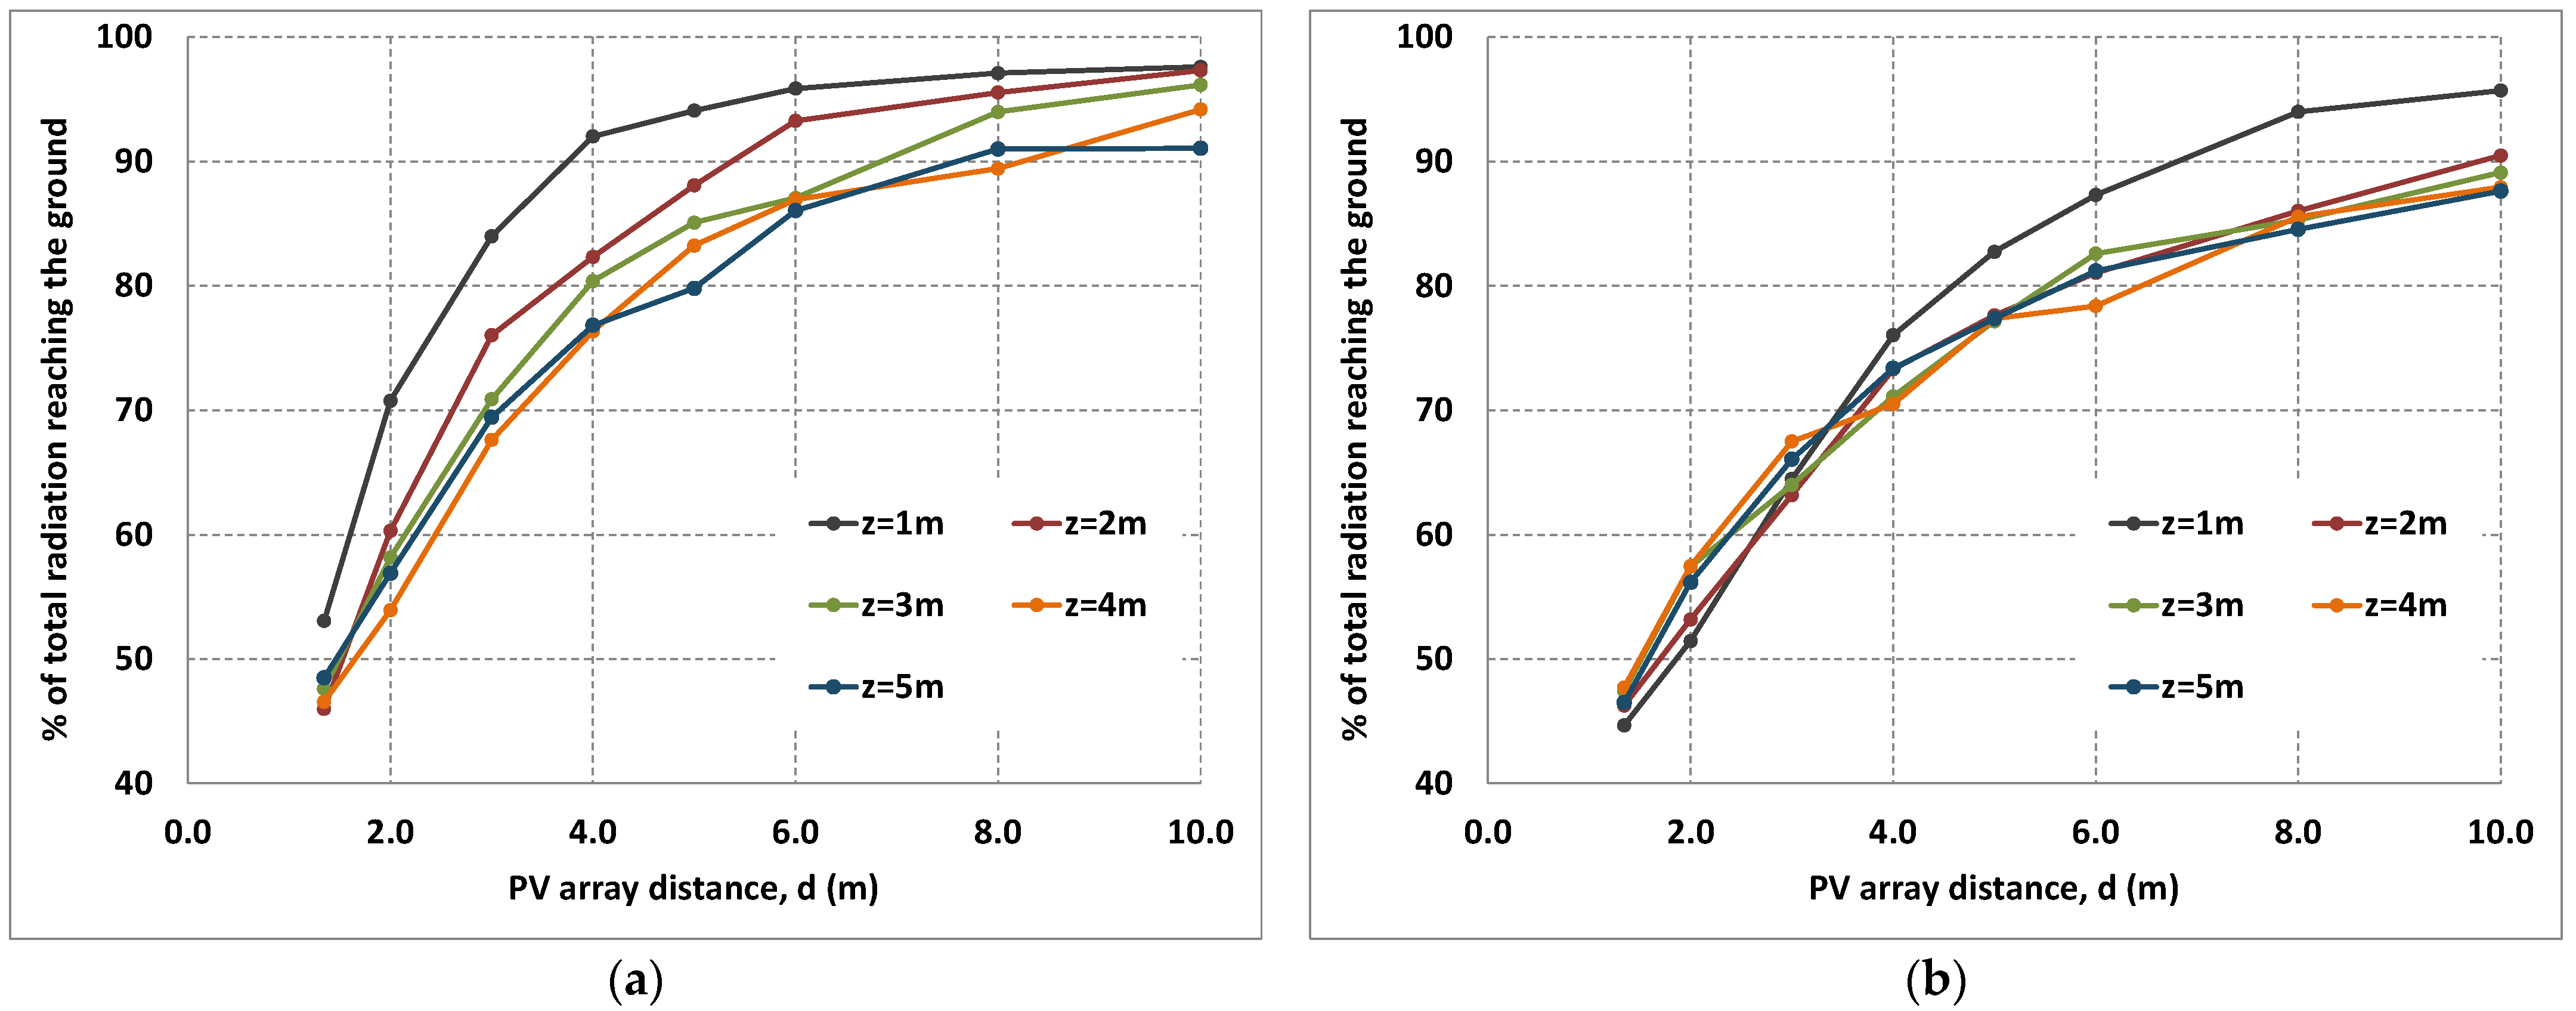
6.2. Ground Radiation
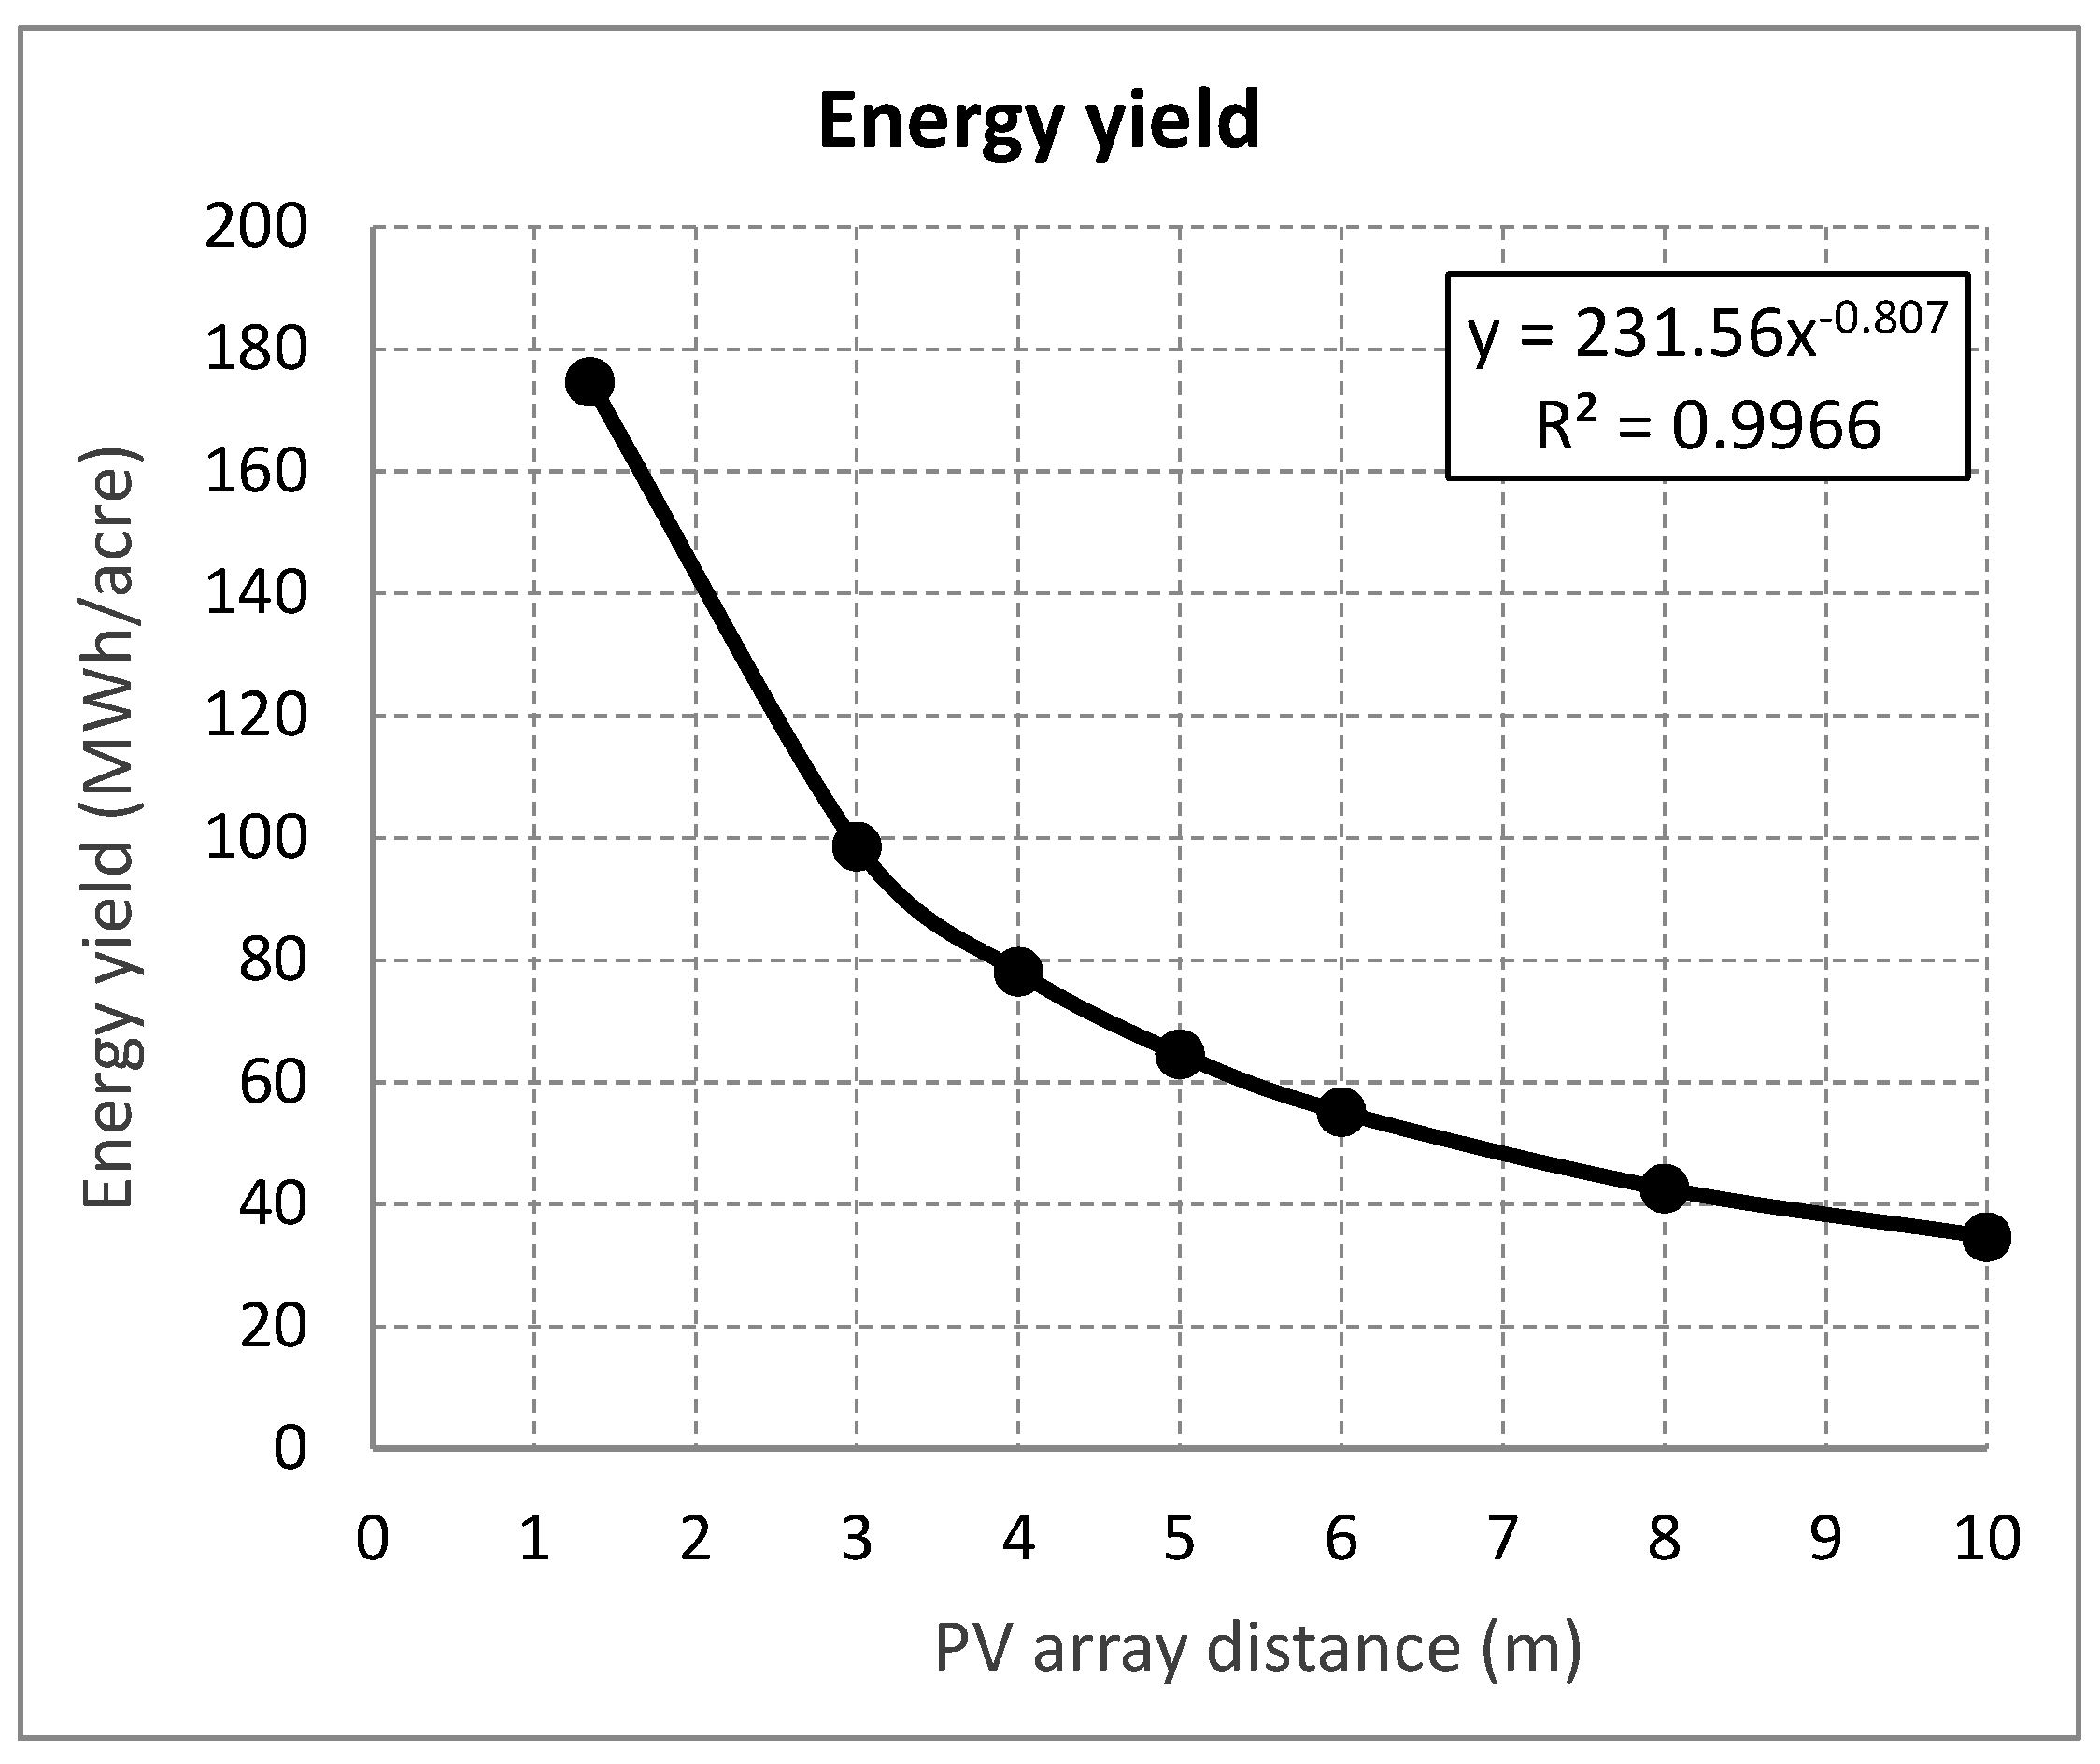
6.3. Energy Yield
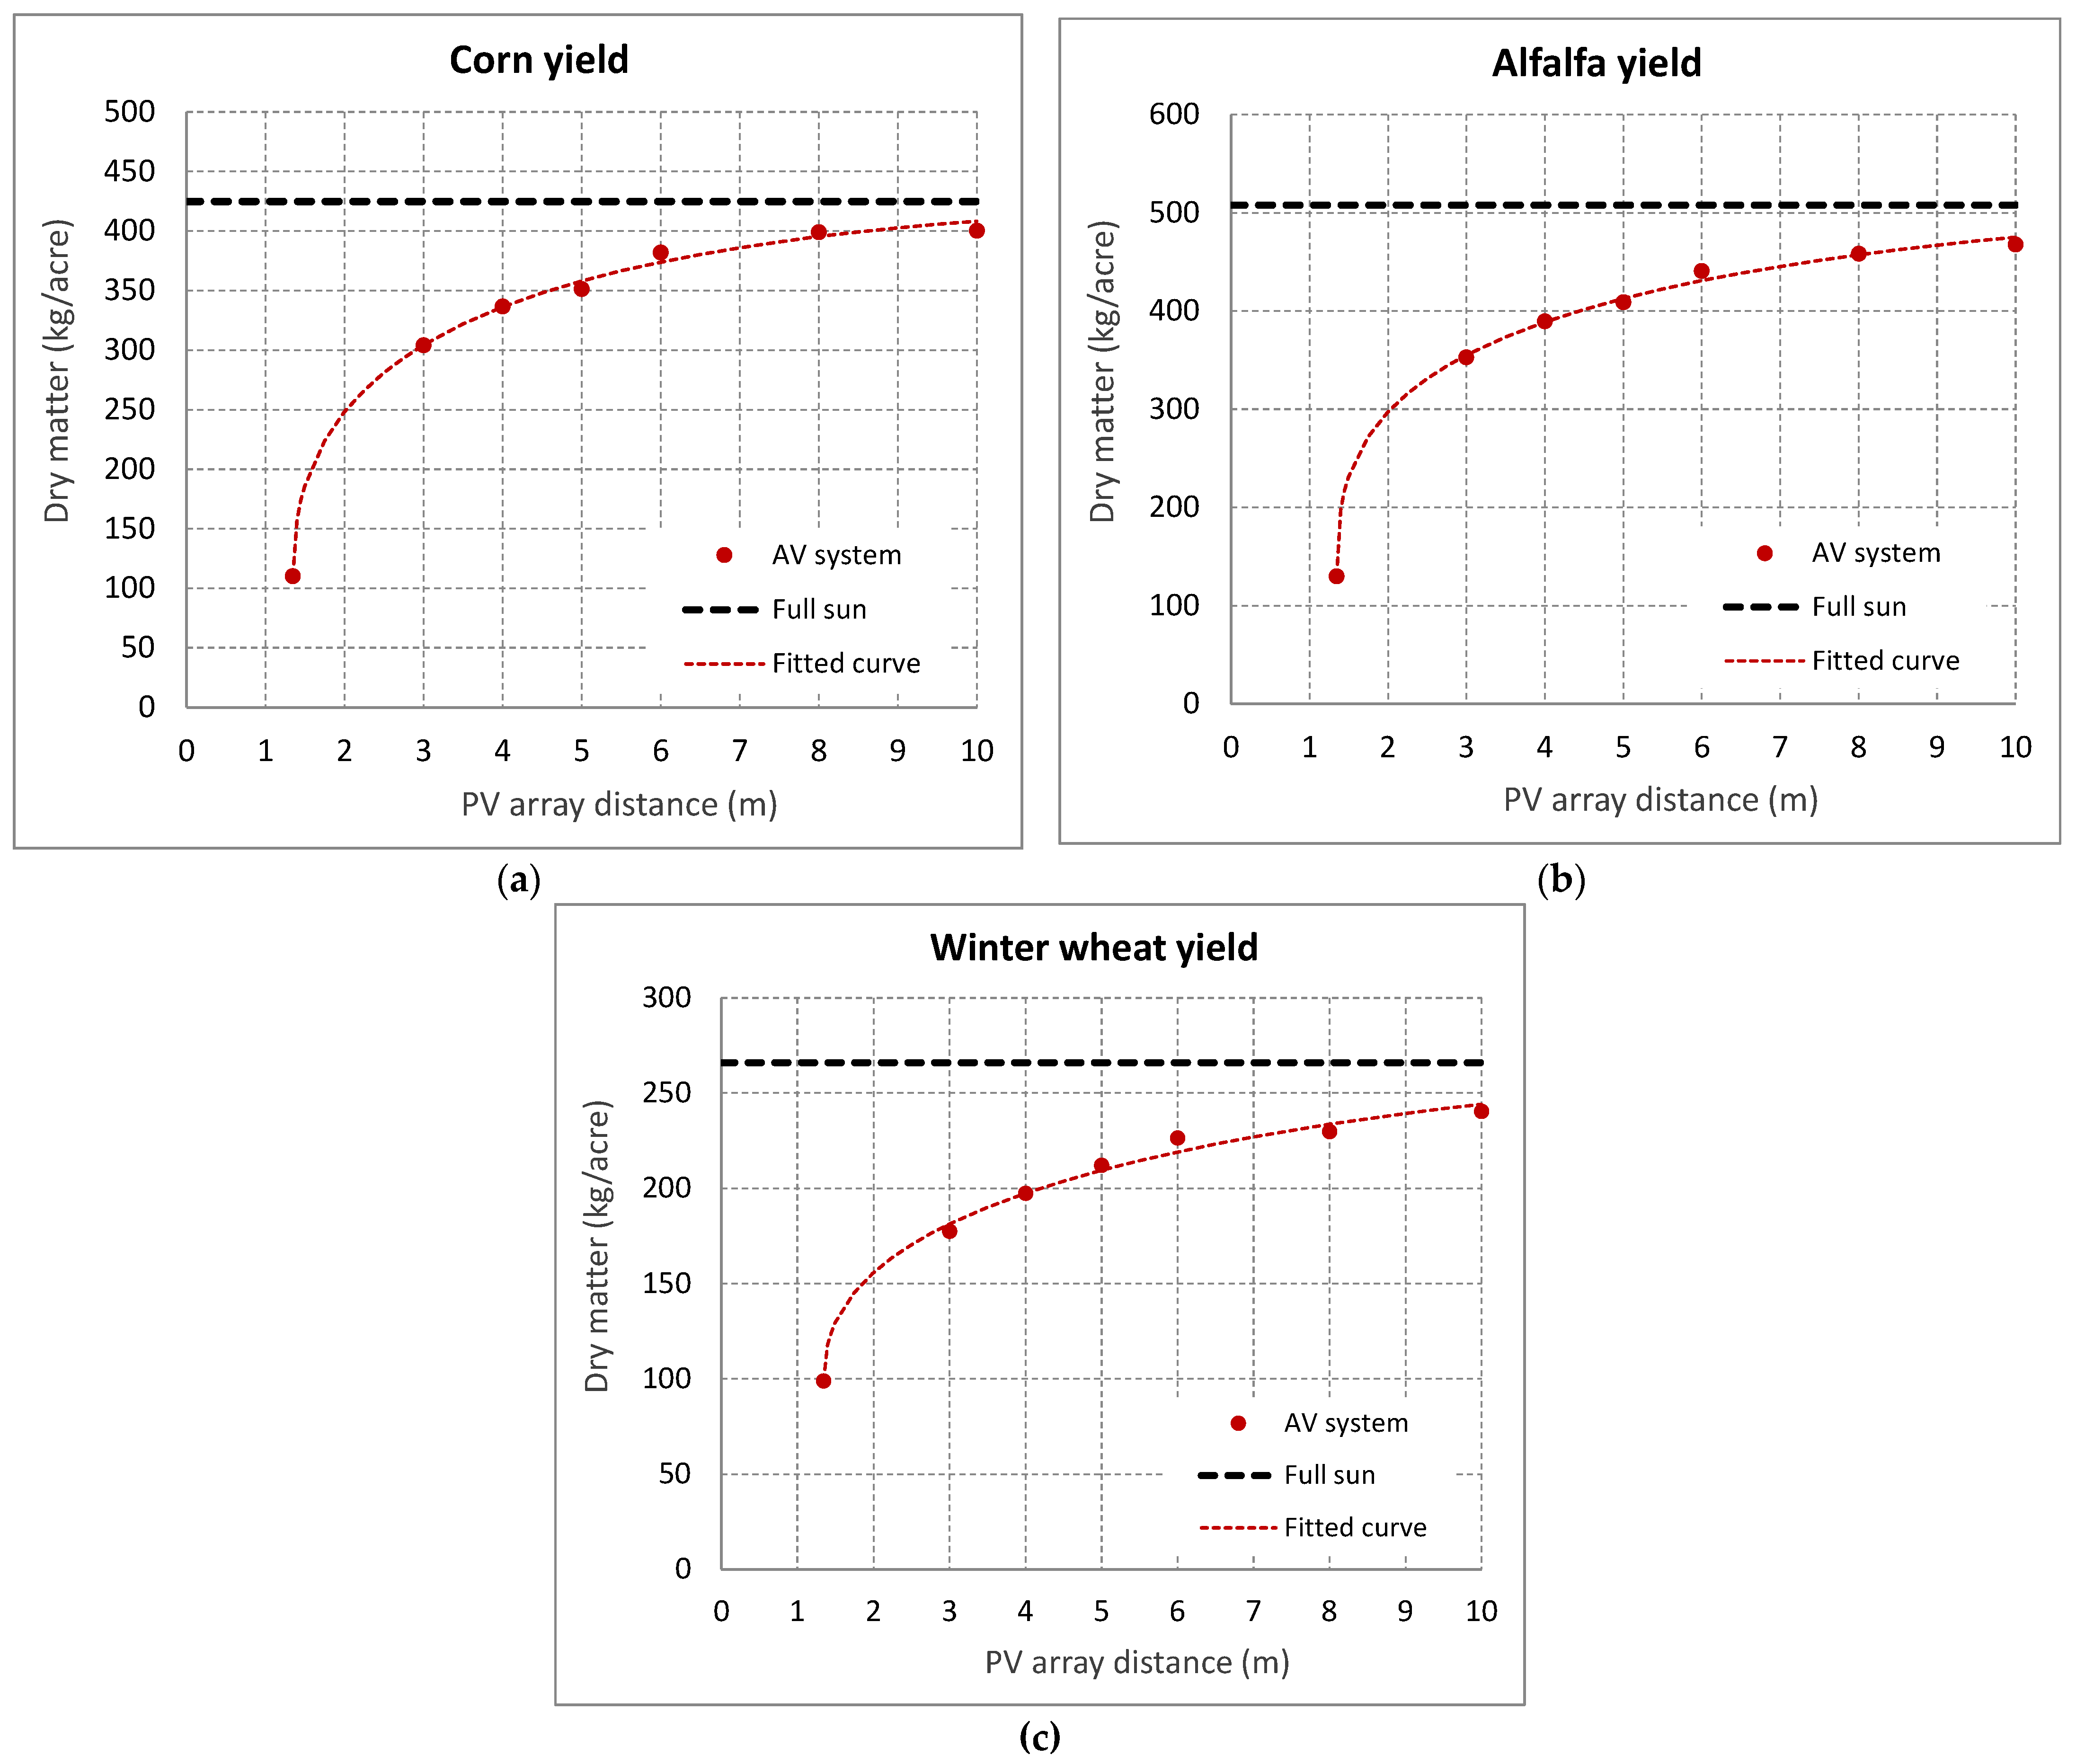
6.4. Crop Yield
6.5. Water Demand
- First stage (25 days): kc = 0.45;
- Second stage (40 days): kc = 0.70;
- Third stage (60 days): kc = 1.05;
- Fourth stage (25 days): kc = 0.60.
6.6. Overall Performance
6.7. Issues of Uncertainty
7. Discussion
8. Conclusions
9. Patents
Author Contributions
Funding
Institutional Review Board Statement
Informed Consent Statement
Data Availability Statement
Acknowledgments
Conflicts of Interest
References
- European Commission, REPowerEU: Affordable, Secure and Sustainable Energy for Europe. Available online: https://commission.europa.eu/strategy-and-policy/priorities-2019-2024/european-green-deal/repowereu-affordable-secure-and-sustainable-energy-europe_en (accessed on 27 March 2023).
- European Commission, European Green Deal: New Financing Mechanism to Boost Renewable Energy. Available online: https://ec.europa.eu/info/news/european-green-deal-new-financing-mechanism-boost-renewable-energy-2020-sep-17_en (accessed on 17 February 2023).
- Strapasson, A.; Woods, J.; Chum, H.; Kalas, N.; Shah, N.; Rosillo-Calle, F. On the global limits of bioenergy and land use for climate change mitigation. GCB Bioenergy 2017, 9, 1721–1735. [Google Scholar] [CrossRef]
- Rosillo-Calle, F. A review of biomass energy—Shortcomings and concerns. J. Chem. Technol. Biotechnol. 2016, 91, 1933–1945. [Google Scholar] [CrossRef]
- Jain, P.; Raina, G.; Sinha, S.; Malik, P.; Mathur, S. Agrovoltaics: Step towards sustainable energy-food combination. Bioresour. Technol. Rep. 2021, 15, 100766. [Google Scholar] [CrossRef]
- Mouhib, E.; Micheli, L.; Almonacid, F.M.; Fernández, E.F. Overview of the Fundamentals and Applications of Bifacial Photovoltaic Technology: Agrivoltaics and Aquavoltaics. Energies 2022, 15, 8777. [Google Scholar] [CrossRef]
- Ioannidis, R.; Koutsoyiannis, D. A review of land use, visibility and public perception of renewable energy in the context of landscape impact. Appl. Energy 2020, 276, 115367. [Google Scholar] [CrossRef]
- Al Mamun, M.A.; Dargusch, P.; Wadley, D.; Zulkarnain, N.A.; Aziz, A.A. A review of research on agrivoltaic systems. Renew. Sustain. Energy Rev. Elsevier Ltd. 2022, 161, 112351. [Google Scholar] [CrossRef]
- Hannah Ritchie and Max Roser. Land Use. Published Online at OurWorldInData.org. 2013. Available online: https://ourworldindata.org/land-use (accessed on 1 May 2023).
- Victoria, M.; Haegel, N.; Peters, I.M.; Sinton, R.; Jäger-Waldau, A.; del Cañizo, C.; Breyer, C.; Stocks, M.; Blakers, A.; Kaizuka, I.; et al. Solar photovoltaics is ready to power a sustainable future. Joule 2021, 5, 1041–1056. [Google Scholar] [CrossRef]
- Späth, L. Large-scale photovoltaics? Yes please, but not like this! Insights on different perspectives underlying the trade-off between land use and renewable electricity development. Energy Policy 2018, 122, 429–437. [Google Scholar] [CrossRef]
- Sargentis, G.-F.; Siamparina, P.; Sakki, G.-K.; Efstratiadis, A.; Chiotinis, M.; Koutsoyiannis, D. Agricultural Land or Photovoltaic Parks? The Water–Energy–Food Nexus and Land Development Perspectives in the Thessaly Plain, Greece. Sustainability 2021, 13, 8935. [Google Scholar] [CrossRef]
- Nonhebel, S. Renewable energy and food supply: Will there be enough land? Renew. Sustain. Energy Rev. 2005, 9, 191–201. [Google Scholar] [CrossRef]
- Delfanti, L.; Colantoni, A.; Recanatesi, F.; Bencardino, M.; Sateriano, A.; Zambon, I.; Salvati, L. Solar plants, environmental degradation and local socioeconomic contexts: A case study in a Mediterranean country. Environ. Impact Assess. Rev. 2016, 61, 88–93. [Google Scholar] [CrossRef]
- Hall, P.A.; Lowe, C.; Vincent, C. Brain Stimulation Effects on Food Cravings and Consumption: An Update on Lowe et al. (2017) and a Response to Generoso et al. (2017). Psychosom. Med. 2017, 79(7), 839–842. [Google Scholar] [CrossRef] [PubMed]
- Zhuang, D.; Abbas, J.; Al-Sulaiti, K.; Fahlevi, M.; Aljuaid, M.; Saniuk, S. Land-use and food security in energy transition: Role of food supply. Front. Sustain. Food Syst. 2022, 6, 1053031. [Google Scholar] [CrossRef]
- Baldock, D.; Buckwell, A. Just Transition in the EU Agriculture and Land Use Sector; Institute for European Environmental Policy: London, UK, 2021. [Google Scholar]
- Klenske, N. To feed a growing population, farmers look to the Sun. Horiz. —EU Res. Innov. Mag. 2022. [Google Scholar]
- Ritchie, H.; Roser, M.; Rosado, P. Energy. Published Online at OurWorldInData.org. 2022. Available online: https://ourworldindata.org/energy (accessed on 1 May 2023).
- Dean, J.C.; Kusaka, R.; Walsh, P.S.; Allais, F.; Zwier, T.S. Plant sunscreens in the UV-B: Ultraviolet spectroscopy of jet-cooled sinapoyl malate, sinapic acid, and sinapate ester derivatives. J. Am. Chem. Soc. 2014, 136, 14780–14795. [Google Scholar] [CrossRef] [PubMed]
- Marrou, H.; Dufour, L.; Wery, J. How does a shelter of solar panels influence water flows in a soil–crop system? Eur. J. Agron. 2013, 50, 38–51. [Google Scholar] [CrossRef]
- European Commission. Farm to Fork Strategy for a Fair, Healthy and Environmentally-Friendly Food System. Available online: https://food.ec.europa.eu/horizontal-topics/farm-fork-strategy_en#further-information (accessed on 3 March 2023).
- Niazi, K.A.K.; Victoria, M. Comparative analysis of PV configurations for agrivoltaic systems in Europe. 2022. Available online: http://arxiv.org/abs/2211.00331 (accessed on 1 May 2023).
- Weselek, A.; Ehmann, A.; Zikeli, S.; Lewandowski, I.; Schindele, S.; Högy, P. Agrophotovoltaic systems: Applications, challenges, and opportunities. A review. Agron. Sustain. Dev. 2019, 39, 35. [Google Scholar] [CrossRef]
- European Bank for Reconstruction and Development. The EBRD just Transition Initiative—Sharing the Benefits of a Green Economy Transition and Protecting Vulnerable Countries, Regions and People from Falling Behind; 2020. Available online: https://www.ebrd.com/what-we-do/just-transition-initiative (accessed on 3 March 2023).
- Abdali, H.; Sahebi, H.; Pishvaee, M. The water-energy-food-land nexus at the sugarcane-to-bioenergy supply chain: A sustainable network design model. Comput. Chem. Eng. 2021, 145, 107199. [Google Scholar] [CrossRef]
- Goetzberger, A.; Zastrow, A. On the Coexistence of Solar-Energy Conversion and Plant Cultivation. Int. J. Sol. Energy 1982, 1, 55–69. [Google Scholar] [CrossRef]
- Tajima, M.; Iida, T. Evolution of agrivoltaic farms in Japan. AIP Publ. LLC 2021, 2361, 030002. [Google Scholar] [CrossRef]
- Dupraz, C.; Marrou, H.; Talbot, G.; Dufour, L.; Nogier, A.; Ferard, Y. Combining solar photovoltaic panels and food crops for optimising land use: Towards new agrivoltaic schemes. Renew. Energy 2011, 36, 2725–2732. [Google Scholar] [CrossRef]
- Amaducci, S.; Yin, X.; Colauzzi, M. Agrivoltaic systems to optimise land use for electric energy production. Appl. Energy 2018, 220, 545–561. [Google Scholar] [CrossRef]
- Chalgynbayeva, A.; Gabnai, Z.; Lengyel, P.; Pestisha, A.; Bai, A. Worldwide Research Trends in Agrivoltaic Systems—A Bibliometric Review. Energies 2023, 16, 611. [Google Scholar] [CrossRef]
- Evans, J.R. Improving Photosynthesis. Plant Physiol. 2013, 162, 1780–1793. [Google Scholar] [CrossRef]
- Dullweber, T.; Schmidt, J. Industrial Silicon Solar Cells Applying the Passivated Emitter and Rear Cell (PERC) Concept—A Review. IEEE J. Photovolt. 2016, 6, 1366–1381. [Google Scholar] [CrossRef]
- Sato, D.; Yamada, N. Design and testing of highly transparent concentrator photovoltaic modules for efficient dual-land-use applications. Energy Sci. Eng. 2020, 8, 779–788. [Google Scholar] [CrossRef]
- Domínguez, C.; Jost, N.; Askins, S.; Victoria, M.; Antón, I. A review of the promises and challenges of micro-concentrator photovoltaics. AIP Publ. LLC 2017, 1881, 080003. [Google Scholar] [CrossRef]
- Thompson, E.P.; Bombelli, E.L.; Shubham, S.; Watson, H.; Everard, A.; D’ardes, V.; Schievano, A.; Bocchi, S.; Zand, N.; Howe, C.J.; et al. Tinted Semi-Transparent Solar Panels Allow Concurrent Production of Crops and Electricity on the Same Cropland. Adv. Energy Mater. 2020, 10, 2001189. [Google Scholar] [CrossRef]
- Fernández, E.F.; Villar-Fernández, A.; Montes-Romero, J.; Ruiz-Torres, L.; Rodrigo, P.M.; Manzaneda, A.J.; Almonacid, F. Global energy assessment of the potential of photovoltaics for greenhouse farming. Appl. Energy 2022, 309, 118474. [Google Scholar] [CrossRef]
- Distler, A.; Brabec, C.J.; Egelhaaf, H. Organic photovoltaic modules with new world record efficiencies. Prog. Photovolt. Res. Appl. 2021, 29, 24–31. [Google Scholar] [CrossRef]
- NREL. Best Research-Cell Efficiency Chart. Available online: https://www.nrel.gov/pv/cell-efficiency.html (accessed on 24 February 2023).
- Toledo, C.; Scognamiglio, A. Agrivoltaic Systems Design and Assessment: A Critical Review, and a Descriptive Model towards a Sustainable Landscape Vision (Three-Dimensional Agrivoltaic Patterns). Sustainability 2021, 13, 6871. [Google Scholar] [CrossRef]
- Sargentis, G.-F.; Ioannidis, R.; Chiotinis, M.; Dimitriadis, P.; Koutsoyiannis, D. Aesthetical Issues with Stochastic Evaluation. In Data Analytics for Cultural Heritage; Belhi, A., Bouras, A., Al-Ali, A.K., Sadka, A.H., Eds.; Springer: Cham, Switzerland, 2021; pp. 173–193. [Google Scholar] [CrossRef]
- Sekiyama, T.; Nagashima, A. Solar Sharing for Both Food and Clean Energy Production: Performance of Agrivoltaic Systems for Corn, A Typical Shade-Intolerant Crop. Environments 2019, 6, 65. [Google Scholar] [CrossRef]
- Hussain, A.; Batra, A.; Pachauri, R. An experimental study on effect of dust on power loss in solar photovoltaic module. Renew. Wind. Water Sol. 2017, 4, 9. [Google Scholar] [CrossRef]
- Marrou, H.; Wery, J.; Dufour, L.; Dupraz, C. Productivity and radiation use efficiency of lettuces grown in the partial shade of photovoltaic panels. Eur. J. Agron. 2013, 44, 54–66. [Google Scholar] [CrossRef]
- Mamassis, N.; Efstratiadis, A.; Apostolidou, I.-G. Topography-adjusted solar radiation indices and their importance in hydrology. Hydrol. Sci. J. 2012, 57, 756–775. [Google Scholar] [CrossRef]
- Valle, B.; Simonneau, T.; Sourd, F.; Pechier, P.; Hamard, P.; Frisson, T.; Ryckewaert, M.; Christophe, A. Increasing the total productivity of a land by combining mobile photovoltaic panels and food crops. Appl. Energy 2017, 206, 1495–1507. [Google Scholar] [CrossRef]
- Gorjian, S.; Bousi, E.; Özdemir, E.; Trommsdorff, M.; Kumar, N.M.; Anand, A.; Kant, K.; Chopra, S.S. Progress and challenges of crop production and electricity generation in agrivoltaic systems using semi-transparent photovoltaic technology. Renew. Sustain. Energy Rev. 2022, 158, 112126. [Google Scholar] [CrossRef]
- Reker, S.; Schneider, J.; Gerhards, C. Integration of vertical solar power plants into a future German energy system. Smart Energy 2022, 7, 100083. [Google Scholar] [CrossRef]
- Scognamiglio, A. ‘Photovoltaic landscapes’: Design and assessment. A critical review for a new transdisciplinary design vision. Renew. Sustain. Energy Rev. 2016, 55, 629–661. [Google Scholar] [CrossRef]
- Dinesh, H.; Pearce, J.M. The potential of agrivoltaic systems. Renew. Sustain. Energy Rev. 2016, 54, 299–308. [Google Scholar] [CrossRef]
- Campana, P.E.; Stridh, B.; Amaducci, S.; Colauzzi, M. Optimisation of vertically mounted agrivoltaic systems. J. Clean. Prod. 2021, 325, 129091. [Google Scholar] [CrossRef]
- Willockx, B.; Uytterhaegen, B.; Ronsijn, B.; Herteleer, B.; Cappelle, J. A Standardized Classification and Performance In-Dicators of Agrivoltaic Systems. In Proceedings of the 37th European Photovoltaic Solar Energy Conference and Exhibition, Lisbon, Portugal, 7–11 September 2020; pp. 1995–1998. [Google Scholar] [CrossRef]
- OECD. The Land-Water-Energy Nexus; OECD: Paris, France, 2017. [Google Scholar] [CrossRef]
- Willockx, B.; Herteleer, B.; Cappelle, J. Combining photovoltaic modules and food crops: First agrivoltaic prototype in Belgium. Renew. Energy Power Qual. J. 2020, 18, 266–271. [Google Scholar] [CrossRef]
- Adeh, E.H.; Selker, J.S.; Higgins, C.W. Remarkable agrivoltaic influence on soil moisture, micrometeorology and water-use efficiency. PLoS ONE 2018, 13, e0203256. [Google Scholar] [CrossRef]
- Willockx, B.; Lavaert, C.; Cappelle, J. Geospatial assessment of elevated agrivoltaics on arable land in Europe to highlight the implications on design, land use and economic level. Energy Rep. 2022, 8, 8736–8751. [Google Scholar] [CrossRef]
- Schindele, S.; Trommsdorff, M.; Schlaak, A.; Obergfell, T.; Bopp, G.; Reise, C.; Braun, C.; Weselek, A.; Bauerle, A.; Högy, P.; et al. Implementation of agrophotovoltaics: Techno-economic analysis of the price-performance ratio and its policy implications. Appl. Energy 2020, 265, 114737. [Google Scholar] [CrossRef]
- Ueckerdt, F.; Hirth, L.; Luderer, G.; Edenhofer, O. System LCOE: What are the costs of variable renewables? Energy 2013, 63, 61–75. [Google Scholar] [CrossRef]
- Mamassis, N.; Mazi, K.; Dimitriou, E.; Kalogeras, D.; Malamos, N.; Lykoudis, S.; Koukouvinos, A.; Tsirogiannis, I.; Papageorgaki, I.; Papadopoulos, A.; et al. OpenHi.net: A Synergistically Built, National-Scale Infrastructure for Monitoring the Surface Waters of Greece. Water 2021, 13, 2779. [Google Scholar] [CrossRef]
- Angstrom, A. On the computation of global radiation from records of sunshine. Ark. Geofys. 1956, 3, 551–556. [Google Scholar]
- Brutsaert, W. Evaporation into the Atmosphere; Springer: Dordrecht, The Netherlands, 1982. [Google Scholar] [CrossRef]
- Wang, C.; Guo, L.; Li, Y.; Wang, Z. Systematic Comparison of C3 and C4 Plants Based on Metabolic Network Analysis. BMC Syst. Biol. 2012, 6, S9. [Google Scholar] [CrossRef]
- Cui, H. Challenges and Approaches to Crop Improvement Through C3-to-C4 Engineering. Front. Plant Sci. 2021, 12. [Google Scholar] [CrossRef]
- Sinclair, D.A.; A Ruddell, A.; Brock, J.K.; Clegg, N.J.; Lloyd, V.K.; A Grigliatti, T. A cytogenetic and genetic characterization of a group of closely linked second chromosome mutations that suppress position-effect variegation in Drosophila melanogaster. Genetics 1992, 130, 333–344. [Google Scholar] [CrossRef]
- Gosse, G.; Varlet-Grancher, C.; Bonhomme, R.; Chartier, M.; Allirand, J.M.; Lemaire, G. Production maximale de matière sèche et rayonnement solaire intercepté par un couvert vegetal. Agronomie 1986, 6, 47–56. [Google Scholar] [CrossRef]
- Gallagher, J.N.; Biscoe, P.V. Radiation absorption, growth and yield of cereals. J. Agric. Sci. 1978, 91, 47–60. [Google Scholar] [CrossRef]
- Campillo, C.; Fortes, R.; del Prieto, H. Solar Radiation Effect on Crop Production. In Solar Radiation; Babatunde, E.B., Ed.; IntechOpen: Rijeka, Croatia, 2012; p. 11. [Google Scholar] [CrossRef]
- Monteith, J.L. Solar Radiation and Productivity in Tropical Ecosystems. J. Appl. Ecol. 1972, 9, 747–766. [Google Scholar] [CrossRef]
- Sinclair, T.R.; Muchow, R.C. Radiation Use Efficiency. In Advances in Agronomy; Sparks, D.L., Ed.; Academic Press: Cambridge, MA, USA, 1999; Volume 65, pp. 215–265. [Google Scholar] [CrossRef]
- Li, Y.-C.; Dai, H.-Y.; Chen, H. Effects of plant density on the aboveground dry matter and radiation-use efficiency of field corn. PLoS ONE 2022, 17, e0277547. [Google Scholar] [CrossRef]
- Allan, R.; Pereira, L.; Smith, M. Crop evapotranspiration—Guidelines for computing crop water requirements. FAO Irrig. Drain. Pap. 56 1998, 56, D05109. [Google Scholar]
- Sakki, G.-K.; Tsoukalas, I.; Kossieris, P.; Makropoulos, C.; Efstratiadis, A. Stochastic simulation-optimization framework for the design and assessment of renewable energy systems under uncertainty. Renew. Sustain. Energy Rev. 2022, 168, 112886. [Google Scholar] [CrossRef]
- Urraca, R.; Huld, T.; Lindfors, A.V.; Riihelä, A.; Martinez-De-Pison, F.J.; Sanz-Garcia, A. Quantifying the amplified bias of PV system simulations due to uncertainties in solar radiation estimates. Sol. Energy 2018, 176, 663–677. [Google Scholar] [CrossRef]
- Pei, Y.; Dong, J.; Zhang, Y.; Yuan, W.; Doughty, R.; Yang, J.; Zhou, D.; Zhang, L.; Xiao, X. Evolution of light use efficiency models: Improvement, uncertainties, and implications. Agric. For. Meteorol. 2022, 317, 108905. [Google Scholar] [CrossRef]
- Hua, D.; Hao, X.; Zhang, Y.; Qin, J. Uncertainty assessment of potential evapotranspiration in arid areas, as estimated by the Penman-Monteith method. J. Arid. Land 2020, 12, 166–180. [Google Scholar] [CrossRef]
- Zohdi, T.I. A digital-twin and machine-learning framework for the design of multiobjective agrophotovoltaic solar farms. Comput. Mech. 2021, 68, 357–370. [Google Scholar] [CrossRef]
- Majumdar, D.; Pasqualetti, M.J. Dual use of agricultural land: Introducing ‘agrivoltaics’ in Phoenix Metropolitan Statistical Area, USA. Landsc. Urban Plan. 2018, 170, 150–168. [Google Scholar] [CrossRef]
- Laleman, R.; Albrecht, J.; Dewulf, J. Life Cycle Analysis to estimate the environmental impact of residential photovoltaic systems in regions with a low solar irradiation. Renew. Sustain. Energy Rev. 2011, 15, 267–281. [Google Scholar] [CrossRef]
- Li, C.; Wang, H.; Miao, H.; Ye, B. The economic and social performance of integrated photovoltaic and agricultural greenhouses systems: Case study in China. Appl. Energy 2017, 190, 204–212. [Google Scholar] [CrossRef]
- Moradi, H.; Abtahi, A.; Zilouchian, A. Financial Analysis of a Grid-connected Photovoltaic System in South Florida. In Proceedings of the 2017 IEEE 44th Photovoltaic Specialist Conference (PVSC), Washington, DC, USA, 25–30 June 2017; pp. 638–642. [Google Scholar] [CrossRef]


| Nominal power (W) | 400 |
| Total efficiency (%) | 22.6 |
| Dimensions (mm) | 1046 × 1690 × 40 |
| Operating temperature (°C) | −40 to +85 |
| Power temperature coefficient (%/°C) | −0.29 |
| Array Distance (m) | Tilt Angle (°) | |||||
|---|---|---|---|---|---|---|
| Height 1.0 m | Height 5.0 m | |||||
| 35 | 40 | 45 | 35 | 40 | 45 | |
| 1.345 | 53 | 53 | 54 | 48 | 48 | 49 |
| 5.0 | 94 | 94 | 94 | 80 | 80 | 79 |
| 10.0 | 98 | 98 | 98 | 91 | 91 | 91 |
| Month | Panel Distance, d (m) | ||||||
|---|---|---|---|---|---|---|---|
| 1.345 | 3.0 | 4.0 | 5.0 | 6.0 | 8.0 | 10.0 | |
| January | 6.9 | 3.9 | 3.1 | 2.5 | 2.2 | 1.7 | 1.4 |
| February | 8.1 | 4.6 | 3.6 | 3.0 | 2.6 | 2.0 | 1.6 |
| March | 12.0 | 6.8 | 5.4 | 4.4 | 3.8 | 2.9 | 2.4 |
| April | 18.3 | 10.3 | 8.2 | 6.8 | 5.8 | 4.5 | 3.6 |
| May | 19.6 | 11.1 | 8.8 | 7.2 | 6.2 | 4.8 | 3.9 |
| June | 22.3 | 12.6 | 10.0 | 8.3 | 7.0 | 5.4 | 4.4 |
| July | 24.8 | 14.0 | 11.1 | 9.2 | 7.8 | 6.1 | 4.9 |
| August | 21.6 | 12.2 | 9.7 | 8.0 | 6.8 | 5.3 | 4.3 |
| September | 15.0 | 8.5 | 6.7 | 5.5 | 4.7 | 3.7 | 3.0 |
| October | 10.9 | 6.2 | 4.9 | 4.0 | 3.4 | 2.7 | 2.2 |
| November | 7.3 | 4.1 | 3.2 | 2.7 | 2.3 | 1.8 | 1.4 |
| December | 7.9 | 4.4 | 3.5 | 2.9 | 2.5 | 1.9 | 1.6 |
| Total | 174.6 | 98.6 | 78.1 | 64.6 | 55.1 | 42.6 | 34.7 |
| Growth Period | Days of Development | Radiation Use Efficiency (RUE) | Dry Matter under Full Sun, DMmax (kg/acre) | Shape Parameters | ||
|---|---|---|---|---|---|---|
| a | b | |||||
| Corn (C4) | 10 April to 9 September | 150 | 2.49 | 424.7 | 0.468 | 2.466 |
| Alfalfa (C3) | Perennial crop | - | 1.77 | 507.9 | 0.381 | 1.788 |
| Winter Wheat (C3) | 15 October to 1 June | 225 | 2.00 | 266.0 | 0.449 | 1.653 |
| Array Distance (m) | Corn | Alfalfa | Winter Wheat |
|---|---|---|---|
| 1.345 | 110.5 | 129.8 | 98.9 |
| 3.0 | 304.2 | 352.9 | 177.5 |
| 4.0 | 336.8 | 389.6 | 197.4 |
| 5.0 | 351.4 | 409.0 | 212.1 |
| 6.0 | 382.1 | 440.7 | 226.4 |
| 8.0 | 399.2 | 458.2 | 229.8 |
| 10.0 | 400.6 | 467.8 | 240.3 |
| Panel Distance, d (m) | ||||||||
|---|---|---|---|---|---|---|---|---|
| ET0 (mm) | 1.345 | 3.0 | 4.0 | 5.0 | 6.0 | 8.0 | 10.0 | Infinite |
| January | 18.4 | 22.0 | 41.3 | 41.5 | 41.8 | 42.5 | 42.3 | 42.9 |
| February | 27.0 | 31.5 | 48.4 | 52.3 | 51.5 | 52.1 | 51.9 | 53.6 |
| March | 36.8 | 43.5 | 62.5 | 60.5 | 62.9 | 61.5 | 63.9 | 64.4 |
| April | 58.0 | 85.5 | 98.7 | 91.3 | 100.1 | 95.7 | 102.2 | 103.5 |
| May | 57.4 | 78.1 | 80.1 | 95.1 | 89.6 | 94.7 | 97.9 | 103.5 |
| June | 83.5 | 98.8 | 89.0 | 119.9 | 122.3 | 130.3 | 126.1 | 144.3 |
| July | 82.1 | 108.2 | 109.8 | 137.4 | 135.2 | 144.2 | 144.6 | 160.2 |
| August | 81.1 | 123.1 | 131.6 | 132.8 | 135.5 | 135.8 | 145.7 | 148.6 |
| September | 49.5 | 63.4 | 94.8 | 86.8 | 95.2 | 90.4 | 95.6 | 97.1 |
| October | 33.9 | 45.2 | 61.9 | 67.4 | 65.2 | 66.7 | 67.7 | 69.6 |
| November | 21.1 | 25.5 | 45.9 | 46.9 | 47.3 | 48.0 | 47.8 | 48.6 |
| December | 17.7 | 18.5 | 39.5 | 39.4 | 39.3 | 39.7 | 39.9 | 40.2 |
| Annual | 566.5 | 743.3 | 903.6 | 971.1 | 985.9 | 1001.6 | 1025.6 | 1076.6 |
| Distance (m) | Theoretical Water Needs, ETc (mm/y) | ||
|---|---|---|---|
| Reference Crop | Corn | Alfalfa | |
| 1.345 | 566.5 | 264.4 | 481.5 |
| 3.0 | 743.3 | 354.9 | 631.8 |
| 4.0 | 903.6 | 365.7 | 768.0 |
| 5.0 | 971.1 | 421.7 | 825.5 |
| 6.0 | 985.9 | 427.0 | 838.1 |
| 8.0 | 1001.6 | 442.4 | 851.4 |
| 10.0 | 1025.6 | 450.9 | 871.8 |
| Infinite | 1076.6 | 487.4 | 915.1 |
| Array Distance (m) | PV Modules /acre | Ground Coverage Ratio (GCR) | Land Equivalent Ratio (LER) | Water Saving Index (WSI) | |||
|---|---|---|---|---|---|---|---|
| Corn | Alfalfa | Winter Wheat | Corn | Alfalfa | |||
| 1.345 | 276 | 0.37 | 1.260 | 1.256 | 1.372 | 0.458 | 0.474 |
| 3 | 156 | 0.21 | 1.281 | 1.260 | 1.232 | 0.272 | 0.310 |
| 4 | 123 | 0.17 | 1.240 | 1.214 | 1.189 | 0.250 | 0.161 |
| 5 | 102 | 0.14 | 1.197 | 1.175 | 1.167 | 0.135 | 0.098 |
| 6 | 87 | 0.12 | 1.215 | 1.183 | 1.167 | 0.124 | 0.084 |
| 8 | 67 | 0.09 | 1.184 | 1.146 | 1.108 | 0.093 | 0.070 |
| 10 | 55 | 0.07 | 1.142 | 1.120 | 1.102 | 0.075 | 0.047 |
Disclaimer/Publisher’s Note: The statements, opinions and data contained in all publications are solely those of the individual author(s) and contributor(s) and not of MDPI and/or the editor(s). MDPI and/or the editor(s) disclaim responsibility for any injury to people or property resulting from any ideas, methods, instructions or products referred to in the content. |
© 2023 by the authors. Licensee MDPI, Basel, Switzerland. This article is an open access article distributed under the terms and conditions of the Creative Commons Attribution (CC BY) license (https://creativecommons.org/licenses/by/4.0/).
Share and Cite
Roxani, A.; Zisos, A.; Sakki, G.-K.; Efstratiadis, A. Multidimensional Role of Agrovoltaics in Era of EU Green Deal: Current Status and Analysis of Water–Energy–Food–Land Dependencies. Land 2023, 12, 1069. https://doi.org/10.3390/land12051069
Roxani A, Zisos A, Sakki G-K, Efstratiadis A. Multidimensional Role of Agrovoltaics in Era of EU Green Deal: Current Status and Analysis of Water–Energy–Food–Land Dependencies. Land. 2023; 12(5):1069. https://doi.org/10.3390/land12051069
Chicago/Turabian StyleRoxani, Aikaterini, Athanasios Zisos, Georgia-Konstantina Sakki, and Andreas Efstratiadis. 2023. "Multidimensional Role of Agrovoltaics in Era of EU Green Deal: Current Status and Analysis of Water–Energy–Food–Land Dependencies" Land 12, no. 5: 1069. https://doi.org/10.3390/land12051069