Article

Coupling Coordination and Spatial-Temporal Evolution of Water-Land-Food Nexus: A Case Study of Hebei Province at a County-Level

1
Institute of Geographic Sciences and Natural Resources Research, Chinese Academy of Sciences, Beijing 100101, China
2
University of Chinese Academy of Sciences, Beijing 101408, China
3
China Academy of Urban Planning & Design, Beijing 100044, China
*
Author to whom correspondence should be addressed.
Land 2023, 12(3), 595; https://doi.org/10.3390/land12030595
Submission received: 1 February 2023 / Revised: 26 February 2023 / Accepted: 27 February 2023 / Published: 2 March 2023
(This article belongs to the Special Issue Water-Energy-Food Nexus for Sustainable Land Management)

Abstract

:
Exploring the interaction between water, land, and food (WLF) is a premise guaranteeing to ease resource restrictions and achieve sustainable development in major agricultural production areas. We chose 26 indicators to build a WLF nexus evaluation index system. We used the coupling coordination model to measure the coupling coordination degree of the WLF nexus in 15 prefecture-level cities and 151 counties under the jurisdiction of Hebei Province in 2000, 2005, 2010, 2015, and 2020. Then, the spatial correlation was analyzed using the global and local Moran’s I. Finally, the regional differences and spatiotemporal patterns were analyzed using a spatial gravity center model and kernel density estimation. The results are as follows: (1) In 11 cities, the comprehensive evaluation index of the WLF and of each subsystem shows a fluctuating upward trend. More than 95% of the counties’ comprehensive evaluation indices improved, and the difference between counties in the north and south narrowed after 2010. (2) The spatial pattern of the WLF in counties has evolved from a pattern of “high in the south and low in the north” to “high in the north and low in the south”, with the development speed of the north being higher than that of the south. (3) The coupling coordination degree of the WLF has a positive spatial autocorrelation relationship in different counties; however, the spatial connection eventually deteriorates, and the geographic pattern exhibits “agglomeration decrease” characteristics. In Hebei Province, the WLF coupling coordination rate slowly improves, and there is a significant development gap between counties. Therefore, local conditions should be taken into consideration when implementing measures to reduce the conflict between water, land, and food in actual regional conditions.

1. Introduction

Water and land resources are both material and natural conditions for human survival [1]; they are not only required for agricultural production and food security [2], but are also directly related to Sustainable Development Goals [3]. The issues of unsustainable population explosions, global climate change, resource scarcity, and increased urbanization [4] are already threatening regional stability. By 2050, it is predicted that the worldwide demand for food and water will have increased by more than 50% from its level in 2015 [5]. Urbanization threatens the security of water and arable land resources in the food production sector [6], and due to this threat, 3.7% of arable land will be lost by 2030 [7]. China, which has the largest population in the world, significantly contributes to both the worldwide demand for and production of food [8]. The evolution of food production patterns will cause problems in the spatial allocation of arable land and water resources [9]. However, the average amount of arable land per person in China is less than 50% of the global average [10,11], while the amount of water per person is just one-fourth of the global average [12,13]. Hebei Province is one of China’s major bases of agricultural production, utilizing only 0.46% of the nation’s water resources and 4.87% of its cultivated land to produce 5.6% [14] of the nation’s food and feed 5.4% of its population. As a result, promoting the upgrade of the water–land–food (WLF) nexus system in Hebei Province and coordinating the balance of regional natural resources and social economy have become important propositions for the main agricultural producing areas in order to achieve high-quality and sustainable development.
The WLF nexus is an intricate, three-dimensional system. In 2011, the conference on “Water, Energy and food Security Nexus” in Bonn, Germany, proposed that researchers look at the relationship between resources from a perspective of coupling rather than isolation [15]. This is also the theoretical underpinning and milestone event of research on the coupling and coordination of the WLF nexus system. Numerous studies have been conducted to investigate how water, land, and food interact [16], including the pairwise relationships between water and food, land and food, and water and land, based on the dynamic nexus approach’s core–periphery interaction theory [17,18]. The water resources subsystem provides water for the production, life, and ecology of the land resources subsystem, and the distribution of these resources affects the density of the population distribution, thereby changing the spatial characteristics of land use and leading to an imbalance between supply and demand [19]. Changes in land types have an effect on the quantity, quality, and spatial distribution of water, since land is a crucial component of food production [20,21]. Irrigation for food production accounts for about 70% of global freshwater withdrawals [22], and the processes of grain planting, processing, and transportation affect the supply of water and land distribution [23]. Due to commercial interests, the phenomenon of replacing grain crops with high-income crops has grown more pronounced, and the percentage of farmed land in China that is “non-grain” has reached 27% [24]. In addition, some of the ecological disasters caused by climate change may have exacerbated the unequal distribution of water and land resources [25], threatened food security, and even triggered vicious competition for resources, as well as social and political unrest [26].
Despite the fact that there is an increasing number of publications on the coupling and coordination of the WLF nexus, the majority of them are focused on the optimization of the allocation of water, land, and food resources [27,28] at the national and provincial levels [1,29]. There is less research at the county level, which is the fundamental unit of national administrative regulation and control with regional characteristics and complete political and economic functions. According to the case study from China’s Three Rivers Headwaters Region (Yangtze, Yellow, and Lantsang), the supply and production of any one resource in the WLF system depends on the other two [30]. In order to resolve the conflict between economic advantages, crop output, and water resources, Mo Li [31] designed a multi-objective programming model of interval irrigation water allocation and applied it to the Hulan River irrigation area in northeast China. Nie’s research at an experimental station in Yucheng County, Shandong Province, proposed a multi-objective, mixed-integer, nonlinear model to promote land use decision making under the food–energy–water nexus [32]. Additionally, numerous researchers have used super network models to highlight the WLF nexus across the economy using Input Output Analysis [33], Ecological Network Analysis [34], and Dempster–Shafer [35] evidence theories. The findings indicate that 93% of industries waste resources and engage in unfair competition [16]. Literature in the Beijing–Tianjin–Hebei(BTH) region has demonstrated that significant changes in land use have already impacted a coordinated balance of food, energy, and water resources [36]. Hebei Province has more than 150 counties. Its location and natural conditions affect the cultivated land pattern, and its economy and population affect the amount of cultivated land, water use structure, and grain changes [37].
Therefore, based on the county data of Hebei Province from 2000, 2005, 2010, 2015 and 2020, this paper explores the relationship between the WLF system and its temporal and spatial evolution characteristics using the changes in the natural properties of land resources, water resource allocation, and food consumption. The potential contributions of this paper are as follows: Firstly, taking the county as the basic unit, we construct a comprehensive evaluation index system of the WLF nexus and measure its development level in Hebei Province through coupling and coordination. Secondly, we analyze the spatial distribution of and changes in the WLF system in 11 cities and 151 counties of Hebei Province and introduce a spatial association analysis to evaluate the spatial correlation and agglomeration characteristics of all units. Then, we provide policy enlightenment for the main grain-producing areas, which are currently being confronted with water and land resource restrictions and the demands of high-quality development. The rest of the paper is organized as follows: The materials and methods are introduced in Section 2. The results of Hebei Province’s WLF nexus system evaluation are presented in Section 3. The discussion and policy implications are presented in Section 4. Finally, this paper is concluded in Section 5.

2. Materials and Methods
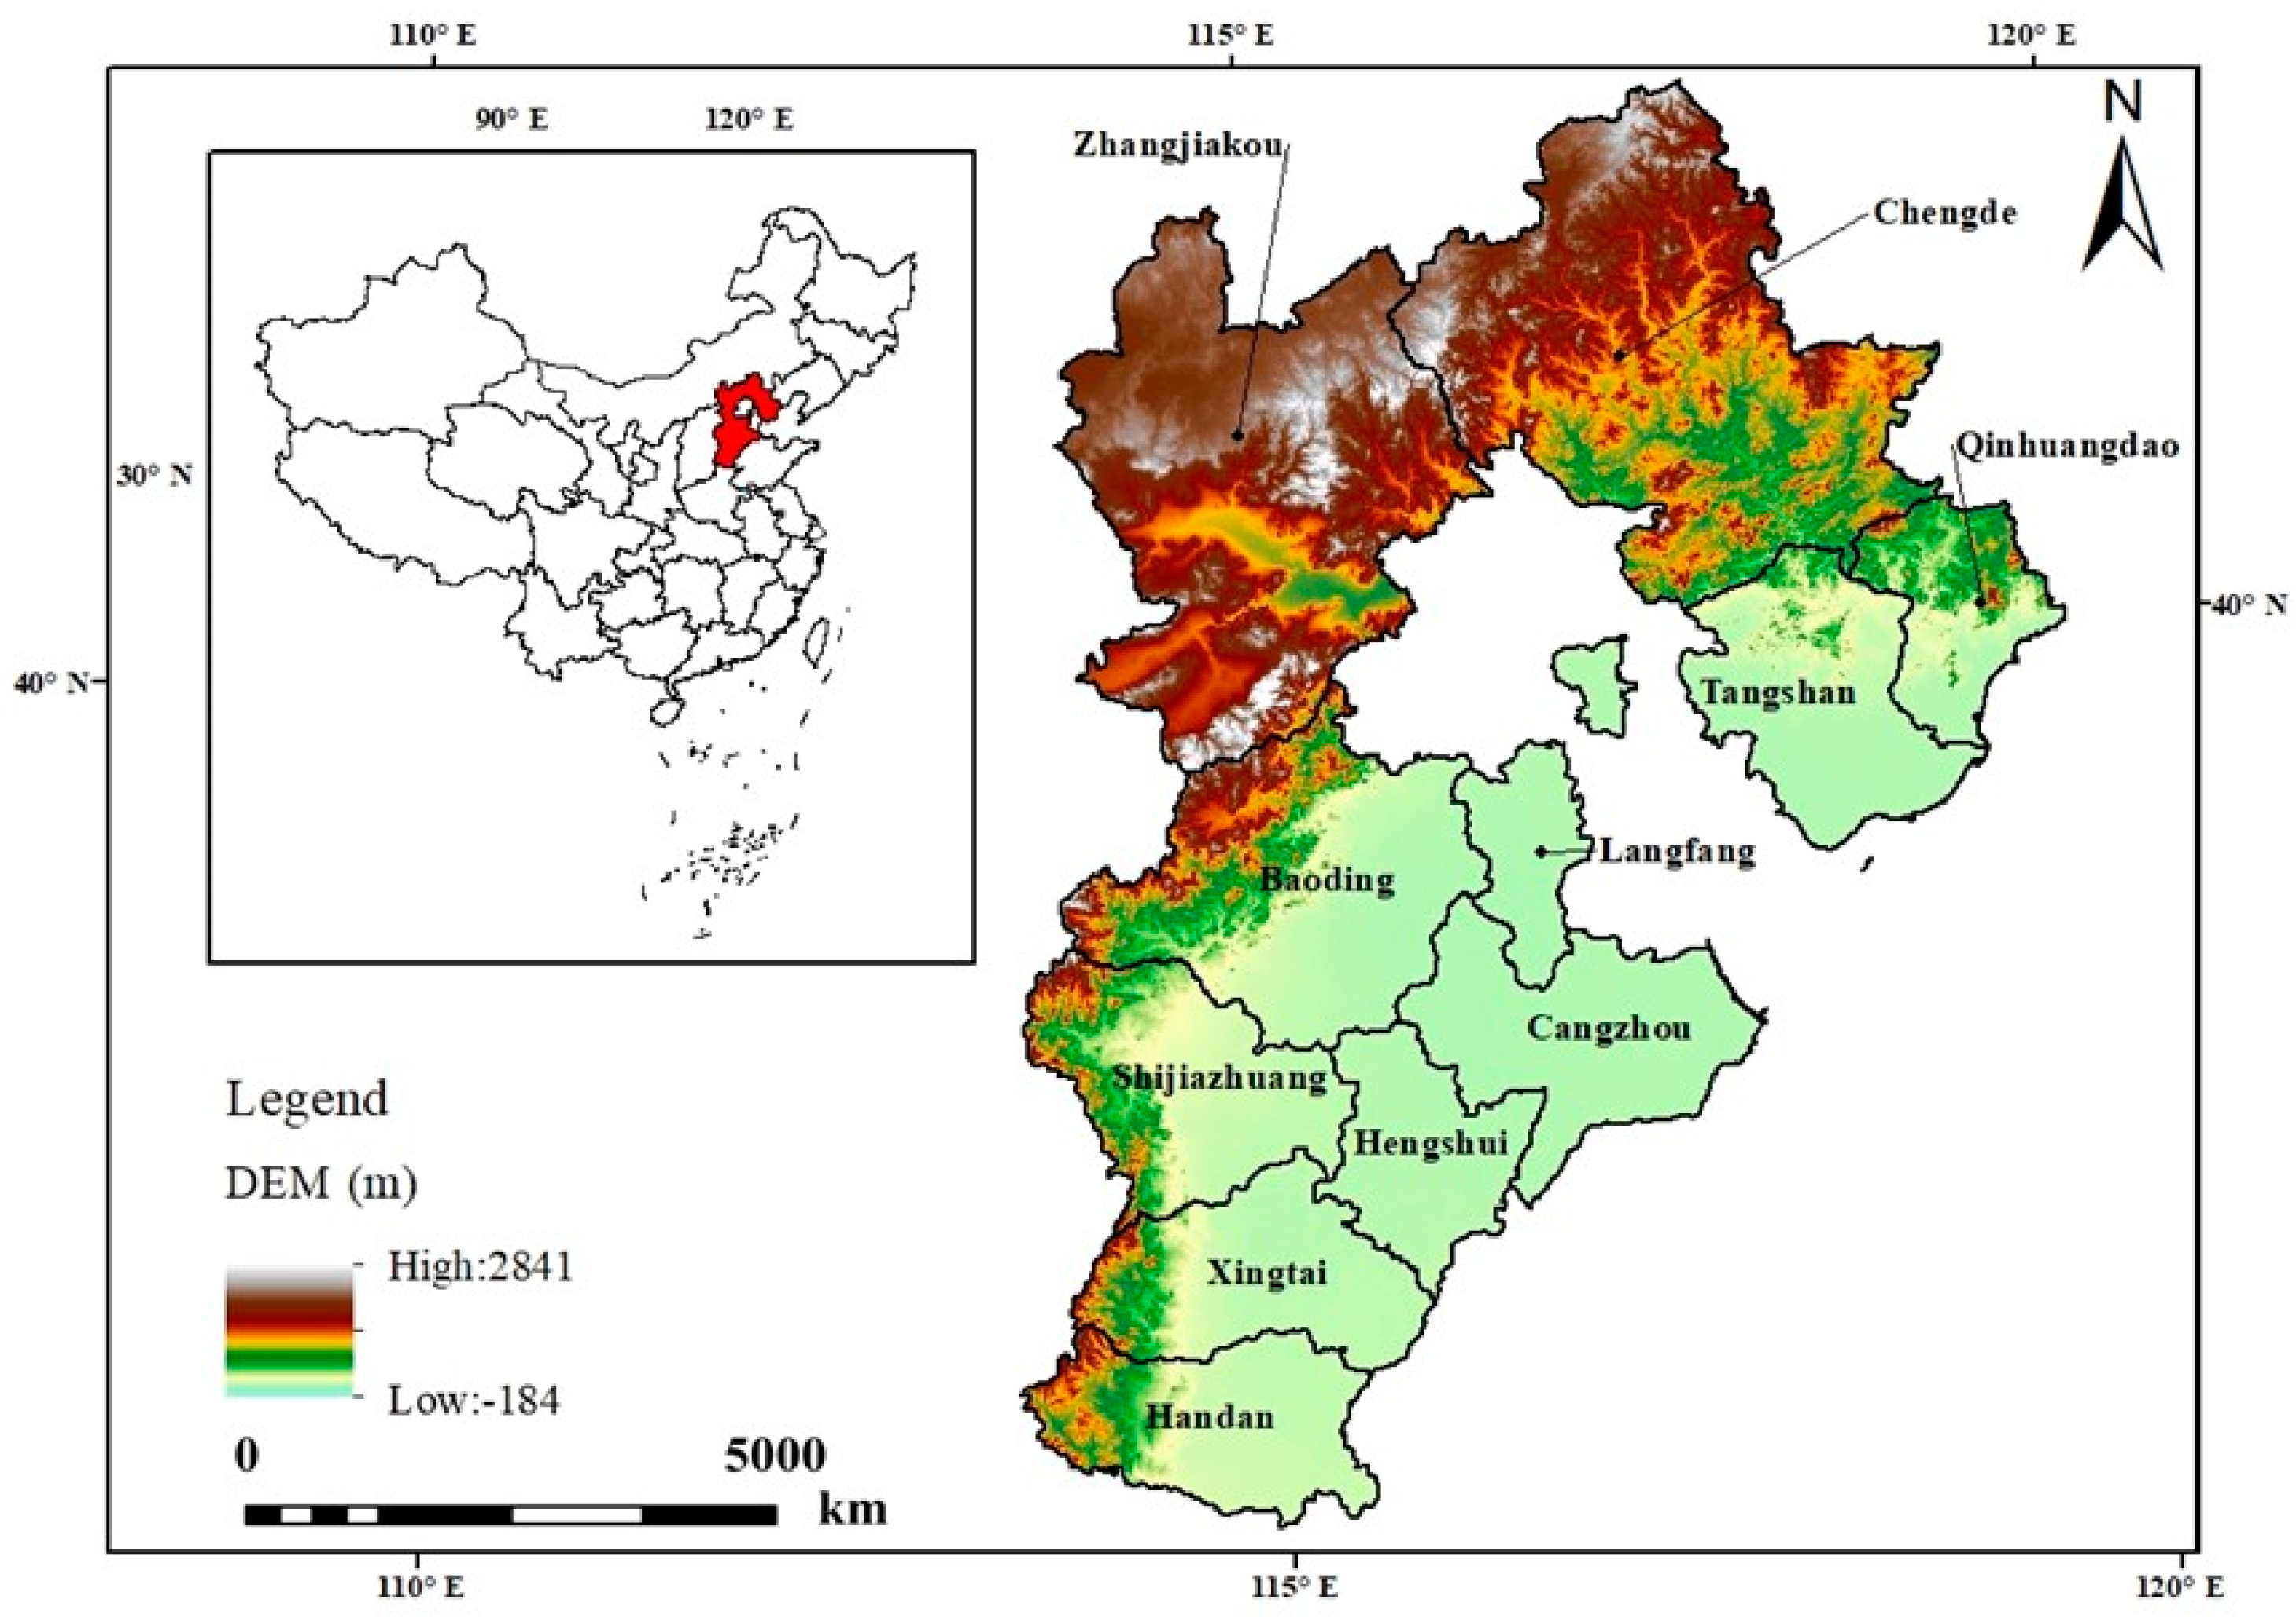
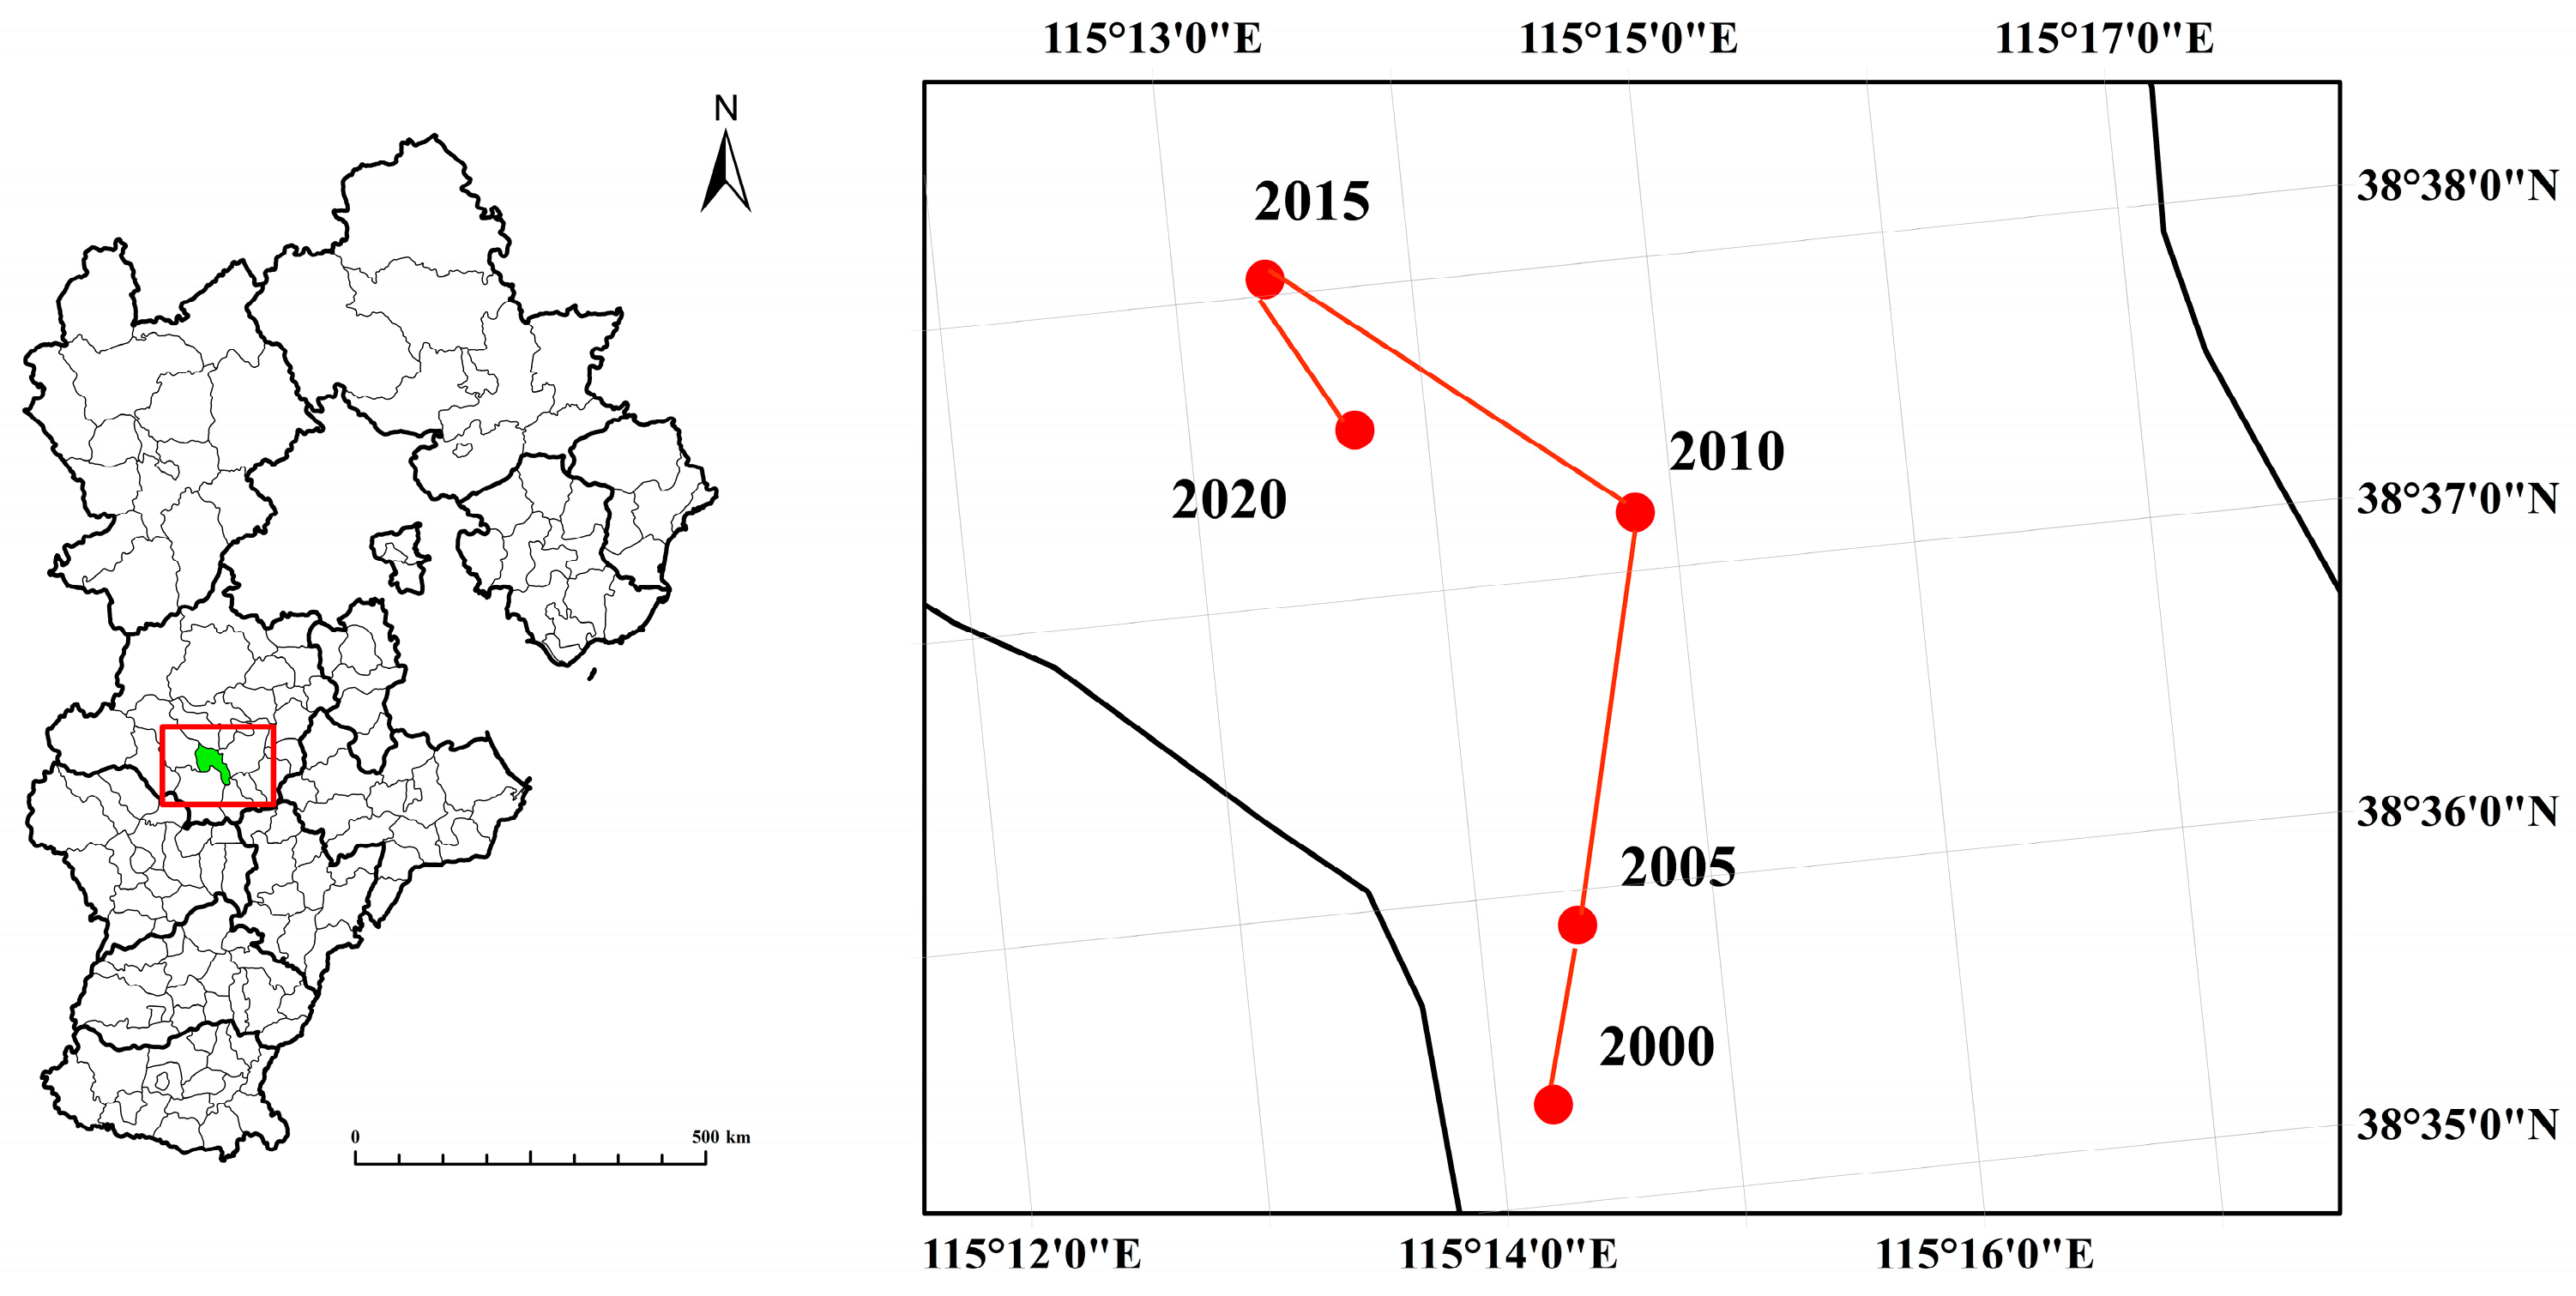
2.1. Study Area

Hebei Province (36°05′–42°40′ N, 113°27′–119°50′ E) is a component of the Beijing–Tianjin–Hebei economic circle and is situated in the North China Plain, covering an area of 188,800 km2 (Figure 1). The geography is made up of wide plains in the center and southeast and mountains, hills, and plateaus in the north and west. Temperatures and precipitation fall from the southeast to the northwest. More than one-third of the provincial land is cultivated with grain crops [14]. The province’s agricultural output value ranks among the top ten in China, and it is one of the country’s main grain bases as well as the area with the most prominent imbalance of water and land resources [38]. Since groundwater extraction is the primary method used for agricultural irrigation [39], groundwater reserves have emerged as a crucial pillar of regional food security. The proportion of water consumption in agriculture decreased from 76.23% in 2000 to 58.92% in 2020 [40], and the amount of land that could be used for agriculture shrank from 68,570.67 km2 to 60,113.33 km2 [41].

2.2. Data Resources

Considering the spatial connectivity, the adjustment of administrative divisions, and the accessibility of county data, this article uses 151 counties in Hebei Province as the sample. The land use data were obtained from the dataset of the Resource and Environment Science and Data Center of the Chinese Academy of Sciences [42] with a spatial resolution of 30 m. Water resources data were obtained from the Hebei Water Resources Bulletin (2000–2020), 11 municipal water resources bulletins (Shijiazhuang, Handan, Xingtai, Baoding, Hengshui, Cangzhou, Langfang, Tangshan, Qinhuangdao, Zhangjiakou, and Chengde), water resources evaluation reports, comprehensive water resource allocation plans, and local government statistics. The meteorological data were taken from the China meteorological assimilation driving datasets [43], and the raster data were generated through ArcGIS 10.2 spatial interpolation. The basic geographic data came from the National Geographic Information Catalog Service [44] and the Geospatial Data Cloud [45]. Socio-economic data were obtained from the Hebei Rural Statistical Yearbook (2001–2021), the Hebei Economic Statistical Yearbook (2001–2021), and the national economic and social development statistical bulletins of 11 municipalities. In order to eliminate the influence of price changes in different periods, GDP and other economic indicators are deflated using 2000 as the base period.

2.3. Methods

2.3.1. Construction of the WLF Evaluation Index System

Based on the coupled and coordinated development of WLF, a comprehensive evaluation index system is constructed from the three dimensions of the water resources subsystem, the land resources subsystem, and the food subsystem following the principles of representativeness, systematism, objectivity, and operability. A total of 10 specific evaluation indicators are selected for the water resources subsystem from four aspects: volume, structure, efficiency, and agricultural hydrology; 7 indicators are evaluated for the land resources subsystem from three aspects: agricultural production, utilization structure, and circulation; and 9 indicators are evaluated for the food system from three aspects: agricultural production, efficiency, and ecological environment. Among them, positive indicators promote the development of the subsystem; the higher the value, the better the subsystem’s condition. Negative indicators hinder the development of the subsystem; the higher the value, the more unfavorable the development of the subsystem [46]. The evaluation index system is detailed in Table 1.

2.3.2. WLF Nexus Integrated Evaluation Index

Due to variances in magnitude and order of magnitude, as well as positive and negative differences among the indicators, a total of 26 indicators were chosen for the combined WLF nexus system coordination assessment index system in Hebei Province. The data were standardized using the extreme difference standardization approach to guarantee data comparability and the objectivity of evaluation outcomes:
Positive   indicators :   X i j = x i j m i n ( x i j ) m a x ( x i j ) m i n ( x i j )
Negative   indicators :   X i j = m a x ( x i j ) x i j m a x ( x i j ) m i n ( x i j )
where  x i j  denotes the jth indicator’s specific data in year i and  m i n ( x i j )  and  m a x ( x i j )  denote the jth indicator’s minimum and maximum values, respectively.  X i j  is the standardized value.
To avoid the limitations of subjective assignment, the entropy value method is used to analyze the correlation and information among indicators so as to determine the weight of each criterion [47]. The formula is as follows:
E j = 1 l n n i = 1 n [ X i j i = 1 n X i j l n X i j i = 1 n X i j ]
K j = 1 E j
W j = K j j = 1 m K j
where  E j  denotes the information entropy of each index  X i j K j  is the variability coefficient, and  W j  is the weight of each index.
The WLF nexus system is in the process of dynamic changes with the development of the economy and society, and the contribution of each subsystem to the overall development of the system is analyzed using the comprehensive evaluation method to assess the development level of the system in different time periods. The comprehensive evaluation indices of the water resources subsystem, land resources subsystem, and food subsystem are determined separately on the basis of the entropy value method, as follows:
W ( x ) = j = 1 m w j X i j
L ( y ) = j = 1 n l j Y i j
F ( z ) = j = 1 p f j Z i j
where  W ( x ) L ( y ) , and  F ( z )  denote the comprehensive evaluation indices of the water, land, and food subsystems, respectively;  w j l j , and  f j  are the weights of the jth indicator of the water, land, and food subsystems, respectively;, and  X i j Y i j , and  Z i j  are the standardized values of the jth indicator of water, land, and food subsystems in year i, respectively.
The integrated WLF nexus system evaluation index is as follows:
T = α W ( x ) + β L ( y ) + γ F ( z )
where  T  is a comprehensive evaluation index of the system reflecting the overall coordination effect of subsystems. α, β and γ denote the weights of the water, land, and food subsystems, respectively. Water and soil resources are interdependent, mutually restricted, and are necessary for food production, while the results of food production reflect the coordination of these two resources.

2.3.3. WLF Nexus Coupling Coordination Model

The coupling degree reflects the degree of interaction between subsystems, and a higher coupling degree indicates a stronger interaction between subsystems, and vice versa [48].
However, the coupling degree cannot reflect the level of coordinated development of the system as a whole, especially in multi-regional comparison studies, where the synergistic effect of the region as a whole is difficult to reflect. In contrast, the coupling coordination degree can characterize whether the system is coordinated in the interaction process and also discern the coordination level in the development process, indicating the trend of the system’s change from disorder to order [29]:
C = 3 W ( x ) L ( y ) F ( z ) 3 W ( x ) + L ( y ) + F ( z )
D = C T
where  C  is the coupling degree of the WLF nexus system, and the value range is [0, 1].  D  is the coupling coordination degree of the system, and the value range is [0, 1]. The higher the value of  D , the more coordination there is between subsystems, and when  D = 1 , the system reaches the optimal coupling coordination state [49]. According to the existing research results [29,50], the coupling coordination degree is divided into 10 levels, as in Table 2.

2.3.4. Spatial Gravity Center Model

By introducing the spatial gravity center model into this study, the integral changes in WLF nexus system in Hebei Province were examined. This model can intuitively and accurately reflect the imbalance of different factors in space through the analysis of the direction and the distance of the gravity center’s departure from the geometric center. If the research area is composed of n units and  ( x i , y i ) t  is the geometric coordinates of the  i -th unit  ( i = 1 ,   2 ,   3 , ,   n )  at time  t , the site of the gravity center  ( X t , Y t )  of the attributes of the study area at time  t  can be stated as:
X t = i = 1 n x i   v i t i = 1 n v i t
Y t = i = 1 n y i   v i t i = 1 n v i t
where  v i t  refers to the property valued for the  i -th unit at time t.
The gravity center’s direction of movement can be accounted for by calculating:
θ = [ k × 2 2 + arctan ( Y t 2 Y t 1 X t 2 X t 1 ) ]   180 ° π
where  θ  represents the angle of deviation of the gravity center during the research period;  t 1  and  t 2  represent the start and ending of the research period;  ( X t 1 ,   Y t 1 )  and  ( X t 2 ,   Y t 2 )  refer to the center of the gravity coordination site at time  t 1  and time  t 2 , respectively;  k  represents the adjustment factor to guarantee that θ∈(−180°, 180°), and  k = 0 ,   1 ,   2 ; and π refers to Ludolph’s coefficient. The positive direction is counterclockwise, and the positive east direction is 0°.
The distance travelled by the gravity center can be calculated by:
D = C ( X t 2 X t 1 ) 2 + ( Y t 2 Y t 1 ) 2
where  D  represents the distance travelled by the gravity center and  ( X t 1 ,   Y t 1 )  and  ( X t 2 ,   Y t 2 )  respectively represent the coordinates at the time  t 1  and time  t 2 C  is a constant, representing the coefficient of conversion from coordinates of latitude and longitude to plane distance (km), having a numerical value of 111.111.

2.3.5. Kernel Density Estimation

To further determine the overall distribution state, differences, and evolutionary trends of the coupled water–soil–grain coordination in Hebei Province counties [51], Equation (16) is commonly used. This equation measures the geographic differences of spatial elements and derives the kernel density estimation in the non-parametric estimation method from the curve position, morphology, trend, peak, and other information to analyze the evolutionary characteristics of coupled coordination [52]. This method can overcome the subjectivity of the functional form compared to parametric methods. It is calculated as follows:
Y = 1 n h i = 1 n K ( x i x h )
where  h  is the generation bandwidth, which reflects the data occupancy and influences the flatness of the curve, and  x i  and  x  denote the coupling coordination of cell  i  and the mean value of the system’s coupling coordination, respectively.  Y  is also the probability density value.  K ( · )  is the kernel function.

2.3.6. Global and Local Moran’s I

To analyze the spatial correlation and clustering characteristics of all units, the global Moran’s I index was used to reveal the overall distribution pattern of water–soil–grain coupling coordination in counties of Hebei Province and to determine whether there is any spatial correlation. The formula is as follows:
I = n i = 1 n j = 1 n w i j ( x i x ) ( x j x ) i n j n w i j ( x i x ) 2
where  n  is the total number of cells in the study area;  x i  and  x j  denote the coupling coordination degree of cell  i  and cell  j , respectively;  x  is the mean value; and  w i j  is the spatial weight matrix, which indicates the cell’s spatial adjacency. The value of Moran’s I ranges from [−1, 1], and when it is greater than 0, it indicates that the coupling coordination degree of the study area is positively correlated in space; when its value is less than 0, it indicates a negative correlation, showing a spatially discrete trend, and the smaller the value, the greater the spatial difference. When it is equal to 0, it means that the units are independent of each other, randomly distributed in space, and there is no spatial correlation.
To further identify the type of spatial agglomeration, the local Moran’s I index is used to analyze the degree of correlation of neighboring units using the following formula:
I i = x i j = 1 n w i j x j
When  I i > 0 , the integrated spatial difference is small, H-H indicates that the spatial unit coupling coordination is higher than the mean value, which is a high-value agglomeration area, and L-L indicates that it is lower than the mean value, which is a low-value agglomeration area. When  I i < 0 , the spatial difference is large, and L-H or H-L indicates that the coupling coordination degree is high or low compared with the surrounding units.

3. Results

3.1. Analysis of Comprehensive Evaluation Index of WLF Nexus System

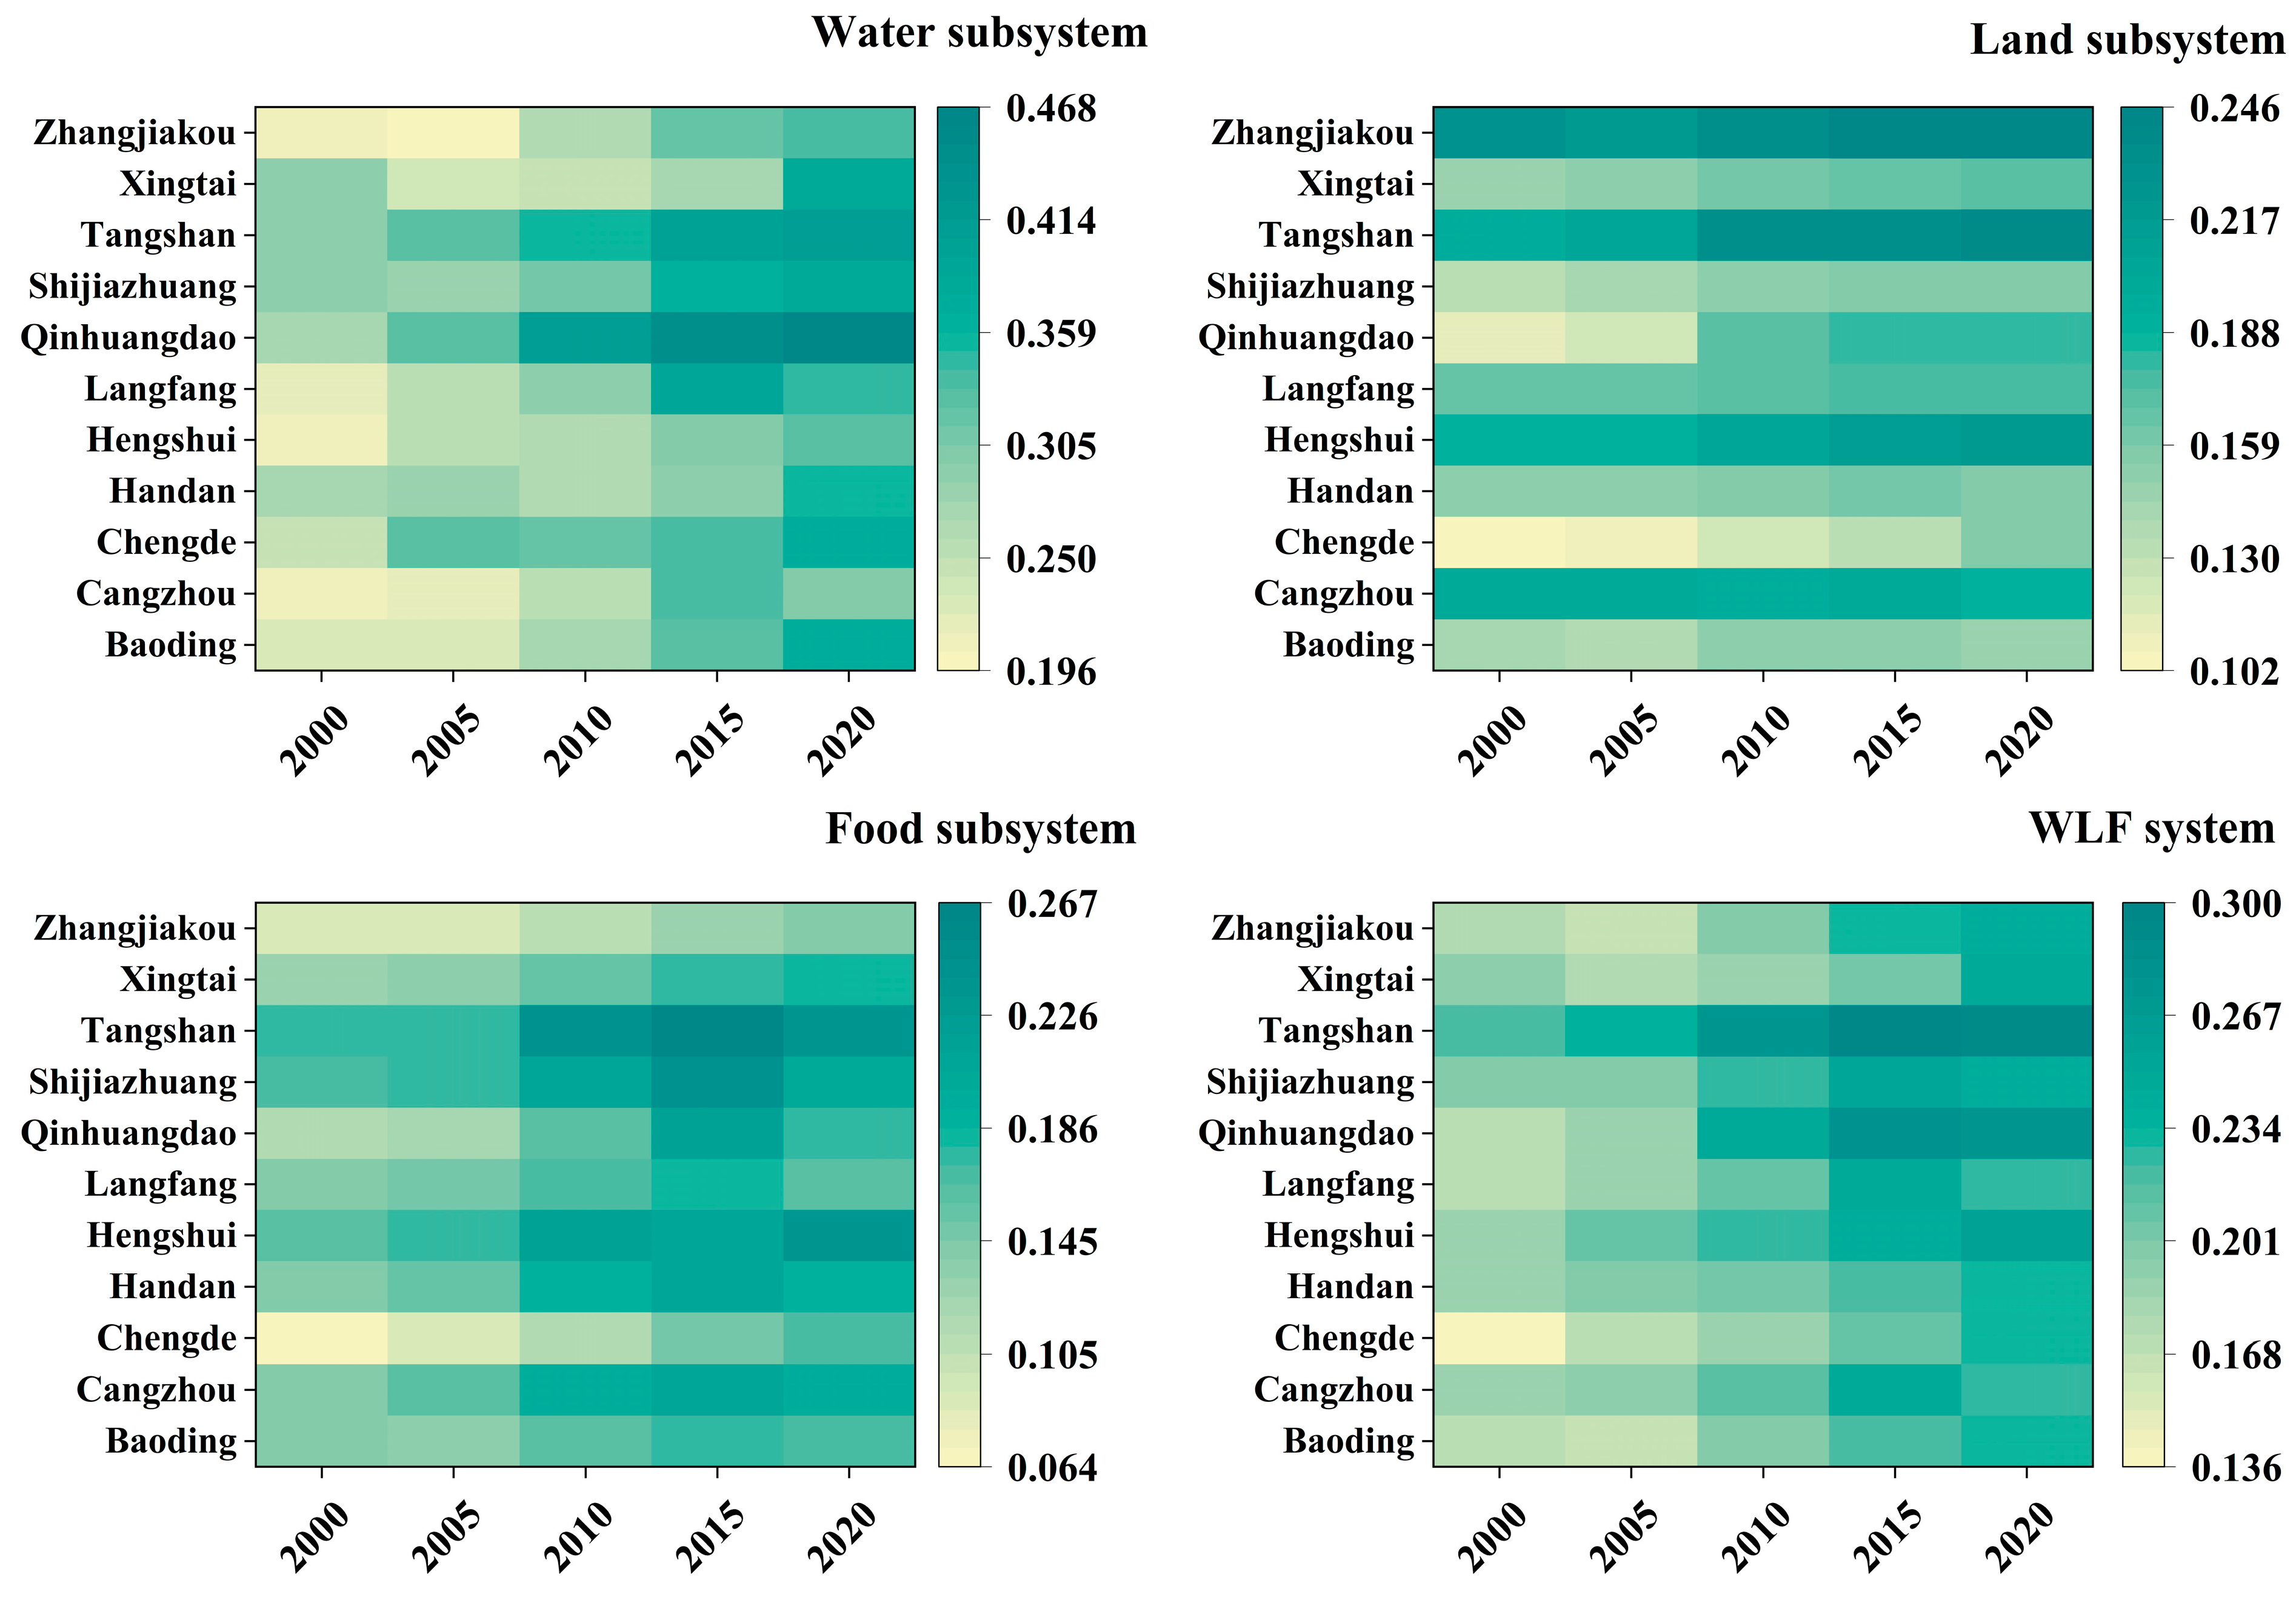
3.1.1. Changes in the Evaluation Index of Each Subsystem of 11 Cities in Hebei Province

Through the entropy value method, the weight results of each subsystem index are shown in Table 3. In the water subsystem, the percentage of ecological water use (W8) was given the highest weight, followed by the water production modulus (W2). This shows that there are obvious differences in water structure and water endowment between counties. In the land subsystem, arable land per capita (L1) and road mileage (L7) were the top two indices. The quantity of arable land and agricultural transportation conditions vary between counties in Hebei Province. The top two contributors to the food subsystem are total agricultural production (F4) and total agricultural machinery power (F3), and their weights are 0.2380 and 0.2345, respectively. All of these indications are positive, which is a significant contributor to the expanding gap between the county’s subsystems and the WLF nexus system’s total assessment index.
Figure 2 displays the overall development trend and rate of each subsystem and the overall evaluation index of the WLF nexus system for 11 cities in Hebei Province.
In the water resources subsystem, the changes in the evaluation indices of 11 cities in Hebei Province vary widely, and the trends can be divided into three categories. The first category includes Qinhuangdao, Baoding, Zhangjiakou, Tangshan, and Chengde, where the water resources subsystem evaluation index increased by more than 40%. This is primarily due to the accelerated urbanization of these cities, which has led to a rise in the demand for water for living and ecology, resulting in a decrease in the proportion of water used for agriculture and a decrease in the proportion of water used for CNY 10,000 GDP. The growth in agricultural water usage levels and water use efficiency, along with the expansion of investment in water conservation infrastructure, were factors that also led to a considerable increase in the water resources subsystem evaluation index. The second group includes Langfang, Hengshui, and Cangzhou, which are all located in the eastern portion of Hebei Province. These cities had low initial values for the water resources evaluation index and slow growth, and they continue to face more water resource pressure as they develop. The third category includes Xingtai, Shijiazhuang, and Handan, where the initial value of the water resources evaluation index is high and grows in fluctuation, but the growth rate is only about 30%. These four cities have well-developed agricultural water conservation infrastructure, a high percentage of effective irrigation area, and agricultural water resources that are completely exploited as a result of structural reform of the agricultural supply side.
In the land resources subsystem, there is little change in each city during the study period, but there are significant differences between cities, which are generally divided into three categories. Zhangjiakou, Tangshan, Hengshui, and Cangzhou are included in the first category. The evaluation index of the land resources subsystem in these four cities has not changed significantly and has remained above 0.2. The second group includes Xingtai, Shijiazhuang, Langfang, Handan, and Baoding, where the evaluation index for the subsystem of land resources is kept at roughly 0.15. The third category includes the cities of Qinhuangdao and Chengde, where the land resource subsystem evaluation index has increased significantly. Among them, Qinhuangdao increased by 58.1% from 0.115 in 2000 to 0.182 in 2010. Chengde increased from 0.102 to 0.155, with a 52.5% growth rate, and Chengde City’s mechanized farming area increased from 1643.61 km2 to 2720.78 km2 in 2020, with a 65.5% growth rate, indicating a significant increase in the level of agricultural mechanization.
In the food subsystem, there is not much difference among the cities. However, compared to other cities, the evaluation index of the food subsystem in Zhangjiakou and Chengde in northern Hebei is significantly lower. These two cities are located in a typical northern agricultural and pastoral interlacing zone between the North China Plain and the Inner Mongolia Plateau, which is a typical northern agricultural and pastoral interlacing zone. Additionally, the low temperature throughout the year limits grain sowing area, yield, and cultivation type, so these cities need to rely on the improvement of technology and agricultural supporting facilities to alleviate the pressure faced by the food subsystem. In contrast, the south-central part of Hebei Province is flat, has a high level of cultivated land usage, and produces a lot of grain and other agricultural products.
In general, the comprehensive evaluation index of the WLF nexus system in 11 cities in Hebei Province has been fluctuating and shows a good development trend. The highest evaluation index among them is held by Tangshan City, while the lowest is held by Chengde. By 2020, except for Tangshan, Qinhuangdao, and Hengshui, the remaining municipalities will not differ much. With the aim of synergistic urban development, the distance between the cities is gradually closed, and the system as a whole tends to be coordinated as all three subsystems have positive trends of change.

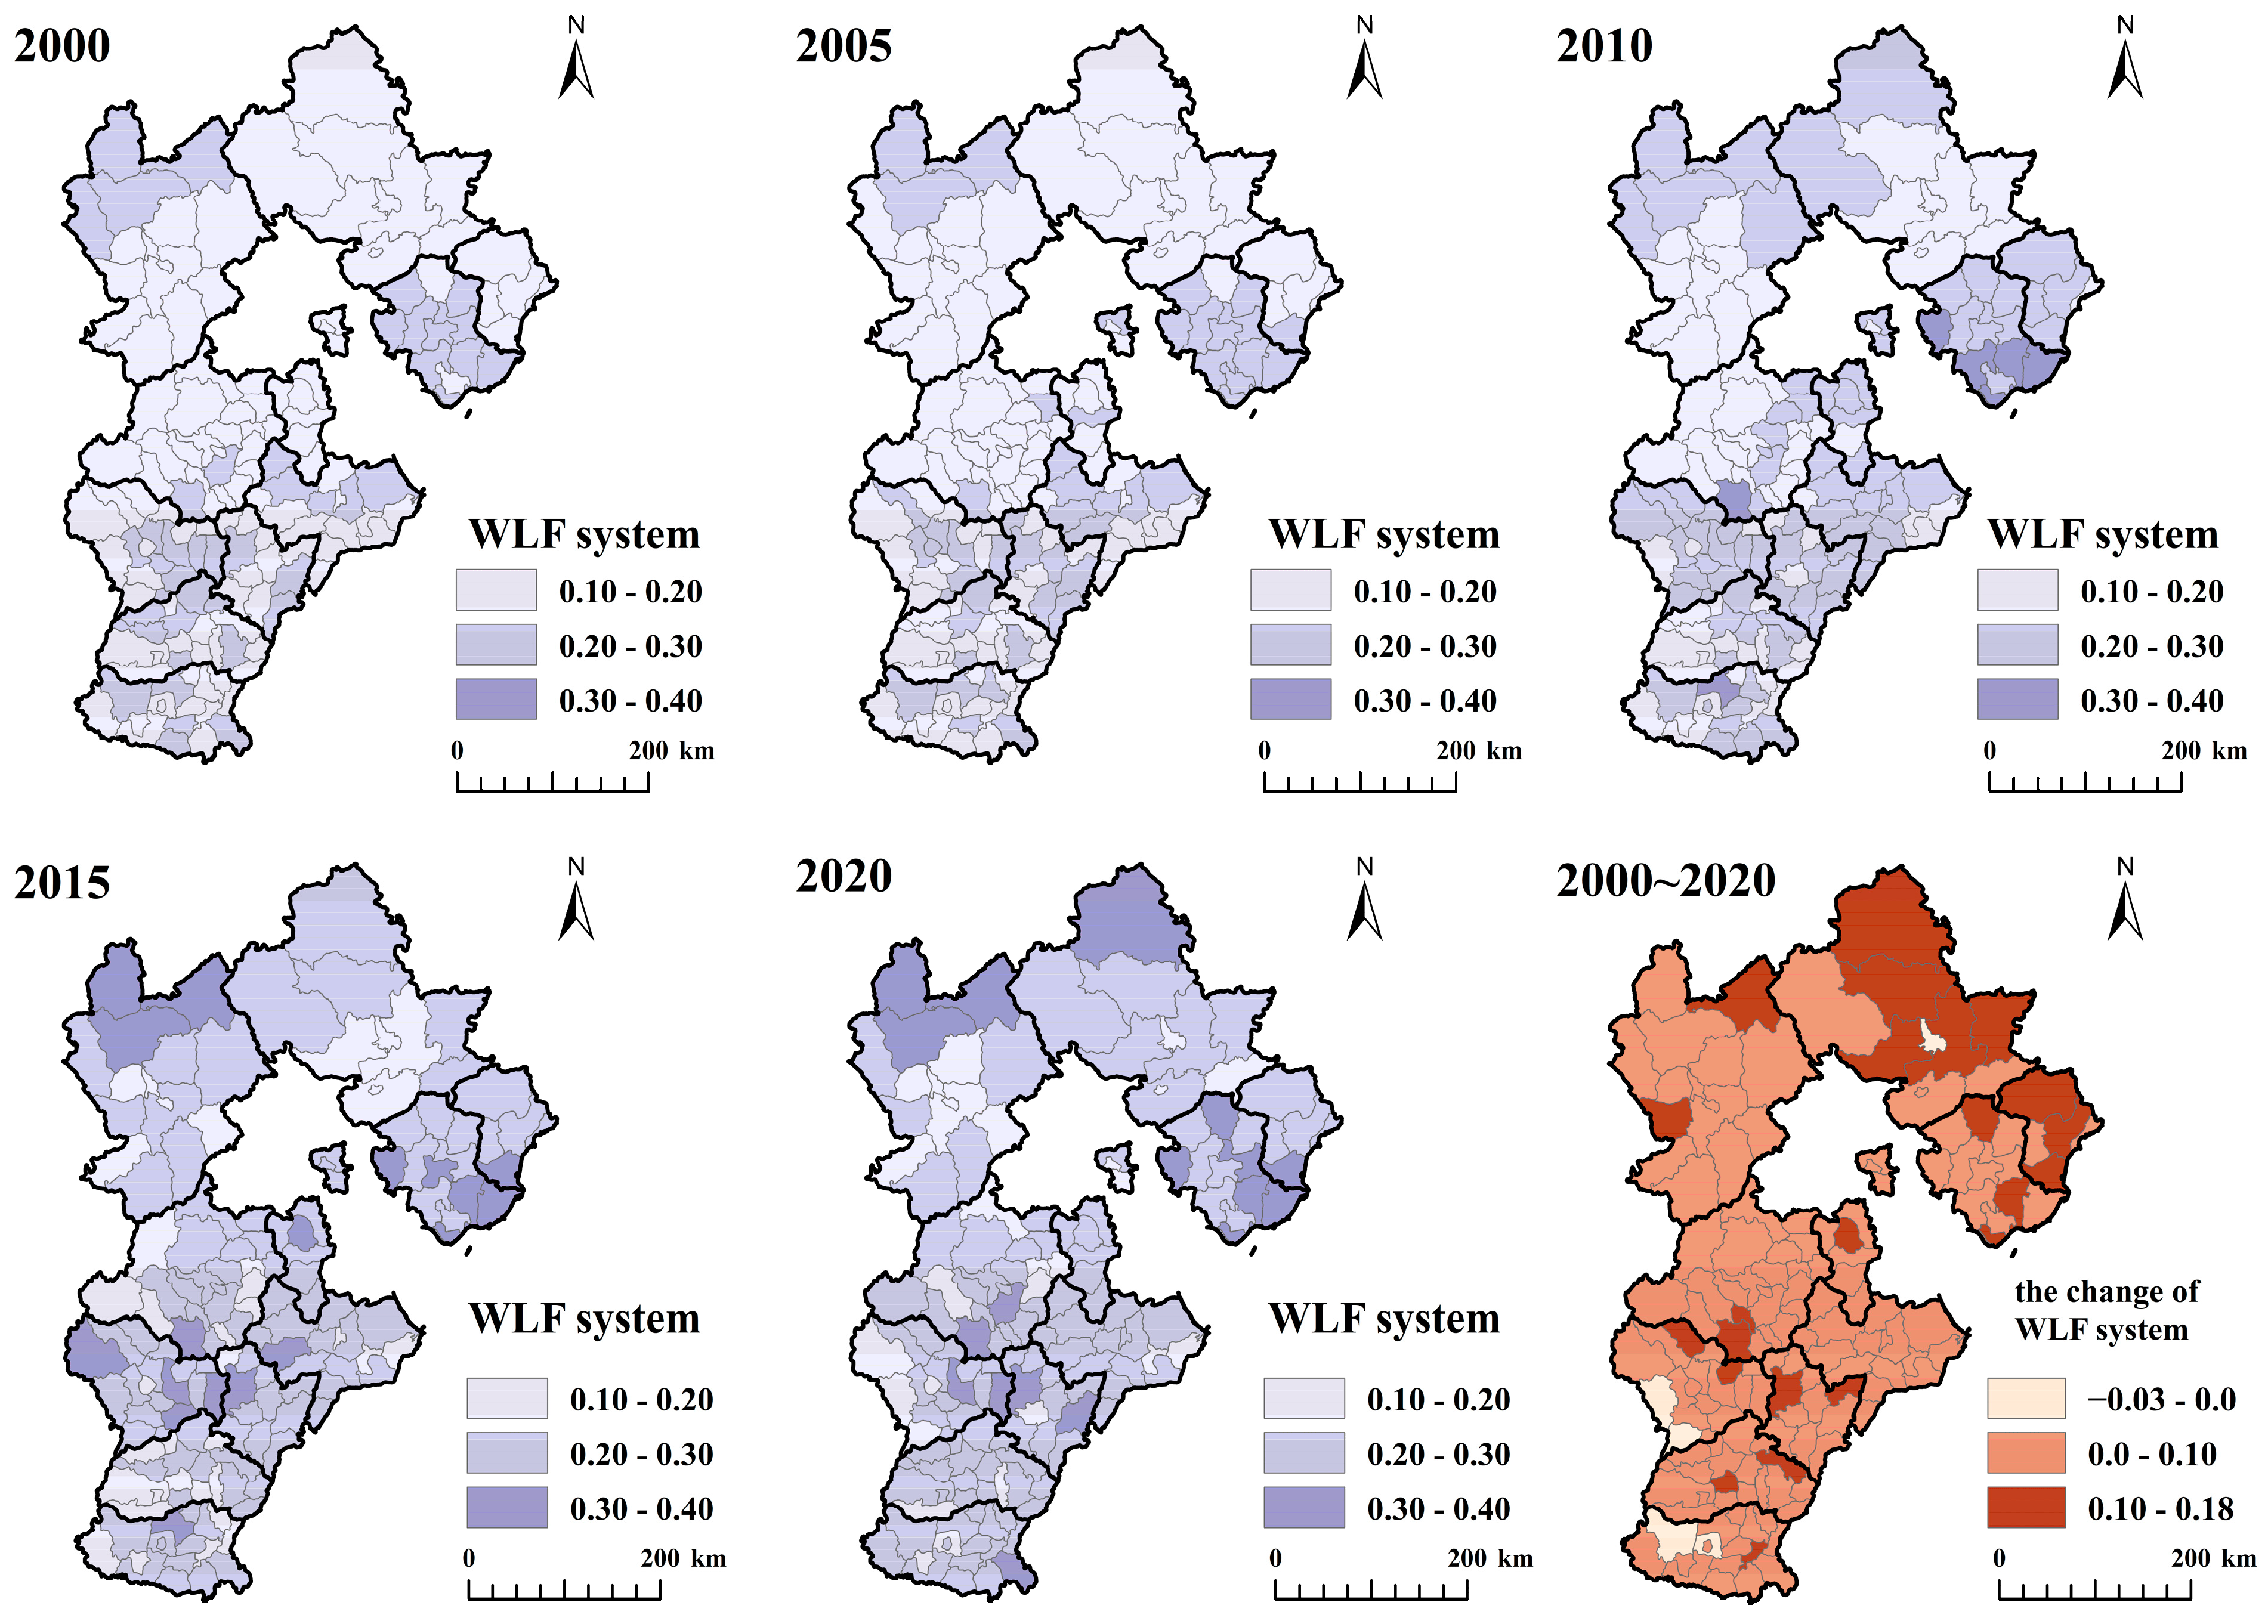
3.1.2. Spatial Distribution Characteristics of Comprehensive Evaluation Index of the WLF Nexus System of 151 Counties in Hebei Province

The changes in the comprehensive evaluation index of the WLF nexus system in 151 counties in Hebei Province were mainly divided into three categories, as shown in Figure 3.
There are only five counties with a reduced evaluation index in the first category, namely, Jingfu County and Zanhuang County in Shijiazhuang, Wu’an and Handan County in Handan, and Chengde County in Chengde. All of these counties have the phenomenon of a decreasing subsystem evaluation index, which indicates that when the development level of any subsystem cannot be compatible with other subsystems, the evaluation level of the system as a whole will also decrease. The precise identification of regional development weaknesses only benefits from the examination the degree of system coupling and coordination. The second category is the counties with a comprehensive evaluation index improvement of less than 0.1, and this category accounts for 82% of Hebei Province. The third category is the counties with an evaluation index improvement greater than 0.1; most of the counties in Chengde and Qinhuangdao are in this category, and the remaining are scattered.
In terms of time, the comprehensive evaluation index of the WLF Nexus system showed a spatial distribution of high in the south and low in the north between 2000 and 2005, with most counties in Baoding, Zhangjiakou, Chengde, and Qinhuangdao having an evaluation index of less than 0.2. Only 27 counties remained in 2020 as the number of counties with a complete evaluation index of less than 0.2 continuously fell after 2010. Overall, there is still significant room for improving the WLF nexus system’s complete evaluation index, and more coordination between the subsystems is required.

3.2. Spatial-Temporal Characteristics of the Coupling Coordination of the WLF Nexus System

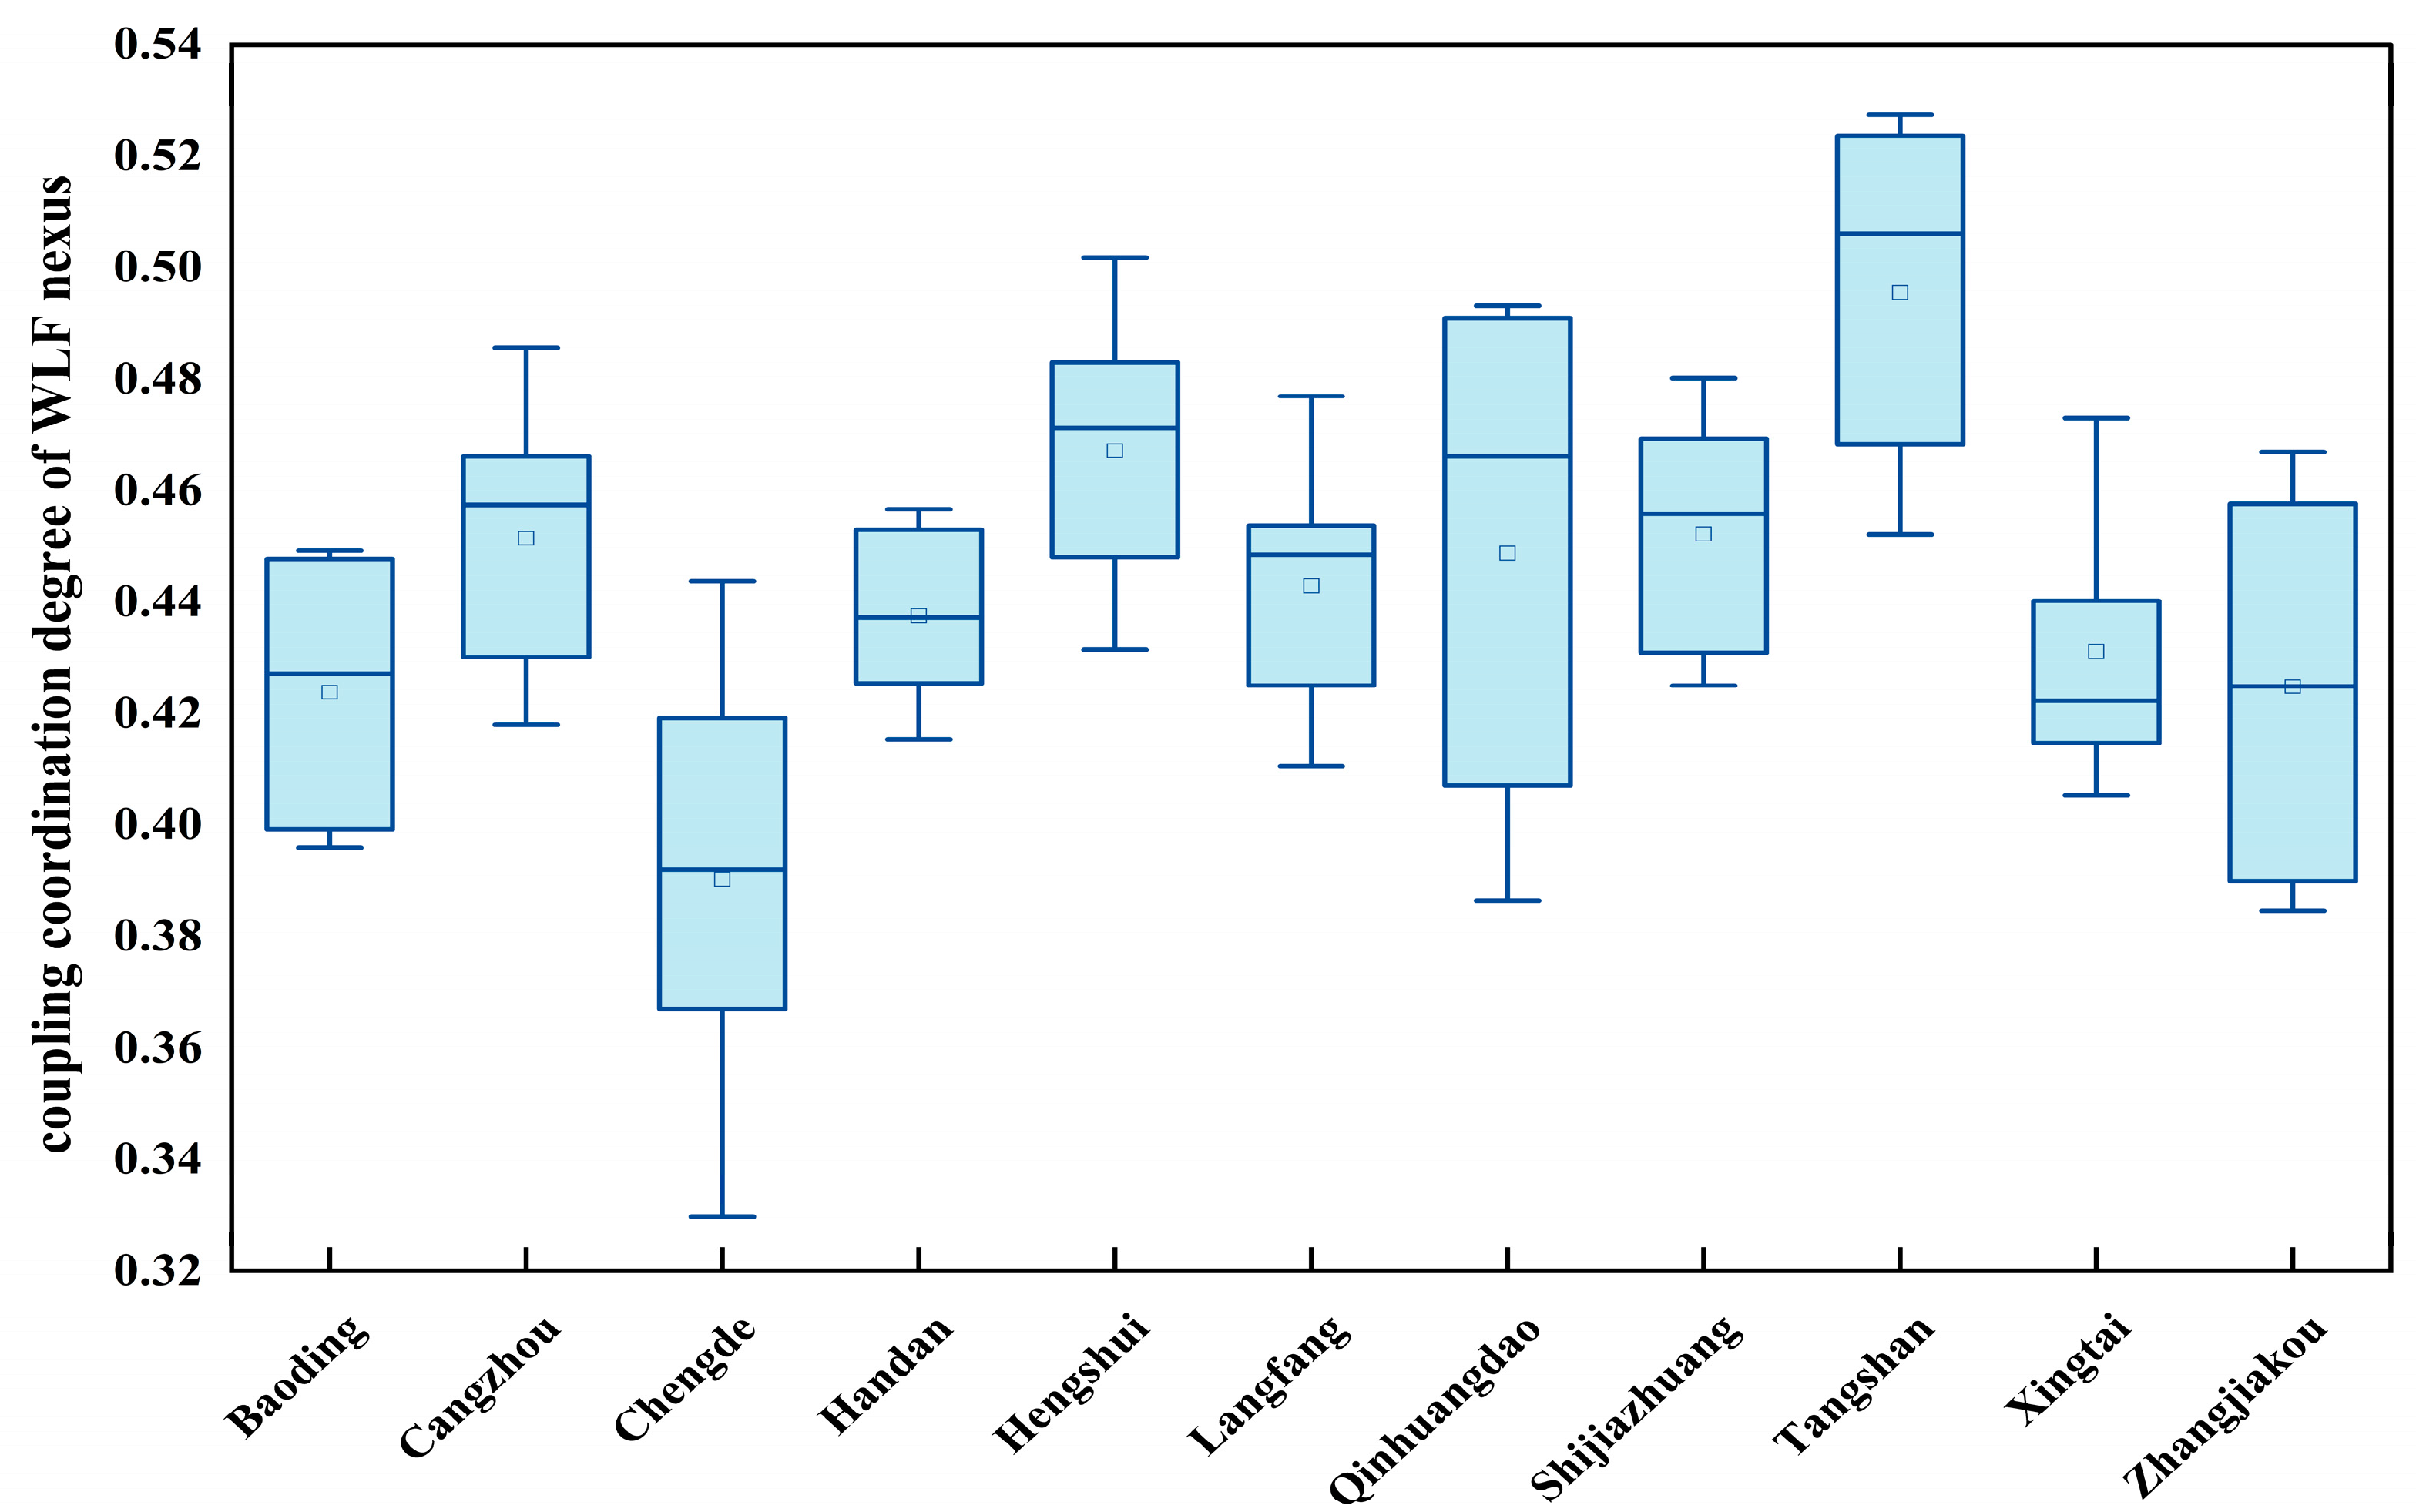
3.2.1. Change Characteristics in Coupling Coordination of 11 Cities in Hebei Province

During the study period, the coupling coordination of the WLF nexus system in Hebei Province was at the near-disorder level, but it increased from 0.40 to 0.47, with a clear trend toward the barely coordinated level. The difference between cities is obvious, as shown in Figure 4. Tangshan is the best-developed city, having developed from near disorder to the barely coordinated level and having a tendency to develop primary coordination, with the coupling coordination degree ranging from 0.45 to 0.53 and the average value being 0.50. Next, Hengshui has also stepped into the barely coordinated level. Baoding, Cangzhou, Handan, Langfang, Shijiazhuang, and Xingtai are all on the verge of the near disorder stage but have the momentum to develop toward the barely coordinated level. Qinhuangdao, Chengde, and Zhangjiakou developed from the mild disorder level to the near disorder level, and the system coupling coordination gradually became better.

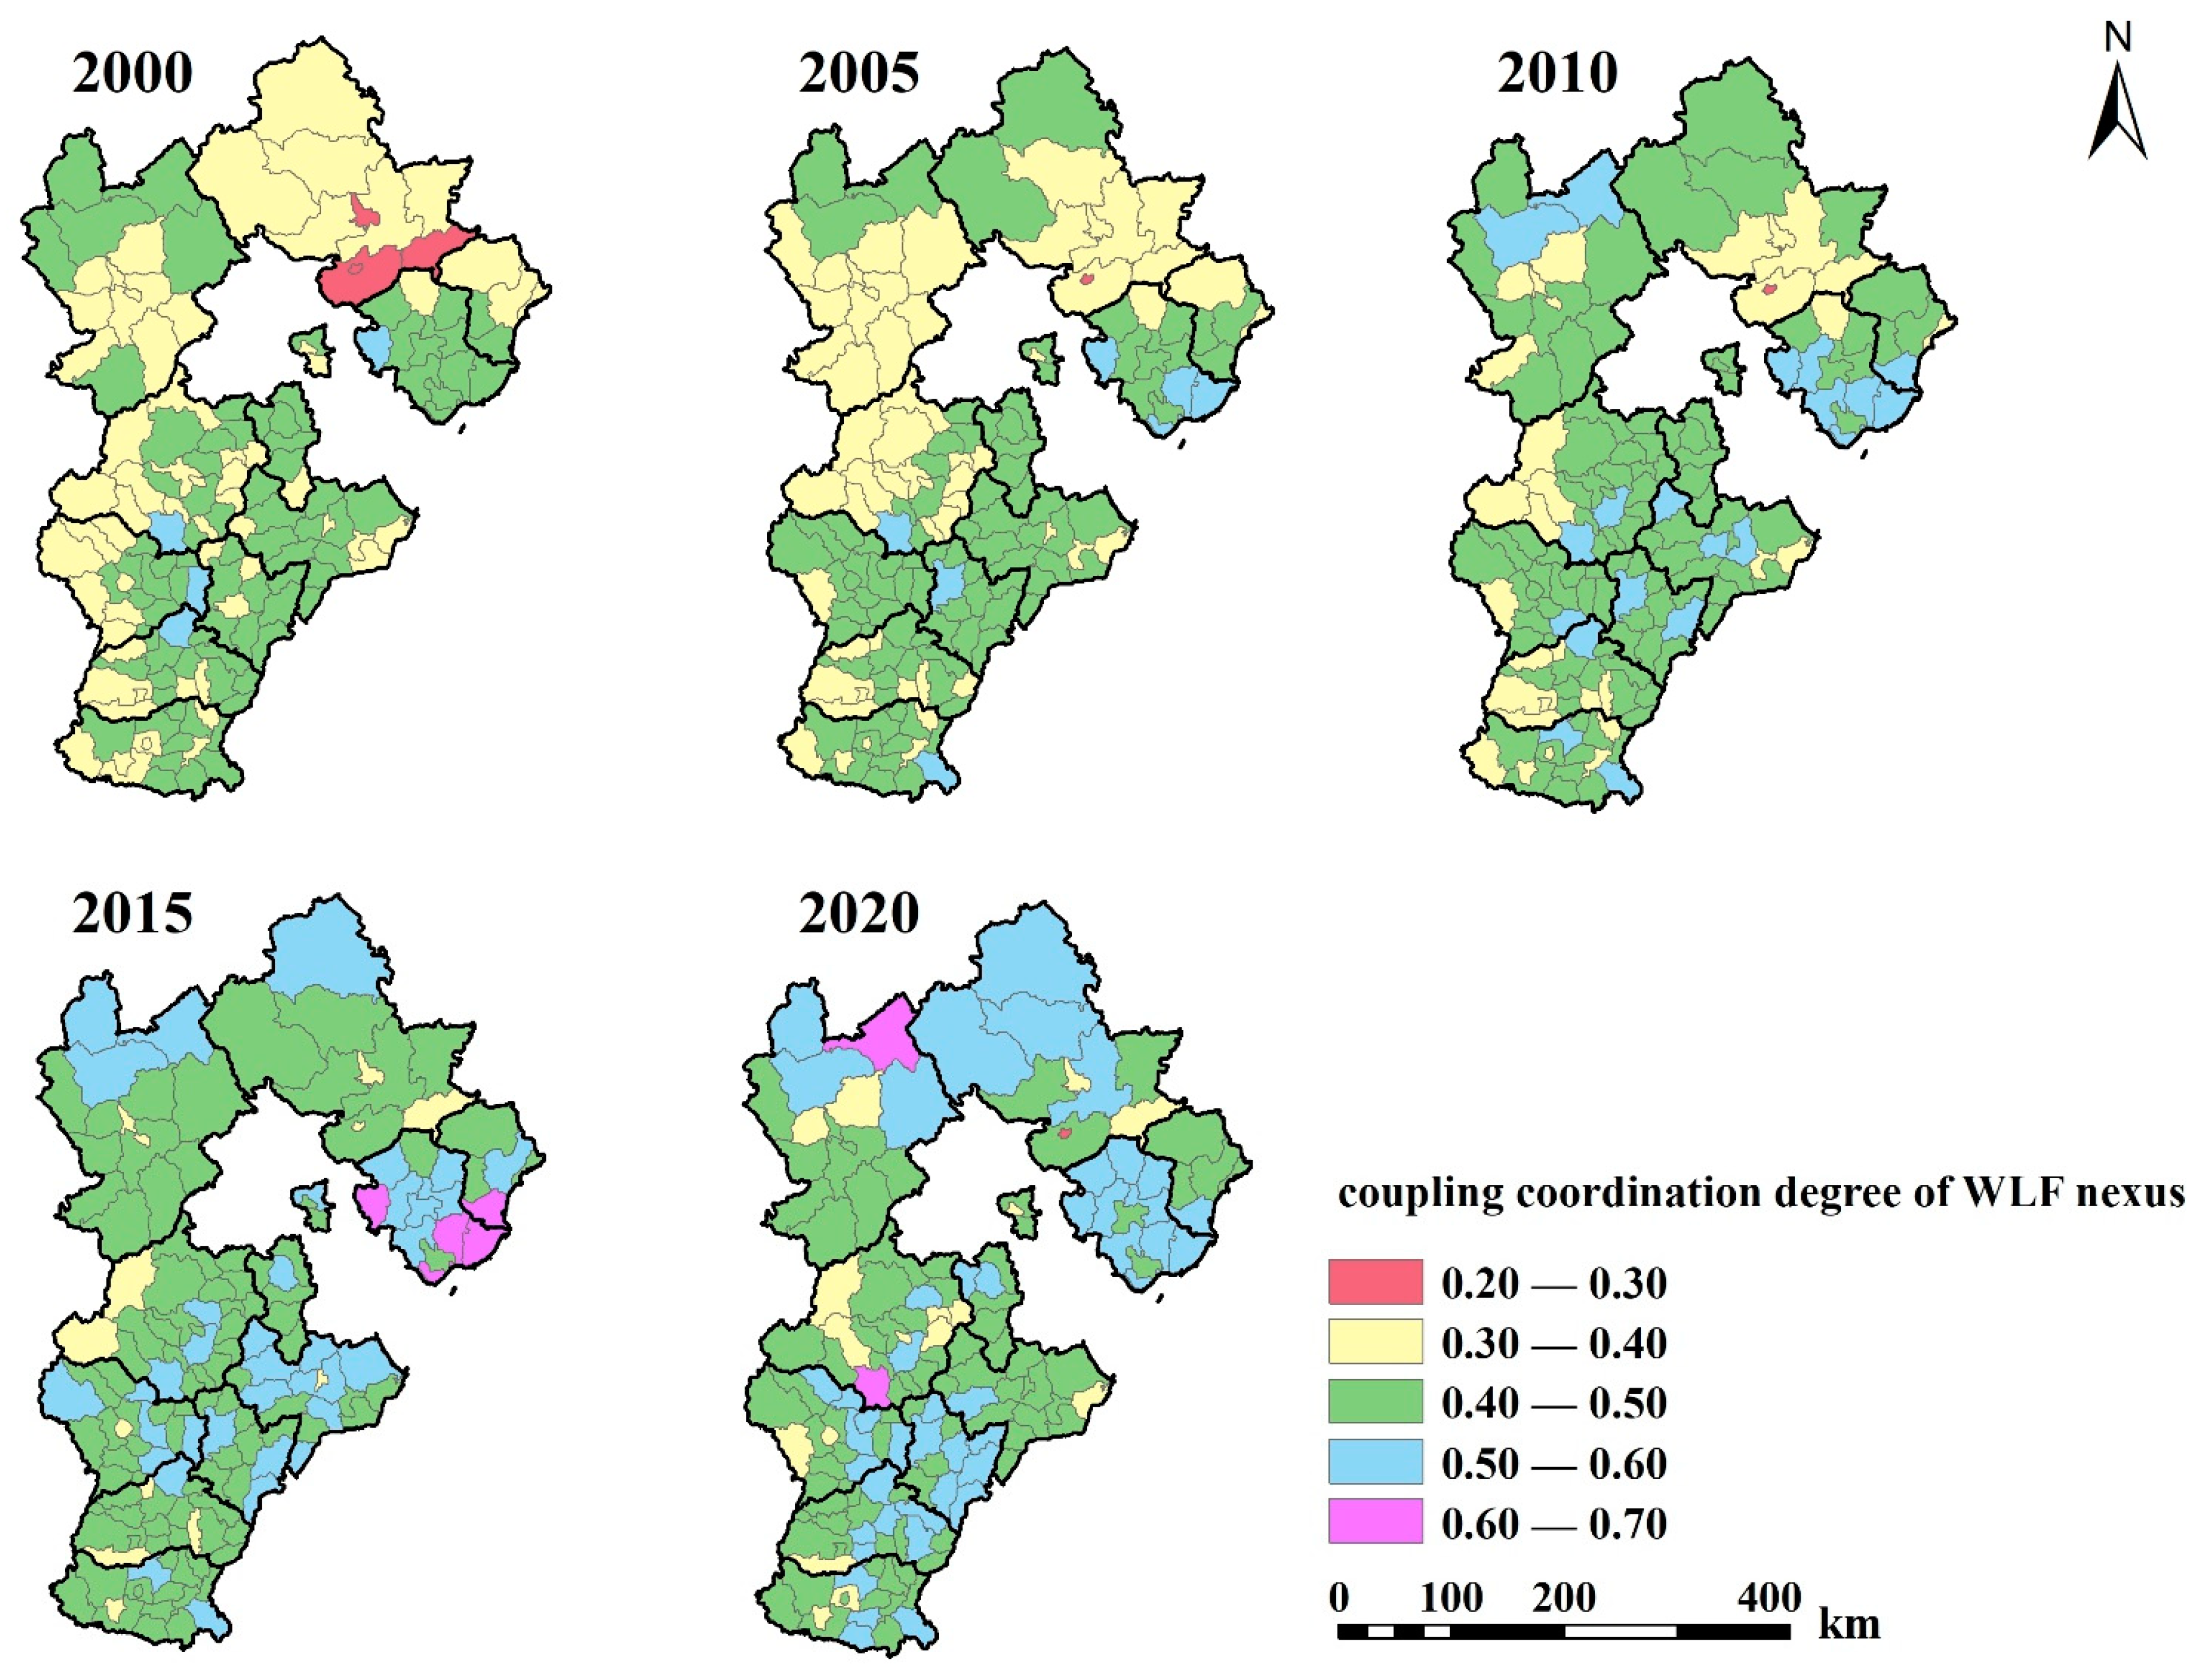
3.2.2. Spatial Distribution Characteristics of 151 Counties in Hebei Province

After 20 years of development in 151 counties in Hebei Province, the WLF nexus system has changed significantly, as shown in Figure 5, from a pattern of “high in the south and low in the north” to “high in the north and low in the south”, with the north developing at a higher rate than the south.
In 2000, the coupling coordination of the system showed a distribution of “high in the south and low in the north, high in the east and low in the west”, with the mining area of Yingjshouyingzi county of Chengde and three counties bordering Tangshan and Qinhuangdao being at the level of moderate disorder. Baoding, Shijiazhuang, and Handan are at the level of high primary coordination, and the remaining counties, making up the other half of the total, were either mildly disordered or on the verge of becoming so. By 2005, the pattern of “high in the north and south, low in the middle” was observed, with only the mining area of Yingshouyingzi county in Chengde City remaining at a moderate level of disorder. The number of counties in Shijiazhuang and Cangzhou, in southern Hebei Province, and the number of counties in Baoding, in the center of Hebei Province, that are on the verge of near disorder and mild disorder both increased. In 2010, only 20% of counties in Hebei Province were left in moderate and mild disorder, and more than 70% were on the level of near-disorder. Several counties in southern Tangshan and Qinhuangdao achieved the level of primary coordination in 2015. By 2020, about 65% of counties are at near-dislocation levels, and 26% are at barely coordinated levels.

3.2.3. Spatial-Temporal Changes in the Gravity Center of the WLF Nexus System in Hebei Province

The variation in the trajectory of the gravity center of the WLF nexus system in Hebei Province is shown in Figure 6. The gravity center shifts from 115°14′14″ E, 38°35′19″ N to 115°13′41″ E, 38°37′32″ N and has always been in Wangdu County in Baoding. The trend of the movement’s trajectory is northwest–southeast. The maximum movement distance from 2015–2020 is 3.123 km, and the minimum distance from 2000–2005 is 1.098 km (Table 4).
There was a gradual shift in agricultural production and resources in Hebei Province from the south-central region, where light and heat conditions are better, to the north-western region. This result is consistent with Zheng’s study in China [53], which indicates that the ecological background quality of agricultural production resources has declined

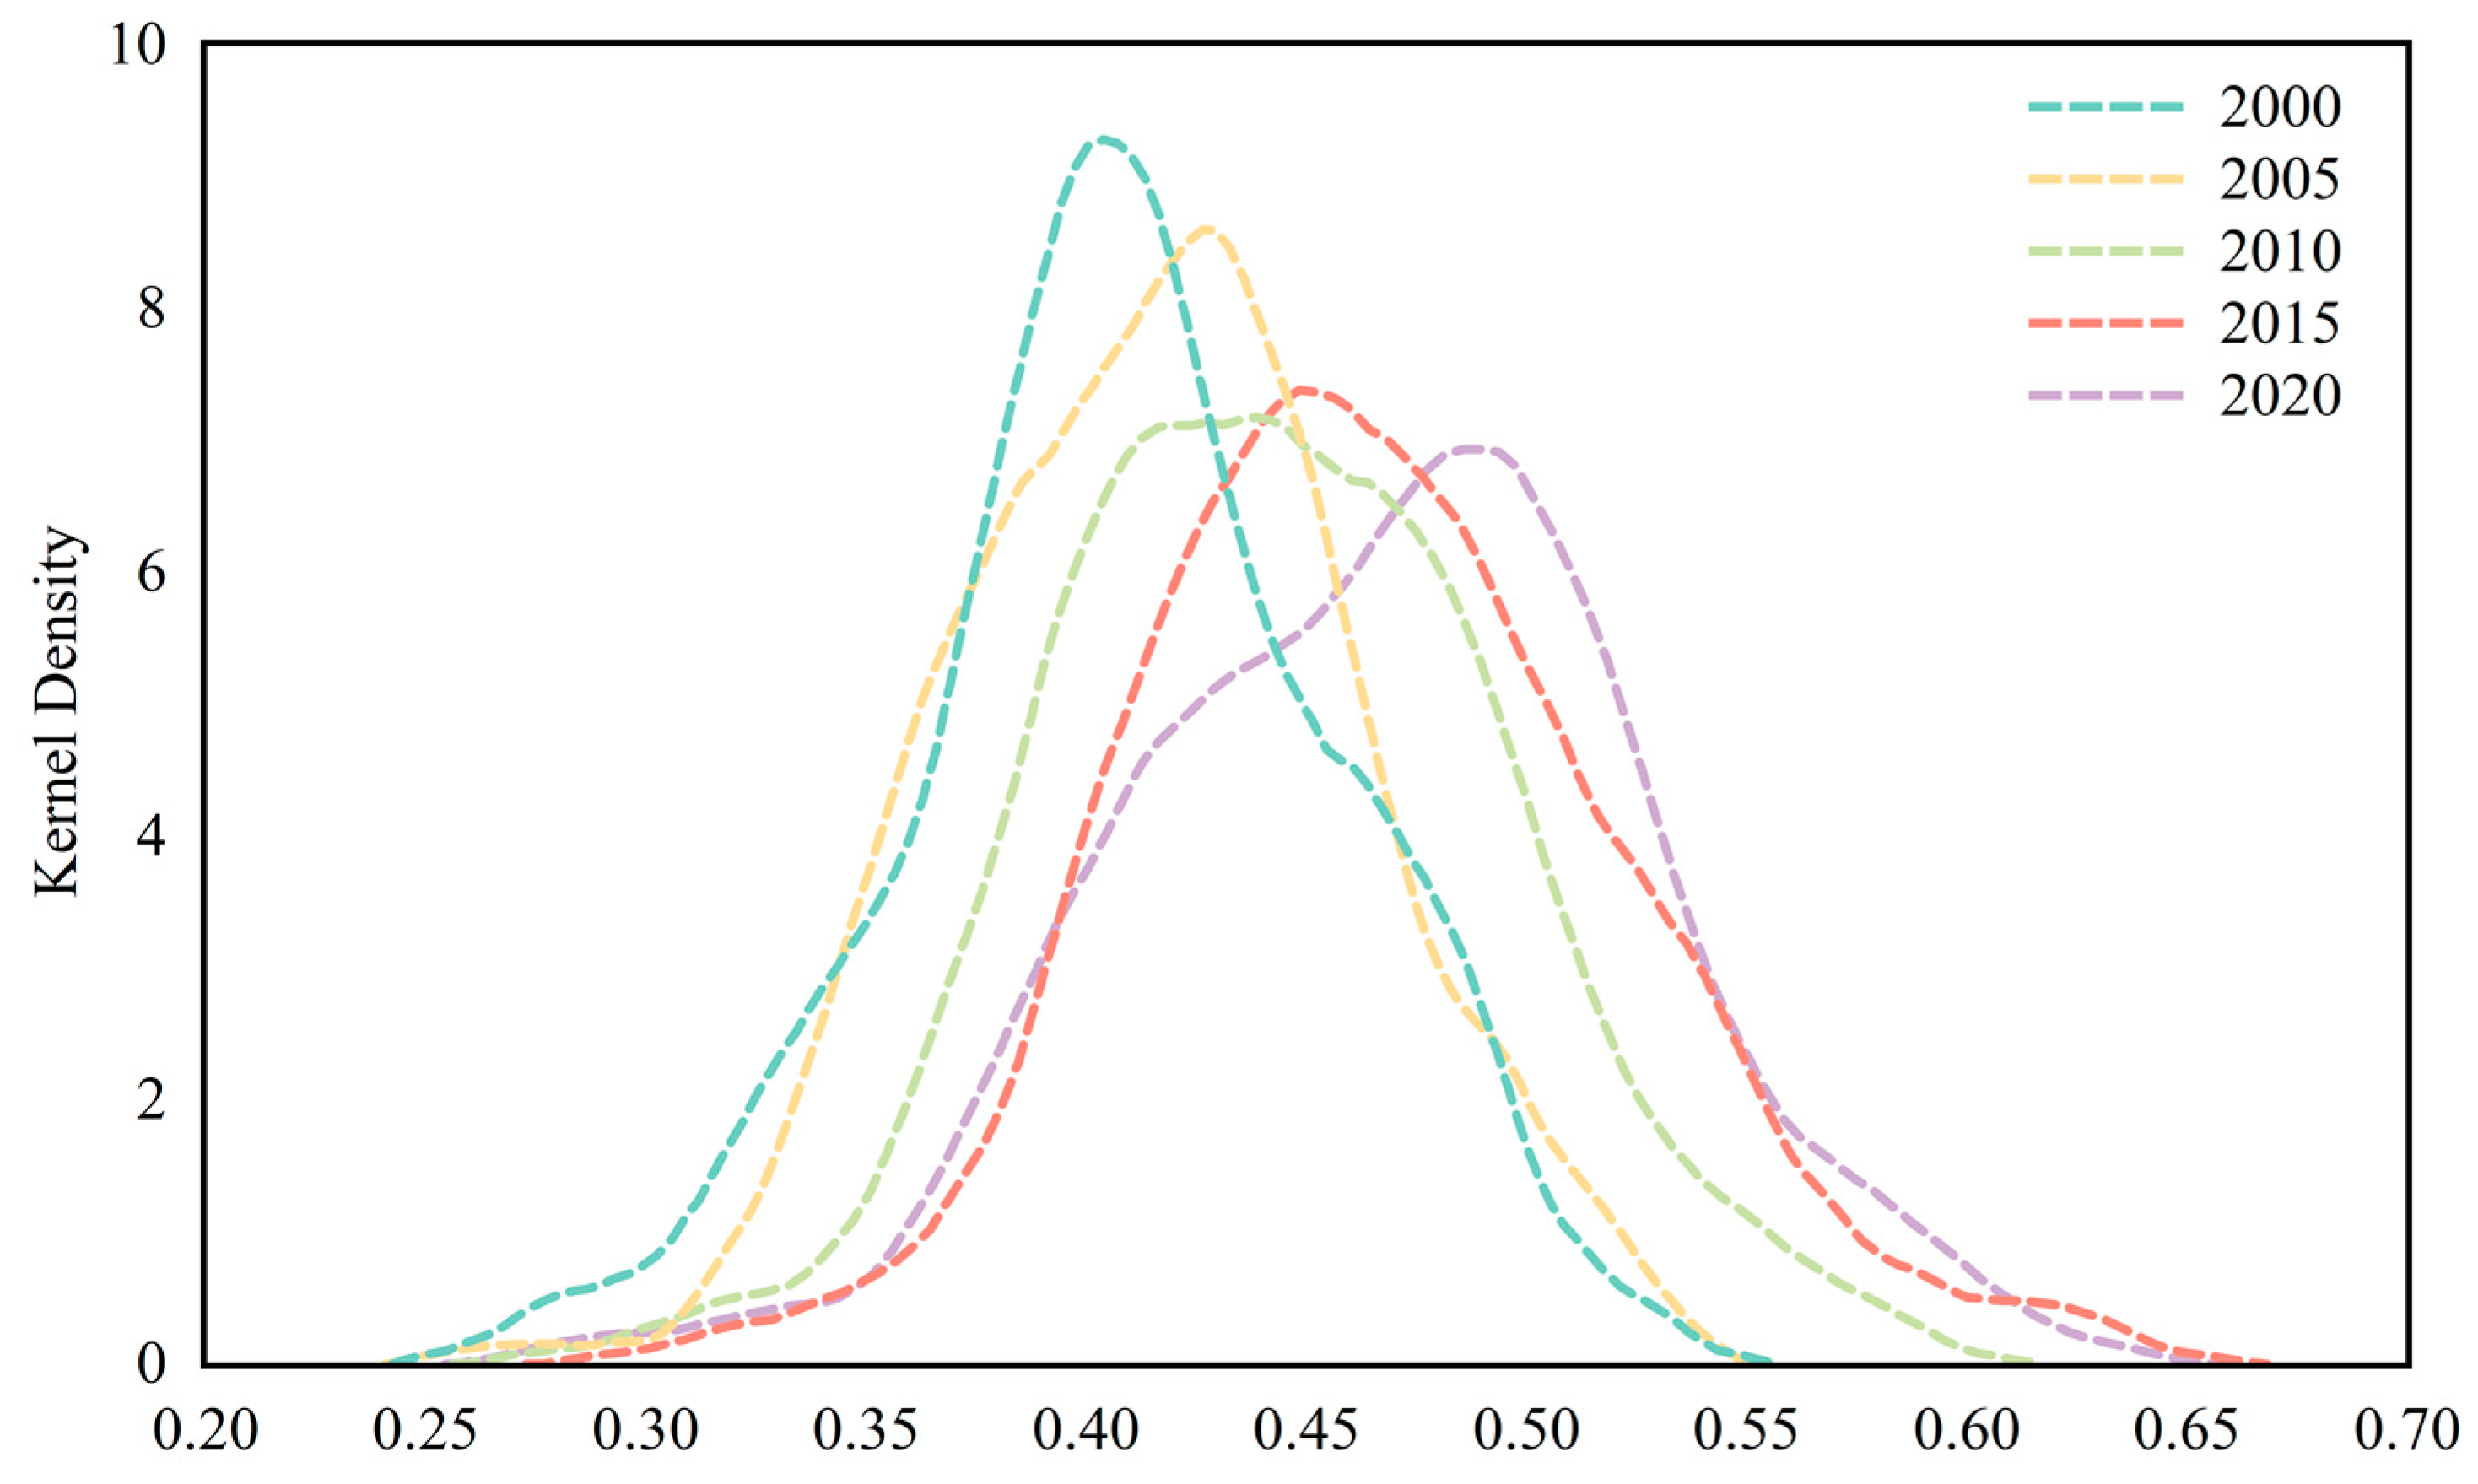
3.3. Dynamic Evolution of Nuclear Density Distribution

The development momentum of the WLF nexus system’s coupling coordination degree in Hebei counties has improved, transitioning from the dysfunctional decline stage to the excessive reconciliation stage, and there is now a trend of entering the coordinated development stage.
However, the level of coupling coordination varies among counties. Spatial differences among counties are analyzed by kernel density estimation (Figure 7), with the horizontal axis representing the coupling coordination degree of the WLF nexus system and the vertical axis indicating the kernel density value. From the point of view of time, the coupling coordination degree of the WLF nexus system in Hebei counties’ kernel density curve evolves to the right from 2000 to 2020. The proportion of low-value counties declines while the proportion of high-value counties rises, and the coupling coordination degree of the system as a whole gradually rises. In 2000, the coupling coordination degree of the central axis of the peak is about 0.40, indicating that most of the counties are in the level of mild disorder or near disorder, and in 2020, the coupling coordination degree reaches about 0.5, meaning most of the counties reach the level of barely coordinated. Correspondingly, the peak core density decreased from a value of about 9 at the beginning of the period to about 6 at the end of the term, reflecting the greater inter-county variation.
In terms of the number of peaks, the kernel density curve evolves from “single peak” to “multi peak” during the study period. There are “single peaks” in the years 2000, 2005, and 2015; “multiple peaks” in 2010, with no obvious prominent main peak; and “double peaks” in 2020, with the right side as the “main peak” and the left side also being prominent. During the study period, the degree of coupling coordination is divergent. From the kurtosis of the curve, from 2000 to 2020, the nuclear density curve gradually becomes slower and lower, evolving from a “sharp peak” form to a “broad peak” form, with the phenomenon of catching up between counties with lower levels of coupling coordination and counties with higher levels. The tails of both sides become longer, the gap between counties gradually expands, and the spatial non-equilibrium becomes stronger; however, there is no phenomenon of individual counties dominating.
Changes in consumption structures and the improvement of living standards result in rising national food demand. Although scientific and technological progress and support policies provide favorable conditions for the coordinated development of the water–soil–grain system, the secondary and tertiary industries use water more efficiently, which has a crowding-out effect on agricultural water use, while the more efficient cash crops lead to the increasing phenomenon of arable land used for non-grain crops, which is also the reason why the coupling coordination of the system in some counties is still in the dysfunctional stage. However, a small number of counties have broken through the bottleneck of coordinated development, and it is the direction of future coordinated development of the coupled water–soil–grain system in Hebei Province to drive low-level counties with high-level counties.

3.4. Spatial Convergence Analysis of WLF Nexus System Coupling Coordination

3.4.1. Global Moran’s I Index Analysis

To investigate whether there is spatial correlation in the WLF nexus system in the counties of Hebei Province, ArcGIS 10.2 was used to calculate the global Moran’s I index for the studied time period, and the results of the p < 0.1 and z > 1.96 passed the significance test, as shown in Table 5.
A Moran’s I > 0 indicates that there is positive spatial autocorrelation between the WLF nexus systems in 151 counties of Hebei Province, indicating spatial agglomeration, i.e., counties with higher levels of coupling coordination are adjacent to each other, as are counties with lower levels of coupling coordination. The global Moran’s I index fell from 0.331 in 2000 to 0.202 in 2020, indicating a downward trend in the phenomenon of spatial clustering. The spatial ties between regions also gradually deteriorate, and the geographical pattern of coupling coordination degree exhibits “clustering decline”.

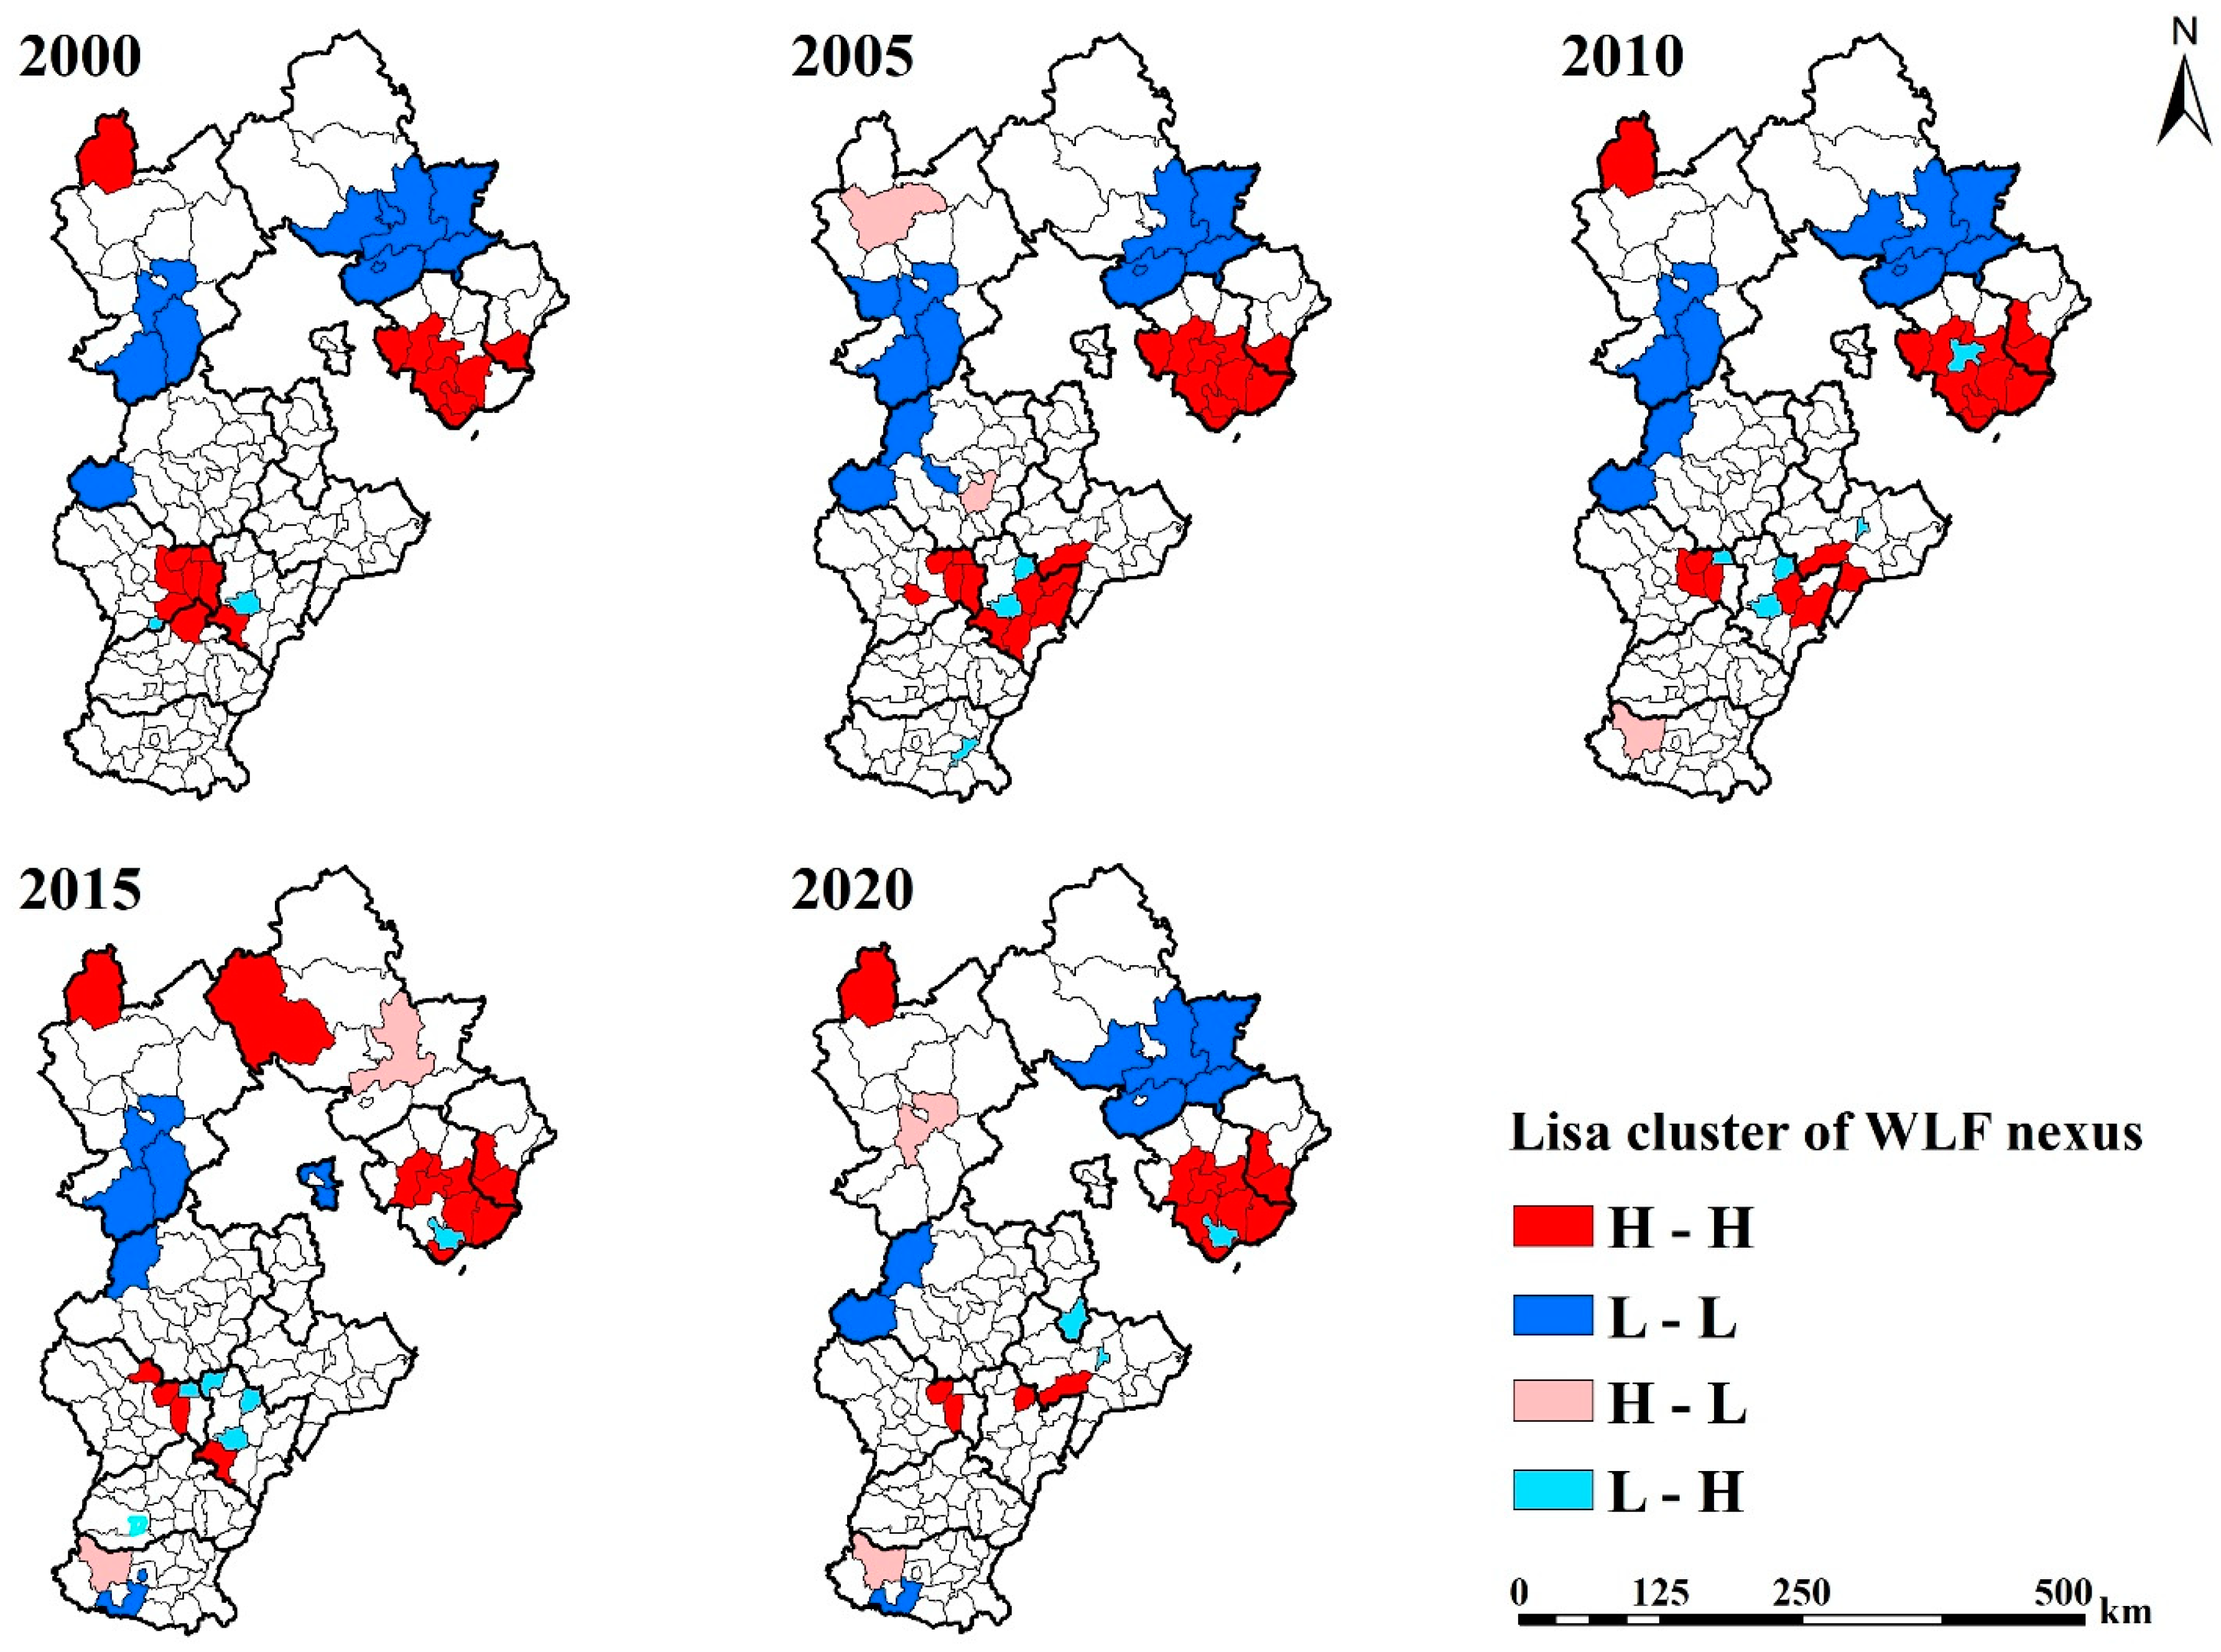
3.4.2. Local Moran’s I Index Analysis

The Lisa aggregation map was created for each year to further identify the spatial aggregation of particular counties, as seen in Figure 8. There was no H-L aggregation in 2000. In the remaining research period, four types of spatial structures H-H, L-L, L-H, and H-L were seen, with the number of counties in each cluster first growing and then declining, and with H-H and L-L aggregation predominating. With a largely consistent spatial distribution pattern, the H-H clusters are concentrated in the southern regions of Tangshan and Qinhuangdao, the northern region of Zhangjiakou, and the counties at the intersection of Shijiazhuang, Hengshui, and Xingtai.
Tangshan had seven H-H counties in 2000, followed by Shijiazhuang with six and Hengshui, Xingtai, Qinhuangdao, and Zhangjiakou with one each. By 2005, Tangshan had increased to nine counties, Hengshui had increased to four, and one county adjacent to Hengshui also appeared in Cangzhou. After 2010, the number of counties in eastern Hebei’s H-H agglomeration gradually declined. These counties are close to the Bohai Sea, and thanks to favorable geographic conditions and recent policy advancements, they have developed into a high-value agglomeration centered on the Bohai Sea. The spatial distribution pattern of L-L agglomerations is more stable, forming a spatial feature dominated by the twin centers at the junction of southeastern Chengde and southwestern Zhangjiakou and northern Baoding, supplemented by scattered counties in southern Handan. The counties with the largest number of L-L concentrations appeared in 2005, with five in Chengde, four in Zhangjiakou, and three in Baoding. In 2015, the L-L counties in Chengde briefly disappeared and reappeared after 2020. Overall, more than 95% of the counties in the L-L aggregation are located north of the Great Wall, where altitude and climate restrictions prevent the cultivation of winter wheat in Zhangjiakou or Chengde. Future development of the region is promoted to take full advantage of the location near the Beijing–Tianjin region to promote anti-seasonal agriculture. H-L indicates that the level of county coupling coordination is significantly higher than that of the surrounding counties and that the polarization of adjacent counties occurs. The counties of this type are the fewest among the four types and are scattered. Only Zhangbei County in Zhangjiakou and Qingyuan County in Baoding in 2005 are included in the H-L spatial structure type. Wu’an county in Handan has maintained H-L status after 2010, and this structure also occurred in Chengde County in Chengde in 2015 and Xuanhua County in Zhangjiakou in 2020. These counties should make the most of their advantages and encourage the development of neighboring counties through resource sharing and technological exchange. The spatial distribution of the counties in the L-H aggregation area is also dispersed. In order to have more marketing space, such counties need to fully increase the efficiency of resource utilization and take advantage of new technology.

4. Discussion

4.1. Influencing Factors of the Coupling Coordination of the WLF Nexus System

Hebei Province is a major production province in China; however, increased demand for water resources has resulted in ecological degradation [54], inefficient use, and significant loss of arable land resources as a result of urbanization, thereby weakening the food production function [55]. There is an inseparable nexus between water, land, and food, and only through the coordinated development and high coupling of the three can we effectively solve the region’s economic development problems [56,57]. We found that the coupling coordination degree of the WLF nexus system in Hebei Province tends to develop at a barely coordinated level and the overall improvement rate is slow, which is similar to the results of Li’s research [29]. The proportion of ecological water use is especially important in the water resources subsystem, where overpopulation threatens water ecosystems [58] and accelerates urban land use expansion. The phenomenon of water and arable land resources flowing from “agriculture to secondary and tertiary industries” [59] leads to a highly coupled but poorly coordinated WLF nexus system. This is the reason for the slow development of coupling coordination, despite the efficient use of resources.
Among the 11 cities in Hebei Province, Tangshan, located in the Bohai Sea economic belt, where counties are close to Beijing and Tianjin, formed a WLF system coupling coordination degree of an H-H value aggregation area, relying on the advantages of location and policy development [60]. This means that the coupling and coordination of the WLF nexus system is driven by the economies of the surrounding regions, and some studies have shown that this economy directly affects regional food consumption and indirectly affects the consumption of water and land resources [17,61]. In northern cities such as Zhangjiakou and Chengde, the coupling was initially poor. Despite the poor endowment of water and land resources, the sustainable development of resources has been achieved by replacing crop types and optimizing fertility periods [62], to build a production scale and planting structure that match the regional resource conditions [63,64]. Similarly, the research in Three Rivers Headwaters Region adjusted the planting areas of various water-consuming crops to optimize resource allocations [30]. The popularization of agricultural mechanization has improved some counties’ grain replanting index [65], such as counties in Chengde and Qinhuangdao, and has promoted the integrated use of land resources.
Furthermore, other major grain-producing provinces in China, such as Hubei Province, are experiencing the problem of the WLF nexus system’s coupling and coordination hovering at the barely coordinated stage. While optimizing the allocation of resources, there are also problems such as the occupation of arable land due to the outflow of rural population, which hinders the productive function of land and affects food security and system coupling coordination [66]. Such issues require more attention from governments.

4.2. Suggestions for Improving Coupling Coordination and Development of Regional WLF Nexus Systems

To achieve the sustainable development of regional water and land resources, as well as food production, counties with high coupling and coordination must play an active role. In areas with poor resource backgrounds, such as Zhangjiakou and Chengde, it is necessary to increase investment into scientific and technological forces, such as increasing support for farmland water conservancy infrastructure and popularizing agricultural mechanization [65] and water-saving technology [67]. In areas with a relatively good economic level and infrastructure foundation, such as Shijiazhuang and Cangzhou, the occupation of cultivated land by urban and rural construction land is strictly controlled to ensure the appropriate amount of cultivated land [68] and avoid the overexploitation of resources. Since the implementation of the land consolidation project in Hebei Province, the cultivated land in the province has developed in a dynamic and balanced manner. In order to improve the coupling and coordination of the WLF system, considering the development positioning of different cities and counties, the southern and eastern cities have taken on the heavy responsibility of economic development, while the western and northern cities have taken on the heavy responsibility of ecological preservation [37]. Only through science and technology and taking the road of modern agricultural development can we break through the bottleneck of coordinating the WLF nexus system, promote industrial upgrading, and improve production efficiency and product value.
In China, cultivated land has been rapidly transferred to construction land. During the period of 2000–2010, total crop yield reduced by 13.08 million ton due to the decline in cultivated land, mostly in the middle and downstream of the Yangtze River and the Huang-Huai-Hai plain [69]. In the years following 2008, the Chinese government expanded domestic demand in response to the economic crisis and accelerated the pace of urbanization. During 2010–2020, about 84% of cultivated land lost was converted to construction land, with areas where urban agglomerations are located experiencing more serious cultivated land occupation [70]. Following the advancement and promotion of agricultural technology, especially the growing popularity of ground mulching and the increasing use of agricultural machinery, some provinces and cities in northwest and northern China have gradually shifted to a two-year cropping system with a significantly higher replanting index, driving the expansion of grain cultivation. However, the marginal efficiency of this external input factor is on a download trend, and changes in cultivated area owing to rapid urban development are having an increasingly significant impact on food production. Due to the low prices of food crops and increased production costs, farmers prefer to grow cash crops rather than food crops so as to have more income and improve their standard of living [71].
Because of this, the large-scale migration of agricultural populations to the cities, for instance in the large population-exporting provinces of Hunan and Sichuan, has not only led to inefficient use of cultivated land, but has also exacerbated the phenomenon of cultivated land abandonment [72]. This trend occurs simultaneously with the compensation for the expropriation of cultivated land. Although the promotion of water-saving irrigation technology has achieved remarkable results and the South–North Water Transfer Project has eased the shortage of agricultural water in northern China, the basic conditions for future agricultural production are not optimistic. Therefore, it is essential to explore the potential for efficiency in depth; adjust the allocation of labor, machinery, fertilizers, and pesticides; and optimize the structure of agricultural production on the premise of saving water while ensuring the same level of output. Attention has to be paid to the water conservation facilities and the effective use of irrigation water on cultivated land. Regional agricultural irrigation water quotas and areas have to be set reasonably to avoid ecological and environmental problems, such as land degradation caused by the overexploitation of water resources. It is also important to avoid exacerbating water shortage situations caused by changes in land use. The formulation of water consumption policies needs to be tailored to local conditions, combining universality and specificity.
In this research, we used the coupling coordination method to determine what stage of development the WLF nexus is in; however, the construction of the index system affects the results. In the land subsystem, use structure and economics were prioritized while undermining the effects of soil type and land quality. Secondly, in order to accurately identify the situation of the counties, some remote sensing data and economic data were used, but such data had some limitations and uncertainties, which in turn affect the accuracy of this study.

5. Conclusions

This study analyzes the coordinated development relationship between water resources, land resources, and food at the municipal and county levels in Hebei Province. By analyzing the comprehensive evaluation index of the WLF nexus system and the temporal and spatial evolution of coupling coordination, the following conclusions are drawn.
Most counties in Hebei Province are on the verge of near-disorder, and the degree of coupling coordination of the WLF nexus system is increasing slowly. Each subsystem’s evaluation index has increased, and the distance between counties has gradually narrowed. By 2015, the main barely coordinated counties are mainly located in Tangshan, the northern part of Zhangjiakou, and Chengde.
The coupled coordination system of the WLF nexus system showed a trend of spatial aggregation. The H-H gathering area is mainly distributed in the north of Zhangjiakou, the south of Tangshan and Qinhuangdao, and the county at the junction of Shijiazhuang, Hengshui, and Xingtai. The L-L type agglomeration area is located in the southeast of Chengde, Zhangjiakou’s southwest, and the junction of Baoding in the north. The H-L and L-H types are distributed across counties.
There are still some shortcomings in this study that need to be further studied and explored. The development and utilization of water and land resources is a multi-level management issue, and every link in the chain of managing the development and use of resources should reflect the various requirements of the government, businesses, and citizens. Food security is not only a priority within a province but is also related to national and even global trade. In addition, expanding and improving the evaluation index system in the future will also help to more comprehensively and accurately understand the internal mechanisms of the relationship between water, land, and food.

Author Contributions

Conceptualization, W.L. and Y.C.; methodology, W.L. and Y.J.; software, W.L.; validation, W.L. and Y.J.; formal analysis, W.L.; investigation, W.L.; resources, W.L. and Z.Y.; and Y.C.; data curation, W.L.; writing—original draft preparation, W.L.; writing—review and editing, Y.C.; visualization, W.L.; supervision, Y.J.; project administration, Y.J. and Y.C.; funding acquisition, Y.C. All authors have read and agreed to the published version of the manuscript.

Funding

This research was funded by the National Key Research and Development Program of China (2016YFC0401408).

Data Availability Statement

The databases that have been used are referred to in detail in the citation given in the text and are publicly available.

Acknowledgments

We are so grateful to the editors and anonymous reviewers for their suggestions.

Conflicts of Interest

We declare that there is no conflict of interest.

References

  1. Chiarelli, D.D.; Rosa, L.; Rulli, M.C.; D’Odorico, P. The water-land-food nexus of natural rubber production. J. Clean. Prod. 2018, 172, 1739–1747. [Google Scholar] [CrossRef] [Green Version]
  2. Liu, X.; Xu, Y.; Sun, S.; Zhao, X.; Wang, Y. Analysis of the Coupling Characteristics of Water Resources and Food Security: The Case of Northwest China. Agriculture 2022, 12, 1114. [Google Scholar] [CrossRef]
  3. Hoff, H.; Iceland, C.; Kuylenstierna, J.; Velde, D.W.T. Managing the Water-Land-Energy Nexus for Sustainable Development. UN Chron. 2012, 49, 34–39. [Google Scholar] [CrossRef]
  4. Yu, B. Ecological effects of new-type urbanization in China. Renew. Sustain. Energy Rev. 2021, 135, 110239. [Google Scholar] [CrossRef]
  5. Ferroukhi, R.; Nagpal, D.; Lopez-Pena, A.; Hodges, T.; Mohtar, R.; Daher, B.; Mohtar, S.; Keulertz, M. Renewable Energy in the Water, Energy & Food Nexus. IRENA 2015, 1, 12–18. [Google Scholar]
  6. Bai, Y.; Deng, X.; Jiang, S.; Zhang, Q.; Wang, Z. Exploring the relationship between urbanization and urban eco-efficiency: Evidence from prefecture-level cities in China. J. Clean. Prod. 2018, 195, 1487–1496. [Google Scholar] [CrossRef]
  7. Bren d’Amour, C.; Reitsma, F.; Baiocchi, G.; Barthel, S.; Guneralp, B.; Erb, K.-H.; Haberl, H.; Creutzig, F.; Seto, K.C. Future urban land expansion and implications for global croplands. Proc. Natl. Acad. Sci. USA 2017, 114, 8939–8944. [Google Scholar] [CrossRef] [Green Version]
  8. Liu, X.; Xu, Y.; Engel, B.A.; Sun, S.; Zhao, X.; Wu, P.; Wang, Y. The impact of urbanization and aging on food security in developing countries: The view from Northwest China. J. Clean. Prod. 2021, 292, 126067. [Google Scholar] [CrossRef]
  9. Zhang, Y.; Wang, J.; Dai, C. The Adjustment of China’s Grain Planting Structure Reduced the Consumption of Cropland and Water Resources. Int. J. Environ. Res. Public Health 2021, 18, 7352. [Google Scholar] [CrossRef]
  10. Wang, Q.; Chen, X. Energy policies for managing China’s carbon emission. Renew. Sustain. Energy Rev. 2015, 50, 470–479. [Google Scholar] [CrossRef]
  11. Carter, C.A.; Zhong, F.; Zhu, J. Advances in Chinese Agriculture and its Global Implications. Appl. Econ. Perspect. Policy 2012, 34, 1–36. [Google Scholar] [CrossRef]
  12. Wang, Q.; Jiang, R.; Li, R. Decoupling analysis of economic growth from water use in City: A case study of Beijing, Shanghai, and Guangzhou of China. Sustain. Cities Soc. 2018, 41, 86–94. [Google Scholar] [CrossRef]
  13. Liu, J.G.; Yang, W. Water Sustainability for China and Beyond. Science 2012, 337, 649–650. [Google Scholar] [CrossRef] [PubMed]
  14. Yuan, Z.; Shen, Y. Estimation of agricultural water consumption from meteorological and yield data: A case study of Hebei, North China. PLoS ONE 2013, 8, e58685. [Google Scholar] [CrossRef] [PubMed]
  15. Hoff, H. Understanding the Nexus. Background Paper for the Bonn 2011 Conference: The Water, Energy and Food Security Nexus; Stockholm Environment Institute: Stockholm, Sweden, 2011. [Google Scholar]
  16. Yuan, Z.; Shen, Y. Managing water-land-food nexus towards resource efficiency improvement: A superedge-based analysis of China. J. Environ. Manag. 2023, 325, 116607. [Google Scholar]
  17. Li, G.; Huang, D.; Sun, C.; Li, Y. Developing interpretive structural modeling based on factor analysis for the water-energy-food nexus conundrum. Sci. Total Environ. 2019, 651, 309–322. [Google Scholar] [CrossRef]
  18. Covarrubias, M. The nexus between water, energy and food in cities: Towards conceptualizing socio-material interconnections. Sustain. Sci. 2018, 14, 277–287. [Google Scholar] [CrossRef] [Green Version]
  19. He, Y.; Wang, Z. Water-land resource carrying capacity in China: Changing trends, main driving forces, and implications. J. Clean. Prod. 2022, 331, 130003. [Google Scholar] [CrossRef]
  20. Qin, C.; Tang, Z.; Chen, J.; Chen, X. The impact of soil and water resource conservation on agricultural production—An analysis of the agricultural production performance in Zhejiang, China. Agric. Water Manag. 2020, 240, 106268. [Google Scholar] [CrossRef]
  21. Hong, C.; Burney, J.A.; Pongratz, J.; Nabel, J.E.M.S.; Mueller, N.D.; Jackson, R.B.; Davis, S.J. Global and regional drivers of land-use emissions in 1961–2017. Nature 2021, 589, 554–561. [Google Scholar] [CrossRef]
  22. Siebert, S.; Burke, J.; Faures, J.M.; Frenken, K.; Hoogeveen, J.; Döll, P.; Portmann, F.T. Groundwater use for irrigation—A global inventory. Hydrol. Earth Syst. Sci. 2010, 14, 1863–1880. [Google Scholar] [CrossRef] [Green Version]
  23. Santini, M. The land use–food–coronavirus nexus. Nat. Food 2021, 2, 390–391. [Google Scholar] [CrossRef]
  24. Xu, Y.; Liu, L.-Y.; Pu, L.-J.; Liu, Y.-M.; Xu, F.; Yu, C. Analysis on farmers’ behavioral intension of cropland use and its influencing factors in the coastal areas of Northern Jiangsu province. J. Nat. Resour. 2022, 37, 1643–1653. [Google Scholar] [CrossRef]
  25. Shrestha, A.; Roth, D.; Joshi, D. Flows of change: Dynamic water rights and water access in peri-urban Kathmandu. Ecol. Soc. 2018, 23, 42. [Google Scholar] [CrossRef]
  26. Thurman, L.L.; Gross, J.E.; Mengelt, C.; Beever, E.A.; Thompson, L.M.; Schuurman, G.W.; Hoving, C.L.; Olden, J.D. Applying assessments of adaptive capacity to inform natural-resource management in a changing climate. Conserv. Biol. 2022, 36, e13838. [Google Scholar] [CrossRef]
  27. Jiang, Y.; Xu, X.; Huang, Q.; Huo, Z.; Huang, G. Optimizing regional irrigation water use by integrating a two-level optimization model and an agro-hydrological model. Agric. Water Manag. 2016, 178, 76–88. [Google Scholar] [CrossRef] [Green Version]
  28. Niu, G.; Li, Y.; Huang, G.; Liu, J.; Fan, Y. Crop planning and water resource allocation for sustainable development of an irrigation region in China under multiple uncertainties. Agric. Water Manag. 2016, 166, 53–69. [Google Scholar] [CrossRef]
  29. Li, Q.; Yang, L.; Jiang, F.; Liu, Y.; Guo, C.; Han, S. Distribution Characteristics, Regional Differences and Spatial Convergence of the Water-Energy-Land-Food Nexus: A Case Study of China. Land 2022, 11, 1543. [Google Scholar] [CrossRef]
  30. Chen, M.; Shang, S.; Li, W. Integrated Modeling Approach for Sustainable Land-Water-Food Nexus Management. Agriculture 2020, 10, 104. [Google Scholar] [CrossRef] [Green Version]
  31. Li, M.; Fu, Q.; Singh, V.P.; Liu, D. An interval multi-objective programming model for irrigation water allocation under uncertainty. Agric. Water Manag. 2018, 196, 24–36. [Google Scholar] [CrossRef]
  32. Nie, Y.; Avraamidou, S.; Xiao, X.; Pistikopoulos, E.N.; Li, J.; Zeng, Y.; Song, F.; Yu, J.; Zhu, M. A Food-Energy-Water Nexus approach for land use optimization. Sci. Total Environ. 2019, 659, 7–19. [Google Scholar] [CrossRef] [Green Version]
  33. Bieber, N.; Ker, J.H.; Wang, X.; Triantafyllidis, C.; van Dam, K.H.; Koppelaar, R.H.; Shah, N. Sustainable planning of the energy-water-food nexus using decision making tools. Energy Policy 2018, 113, 584–607. [Google Scholar] [CrossRef]
  34. Zhai, M.; Huang, G.; Liu, L.; Zhang, X. Ecological network analysis of an energy metabolism system based on input-output tables: Model development and case study for Guangdong. J. Clean. Prod. 2019, 227, 434–446. [Google Scholar] [CrossRef]
  35. Xiao, F. A new divergence measure for belief functions in D–S evidence theory for multisensor data fusion. Inf. Sci. 2020, 514, 462–483. [Google Scholar] [CrossRef]
  36. Wang, Y.; Sun, R.-X. Impact of land use change on coupling coordination degree of regional water-energy-food system: A case study of Beijing-Tianjin-Hebei Urban Agglomeration. J. Nat. Resour. 2022, 37, 582–599. [Google Scholar] [CrossRef]
  37. Gong, Y.; Li, J.; Li, Y. Spatiotemporal characteristics and driving mechanisms of arable land in the Beijing-Tianjin-Hebei region during 1990–2015. Socio-Econ. Plan. Sci. 2020, 70, 100720. [Google Scholar] [CrossRef]
  38. Deng, X.; Gibson, J.; Wang, P. Relationship between landscape diversity and crop production: A case study in the Hebei Province of China based on multi-source data integration. J. Clean. Prod. 2017, 142, 985–992. [Google Scholar] [CrossRef]
  39. Deng, X.P.; Shan, L.; Zhang, H.; Turner, N.C. Improving agricultural water use efficiency in arid and semiarid areas of China. Agric. Water Manag. 2006, 80, 23–40. [Google Scholar] [CrossRef]
  40. Department of Water Resources of Hebei Province. Hebei Water Resourcs Bulletin, 2000 and 2020; Department of Water Resources of Hebei Province: Shijiazhuang, China, 2000. [Google Scholar]
  41. China Statistic Press. Hebei Statitical Yearbook, 2001 and 2021; China Statistic Press: Beijing, China, 2021. [Google Scholar]
  42. Available online: https://www.resdc.cn/ (accessed on 12 December 2022).
  43. Available online: https://www.cmads.org (accessed on 26 December 2022).
  44. Available online: http://www.webmap.cn (accessed on 26 December 2022).
  45. Available online: https://www.gscloud.cn (accessed on 12 December 2022).
  46. Dong, C.; Tan, Q.; Huang, G.-H.; Cai, Y.-P. A dual-inexact fuzzy stochastic model for water resources management and non-point source pollution mitigation under multiple uncertainties. Hydrol. Earth Syst. Sci. 2014, 18, 1793–1803. [Google Scholar] [CrossRef] [Green Version]
  47. Zhang, Z.; Li, Y. Coupling coordination and spatiotemporal dynamic evolution between urbanization and geological hazards-A case study from China. Sci. Total Environ. 2020, 728, 138825. [Google Scholar] [CrossRef]
  48. Song, Q.; Zhou, N.; Liu, T.; Siehr, S.A.; Qi, Y. Investigation of a “coupling model” of coordination between low-carbon development and urbanization in China. Energy Policy 2018, 121, 346–354. [Google Scholar] [CrossRef] [Green Version]
  49. Hu, S.; Yang, Y.; Zheng, H.; Mi, C.; Ma, T.; Shi, R. A framework for assessing sustainable agriculture and rural development: A case study of the Beijing-Tianjin-Hebei region, China. Environ. Impact Assess. Rev. 2022, 97, 106861. [Google Scholar] [CrossRef]
  50. Cui, Y. The coordinated relationship among industrialization, environmental carrying capacity and green infrastructure: A comparative research of Beijing-Tianjin-Hebei region, China. Environ. Dev. 2022, 44, 100775. [Google Scholar] [CrossRef]
  51. Katkovnik, V.; Shmulevich, I. Kernel density estimation with adaptive varying window size. Pattern Recognit. Lett. 2002, 23, 1641–1648. [Google Scholar] [CrossRef]
  52. Li, M.; Dong, Z.; Zhang, Z. Calculation of the aeolian sediment flux-density profile based on estimation of the kernel density. Aeolian Res. 2015, 16, 49–54. [Google Scholar] [CrossRef]
  53. Zheng, D.; An, Z.; Yan, C.; Wu, R. Spatial-temporal characteristics and influencing factors of food production efficiency based on WEF nexus in China. J. Clean. Prod. 2022, 330, 129921. [Google Scholar] [CrossRef]
  54. Li, Q.; Chen, L.; Xu, Y. Drought risk and water resources assessment in the Beijing-Tianjin-Hebei region, China. Sci. Total Environ. 2022, 832, 154915. [Google Scholar] [CrossRef]
  55. Men, B.; Yao, J.; Wang, G.; Tang, X. Spatio-temporal Analysis of Precipitation and Temperature: A Case Study Over the Beijing–Tianjin–Hebei Region, China. Pure Appl. Geophys. 2020, 177, 3527–3541. [Google Scholar] [CrossRef]
  56. Lu, Y.; Liu, M.; Zeng, S.; Wang, C. Applying the food–energy–water nexus concept at the local scale. Nat. Sustain. 2021, 4, 672–679. [Google Scholar]
  57. Wu, T.C. Water Footprint Analysis of Paddy Rice and the Nexus of Water-Land-Rice in Taiwan: 2005–2014. IOP Conf. Ser. Earth Environ. Sci. 2018, 150, 012001. [Google Scholar] [CrossRef]
  58. Lu, Y.; Schmidt, J.I.; Loring, P.A.; Whitney, E.; Aggarwal, S.; Byrd, A.G.; Dev, S.; Dotson, A.D.; Huang, D.; Johnson, B.; et al. Screening and mitigating major threats of regional development to water ecosystems using ecosystem services as endpoints. J. Environ. Manag. 2021, 293, 112787. [Google Scholar] [CrossRef] [PubMed]
  59. Li, M.; Xu, Z.; Jiang, S.; Zhuo, L.; Gao, X.; Zhao, Y.; Liu, Y.; Wang, W.; Jin, J.; Wu, P. Non-negligible regional differences in the driving forces of crop-related water footprint and virtual water flows: A case study for the Beijing-Tianjin-Hebei region. J. Clean. Prod. 2021, 279, 123670. [Google Scholar] [CrossRef]
  60. Sanwei, H.E.; Xi, S. Spatial Clustering and Coupling Coordination of Population-Land-Economic Urbanization in Beijing-Tianjin-Hebei Region. Econ. Geogr. 2018, 38, 95–102. [Google Scholar]
  61. Yuxi, Z.; Jingke, H.; Changlin, X.; Zhangmiao, L. Unfolding the synergy and interaction of water-land-food nexus for sustainable resource management: A supernetwork analysis. Sci. Total Environ. 2021, 784, 147085. [Google Scholar] [CrossRef] [PubMed]
  62. Yang, X.-L.; Chen, Y.-Q.; Steenhuis, T.S.; Pacenka, S.; Gao, W.-S.; Ma, L.; Zhang, M.; Sui, P. Mitigating Groundwater Depletion in North China Plain with Cropping System that Alternate Deep and Shallow Rooted Crops. Front. Plant Sci. 2017, 8, 980. [Google Scholar] [CrossRef] [Green Version]
  63. Xiao, D.; Shen, Y.; Qi, Y.; Moiwo, J.P.; Min, L.; Zhang, Y.; Guo, Y.; Pei, H. Impact of alternative cropping systems on groundwater use and grain yields in the North China Plain Region. Agric. Syst. 2017, 153, 109–117. [Google Scholar] [CrossRef]
  64. Luo, J.; Shen, Y.; Qi, Y.; Zhang, Y.; Xiao, D. Evaluating water conservation effects due to cropping system optimization on the Beijing-Tianjin-Hebei plain, China. Agric. Syst. 2018, 159, 32–41. [Google Scholar] [CrossRef]
  65. Devkota, K.P.; Yadav, S.; Khanda, C.; Beebout, S.J.; Mohapatra, B.K.; Singleton, G.R.; Puskur, R. Assessing alternative crop establishment methods with a sustainability lens in rice production systems of Eastern India. J. Clean. Prod. 2020, 244, 118835. [Google Scholar] [CrossRef]
  66. Liu, X.; Xin, L. Assessment of the Efficiency of Cultivated Land Occupied by Urban and Rural Construction Land in China from 1990 to 2020. Land 2022, 11, 941. [Google Scholar] [CrossRef]
  67. Zhang, W.; Dong, A.; Liu, F.; Niu, W.; Siddique, K.H. Effect of film mulching on crop yield and water use efficiency in drip irrigation systems: A meta-analysis. Soil Tillage Res. 2022, 221, 105392. [Google Scholar] [CrossRef]
  68. Miao, Y.; Liu, J.; Wang, R.Y. Occupation of Cultivated Land for Urban–Rural Expansion in China: Evidence from National Land Survey 1996–2006. Land 2021, 10, 1378. [Google Scholar] [CrossRef]
  69. Liu, L.; Xu, X.; Liu, J.; Chen, X.; Ning, J. Impact of farmland changes on production potential in China during 1990–2010. J. Geogr. Sci. 2014, 25, 19–34. [Google Scholar] [CrossRef] [Green Version]
  70. Jiang, L.; Deng, X.; Seto, K.C. The impact of urban expansion on agricultural land use intensity in China. Land Use Policy 2013, 35, 33–39. [Google Scholar] [CrossRef]
  71. Chai, J.; Wang, Z.; Yang, J.; Zhang, L. Analysis for spatial-temporal changes of grain production and farmland resource: Evidence from Hubei Province, central China. J. Clean. Prod. 2019, 207, 474–482. [Google Scholar] [CrossRef]
  72. Chen, R.; Ye, C.; Cai, Y.; Xing, X.; Chen, Q. The impact of rural out-migration on land use transition in China: Past, present and trend. Land Use Policy 2014, 40, 101–110. [Google Scholar] [CrossRef]
Figure 1. Location of the study area in China.
Land 12 00595 g001
Figure 2. Evolutionary trends in the comprehensive evaluation indices for each subsystem and WLF system in 11 cities in Hebei Province from 2000, 2005, 2010, 2015, and 2020.
Land 12 00595 g002
Figure 3. Spatial-temporal evaluation index of the WLF nexus system in 151 counties of Hebei province.
Land 12 00595 g003
Figure 4. The degree of coupling coordination of the WLF nexus system in 11 cities of Hebei Province.
Land 12 00595 g004
Figure 5. The degree of coupling coordination of the WLF nexus system in 151 counties of Hebei Province.
Land 12 00595 g005
Figure 6. Variation in the trajectory of gravity centers of WLF nexus system in Hebei Province.
Land 12 00595 g006
Figure 7. Kernel density curve of the coupling coordination of WLF nexus.
Land 12 00595 g007
Figure 8. The WLF Nexus System’s Lisa Aggregations map of 151 counties in Hebei Province.
Land 12 00595 g008
Table 1. Index system of WLF nexus coupling coordination degree.
SubsystemsIndicator CategoryEvaluation
Indicators
NumberUnitCalculation FormulaProperties
Water
Subsystem
volumePrecipitationW1108 m3China meteorological assimilation driving datasets+
Water production modulusW2104 m3/km2Total water resources/area +
Water resources per capitaW3m3/personTotal water resources/total regional population+
Water consumption per capitaW4m3/personTotal water consumption/total regional population+
structurePercentage of water used in agricultureW5%Agricultural water consumption/total water consumption
Percentage of industrial water useW6%Industrial water consumption/total water consumption
Percentage of domestic water useW7%Domestic water consumption/total water consumption+
Percentage of ecological water useW8%Ecological water consumption/total water consumption+
efficiencyWater consumption per 10,000 GDPW9m3/104 CNYTotal water use/regional GDP
agricultural hydrologyEffective irrigated areaW10km2Statistics+
Land
Subsystem
agricultural productionArable land per capitaL1km2/personArable land area/total population+
Construction land area per capitaL2km2/personConstruction land area/total population+
Machine farming areaL3km2Statistics+
structureIntegrated land use degreeL4Resource and Environment Science and Data Center+
Replanting indexL5Crop sown area/cultivated land area+
circulationPopulation densityL6person/km2Total population/total area of the region
Road mileageL7kmStatistics+
Food
Subsystem
agricultural productionCrop seeding areaF1km2Statistics+
Total Grain ProductionF2tonStatistics+
Total power of
agricultural
machinery
F3104 kwStatistics+
efficiencyTotal agricultural outputF4104 CNYStatistics+
Per capita food holdingsF5ton/personTotal food production/total population+
Grain yieldF6kg/km2Total food production/area under food cultivation+
ecological environmentFertilizer application amountF7tonStatistics
Pesticide application amountF8tonStatistics
Natural population growth rateF9(Births − Deaths)/Average annual population
Table 2. WLF nexus coupling coordination level classification criteria.
D Coupling CoordinationCoupling Coordination LevelType of Coupling Coordination
0.0 < D ≤ 0.1Extreme disorderDysfunctional decline stage
0.1 < D ≤ 0.2Severe disorder
0.2 < D ≤ 0.3Moderate disorder
0.3 < D ≤ 0.4Mild disorder
0.4 < D ≤ 0.5Near-disorderExcessive reconciliation stage
0.5 < D ≤ 0.6Barely coordinated
0.6 < D ≤ 0.7Primary coordination
0.7 < D ≤ 0.8Intermediate coordinationCoordinated development stage
0.8 < D ≤ 0.9Virtuous coordination
0.9 < D ≤ 1.0Quality coordination
Table 3. The Weight of Each Evaluation Indicator in the WLF Nexus System.
Water Subsystem IndicatorsWeightLand Subsystem IndicatorsWeightFood Subsystem IndicatorsWeight
W10.0328L10.2613F10.1067
W20.1713L20.1689F20.1600
W30.1297L30.1662F30.2345
W40.0708L40.0913F40.2380
W50.0729L50.0819F50.1097
W60.0111L60.0103F60.1151
W70.0710L70.2182F70.0064
W80.2934 F80.0069
W90.0656 F90.0229
W100.0812
Table 4. Direction and distance of the gravity center’s movement.
PeriodDirection (°)Distance (km)
2000–200572.3321.098
2005–201071.9852.530
2010–2015−30.7883.132
2015–2020−58.6131.107
Table 5. Global Moran’s I of the coupling coordination of the WLF nexus system.
Model Parameters20002005201020152020
Moran’s I0.3310.2810.2530.2180.202
z-score6.5925.6235.0614.3864.074
p-value0.000.000.000.000.00
Disclaimer/Publisher’s Note: The statements, opinions and data contained in all publications are solely those of the individual author(s) and contributor(s) and not of MDPI and/or the editor(s). MDPI and/or the editor(s) disclaim responsibility for any injury to people or property resulting from any ideas, methods, instructions or products referred to in the content.

