

Industrial Spatio-Temporal Distribution of High-Speed Rail Station Area from the Accommodation Facilities Perspective: A Multi-City Comparison

Abstract
:1. Introduction
2. Data and Methods
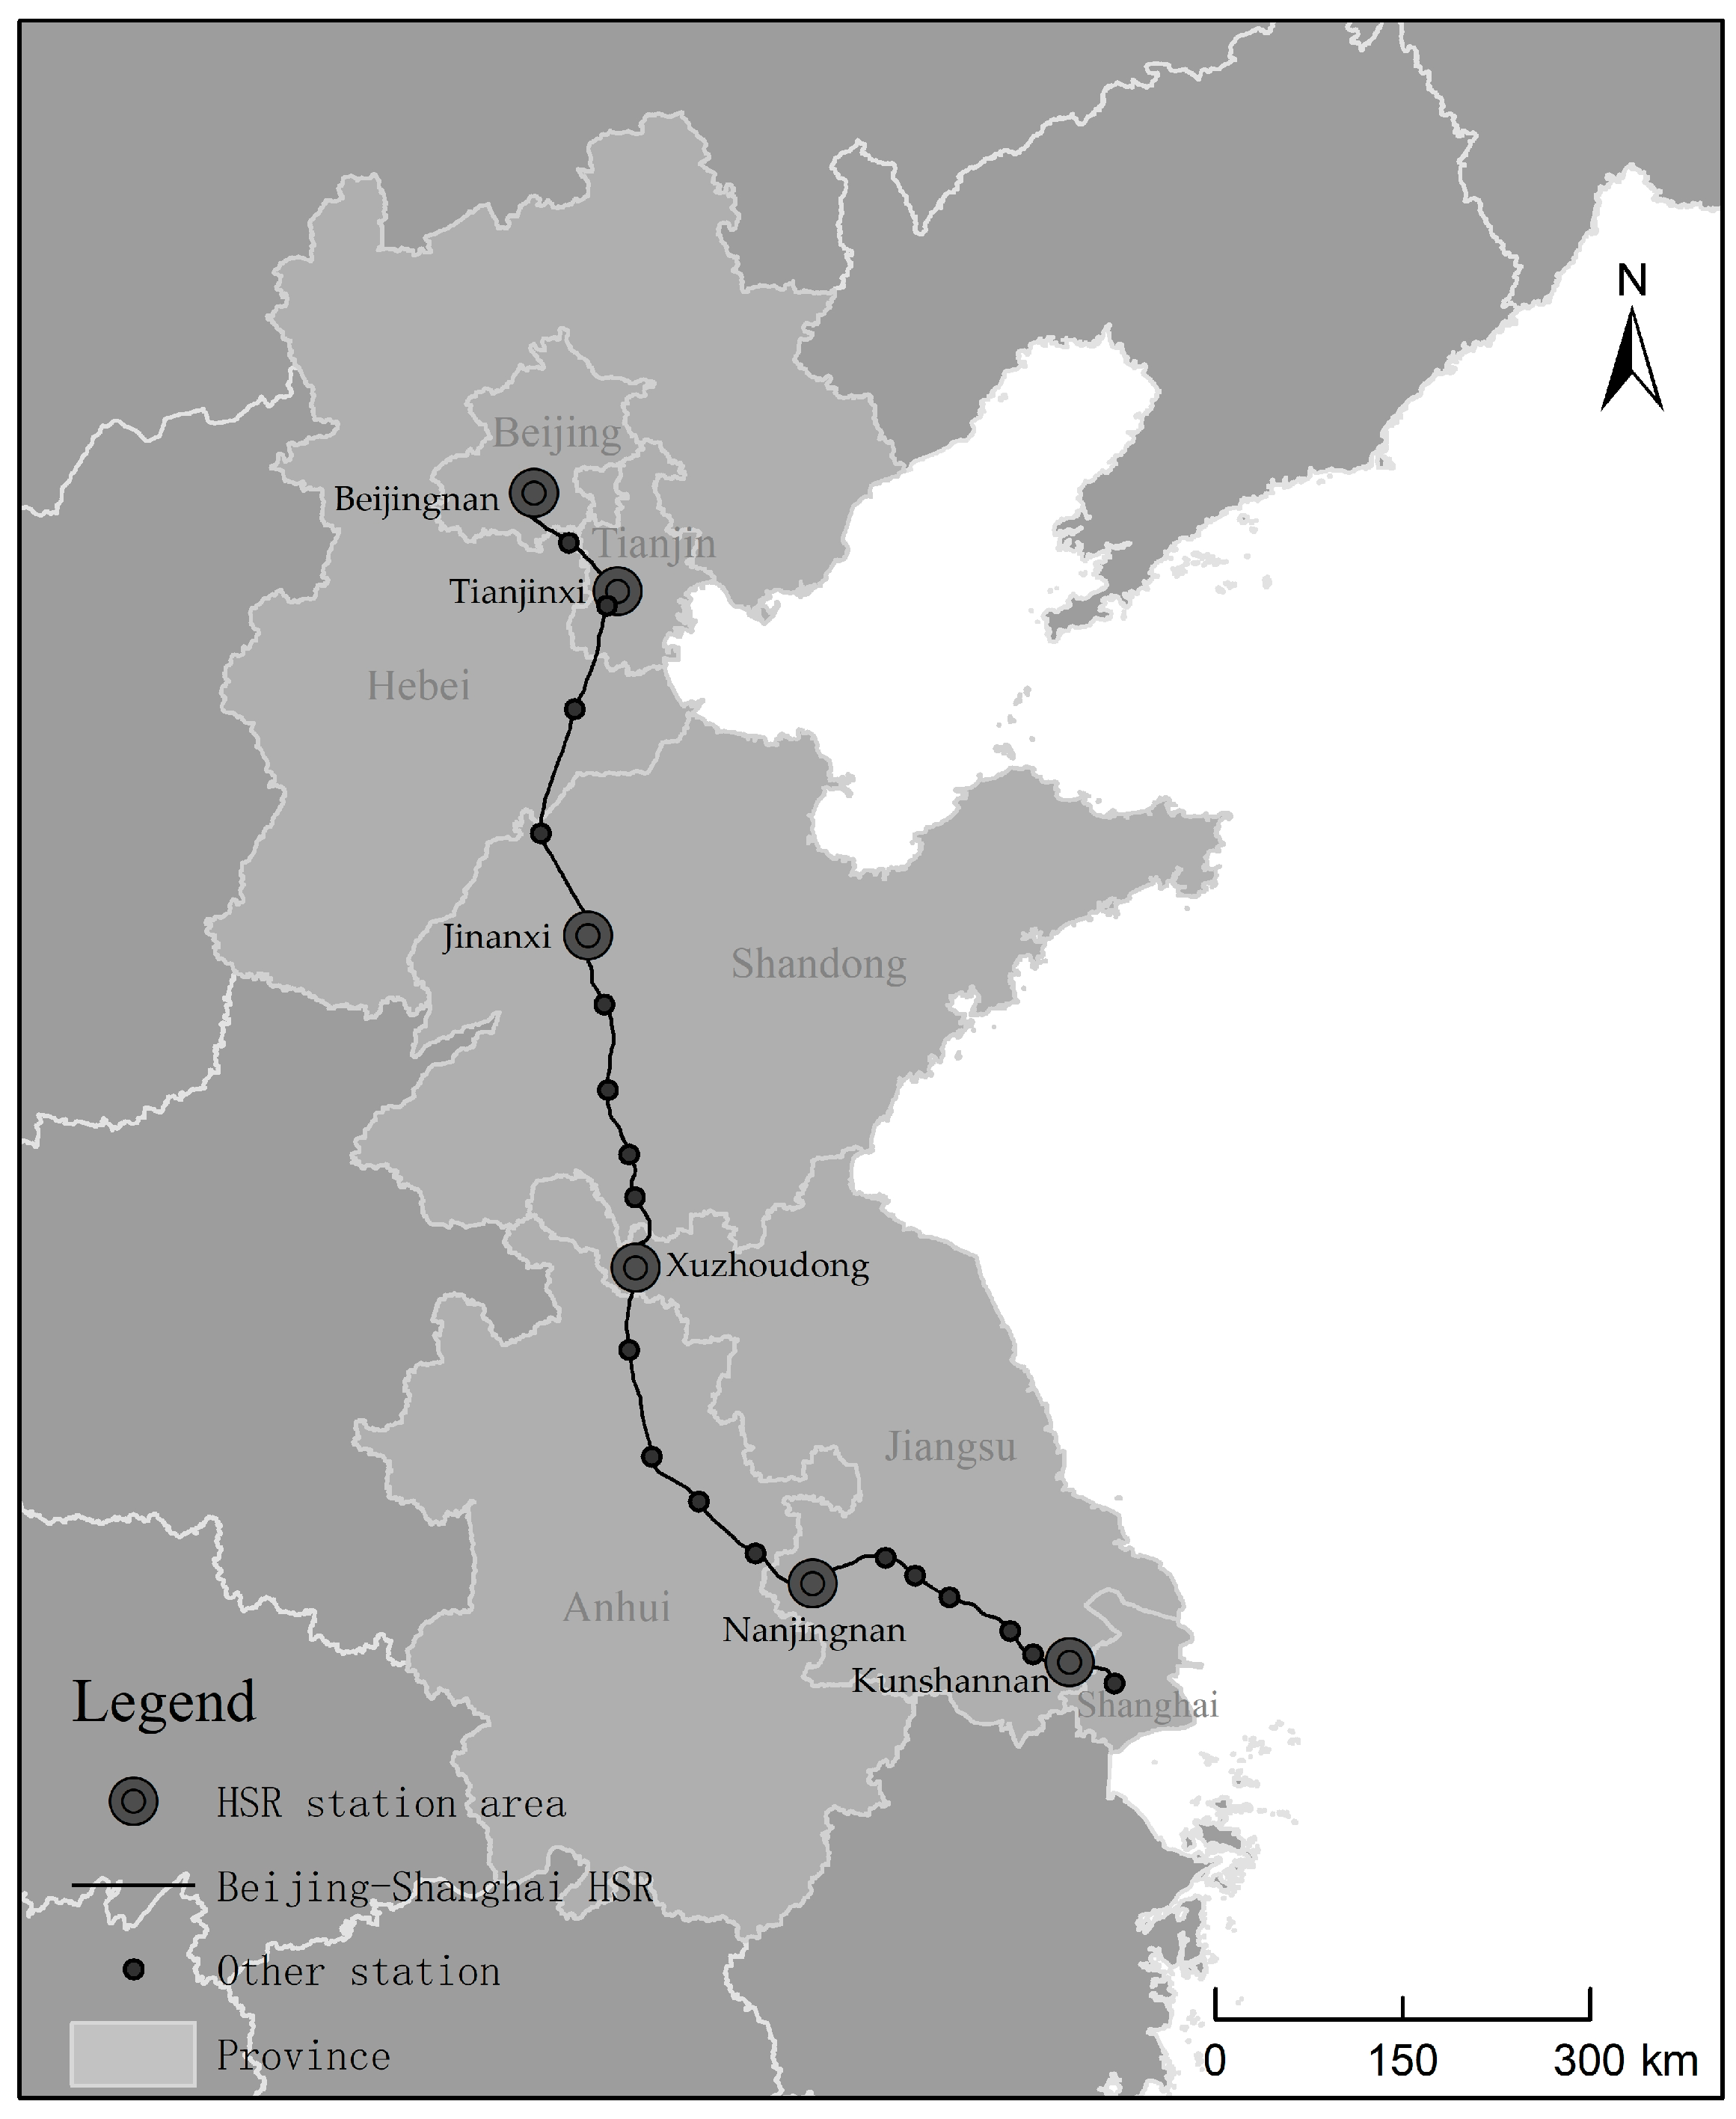
2.1. Study Area
2.2. Data Collection
2.3. Methods
2.3.1. Kernel Density Estimation
2.3.2. Nearest Neighbor Index
2.3.3. Geodetector Model
3. Spatio-Temporal Characteristic Analysis
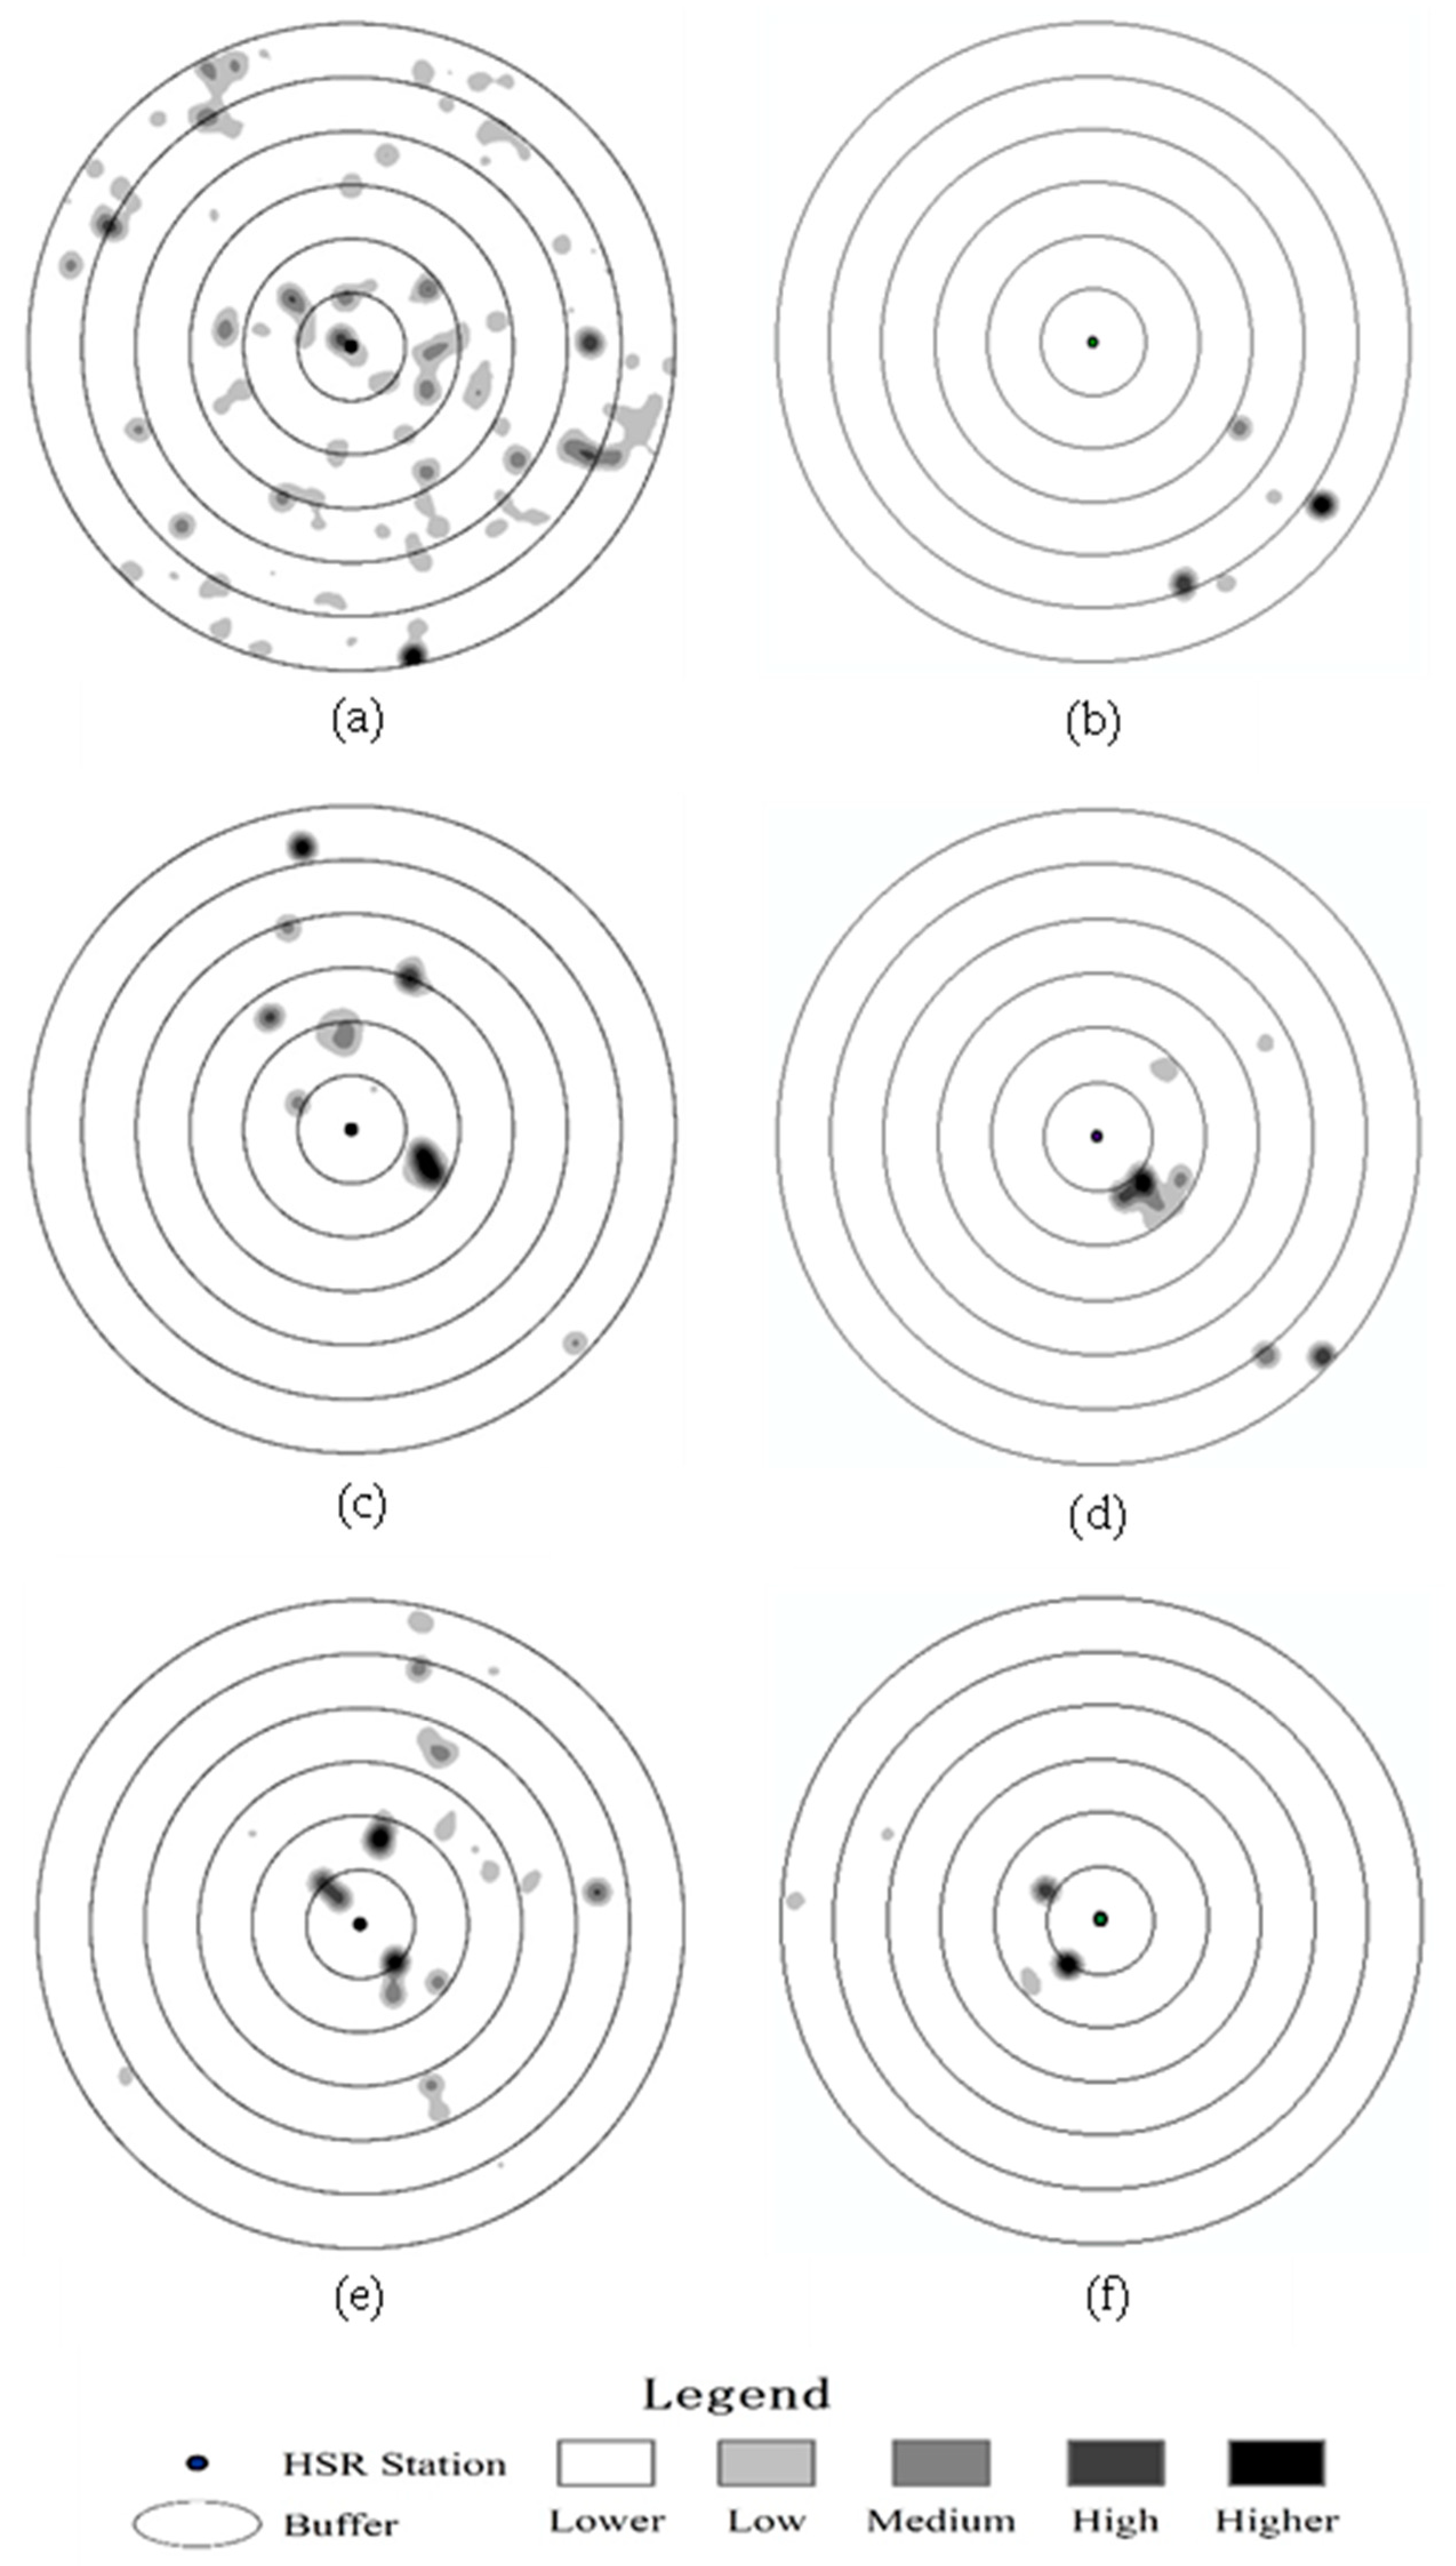
3.1. Spatial Distribution Pattern
3.2. Temporal Evolution Feature
4. Driving Factors Analysis
4.1. Selection and Treatment of Driving Factors
4.2. Single Factor Analysis
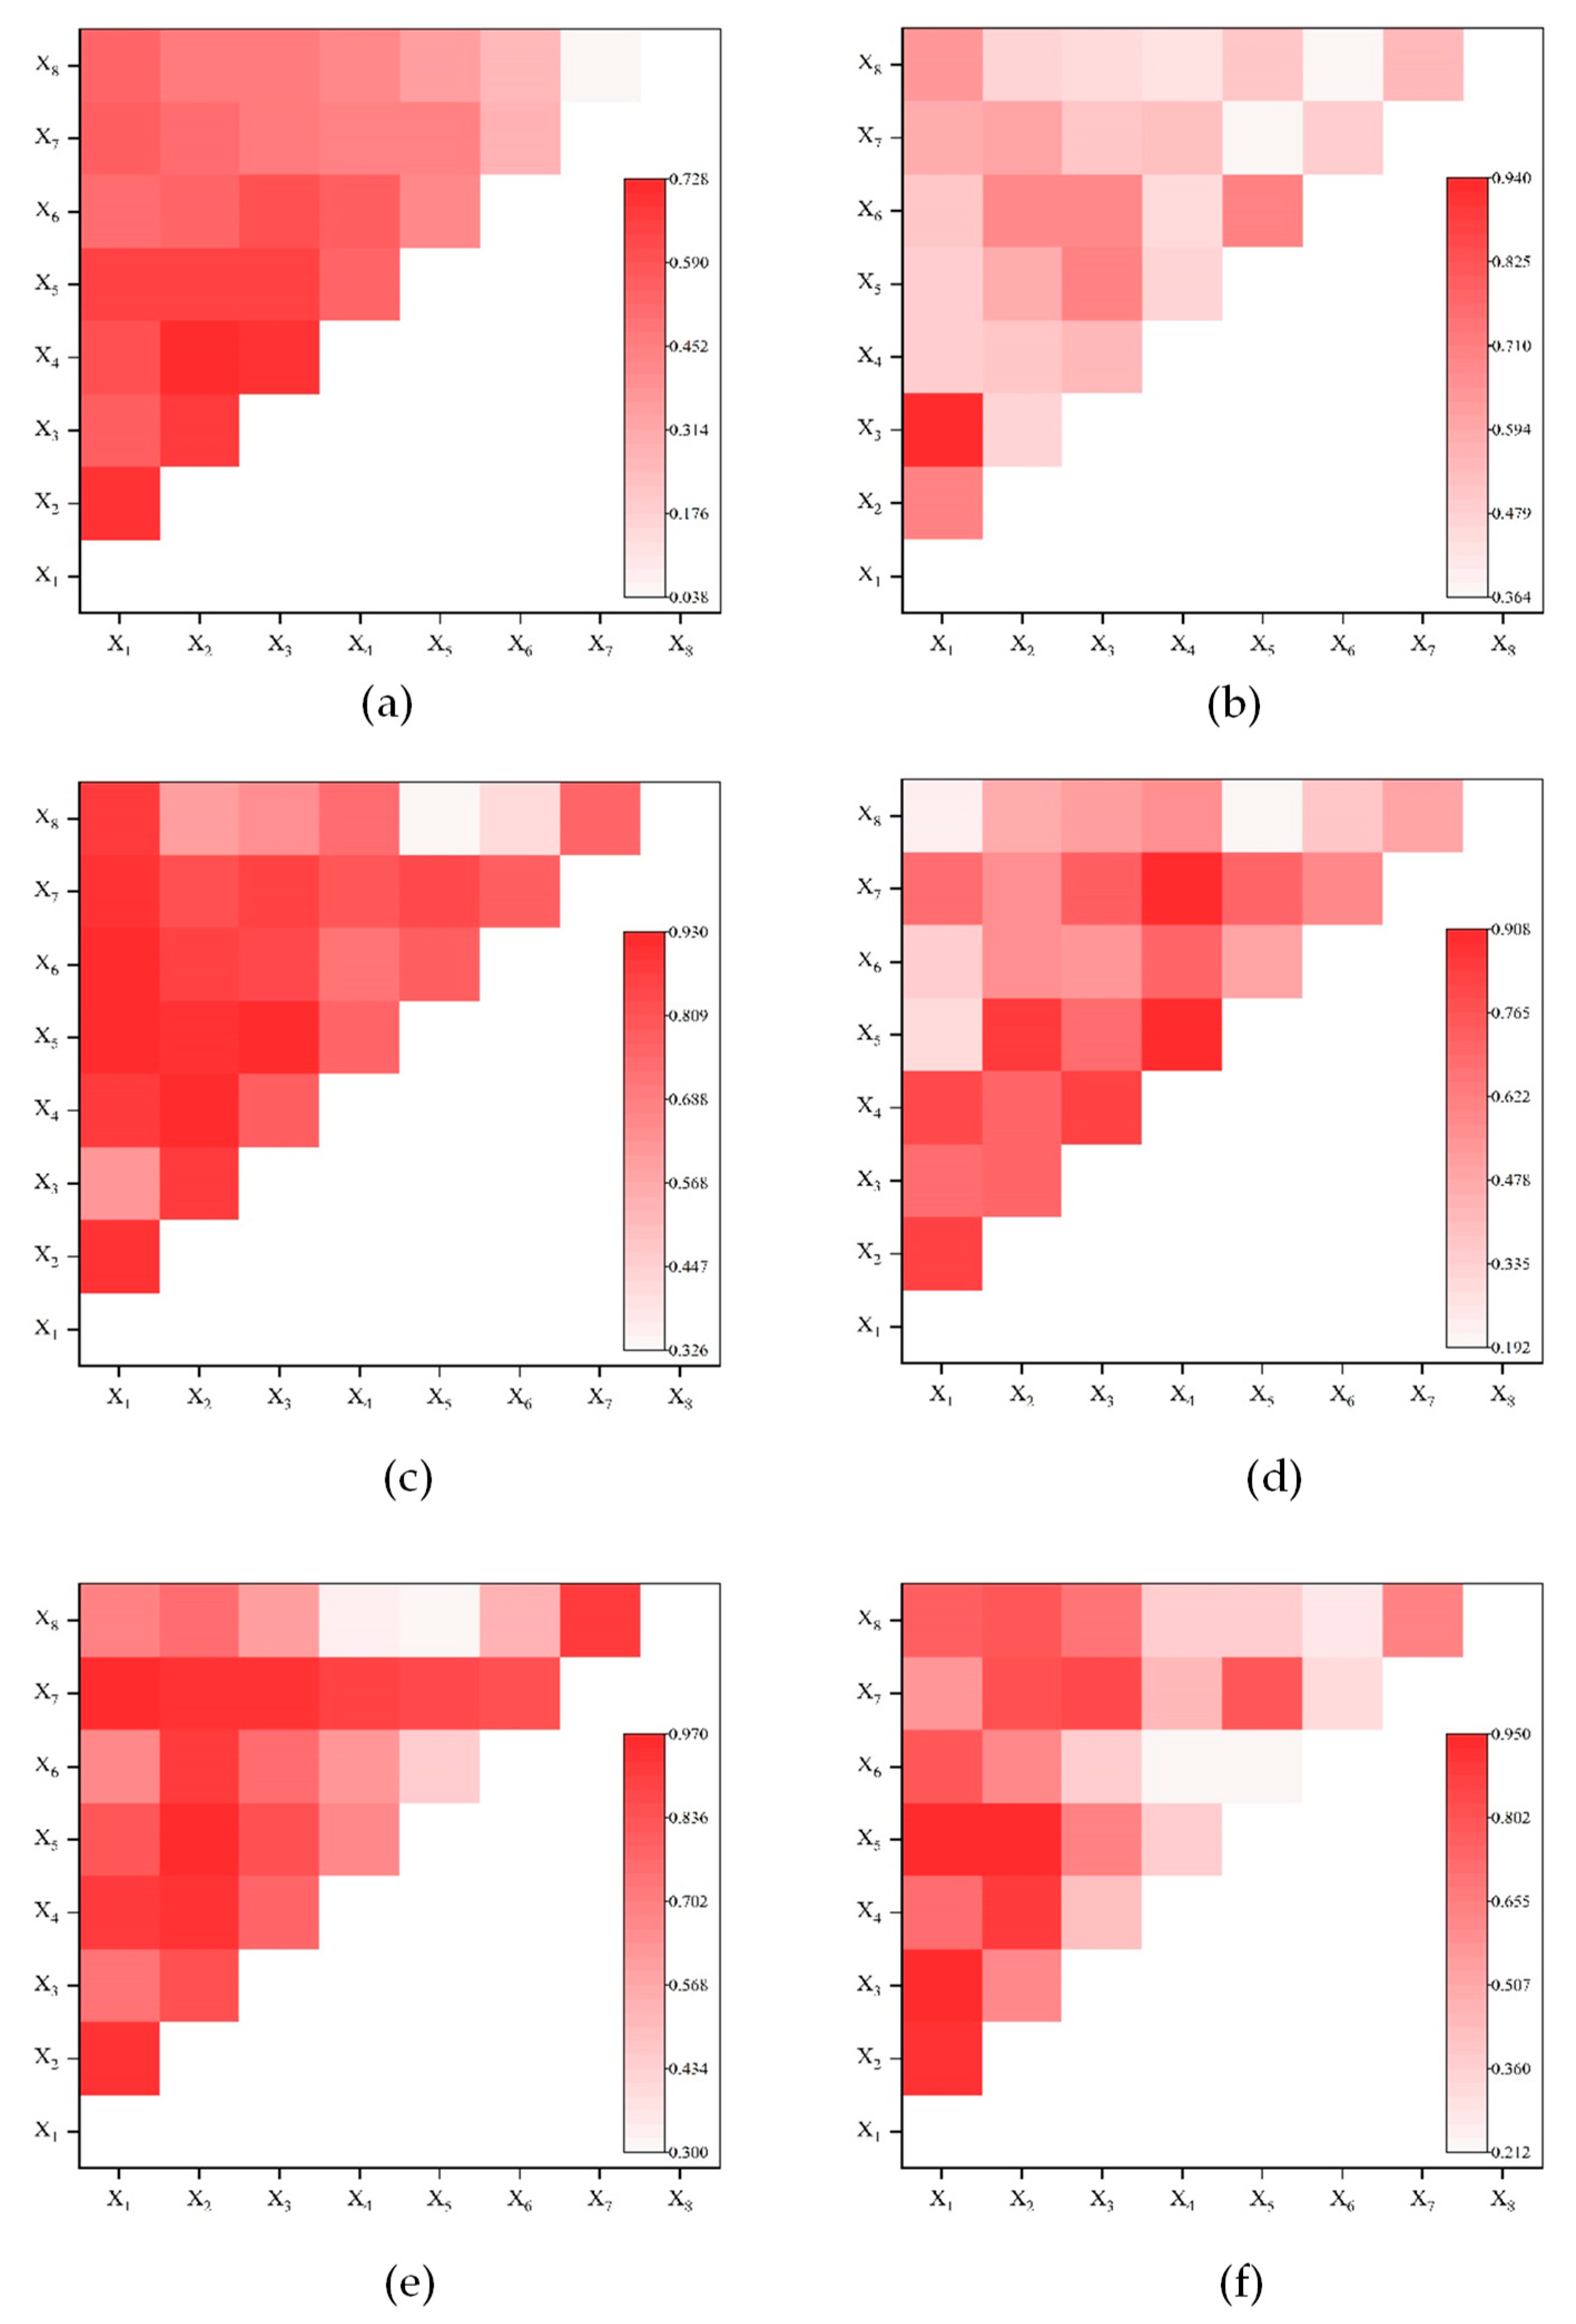
4.3. Factor Interaction Analysis
5. Discussion
6. Conclusions
Author Contributions
Funding
Data Availability Statement
Conflicts of Interest
References
- Ahlfeldt, G.M.; Feddersen, A. From Periphery to Core: Measuring Agglomeration Effects Using High-Speed Rail. J. Econ. Geogr. 2017, 18, 1–36. [Google Scholar] [CrossRef]
- Liu, X.; Jiang, C.; Wang, F.; Yao, S. The Impact of High-Speed Railway on Urban Housing Prices in China: A Network Accessibility Perspective. Transp. Res. Part A Policy Pract. 2021, 152, 84–99. [Google Scholar] [CrossRef]
- He, Y.; Sherbinin, A.D.; Shi, G.; Xia, H. The Economic Spatial Structure Evolution of Urban Agglomeration under the Impact of High-Speed Rail Construction: Is There a Difference between Developed and Developing Regions? Land 2022, 11, 1551. [Google Scholar] [CrossRef]
- Huang, Y.; Xu, W.A. Spatial and Temporal Heterogeneity of the Impact of High-Speed Railway on Urban Economy: Empirical Study of Chinese Cities. J. Transp. Geogr. 2021, 91, 102972. [Google Scholar] [CrossRef]
- Zhu, X.; Qian, T.; Wei, Y. Do High-Speed Railways Accelerate Urban Land Expansion in China? A Study Based on the Multi-Stage Difference-In-Differences Model. Socio-Econ. Plan. Sci. 2020, 71, 100846. [Google Scholar] [CrossRef]
- Sanchez-Mateos, H.S.M.; Givoni, M. The Accessibility Impact of a New High-Speed Rail Line in The UK–A Preliminary Analysis of Winners and Losers. J. Transp. Geogr. 2012, 25, 105–114. [Google Scholar] [CrossRef]
- Wenner, F.; Thierstein, A. High Speed Rail as Urban Generator? An Analysis of Land Use Change Around European Stations. Eur. Plan. Stud. 2021, 30, 1–24. [Google Scholar] [CrossRef]
- Hu, J.; Ma, G.; Shen, C.; Zhou, X. Impact of Urbanization through High-Speed Rail on Regional Development with the Interaction of Socioeconomic Factors: A View of Regional Industrial Structure. Land 2022, 11, 1790. [Google Scholar] [CrossRef]
- Geng, B.; Bao, H.; Liang, Y. A Study of The Effect of a High-Speed Rail Station on Spatial Variations in Housing Price Based on the Hedonic Model. Habitat Int. 2015, 49, 333–339. [Google Scholar] [CrossRef]
- Yin, P.; Pagliara, F.; Wilson, A. How Does High-Speed Rail Affect Tourism? A Case Study of the Capital Region of China. Sustainability 2019, 11, 472. [Google Scholar] [CrossRef] [Green Version]
- Dong, X. High-Speed Railway and Urban Sectoral Employment in China. Transp. Res. Part A Policy Pract. 2018, 116, 603–621. [Google Scholar] [CrossRef]
- Tveter, E. The Effect of Airports on Regional Development: Evidence from the Construction of Regional Airports in Norway. Res. Transp. Econ. 2017, 63, 50–58. [Google Scholar] [CrossRef]
- Newman, P.; Kenworthy, J. Sustainability and Cities: Overcoming Automobile Dependence; Island Press: Washington, DC, USA, 1999. [Google Scholar]
- Niu, F.; Xin, Z.; Sun, D. Urban Land Use Effects of High-Speed Railway Network in China: A Spatial Spillover Perspective. Land Use Policy 2021, 105, 105417. [Google Scholar] [CrossRef]
- Matas, A.; Raymond, J.L.; Roig, J.L. Evaluating the Impacts of HSR Stations on the Creation of Firms. Transp. Policy 2020, 99, 396–404. [Google Scholar] [CrossRef]
- Deng, T.; Gan, C.; Hu, Y. Do Hotel Business Benefit from Increased Tourist Accessibility? Evidence from China’s High-Speed Railway Program. Tourism Econ. 2020, 27, 1357–1374. [Google Scholar] [CrossRef]
- Tian, M.; Li, T.; Ye, X.; Zhao, H.; Meng, X. The Impact of High-Speed Rail on Service Industry Agglomeration in Peripheral Cities. Transp. Res. Part D Transp. Environ. 2021, 93, 102745. [Google Scholar] [CrossRef]
- Shao, S.; Tian, Z.; Yang, L. High Speed Rail and Urban Service Industry Agglomeration: Evidence from China’s Yangtze River Delta Region. J. Transp. Geogr. 2017, 64, 174–183. [Google Scholar] [CrossRef]
- Andersson, D.E.; Shyr, O.F.; Lee, A. The Successes and Failures of a Key Transportation Link: Accessibility Effects of Taiwan’s High-Speed Rail. Ann. Reg. Sci. 2012, 48, 203–223. [Google Scholar] [CrossRef]
- Wang, L.; Yuan, F.; Duan, X. How High-Speed Rail Service Development Influenced Commercial Land Market Dynamics: A Case Study of Jiangsu Province, China. J. Transp. Geogr. 2018, 72, 248–257. [Google Scholar] [CrossRef]
- Froeidh, O. Market Effects of Regional High-Speed Trains on The Svealand Line. J. Transp. Geogr. 2005, 13, 352–361. [Google Scholar] [CrossRef]
- Gao, Y.; Su, W.; Wang, K. Does High-Speed Rail Boost Tourism Growth? New Evidence from China. Tour. Manag. 2019, 72, 220–231. [Google Scholar] [CrossRef]
- Li, M.; Chen, J. High-Speed Rail Network in China: The Contribution of Fast Trains to Regional Tourism and Economic Development. Tour. Rev. 2019, 75, 414–432. [Google Scholar] [CrossRef]
- Banister, D.; Givoni, M. High-Speed Rail in the EU27: Trends, Time, Accessibility and Principles. Built Environ. 2013, 39, 324–338. [Google Scholar] [CrossRef] [Green Version]
- Yin, M.; Bertolini, L.; Duan, J. The Effects of The High-Speed Railway on Urban Development: International Experience and Potential Implications for China. Prog. Plann. 2015, 98, 1–52. [Google Scholar] [CrossRef] [Green Version]
- Banister, D.; Berechman, Y. Transport Investment and The Promotion of Economic Growth. J. Transp. Geogr. 2001, 9, 209–218. [Google Scholar] [CrossRef]
- Givoni, M. Development and Impact of the Modern High-speed Train: A Review. Transp. Rev. 2006, 26, 593–611. [Google Scholar] [CrossRef]
- Gui, W.; Zhang, X.; Wang, A. Research on Spatial Planning Evaluation of Beijing Shanghai High Speed Railway Station Based on Node-Place Model. J. Intell. Fuzzy Syst. 2021, 40, 733–743. [Google Scholar] [CrossRef]
- Tsai, Y.; Guan, J.; Chung, Y. Multilevel Spatial Impact Analysis of High-Speed Rail and Station Placement: A Short-Term Empirical Study of the Taiwan HSR. J. Transp. Land Use 2020, 13, 317–341. [Google Scholar] [CrossRef]
- Ortega, E.; López, E.; Monzón, A. Territorial Cohesion Impacts of High-Speed Rail at Different Planning Levels. J. Transp. Geogr. 2012, 24, 130–141. [Google Scholar] [CrossRef]
- Wang, S.; Wang, J.; Liu, X. How Do Urban Spatial Structures Evolution in The High-Speed Rail Era? Case Study of Yangtze River Delta, China. Habitat Int. 2019, 93, 102051. [Google Scholar] [CrossRef]
- Eom, J.K.; Lee, K.; Song, J.Y.; Lee, J. Analysis of Mobile Phone Data to Compare Mobility Flows and Hotspots Before and After the Opening of High-Speed Railway: Case Study of Honam KTX in Korea. Appl. Sci. 2020, 10, 5009. [Google Scholar] [CrossRef]
- Kamga, C. Emerging Travel Trends, High-Speed Rail, and the Public Reinvention of U.S. Transportation. Transp. Policy 2015, 37, 111–120. [Google Scholar] [CrossRef]
- Chatman, D.G.; Noland, R.B. Transit Service, Physical Agglomeration and Productivity in US Metropolitan Areas. Urban Stud. 2014, 51, 917–937. [Google Scholar] [CrossRef] [Green Version]
- Loukaitou-Sideris, A.; Cuff, D.; Higgins, T.; Linovski, O. Impact of High Speed Rail Stations on Local Development: A Delphi Survey. Built Environ. 2012, 38, 51–70. [Google Scholar] [CrossRef]
- Diao, M.; Zhu, Y.; Zhu, J. Intra-City Access to Inter-City Transport Nodes: The Implications of High-Speed-Rail Station Locations for the Urban Development of Chinese Cities. Urban Stud. 2017, 54, 2249–2267. [Google Scholar] [CrossRef]
- Li, L.; Lu, L.; Xu, Y.; Sun, X. The Spatiotemporal Evolution and Influencing Factors of Hotel Industry in the Metropolitan Area: An Empirical Study Based on China. PLoS ONE 2020, 15, e231438. [Google Scholar] [CrossRef] [PubMed]
- Han, Z.; Song, W. Identification and Geographic Distribution of Accommodation and Catering Centers. Int. J. Geo-Inf. 2020, 9, 546. [Google Scholar] [CrossRef]
- Yang, Y.; Wong, K.K.F.; Wang, T. How Do Hotels Choose Their Location? Evidence from Hotels in Beijing. Int. J. Hosp. Manag. 2012, 31, 675–685. [Google Scholar] [CrossRef]
- Fang, L.; Zhang, X.; Feng, Z.; Cao, C. Effects of High-Speed Rail Construction on The Evolution of Industrial Agglomeration: Evidence from Three Great Bay Areas in China. E M Eko. Manag. 2020, 23, 17–32. [Google Scholar] [CrossRef]
- Schütz, E. Stadtentwicklung durch Hochgeschwindigkeitsverkehr, Konzeptionelle und Methodische Absätze zum Umgang mit den Raumwirkungen des schienengebunden Personen-Hochgeschwindigkeitsverkehr (HGV) als Beitrag zur Lösung von Problemen der Stadtentwicklung, Informationen zur Raumentwicklungs. Heft 1998, 6, 369–383. [Google Scholar]
- Wang, L.; Youhui, C.; Kewen, L.; Wang, C. Spatial Distribution and Clusters of Industry Nearby High-speed Rail Station: The case of Nanjing Station, Shanghai-Nanjing Motor Train. Sci. Geogr. Sin. 2012, 32, 301–307. [Google Scholar] [CrossRef]
- Lu, C.; Pang, M.; Zhang, Y.; Li, H.; Lu, C.; Tang, X.; Cheng, W. Mapping Urban Spatial Structure Based on POI (Point of Interest) Data: A Case Study of the Central City of Lanzhou, China. Int. J. Geo-Inf. 2020, 9, 92. [Google Scholar] [CrossRef] [Green Version]
- Liu, K.; Yin, L.; Lu, F.; Mou, N. Visualizing and Exploring POI Configurations of Urban Regions on POI-Type Semantic Space. Cities 2020, 99, 102610. [Google Scholar] [CrossRef]
- McKenzie, G.; Janowicz, K.; Gao, S.; Gong, L. How Where is When? On the Regional Variability and Resolution of Geosocial Temporal Signatures for Points of Interest. Comput. Environ. Urban 2015, 54, 336–346. [Google Scholar] [CrossRef]
- Chang, Y.W.; Hsu, P.Y.; Lan, Y.C. Cooperation and Competition between Online Travel Agencies and Hotels. Tour. Manag. 2019, 71, 187–196. [Google Scholar] [CrossRef]
- Xie, Z.; Yan, J. Kernel Density Estimation of Traffic Accidents in A Network Space. Comput. Environ. Urban 2008, 32, 396–406. [Google Scholar] [CrossRef] [Green Version]
- Wang, F.; Chen, C.; Xiu, C.; Zhang, P. Location Analysis of Retail Stores in Changchun, China: A Street Centrality Perspective. Cities 2014, 41, 54–63. [Google Scholar] [CrossRef]
- Wang, J.; Li, X.; Christakos, G.; Liao, Y.; Zhang, T.; Xue, G.; Zheng, X. Geographical Detectors—Based Health Risk Assessment and its Application in the Neural Tube Defects Study of the Heshun Region, China. Int. J. Geo-Inf. 2010, 24, 107–127. [Google Scholar] [CrossRef]
- Aliagaoglu, A.; Ugur, A. Hotels as A Model of Regional Life: The Erzurum Sample. Eur. Plan. Stud. 2008, 16, 1405–1422. [Google Scholar] [CrossRef]
- Wang, S.; Mo, H.; Lv, H. Industrial Structure of High-Speed Railway Station Areas Under the Influence of Location: Empirical Evidences from POI Data. Acta Geogr. Sin. 2021, 76, 2016–2031. [Google Scholar] [CrossRef]
- Zheng, L.; Long, F.; Chang, Z.; Ye, J. Ghost Town or City of Hope? The Spatial Spillover Effects of High-Speed Railway Stations in China. Transp. Policy 2019, 81, 230–241. [Google Scholar] [CrossRef]
- Wang, L.; Zheng, W.; He, S.; Wei, S. Assessing Urban Vitality and Its Determinants in High-Speed Rail Station Areas in the Yangtze River Delta, China. J. Transp. Land Use 2022, 15, 333–354. [Google Scholar] [CrossRef]
- Fang, L.; Xie, Y.; Yao, S.; Liu, T. Agglomeration and/or Differentiation at Regional Scale? Geographic Spatial Thinking of Hotel Distribution-A Case Study of Guangdong, China. Curr. Issues Tour. 2021, 24, 1358–1374. [Google Scholar] [CrossRef]


| City Size | HSR Station | Population/mil. | Platforms | Tracks | Floorage/hm2 | Accommodation Facilities/num. |
|---|---|---|---|---|---|---|
| Supersized | Beijingnan | 17.75 | 10 | 20 | 32 | 483 |
| Tianjinxi | 10.93 | 13 | 26 | 18 | 478 | |
| Mega | Nanjingnan | 7.91 | 15 | 28 | 73 | 579 |
| Jinanxi | 5.88 | 8 | 17 | 10 | 291 | |
| Large | Kunshannan | 1.41 | 4 | 12 | 7.1 | 215 |
| Xuzhoudong | 2.05 | 13 | 28 | 4.5 | 94 |
| Station | 2011 | 2012 | 2013 | 2014 | 2015 | 2016 | 2017 | 2018 | 2019 | 2020 | 2021 |
|---|---|---|---|---|---|---|---|---|---|---|---|
| Beijingnan | 0.863 *** | 0.819 *** | 0.785 *** | 0.753 *** | 0.738 *** | 0.721 *** | 0.685 *** | 0.706 *** | 0.692 *** | 0.684 *** | 0.661 *** |
| Tianjinxi | 0.926 | 0.794 *** | 0.750 *** | 0.620 *** | 0.624 *** | 0.626 *** | 0.553 *** | 0.479 *** | 0.436 *** | 0.425 *** | 0.427 *** |
| Nanjingnan | 0.629 *** | 0.655 *** | 0.481 *** | 0.463 *** | 0.410 *** | 0.512 *** | 0.383 *** | 0.375 *** | 0.377 *** | 0.364 *** | 0.354 *** |
| Jinanxi | 103.211 | 2.107 | 2.107 | 1.288 | 1.037 | 0.816 ** | 0.529 *** | 0.471 *** | 0.429 *** | 0.434 *** | 0.395 *** |
| Kunshannan | 0.779 *** | 0.676 *** | 0.685 *** | 0.674 *** | 0.704 *** | 0.601 *** | 0.571 *** | 0.558 *** | 0.450 *** | 0.364 *** | 0.337 *** |
| Xuzhoudong | / | 130.166 | 4.761 | 1.145 | 0.600 *** | 0.507 *** | 0.440 *** | 0.460 *** | 0.382 *** | 0.354 *** | 0.358 *** |
| Index Type | Code | Detection Factor | Detection Indicator |
|---|---|---|---|
| Basic industry | X1 | Living service | Number of corresponding facilities in the grid |
| X2 | Catering service | ||
| X3 | Shopping service | ||
| Derivative industry | X4 | Business residence | |
| X5 | Enterprise | ||
| X6 | Financial insurance | ||
| Relevant industry | X7 | Sports leisure | |
| X8 | Scenic spot |
| Station | X1 | X2 | X3 | X4 | X5 | X6 | X7 | X8 |
|---|---|---|---|---|---|---|---|---|
| Beijingnan | 0.356 *** | 0.365 *** | 0.293 *** | 0.329 *** | 0.265 *** | 0.178 *** | 0.012 | 0.188 |
| Tianjinxi | 0.255 ** | 0.163 * | 0.211 *** | 0.214 ** | 0.116 * | 0.193 *** | 0.166 *** | 0.044 |
| Nanjingnan | 0.539 *** | 0.486 *** | 0.321 *** | 0.624 *** | 0.240 *** | 0.227 *** | 0.641 *** | 0.042 |
| Jinanxi | 0.117 | 0.320 *** | 0.280 *** | 0.524 *** | 0.104 | 0.219 *** | 0.426 *** | 0.031 |
| Kunshannan | 0.490 *** | 0.684 *** | 0.351 *** | 0.281 *** | 0.160 ** | 0.294 ** | 0.776 *** | 0.121* |
| Xuzhoudong | 0.519 *** | 0.535 *** | 0.308 *** | 0.148 *** | 0.118 | 0.073 | 0.228 *** | 0.166 *** |
Disclaimer/Publisher’s Note: The statements, opinions and data contained in all publications are solely those of the individual author(s) and contributor(s) and not of MDPI and/or the editor(s). MDPI and/or the editor(s) disclaim responsibility for any injury to people or property resulting from any ideas, methods, instructions or products referred to in the content. |
© 2023 by the authors. Licensee MDPI, Basel, Switzerland. This article is an open access article distributed under the terms and conditions of the Creative Commons Attribution (CC BY) license (https://creativecommons.org/licenses/by/4.0/).
Share and Cite
Niu, B.; Yin, P.; Shen, P. Industrial Spatio-Temporal Distribution of High-Speed Rail Station Area from the Accommodation Facilities Perspective: A Multi-City Comparison. Land 2023, 12, 332. https://doi.org/10.3390/land12020332
Niu B, Yin P, Shen P. Industrial Spatio-Temporal Distribution of High-Speed Rail Station Area from the Accommodation Facilities Perspective: A Multi-City Comparison. Land. 2023; 12(2):332. https://doi.org/10.3390/land12020332
Chicago/Turabian StyleNiu, Bingjie, Ping Yin, and Pengxia Shen. 2023. "Industrial Spatio-Temporal Distribution of High-Speed Rail Station Area from the Accommodation Facilities Perspective: A Multi-City Comparison" Land 12, no. 2: 332. https://doi.org/10.3390/land12020332