Article

The Role of Brownfields and Their Revitalisation for the Functional Connectivity of the Urban Tree System in a Regrowing City

1
Landscape Ecology Lab, Department of Geography, Humboldt University Berlin, 10099 Berlin, Germany
2
Department of Urban and Environmental Sociology, Helmholtz-Centre for Environmental Research—UFZ, 04318 Leipzig, Germany
3
Department of Computational Landscape Ecology, Helmholtz-Centre for Environmental Research—UFZ, 04318 Leipzig, Germany
*
Author to whom correspondence should be addressed.
Land 2023, 12(2), 333; https://doi.org/10.3390/land12020333
Submission received: 6 December 2022 / Revised: 20 January 2023 / Accepted: 23 January 2023 / Published: 26 January 2023

Abstract

:
The connectivity of green infrastructure facilitating the movement of organisms is the key to strengthening biodiversity in cities. Brownfields are a valuable land resource, with their revitalisation as a Nature Based Solution high on the policy agenda. In supporting cities which simultaneously aim for densification and the maintenance or further development of greenery, this paper develops a model for identifying and prioritising the role of revitalised and prevailing brownfields for the connectivity of green infrastructure using the example of Leipzig, Germany. Comparing metrics between land use categories, brownfields have a central role as stepping stones, with a value of 13%, while revitalised brownfields substantially contribute to global connectivity, with a value of 87% being equally important, for example, with Leipzig’s central parks. This paper’s spatial-explicit network approach provides a complementary planning tool for prioritising brownfields and the added value of their renaturing by identifying (a) strategic functional corridors formed by brownfields, (b) the connectivity relevance and exposure of individual brownfields, and (c) how renatured brownfields would strengthen existing corridors and form alternative paths. This paper presents an approach using freely available software tools and high-resolution canopy data as a proxy for functional connectivity which serves as a standardised and comparable ex-ante evaluation of NBS strategies being implemented in other cities.

1. Introduction

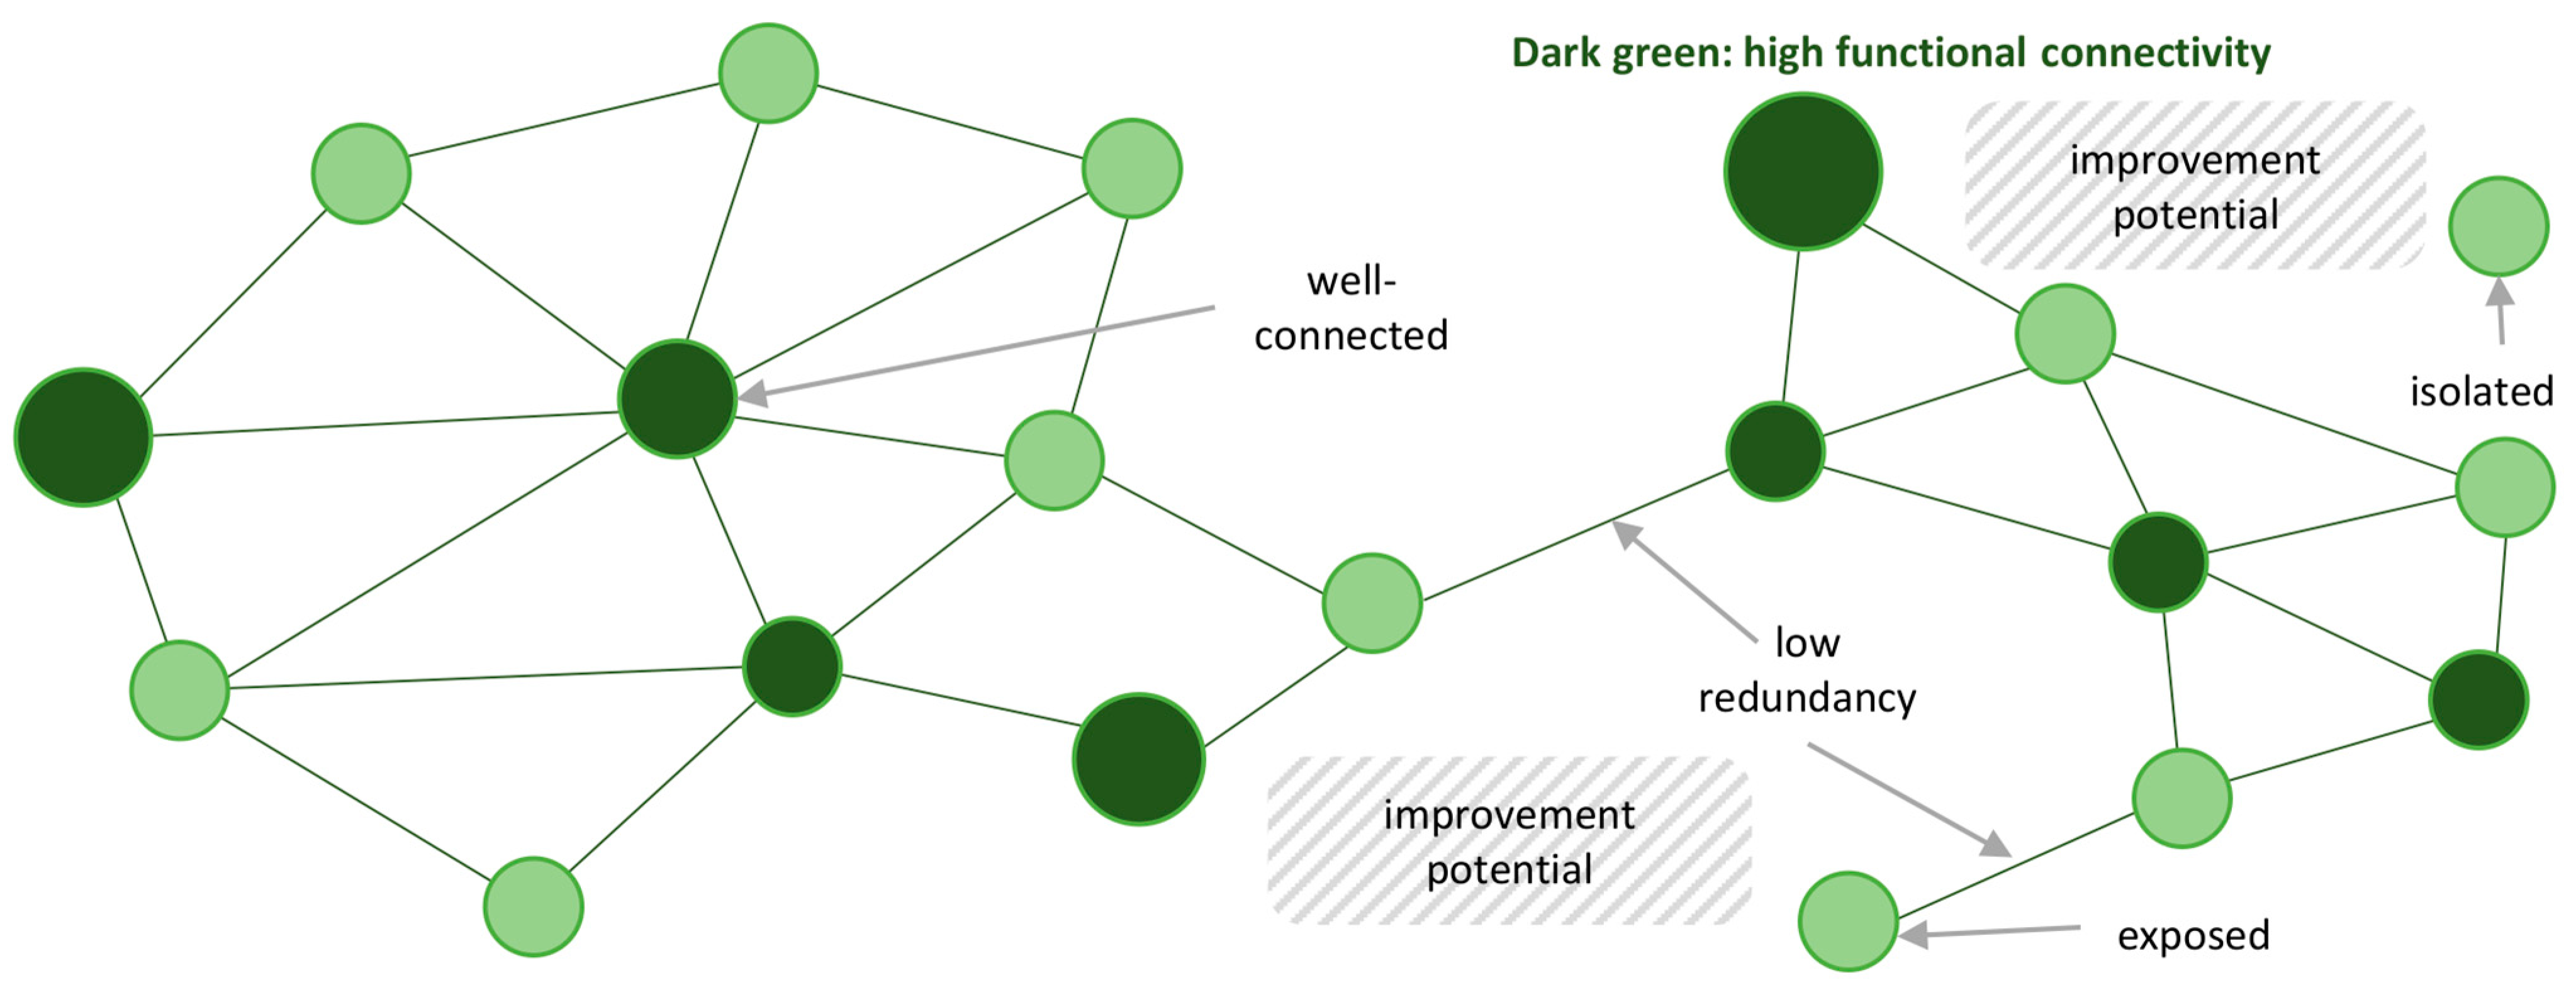
1.1. Functional Connectivity in Densifying Cities

There is a quest to develop more sustainable and liveable cities under the current trend of urbanisation [1,2]. Notably, the spatial availability and configuration of urban tree systems (UTS) support cities in this endeavour by providing social and ecological functions, supporting natural and ecological processes, fostering human health and wellbeing, and being linked via flows of benefits [3]. In particular, UTS, the cumulated spatial arrangement of woody vegetation, can provide a means for enabling wildlife movement through a less suitable matrix and across barriers [4,5]. Their connectivity is especially challenged when UTS are rare or fragmented, such as in cities [6,7,8]. Given the heterogeneity of land use in cities, any changes within the complex land use network essentially impact the functional connectivity of UTS in cities [9]. Against this background, we question the added value of revitalisation measures as well as existing brownfields as a valuable land resource for functional connectivity in a regrowing city.
Functional connectivity, defined as the extent to which favoured areas are linked up, is positively related to biodiversity [4,10]. In particular, canopy cover is a central factor as it offers sites for habitat, food, shelter, nesting, etc.; thus, the species richness is greater the larger the canopy patches are [11,12]. The functional connectivity between canopy patches facilitates the movement of genes, individuals, populations, and species [13,14,15,16], and allows the recolonisation of empty habitat patches [17], the migration and persistence of metapopulations [18], and the ability of species to expand or alter their range in response to climate change [19,20,21]. However, these benefits differ with each species as a different behaviour applies with respect to the use of, responses to, and movements within a network that translates, e.g., into different dispersal distances [4,22]. For connectivity analysis in cities, breeding birds are a commonly used taxa and representative indicators of the abundance of other taxa inhabiting an urban area [23].
For the functional connectivity of UTS, especially small tree patches, private gardens, residential yards, or brownfields act as stepping stones for organisms being able to move through a densely built matrix [24,25]. In particular, brownfields are a valuable and non-renewable land resource but have been largely undervalued by city officials for their ecological value [4]. Instead, the revitalisation of brownfields as a Nature Based Solution (NBS) strategy is high on the policy agenda [26], and is as understood as any measure of remediation, renaturation, restoration, or redensification on former brownfields. In line with the Leipzig Charter of 2007, many German cities such as this paper’s case study, Leipzig, seek to significantly reduce land take and create more valuable open and green space. After decades of severe shrinkage, Leipzig has experienced dynamic population regrowth from 2012 onwards. Framed by an integrated urban development concept for 2009–2020, the city simultaneously aims for structural densification as well as the maintenance, further development, and qualification of urban greenery [27]. With brownfields being the key for this double strategy, their revitalisation is a mixed blessing. On the one hand, the renaturation of brownfields brings more and diverse natural features into the urban setting, strengthening also the functional connectivity of UTS. On the other hand, redensification of brownfields can support cities in limiting land consumption and prevent urban sprawl with the associated disappearance of network features in other parts [26]. However, the construction and soil-sealing on former brownfields makes important biodiversity stepping stones disappear. Between 1998 and 2020, 6900 brownfield sites with a total area of 980 hectares have been revitalised, while 2946 brownfield sites still existed with a total area of 835 ha. Approximately 20% of the area revitalised was due to greening measures such as pocket parks or urban forest.
Given this big pool of revitalised and prevailing brownfields, there is a strong need for evidence-based support for future land use decisions facing the double challenge of infill-driven densifying and maintaining or developing further greenery. This decision-support should be based on lessons learnt from current revitalisation strategies. There is also a need for a prioritisation of brownfields which needs to be kept for ensuring functional connectivity of the urban green infrastructure, those which could potentially be densified, and those which need to be revitalised/renatured, fostering the overall connectivity for urban wildlife conservation.
Against this background, this paper develops a data-driven model that enables the place-based identification, visualisation, and prioritisation of the role of revitalised and prevailing brownfield sites for the functional connectivity of UTS in the regrowing city of Leipzig with respect to:
(1)
Spatial explicit elicitation of the importance of canopy patches for functional connectivity;
(2)
Evaluating the contribution of different revitalisation strategies for functional connectivity in a temporal perspective;
(3)
Detection of brownfield sites which are the key as stepping stones for preserving and fostering strategic functional connectivity corridors.

1.2. Conceptual–Theoretical Background

Functional connectivity is the probability of movement of species between all resource patches in an ecological network [4,22]. This network can include many different components. Cores are areas of high habitat quality, while stepping stones are small areas that build corridors for the movement of species by serving as islands in between larger core areas, even though they may not be directly physically connected [28]. These stepping stones are typically not important, for example, as major sources of recruitment, but rather for the long-term genetic flow through barriers [4].
High connectivity implies a high level of traversability, “i.e., the ability for an organism to reach over long distances in the landscape by moving from patch to patch” ([9], p. 33). From a structural perspective, connectivity is the extent to which patches are linked physically, referring to a characterisation of landscapes from a human perspective and scales [29]. Although being easy to understand, measure, and communicate, it does not consider how species actually move through and use the landscape [4]. In contrast, functional connectivity is the degree to which the landscape facilitates or impedes movement among patches [30]. It indicates how a network is used and combines the effects of both the physical landscape structure and the behaviour, movement, or ecological requirements of a particular species in that landscape [31,32]. Physically disconnected green spaces can be functionally connected via stepping stones establishing potential biological corridors which mirror species’ habits with high operability in ensuring the integrity and continuity of the urban ecological process [29,33,34].
For modelling connectivity, different approaches exist based on circuit theory, least cost path, and graph theory models [35]. The first two models measure movement between patches in a landscape represented as cost surface referring to, e.g., roads, water bodies, or green stripes [36]. High costs represent high resistances to movement. Circuit theory uses linear algebra to determine paths with higher or lower costs to be weighted regarding their potential to aid movement and estimates distance resistances assuming that species movement is random and driven by landscape exploration rather than landscape familiarity [37,38]. In contrast, least cost path models are based on raster analysis, in which each raster cell is defined according to the level of barrier. An algorithm finds a path from two designated points that costs the least in terms of the predetermined ratings of each raster cell and creates least cost distances [39]. Both circuit theory and least cost path modelling assume that species have complete knowledge of the landscape and always choose to move within the most optimal route [40].
In contrast, graph theory modelling measures the efficiency of movement flows between patches and estimates the importance of individual landscape elements against their overall connectivity contribution of the ecological network [41]. This is particularly beneficial in fragmented and perforated landscapes such as cities [42]. In particular, network analysis based on graph theory provide a powerful method for the analysis of complex systems [43,44]. The network is represented by a graph, consisting of a set of nodes and links based on a real-world landscape [10,45]. A node represents a patch important for habitat, while a link represents dispersal [46]. This graphical representation offers an adequate portrayal of real functional connectivity in relation to the required amount of input data and allows for different dispersal distances of species to be accounted for [9,47].
A central technique for finding patches important for functional connectivity is the removal of one patch (i.e., one node) at a time and recording the corresponding change of the connectivity index [44,48]. When based on species dispersal, e.g., via Euclidean distance units or number of links, this technique can even translate into changes in ecosystem services and ecological flows [10,49,50].
Impacts on the network, e.g., by building construction or brownfield revitalisation, affect the connectivity potential in specific sites and vice versa [46]. Thus, a high link redundancy in the network makes it more resilient to the removal of links or nodes [51]. The lower the redundancy, the less alternative routes through the network are available, i.e., for areas with high functional connectivity potential (Figure 1). Consequently, the corresponding nodes are increasingly exposed to small changes in the network, as these changes have immense consequences for the local patch, which can ultimately become isolated [10]. The exposure or isolation of these patches can be mitigated, for example, by restoring links and adding redundancy.

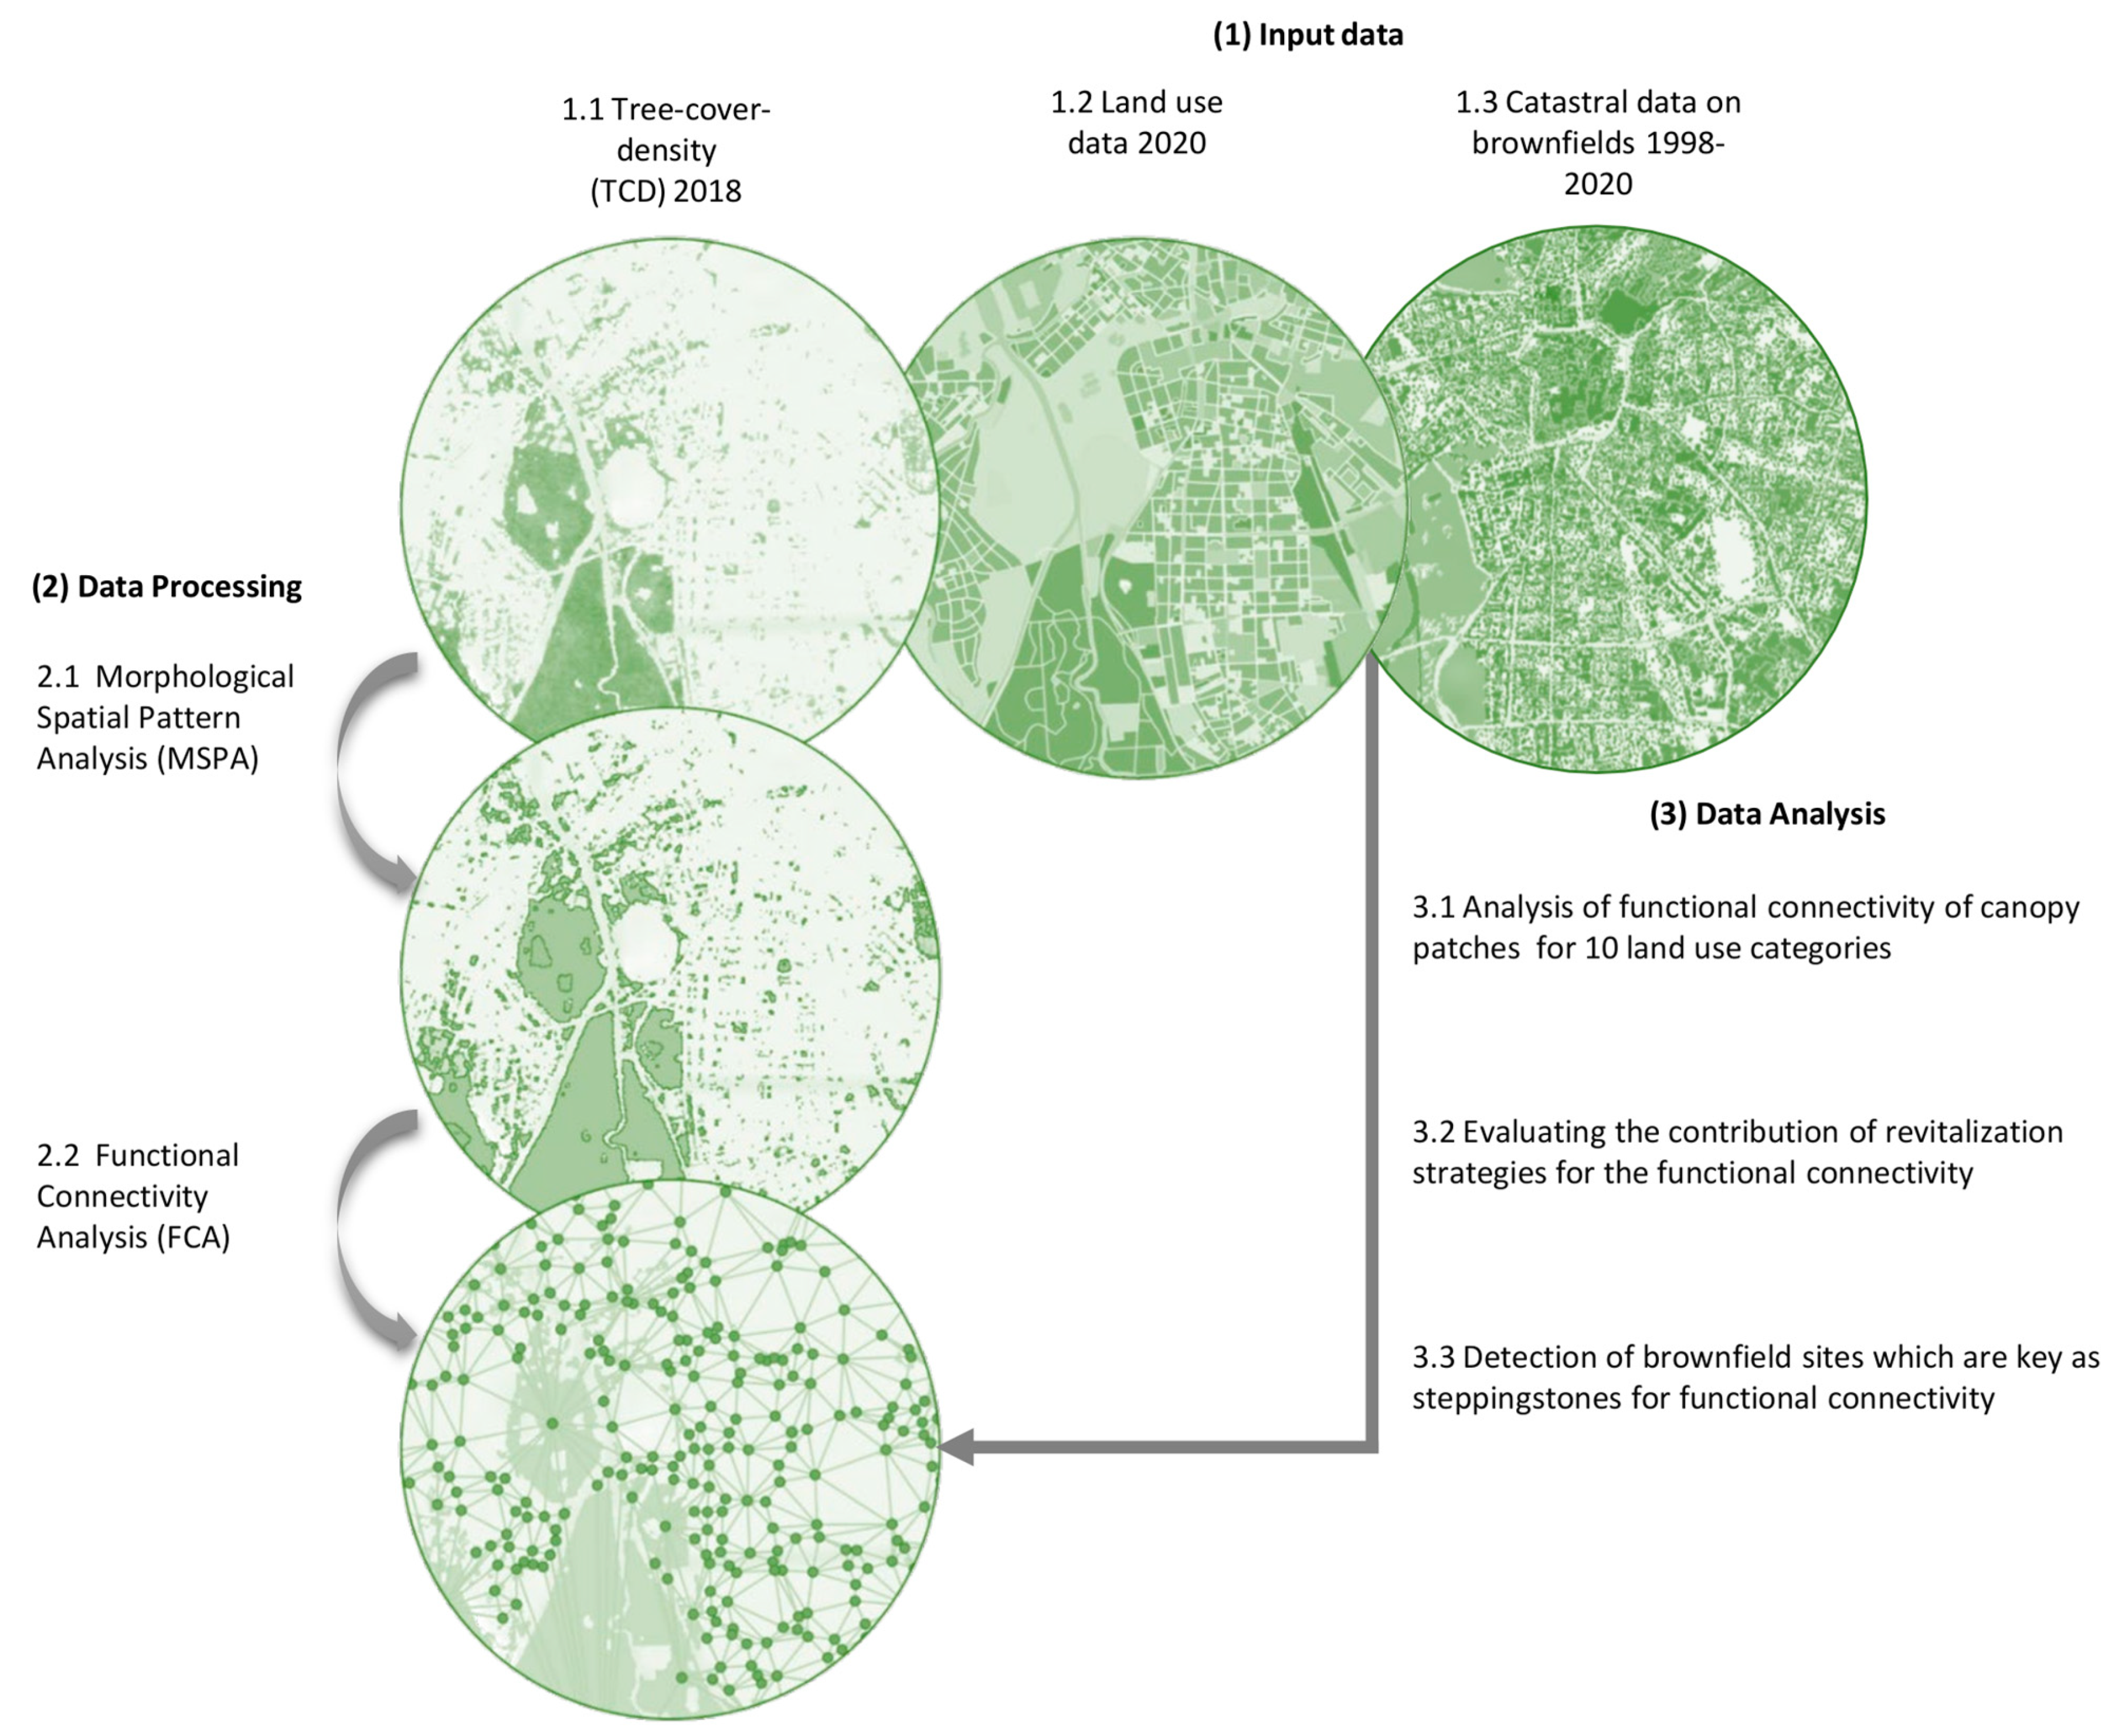
2. Materials and Methods

2.1. Case Study

After World War II, Leipzig experienced long-term population losses which were especially severe during the early 1990s [52]. As a consequence of the closure and abandonment of commercial and industrial areas, the city suffered from an enormous number and surface area of brownfield sites. Between 1990 and 2014, the number of brownfield sites rose from 3000 to 3800 and comprised an area of 1050 ha [27]. By the turn of the century, the population recovered and since 2012, Leipzig has seen considerable growth rates accompanied by the upgrading and heightening of existing residential houses, the construction of new houses, and increasing pressure on brownfields [53]. Benefiting from massive public and private interventions and investment, the share of brownfields in the total area decreased from 3.5% in 2014 to 3.3% in 2017 (~980 ha, [27,54]). In 2020, 2946 brownfield sites existed with a total area of 835 ha. While many of the larger sites are industrial brownfields or conversion areas of railroad and military facilities, the majority of brownfields are comparably small as they basically form gaps between buildings [55]. An important characteristic of the brownfield stock in Leipzig is, however, the high proportion that are private property, numbering approximately 67%. Only 15% are owned by the city of Leipzig, 8% by a large housing company (LWB), and 10% are distributed among other owners such as German Railway (DB AG) or a big commercial real estate company (TLG) [27].
Brownfields represent an important area pool for the strategic sustainable development of the city in facing dynamic population growth and its challenges. This aspect was implemented in Leipzig’s first integrated urban development concept SEKO 2009 (updated 2015), which was replaced by a new integrated urban development concept, Leipzig 2030 INSEK, in 2020. Brownfields have been used for extensive urban revitalisation measures, including the upgrading of structurally disadvantaged neighbourhoods and as compensation for new industrial or commercial areas at the fringe. Furthermore, former industrial buildings were often converted into residential properties, gaps between buildings were filled with new housing, or several kindergartens and schools were built. In contrast, permit agreements enabled the temporary use of fallow areas as green, sports, or play areas, while approx. EUR 1.25 million was invested in the renaturation of brownfield sites between 1997 and 2004. Yet, the average area of the revitalised sites is smaller compared to the still existing brownfield sites. Between 1998, the year that statistics on brownfield sites were first gathered, and 2020, 6900 brownfield sites with a total area of 980 ha have been revitalised (Figure S1a).

2.2. Data Input

We used three data sources as input for our analysis. First, for the land use information, we used the highly precise ATKIS (the Official Topographic-Cartographic Information System) data for 2020 which is captured from high-resolution orthophotos at a scale of 1:10,000 [56]. Collectively, 42 land use classes have been classified to 10 land use categories of green infrastructure according to an established typology ([57], Figure S1b). Second, we used Leipzig’s official cadastral information on brownfields (INKOBRA), which covers spatial data on existing brownfields, construction sites, and revitalised brownfields for the years between 1998 and 2020 [58]. Revitalised brownfields further contain information about the year and the measurement of revitalisation that we classified into six categories. Third, we used a freely available and high-resolution dataset on Tree Cover Density (TCD) for the reference year 2018 (10 m resolution, [59]). A benefit of this high resolution is that a pixel illustrates a larger tree, which increases the representativeness of a real existing tree functioning as a breeding habitat [60]. As ecological processes such as bird dispersal are not limited to administrative boundaries, a 1 km buffer was applied around the boundary of the city in order to clip the TCD dataset (Figure S1c).

2.3. Data Processing

The clipped TCD was subsequently processed using Morphological Spatial Pattern Analysis (MSPA) and Functional Connectivity Analysis (FCA). The MSPA (Figure 2) was performed using Guidos Toolbox, a holistic platform for the analysis of composition, connectivity, and fragmentation of habitats. It is an efficient tool to determine structural connectivity approaches since it is independent from any faunal species interaction [61]. MSPA is an image processing method that uses a binary image with land use information as an input [62]. MSPA was set up by a standard edge width of 1 pixel (10 m) and 8-pixel connectivity (border and corner pixel connectivity). The algorithm segments each canopy pixel into seven mutual canopy categories (Figure S1d). We used the following four classes in line with previous studies: canopy cores, edges, islets, and bridges [25].
These four classes with a minimum patch area of 0.1 ha, representing habitats for breeding birds [63], have been used for performing FCA using Graphab (Figure 2). Graphab is a tool for modelling ecological networks based on graph theory that focuses on the behavioural interactions of a targeted species for functional connectivity calculation [64]. We created planar networks as usually being applied in functional connectivity analysis: a node within the graph only connects directly to its geographically adjacent nodes surrounding it and, consequently, must connect to more distant nodes by passing through stepping-stone nodes [8]. Based on a broad literature consultation on breeding birds in urban ecosystems, the following dispersal distances were applied [9,14,46,65]: 200 m as the minimum distance, 400 m as the maximum distance, and 800 m in order to account for distance outliers and to demonstrate the sensitivity of connectivity values against the regular increase of dispersal distance [66]. For each distance, we calculated the connectivity metrics and used the average of the three dispersal distances in order to obtain a more comprehensive ecological network [67].
Among connectivity metrics, the probability of connectivity (PC) is one of the most feasible metrics for accounting for the behavioural response of species to the landscape elements [68]. The PC expresses the probability that two individuals randomly placed within the landscape manage to come into contact, either because they are located in the same patch of habitat or because they are in two patches connected to each other [41]. The value ranges between 0 (no chance that two individuals meet because the study area contains no habitat) and 1 (100% chance that two individuals are connected, which is possible only if the study area is fully constituted of habitat).
This study used four metrics which are based on the probabilistic connection graph model of PC allowing for continuous modulation of the connection strength or dispersal feasibility. First, for evaluation of the importance of nodes and edges for the functional connectivity, this study used the delta PC (dPC) as a powerful indicator for prioritising landscape elements for their habitat function of urban wildlife widely used in conservation planning [69]. The dPC value equals the percentage decrease in PC if this element is removed and is, hence, a relative measure of the contribution of a node or an edge to the functional connectivity of the whole network [49,70]. The global PC is calculated in the initial state, a patch is removed from the graph, and the global metric is recalculated. The difference between the two values is implemented in the removed patch, reflecting the loss of connectivity generated if this element is removed. This calculation is then applied to each of the nodes and edges, thus making it possible to prioritise them according to their contribution to the overall connectivity. The result of the delta PC (dPC) is therefore local, but with reference to the global level.
Second, in order to assess why a patch is important for overall connectivity, we used the decomposed dPC, which is expressed in three metrics (their sum is equal to the dPC value; [70,71]):
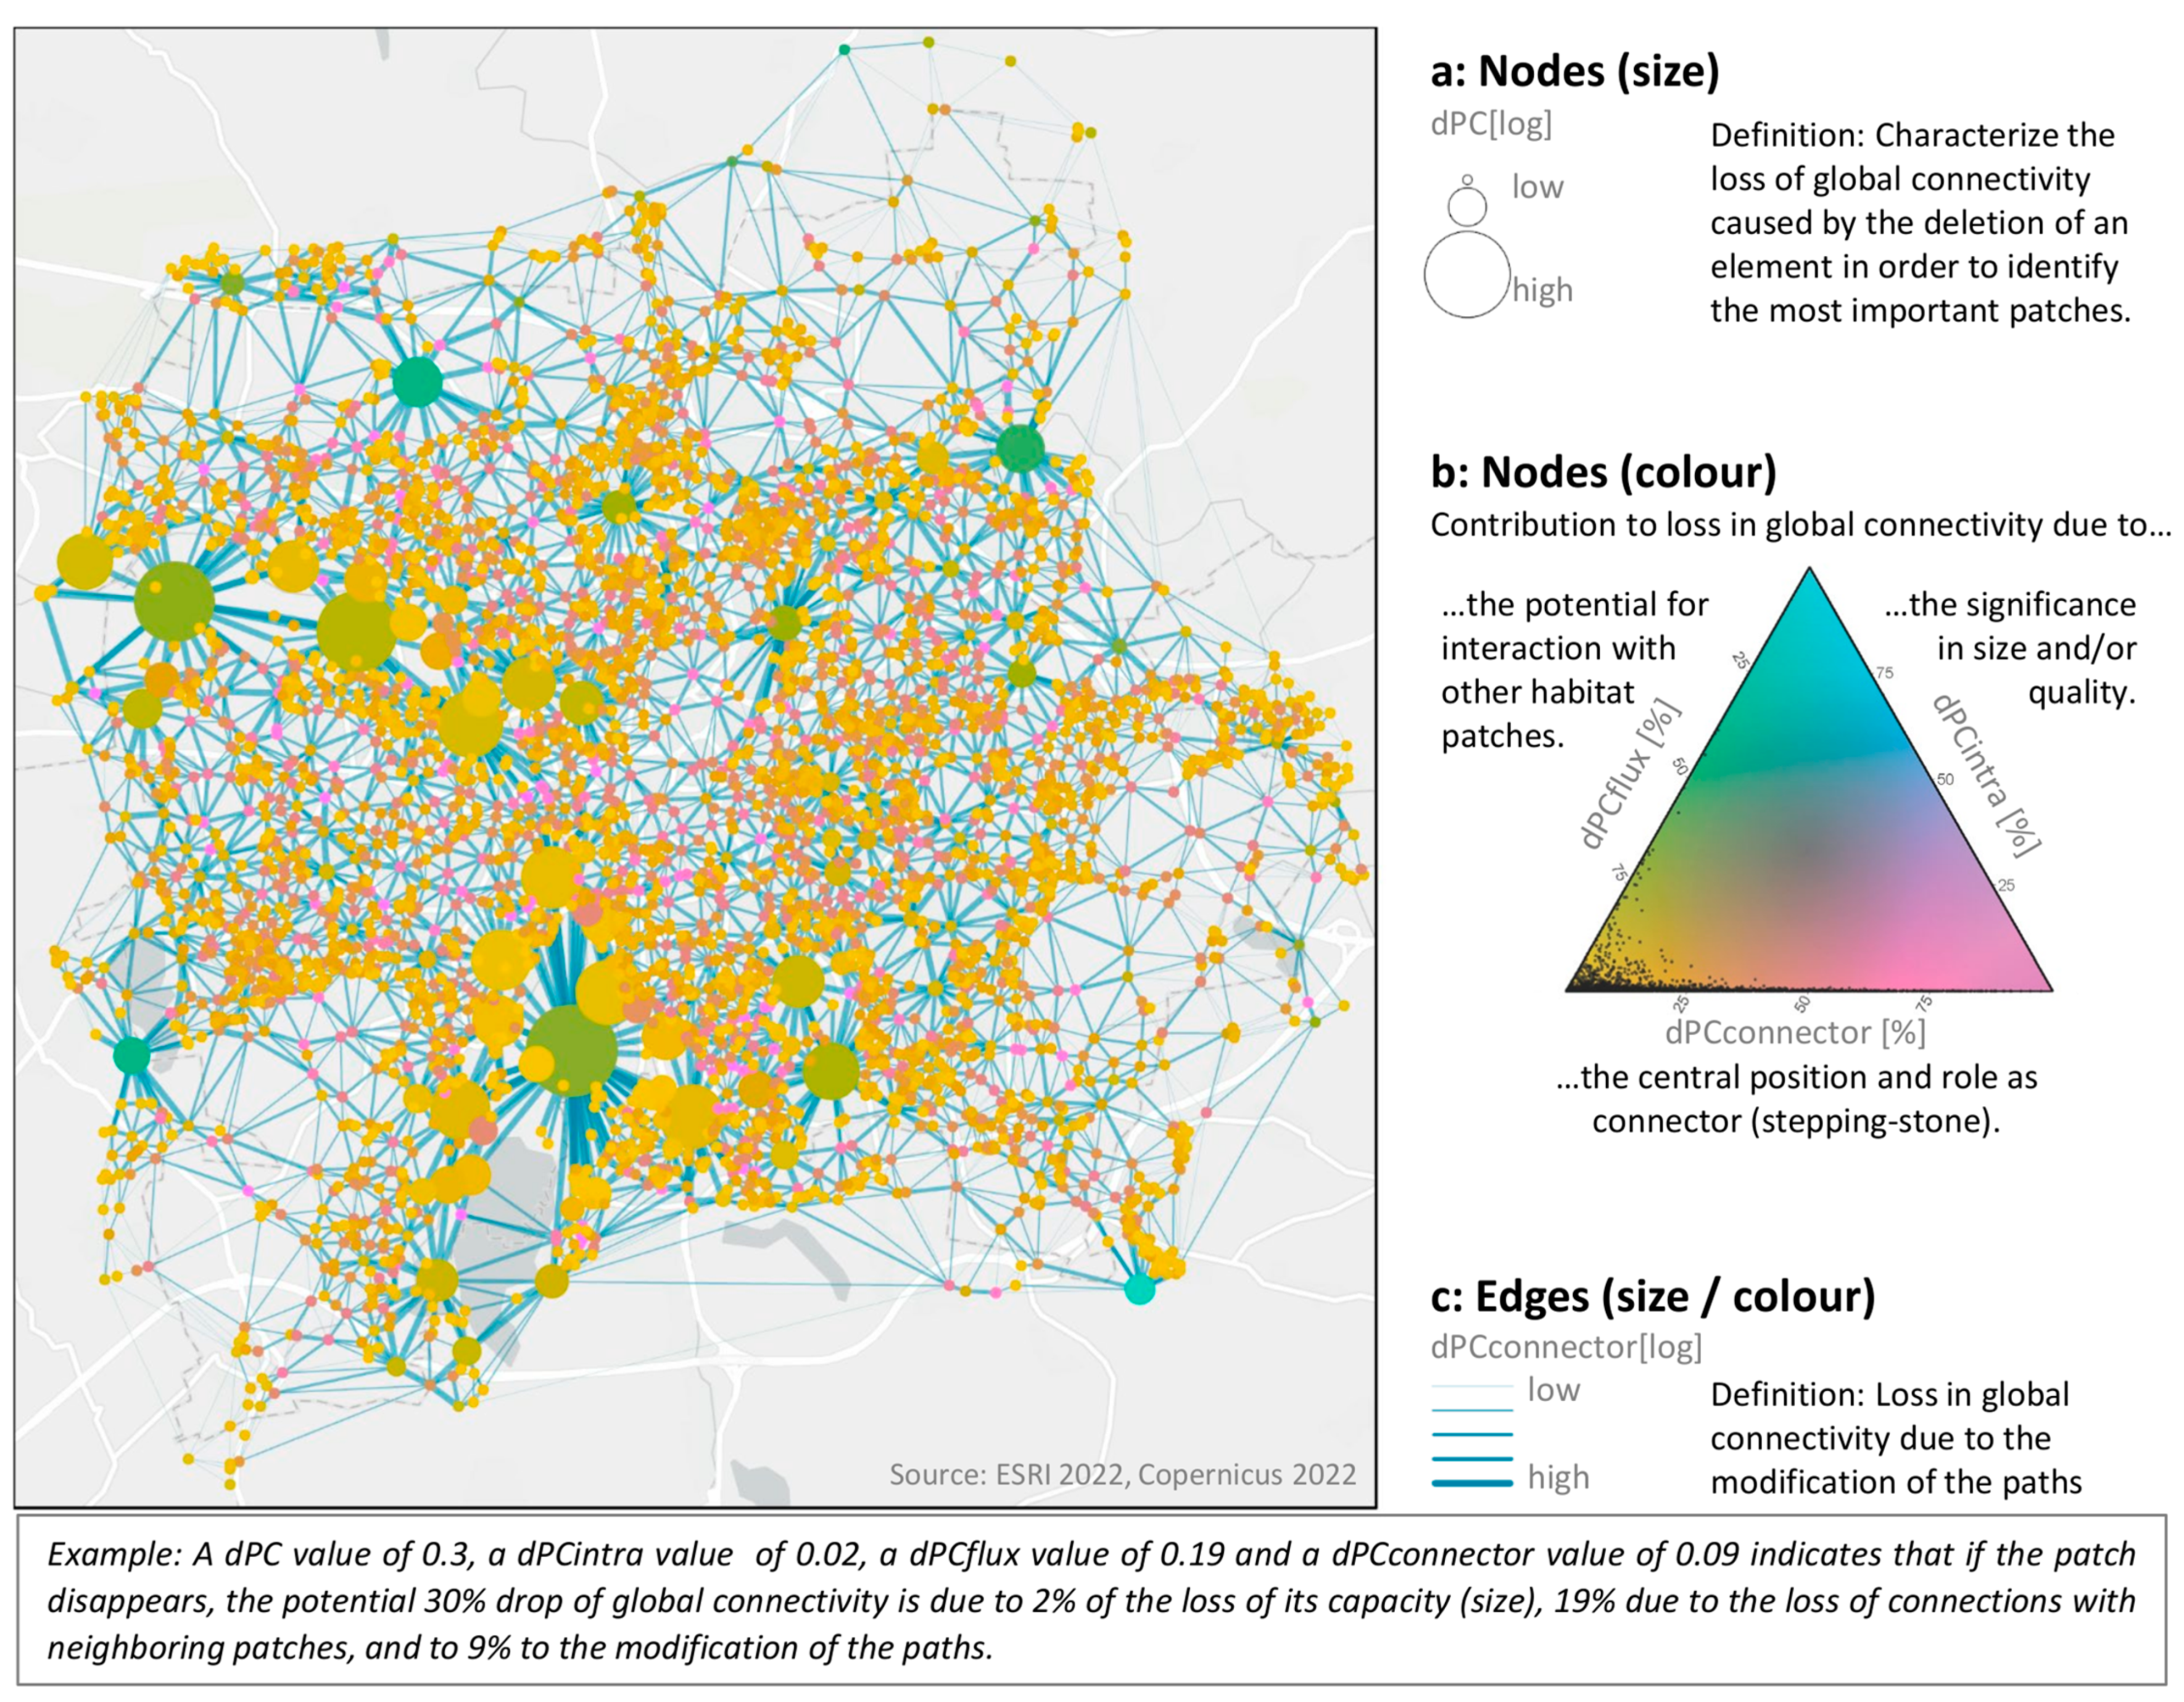
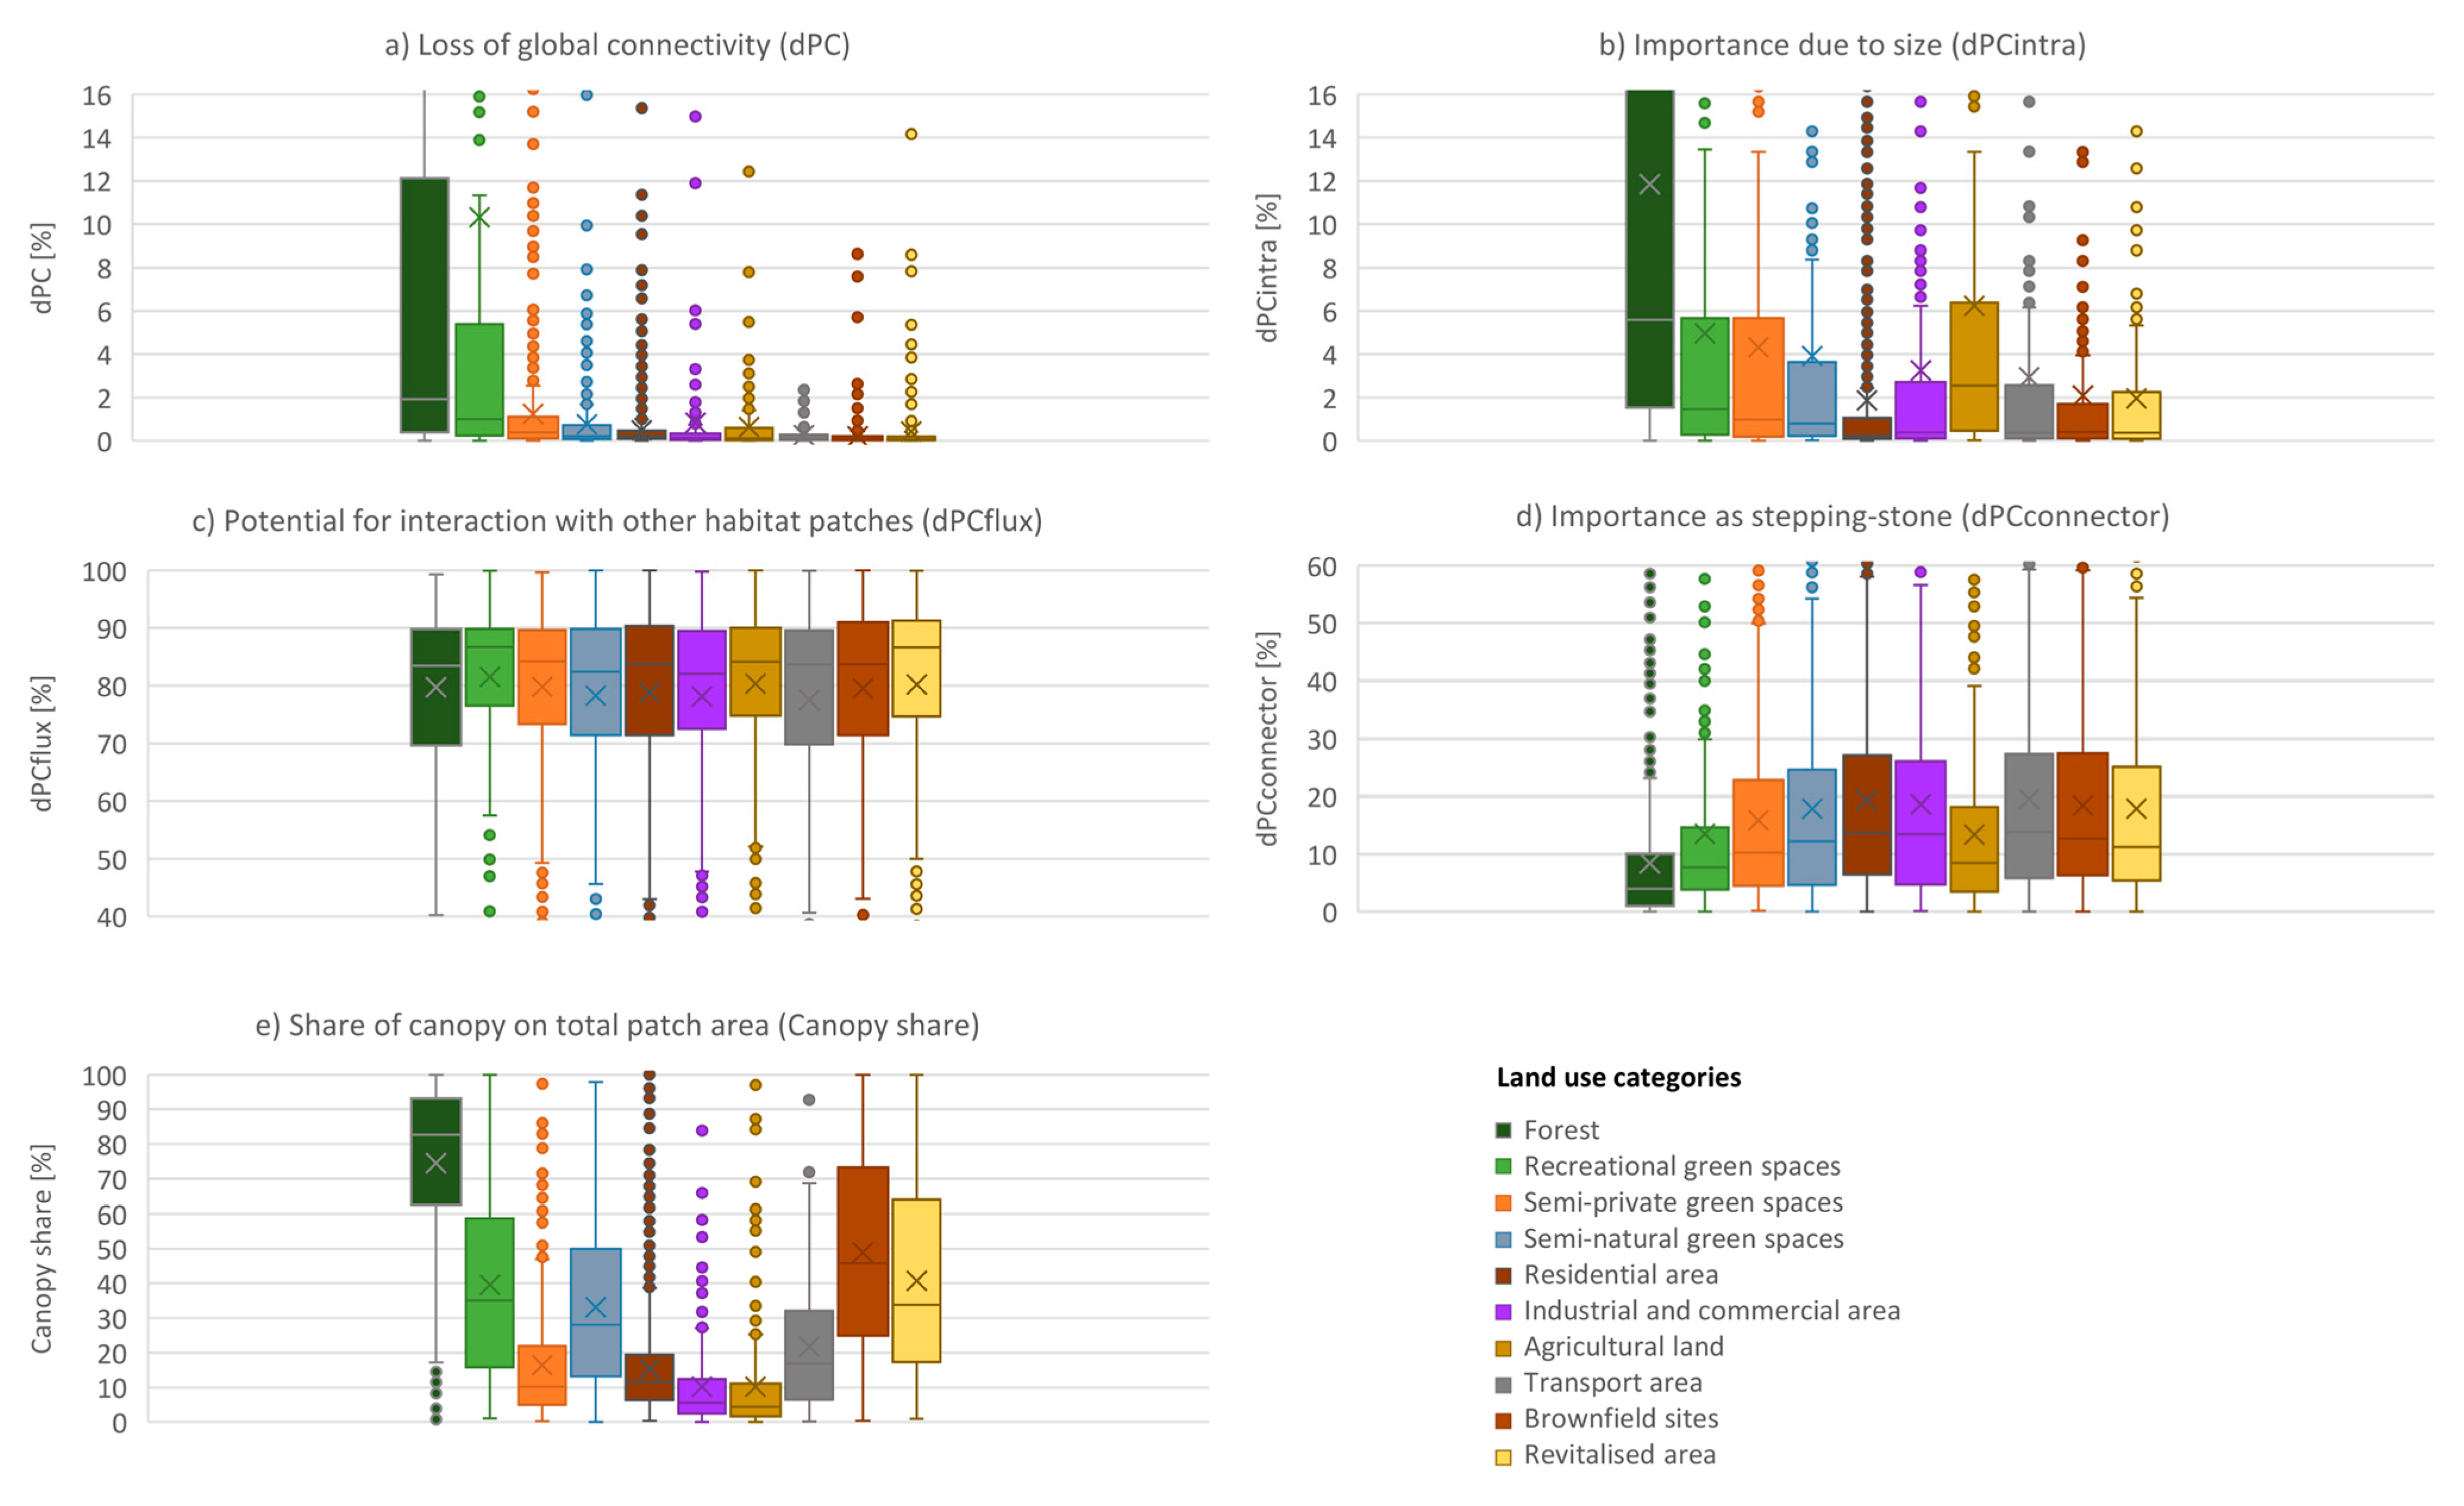
  • dPCintra: Intrapatch connectivity for a patch based on the assumption that connectivity exists within the patch and is, consequently, proportional to the patch area, reflecting internal characteristics.
  • dPCflux: Area-weighted dispersal flow through the connections of a patch to or from all of the other patches in the landscape. It depends both on the area of a patch and its position within the landscape.
  • dPCconnector: Topological-based importance of a patch or link for maintaining connectivity between other patches as a connecting element (stepping stone) between them. A certain patch or link will contribute to dPCconnector only when it is part of the best (maximum product probability) path for dispersal between two other patches, and is independent of the size of a patch.

2.4. Data Analysis

The data analysis was aligned according to the three research questions. First, we used the delta PC value (dPC in %) in order to assess the importance of canopy patches for the functional connectivity of UTS. We further evaluated the contribution of individual patches to the connectivity with respect to their size (dPCintra), flux potential (dPCflux), and role as a stepping stone (dPCconnector). Each of the three fractions was recalculated in order to sum to 100% of the dPC value in order to allow a better comparison of the individual contributions between all patches. In addition to a detailed mapping of the four metrics, we intersected the individual values with the underlying land use category. Based on this, we used box plots in order to display the variations of each metric within and between the 10 land use categories. We also added the variation of canopy share on a patch total area as complementary information.
Second, we evaluated the contribution of different revitalisation measurements for functional connectivity in a temporal perspective focusing on the 466 revitalised patches which are relevant for functional connectivity (dPC > 0). We classified each individual measurement into six revitalisation categories and analysed two complementary metrics for each measurement and each year between 1998 and 2020 in which the revitalisation had been implemented. The dPC value was used in order to account for the overall contribution to functional connectivity, while the canopy area for each revitalised patch serves as a reference for the corresponding land take of each measurement and year. In order to compare both indicators, we recalculated the individual values over all years and measurements between 1998 and 2020 such that they summed to 100% of the total value of either the dPC or the canopy area. Finally, we used a detailed mapping of each measurement category together with selected examples which display the highest contribution to the functional connectivity.
Third, we focused on 239 brownfield nodes and evaluated the criticalness of their connectivity, and their contribution to different subnetworks. In order to assess the criticalness, we used the number of links per node, with the assumption that a node is more exposed to being disconnected the less links it forms to other nodes [10]. This exposure is even more relevant for important network elements. In order to account for this, we analysed the role of each node as a stepping stone by summing the connector values (dPCconnector) of each link that a node connects. This allows a ranking of brownfield patches according to their local connectivity value as well as their criticalness or exposure. In addition, we analysed the potential of the renaturation of 521 brownfield nodes which had not been considered for the previous analysis of functional connectivity (dPC = 0). We ran the same steps for the FCA (see Section 2.3) and evaluated the difference to the previous analysis with respect to the number of nodes, number of links, sum of dPCconnector, and the Beat Index for each subnetwork. Plotting the sum of dPCconnector for each of the 521 renatured brownfield nodes assisted in prioritising the improvement of functional connectivity in individual locations.

3. Results

3.1. Variation of Connectivity of Tree Canopy over Land Use Classes

The total tree canopy in the city of Leipzig relevant for the functional connectivity of UTS sums to an area of 4053 hectares (ha) distributed over 6071 land use patches. The global PC value for the city is 3.86E−04. The spatial analysis in Figure 3 highlights two important canopy patch locations, measured as a general contribution to global connectivity dPC (see Figure 3a). First, a corridor from north–west to the south of the city basically corresponds to Leipzig’s floodplains and hosts the most important nodes, such as the large canopy patch of the southern floodplain forest which, alone, would cause a loss of 41% of the global PC if it was removed. Adjacent to these nodes, canopy patches important for the functional connectivity of UTS can be found, for instance, in the central part of the city where relevant nodes belong to Leipzig’s Clara-Zetkin-Park or Rosental Park. This is mirrored by the variation of dPC values displayed in Figure 4a, as forest and recreational areas share a comparably high median dPC (1.92% and 1.0%, respectively), as well as a very high variation towards maximum values. Second, secondary networks with important nodes can be detected, for example, larger parks or cemeteries in the eastern and south-eastern part of the city (e.g., Südfriedhof, Stünzer Park), semi-private green spaces such as allotment gardens or green sport facilities in the north-eastern part of the city (e.g., Freibad Schönefeld, KGV Elsteraue), or semi-natural areas such as shrubland in particular at the inner fringe. The median dPC values displayed in Figure 4a also suggest that semi-natural (0.21%) and especially semi-private green spaces (0.4%) play an additional role in maintaining the functional connectivity of UTS in Leipzig.
In contrast, brownfield sites and revitalised areas show, on average, the lowest dPC median of 0.08% and 0.07%, respectively (Figure 4a). However, a closer look at the two land use categories is promising due to three facts. First, the dPC values of both land use categories show a variation higher than other land use categories, suggesting that individual patches of existing and revitalised brownfields play a decisive role for the functional connectivity of the city. Second, being comparably small in size, the associated patches of existing and revitalised brownfields show a comparably high share of canopy cover, with more than one third of their total area being covered (Figure 4e). Although too small to serve as habitat, several patches can act as relevant stepping stones due to their high share in canopy cover. Third, the spatial distribution of especially nodes with lower connectivity relevance suggests that they, nevertheless, serve as important connecting elements which finally support a fine web of edges throughout the city and, finally, support bigger nodes in expressing their high connectivity values (Figure 3c). Consequently, we tested each patch for its individual contribution to the connectivity with respect to its size, flux potential, and role as a stepping stone.
The individual patches contribute differently to the connectivity metrics, as presented above with respect to their size, flux potential, or role as a stepping stone. The dPCintra median values displayed in Figure 4b indicate that the global connectivity values dPC of especially forest areas and, to some extent, agricultural land are significantly driven by their habitat size or quality (median dPCintra of 5.6% and 2.6%, respectively). As expected, existing and revitalised brownfields do not play a major role for connectivity due to their habitat size (0.41 and 0.38%, respectively). Still, their median is double the median for residential areas. As the residential areas show, nevertheless, a within average global connectivity dPC comparable to the median of semi-private green spaces (Figure 4a) indicates that the topological position relative to other canopy patches is more decisive for this land use category.
As mirrored by Figure 4c, residential areas especially play a central role as stepping stones with their immediate surrounding patches (13.7%). As displayed in Figure 3b (reddish colours), there is a large number of patches, usually small in size and with a comparably low contribution to the overall connectivity, which serve this role. These patches are predominantly located within the dense urban built-up structures of the city connecting nodes with higher connectivity relevance with each other. The median of the corresponding dPCconnector values indicates that beside industrial, commercial, or transport areas, brownfield sites are very important as stepping stones (median >13% each, Figure 4c).
In contrast, especially revitalised brownfields contribute to the global connectivity due to their potential for interaction with other habitat patches (dPCflux). Their median dPCflux of 86.7% is equal to that of recreational green spaces, suggesting that although the global connectivity of recreational green spaces is far higher than that of revitalised brownfields, both land use categories predominantly connect other patches with each other in a similar vein (Figure 4c). Although their dPCflux value usually dominates the individual patch contributions of recreational green spaces, such as the central Clara-Zetkin-Park, the Rosental Park, or the local districts of Volkspark Kleinzschocher, they significantly benefit from their additional role as habitat due to the canopy size that these patches host (measured by dPCintra, Figure 4b).

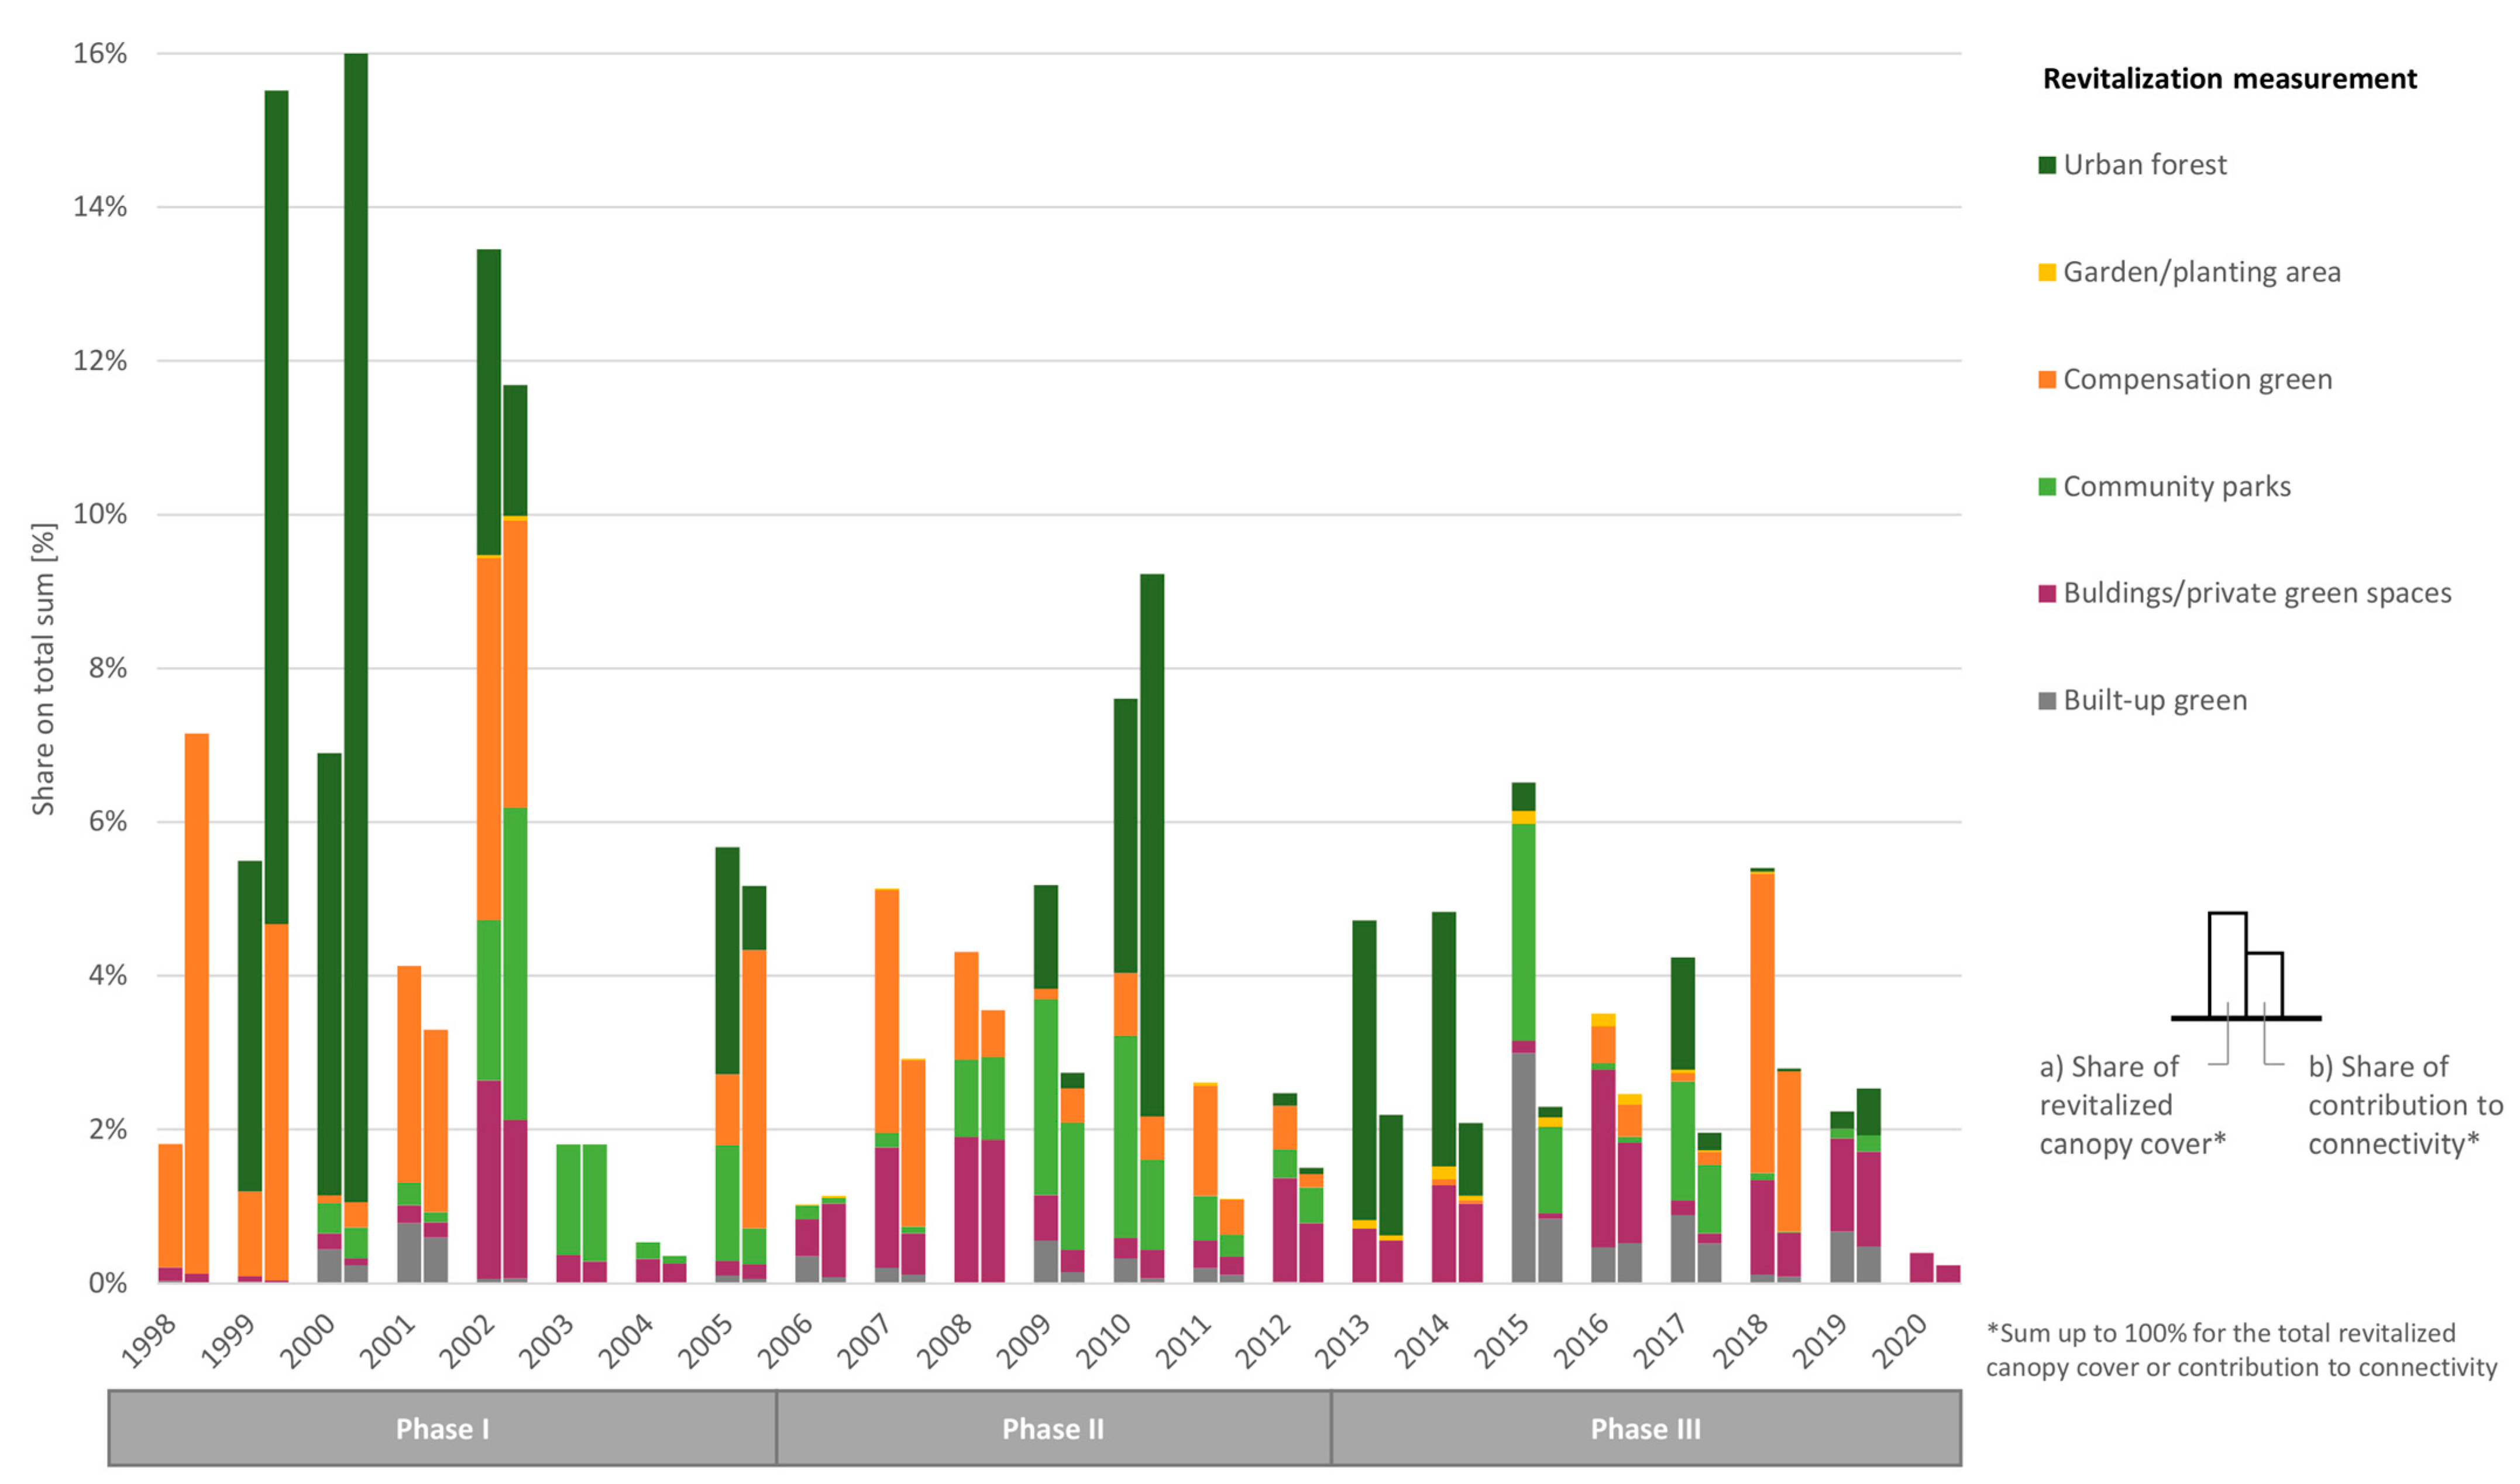
3.2. Connectivity of Revitalised Brownfields 1998 to 2020

Of the 6900 brownfield sites that have been revitalised since 1998, 466 sites contain tree patches which are relevant for the functional connectivity of UTS in Leipzig. The total area accounts for 244 ha, with an estimated tree cover area of 82 ha resulting in a share of 34% canopy cover (Table S1). The individual measurements as detailed in Figure 5 represent a mix of green and grey measures with urban forest and compensation green showing a canopy cover of more than 50%, community parks and garden/planting areas hosting trees on approximately one third of their area, and built-up green or private green revitalisation measurements being dominated by grey elements (canopy cover up to 20%). The following paragraph describes the contribution to functional connectivity of each individual measurement, measured by dPC, going back to 1998. In so doing, three different phases can be distinguished, as shown in Figure 5.
In a first phase between 1998 and 2005, 33 ha of treed areas were revitalised, especially in the years 1999/2000 and 2002. In particular, the two revitalisations for urban forests, one in 1999 and the other in 2000, had an impact on the functional connectivity of UTS in Leipzig (example 1 in Figure 6). Furthermore, this phase is characterised by a large, revitalised area for compensation green, most prominently in 1998/99 and 2001/02. Example 2 in Figure 6 shows a corresponding set of patches, with the highest connectivity values dPC being Agra Park in Leipzig’s southern floodplains. The city administration aimed for the extensive renaturation of the whole former agriculture exhibition grounds. Due to its location vis-à-vis to the central floodplains, this area provides excellent connection for the large floodplain forest to tree patches within the built-up structures of the city. In addition, community parks have been established on former brownfields. In particular, 19 community parks revitalised in 2002/03 show high connectivity values dPC, although their area is comparably small (high area-connectivity ratio, example 3 in Figure 6).
A second phase, between 2006 and 2012, when 23 ha of treed areas were revitalised, suggests diverging results compared to the previous phase. First, the revitalised area does not add to the functional connectivity, as per the measurements in the previous phase when contrasted to the size of the converted area. This accounts for almost all measurements in each year of this phase—in particular for community parks and compensation green. One exception was the year 2010, in which two revitalised urban forests significantly added to functional connectivity (high area-connectivity ratio). In addition, private green spaces were created at constant frequencies in each year of this phase (Figure 5). For them, the relative location is relevant for the functional connectivity. While nine measurements significantly added to the connectivity in 2008 (example 4 in Figure 6), 18 measurements in 2009 did not really increase the functional connectivity of UTS. Finally, the community parks created between 2008 and 2020 significantly contributed to the functional connectivity. Example 5 in Figure 6 shows how pocket parks created in this phase connect previously revitalised areas in the eastern district of Leipzig, forming a functional corridor in the dense built-up structure.
In a third phase between 2013 and 2020, 26 ha of tree-holding areas were created. During this phase, in each year, a low but constant number of areas were revitalised with, however, only moderate contributions to the functional connectivity of the network when measured by dPC (Figure 5). This phase was characterised by a mix of measurements for revitalising brownfields which contributed to functional connectivity in a similar vein: the added value of private green spaces to functional connectivity was low but similar to the added value of community parks or urban forests. In each year, the area of the measurements was larger by far, in relative terms, than the added value to the connectivity. This indicates the very high sensitivity of revitalised areas for the functional connection with respect to their relative location: not all core areas and corridors can express their full potential as functional stepping stones and habitats from a functional connectivity perspective when they are misplaced.
Screening for the individual contribution of each measurement in our analysis confirmed that urban forest is especially relevant for functional connectivity due to its role as a larger habitat patch: 9% of urban forest’s contribution to connectivity results from internal functionality dPCintra (Table S1). At the same time, these areas substantially contribute to the overall connectivity of the network: the dPCflux contribution of 89% is the highest among all measurements. This is due to their central position within the UTS in Leipzig, connecting, for instance, the northern and southern parts of the important floodplain forest areas in Leipzig. A comparable role with slightly smaller shares for dPCintra and dPCflux refers to compensation green spaces. These areas are mostly located adjacent to forest areas, e.g., central floodplain forest, or at the inner fringe of the inner city. Community parks which emerged very well due to revitalisation represent the average of all measurements with respect to their composition of dPCintra, dPCflux, and dPCconnector. Several community parks substantially foster the functional connectivity, for instance, in the eastern or western district in particular due to their role as stepping stones (share dPCconnector 14%). Other revitalised community parks remain relatively isolated with limited contribution to functional connectivity in Leipzig. Revitalised private green spaces play an even more important role as local stepping stones (share dPCconnector 17%) as well as built-up green spaces (27%). This is a consequence of their small area combined with their relative location in areas which lack alternative paths connecting canopy patches. In particular, trees accompanying larger roads play a decisive role as part of built-up green spaces (example 6 in Figure 6).

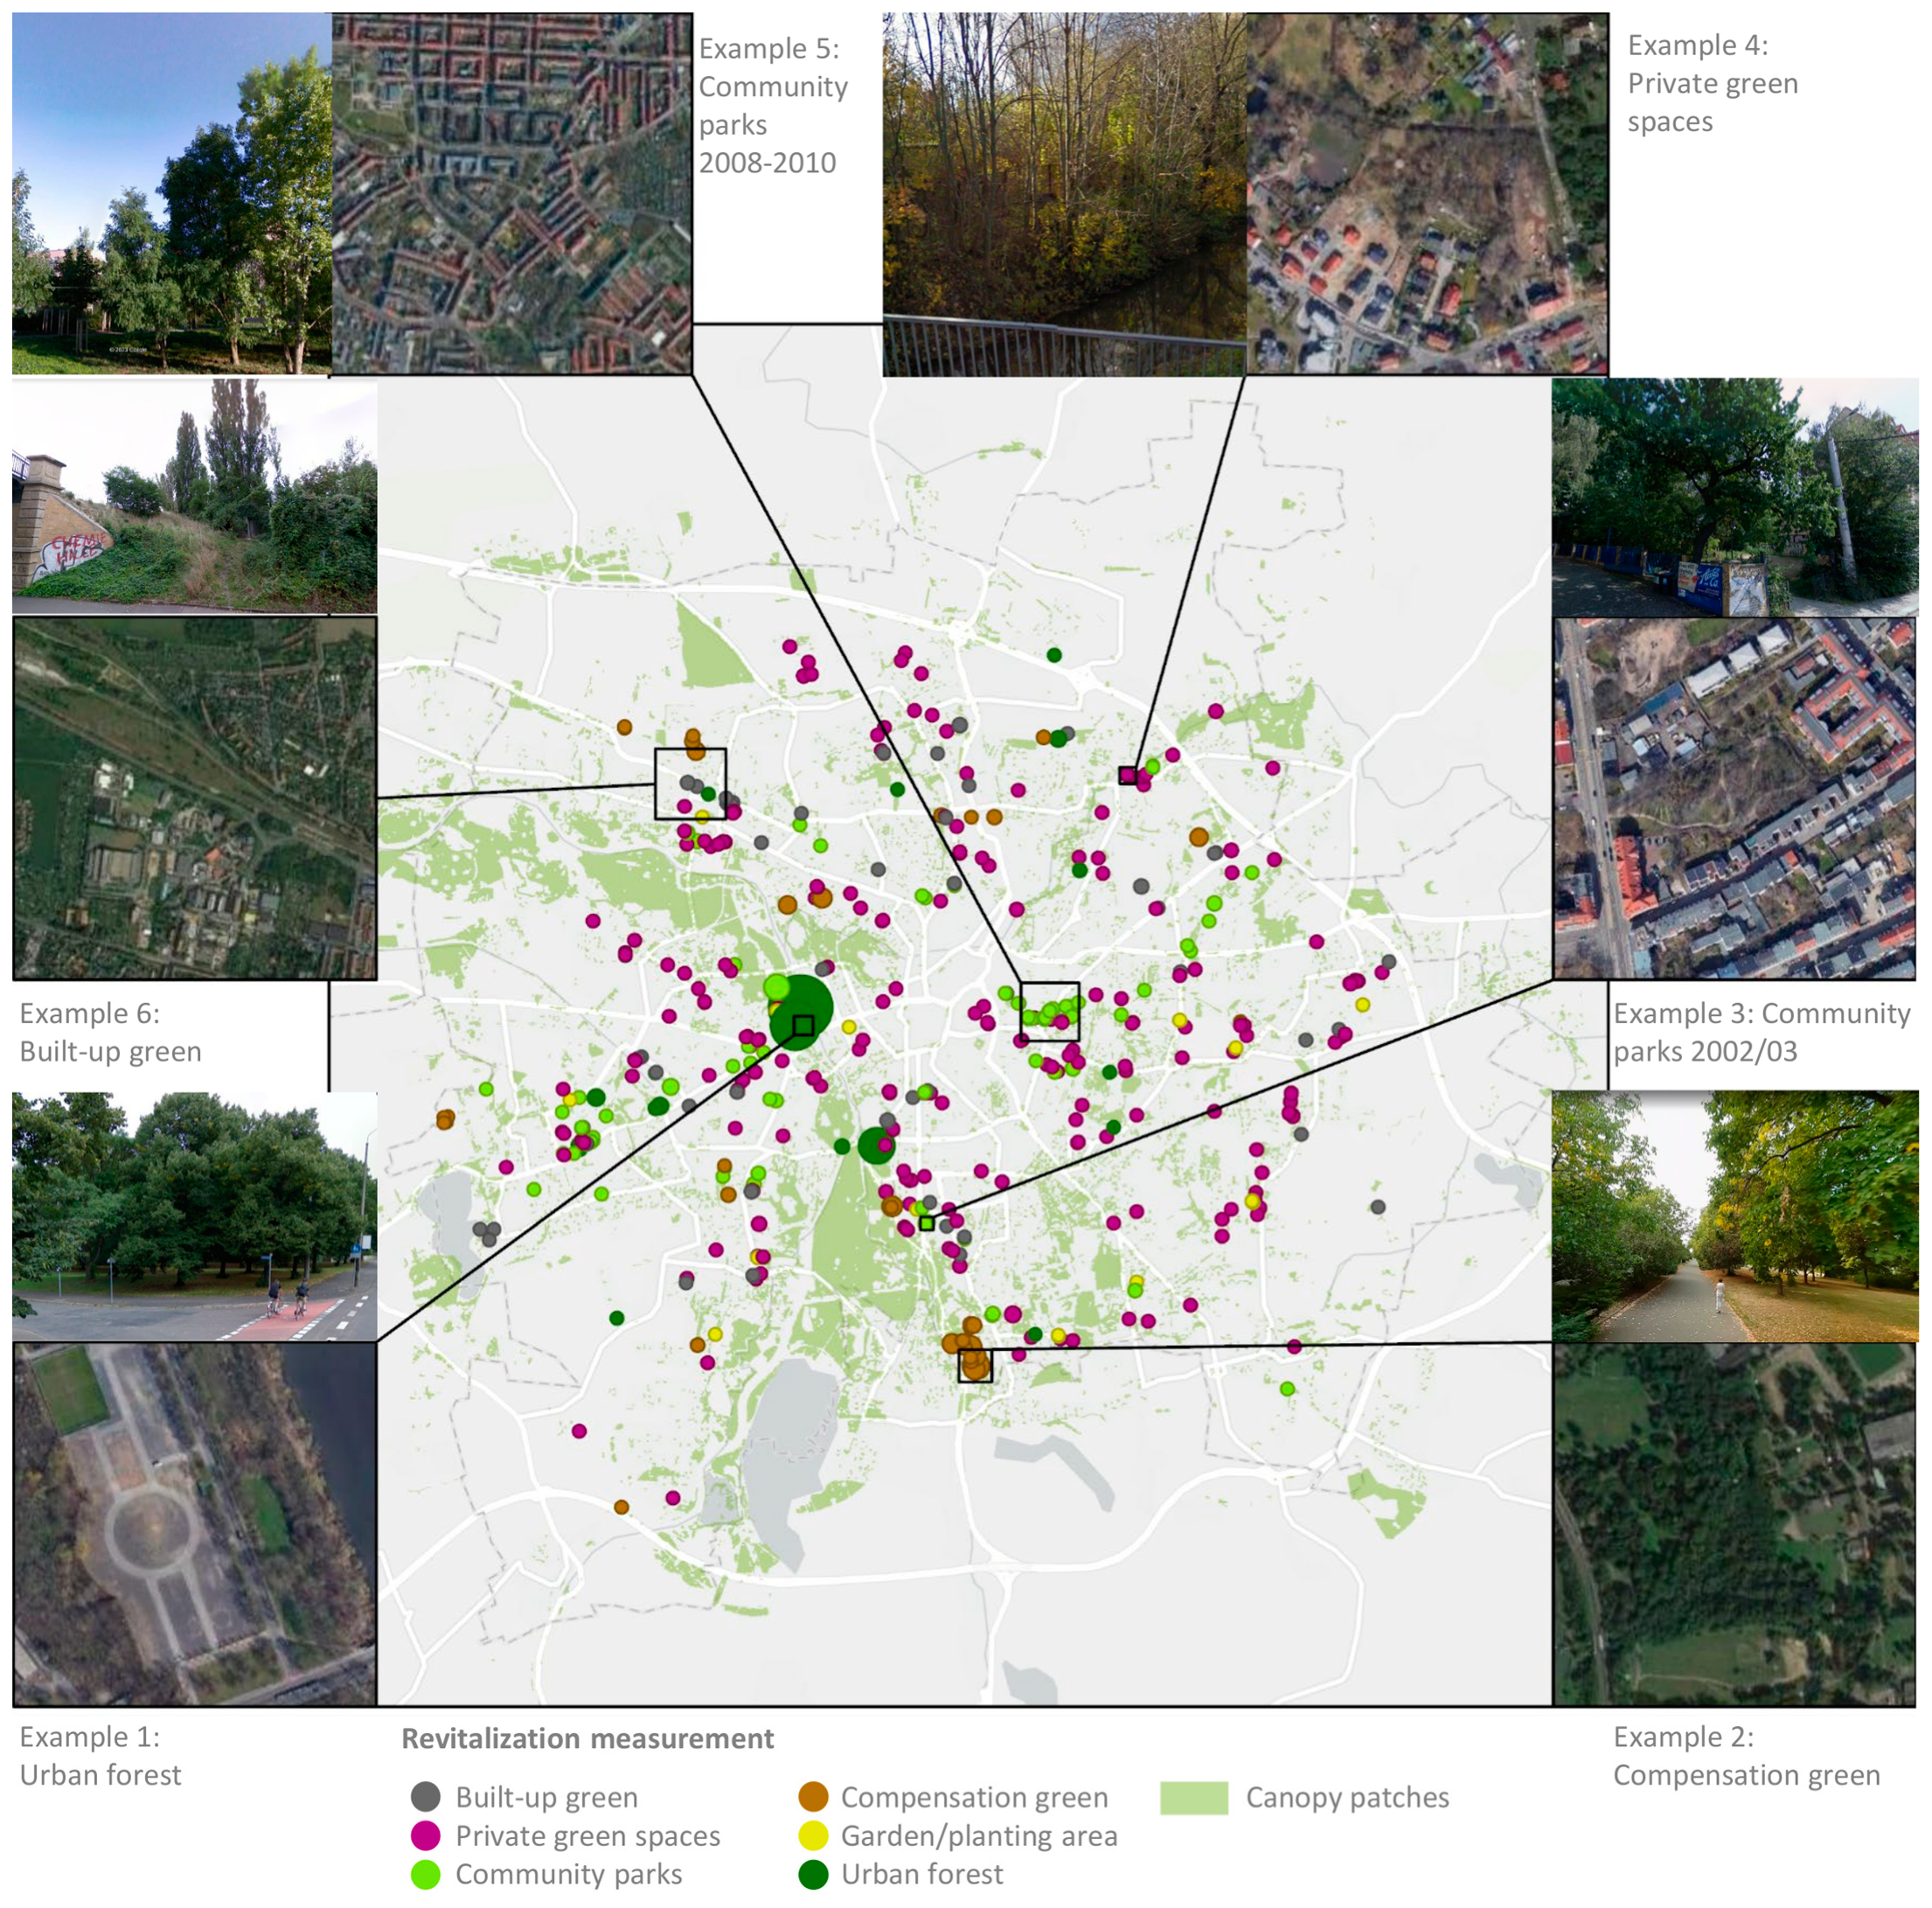
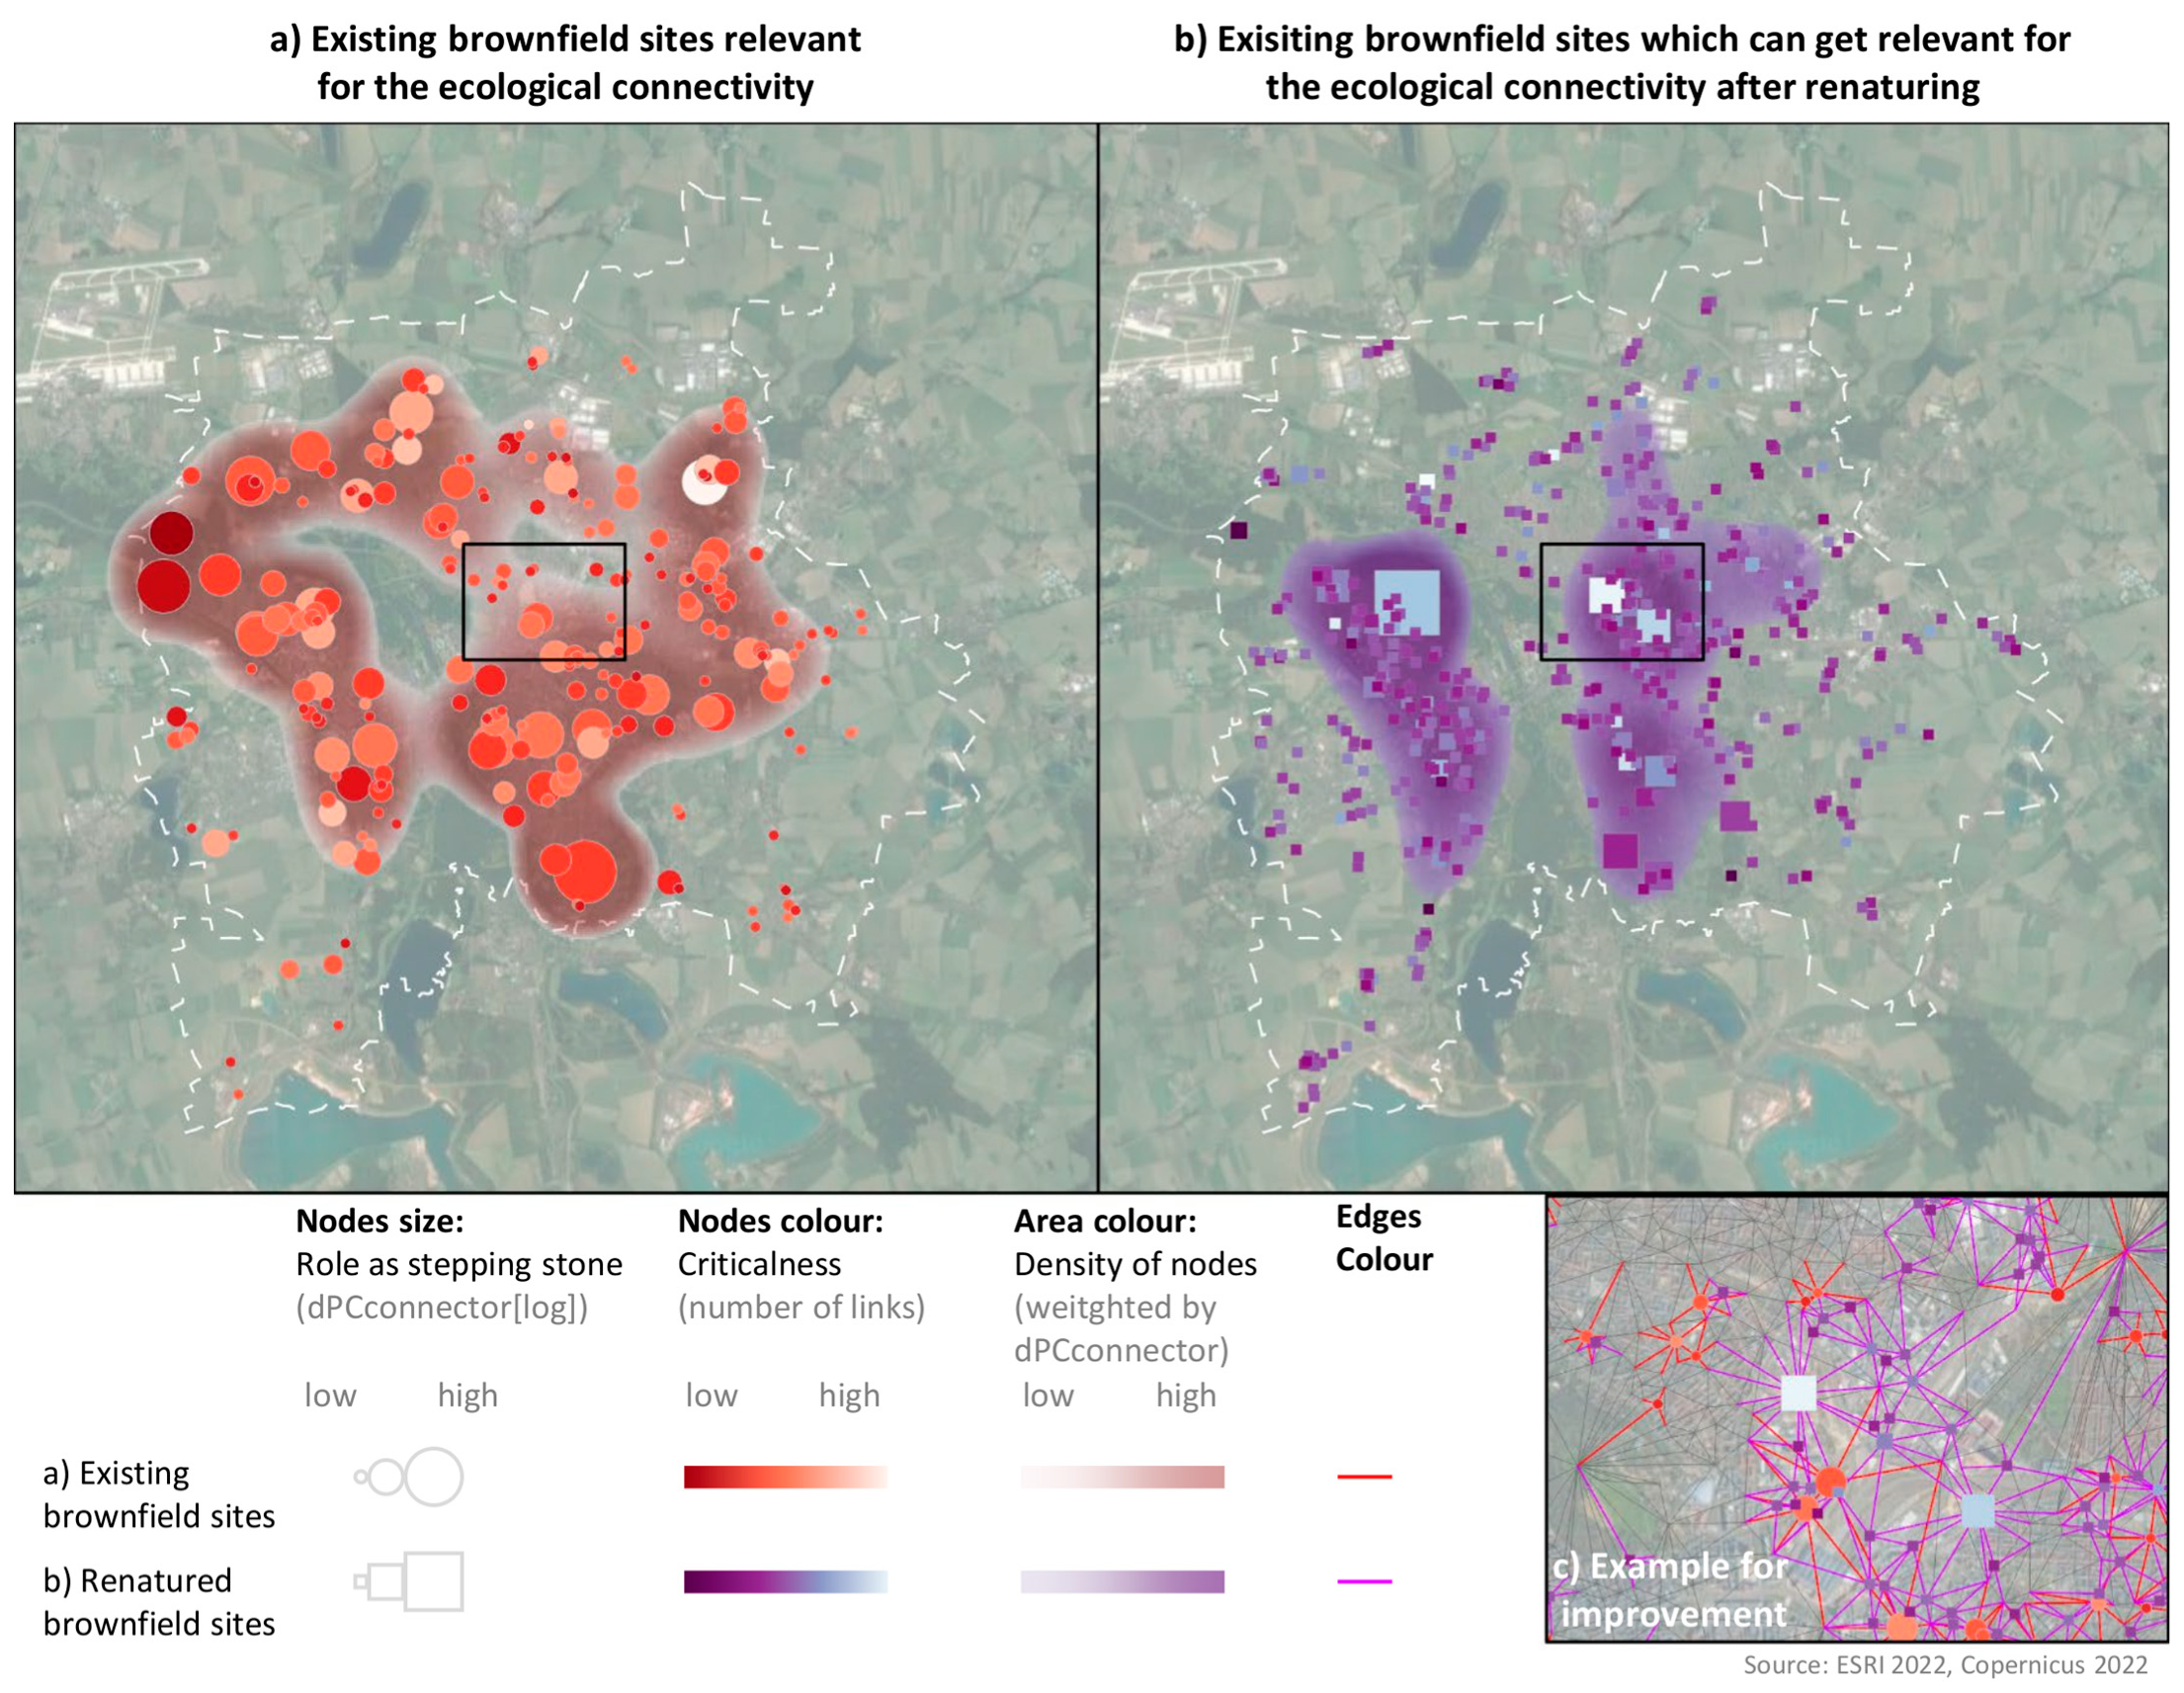
3.3. Brownfields Sites for Preserving and Fostering Functional Connectivity

Of the 2946 brownfield sites in Leipzig, 829 are relevant for the functional connectivity of urban trees in Leipzig. The area accounts for 438 ha, with a canopy cover of 127 ha resulting in a share of canopy patches of approximately 29% (Table S1). However, which brownfield sites must be preserved as a priority as they substantially contribute to the functional connectivity of UTS in Leipzig? What is the potential of renaturation current brownfields which are not part of UTS, yet, for fostering strategic functional corridors in the city? In order to answer these questions, this section demonstrates a tool for detecting, prioritising, and visualising brownfields from a graphical perspective, in which 239 brownfield nodes contribute to the UTS of Leipzig.
As explained earlier in this paper, brownfield sites only contribute to the global connectivity to a limited extent, but are valuable stepping stones for supporting and maintaining the high functional connectivity function of other patches within the UTS. This role as a stepping stone is visualised in Figure 7a (node size), from which three relevant functional corridors can be detected. A first corridor runs parallel to Leipzig’s floodplains in the western part of the city. Relevant brownfield nodes are especially locatable at the respective ends of this corridor. Thereof, a sample of brownfields at the lower end of this corridor is of particular relevance as it is embedded in the dense built-up area of western Leipzig. A second corridor stretches at the northern inner fringe of the city from west to east. Brownfield sites here basically serve as stepping stones between canopy patches of the denser built-up parts of the city and the sparsely populated parts at the fringe on the intersection towards canopy patches on agricultural land or shrubland. A third corridor runs from west to east in the southern part of the city and connects the core habitat areas of the Leipzig floodplains with smaller habitat niches, e.g., in parks or allotments, and the canopy patches at the outskirts of the city.
All three strategic functional corridors consist of several individual brownfield nodes which, however, show a different degree of exposure against future land use changes (Figure 7a, node colour). In particular, brownfield nodes along the first-mentioned corridor parallel to Leipzig’s floodplains are connected only with a few links which could quickly vanish, in particular, in the dense urban fabric due to densification, or due to sprawl at the outskirts. In addition, the third-mentioned corridor from Leipzig’s west to east is also exposed to land use changes. It is surprising that particular brownfield nodes with a high relevance as stepping stones are connected with a comparably low number of links. This means that the diversity and redundancy of connecting links is lower than their topological position within the network would assume. As a consequence, these important nodes are connected by few albeit important links which could be eliminated when either the corresponding brownfield patches are densified or if the connected canopy patches disappear.
However, what is the potential of renaturing brownfields for improving the functional connectivity of UTS in Leipzig? With their status in 2020, 521 brownfield nodes could potentially be renatured. However, due to the differences in topological relations of renatured brownfields vis a vis to existing nodes of canopy patches, Figure 7b mirrors that the improvement for the stepping stone potential differs with spatial location. First, for corridor 1, the most important improvements can be detected at their northern part, adjacent to relevant forest patches. Second, there are few albeit very relevant brownfield sites in the southern part of the city which suggest that their renaturation will allow the third-mentioned corridor to be connected to the canopy patches at the southern outskirts and, thus, substantially diversify the connections between the dense parts of the city and the outskirts. Third, the renaturation of brownfields north of the city centre would open up a new functional corridor which bypasses the dense built-up structures. This bypass could potentially provide a north–south corridor as an alternative to the very important floodplain corridor. As displayed by the nodes’ colour, there are key brownfield sites for which their renaturation would not just promote them to key stepping stones but also allow them to establish various functional links to adjacent canopy patches indicated by a corresponding low criticalness of these nodes (see Figure 7c).

4. Discussion

4.1. The Complex Role of Existing and Revitalised Brownfields for the Functional Connectivity of UTS

Our proposed approach has uncovered, prioritised, and visualised the role of revitalised and existing brownfield sites for the functional connectivity of UTS in the regrowing city of Leipzig. Based on a functional connectivity analysis of canopy patches in Leipzig, the analysis has (i) contrasted the role of revitalised and existing brownfield sites against other land use categories, (ii) demonstrated when and where different revitalisation measurements have contributed most to the functional connectivity, and (iii) provided a complementary planning tool for prioritising brownfield sites currently relevant for the connectivity of canopy patches, as well as for demonstrating the added value of renaturing current brownfields for the connectivity. These three aspects are discussed in the following section in relation to our research questions.
The spatial explicit elicitation of the importance of canopy patches has detected primary and secondary networks of functional connectivity of UTS in Leipzig. In particular, Leipzig’s floodplains form an important functional corridor from north–west to the south of the city and, together with adjacent nodes, the most important ecological network of the city. This network basically consists of large forest patches as well as bigger parks, while the centrally located parks serve as both habitats and relevant connectors for the whole network. Being relevant for recreation and biodiversity, the corresponding parks need to be the subject of follow-up studies on the trade-offs between these two ecosystem services [72,73]. In addition, secondary networks substantially contribute to functional connectivity in other parts of the city for which, in particular, cemeteries, allotment gardens, or green sport facilities play a key role. Primary and secondary networks are further connected by nodes which do not play a central role as habitat patches (measured by dPCintra), but either due to their potential for interaction with other habitat patches (measured by dPCflux) or their central position and role as a stepping stone for the immediate surrounding (measured by dPCconnector), they do play a central role. This conclusion was enabled by accounting for the different role for land uses and individual patches with respect to their contribution to the global connectivity within our analysis. It was shown that brownfield sites especially, as well as residential areas, play a central role as stepping stones with their immediate surrounding patches. Their topological position relative to other canopy patches within the network is decisive for these two land use categories. In addition, revitalised brownfields play a central role due to their potential for interaction with other habitat patches. The analysis has shown that the importance of revitalised areas in connecting other patches with each other is as high as the corresponding importance of Leipzig’s central parks. Considering that the patches of existing and revitalised brownfields predominantly located within the dense urban built-up structures of the city [24] are small in size but show a comparable high canopy share, their contribution in forming functional corridors and connecting primary and secondary networks is undoubted. Consequently, their role as a green infrastructure element enabling flows of ecological benefits and supporting natural and ecological processes should not be underestimated [3]. A similar role was already proven for courtyard canopy [25].
The revitalisation of brownfields has long been a strategy in the formerly shrinking city of Leipzig [27]—the renaturation of former brownfields as a Nature Based Solution (NBS) strategy is, consequently, not new to the city [26]. However, learning from Leipzig when evaluating the contribution of different revitalisation measurements for functional connectivity between 1998 and 2020 suggests three conclusions as being relevant for this type of NBS. First, not only the individual measurement is decisive for producing an added ecological value but the spatial context. The revitalisation of urban forest in 1999 and 2000 has resulted in the highest functional connectivity contribution compared to other measurements or other years. The overall size of these measurements was relatively low compared to the functional connectivity benefit. In contrast, urban forest revitalisation in later years has not translated into a similar connectivity benefit, although the corresponding area was larger.
A similar contrast can be detected for compensation green revitalisation measurements. For both examples, the analysis has shown that around the turn of the century, several revitalisation measurements have been located either in centrally located positions within existing ecological networks, or adjacent to them. This indicates the very high sensitivity of revitalised areas for the functional connection with respect to their relative location: not all revitalised areas can express their full potential as functional stepping stones or habitats from a functional connectivity perspective when misplaced. Second, the individual measurements and their final contribution to functional connectivity depend on the overall urban development of a city. The analysis has shown that, in particular, with Leipzig’s regrowth from around 2010 onwards, revitalisation measurements have translated into a limited improvement of functional connectivity compared to previous measurements. At the same time, the connectivity benefit decreased relative to the revitalised area. This points to the fact that with Leipzig’s regrowth, a higher dynamic of redensification can be observed which limits the functional connectivity benefit of revitalisation measurements as the corresponding patches become smaller and more isolated from a functional connectivity perspective [53]. Third, revitalisation of brownfields, especially in the form of community parks, proved to have a comparably high connectivity value although their area is comparably small. The parks created in 2002/03 and between 2008 and 2020 are good examples, as they connect previously revitalised areas in their corresponding area, creating functional corridors for species movement in the dense built-up structures. At the same time, these parks can contribute to an improved environmental justice in the city [74]. They provide recreational functions for residents in formerly deprived neighbourhoods during a phase in which Leipzig’s regrowth was basically dominated by redensification or the creation of private green spaces.
Brownfields represent a valuable land resource, not only but in particular in a formerly shrinking city such as Leipzig. In 2020, brownfields relevant to functional connectivity accounted for 438 ha total area size, a canopy cover of 127 ha, and formed 239 nodes within the UTS in Leipzig. The results demonstrated that these brownfield nodes, in their role as stepping stones, form strategic corridors for preserving and fostering functional connectivity complementary to the major ecological networks, e.g., along Leipzig’s floodplains. As the city of Leipzig will continue to grow, brownfields might be replaced by built and transportation space due to housing needs [52,53]. In line with the city’s strategy of simultaneously allowing for both infill densification and maintenance, further development, and qualification of urban greenery, the last part of our analysis was designed for supporting planning decisions following four non-consecutive steps.
  • In the first step, decision-makers should carefully screen their strategic pool of brownfields and select those brownfields for structural redensification which either play no or only a very small role for the functional connectivity of the city. This study has shown that brownfields which support the connectivity of UTS have a comparably high canopy share. This ecological quality, together with their connectivity potential, could be used as an indication of whether a potential redensification would change the overall connectivity of the network. The results presented here allow a prioritisation of brownfield sites with respect to these two indicators. As a consequence, the large pool of brownfields which currently host either none or only small canopy patches could be redensified in the first place.
  • In the second step, brownfields currently not relevant to functional connectivity are prioritised according to their potential for serving as stepping stones when the area is renatured. A corresponding prioritisation is provided by this analysis. In particular, brownfield sites which either strengthen existing primary and secondary networks should be renatured in the first place, as well as those which open corridors to habitat areas at the southern fringe or provide a bypass around the very dense city centre. Around the centre, the modelling has proven that the number of links of the renatured brownfield sites and adjacent canopy patches would substantially increase. As a consequence, this would result in a high redundancy of connections and a corresponding low criticalness and exposure against future land use changes. In contrast, brownfield patches with no or a very low contribution to functional connectivity when renatured could serve as potential candidates for redensification.
  • In the third step, planning is asked to preserve functional connectivity by maintaining and protecting the relevant nodes of the urban tree canopy network. In this regard, the results help to prioritise existing brownfields according to their role for functional connectivity. At the same time, it is not only an individual site which is relevant in this regard, but their topological relations to other canopy patches. The results highlighted that, in particular, brownfield nodes parallel to Leipzig’s floodplains are connected with only a few links which could quickly vanish due to densification or sprawl at the outskirts. In several parts of the city, brownfield nodes with a high relevance as stepping stones are connected with a comparably low number of links and their corresponding criticalness is high. Consequently, planning is asked not just to preserve the important brownfield sites, but also their connections to other surrounding canopy patches—otherwise the functional connectivity of the whole corresponding subnetwork could decrease with limited options for animals to move.
  • In the fourth step, this study has demonstrated that renaturation has the potential to strengthen the functional connectivity of some corridors. In contrast, for other areas, the renaturation of brownfields does not decrease, or barely does so, the criticalness of the corresponding nodes of UTS. For these areas, a large-scale protection status linked to existing protected areas within, or even outside, the administrative boundaries would support the preservation of the functional connectivity of UTS in the city and beyond.
Although this paper recommends using the results by following the mentioned four steps, it recognises the complexity of decision-making processes in revitalising brownfields [75]. Only 15% of all brownfields are owned by the city [54]. Investors usually have an interest in particular sites challenging a broader perspective on brownfields as a strategic resource for fostering functional connectivity. Public–private partnerships, especially for complex urban revitalisation that is difficult to finance [54], are requested as well as a strategic purchase of land based on ex-ante impact assessments such as those presented here. In addition, it would be challenging to renature all brownfields owned by the city due to the variety of needs in a regrowing city. Instead, several objectives, e.g., strengthening educational supply, etc., require thematic compromises with respect to the chosen revitalisation measurement. The growing competition for the subsequent use of brownfields, especially in the inner city, requires a forward-looking, interdisciplinary strategy focus on the concept of multifunctionality when dealing with these areas [76].

4.2. Method Limitation

The network analysis of this paper based on graph theory modelling proved to be a powerful method in fragmented and complex landscape systems such as cities [44]. Although this method is very effective in measuring how efficiently movement flows between patches are against their overall connectivity contribution of the ecological network [41], it hardly realises the built-up structures as barriers of these movements, e.g., in contrast to least-cost surface modelling approaches. As a consequence, it must be considered that the chosen approach might not be a good representative of other taxa such as mammals. Consequently, the chosen model was designed for representing only breeding birds, which are a commonly used taxa in urban areas [23]. Accordingly, dispersal distances have been derived from a literature review on breeding birds in urban ecosystems [9,14,46,65].
This paper chose canopy data based on high-resolution Sentinel 2 data with a spatial resolution of 10 metres ground resolution (as described in the Materials and Methods section). The accuracy of this product is 94% [60]. Still, uncertainties resulting from false or unprecise classifications remain. Consequently, we chose a minimum patch area of 0.1 ha in order to account for these data-inherited uncertainties, as well as better representing habitats for breeding birds. However, the chosen distances are only proxies for real dispersal behaviour as the use of, responses to, and movements within a network can vary even between different taxa of breeding birds [4]. In addition, no further qualification of the habitat quality was included in the modelling other than canopy patches. An additional assessment of habitat traits would allow a finer-tuned differentiation of habitat quality [77,78]. Still, the analysis uses high-resolution canopy cover data as well as cadastral data for the whole territory of the city which allows support planner decisions to be made, in particular with respect to brownfield redensification and renaturation in order to strengthen biodiversity in the cities.

5. Conclusions

Given the fact that Leipzig will remain the fastest growing big city in Germany with an estimated population increase of 14% up to 2040, evidence-based support of land use decisions is needed more than ever. To assist this decision, this paper used an ecological network model (Graphab) for the functional connectivity of UTS, based on high-resolution and cadastral data in the city of Leipzig. We uncovered, prioritised, and visualised the role of revitalised and existing brownfield sites accounting for the complexity of multiple associations between nodes of the broader green infrastructure network. In order to balance the need for densification, as well as for the maintenance, further development, and qualification of urban greenery in Leipzig, the paper (a) distilled lessons learnt from the hitherto revitalisation strategies, (b) detected strategic functional connectivity corridors contributing to establish overall connectivity for urban wildlife conservation, and (c) provided a tool for prioritising brownfields which needs to be kept for ensuring functional connectivity of the green infrastructure, those which could potentially be densified, and those which need to be renatured fostering the functional connectivity of the city.
To what extent brownfields facilitate the ecological movement and biodiversity within the city, or how revitalisation measurements foster this functional connectivity of the whole green network, are, among others, blind spots in the current planning strategies of many cities. In contrast, brownfield revitalisation is one of the most important Nature Based Solution (NBS) strategies in cities. Given the wide absence of spatial-explicit taxa data and data-processing know-how in many city administrations, this paper presented an approach using freely available software tools and high-resolution canopy data as a proxy for functional connectivity which serves as a blueprint for implementation in other cities. As decision-makers are challenged by the question of whether or not a brownfield could be renatured or densified, the application of the proposed approach can (a) be used as an ex-ante evaluation of NBS strategies with comparably low effort in data obtaining and processing, (b) be used to reduce or avoid costs of possible wrong land use decisions, (c) provide a complementary perspective compared to widely used place-centric assessments of individual patches or areas, and (d) form a standardised tool for a continuous and comparable monitoring in line with current international recommendations [79]. All of these aspects will be required in order to balance urban development and ecological protection and biodiversity in our cities.

Supplementary Materials

The following supporting information can be downloaded at: https://www.mdpi.com/article/10.3390/land12020333/s1, Figure S1. Maps displaying the four input data sets (A, B, C) and the Morphological Spatial Pattern Analysis (D) as pre-processing of the assessment of the functional connectivity of Urban Tree Systems (UTS) in Leipzig; Table S1. Key metrics for functional connectivity of 10 land use categories (A) and six revitalisation measurements (B).

Author Contributions

Conceptualization, M.W.; methodology, M.W. and T.L.H.; validation, T.L.H.; formal analysis M.W.; resources M.W. and D.H.; data curation and interpretation of results, M.W.; writing—original draft preparation, M.W. and T.L.H.; writing—review and editing, M.W., D.H., J.P. and T.L.H.; visualization, M.W.; supervision, J.P. and D.H.; project administration, D.H.; funding acquisition, M.W. and D.H. All authors have read and agreed to the published version of the manuscript.

Funding

This research was funded by the CLEARING HOUSE (Collaborative Learning in Research, Information-sharing, and Governance on How Urban Forest-based Solutions Support Sino-European Urban Futures) Horizon 2020 project (No. 1290/2013) and the NaturaConnect (Designing a Resilient and Coherent Trans-European Network for Nature and People) Horizon 2020 project (contract No. 101060429).

Data Availability Statement

Restrictions apply to the availability of these data obtained from the City of Leipzig (brownfield database). The data of the modelling of functional connectivity of tree canopy patches are made available on request from the corresponding author.

Conflicts of Interest

The authors declare no conflict of interest.

References

  1. Wolff, M.; Haase, D. Mediating sustainability and liveability—Turning points of green space supply in European cities. Front. Environ. Sci. 2019, 7, 61. [Google Scholar] [CrossRef] [Green Version]
  2. Theodorou, P.; Radzevičiūtė, R.; Lentendu, G.; Kahnt, B.; Husemann, M.; Bleidorn, C.; Paxton, R.J. Urban areas as hotspots for bees and pollination but not a panacea for all insects. Nat. Commun. 2020, 11, 576. [Google Scholar] [CrossRef] [PubMed] [Green Version]
  3. Andersson, E.; Borgström, S.; Haase, D.; Langemeyer, J.; Mascarenhas, A.; McPhearson, T.; Wolff, M.; Łaszkiewicz, E.; Kronenberg, J.; Barton, D.N.; et al. A context-sensitive systems approach for understanding and enabling ecosystem service realization in cities. Ecol. Soc. 2021, 26, 35. [Google Scholar] [CrossRef]
  4. Landscape Institute. Connectivity and Ecological Networks; Technical Information Note 01/2016; Landscape Institute: London, UK, 2016. [Google Scholar]
  5. Konijnendijk, C.C.; Ricard, R.M.; Kenney, A.; Randrup, T.B. Defining urban forestry—A comparative perspective of North America and Europe. Urban For. Urban Green. 2006, 4, 93–103. [Google Scholar] [CrossRef] [Green Version]
  6. Flather, C.H.; Bever, M. Patchy reaction-diffusion and population abundance: The relative importance of habitat amount and arrangement. Am. Nat. 2002, 159, 40–56. [Google Scholar] [CrossRef]
  7. King, A.W.; With, K. Dispersal success on spatially structured landscapes: When do spatial pattern and dispersal behaviour really matter? Ecol. Model. 2002, 147, 23–39. [Google Scholar] [CrossRef]
  8. Minor, E.S.; Urban, D.L. A graph-theory framework for evaluating landscape connectivity and conservation planning. Conserv. Biol. 2008, 22, 297–307. [Google Scholar] [CrossRef] [PubMed]
  9. Bodin, Ö.; Norberg, J. A network approach for analyzing spatially structured populations in fragmented landscape. Landsc. Ecol. 2007, 22, 31–44. [Google Scholar] [CrossRef]
  10. Zetterberg, A.; Mörtberg, U.M.; Balfors, B. Making graph theory operational for landscape ecological assessments, planning, and design. Landsc. Urban Plan. 2010, 95, 181–191. [Google Scholar] [CrossRef]
  11. Treby, D.L.; Castley, J.G. Distribution and abundance of hollow-bearing trees in urban forest fragments. Urban For. Urban Green. 2015, 14, 655–663. [Google Scholar] [CrossRef] [Green Version]
  12. Turrini, T.; Knop, E. A landscape ecology approach identifies important drivers of urban biodiversity. Glob. Chang. Biol. 2015, 21, 1652–1667. [Google Scholar] [CrossRef]
  13. Evans, K.L.; Newson, S.E.; Gaston, K.J. Habitat influences on urban avian assemblages. Ibis 2009, 151, 19–39. [Google Scholar] [CrossRef]
  14. Kang, W.; Minor, E.S.; Park, C.R.; Lee, D. Effects of habitat structure, human disturbance, and habitat connectivity on urban forest bird communities. Urban Ecosyst. 2015, 18, 857–870. [Google Scholar] [CrossRef]
  15. Shanahan, D.F.; Miller, C.; Possingham, H.P.; Fuller, R.A. The influence of patch area and connectivity on avian communities in urban revegetation. Biol. Conserv. 2011, 144, 722–729. [Google Scholar] [CrossRef]
  16. Suarez-Rubio, M.; Ille, C.; Bruckner, A. Insectivorous bats respond to vegetation complexity in urban green spaces. Ecol. Evol. 2018, 8, 3240–3253. [Google Scholar] [CrossRef] [Green Version]
  17. Clergeau, P.; Burel, F. The role of spatio-temporal patch connectivity at the landscape level: An example in a bird distribution. Landsc. Urban Plan. 1997, 38, 37–43. [Google Scholar] [CrossRef]
  18. Ferreras, P. Landscape structure and asymmetrical inter-patch connectivity in a metapopulation of the endangered Iberian lynx. Biol. Conserv. 2001, 100, 125–136. [Google Scholar] [CrossRef]
  19. Opdam, P.; Wascher, D. Climate change meets habitat frag-mentation: Linking landscape and biogeographical scale levels inresearch and conservation. Biol. Conserv. 2004, 117, 285–297. [Google Scholar] [CrossRef]
  20. Munshi-South, J. Urban landscape genetics: Canopy cover predicts gene flow between white-footed mouse (Peromyscus leucopus) populations in New York City. Mol. Ecol. 2012, 21, 1360–1378. [Google Scholar] [CrossRef] [PubMed]
  21. Nor, A.N.M.; Corstanje, R.; Harris, J.A.; Grafius, D.R.; Siriwardena, G.M. Ecological connectivity networks in rapidly expanding cities. Heliyon 2017, 3, e00325. [Google Scholar] [CrossRef] [Green Version]
  22. Egerer, M.; Anderson, E. Social-Ecological Connectivity to Understand Ecosystem Service Provision across Networks in Urban Landscapes. Land 2020, 9, 530. [Google Scholar] [CrossRef]
  23. Heleno, R.H.; Ross, G.; Everard, A.; Memmott, J.; Ramos, J.A. Short communication the role of avian “seed predators” as seed dispersers. Ibis 2011, 153, 199–203. [Google Scholar] [CrossRef]
  24. Threlfall, C.G.; Law, B.; Banks, P.B. Sensitivity of insectivorous bats to urbanization: Implications for suburban conservation planning. Biol. Conserv. 2012, 146, 41–52. [Google Scholar] [CrossRef]
  25. Ossola, A.; Locke, D.; Lin, B.; Minor, E. Yards increase forest connectivity in urban landscapes. Landsc. Ecol. 2019, 34, 2935–2948. [Google Scholar] [CrossRef]
  26. EU. Urban Agenda for the EUPact of Amsterdam. Netherlands Presidency of the Council of the European Union (EU), 2016. Available online: https://ec.europa.eu/futurium/en/system/files/ged/pact-of-amsterdam_en.pdf (accessed on 6 May 2022).
  27. City of Leipzig. Integriertes Stadtentwicklungskonzept SEKO 2020 (Integrated Urban Development Concept), Updated from Original SEKO 2009; Beschluss der 57. Ratsversammlung, Nr. RBIV-1595/09 vom 20.05.2009; Dezernat Stadtentwicklung und Bau, Stadtplanungsamt: Leipzig, Germany, 2015. [Google Scholar]
  28. Luo, Y.; Wu, J.; Wang, X.; Peng, J. Using stepping-stone theory to evaluate the maintenance of landscape connectivity under China’s ecological control line policy. J. Clean. Prod. 2021, 296, 126–356. [Google Scholar] [CrossRef]
  29. Lynch, A.J. Creating Effective Urban Greenways and Stepping-stones: Four Critical Gaps in Habitat Connectivity Planning Research. J. Plan. Lit. 2019, 34, 131–155. [Google Scholar] [CrossRef]
  30. Taylor, P.D.; Fahrig, L.; Henein, K.; Merriam, G. Connectivity is a vital element of landscape structure. Oikos 1993, 68, 571–573. [Google Scholar] [CrossRef] [Green Version]
  31. Tischendorf, L.; Fahring, L. On the usage and measurement of landscape connectivity. Oikos 2000, 90, 7–19. [Google Scholar] [CrossRef] [Green Version]
  32. Gurrutxaga, M.; Lozano, P.J.; del Barrio, G. GIS-based approach for incorporating the connectivity of ecological networks into regional planning. J. Nat. Conserv. 2010, 18, 318–326. [Google Scholar] [CrossRef]
  33. Lookingbill, T.R.; Minor, E.S. Assessing Multi-Scale Landscape Connectivity Using Network Analysis. In Learning Landscape Ecology; Gergel, S., Turner, M., Eds.; Springer: Berlin, Germany, 2017. [Google Scholar]
  34. Wang, B.Y.; Liu, Z.C. Functional connectivity analyses and construction strategies of the structure of green space network in Haidian district of Beijing. Landsc. Archit. Front. 2019, 7, 34–51. [Google Scholar] [CrossRef]
  35. Cox, D.T.C.; Inger, R.; Hancock, S.; Anderson, K.; Gaston, K.J. Movement of feeder using songbirds: The influence of urban features. Sci. Rep. 2016, 6, 37669. [Google Scholar] [CrossRef] [PubMed] [Green Version]
  36. Dave, W. Wildlife Corridor Analysis Methods Summary and Results; Public Works Dept. Natural Resources Division: Bellingham, WA, USA, 2021. [Google Scholar]
  37. Hanks, E.M.; Hooten, M.B. Circuit Theory and Model-Based Inference for Landscape Connectivity. J. Am. Stat. Assoc. 2013, 108, 22–33. [Google Scholar] [CrossRef]
  38. Marrotte, R.R.; Bowman, J. The relationship between least-cost and resistance distance. PLoS ONE 2017, 12, e0174212. [Google Scholar] [CrossRef] [PubMed] [Green Version]
  39. Balbi, M.; Petit, E.J.; Croci, S.; Nabucet, J.; Georges, R.; Madec, L.; Ernoult, A. Ecological relevance of least cost path analysis: An easy implementation method for landscape urban planning. J. Environ. Manag. 2019, 244, 61–68. [Google Scholar] [CrossRef] [PubMed]
  40. Etherington, T.R. Least-Cost Modelling and Landscape Ecology: Concepts, Applications, and Opportunities. Curr. Landsc. Ecol. Rep. 2016, 1, 40–53. [Google Scholar] [CrossRef] [Green Version]
  41. Saura, S.; Hortal, P.L. A new habitat availability index to integrate connectivity in landscape conservation planning: Comparison with existing indices and application to a case study. Landsc. Urban Plan. 2007, 83, 91–103. [Google Scholar] [CrossRef]
  42. Fanhua, K.; Haiwei, Y.; Nobukazu, N.; Zong, Y. Urban green space network development for biodiversity conservation: Identification based on graph theory and gravity modeling. Landsc. Urban Plan. 2010, 95, 16–27. [Google Scholar]
  43. Bodin, Ö.; Tengo¨, M.; Norman, A.; Lundberg, J.; Elmqvist, T. The value of small size: Loss of forest patches and ecological thresholds in southern Madagascar. Ecol. Appl. 2006, 16, 440–451. [Google Scholar] [CrossRef] [PubMed] [Green Version]
  44. Urban, D.; Keitt, T. Landscape connectivity: A graph-theoretic perspective. Ecology 2001, 82, 1205–1218. [Google Scholar] [CrossRef]
  45. Jacoby, D.M.P.; Freeman, R. Emerging Network-Based Tools Movement Ecology. Trends Ecol. Evol. 2016, 31, 301–314. [Google Scholar] [CrossRef] [PubMed]
  46. Xiu, N.; Ignatieva, M.; van den Bosch, C.K.; Chai, Y.; Wang, F.; Cui, T.; Yang, F. A socio-ecological perspective of urban green networks: The Stockholm case. Urban Ecosyst. 2017, 20, 729–742. [Google Scholar] [CrossRef] [Green Version]
  47. Calabrese, J.M.; Fagan, W.F. A comparison-shopper’s guide to connectivity metrics. Front. Ecol. Environ. 2004, 2, 529–536. [Google Scholar] [CrossRef]
  48. Keitt, T.H.; Urban, D.L.; Milne, B.T. Detecting critical scales in fragmented landscapes. Conserv. Ecol. 1997, 1, 4. [Google Scholar]
  49. Pascual-Hortal, L.; Santiago, S. Comparison and development new graph-based landscape connectivity indices: Towards the priorization of habitat patches and corridors for conservation. Landsc. Ecol. 2006, 21, 959–967. [Google Scholar] [CrossRef]
  50. Andersson, E.; Bodin, Ö. Practical tool for landscape planning? An empirical investigation of network based models of habitat fragmentation. Ecography 2009, 32, 123–132. [Google Scholar] [CrossRef]
  51. Janssen, M.A.; Bodin, O.; Anderies, J.M.; Elmqvist, T.; Ernstson, H.; McAllister, R.R.J.; Olsson, P.; Ryan, P. Toward a network perspective of the study of resilience in social–ecological systems. Ecol. Soc. 2006, 11, 15. [Google Scholar] [CrossRef] [Green Version]
  52. Rink, D.; Haase, A.; Grossmann, K.; Couch, C.; Cocks, M. From long-term shrinkage to regrowth? A comparative study of urban development trajectories of Liverpool and Leipzig. Built Environ. 2012, 38, 162–178. [Google Scholar] [CrossRef]
  53. Wolff, M.; Haase, A.; Haase, D.; Kabisch, N. The impact of urban regrowth on the built environment. Urban Stud. 2017, 54, 2683–2700. [Google Scholar] [CrossRef]
  54. City of Leipzig. Integriertes Stadtentwicklungskonzept INSEK 2030 (Integregated Urban Development Concpet); Dezernat Stadtentwicklung und Bau, Stadtplanungsamt: Leipzig, Germany, 2020. [Google Scholar]
  55. Banzhaf, E.; Thomas, A.; Ladiges, J. Potenziale städtischer Gewerbebrachflächen für eine integrierte Stadtentwicklung. Disp-Plan. Rev. 2018, 54, 26–43. [Google Scholar] [CrossRef]
  56. Schumacher, U.; Meinel, G. ATKIS, ALK(IS), Orthobild—Vergleich von Datengrundlagen eines Flächenmonitorings. In Flächennutzungsmonitoring. Konzepte—Indikatoren–Statistik; Meinel, G., Schumacher, U., Eds.; Shaker-Verlag: Aachen, Germany, 2009; pp. 47–67. [Google Scholar]
  57. Cvejic, R.; Eler, K.; Pintar, M.; Zeleznikar, S.; Haase, D.; Kabisch, N.; Strohbach, M.W. A Typology of Urban Green Spaces, Ecosystem Services Provisioning and Demands. Report D3.1. 2015. Available online: https://greensurge.eu/working-packages/wp3/files/D3.1_Typology_of_urban_green_spaces_1_.pdf (accessed on 10 September 2021).
  58. City of Leipzig. INKOBRA Dataset on Brownfields Based on Catastral Information 1998 to 2020; Dezernat Stadtentwicklung und Bau, Stadtplanungsamt: Leipzig, Germany, 2020. [Google Scholar]
  59. Copernicus. High Resolution Layers. Available online: https://land.copernicus.eu/pan-european/high-resolution-layers (accessed on 6 May 2022).
  60. European Union; Copernicus Land Monitoring Service CLMS; European Environment Agency (EEA). HRL Forest 2018 Product User Manual 2021. Available online: https://land.copernicus.eu/user-corner/technical-library/forest-2018-user-manual.pdf (accessed on 6 May 2022).
  61. Vogt, P.; Riitters, K. GuidosToolbox: Universal digital image object analysis. Eur. J. Remote Sens. 2017, 50, 352–361. [Google Scholar] [CrossRef]
  62. Ostapowicz, K.; Vogt, P.; Riitters, K.; Kozak, J.; Estreguil, C. Impact of Scale on Morphological Spatial Pattern of Forest. Landsc. Ecol. 2008, 23, 1107–1117. [Google Scholar] [CrossRef]
  63. Mollashahi, H.; Szymura, M.; Szymura, T.H. Connectivity assessment and prioritization of urban grasslands as a helpful tool for effective management of urban ecosystem services. PLoS ONE 2020, 15, e0244452. [Google Scholar] [CrossRef] [PubMed]
  64. Graphab. Documentation. Available online: https://sourcesup.renater.fr/www/graphab/en/home.html (accessed on 6 May 2022).
  65. Marzluff, J.M.; DeLap, J.H.; Oleyar, M.D.; Whittaker, K.A.; Gardner, B. Breeding Dispersal by Birds in a Dynamic Urban Ecosystem. PLoS ONE 2016, 11, e0167829. [Google Scholar] [CrossRef] [PubMed] [Green Version]
  66. Völkl, W.; Blick, T.; Kornacker, P.; Martens, H. Quantitativer Überblick über die rezente Fauna von. Deutschland. Mollusca 2004, 1, 4. [Google Scholar]
  67. Bergsten, A.; Galafassi, D.; Bodin, Ö. The problem of spatial fit in social-ecological systems: Detecting mismatches between ecological connectivity and land management in an urban region. Ecol. Soc. 2014, 19, 6. [Google Scholar] [CrossRef]
  68. Rayfield, B.; Fortin, M.-J.; Fall, A. Connectivity for conservation: A framework to classify network measures. Ecology 2011, 92, 847–858. [Google Scholar] [CrossRef]
  69. Conefor Sensitode 2.2. Users Manuel Software for Quantifying the Importance of Habitat Patches for Landscape Connectivity through Graphs and Habitat Availability Indices. 2014. Available online: http://www.conefor.org/files/usuarios/CS22manual.pdf (accessed on 6 April 2022).
  70. Saura, S. Measuring connectivity in habitat mosaics: The equivalence of two existing network indices and progress beyond them. Community Ecol. 2010, 11, 217–222. [Google Scholar] [CrossRef] [Green Version]
  71. Saura, S.; Rubio, L. A common currency for the different ways in which patches and links can contribute to habitat availability and connectivity in the landscape. Ecography 2010, 10, 1618. [Google Scholar] [CrossRef]
  72. Haase, D.; Schwarz, N.; Strohbach, M.; Kroll, F.; Seppelt, R. Synergies, trade-offs, and losses of ecosystem services in urban regions: An integrated multiscale framework applied to the Leipzig-Halle region, Germany. Ecol. Soc. 2012, 17, 22. [Google Scholar] [CrossRef]
  73. Haase, D.; Wolff, M. Enabling ecosystem services at the neighborhood scale while allowing for urban regrowth: The case of Halle, Germany. Ecol. Soc. 2022, 27, 22. [Google Scholar] [CrossRef]
  74. Anguelovski, I.; Brand, A.L.; Connolly, J.J.T.; Corbera, E.; Kotsila, P.; Steil, J.; Garcia-Lamarca, M.; Triguero-Mas, M.; Cole, H.; Baró, F.; et al. Expanding the boundaries of justice in urban greening scholarship: Toward an emancipatory, antisubordination, intersectional, and relational approach. Ann. Am. Assoc. Geogr. 2020, 110, 1743–1769. [Google Scholar] [CrossRef]
  75. De Groot, R.S.; Blignaut, J.; van der Ploeg, S.; Aronson, J.; Elmqvist, T.; Farley, J. Benefits of Investing in Ecosystem Restoration. Conserv. Biol. 2013, 27, 1286–1293. [Google Scholar] [CrossRef] [PubMed] [Green Version]
  76. Pauleit, S.; Zölch, T.; Hansen, R.; Randrup, T.B.; Konijnendijk van den Bosch, C. Nature-based Solutions and Climate Change—Four Shades of Green. In Nature-Based Solutions to Climate Change in Urban Areas—Linkages of Science, Society and Policy; Kabisch, N., Bonn, A., Korn, H., Stadler, J., Eds.; Springer: New York, NY, USA, 2017. [Google Scholar]
  77. Lausch, A.; Bastian, O.; Klotz, S.; Leitão, P.J.; Jung, A.; Rocchini, D.; Schaepman, M.E.; Skidmore, A.K.; Tischendorf, L.; Knapp, S.; et al. Understanding and assessing vegetation health by in-situ species and remote sensing approaches. Methods Ecol. Evol. 2018, 9, 1799–1809. [Google Scholar] [CrossRef]
  78. Preston, P.D.; Dunk, R.M.; Smith, G.R.; Cavan, G. Not all brownfields are equal: A typological assessment reveals hidden green space in the city. Landsc. Urban Plan. 2023, 229, 104590. [Google Scholar] [CrossRef]
  79. IUCN. The IUCN Urban Nature Indices: A Methodological Framework; IUCN: Cambridge, UK, 2022; 32p. [Google Scholar]
Figure 1. Schematic overview for detecting critical network structures as areas with low redundancy and associated exposed nodes after ([10], p. 186).
Land 12 00333 g001
Figure 2. Workflow showing data input (step 1), data processing steps (step 2), and data analysis steps (step 3). The data processing consists of a Morphological Spatial Pattern Analysis (MSPA) using Guidos Toolbox resulting in 7 MSPA classes (2.1) and a Functional Connectivity Analysis (FCA) using Graphab for 3 dispersal distances (2.2). The data analysis consists of a spatial explicit analysis of dPC and its 3 fractions (dPCintra, dPCflux, dPCconnector) for 10 land use categories (3.1), the evaluation of the contribution of 466 revitalised patches for the ecological connectivity using dPC and canopy area for 6 measurement categories annually between 1998 and 2020 (3.2), and the detection of the importance of 239 brownfields for the functional connectivity, and the potential of the renaturation of 521 brownfields (3.3).
Land 12 00333 g002
Figure 3. Characteristics of the functional connectivity of urban tree systems (UTS) in Leipzig highlighting the overall importance of patches (a: node size), the individual contribution to this importance with respect to three fractions (b: node colour), and the relevance of individual paths (c: edge size/colour).
Land 12 00333 g003
Figure 4. Variation of functional connectivity metrics for the urban tree systems (UTS) in Leipzig differentiated by land use categories. Box plots for (a) the loss of global connectivity caused by the deletion of an element (dPC), (b) the importance due to size (dPCintra), (c) the potential for interaction with other habitat patches (dPCflux), (d) the importance as a stepping stone (dPCconnector), and (e) share of canopy on total patch area (canopy share) are displayed.
Land 12 00333 g004
Figure 5. Share of (a) revitalised canopy cover and (b) the associated contribution to the functional connectivity of urban tree systems (UTS) in Leipzig per year and the measurement of revitalisation from 1998 to 2020.
Land 12 00333 g005
Figure 6. Location of revitalised measurements of brownfields between 1998 and 2020, as well as illustration of examples for selected measurements with a corresponding high functional connectivity (dPC value).
Land 12 00333 g006
Figure 7. Prioritisation of existing (a) and renatured (b) brownfield nodes according to their role as stepping stones and their criticalness.
Land 12 00333 g007
Disclaimer/Publisher’s Note: The statements, opinions and data contained in all publications are solely those of the individual author(s) and contributor(s) and not of MDPI and/or the editor(s). MDPI and/or the editor(s) disclaim responsibility for any injury to people or property resulting from any ideas, methods, instructions or products referred to in the content.

