Article

More Urban Elderly Care Facilities Should Be Placed in Densely Populated Areas for an Aging Wuhan of China

1
School of Public Administration, Hubei University, Wuhan 430062, China
2
School of Geography Science and Geomatics Engineering, Suzhou University of Science and Technology, Suzhou 215009, China
3
School of Public Administration, China University of Geosciences, Wuhan 430074, China
*
Author to whom correspondence should be addressed.
Land 2023, 12(1), 220; https://doi.org/10.3390/land12010220
Submission received: 2 December 2022 / Revised: 3 January 2023 / Accepted: 8 January 2023 / Published: 10 January 2023
(This article belongs to the Special Issue Big Data Analytics, Spatial Optimization for Land Use Planning)

Abstract

:
Global aging is getting worse, especially in China, a country with a large population. It is urgently needed to plan the site of new urban elderly care facilities for an aging society. Based on point of interest data and machine learning algorithms, we established a site selection model of urban elderly care facilities for Wuhan in China and selected potential optimal sites for new urban elderly care facilities. We found that 2059 of the 31,390 grids with a resolution of 500 m × 500 m of Wuhan are priority layout grids for new urban elderly care facilities. A total of 635 priority grids were further selected based on the agglomeration degree of the aging population in each street. They are mainly distributed in the areas with a concentrated aging population within the Second Ring Road around the urban centers. Additionally, some outer suburban streets with a relatively high aging degree also require immediate facility construction. The point of interest data and machine learning algorithms to select the location of urban elderly care facilities can optimize their overall configuration and avoid the subjectivity of site selection to some degree, provide empirical support for how to achieve a good configuration of “population–facilities” in space, and continuously improve the science of the spatial allocation of elderly care facilities.

1. Introduction

Nowadays, the aging of the population is a common concern of the international community. The global proportion of the population aged 65 and over rose from 5% in 1960 to 9% in 2018, and it is expected to rise to 16% by 2050 [1]. The rapid growth of the elderly population has become a prominent phenomenon in many countries, including developed countries such as the United States [2], Germany [3], Canada [4], and Japan [5], and developing countries such as China [6]. Since the 21st century, the aging process in China has accelerated significantly, and the problem of elderly care has become increasingly prominent. With the increase in aging and the burden of family retirement, there is a growing demand for elderly care facilities [7]. Whether the allocation of elderly care facilities is reasonable or not is very important for the improvement of urban quality and the realization of social equity. However, the location of elderly care facilities is affected by various existing infrastructure and service facilities in the surrounding area and the number of elderly people in the area [8], making it difficult to determine a suitable location for construction. As a result, it is urgently necessary to find an excellent method to determine the spatial layout of urban elderly care facilities [9].
Much work has been done in related studies of the spatial layout of urban elderly care facilities [10,11,12,13]. They can be divided into three categories. The first is the fairness assessment of the spatial distribution of elderly care facility resources, which emphasizes that public services for the elderly should be given to each elderly group fairly and equitably [14,15,16,17]. The second is the efficiency of the spatial allocation of elderly-service resources. Their focus is on the distribution characteristics of elderly care facilities [18], their coupling relationship with the population and the accessibility of elderly care facilities [19,20], and the spatial distribution equilibrium and continuity of service facilities [21,22,23]. The third is simulation and prediction of the scale, type, and spatial planning of elderly care facilities [24,25,26]. However, most of them focused on a coarse scale, and the high-resolution site selection studies on the street and even finer scales are scarce, which is not accurate enough to guide the government’s decision-making.
As Point of Interest (POI) data and artificial intelligence algorithms, including machine learning, are increasingly available [27,28,29,30,31,32,33], they provide a possibility for filling these gaps [34,35].
As the world’s most big populous country, China also faces an aging problem. Based on data from the National Bureau of Statistics of China, the proportion of the population aged 65 and over in China reached 7.0% in 2000. Moreover, there were 190.64 million persons in the age group of 65 and over, according to China’s seventh national census data, accounting for 13.5%. According to the WHO criteria for aging, when the ratio of the population aged 65 and over in a country or region exceeds 14%, the area has entered a deeply aging society [36]. Therefore, China will enter a profoundly aging society soon. However, in China, research on the locations of urban elderly care facilities is mainly concentrated in areas such as Beijing [37], Shanghai [38], and Guangzhou [39,40] because the aging first appeared there. In recent years, some new first-tier cities in China, including Hangzhou, Wuhan, Chengdu, and Zhengzhou, have developed rapidly, and their population aging phenomenon has become more and more serious. However, there are few studies on these cities, and the future layout of aging infrastructure in these new first-tier cities urgently needs the support of relevant research.
Therefore, in this study, we intend to construct a site selection model of urban elderly care facilities for Wuhan in China at the street/town level based on POI and machine learning algorithms to improve site selection’s rationality, objectivity, and efficiency. The model predicted optimal sites for new urban elderly care facilities in Wuhan. Section 2 introduces the study area, followed by “Materials and Methods” in Section 3. Subsequently, the results and discussion are presented in Section 4 with figures. Finally, we conclude our research with take-home messages for readers.

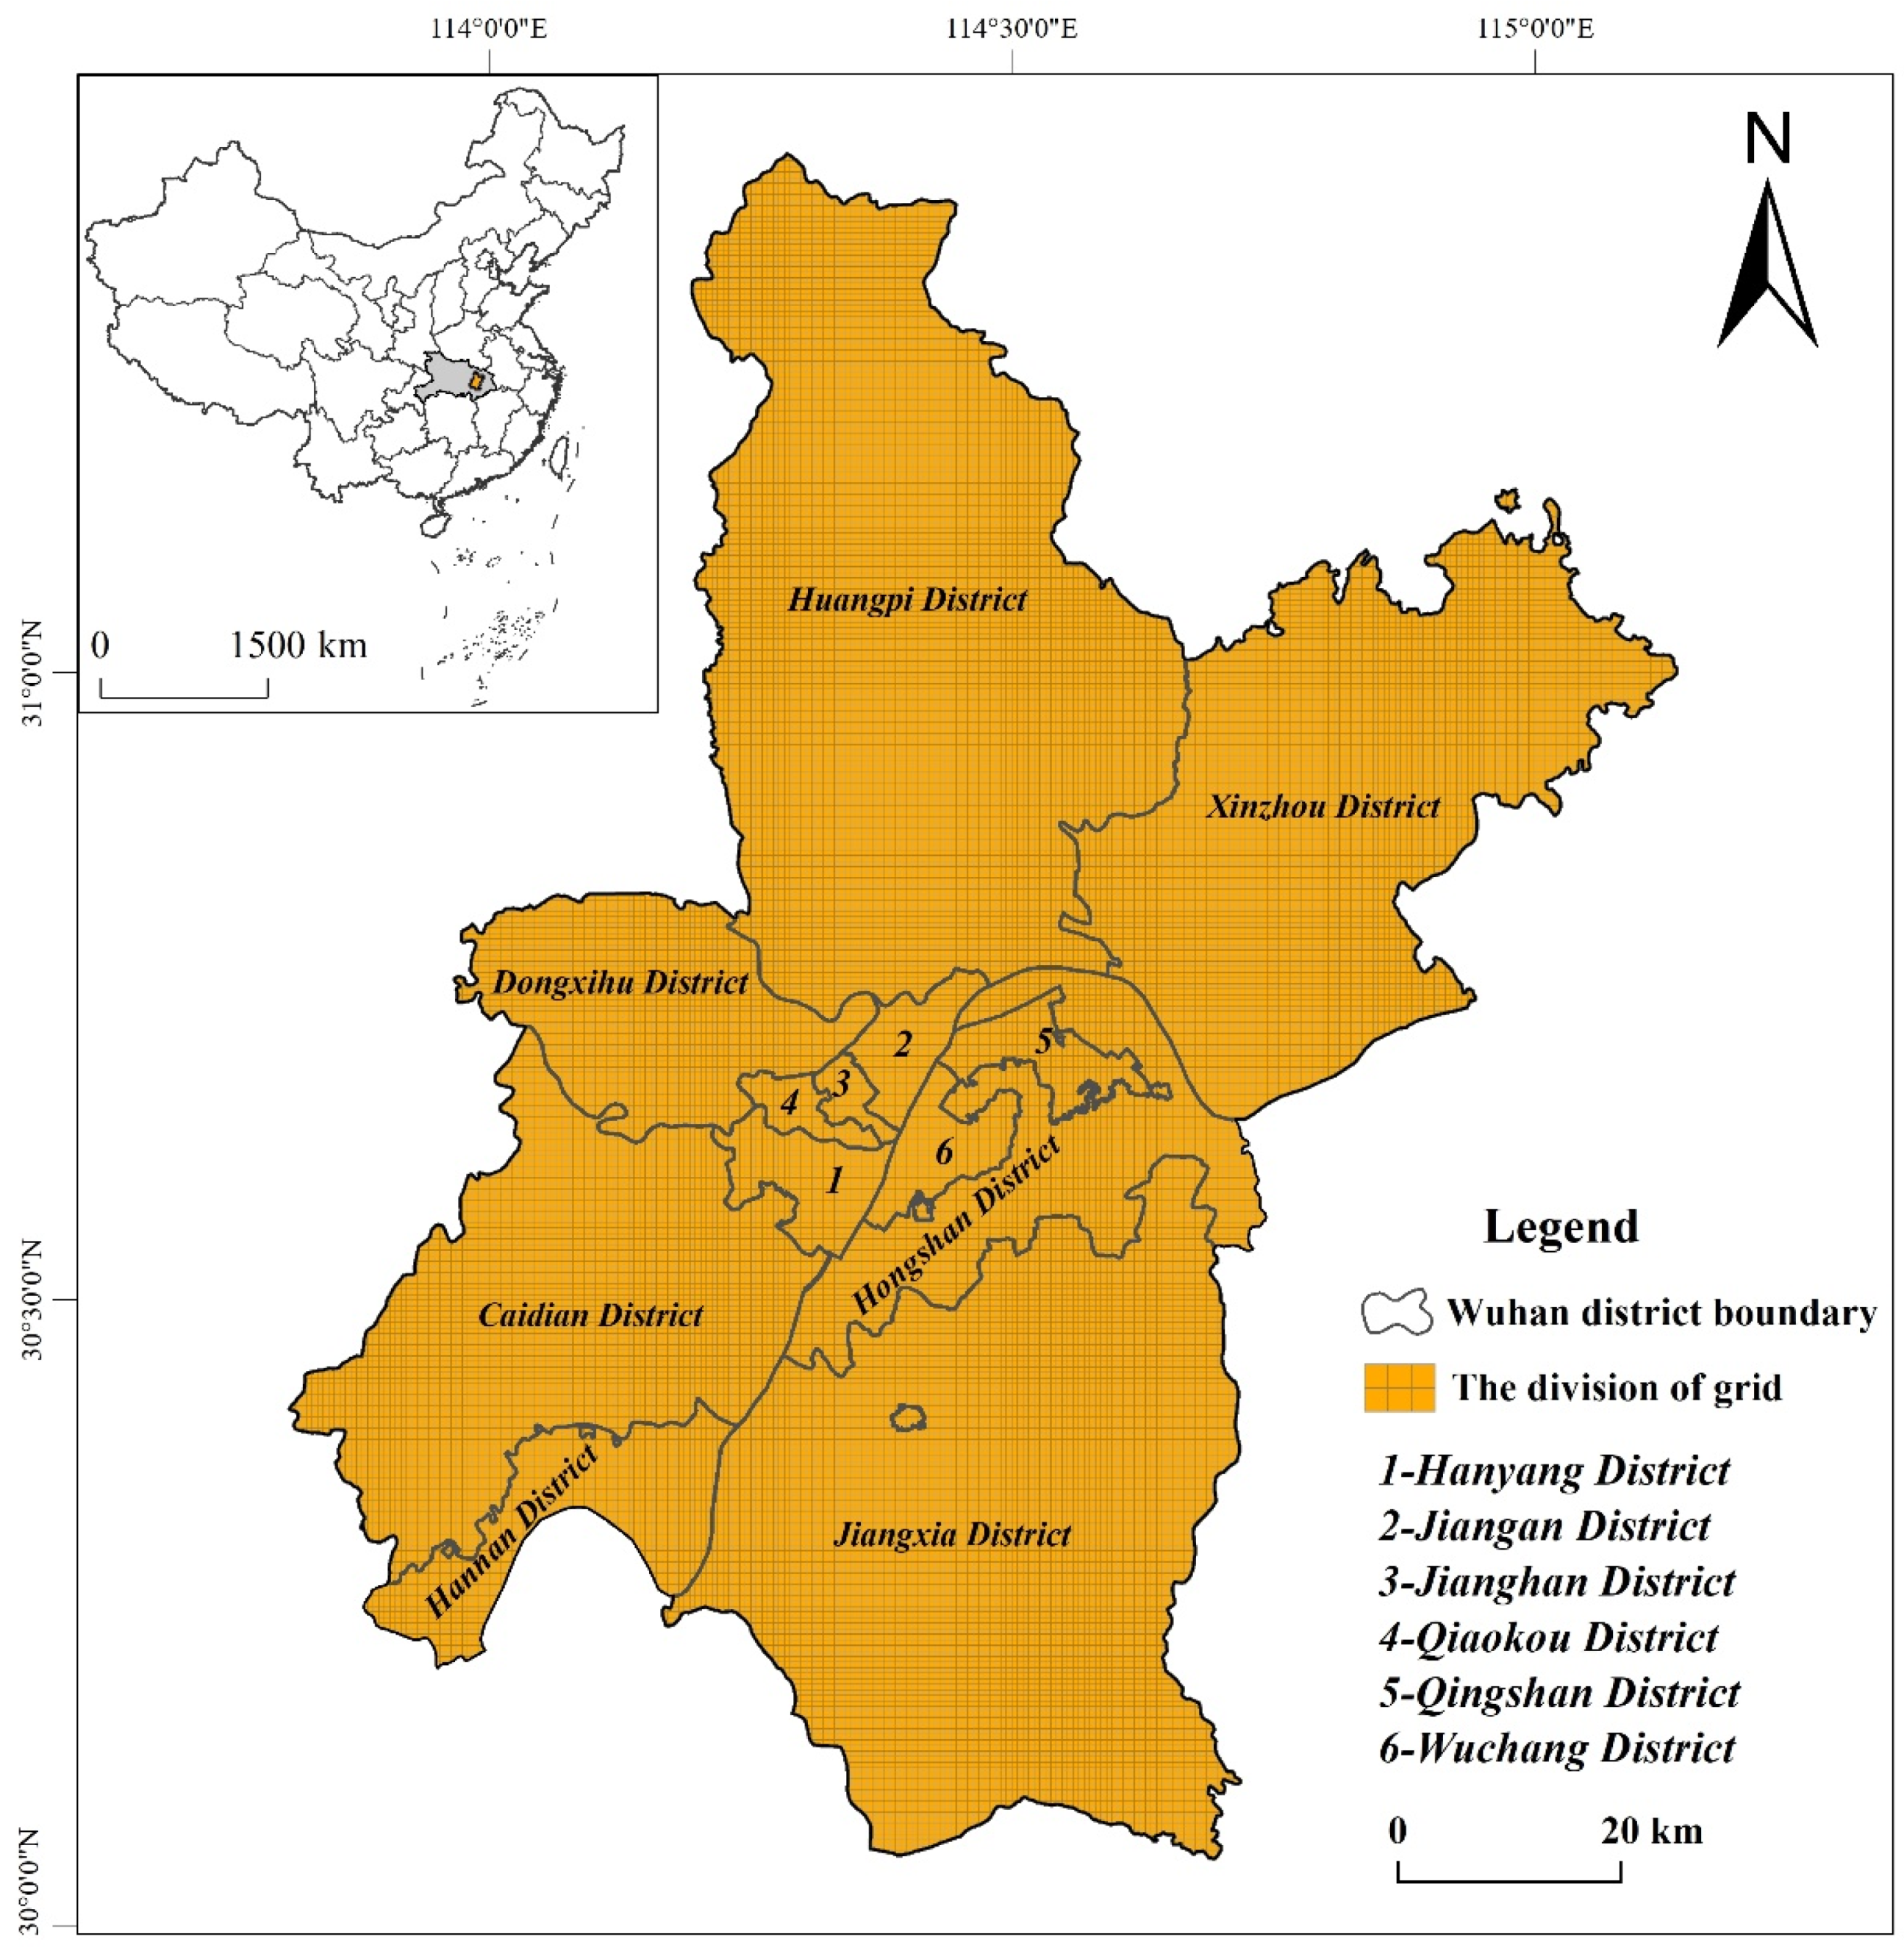
2. Brief Introduction to the Study Area

Wuhan is one of the largest cities in central China, and its aging problem has been severe in recent years and will continue to be for the near future. However, due to the insufficient amount and limited covering scope of urban elderly care facilities, it is urgent to establish a vast array of new urban elderly care facilities in Wuhan. Therefore, in this study, we attempt to conduct an empirical study on the site selection of urban elderly care facilities in Wuhan for subsequent policy implications.
Based on the data from Wuhan’s seventh population census, in 2020, Wuhan’s permanent urban population reached 13.65 million, and 2.01 million persons in the age group of 65 and over, accounting for 14.73%, which means that Wuhan’s population has entered a deep aging stage. According to the “Fourteenth Five-Year Plan for the Development of Civil Affairs in Wuhan”, by 2025, the coverage of elderly care facilities in urban and rural communities will reach 100% and 90%, respectively. That is to say, an urgent need exists in Wuhan to lay out and construct many new elderly care facilities. Scientifically selecting the location of these new elderly care facilities is a top priority in the near future. According to the distance that the elderly walk for 15 min [41], the service radius of urban community elderly care facilities should not exceed 500 m [42,43]. Therefore, we divided Wuhan into 31,390 grids with a resolution of 500 m × 500 m (Figure 1).

3. Materials and Methods

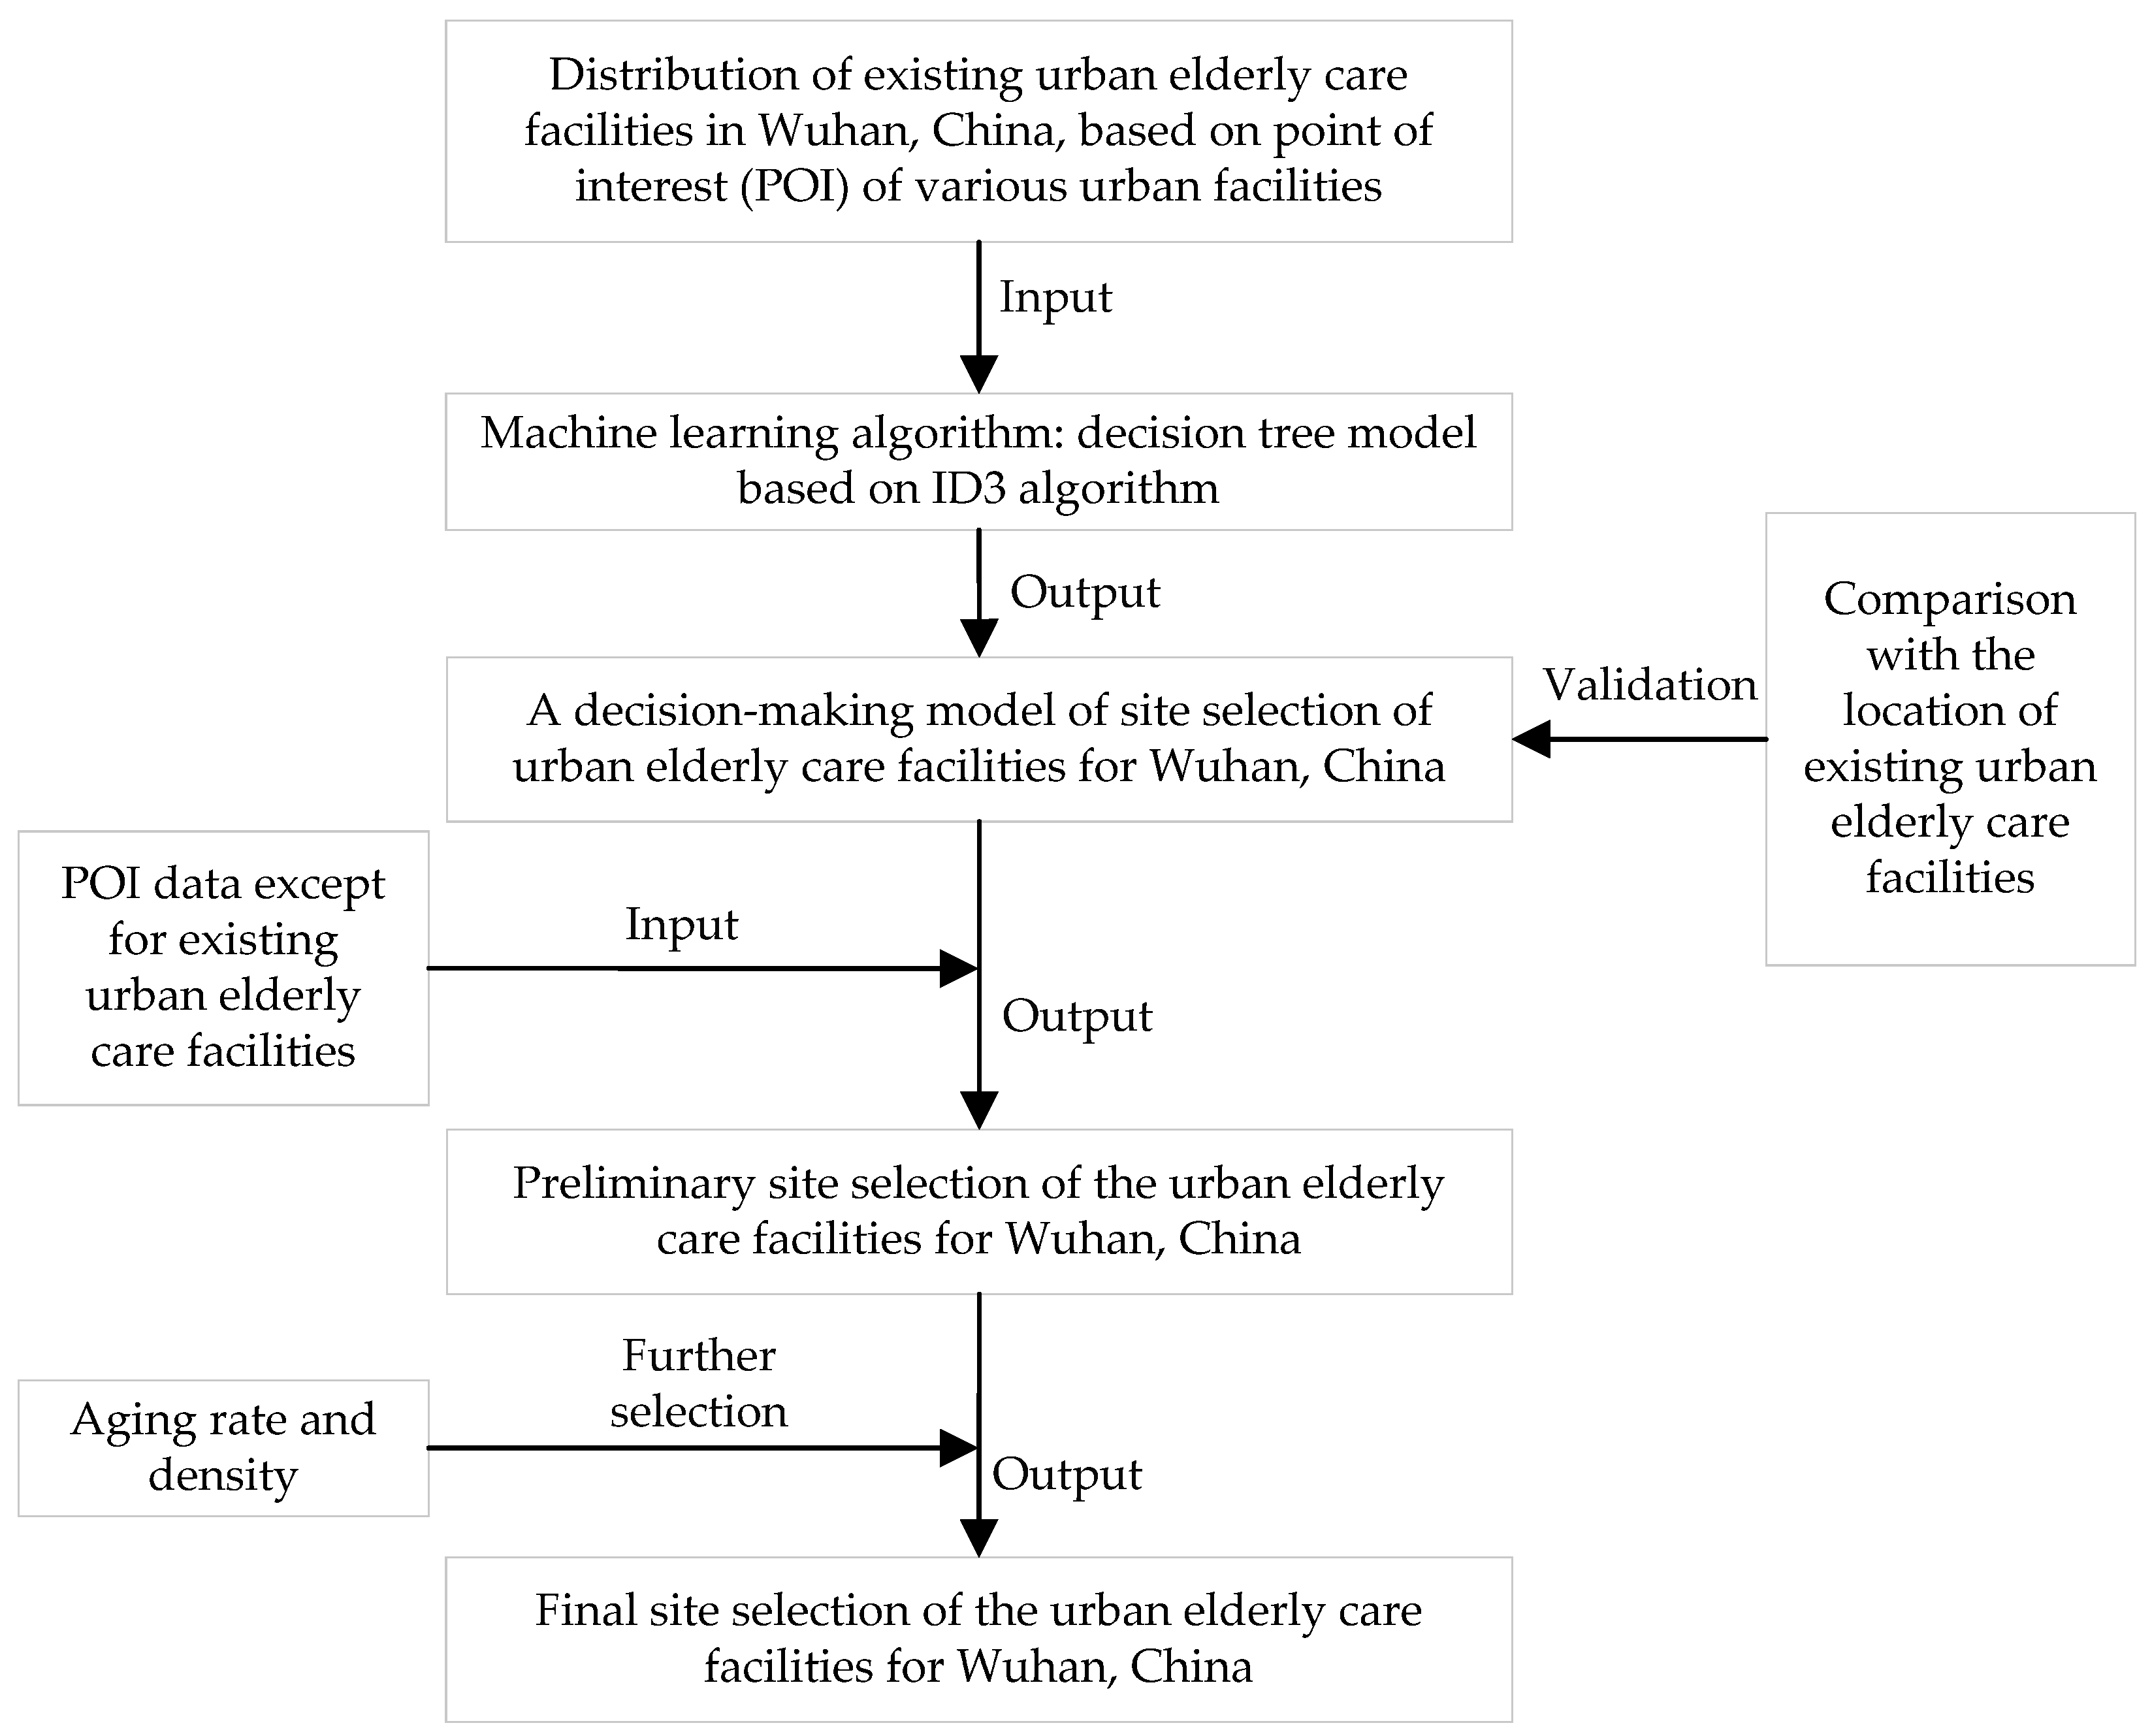
3.1. Methods for Site Simulation of New Urban Elderly Care Facilities

The method framework of this study is illustrated in Figure 2. First of all, existing urban elderly care facility grids in Wuhan were randomly selected as training sets. Then, based on the ID3 machine learning algorithm and using the sampled urban elderly care facilities, a decision tree model suitable for the location of urban elderly care facilities was trained. Next, the dataset outside the training set of urban elderly care facilities was used to evaluate the accuracy of the simulation results of the model. If the coincidence degree between the existing facilities and the simulation results exceeded 80%, the model would be reliable; otherwise, the training and optimizing process continued [44]. Subsequently, the model was utilized to predict the sites of new urban elderly care facilities. Finally, combined with the aging population density of each grid, the grids of urban elderly care facilities that should be built immediately were selected (Figure 2).
Specifically, in the existing grids of elderly-care facilities in Wuhan, 50% of them were randomly selected as the training set of the prediction model. Subsequently, the machine learning-ID3 algorithm was employed to simulate the distribution pattern of elderly care facilities considering the layout of elderly care facilities and other related infrastructure services in the sampled grids, and a preliminary positional decision-making model was obtained. Afterward, all grids outside the training set were taken as the prediction set. Then, according to the location decision model of elderly care facilities and the layout of various existing infrastructures in each grid, we predicted the suitability of construction of urban elderly care facilities, and then examined the fitting degree between prediction results and the existing elderly care facilities. The final test results exhibited a 95.7% match, indicating that the configuration of existing urban elderly care facilities was very consistent with the prediction. Therefore, the model is reliable and can be used to predict the sites of new urban elderly care facilities.

3.2. Point of Interest Data for Wuhan

The POI data of various urban facilities for Wuhan of China were acquired from the Application Programming Interface provided by the Baidu Map Company (https://map.baidu.com, accessed on 8 November 2021) for Internet users. The POI data was in database format, and the attributes contained basic information such as the name of the facility, its functional category, and latitude and longitude coordinates. Python conversion code converted the projection coordinate system of the POI data into the unified WGS84 geographic coordinate system. The total number of the POI of various urban facilities was 429,096, consisting of four primary categories (Table 1) and covering 13 municipal districts and 184 streets/towns in Wuhan. Furthermore, the distributional status of POI-based urban facilities in each grid was obtained using a spatial overlay with the help of ArcGIS software.
In this paper, urban elderly care facilities mainly include nursing homes, elderly nursing centers, elderly universities, elderly apartments, care centers, and social welfare centers, etc. There are 1004 POIs of urban elderly care facilities in Wuhan, which are mainly distributed within the Third Ring Road and the street communities or central towns of suburban cities and counties.

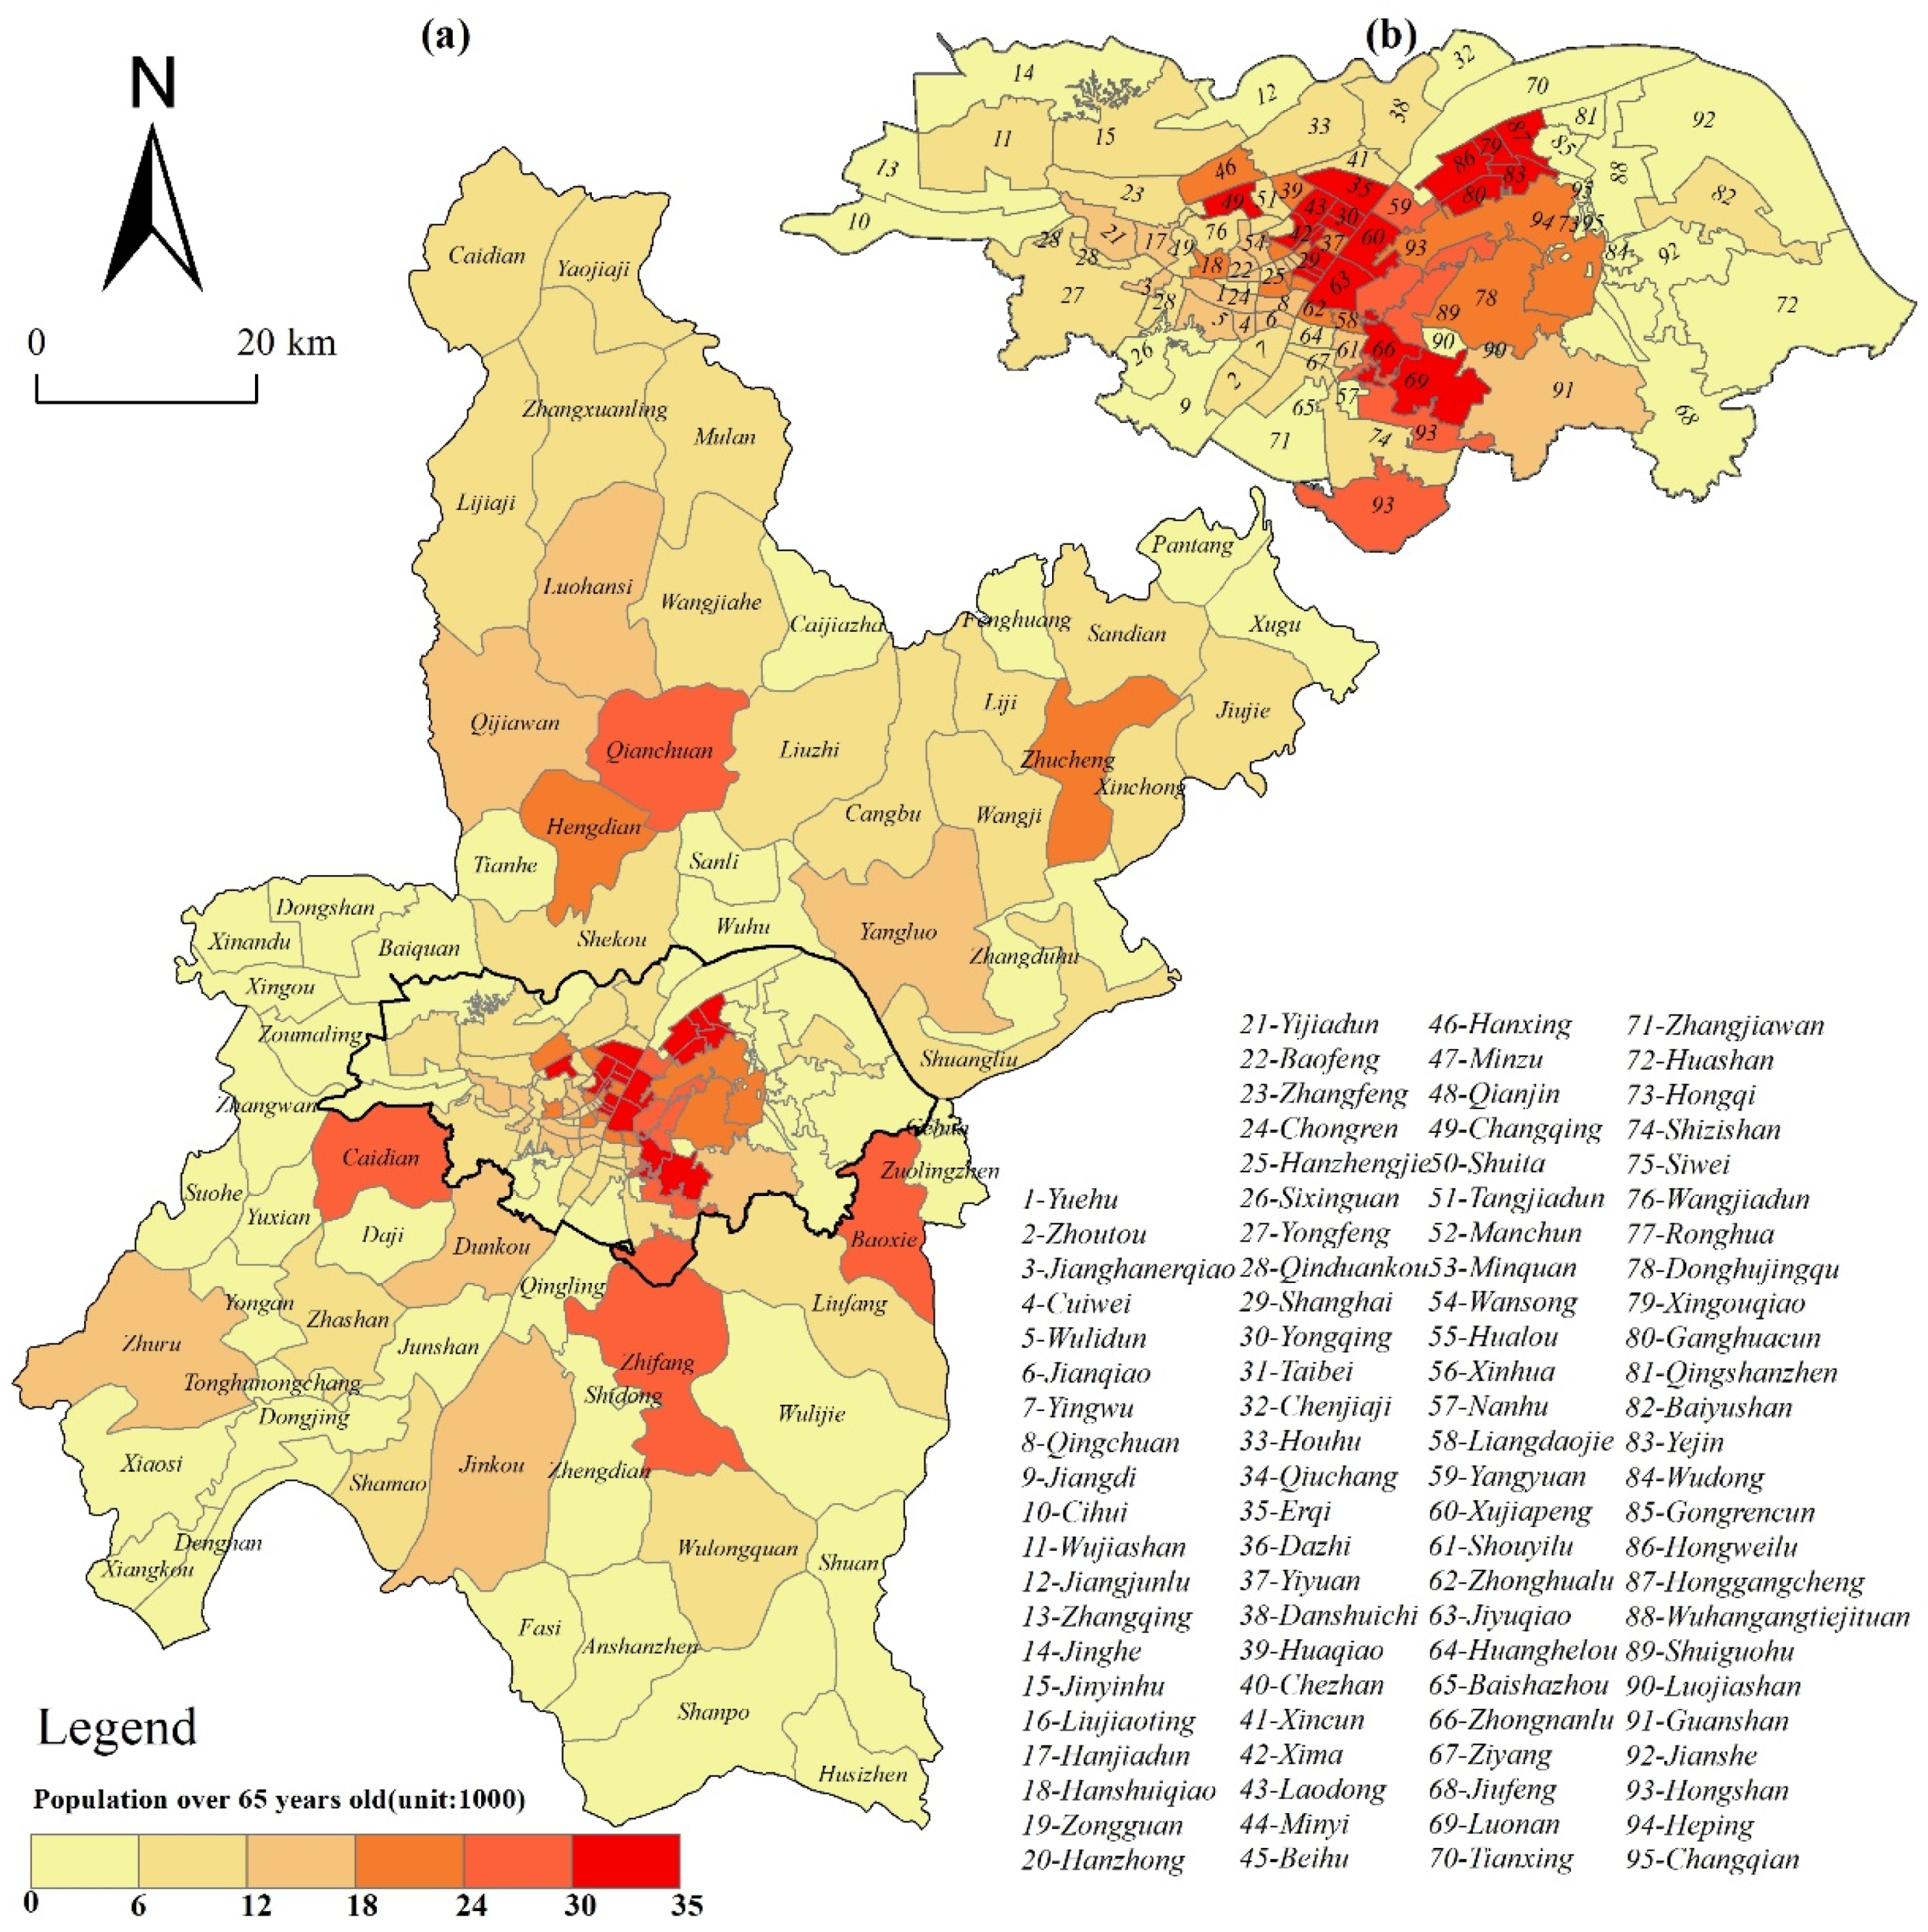
3.3. The Latest Aging Population Data for Wuhan

POI denotes the spatial pattern of urban facilities for 2020. The seventh population census data in 2020 was cited to get Wuhan’s latest street-level aged population (Figure 3). We found 10 streets with more than 20,000 people aged 65 and over in Wuhan. Moreover, there were 67 streets with more than 10,000 people aged 65 and over, accounting for 36.2% of the total streets. The spatial pattern of the aging population in Wuhan presents a gradual outward diffusion pattern that centers on the main urban area (Figure 3). At the same time, it appears to be a multiple-nuclei structure clustered with urban streets as the center in the outer suburbs.

4. Results and Discussion

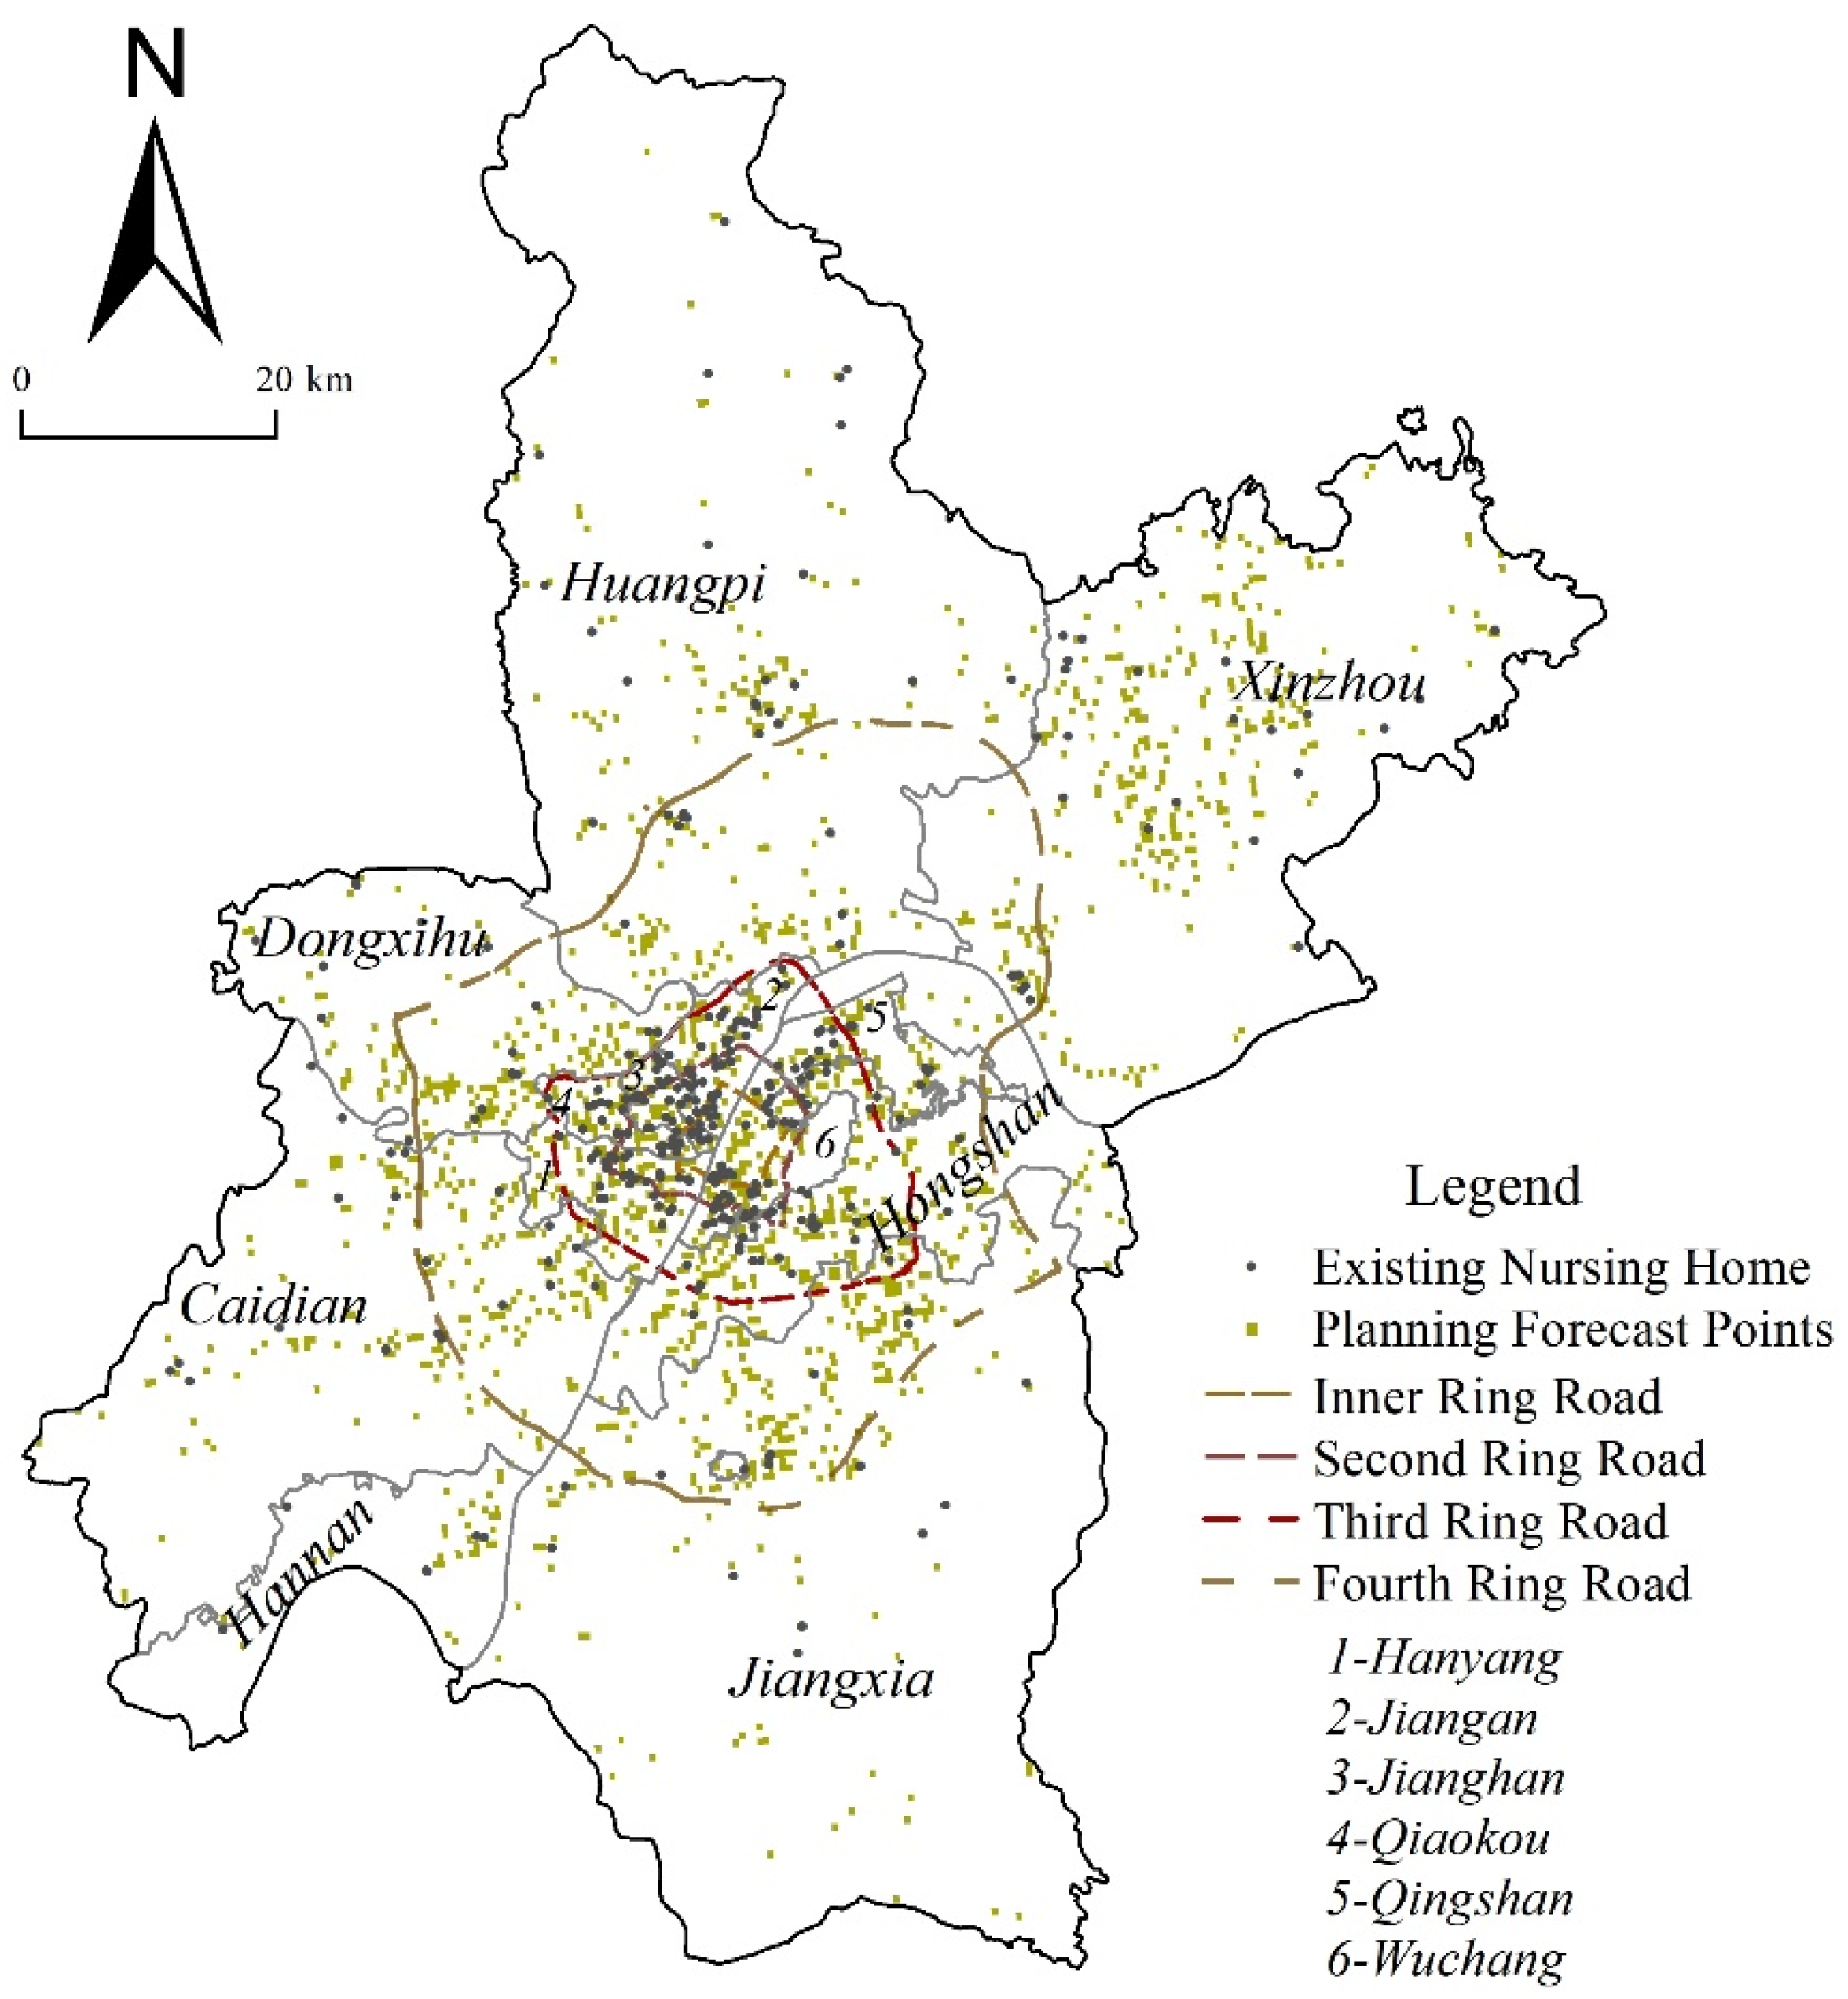
4.1. Initial Regions for the New Urban Elderly Care Facilities

After training the prediction model, we took the urban elderly care facilities in each grid as the dependent variable and the other 13 types of facilities as the independent variable to predict the site selection suitability of 31,390 grids in Wuhan, China. Our simulation results show that 2059 grids are suitable for new urban elderly care facilities (Figure 4). The suitable sites for new elderly care facilities are widely distributed in various streets (towns).
The initial simulation results show that the layout of new urban elderly care facilities in Wuhan is highly concentrated and evenly distributed within the Third Ring Road. Because the elderly care facilities cannot exist in isolation, they are bound to rely on medical, transport, communal, recreational, servicing, and other public facilities. Only combined with these can they play a better public service role. These facilities are widely distributed in all regions within the Third Ring Road. As a result, there are many potential sites for new elderly care facilities in the region that are evenly distributed. However, the prediction results outside the Third Ring Road exhibit significant distinctions. First, the potential sites of new elderly care facilities outside the Third Ring Road present prominent characteristics of spotted aggregation and mainly gather around the administrative center of each district. The suitable construction sites in other regions scatter sparsely in crucial towns. The main reason is that the regional distribution of infrastructure is significantly distinctive in the suburban areas of Wuhan outside the Third Ring Road. The infrastructures mainly concentrate on the main urban areas and critical towns. Other significant areas are in short supply of infrastructure closely related to elderly care facilities, which is not conducive to the new layout of elderly care facilities. Secondly, the prediction results of Huangpi, Xinzhou, and Caidian Districts possess apparent particularity compared with other regions. These three regions have more suitable sites for the location of elderly care facilities than other suburban areas, with the characteristics of multi-point aggregation, and the spatial regional configuration differences are prominent. Suitable location sites in Xinzhou District are mainly concentrated in the central north, while the eastern and southern areas have fewer ones. The central south of Huangpi District is highly centralized with possible site options, with only a few potential matches in the north; suitable location points of Caidian District are mainly situated in the northern area, and only a few scatter in the west and south.
The initial fitting results of 2059 new sites of elderly care facilities are only suitable for construction according to the completeness of facilities in surrounding cities. However, this massive number, far beyond that recently planned in Wuhan, does not match the density and scale of the aging population; the spatial layout of prediction and demand is still not optimal. Therefore, it is necessary to select and screen out the preliminary results. Then the sites of intense demand for construction can be given prior attention during the government’s decision-making process.

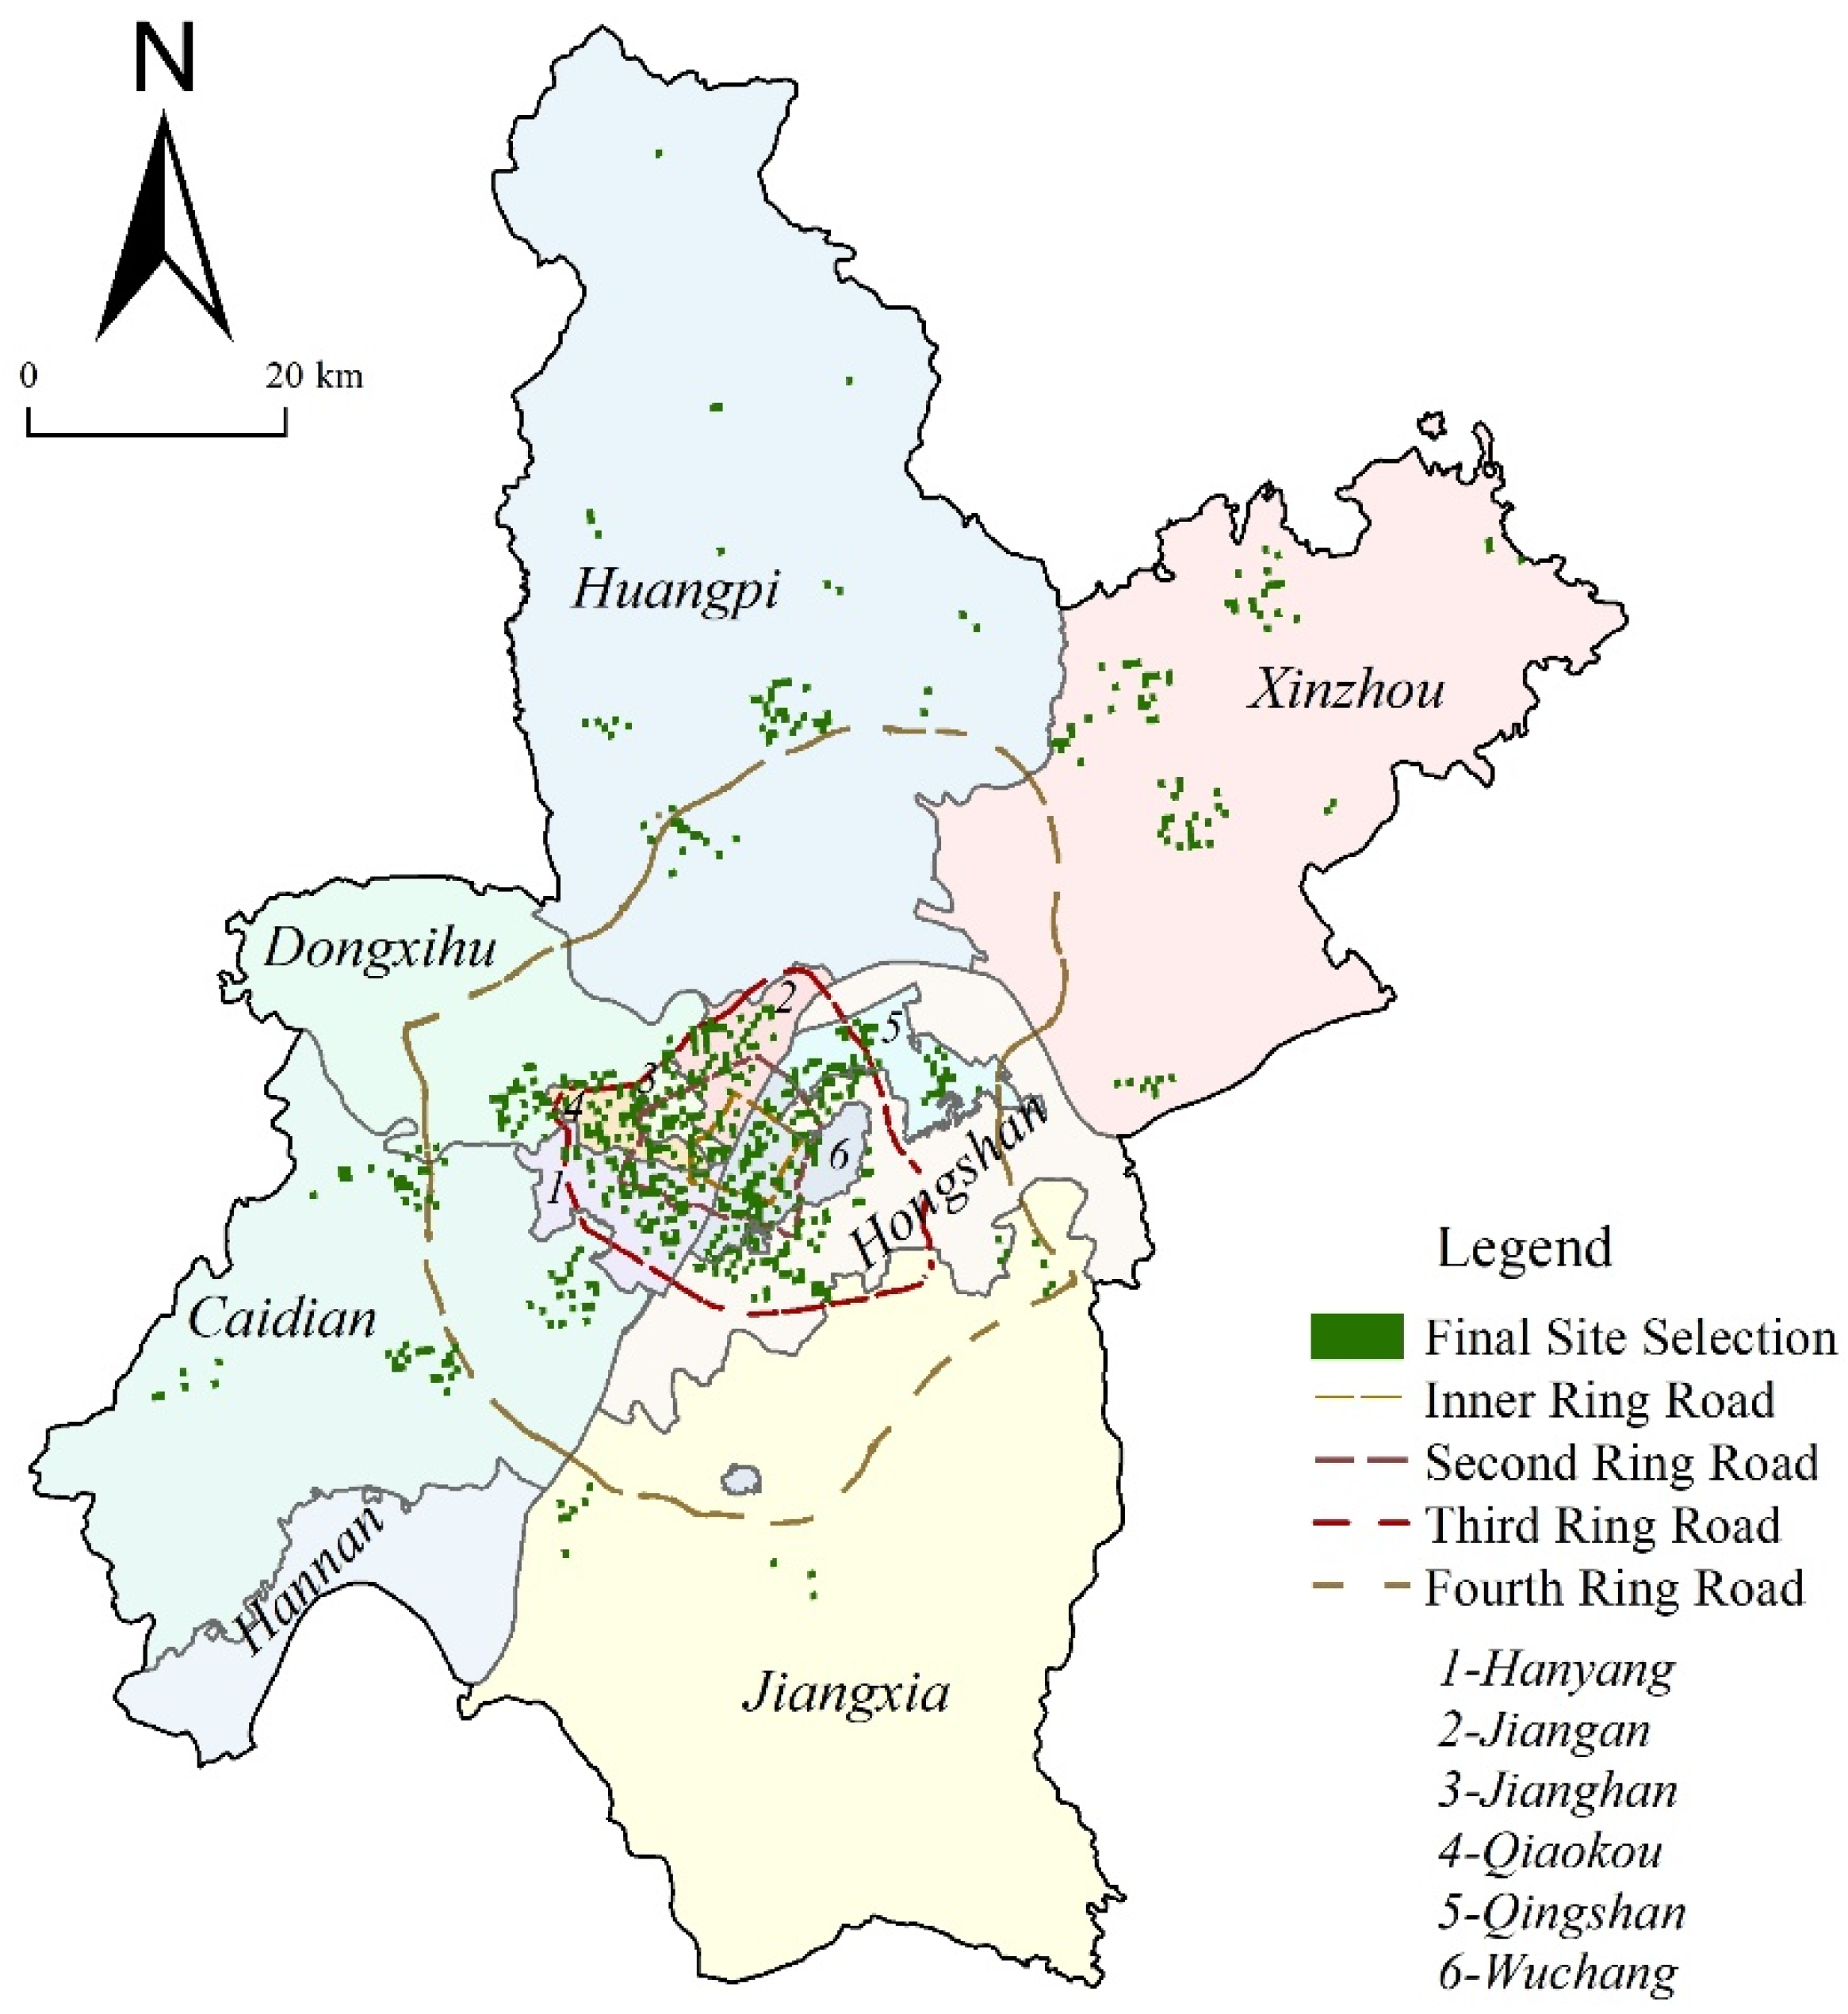
4.2. Final Regions for the New Elderly Care Facilities

A key consideration in the location decision for a new elderly care facility involves matching the population’s need for the services [45]. Firstly, calculate the aging rate of each street based on the total population of 184 streets and the elderly population of 65 and over. When the ratio of the population aged 65 and over exceeds 14%, this area has entered a deeply aging society. Therefore, the regions should be given priority when constructing new elderly care facilities. At the same time, the scale of the elderly is also an essential standard in deciding whether to build senior centers. For example, according to the aging data of streets in Wuhan, the average number of people aged 65 and over in every street of Wuhan has exceeded 3000; the selected streets are those with more than 3000 people aged 65 and over. The results show that there are 84 streets in Wuhan that meet the requirements. Then, ArcGIS is utilized to screen out and optimize the suitable sites in all grids covered by 84 streets and remove the grid of the existing layout of elderly care facilities. Finally, 635 matching grids where new elderly care facilities should be built are obtained (Figure 5).
As seen in Figure 5, all 84 severely aging streets in Wuhan have grids suitable for new elderly care facilities. There are many profoundly aging streets within the Second Ring Road of the city, with seven in the Wuchang District, among which two have a senior population of more than 12,000. Wuchang District is an administrative district with a relatively severe aging problem in Wuhan, but all various public facilities are well-equipped. Therefore, there exists a lavish array of possible location sites for new elderly care facilities. Jianghan and Jiang’an Districts are the ancient downtown areas of Wuhan, which also abound in deep aging streets, but the aging degree of these streets is slightly lower than that of the Wuchang District. Generally, the aging population of these streets ranges from 3000 to 6000. The aging degree of the area between the Second and the Third Ring Road of the city is relatively low. Only a few streets in the Wuchang district are gravely aging, but seven are in the Qingshan district. Qingshan District belongs to the old urban area of Wuhan. Many retired Wuhan Iron and Steel Plant employees live in this region, and the aging population is significant. Therefore, the layout of urban elderly care facilities should be increased. Streets outside the Third Ring Road are not evenly distributed in the deepened aging process. Hongshan, Qingshan, Jiangxia, Hannan, and other administrative districts have relatively few deepened aging streets.
Many areas in Hongshan district can be categorized as part of the high-tech developing zone of Wuhan. Due to certain requirements for the age of workers raised by commerce and industry, most of those who gather here are young, and the aging degree remains relatively low. Jiangxia and Hannan districts have many secondary industries in Wuhan, such as automobiles, machinery, and other industries. These streets are also where young people gather, so the aging degree remains relatively low. Compared with Huangpi and Xinzhou districts, the Caidian district is different. Although it is also categorized as the suburbs of Wuhan, its aging degree is not severe. The aging population in deepened aging streets is primarily within the range from 3000 to 6000; only one street reaches the peak level with an aging population within the range of 12,000 to 18,000.
The new elderly care facilities among regions have sequenced priority, and the core urban area within the Second Ring Road is severely aging. Given this, these deepened aging streets should be taken into consideration. However, there are a complete set of accessorized facilities within the Second Ring Road, with rich, high-quality medical resources, recreational and entertaining facilities, and convenient transportation. With too many restrictions on the location of elderly care facilities, no great, location sites are available in areas within the Second Ring. The distribution of the elderly population between the Second Ring Road and the Third Ring Road is relatively scarce, with relatively complete various accessorized facilities, so this area abounds in grids suitable for distributing elderly care facilities. Because of the low aging degree in the eastern area of the Wuchang district, it is not classified as prioritized. However, considering the tendency of dispersion and limited traffic conditions, the outskirts’ demand for the construction of new elderly care facilities should not be overlooked. Many aging streets situate in Huangpi, Xinzhou and Caidian districts, among which there are many profoundly aging ones in Huangpi and Xinzhou districts. Distant from the urban area, the number of the aged population on these streets is enormous, and supporting facilities are relatively outdated. Nevertheless, plenty of grids are still suitable for locating elderly care facilities. Therefore, it is necessary to construct new elderly care facilities in these suburban areas.
Many severely aging streets are densely situated on the Second Ring Road in Wuhan. The distribution of existing elderly care facilities is relatively concentrated, and the number of the predicted planning sites is still large. The land within the Second Ring is relatively scarce, but with convenient transportation, people may resort to high-storied and large-scale facilities to save the land. At the same time, the existing public facilities in the city should be made of full avail, and different types of facilities should be constructed for the aged, in light of the situations of different regions. For example, in the Wuchang district, people should fully use the rich educational resources and build universities and social welfare centers for seniors. In terms of Jianghan and Jiang’an districts, retirement centers integrated with medical and nursing care should be established, utilizing the superior medical resources in this region. However, the Third Ring Road and beyond also have lavish streets with seriously aging problems. Huangpi district has 13 streets with a massive severely aged population, among which eight streets have more than 6000 people aged 65 and over, while Xinzhou district has five. However, these streets are all located in the outer suburbs of Wuhan, not so affluent considering their economic condition. Apart from that, according to the traditional site selection method, these streets are prone to be ignored. However, on the contrary, this requires extra attention from the government planning department. Meanwhile, the land price of these suburban streets remains relatively low, with stunning landscapes. In the later stage of site selection, based on local characteristics and advantages, some ordinary elderly care facilities can be constructed to meet the nursing needs of residents while introducing several commercial institutions and high-end elderly care facilities to fulfill the needs for vacation and leisure activities of some of the elderly.

4.3. Comparison with Previous Studies

Compared with previous studies [46], in terms of the equilibrium of spatial distribution of elderly care facilities in Wuhan, our results are basically consistent with them. Their research shows that there are more elderly care facilities in the urban centers of Wuhan, but the per capita number is relatively small, and the demand is still high [47,48]. Meanwhile, the service level of elderly care facilities in outer suburban areas is weak, such as Huangpi, Xinzhou, and Caidian districts. Therefore, some outer suburban streets with a relatively high aging degree also need to increase elderly care facilities immediately [49,50]. As for the simulated site selection of newly built elderly care facilities, there are currently few research results. Peng et al. simulated the location of newly built elderly care facilities in Wuhan using the minimum facility point model with a regional and street level scale. However, he simulated only 26 points, among which 5 points were newly built, and 21 points were renovated [51], which could not meet the actual needs of Wuhan City. Some scholars have also studied the layout optimization of elderly care facilities in Beijing [52], Shanghai [53], Shenzhen [54], and Xi’an [55] cities, but the research scale is limited to the street. In general, they first evaluate the accessibility and spatial distribution equilibrium of the existing elderly care facilities, and then give the optimization results. That is, the layout of elderly care facilities is unbalanced in some areas, so it is necessary to increase the layout of elderly care facilities. However, where and how many elderly care facilities need to be built? They cannot give exact results. Our study can solve the deficiency of their research and take the previous work to the next level.
Compared with the previous studies: (1) In Methods, we used POI and machine learning methods to identify the location of elderly care facilities; (2) In Results, we get the results at a fine scale, which is more suitable for local governments to make decisions on the location of elderly care facilities.

4.4. Strengths and Limitations of This Study

Most previous studies on the planning of urban elderly care facilities use relative qualitative measurement and traditional prediction algorithms, which are relatively subjective [56,57] and inefficient [58]. However, we combine big-data methods (POI data) and machine-learning algorithms, which are more scientific and holistic. Consequently, the overall layout is more optimal, the prediction results are objective, and the site selection work will be more efficient. It can also be an excellent method for other public facilities’ planning and decision-making processes.
In addition, this article is a selection and prediction of facilities for the aged on a street/township scale. The resolution is much higher than in previous studies on urban or coarse scales. Therefore, our results are more valuable to the government and can be implemented more directly.
Our study’s final site selection prediction points are limited to a 500 m × 500 m grid. The layout has been relatively accurate. These grids are areas that are both suitable for construction and should be constructed as early as possible. The government can use the results of this research to deploy urban elderly care facilities at the corresponding forecast points directly.
The limitations of this study are as follows. Urban elderly care facilities can be further subdivided into nursing homes, elderly nursing centers, elderly universities, elderly apartments, care centers, and social welfare centers. The location and layout of each facility have certain particularities. This article does not subdivide facilities, and the differences in the location and layout of different types of elderly care facilities need to be further explored.

5. Conclusions

In this study, based on high-resolution POI data and machine learning algorithms, we constructed a street-level site selection model of new urban elderly care facilities for Wuhan in China. The city is divided into 31,390 grids with a cell size of 500 m × 500 m. In total, 2059 initial grids were selected by the established model for new urban elderly care facilities. According to the latest agglomeration degree of the aging population in each street, the final 635 top-priority grids were further selected. The 635 grids in urgent need of elderly care facilities in Wuhan are mainly distributed in the areas with a concentrated aging population within the Second Ring Road. Additionally, some outer suburban streets with a relatively high aging degree also require immediate facility construction. Our contribution to the existing literature is that high-resolution POI data and machine learning algorithms can be used to determine the site of urban elderly care facilities at a fine scale. In addition, the differences in the location and layout of different types of elderly care facilities need to be further explored in the future.

Author Contributions

Conceptualization, Z.W. and X.W.; methodology, Z.W.; software, S.L.; validation, Z.D. and L.L.; formal analysis, X.W.; investigation, Z.W.; resources, Z.D. and L.L.; data curation, X.W.; writing—original draft preparation, Z.W. and S.L.; writing—review and editing, Z.W., X.W., S.L., and W.L.; visualization, S.L.; supervision, S.L.; project administration, Z.W.; funding acquisition, Z.W. All authors have read and agreed to the published version of the manuscript.

Funding

This research was supported by the Ministry of Education of Humanities and Social Science project (granted No.19YJC630179).

Institutional Review Board Statement

Not applicable.

Informed Consent Statement

Not applicable.

Data Availability Statement

The data presented in this study are available on request from the corresponding author.

Acknowledgments

We would like to thank Feng Xiong for his help in data processing and Jian Wu and Xing Yan for their help in graphic production.

Conflicts of Interest

The authors declare no conflict of interest.

References

  1. Liu, L.; Lyu, H.; Zhao, Y.; Zhou, D. An improved two-step floating catchment area (2sfca) method for measuring spatial accessibility to elderly care facilities in Xi’an, China. Int. J. Environ. Res. Public Health 2022, 19, 11465. [Google Scholar] [CrossRef] [PubMed]
  2. Grekousis, G.; Mountrakis, G. Sustainable development under population pressure: Lessons from developed land consumption in the conterminous U.S. PLoS ONE 2015, 10, e119675. [Google Scholar] [CrossRef] [PubMed]
  3. Martinez-Fernandez, C.; Audirac, I.; Fol, S.; Cunningham-Sabot, E. Shrinking cities: Urban challenges of globalization. Int. J. Urban Reg. Res. 2012, 36, 213–225. [Google Scholar] [CrossRef] [PubMed]
  4. Joy, M. Problematizing the age friendly cities and communities program in toronto. J. Aging Stud. 2018, 47, 49–56. [Google Scholar] [CrossRef]
  5. Wang, Y.; Fukuda, H. Sustainable urban regeneration for shrinking cities: A case from Japan. Sustainability 2019, 11, 1505. [Google Scholar] [CrossRef] [Green Version]
  6. Huang, X.; Gong, P.; White, M. Study on spatial distribution equilibrium of elderly care facilities in downtown Shanghai. Int. J. Environ. Res. Public Health 2022, 19, 7929. [Google Scholar] [CrossRef]
  7. Wang, S.; Ma, S. Efficient methods for a bi-objective nursing home location and allocation problem: A case study. Appl. Soft Comput. 2018, 65, 280–291. [Google Scholar] [CrossRef]
  8. Cheng, L.; Yang, M.; Vos, J.D.; Witlox, F. Examining geographical accessibility to multi-tier hospital care services for the elderly: A focus on spatial equity. J. Transp. Health 2020, 19, 100926. [Google Scholar] [CrossRef]
  9. Ishikawa, N.; Fukushige, M. Dissatisfaction with dwelling environments in an aging society: An empirical analysis of the kanto area in Japan. Rev. Urban Reg. Dev. Stud. 2015, 27, 149–176. [Google Scholar] [CrossRef]
  10. Yin, C.; He, Q.; Liu, Y.; Chen, W.; Gao, Y. Inequality of public health and its role in spatial accessibility to medical facilities in China. Appl. Geogr. 2018, 92, 50–62. [Google Scholar] [CrossRef]
  11. Park, Y.; Newman, G.D.; Lee, J.; Lee, S. Identifying and comparing vacant housing determinants across south korean cities. Appl. Geogr. 2021, 136, 102566. [Google Scholar] [CrossRef]
  12. Faraji Sabokbar, H.; Mohammadi, H.; Tahmasbi, S.; Rafii, Y.; Hosseini, A. Measuring spatial accessibility and equity to healthcare services using fuzzy inference system. Appl. Geogr. 2021, 136, 102584. [Google Scholar] [CrossRef]
  13. Davari, S.; Van Woensel, T. The elderly centre location problem. J. Oper. Res. Soc. 2021, 72, 1207–1220. [Google Scholar] [CrossRef]
  14. Schwanen, T.; Hardill, I.; Lucas, S. Spatialities of ageing: The co-construction and co-evolution of old age and space. Geoforum 2012, 43, 1291–1295. [Google Scholar] [CrossRef]
  15. Wu, H.; Tseng, M. Evaluating disparities in elderly community care resources: Using a geographic accessibility and inequality index. Int. J. Environ. Res. Public Health 2018, 15, 1353. [Google Scholar] [CrossRef] [Green Version]
  16. Rishworth, A.; Elliott, S.J. Global environmental change in an aging world: The role of space, place and scale. Soc. Sci. Med. 2019, 227, 128–136. [Google Scholar] [CrossRef]
  17. Tao, Z.; Han, W. Assessing the impacts of hierarchical healthcare system on the accessibility and spatial equality of healthcare services in Shenzhen, China. ISPRS Int. J. Geo-Inf. 2021, 10, 615. [Google Scholar] [CrossRef]
  18. Lu, S.; Shi, C.; Yang, X. Impacts of built environment on urban vitality: Regression analyses of beijing and Chengdu, China. Int. J. Environ. Res. Public Health 2019, 16, 4592. [Google Scholar] [CrossRef] [Green Version]
  19. Pulver, A.; Wei, R. Optimizing the spatial location of medical drones. Appl. Geogr. 2018, 90, 9–16. [Google Scholar] [CrossRef]
  20. Boonmee, C.; Arimura, M.; Asada, T. Facility location optimization model for emergency humanitarian logistics. Int. J. Disaster Risk Reduct. 2017, 24, 485–498. [Google Scholar] [CrossRef]
  21. Mcgrail, M.R. Spatial accessibility of primary health care utilising the two step floating catchment area method: An assessment of recent improvements. Int. J. Health Geogr. 2012, 11, 50. [Google Scholar] [CrossRef] [PubMed] [Green Version]
  22. Di, X.; Wang, L.; Dai, X.; Yang, L. Assessing the accessibility of home-based healthcare services for the elderly: A case from Shanxi province, China. Int. J. Environ. Res. Public Health 2020, 17, 7168. [Google Scholar] [CrossRef] [PubMed]
  23. Xia, X.; Lin, K.; Ding, Y.; Dong, X.; Sun, H.; Hu, B. Research on the coupling coordination relationships between urban function mixing degree and urbanization development level based on information entropy. Int. J. Environ. Res. Public Health 2021, 18, 242. [Google Scholar] [CrossRef] [PubMed]
  24. Garavaglia, G.; Lettieri, E.; Agasisti, T.; Lopez, S. Efficiency and quality of care in nursing homes: An Italian case study. Health Care Manag. Sci. 2011, 14, 22–35. [Google Scholar] [CrossRef] [PubMed]
  25. Xu, X.; Zhou, L.; Antwi, H.A.; Chen, X. Evaluation of health resource utilization efficiency in community health centers of Jiangsu province, China. Hum. Resour. Health 2018, 16, 13. [Google Scholar] [CrossRef]
  26. Zhang, L.; Zeng, Y.; Fang, Y. Evaluating the technical efficiency of care among long-term care facilities in Xiamen, China: Based on data envelopment analysis and tobit model. BMC Public Health 2019, 19, 1230. [Google Scholar] [CrossRef] [Green Version]
  27. Xu, Z.; Zhou, L.; Lan, T.; Wang, Z.; Sun, L.; Wu, R. Spatial optimization of mega-city fire station distribution based on point of interest data: A case study within the 5th ring road in Beijing. Prog. Geogr. 2018, 37, 535–546. [Google Scholar]
  28. Hu, L.; He, S.; Han, Z.; Xiao, H.; Su, S.; Weng, M.; Cai, Z. Monitoring housing rental prices based on social media:an integrated approach of machine-learning algorithms and hedonic modeling to inform equitable housing policies. Land Use Pol. 2019, 82, 657–673. [Google Scholar] [CrossRef]
  29. Zhang, Z.; Xiao, Y.; Luo, X.; Zhou, M. Urban human activity density spatiotemporal variations and the relationship with geographical factors: An exploratory baidu heatmaps—Based analysis of Wuhan, China. Growth Change 2020, 51, 505–529. [Google Scholar] [CrossRef]
  30. Zhu, J.; Lu, H.; Zheng, T.; Rong, Y.; Tang, L. Vitality of urban parks and its influencing factors from the perspective of recreational service supply, demand, and spatial links. Int. J. Environ. Res. Public Health 2020, 17, 1615. [Google Scholar] [CrossRef] [Green Version]
  31. Zhang, P.; Hu, S.; Li, W.; Zhang, C.; Yang, S.; Qu, S. Modeling fine-scale residential land price distribution: An experimental study using open data and machine learning. Appl. Geogr. 2021, 129, 102442. [Google Scholar] [CrossRef]
  32. Miao, R.; Wang, Y.; Li, S. Analyzing urban spatial patterns and functional zones using sina weibo poi data: A case study of Beijing. Sustainability 2021, 13, 647. [Google Scholar] [CrossRef]
  33. Zhang, J.; Yuan, X.D.; Lin, H. The extraction of urban built-up areas by integrating night-time light and poi data—A case study of Kunming, China. IEEE Access 2021, 9, 22417–22429. [Google Scholar]
  34. Ma, J.; Cheng, J.C.P.; Jiang, F.; Chen, W.; Zhang, J. Analyzing driving factors of land values in urban scale based on big data and non-linear machine learning techniques. Land Use Pol. 2020, 94, 104537. [Google Scholar] [CrossRef]
  35. Wu, H.; Lin, A.; Xing, X.; Song, D.; Li, Y. Identifying core driving factors of urban land use change from global land cover products and poi data using the random forest method. Int. J. Appl. Earth Obs. Geoinf. 2021, 103, 102475. [Google Scholar] [CrossRef]
  36. Cox, P.R. The aging of populations and its economic and social implications. Int. Aff. 1958, 34, 528. [Google Scholar] [CrossRef]
  37. Shao, L.; Zhang, J.; Xu, B.; Tan, Y. An analysis of the spatial distribution and demand-supply relation of care facilities for the elderly in the central urban area of Beijing. Archit. J. 2017, 10, 4–8. [Google Scholar]
  38. Cheng, M.; Cui, X. Spatial optimization of residential care facility configuration based on the integration of modified immune algorithm and gis: A case study of jing’an district in Shanghai, China. Int. J. Environ. Res. Public Health 2020, 17, 8090. [Google Scholar] [CrossRef]
  39. Wang, D.N.; Qiao, C.J.; Liu, S.J.; Wang, C.Y.; Yang, J.; Li, Y.; Huang, P. Assessment of spatial accessibility to residential care facilities in 2020 in Guangzhou by small-scale residential community data. Sustainability 2020, 12, 3169. [Google Scholar] [CrossRef] [Green Version]
  40. Zhong, Z.P.; Lin, L.; Yang, Y. Study on the health status and health service utilization for the rural elderly in the metropolitan suburb during the urbanization process: A case for mingxing village, Guangzhou. Sustainability 2020, 12, 3560. [Google Scholar] [CrossRef]
  41. Irvine, K.N.; Marselle, M.R.; Melrose, A.; Warber, S.L. Group outdoor health walks using activity trackers: Measurement and implementation insight from a mixed methods feasibility study. Int. J. Environ. Res. Public Health 2020, 17, 2515. [Google Scholar] [CrossRef] [PubMed] [Green Version]
  42. Liu, J.; Hou, X.; Xia, C.; Kang, X.; Zhou, Y. Examining the spatial coordination between metrorail accessibility and urban spatial form in the context of big data. Land 2021, 10, 580. [Google Scholar] [CrossRef]
  43. Filippi, F. A paradigm shift for a transition to sustainable urban transport. Sustainability 2022, 14, 2853. [Google Scholar] [CrossRef]
  44. Tsukahara, K.; Yamamoto, K. Method to Evaluate the Location of Aged Care Facilities in Urban Areas Using Median Share Ratio; Springer: Cham, Germany, 2019; pp. 389–404. [Google Scholar]
  45. Graham, B. Population characteristics and geographic coverage of primary care facilities. BMC Health Serv. Res. 2018, 18, 398. [Google Scholar] [CrossRef] [PubMed] [Green Version]
  46. Bo, S.; Yang, C. Progress and outlook of research on layout and planning of urban facilities for the elderly in China. South Archit. 2019, 2, 43–49. [Google Scholar]
  47. Yishan, X.; Dian, Z.; Zhiwei, Q.; Zhe, L. A study on the planning and layout of care facilities based on spatial distributive characteristics of the elderly people. Archit. J. 2017, 9, 74–77. [Google Scholar]
  48. Luo, X.; Yue, B.; Lin, A. The research of accessibility and fairness of pension service facilities based on multiple modes of transportation: A case study of Wuhan. J. Cent. China Norm. Univ. 2018, 52, 883–893. [Google Scholar]
  49. Wei, W.; Hong, M.; Zhou, J.; Xia, J. Evaluation method of urban basic public service facilities from the perspective of “city people”—A case study of Wuhan city. Urban Plan. 2020, 44, 71–80. [Google Scholar]
  50. Ma, Y.; Zheng, T.; Wang, Y. Study on the spatial distribution characteristics of supply and demand relationship of urban public service facilities for the elderly: A case study of Wuhan city center. In Proceedings of the 2020/2021 China Urban Planning Annual Conference, Chengdu, China, 25 September 2021; pp. 163–170. [Google Scholar]
  51. Peng, J.; Xing, L.; Yang, H. research on planning and layout of elderly care service facilities based on supply-demand matching. J. Geo-Inf. Sci. 2022, 24, 1349–1362. [Google Scholar]
  52. Tao, Z.L.; Cheng, Y.; Dai, T.Q.; Li, X. Optimization of elderly care facilities in Beijing in 2020 based on the goal of fairness maximization. Prog. Geogr. 2015, 34, 1609–1616. [Google Scholar]
  53. Zhu, H. Spatial matching and policy-planning evaluation of urban elderly care facilities based on multi-agent simulation: Evidence from Shanghai, China. Sustainability 2022, 14, 16183. [Google Scholar] [CrossRef]
  54. Hu, S.; Lu, Y.; Hu, G.; Sun, J. Measurement of accessibility and equity of medical facilities in Shenzhen based on multi-source big data. Econ. Geogr. 2021, 47, 87–96. [Google Scholar]
  55. Liu, S.; Wang, Y.; Zhou, D.; Kang, Y. Two-step floating catchment area model-based evaluation of community care facilities’ spatial accessibility in Xi’an, China. Int. J. Environ. Res. Public Health 2020, 17, 5086. [Google Scholar] [CrossRef] [PubMed]
  56. Wei, B.; Tian, Y. Research on the optimization of home care facilities in existing communities: A case study of Qingshan district in Wuhan. Huazhong Archit. 2019, 37, 128–133. [Google Scholar]
  57. Xiang, Z.Y.; Yi, Q.F. Research on spatial optimization layout adaptability of community elderly service facilities. Urban Hous. 2019, 26, 197–200. [Google Scholar]
  58. Liu, F.; Zhu, X.; Huang, Q.; Li, J. Progress of facilities for the elderly research and its evolution in china based on bibliomertrics analysis. Mod. Urban Res. 2020, 6, 33–40. [Google Scholar]
Figure 1. Location of Wuhan in China, its 13 districts, and the grid division with a cell size of 500 m × 500 m.
Land 12 00220 g001
Figure 2. The machine learning method framework for site simulation of urban elderly care facilities.
Land 12 00220 g002
Figure 3. Spatial pattern of the street-level aging population in Wuhan of China, for 2020. The street name label is available in the figure. (a) The whole study area, and (b) enlargement of the black frame area in (a).
Land 12 00220 g003
Figure 4. Initial areas for the new urban elderly care facilities at the street level in Wuhan, China.
Land 12 00220 g004
Figure 5. Areas for the new urban elderly care facilities at the street level in Wuhan, China.
Land 12 00220 g005
Table 1. Categorization and appellation of relevant point of interest data of various urban facilities for Wuhan, China.
Category of POIAppellation of Facilities
Transportation Airports, railway stations, coach stations, subway stations, bus stations, etc.
Scientific, educational, and cultural facilitiesLibraries, science museums, universities, primary and secondary kindergartens, parent–child education, special education schools, training institutions, etc.
Sports and leisure facilitiesParks, stadiums, fitness centers, farm yards, cinemas, theaters, halls, leisure squares, etc.
AttractionsZoos, botanical gardens, museums, cultural relics, churches, tourist attractions, etc.
Life servicesCommunication business halls, post offices, laundries, photo studios, maintenance points, newsstands, public restrooms, etc.
Financial facilities Banks, ATMs, rural credit cooperatives, etc.
Accommodations Star hotels, express hotels, apartment hotels, etc.
Shopping facilities Shopping centers, department stores, supermarkets, grocery stores, building materials markets, home appliances and electronics markets, fairs, etc.
Catering facilitiesRestaurants, foreign restaurants, fast food restaurants, dessert shops, cafés, tea-houses, etc.
Governmental facilities Governments, administrative departments, welfare institutions, etc.
CorporationsCompanies, designated areas of unified planning, agricultural, forest and gardening areas, etc.
Real estatesOffice buildings, residential areas, dormitories, etc.
Medical servicesGeneral hospitals, specialized hospitals, clinics, drug stores, sanatoriums, emergency centers, CDCs, etc.
Elderly care facilitiesNursing homes, elderly nursing centers, elderly universities, elderly apartments, care centers, social welfare centers, etc.
Disclaimer/Publisher’s Note: The statements, opinions and data contained in all publications are solely those of the individual author(s) and contributor(s) and not of MDPI and/or the editor(s). MDPI and/or the editor(s) disclaim responsibility for any injury to people or property resulting from any ideas, methods, instructions or products referred to in the content.

