
Research on the Establishment of Provincial Characteristic Scenic Lines Based on GIS


Abstract
:1. Introduction
1.1. Regional Integration Opens up a New Pattern of Organic Development
1.2. Definition of the Relevant Concepts
1.2.1. The Scenic Line and the Characteristic Scenic Line
1.2.2. Organic Context of the Scenic Line
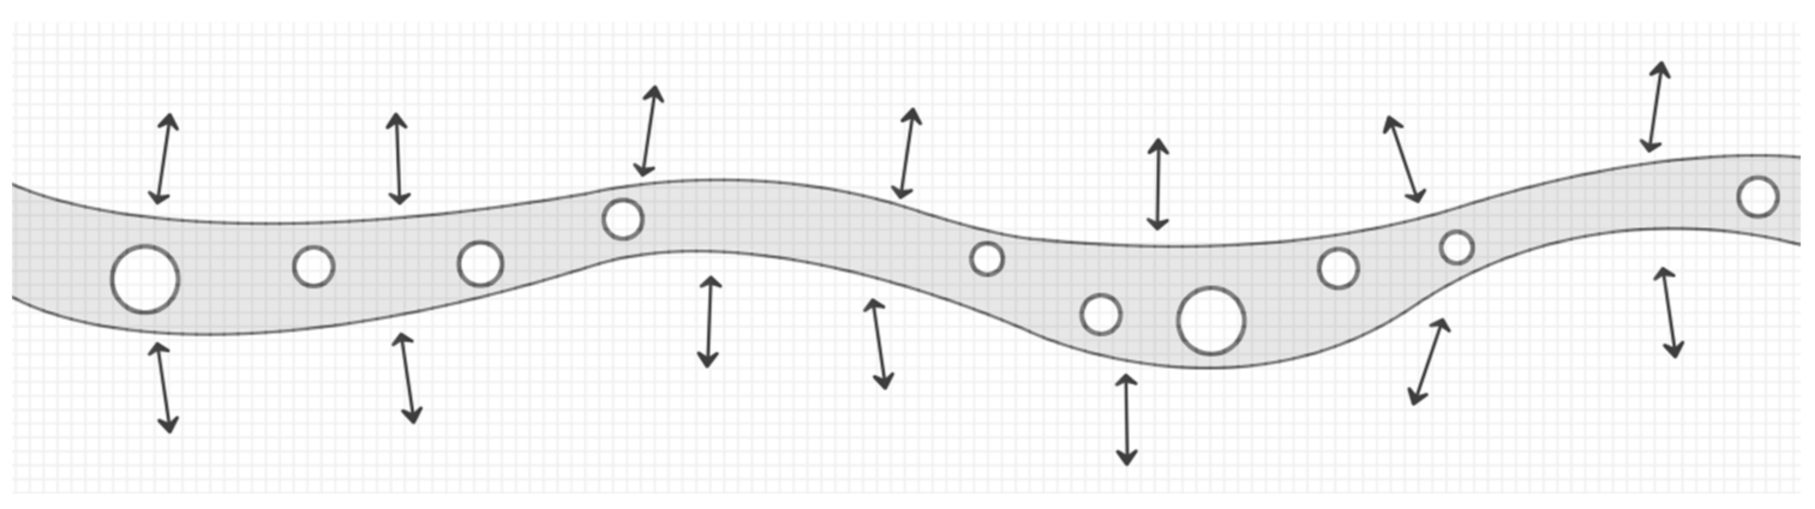
1.2.3. Organic Construction System of the Characteristic Scenic Line
- (1)
- Resistance side
- (2)
- Petiole
- (3)
- Vein
1.3. Suitability Analysis Combined with GIS Analysis Tool
1.4. New Contributions and Innovation
2. Materials and Methods
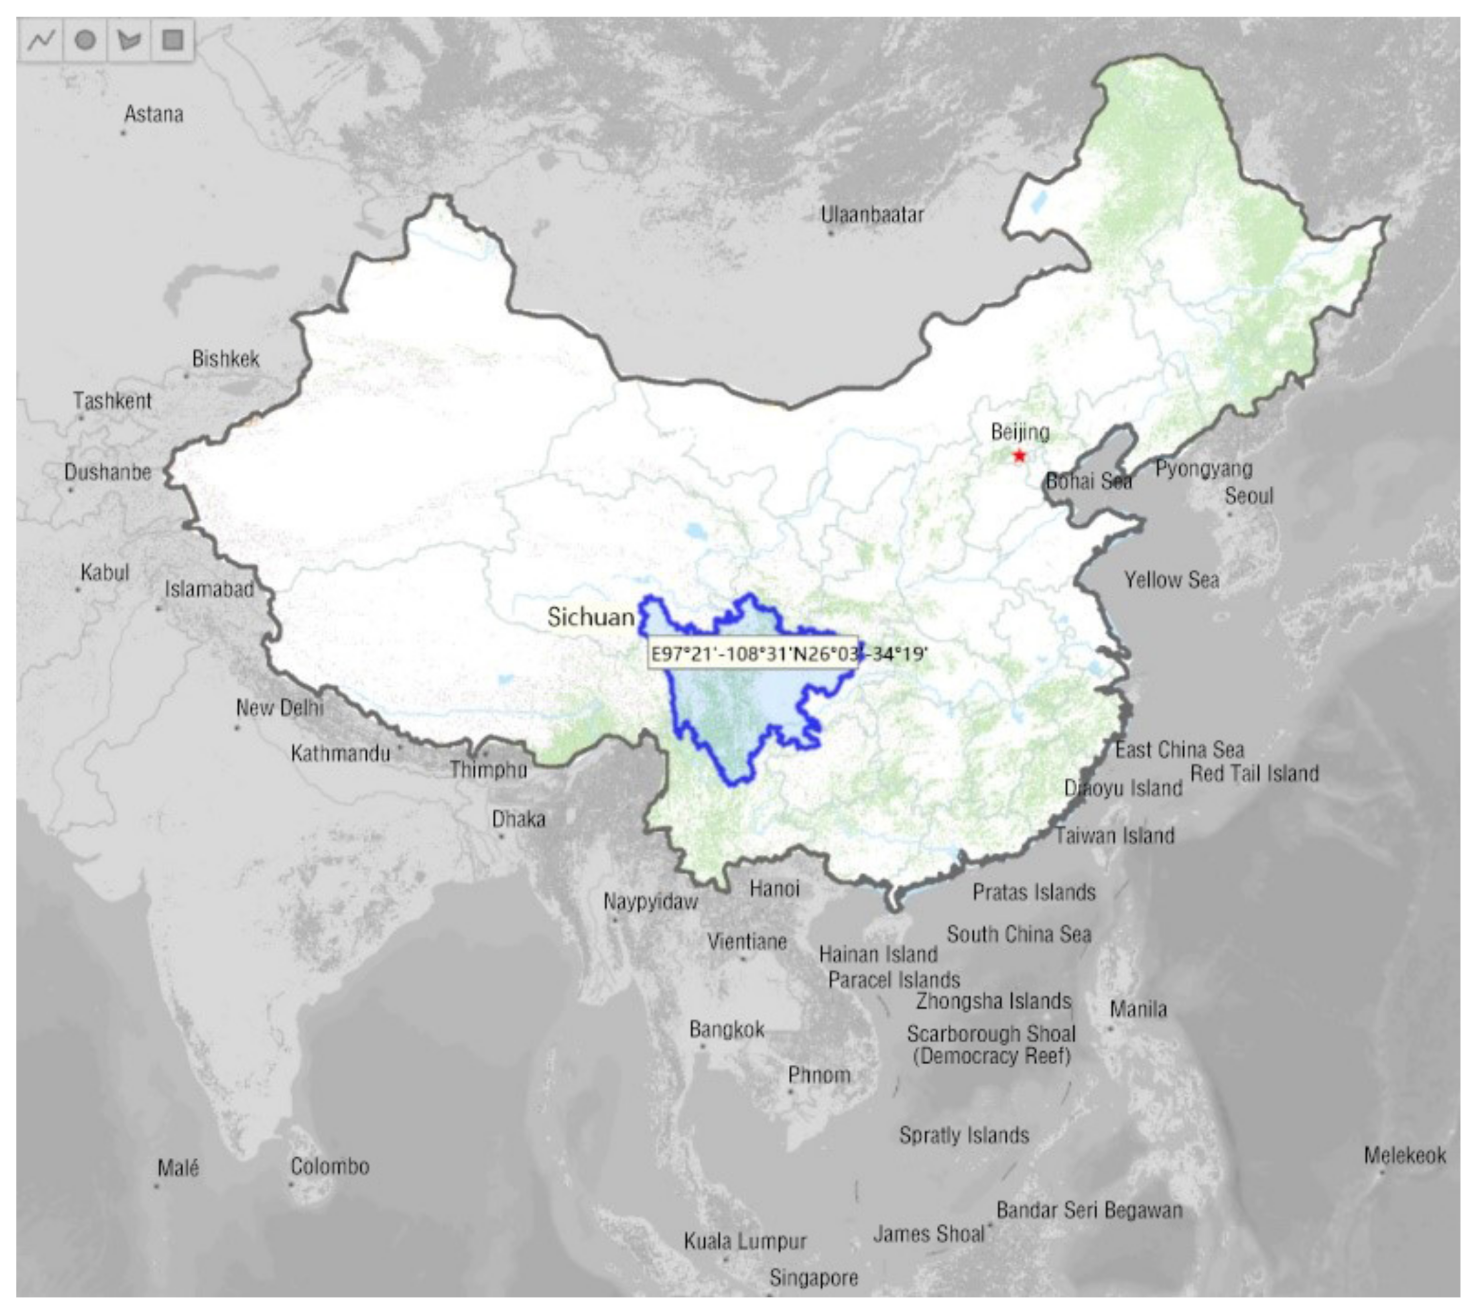
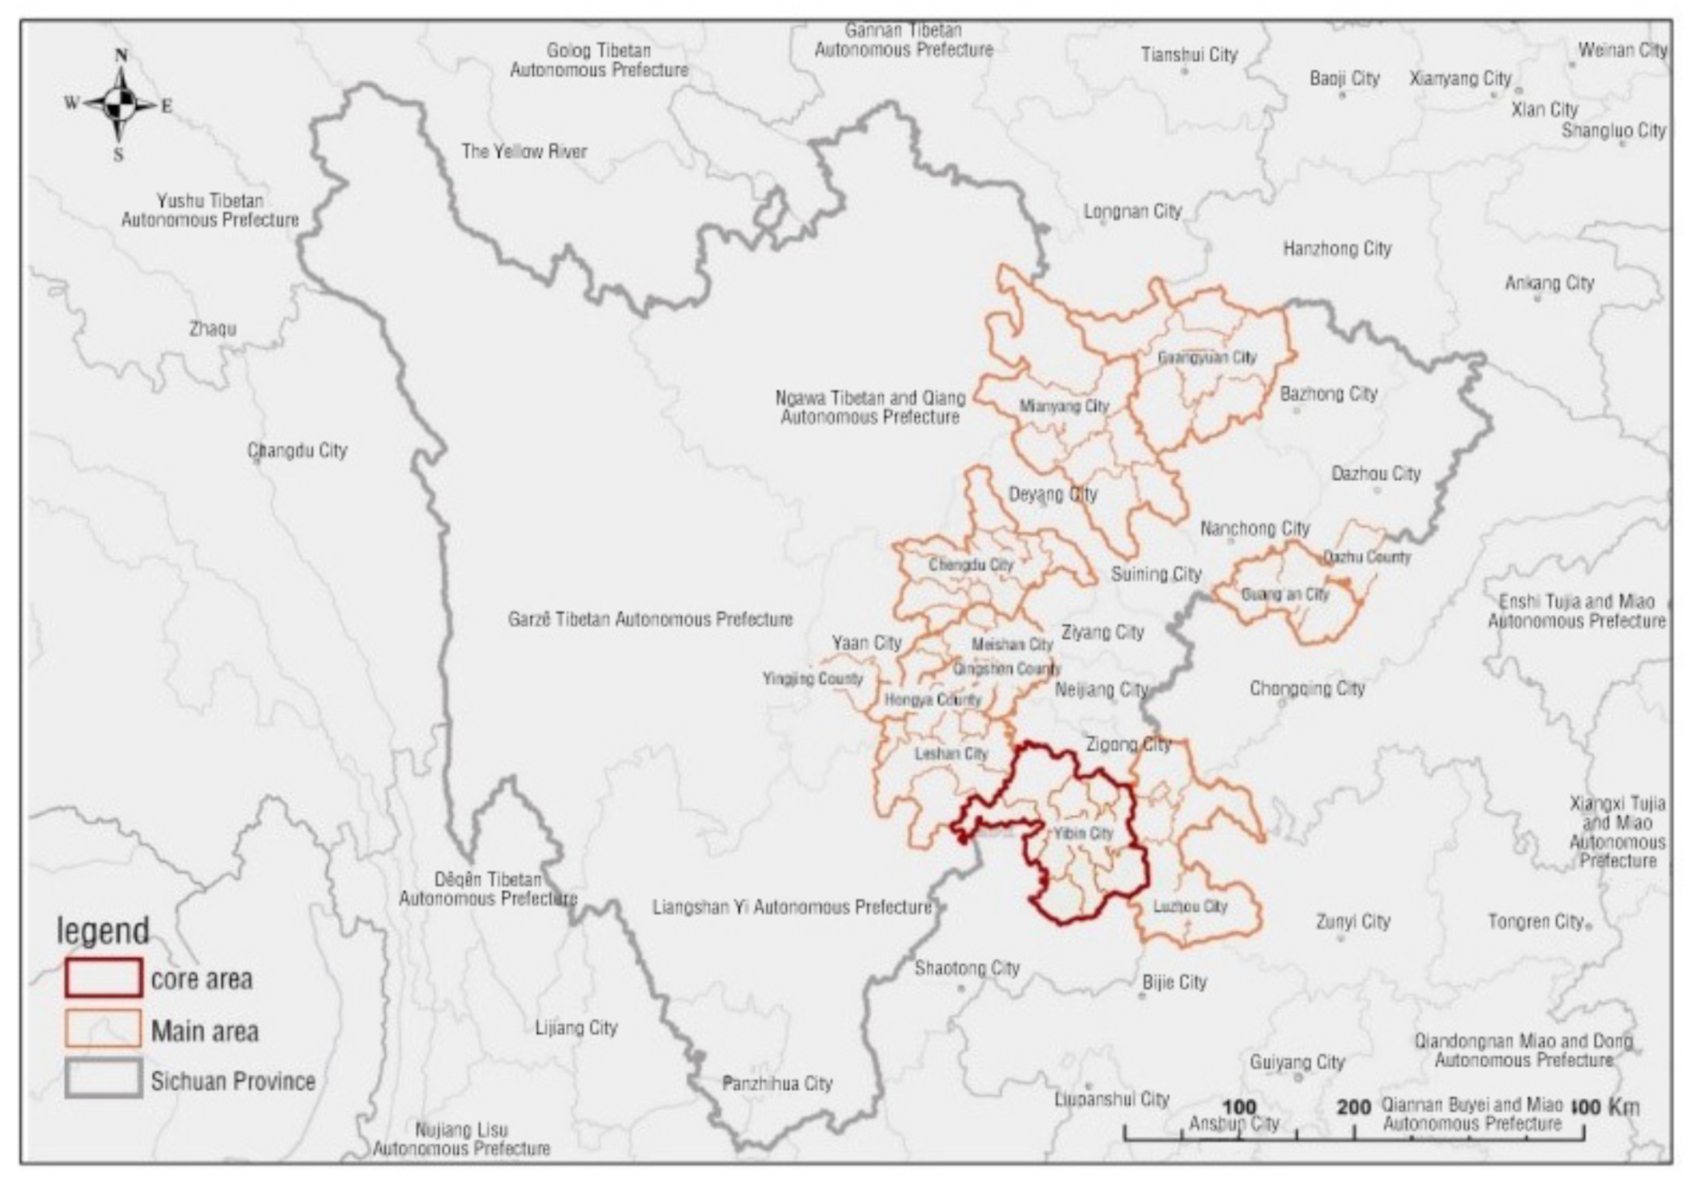
2.1. Research Areas
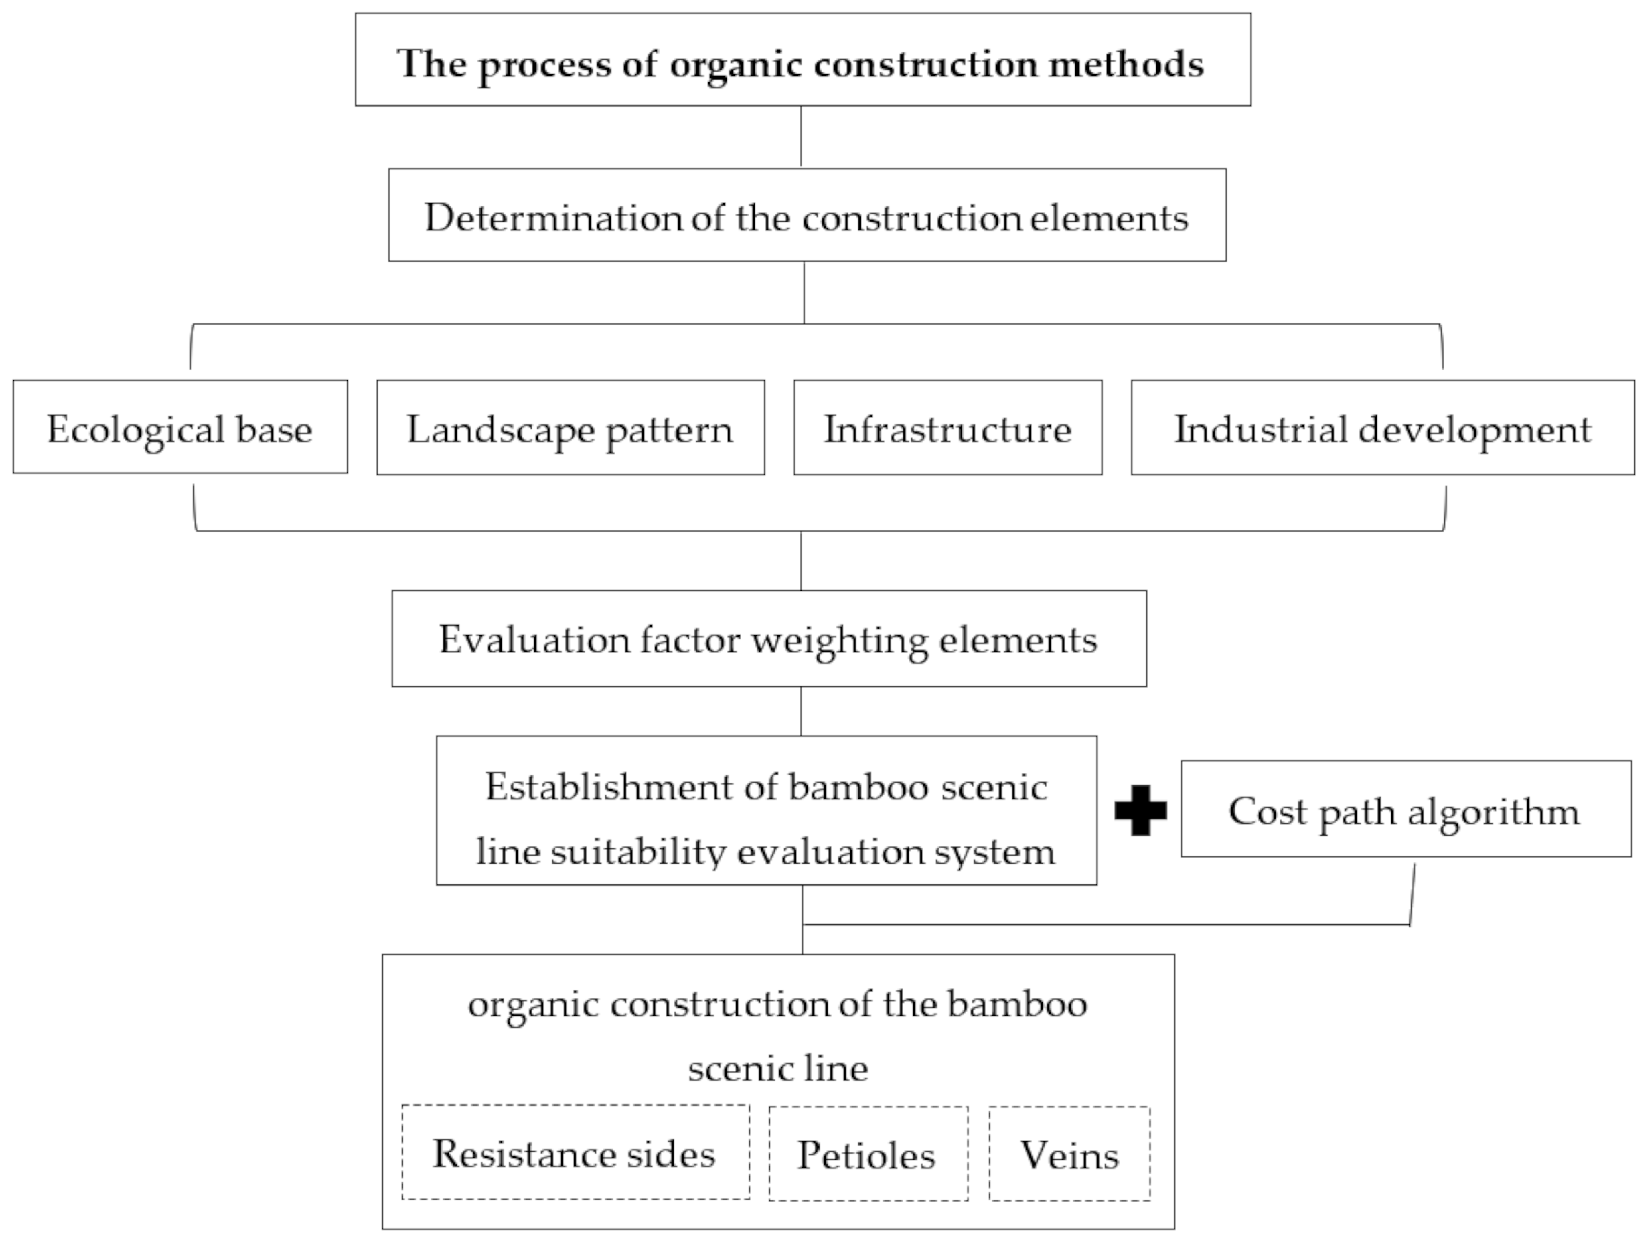
2.2. Construction Methods
2.2.1. Determination of the Construction Elements
2.2.2. Evaluation Factor Weighting
- (1)
- The formula of the standardized treatment for the indicators is:
- (2)
- The proportion of the i-th area bamboo forest scenic line is calculated using the index under the j-th index:
- (3)
- To calculate the entropy of the j-th index:
- (4)
- The weight calculation:
2.2.3. Cost Path Algorithm
3. Results
3.1. Analysis Results on the Construction Elements of the Bamboo Scenic Line
3.1.1. Ecological Base Layer
- (1)
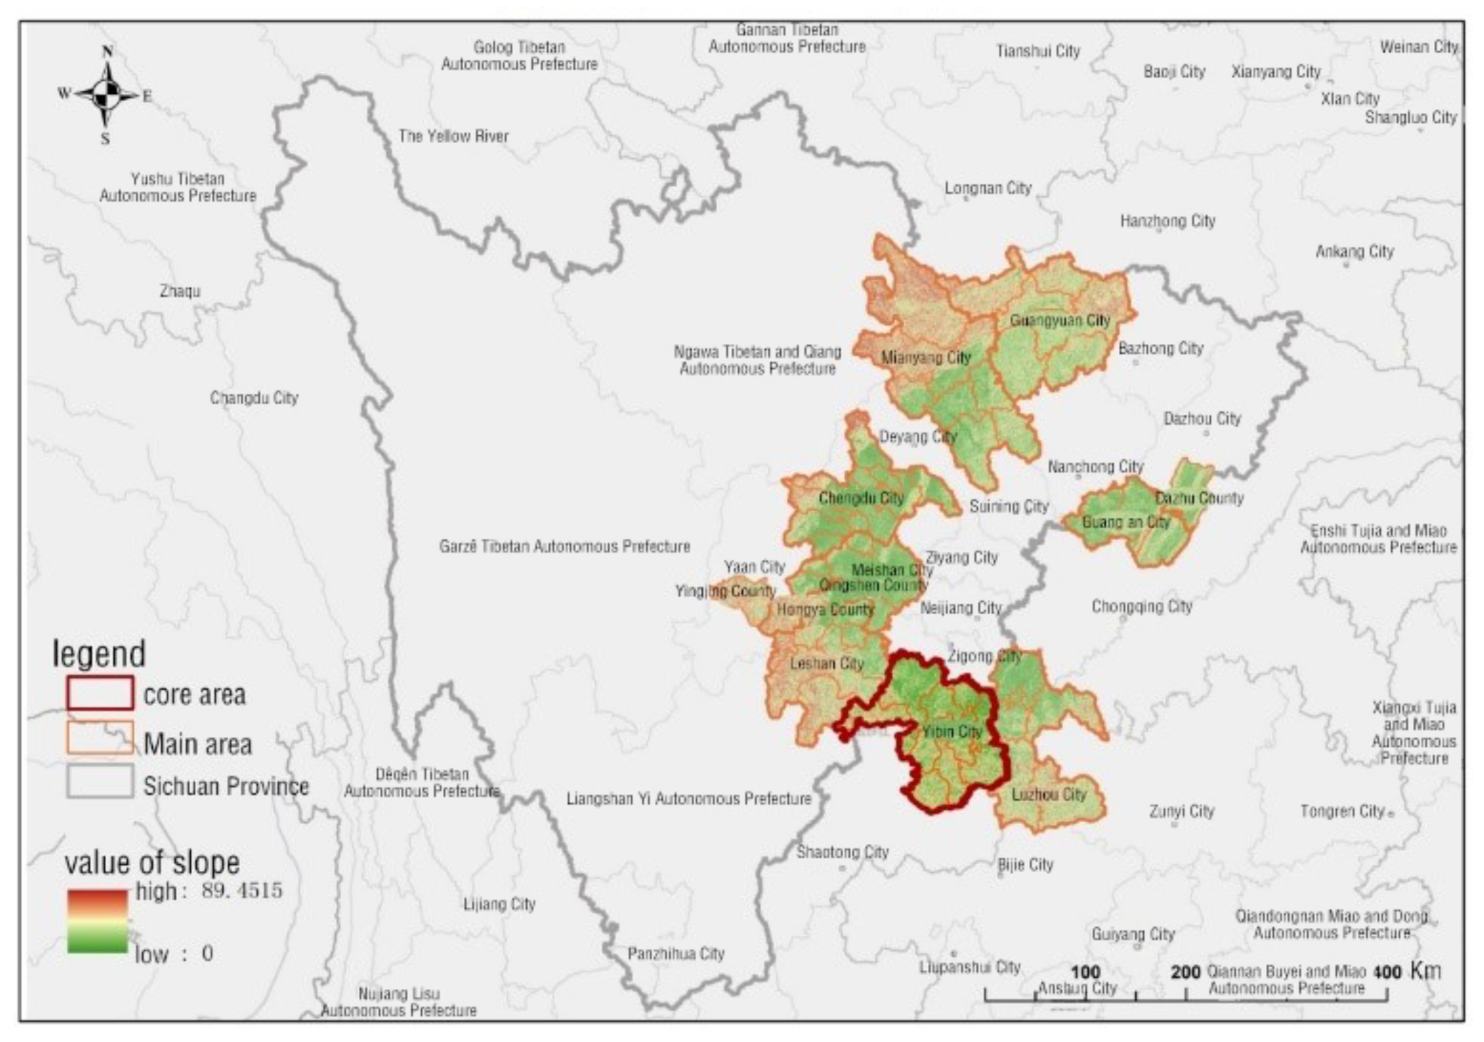
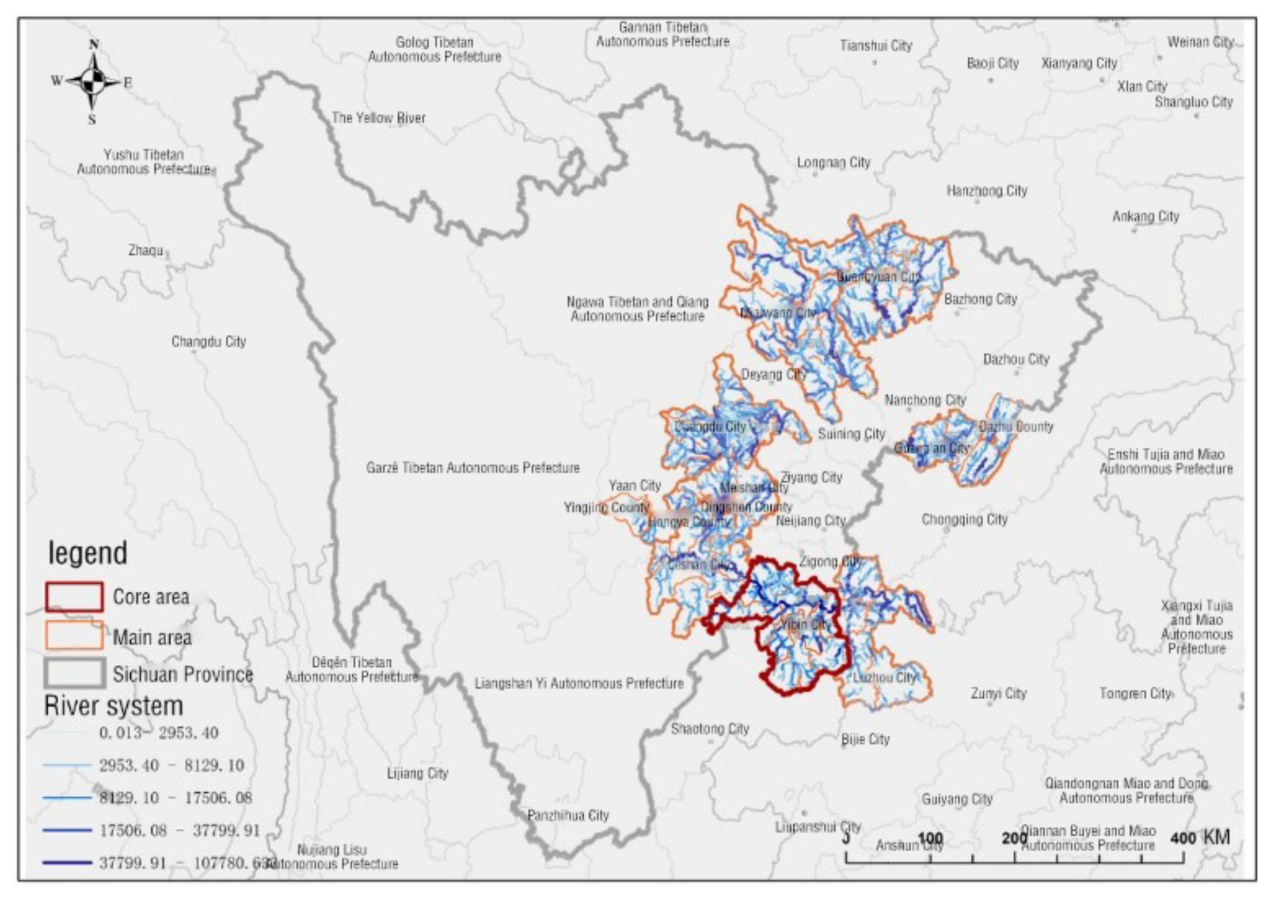
- Landform and hydrological analysis
- (2)
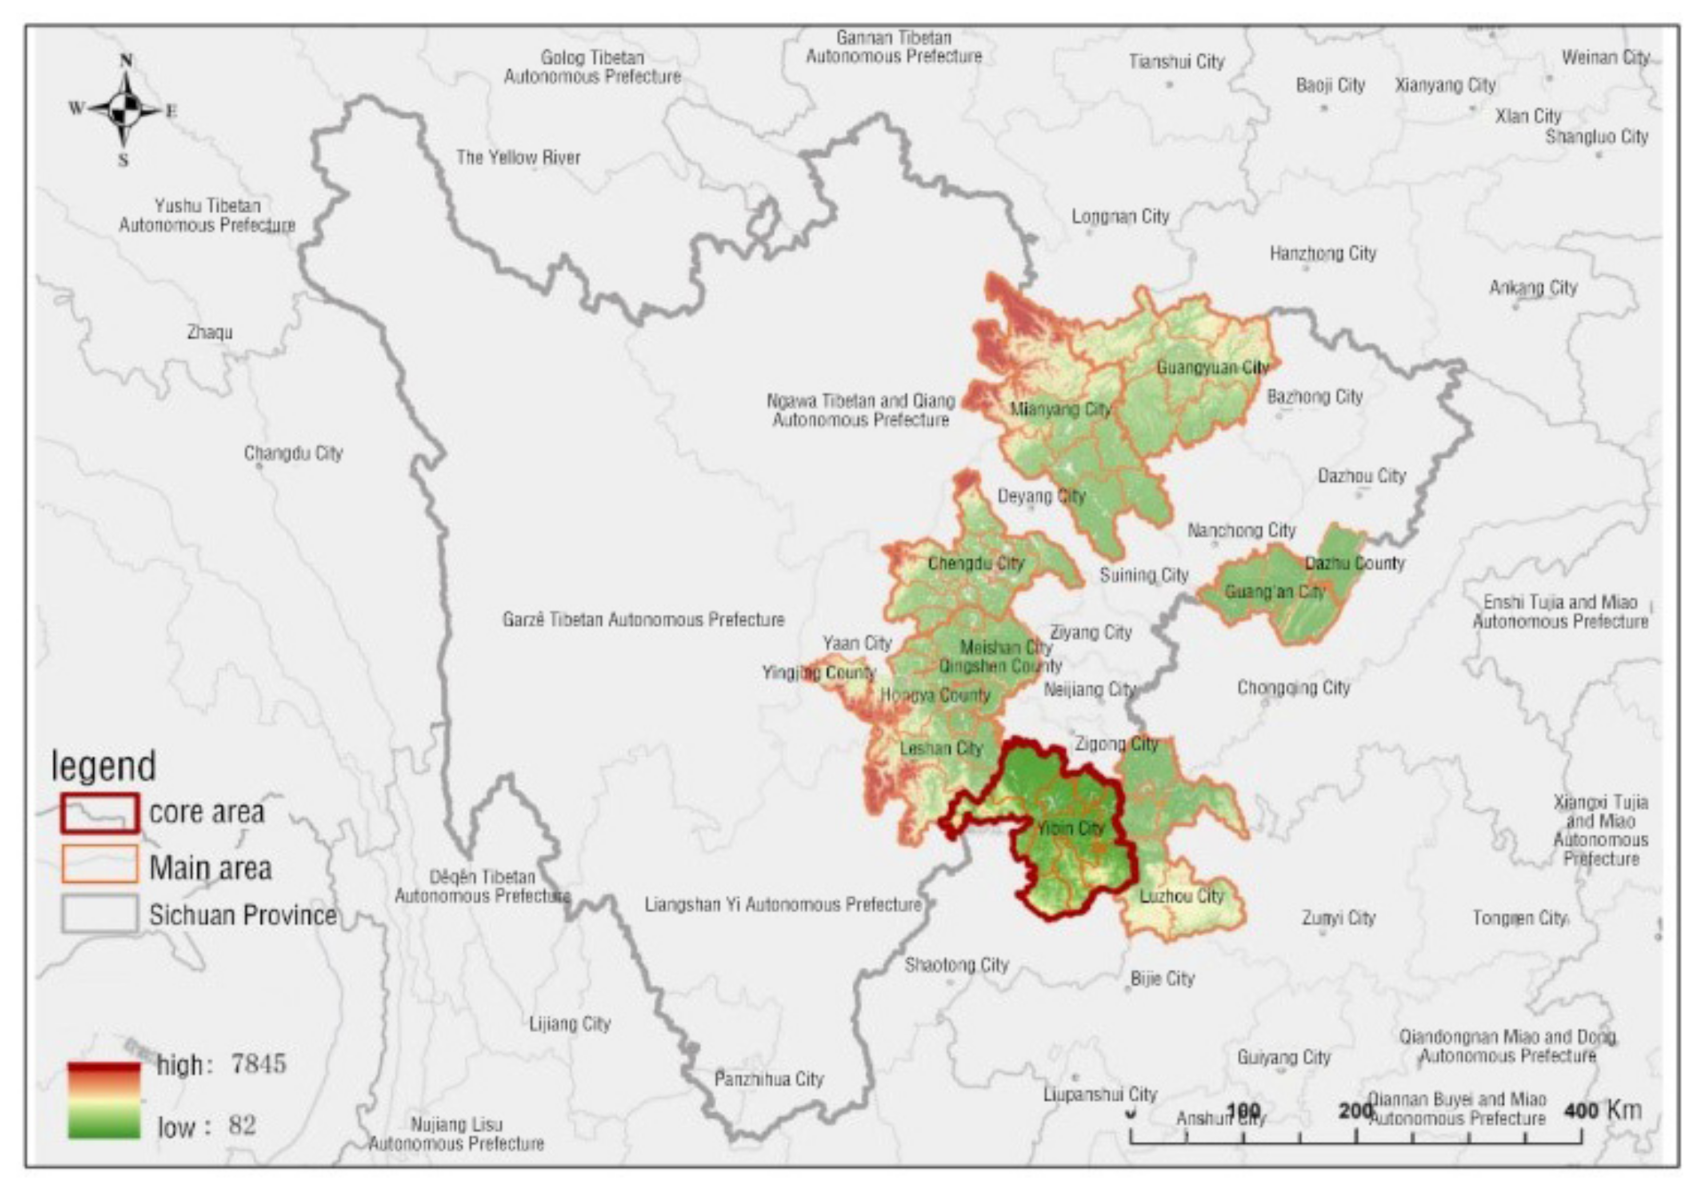
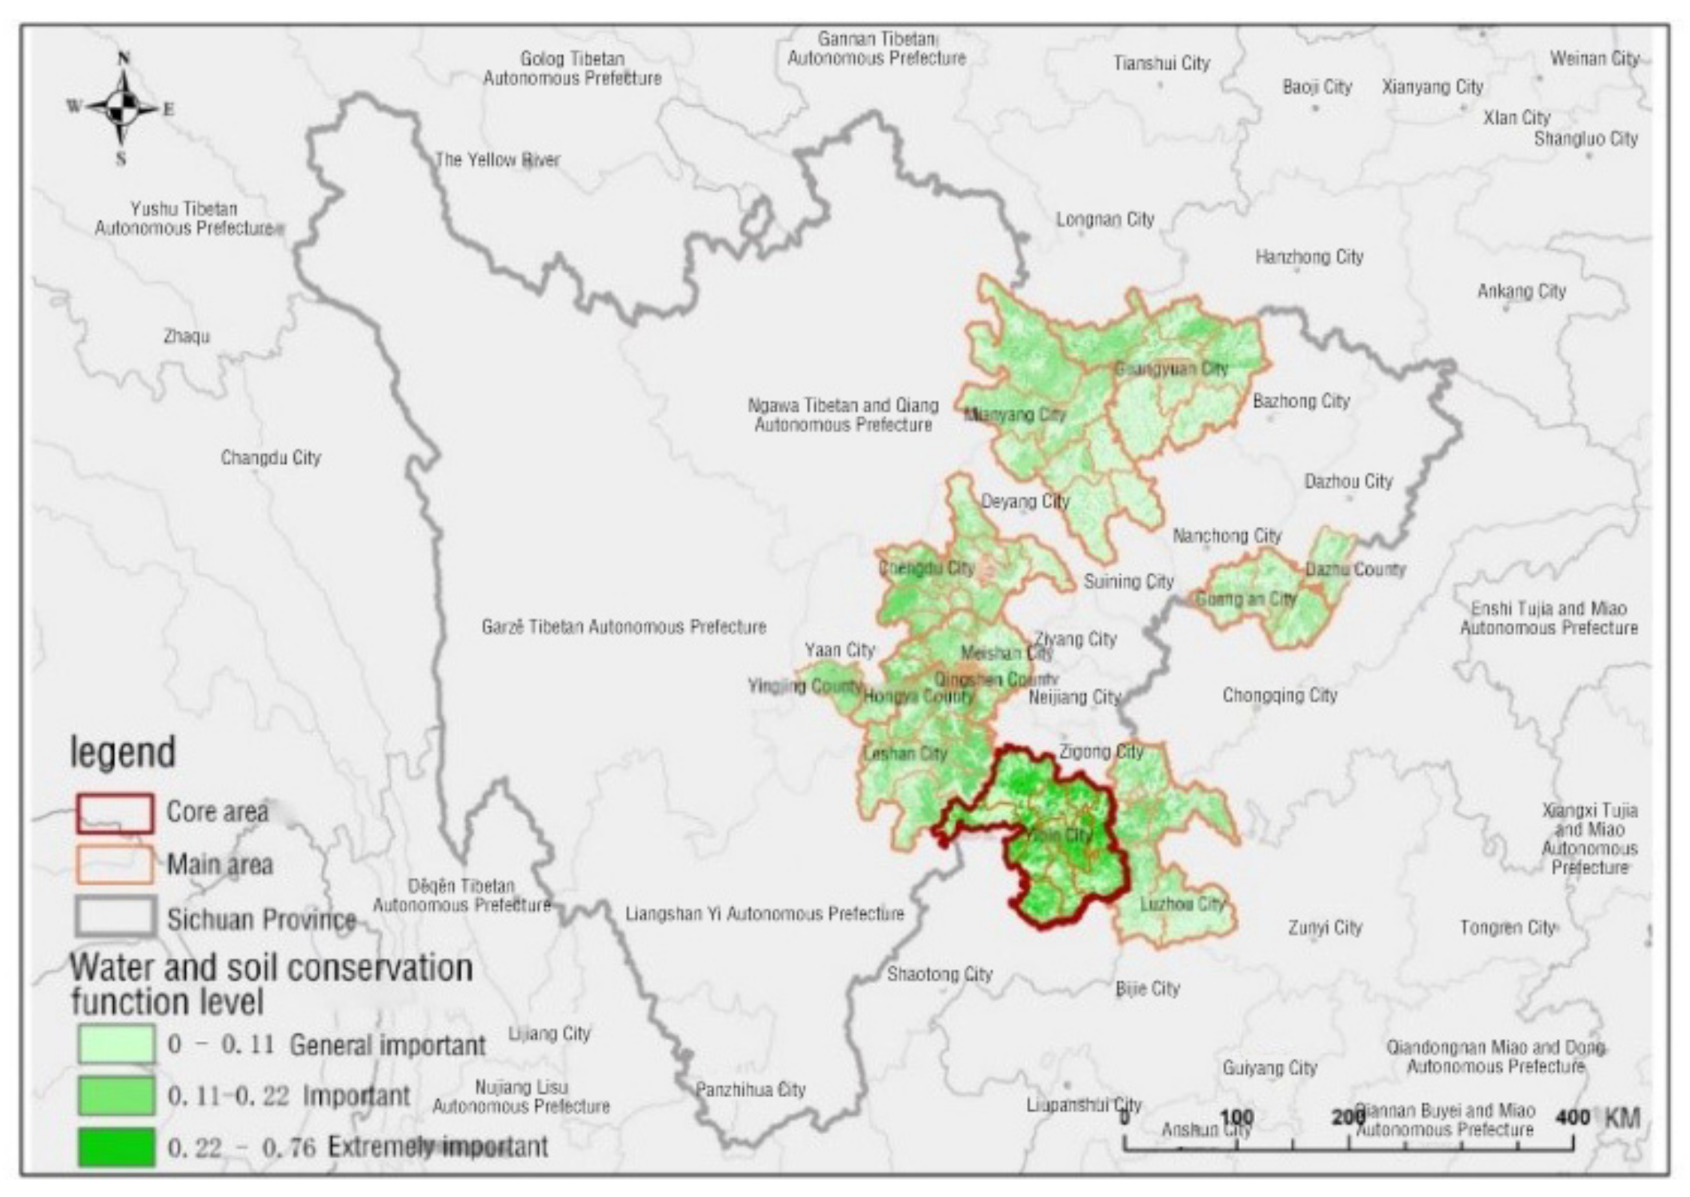
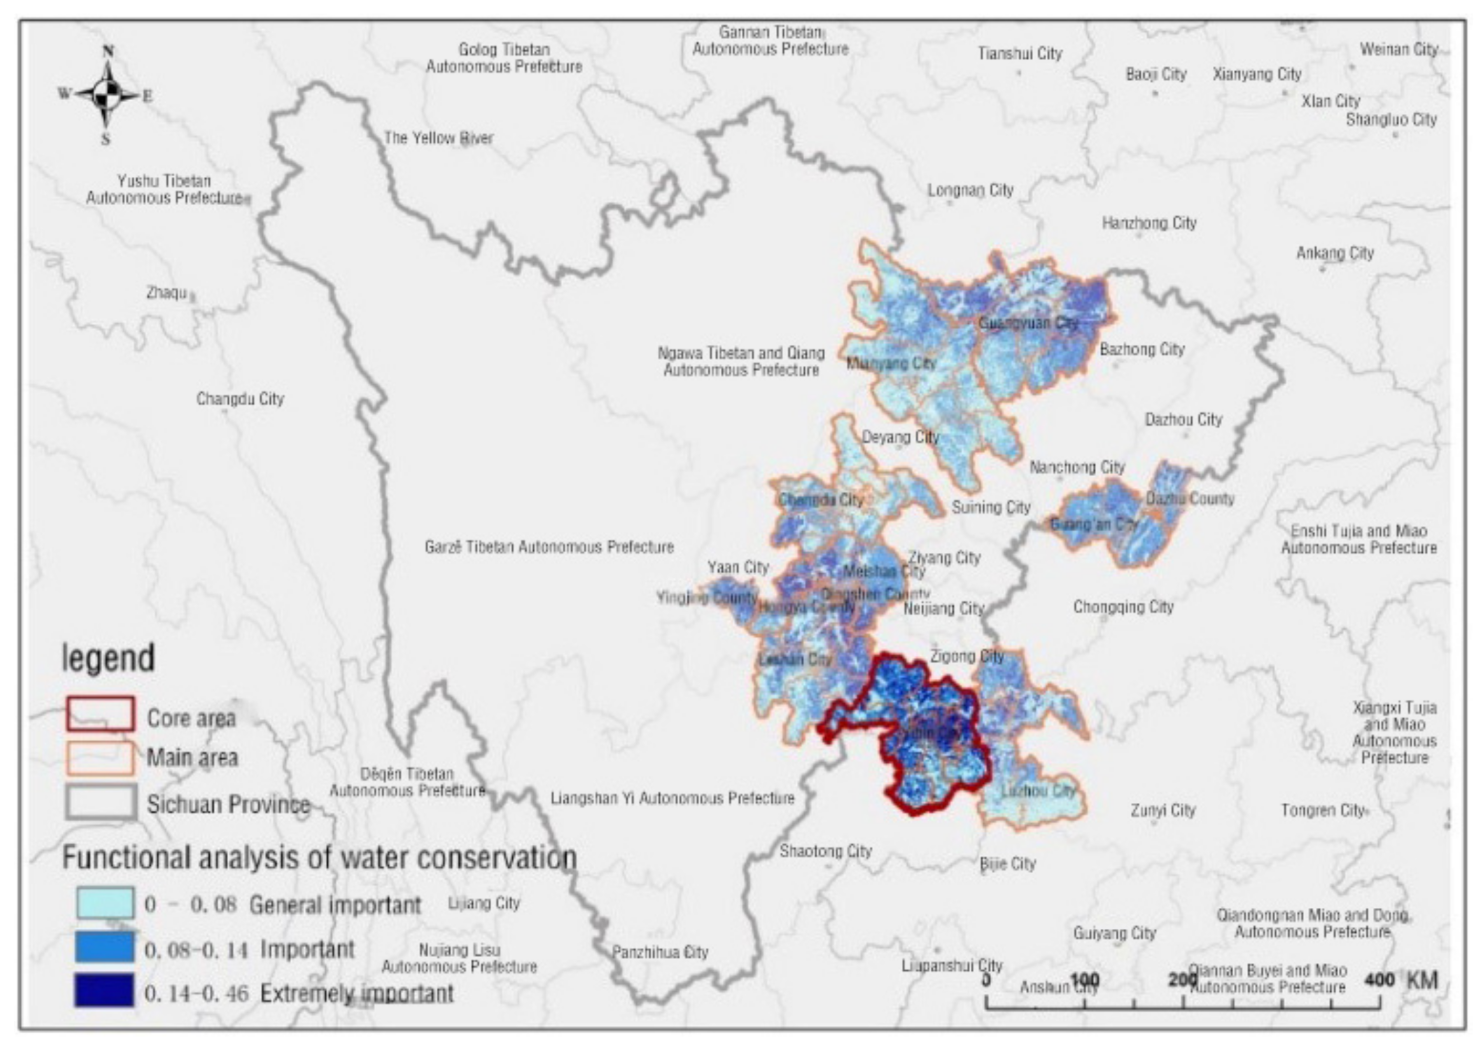
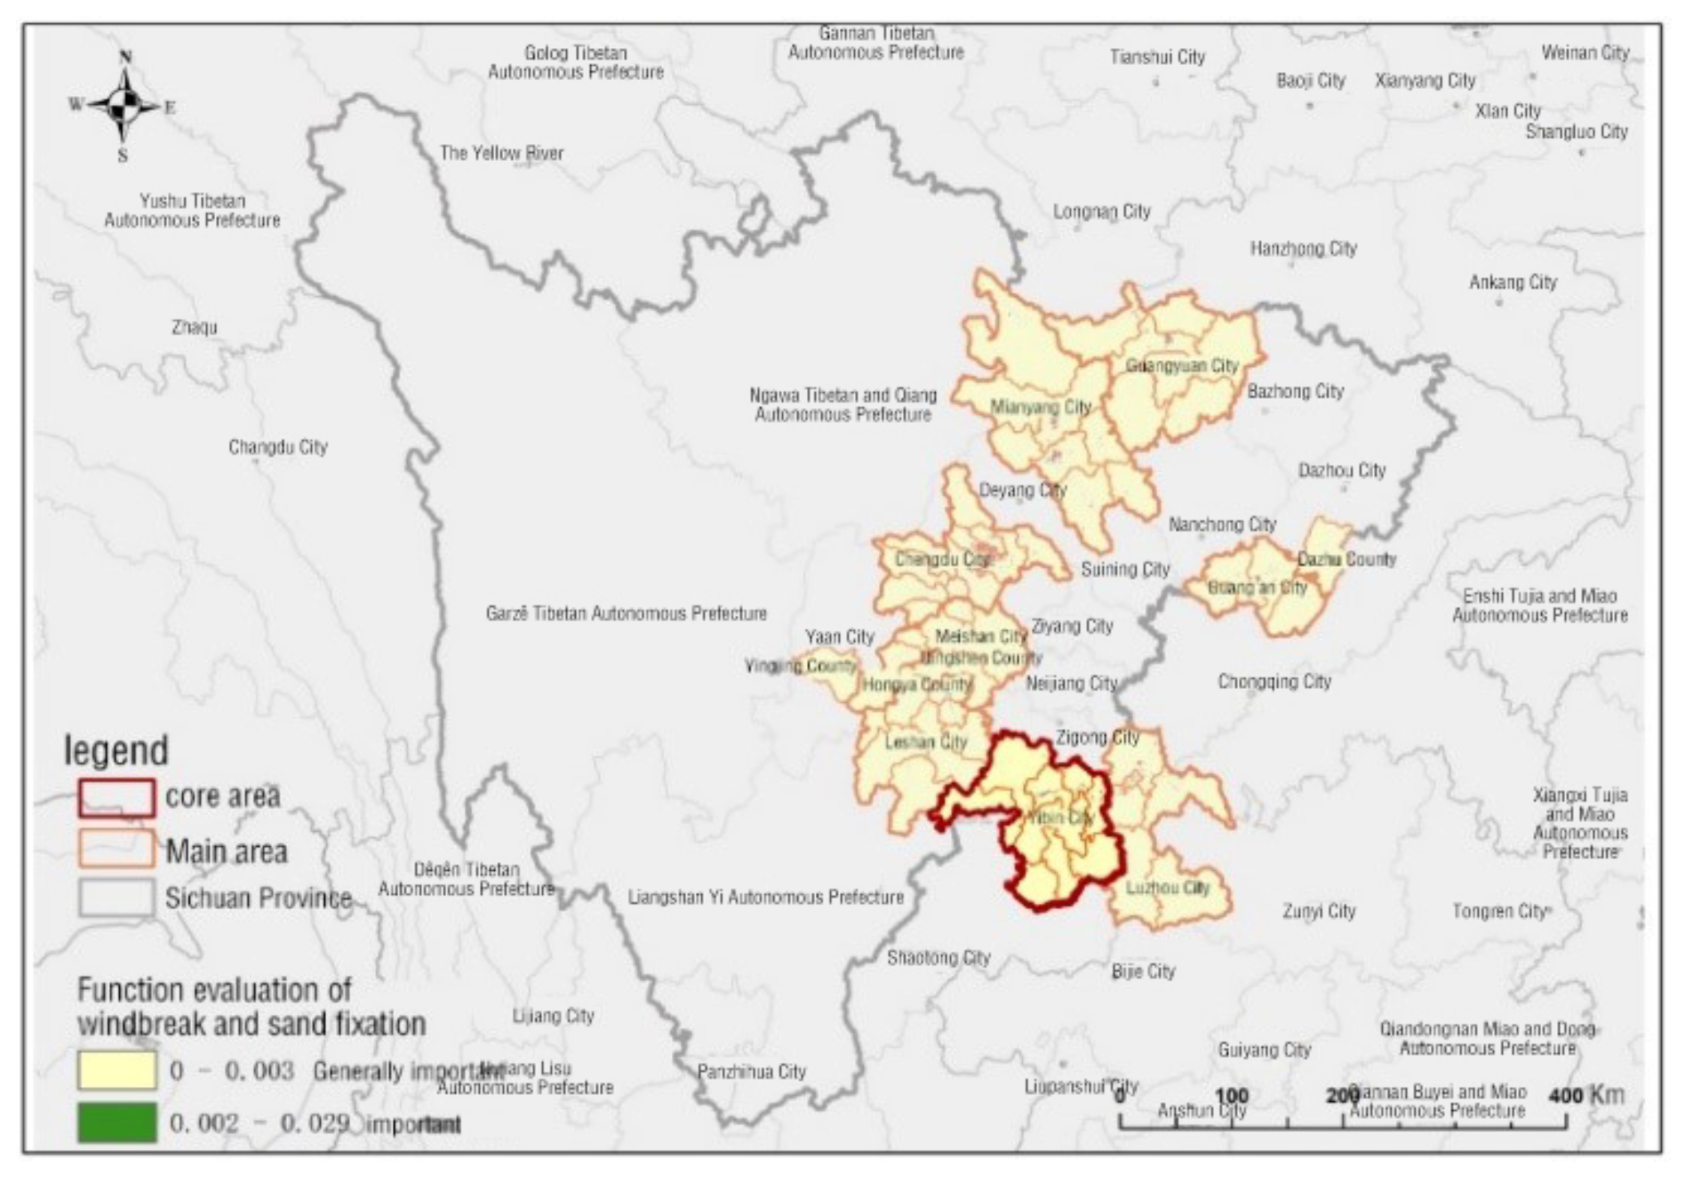
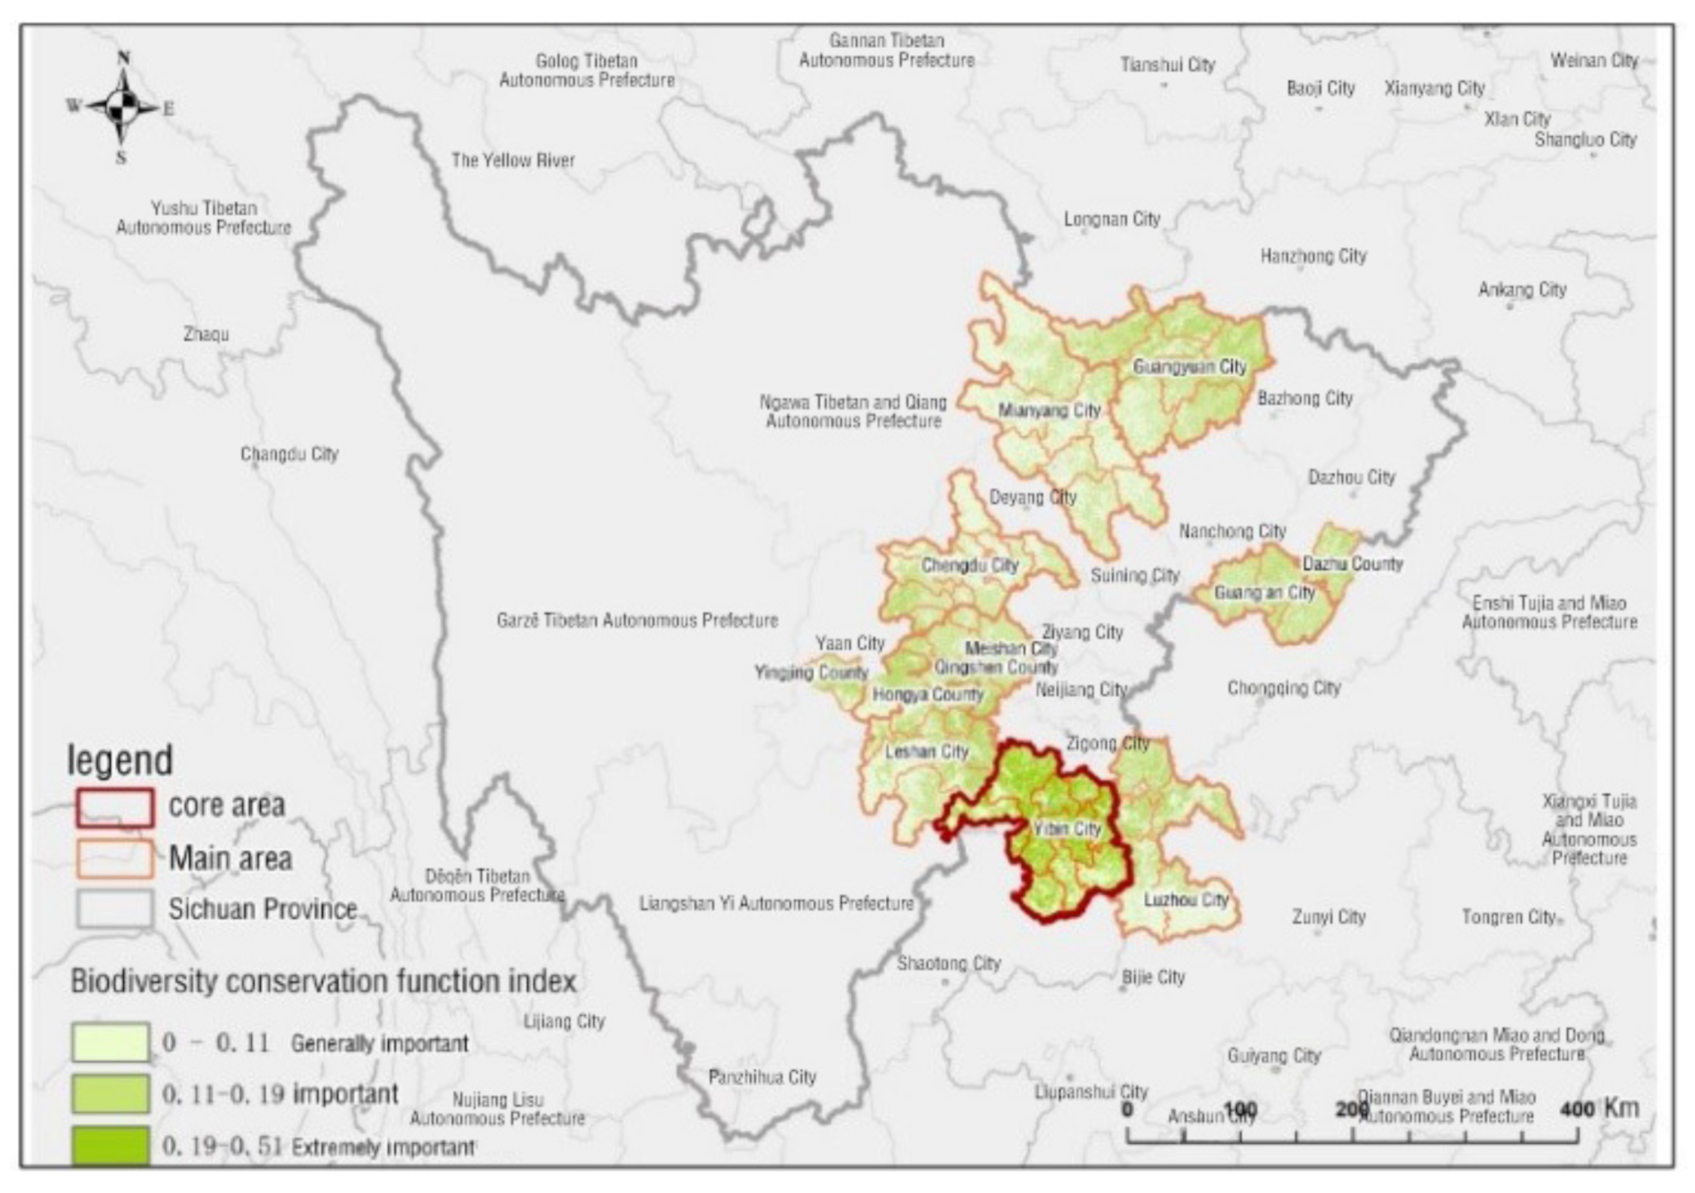
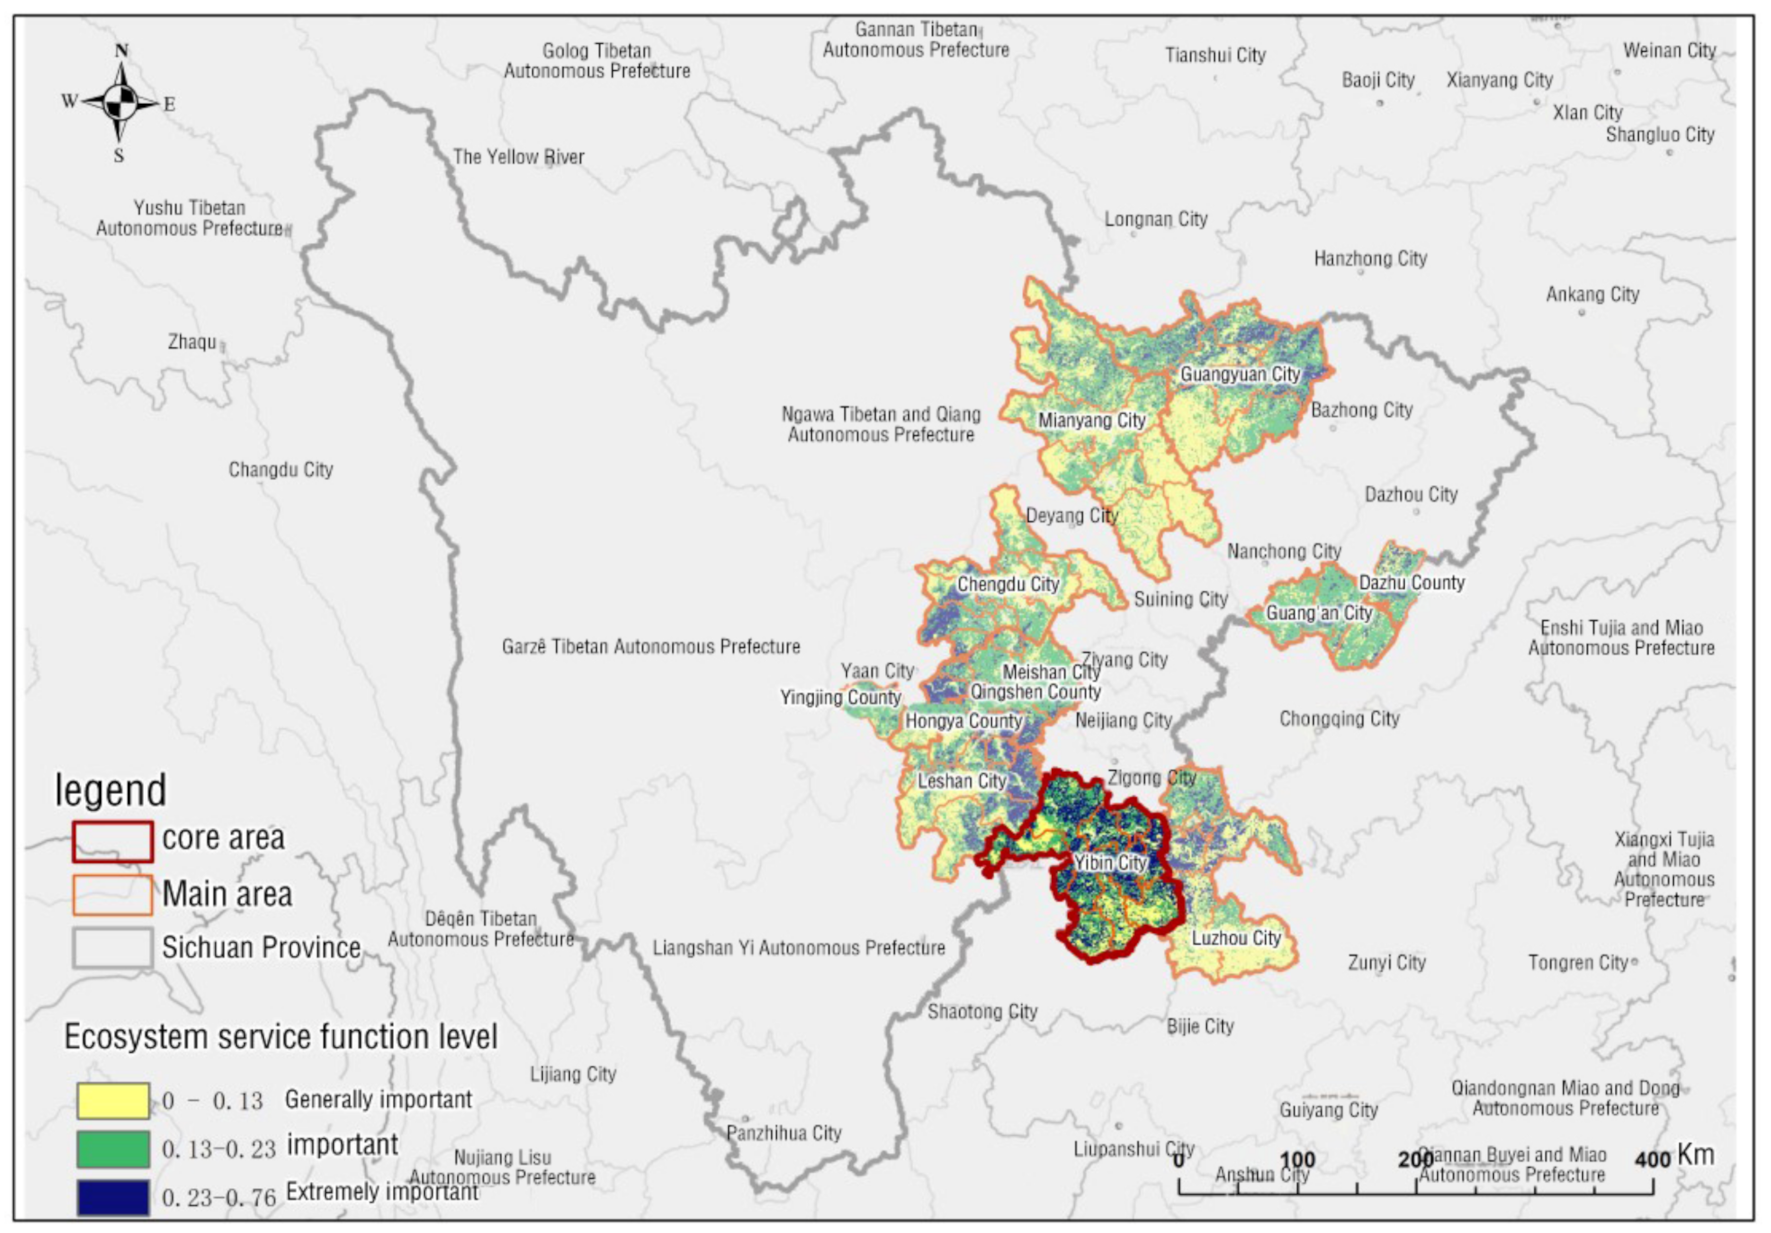
- Importance of ecosystem services
- (3)
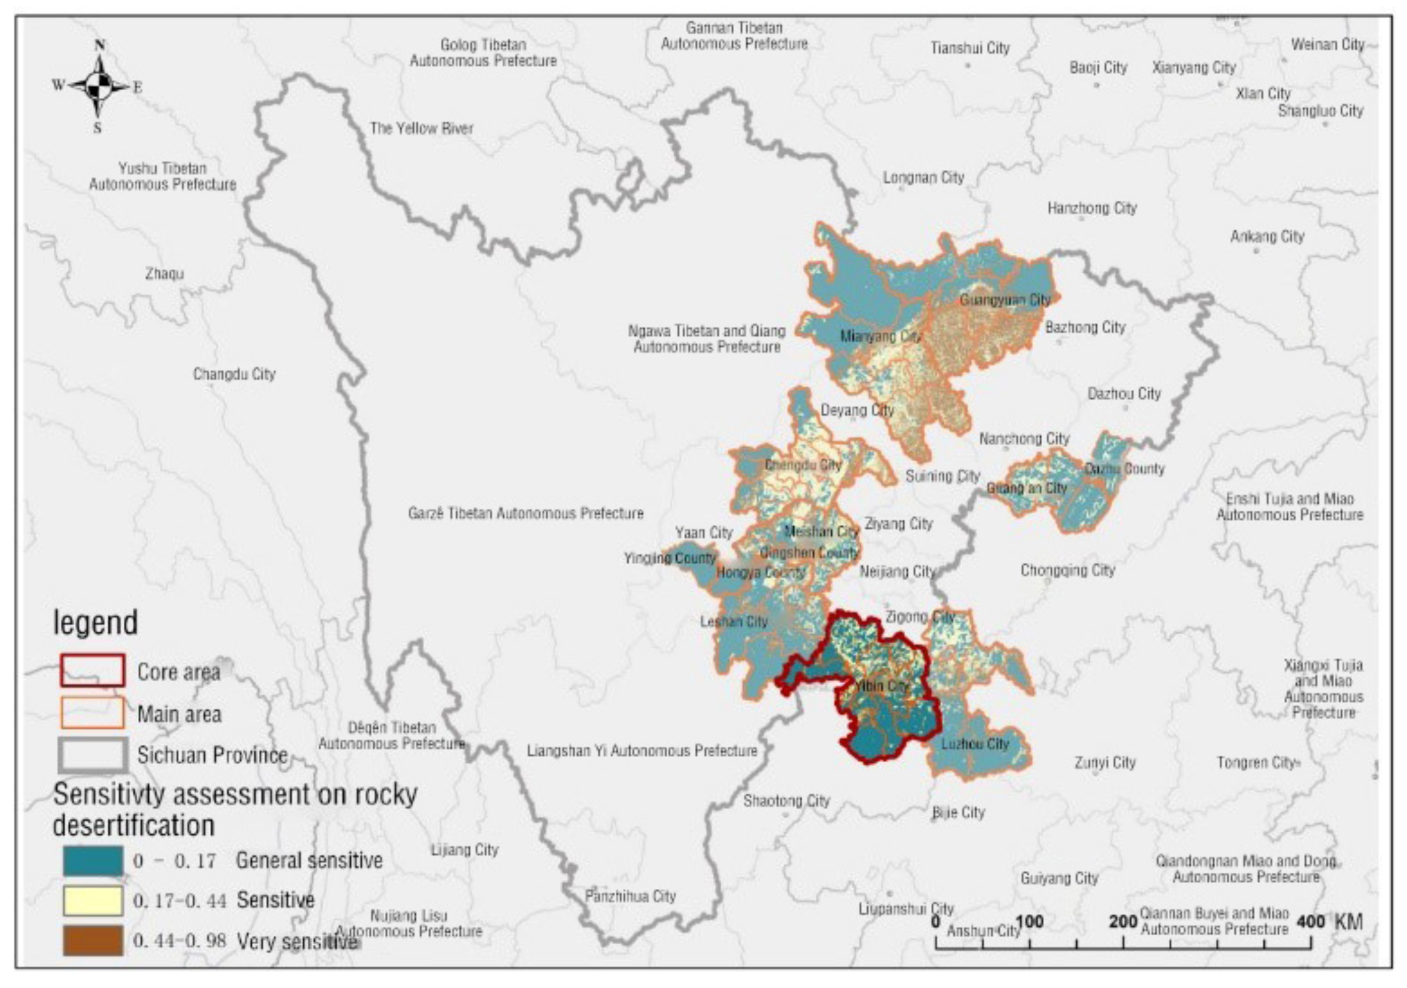
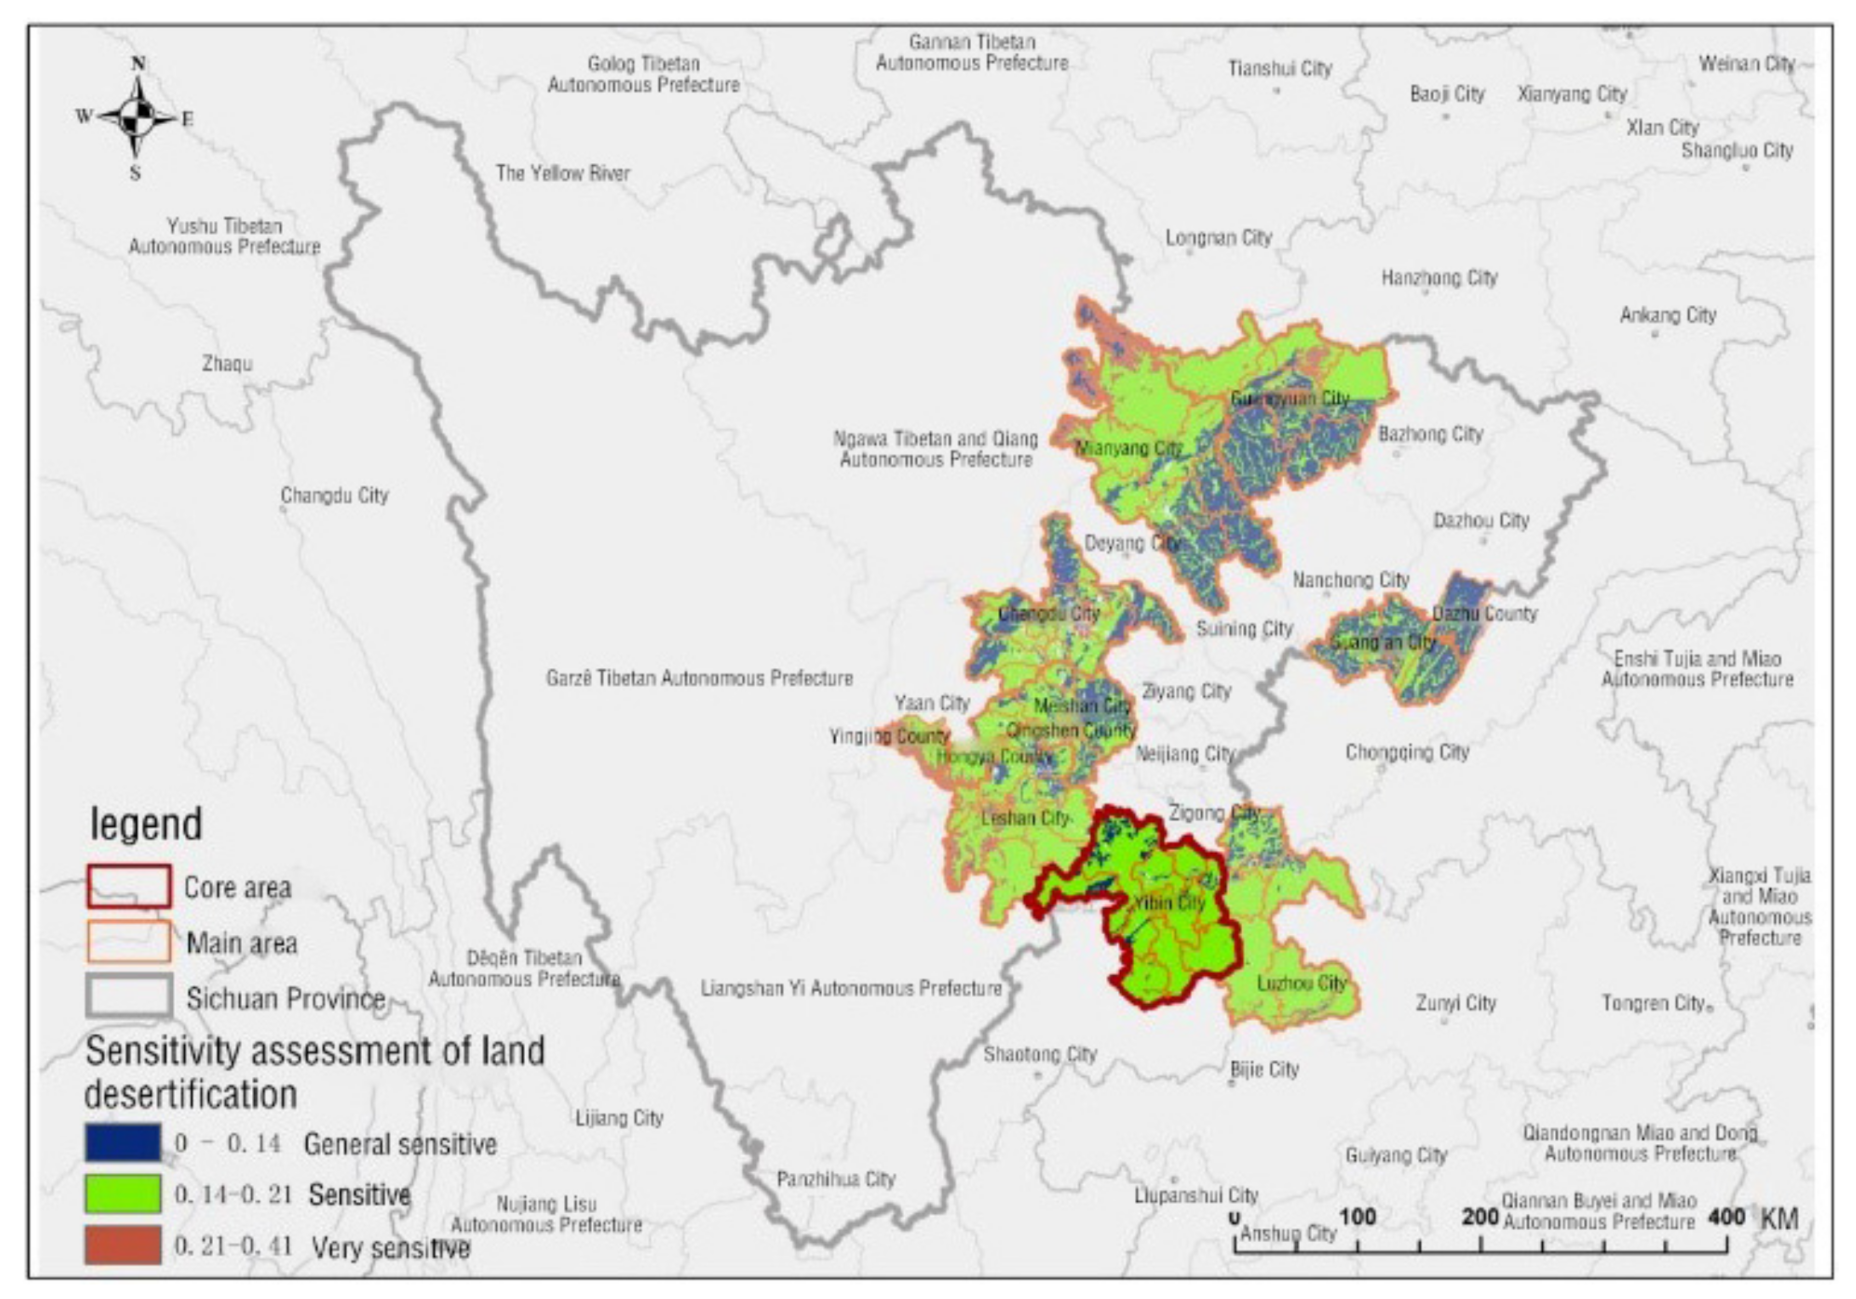
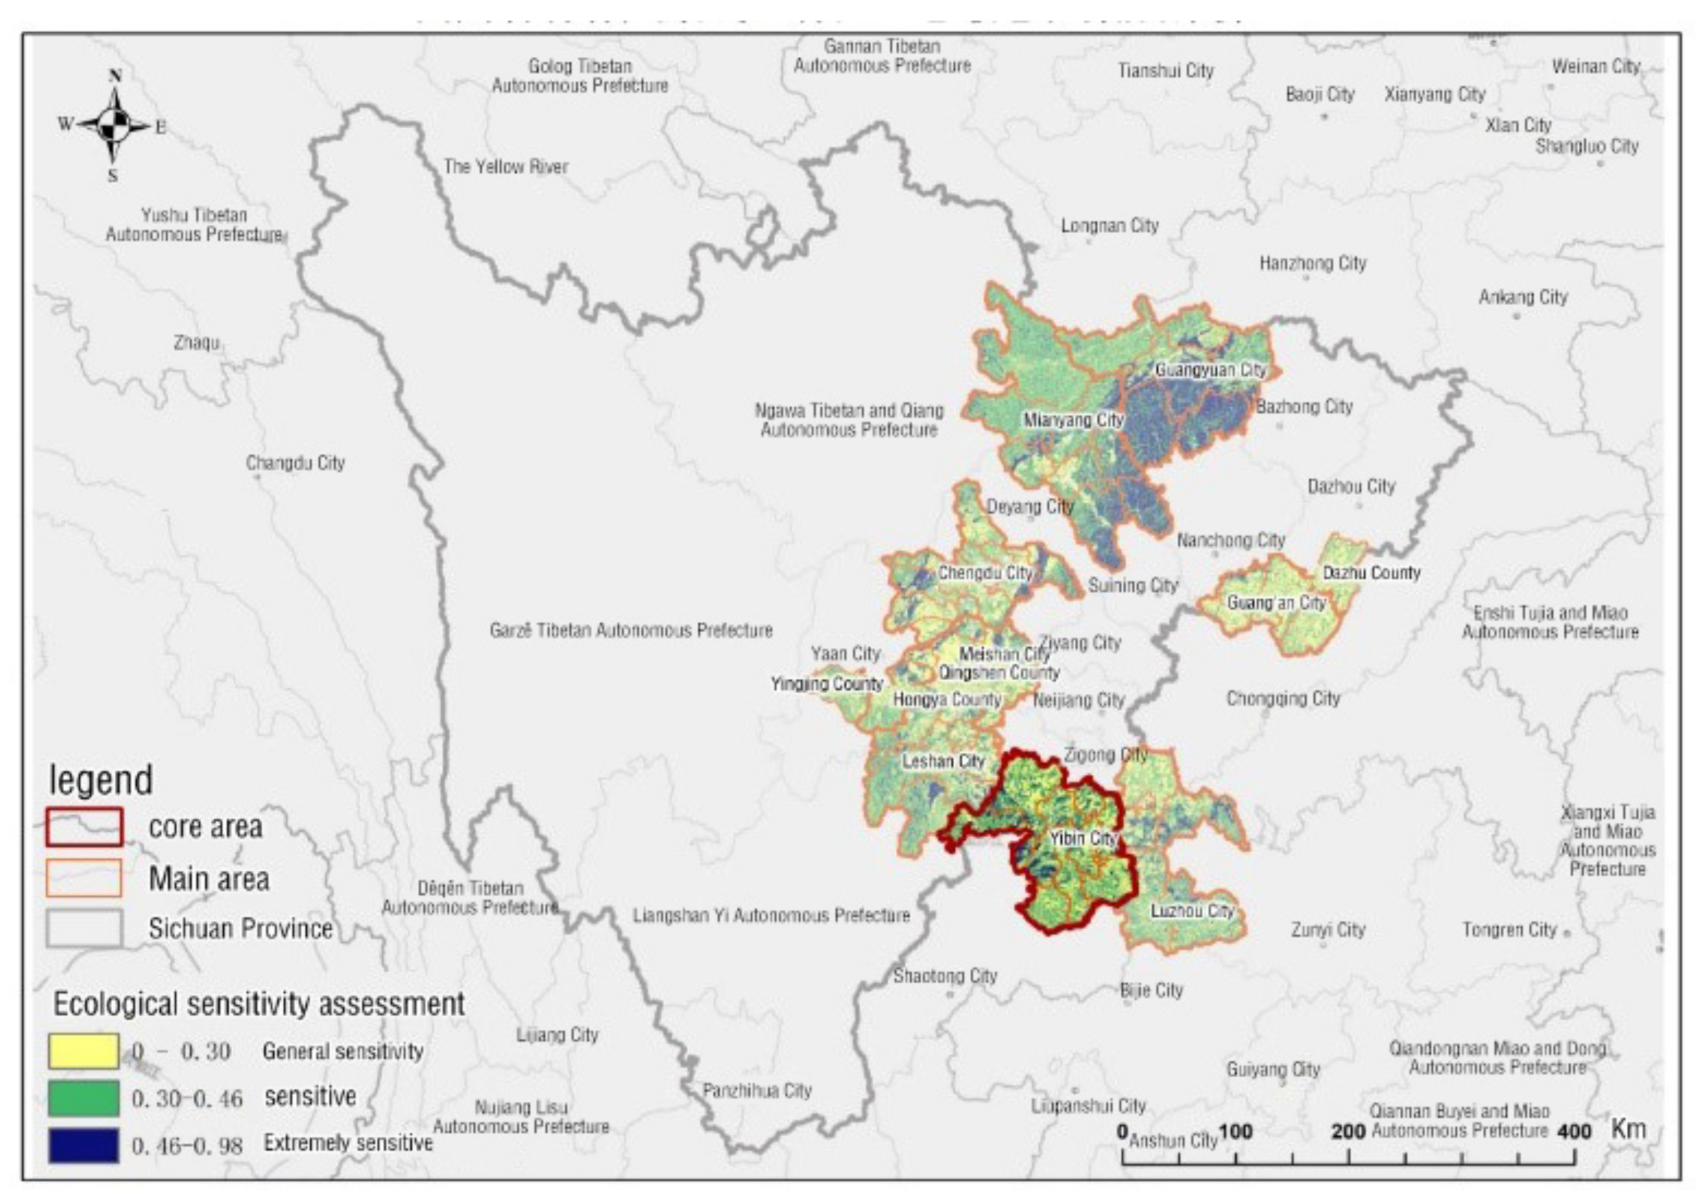
- Ecological sensitivity analysis and evaluation
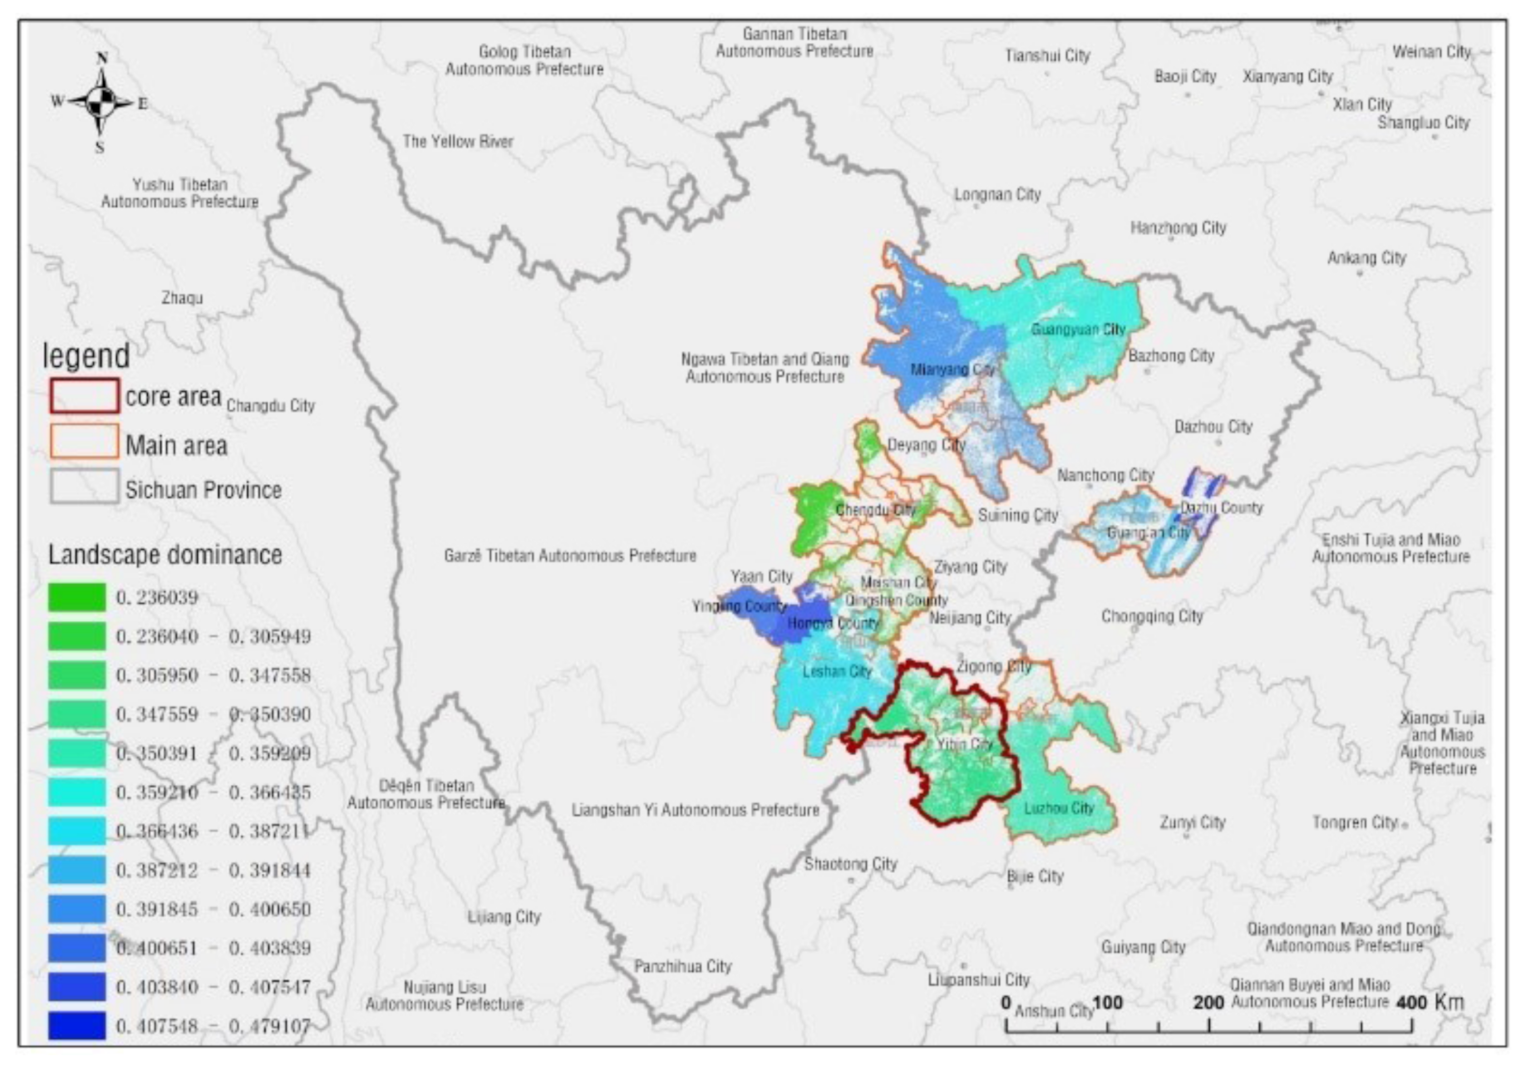
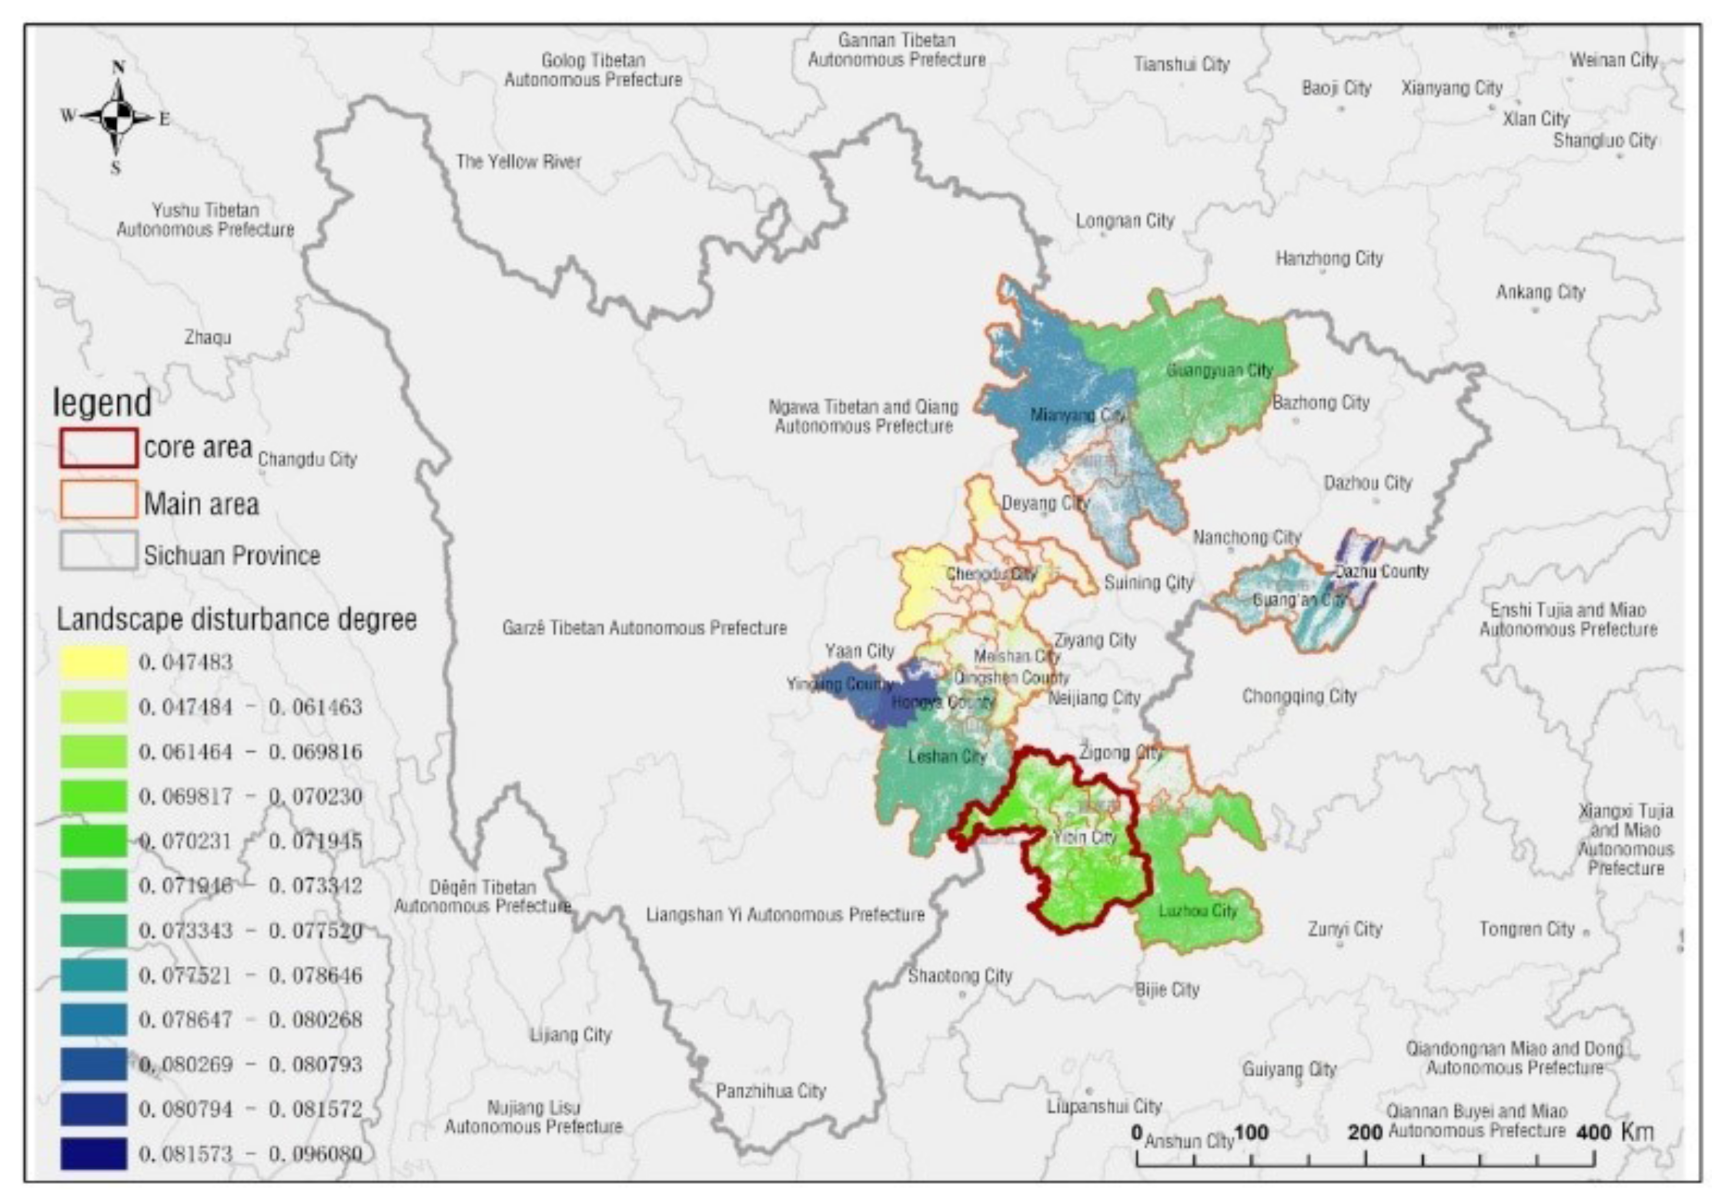
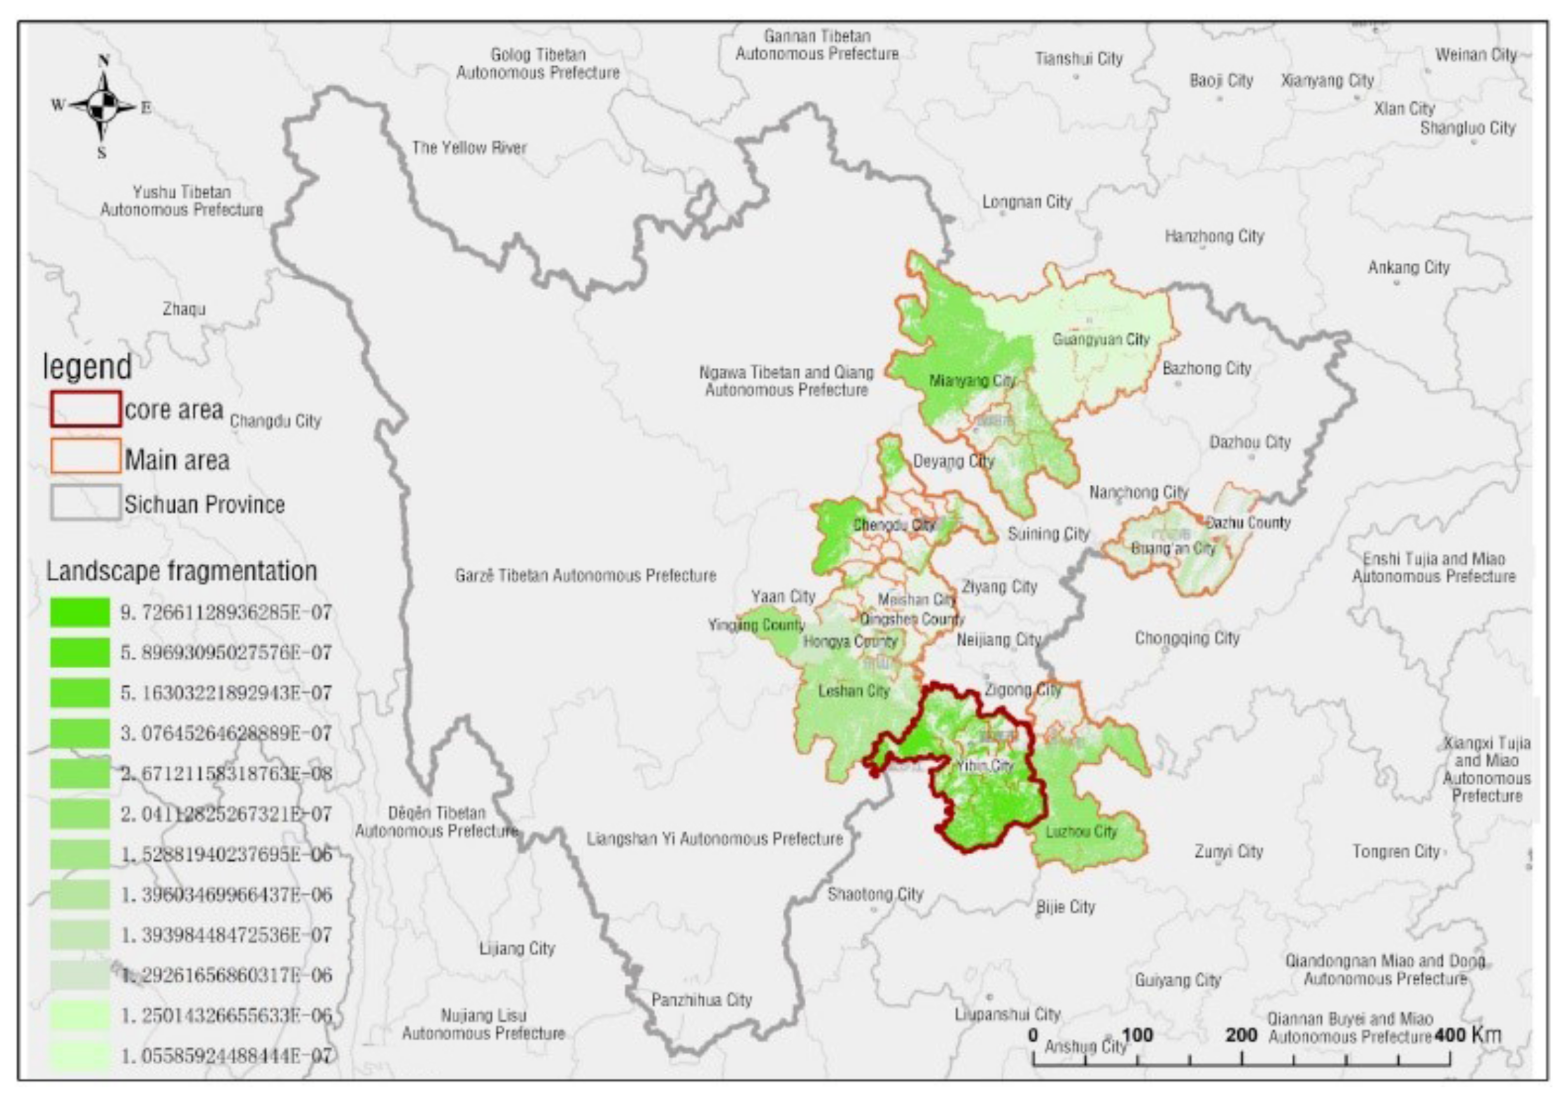
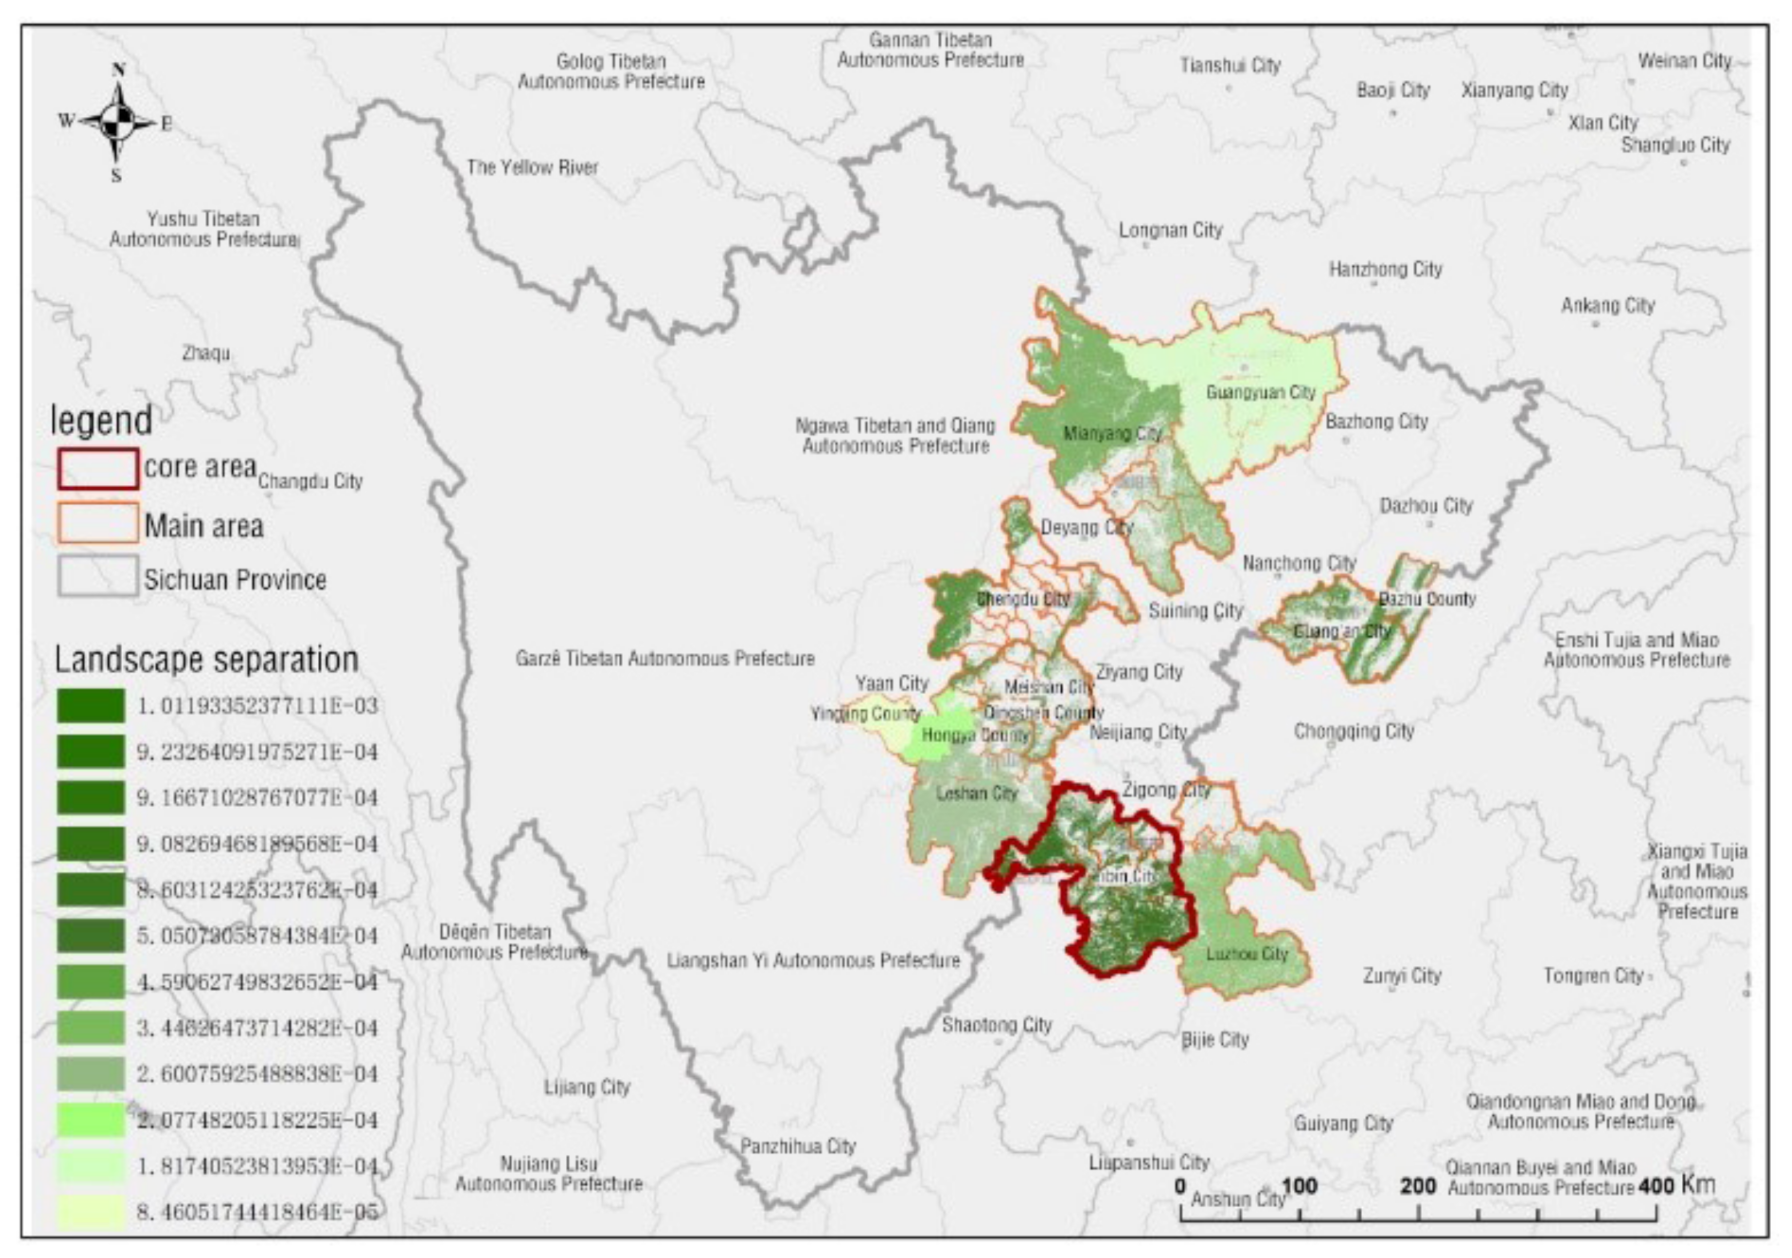
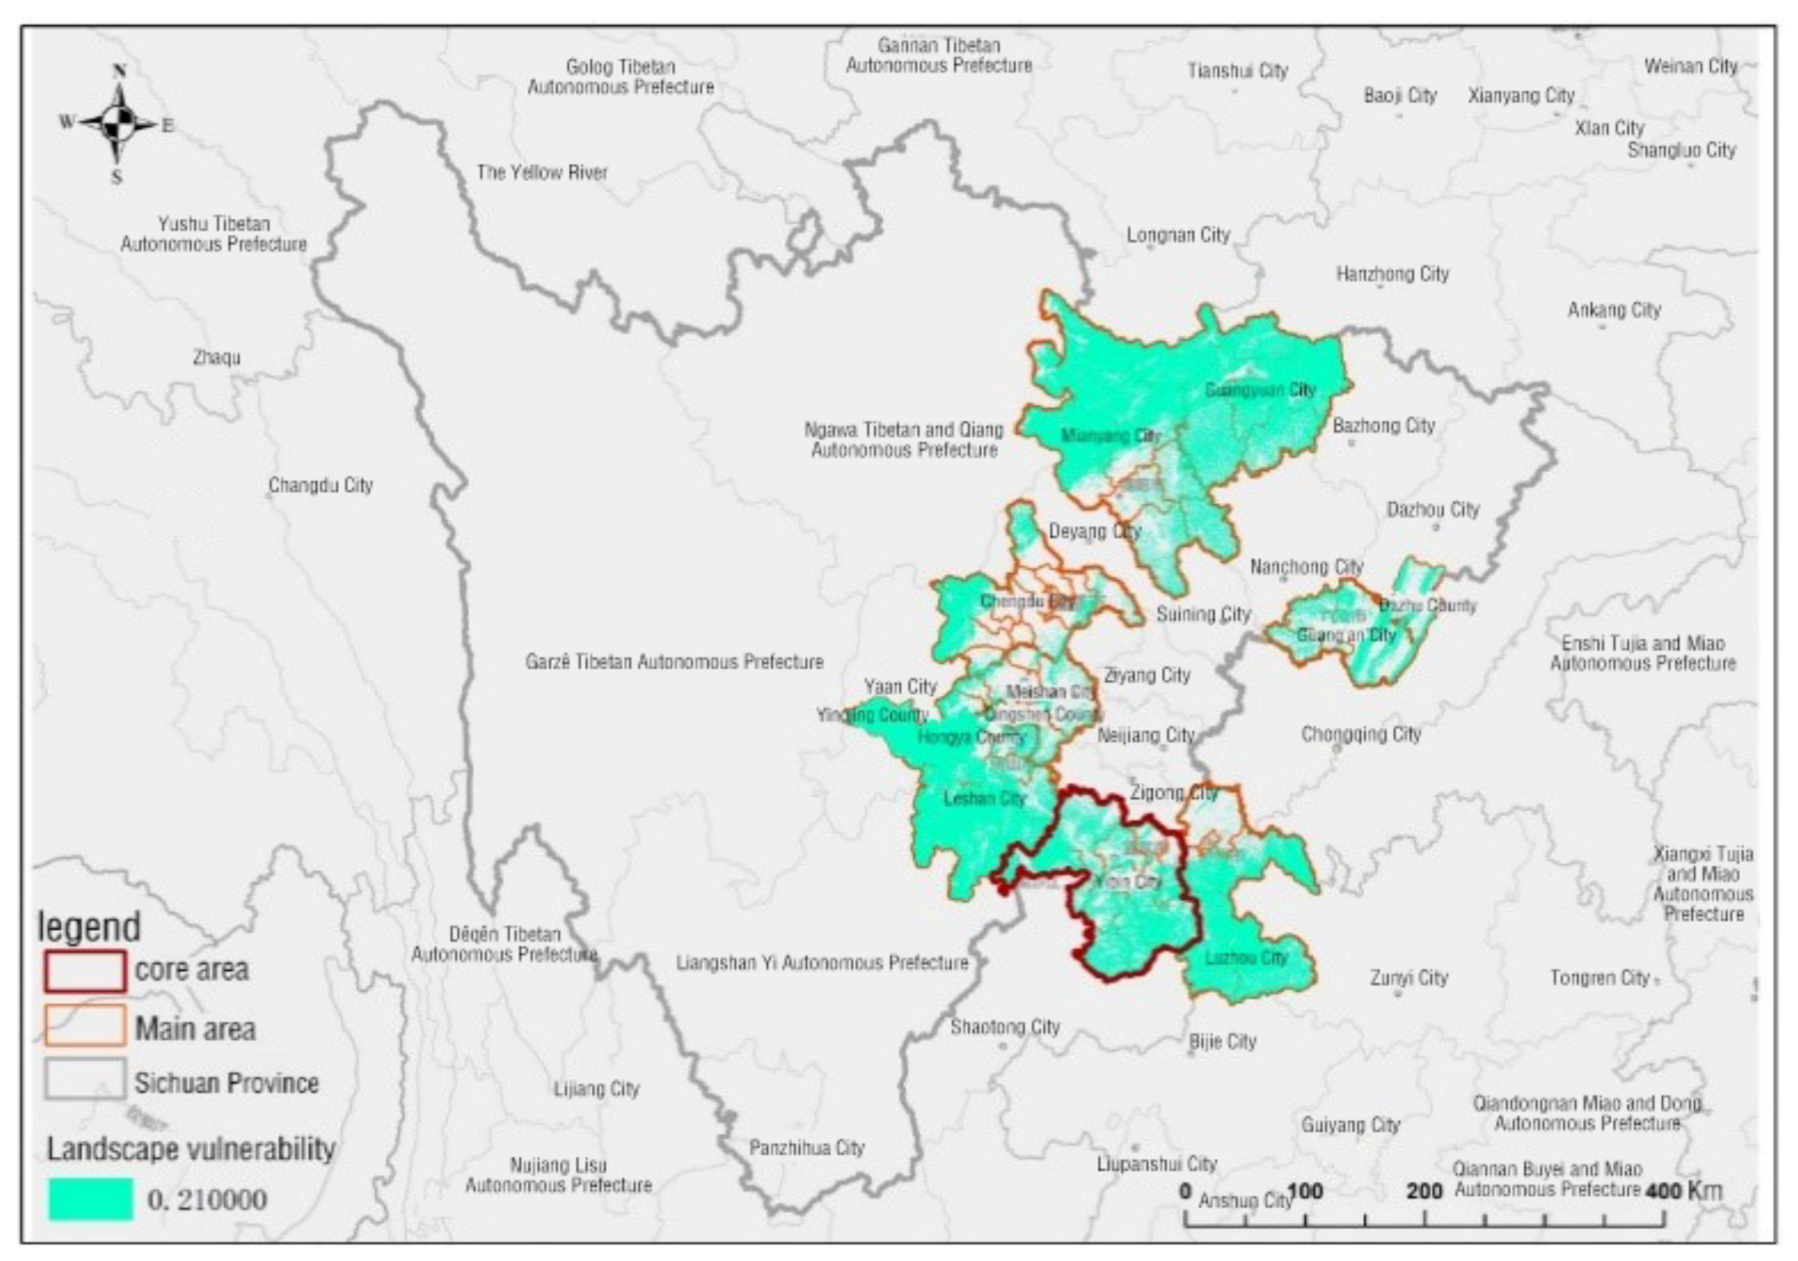
3.1.2. Landscape Pattern Layer
3.1.3. Infrastructure Layer
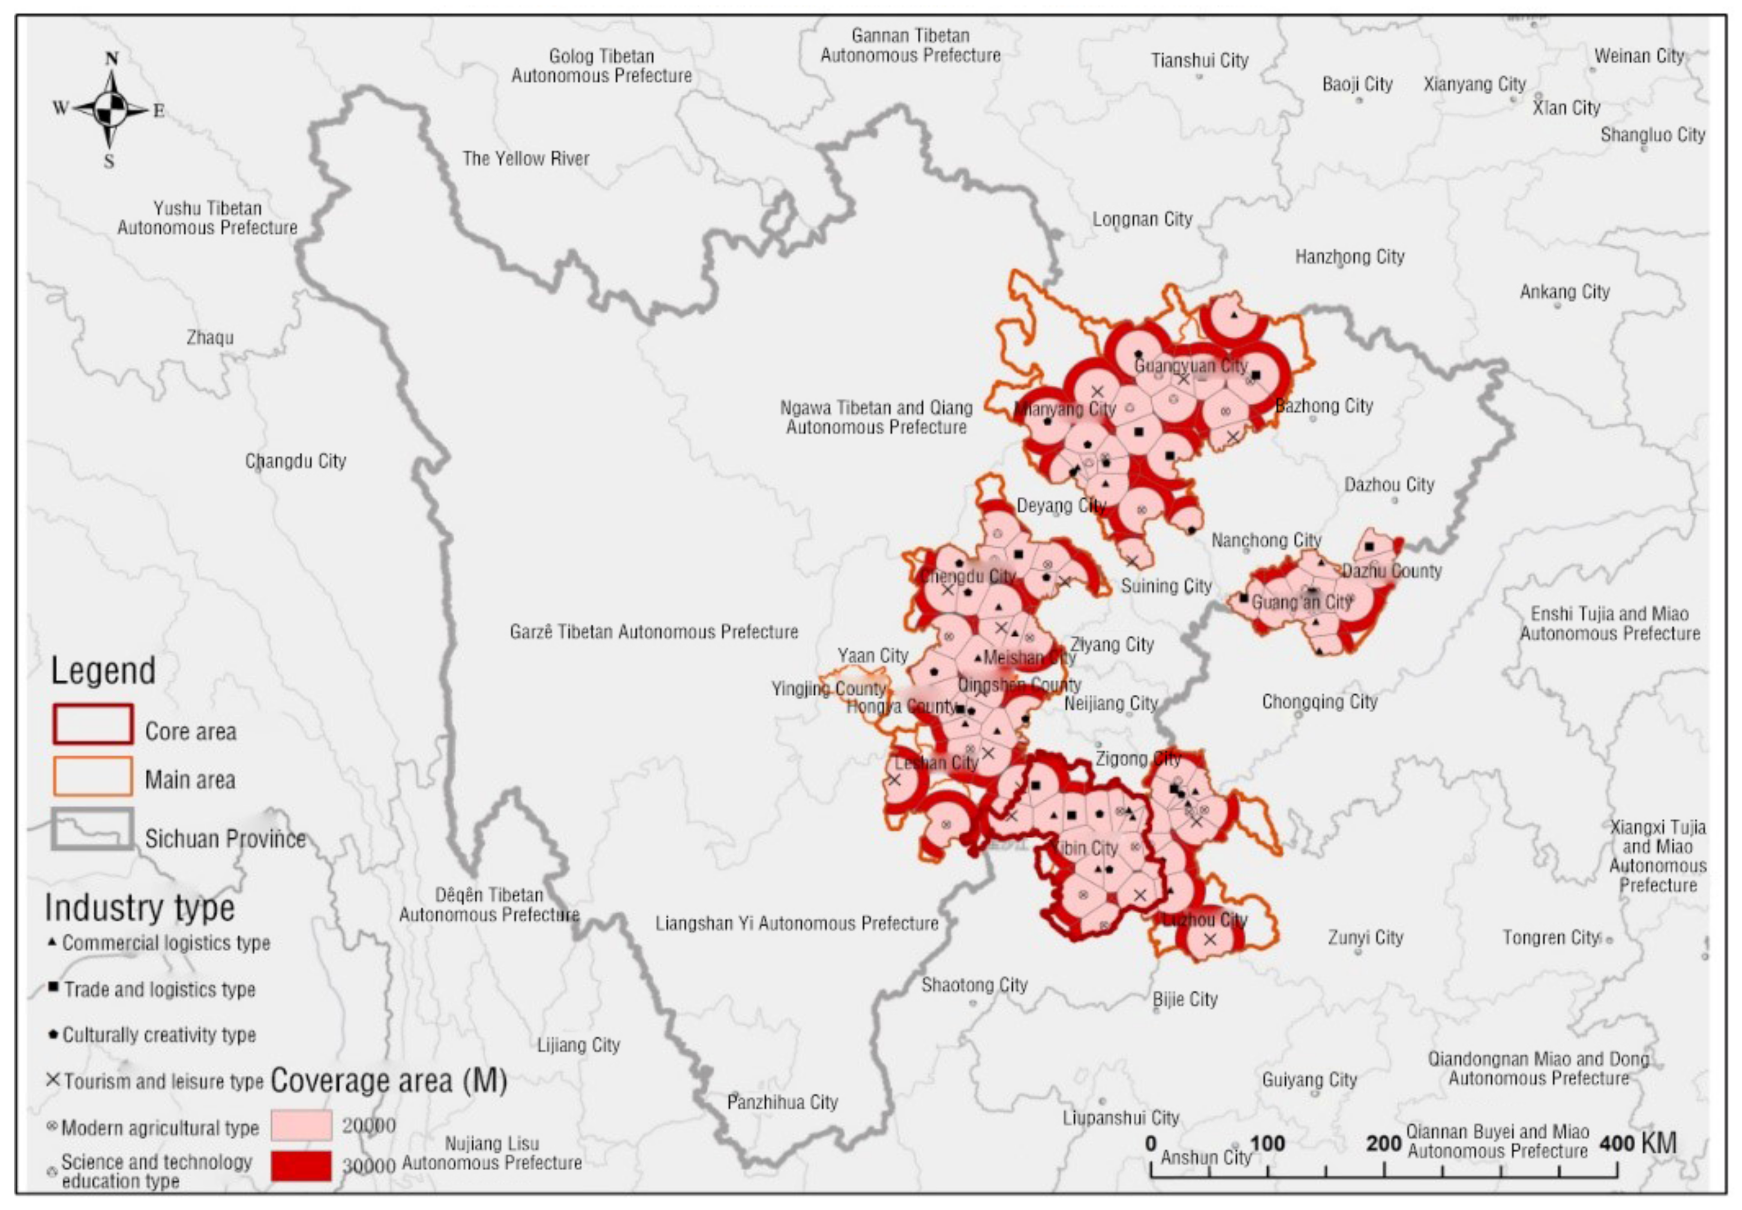
3.1.4. Industrial Development Layer
3.2. Establishment of the Bamboo Scenic Line Evaluation System
3.3. Results on Cost Path Analysis of the Bamboo Scenic Line
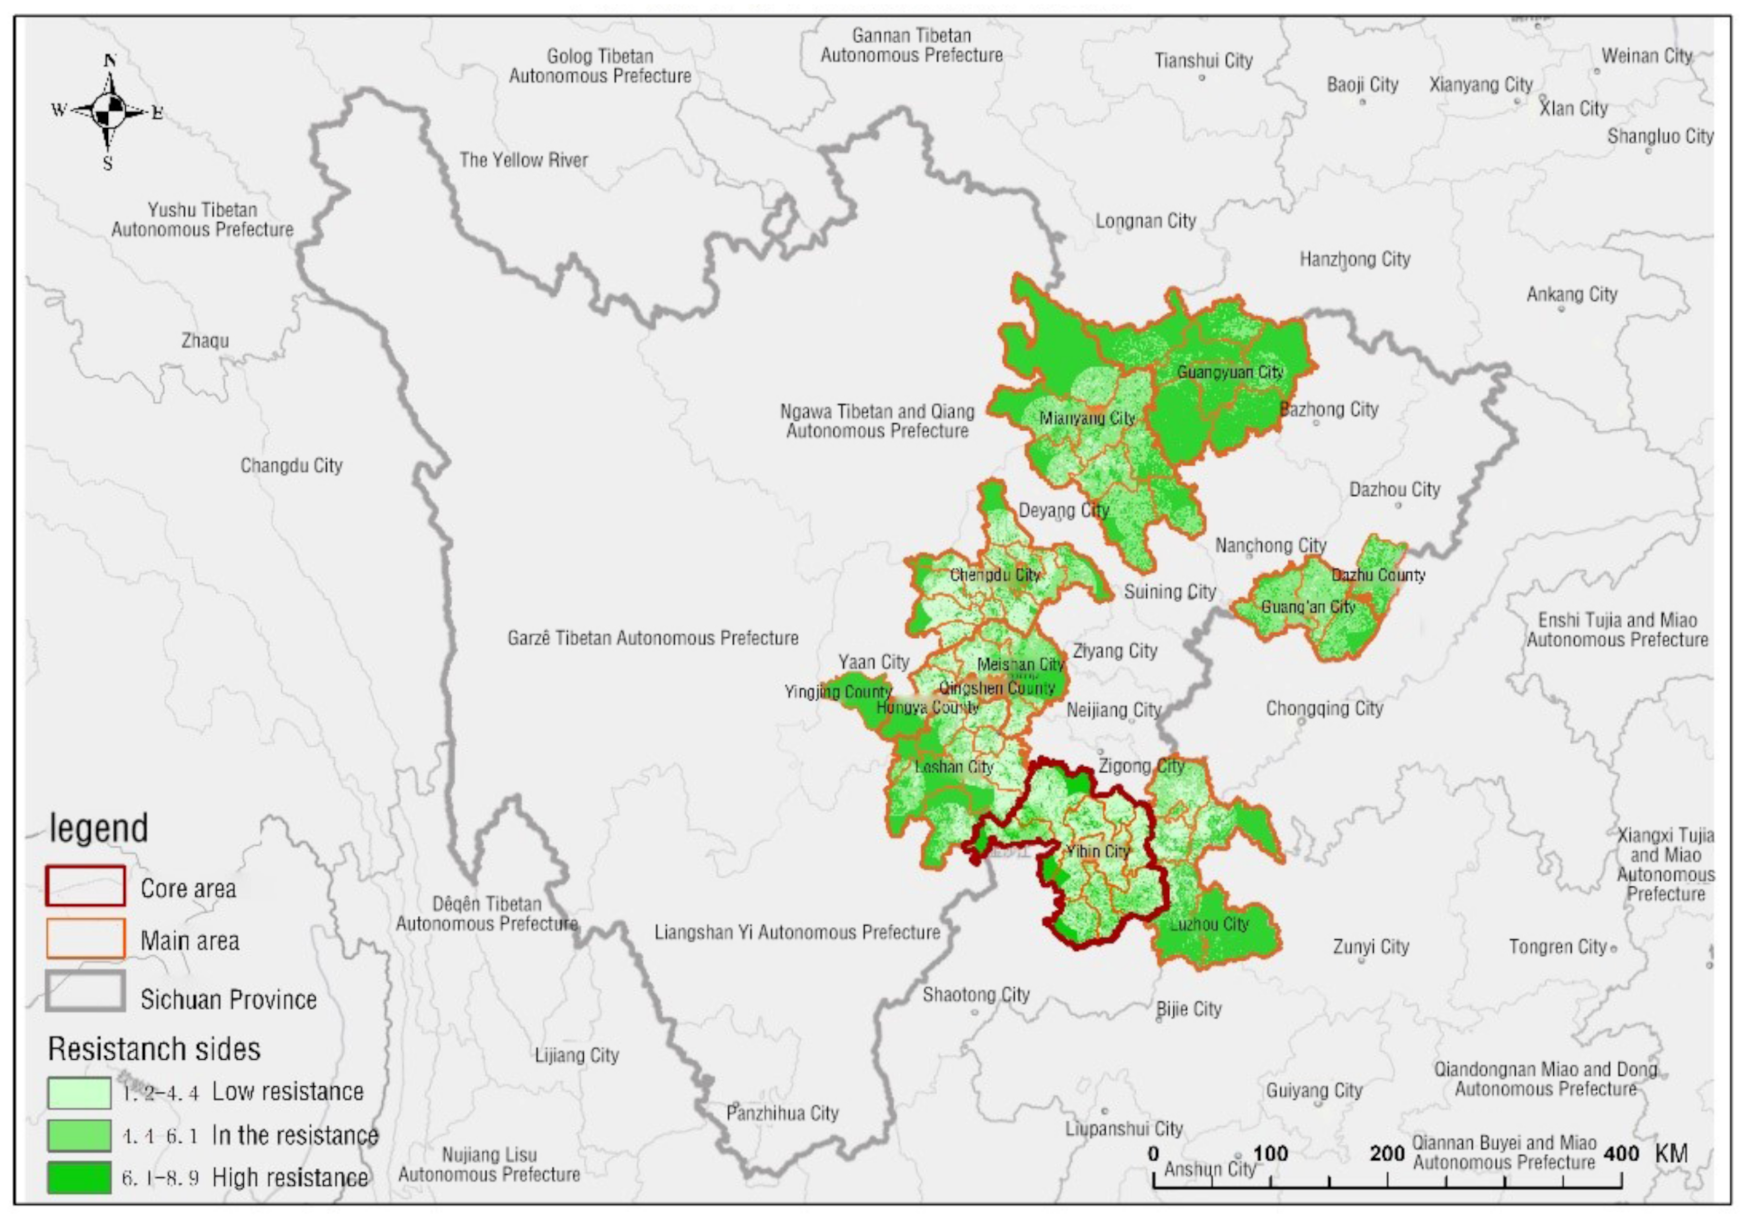
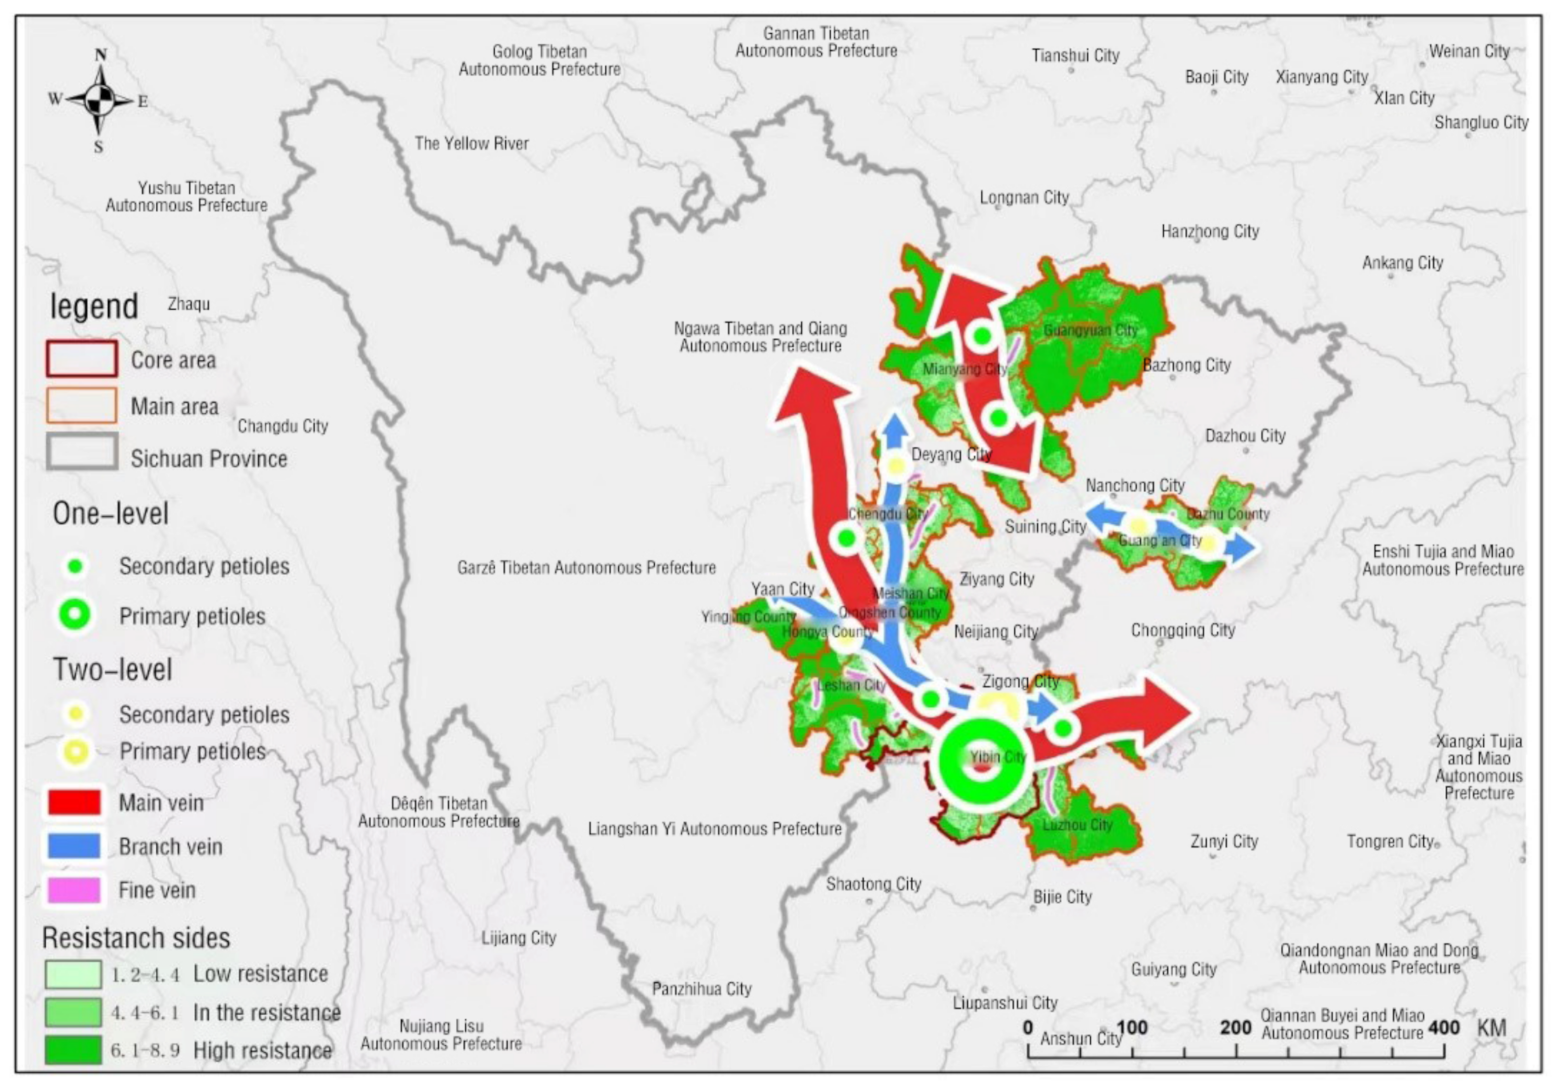
3.3.1. Resistance Sides
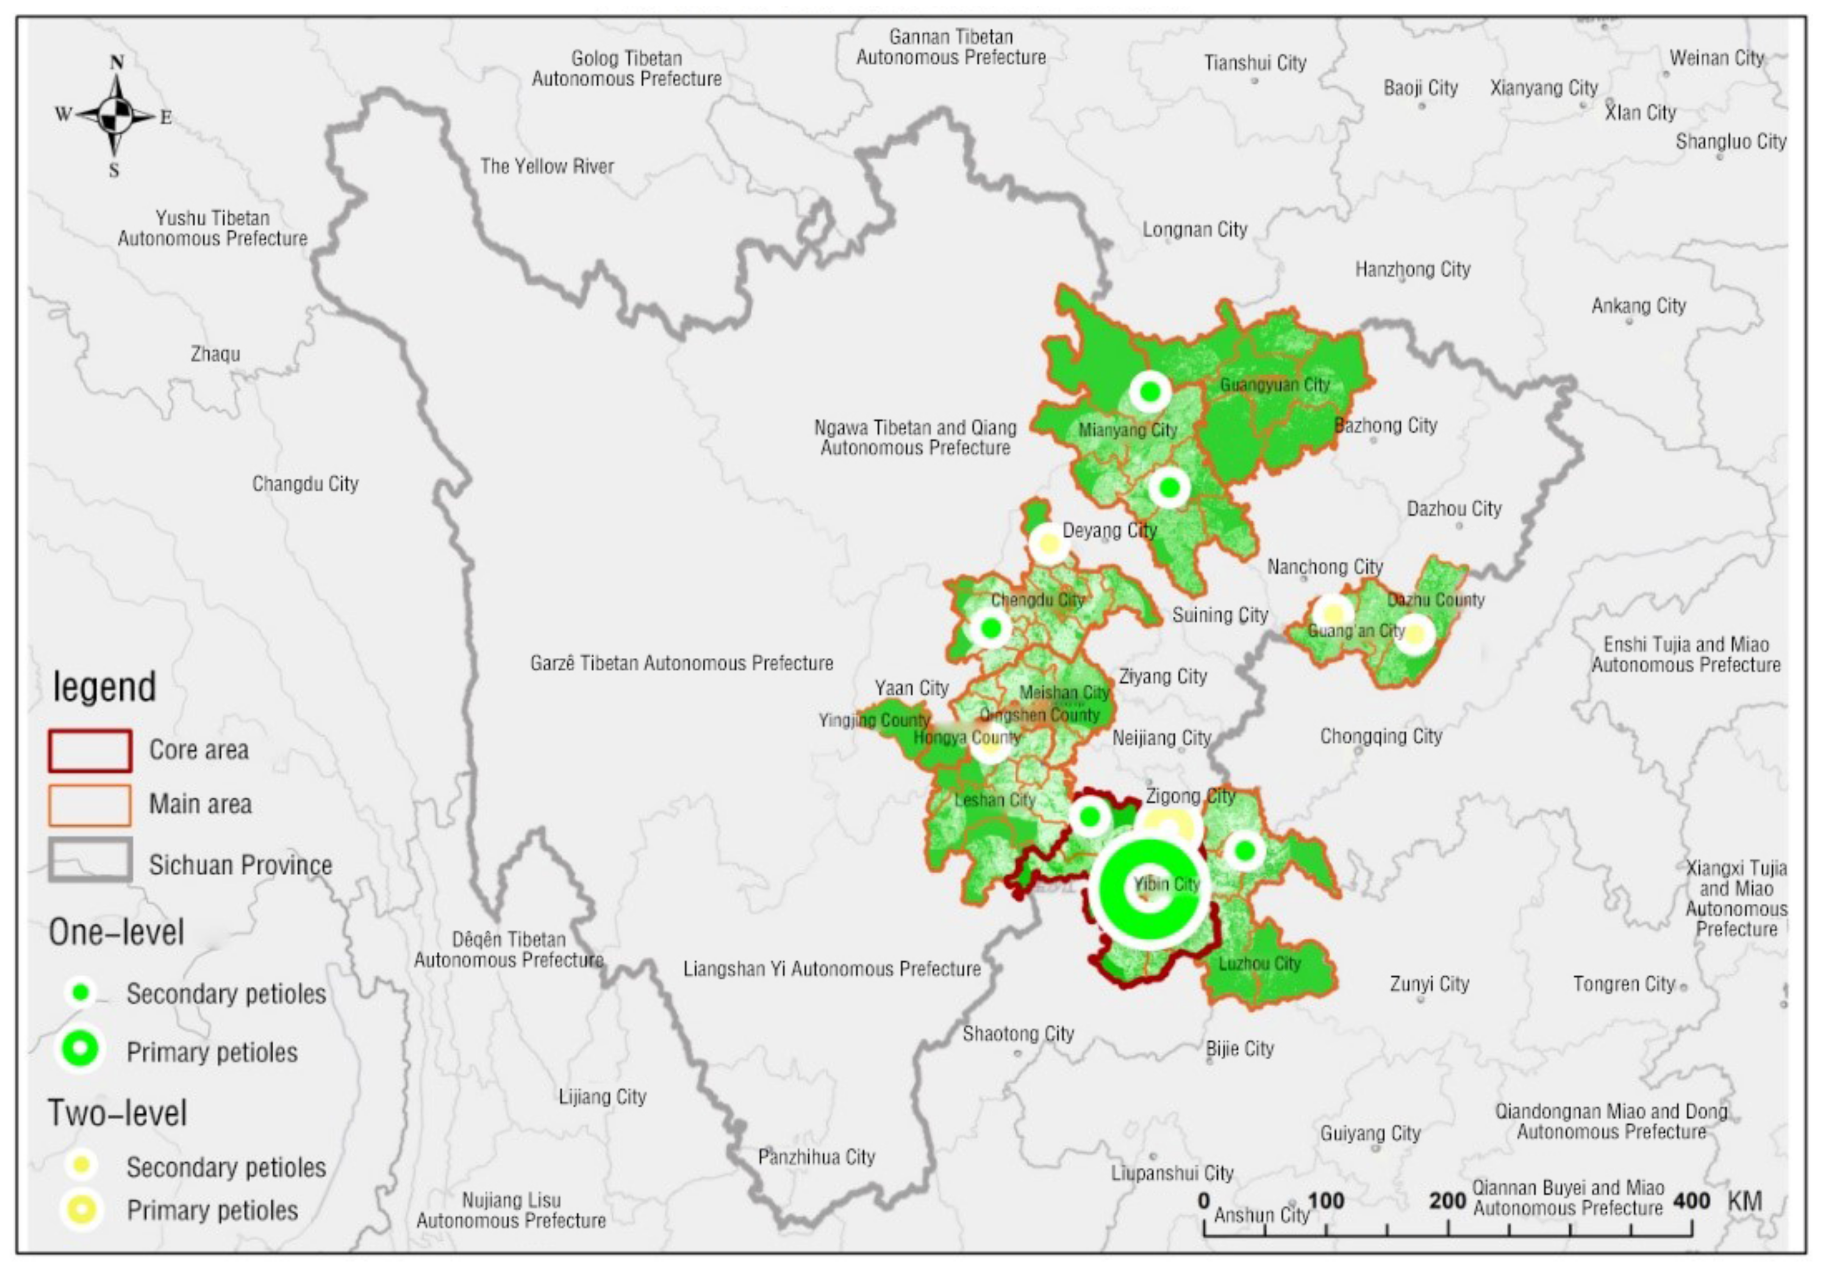
3.3.2. Petioles
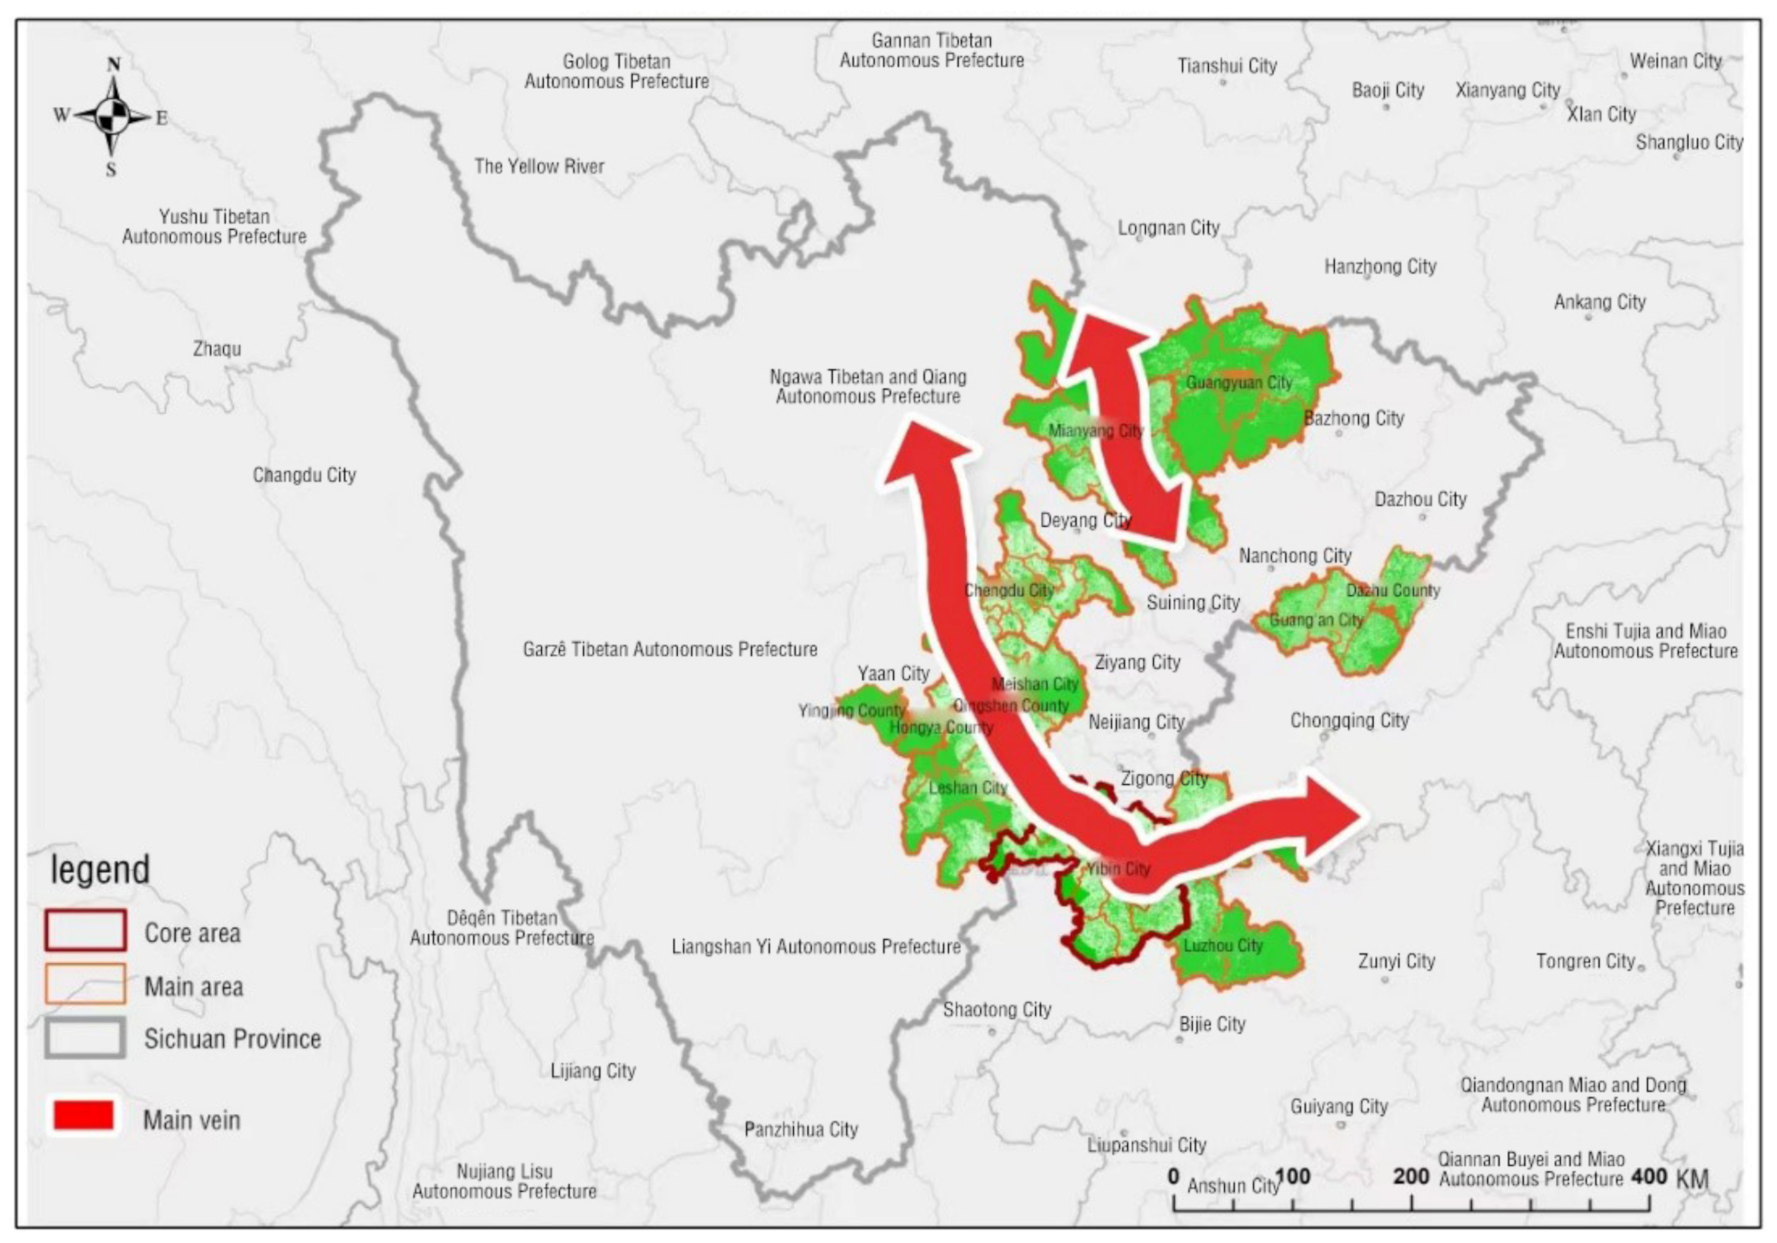
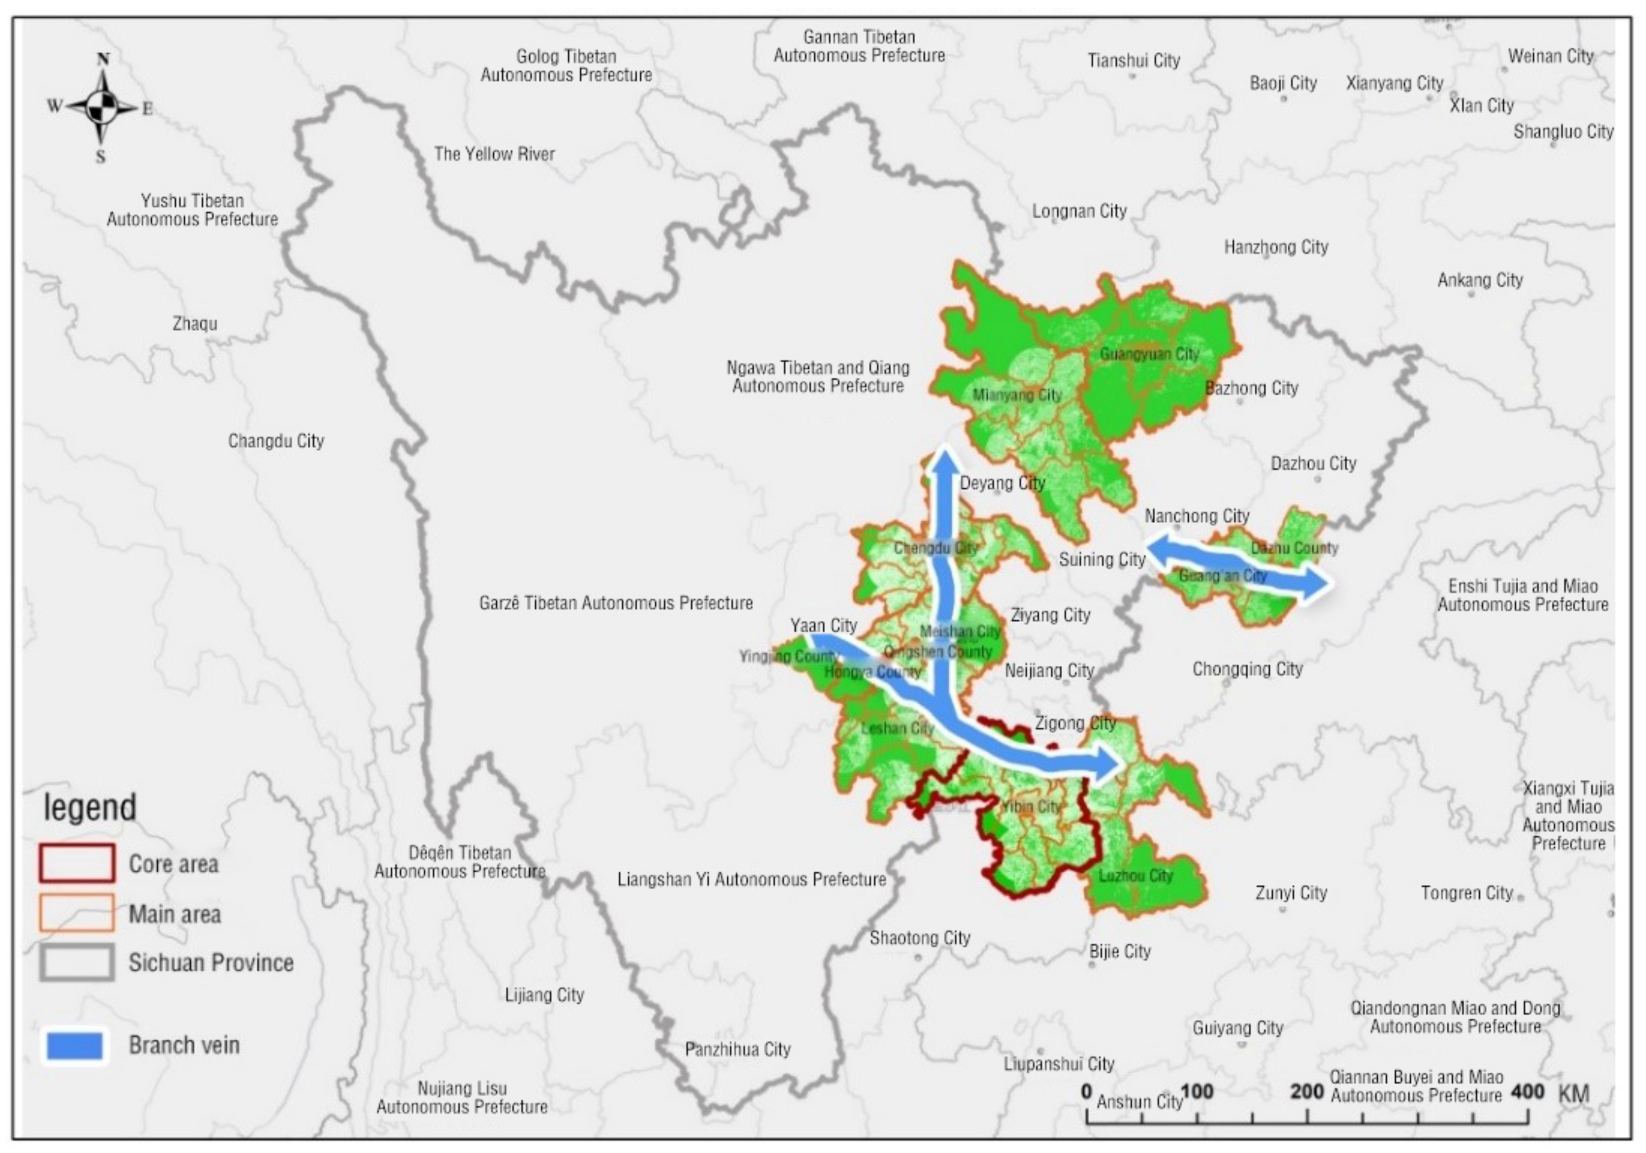
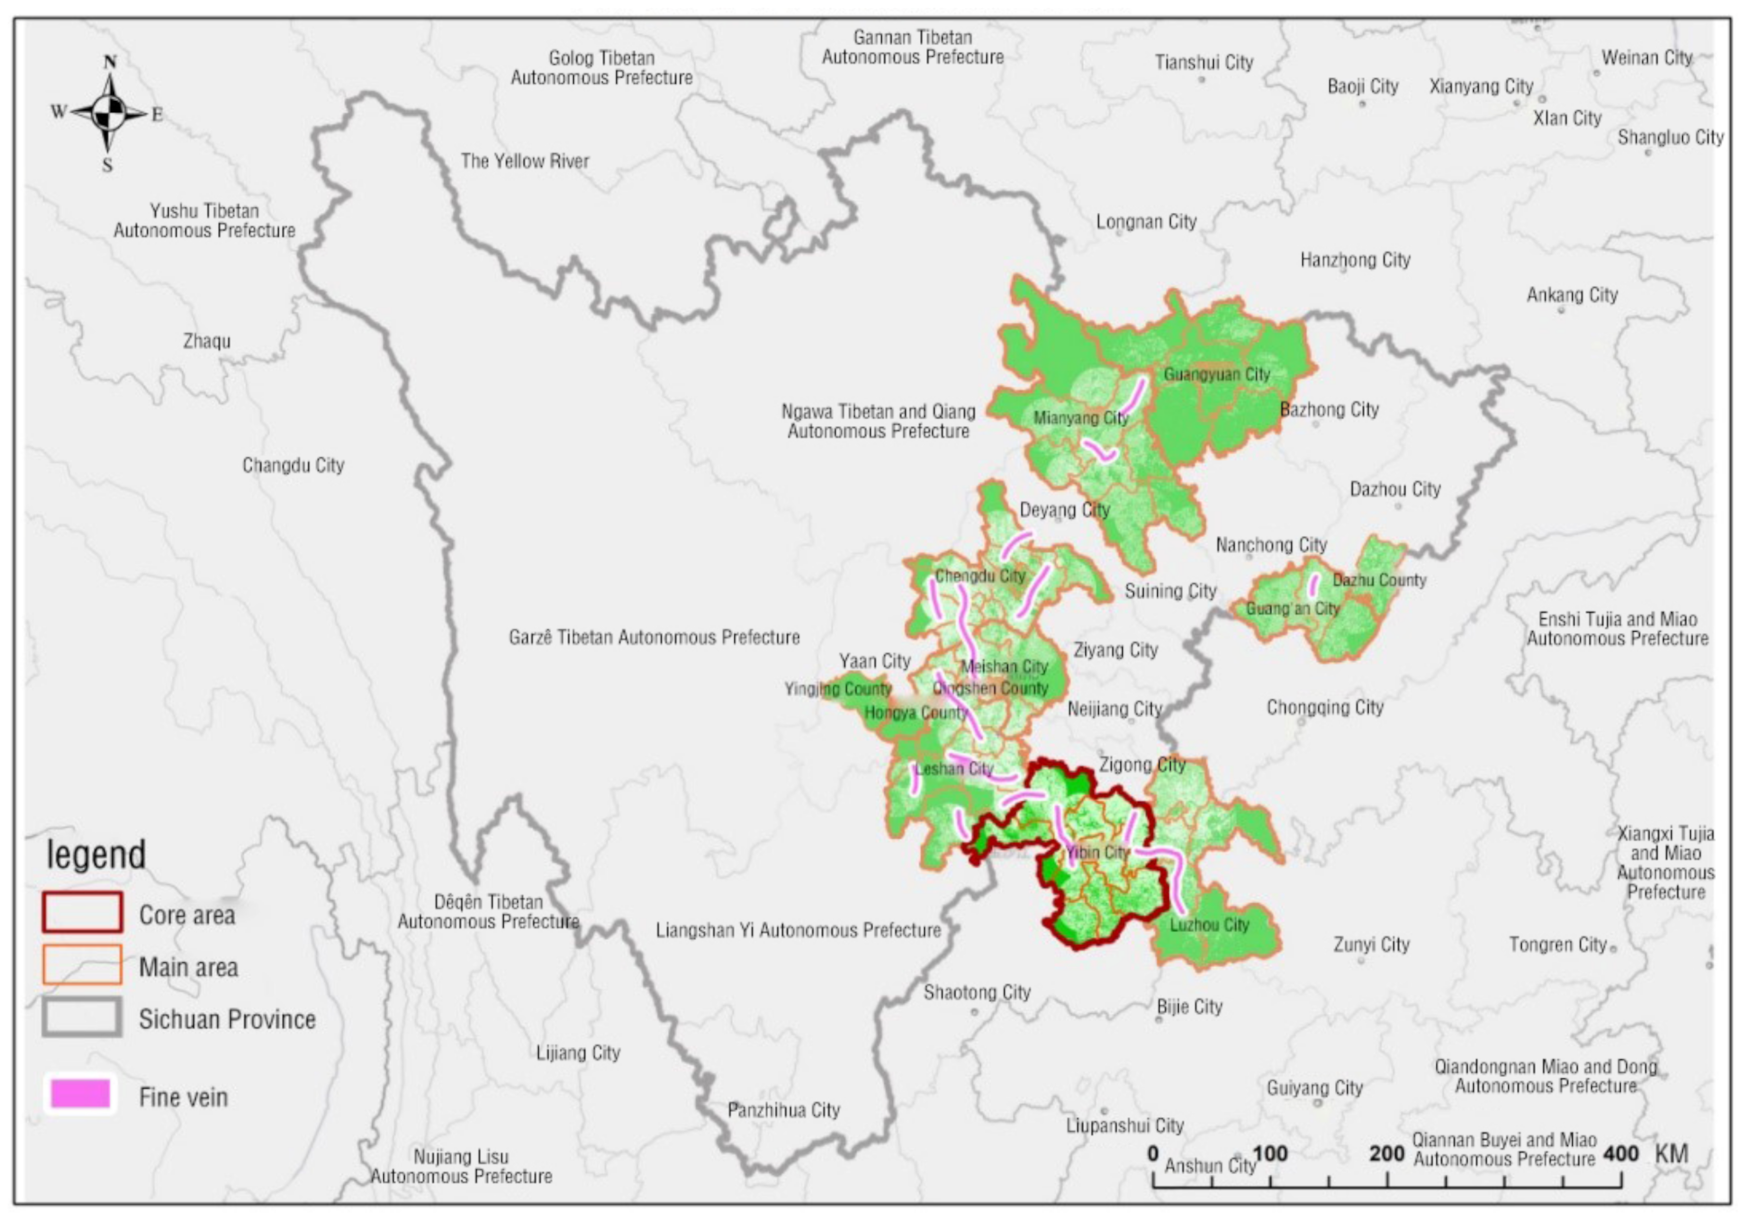
3.3.3. Veins
- (1)
- Main veins’ structure
- (2)
- Branch veins’ structure
- (3)
- Fine veins’ structure
3.4. Results of Organic Construction of the Bamboo Scenic Line
4. Discussion and Conclusions
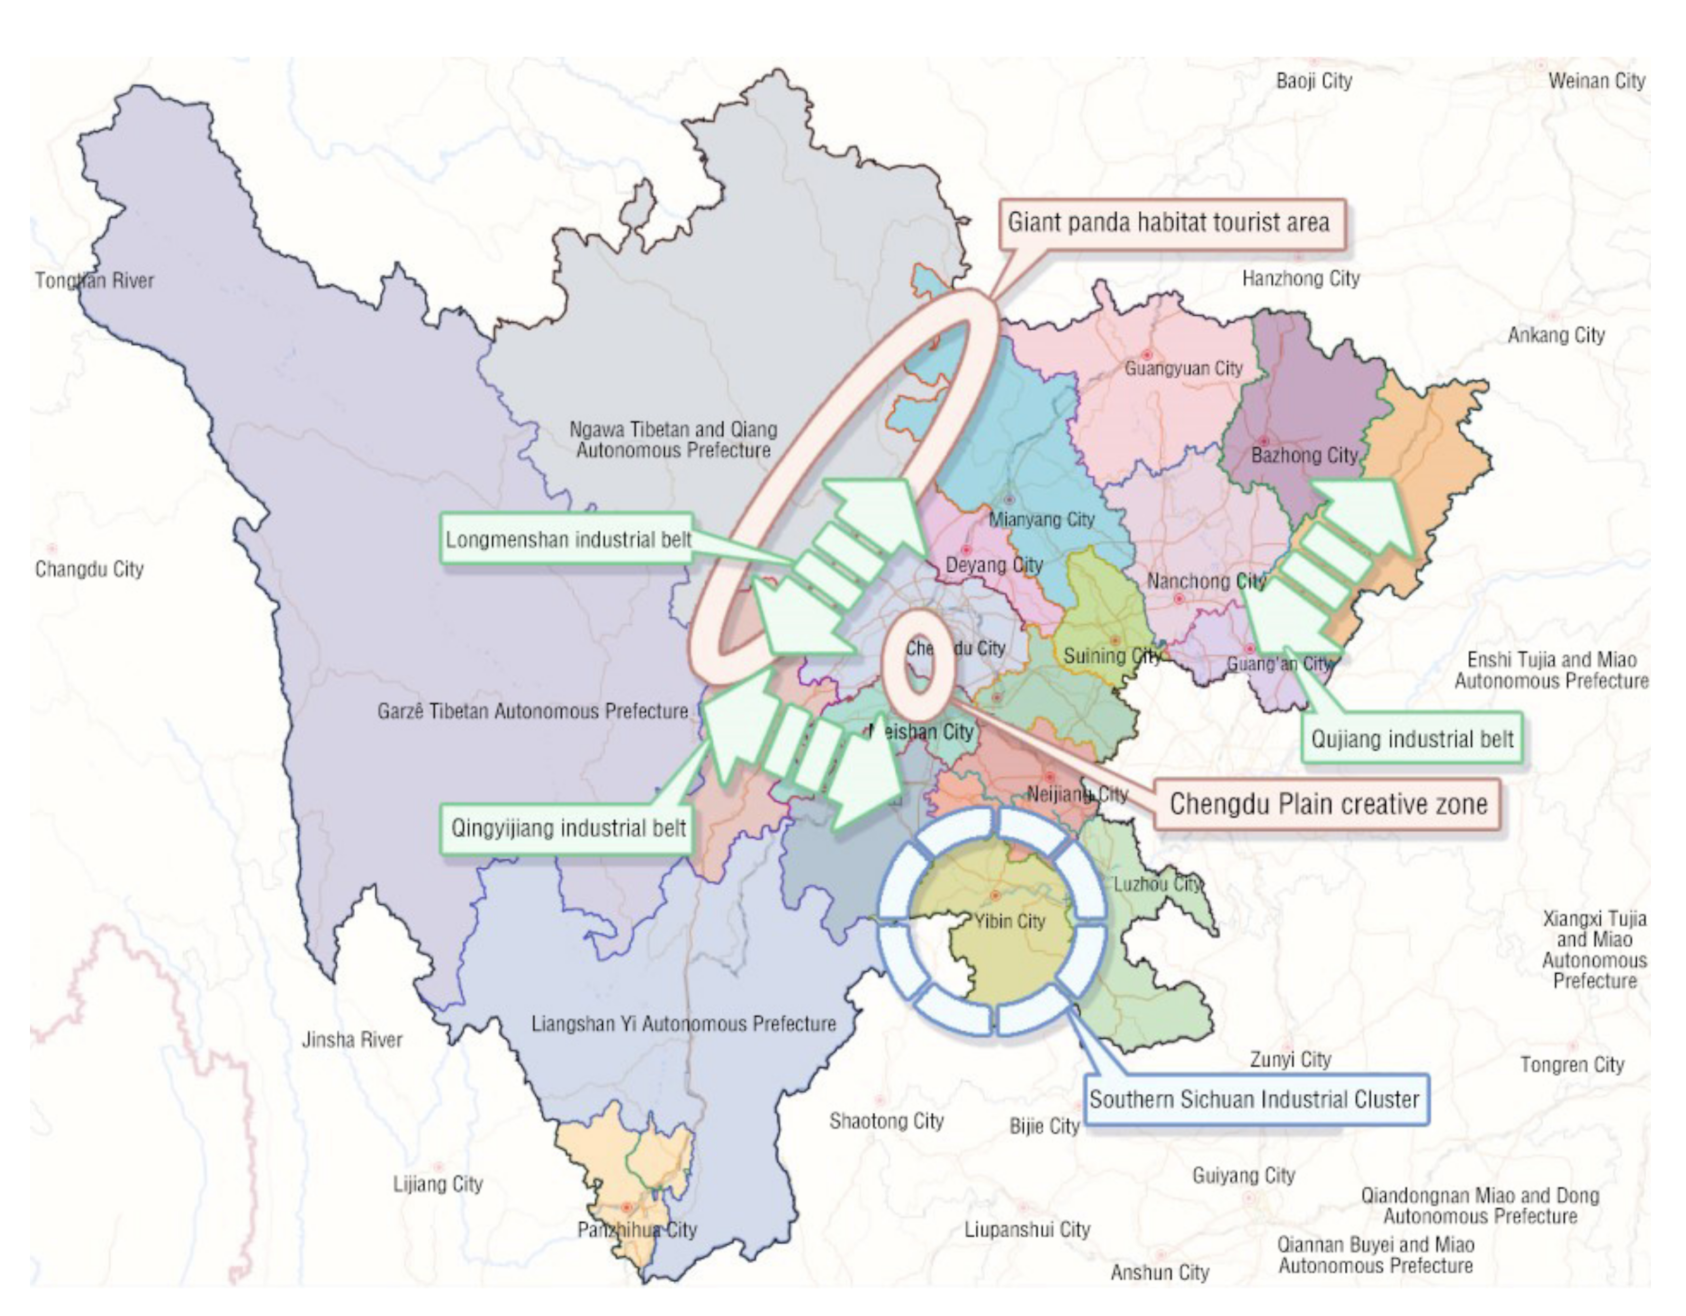
4.1. Comparison with the Existing Provincial Bamboo Scenic Lines Industry Development Planning
4.2. Suitability Evaluation Based on GIS Cost Path Analysis
4.3. Limitations
4.4. Conclusion and Prospect
Author Contributions
Funding
Data Availability Statement
Acknowledgments
Conflicts of Interest
Appendix A

| Research Areas | Tourism and Leisure Type | Modern Agricultural Type | Commercial Logistics Type | Processing and Manufacturing Type | Cultural Creativity Type | Science and Technology Education Type |
|---|---|---|---|---|---|---|
| Yibin City | Shihai Town, Xingwen County, Longhua Town, Pingshan County | Jiangnan Town, Nanxi District, dipeng Town, Jiang’an County | Caiba Town, Cuiping District, Nixi Town, Yibin County | Peishi Town, Nanxi District, Gaochang Town, Yibin County | Lizhuang Town, Cuiping District, Shuanghe Town, Changning County | |
| Dawo Town, Gaoxian County, Tengda Town, Junlian County | Tongzi Town, Jiang’an County, Gongquan Town, Gong county | |||||
| Wangjia Town, Gong county | ||||||
| Chengdu City | Wufeng Town, Jintang County, Xinchang Town, Dayi County | Fuhong Town, Qingbaijiang District | Banzhuyuan Town, Xindu District | Puyang Town, Dujiangyan City, Puxing Town, Xinjin County | Luodai Town, Longquanyi District, Huaiyuan Town, Chongzhou City | Deyuan Town, Pidu District, Lichun Town, Pengzhou City |
| Chaoyanghu Town, Pujiang County | Anren Town, Dayi County | Shibandeng Town, Jianyang City | ||||
| Meishan City | Jiangkou Town, Pengshan District, Hanyang Town, Qingshen County | Wengong Town, Renshou County | Xiuwen Town, Dongpo District, Shigao Town, Renshou County | Zhige Town, Hongya County | ||
| Luzhou City | Yaoba Town, Hejiang County, Shuangsha Town, Gulin County | Fenshuiling Town, Jiangyang District, Daqiao Town, Hejiang County | Shidong Town, Longmatan District | Huangyi Town, Jiangyang District, Dadukou Town, Naxi District | Texing Town, Longmatan District, Jiangmen Town, Xuyong County | Hemian Town, Naxi District, Yunlong Town, Luxian County |
| Taifu town of Luxian County, Longfeng town of Xuyong County | ||||||
| Guang’an City | Feilong Town, Wusheng County | Guantang Town, Qianfeng District, Mingyue Town, Huaying City | Hu’an Town, Qianfeng District, Liemian Town, Wusheng County | Longtai Town, Guang’an District, Happy Town, Huaying City | Yongxing Town, Huaying City | Xiexing Town, Guang’an District |
| Qiaojia Town, Yuechi County, Ganzi Town, Linshui County | Gaotan Town, Linshui County | |||||
| Mianyang City | Xiangyan Town, Pingwu County, Qijiang Town, Santai County | Jiezi Town, Youxian District | Xuzhou Town, Zitong County | Songya Town, Youxian District, Jiepai Town, Anzhou District | Riverside town, Fucheng District, Chenkang Town, Youxian District | Qingyi Town, Fucheng District, Houba Town, Jiangyou City |
| Qinglian town, Jiangyou City, Yuli Town, Beichuan County | ||||||
| Jinji Town, Yanting County | ||||||
| Leshan City | Bagou Town, Qianwei County, Jianban Town, Muchuan County | Fulu Town, Shawan District, huatou Town, Jiajiang County | Fuxi Town, Emeishan City | Jinshan Town, Wutongqiao District, Jianong Town, Shawan District | Suji Town, Shizhong District, Zhuyuan Town, Jingyan County | |
| Heizhugou Town, Ebian Yi Autonomous County | Yanfeng Town, Mabian Yi Autonomous County | |||||
| Guangyuan City | Zengjia Town, Chaotian District, JIANMENGUAN Town, Jiange County | Wulong Town, Cangxi County | Hongyan Town, Zhaohua District, Yuanshan Town, Jiange County | Zhongzi Town, Chaotian District | Guanzhuang Town, Qingchuan County | Pu’an Town, Jiange County, Zhuyuan Town, Qingchuan County |
| Yunfeng Town, Cangxi County | Jiachuan Town, Wangcang County | |||||
| Dazhu County | Wumu Town, Dazhu County | Yangjia Town, Dazhu County |
References
- GB50137-2011; Code for Classification of Urban Land Use and Planning Standards of Development Land. Ministry of Housing and Urban-Rural Development of the People’s Republic of China: Beijing, China, 2012.
- Feng, Y. Spatial Restructure and Society Transformation Investigation and Analytical Study of Evolvement of the Five Small Towns in the Middle Area of China; Tsinghua University: Beijing, China, 2006. [Google Scholar]
- Qi, B. Research and Demonstration of Bamboo Forest Landscape Model Construction; China Science Publishing&Media Ltd.: Beijing, China, 2022. [Google Scholar]
- Fan, S.-M. Sichuan Bamboo Landscape; China Forestry Publishing House: Beijing, China, 2020. [Google Scholar]
- Sichuan Forestry and Grassland Administration. Sichuan 14th Five Bamboo Industry High Quality Development and Bamboo Landscape Line High Quality Construction Planning; 2021. Available online: https://www.sc.gov.cn/10462/c108551/2021/11/11/4e8f08c960dc4851a709455f9686d5af/files/44dcae254c25410caf69cb28f4e11cb6.pdf (accessed on 2 December 2021).
- Saarinen, E. The City. Its Growth. Its Decay. Its Future. J. Aesthet. Art Crit. 1945, 3, 87–88. [Google Scholar]
- Wu, L. Introduction to Sciences of Human Settlements; China Architecture Publishing & Media Co.Ltd.: Beijing, China, 2001. [Google Scholar]
- Zhang, J.-X. A Brief History of Western Urban Planning Thought; Southeast University Press: Nanjing, China, 2005. [Google Scholar]
- Ryan, K.-L.; Flink, C.A. Trails for the Twenty-First Century: Planning, Design, and Management Manual for Multi-Use Trails; Island Press: Washington, DC, USA, 1993. [Google Scholar]
- Bin, Y. The Organic Venation of Urban and Rural Spatial Reconstruction Model Study based on the “Greenway Gene” Transplant; Chongqing University: Chongqing, China, 2013. [Google Scholar]
- Ahern, J. Greenways as a planning strategy. Landsc. Urban Plan. 1995, 33, 131–155. [Google Scholar] [CrossRef]
- Fabos, J.G. Introduction and Overview: The Greenway Movement, Uses and Potentials of Greenways; Elsevier: Amsterdam, The Netherlands, 1995; pp. 1–13. [Google Scholar]
- Fabos, J.G. Greenway planning in the United States: Its origins and recent case studies. Landsc. Urban Plan. 2004, 68, 321–342. [Google Scholar] [CrossRef]
- Von Haaren, C.; Reich, M. The German way to greenways and habitat networks. Landsc. Urban Plan. 2006, 76, 7–22. [Google Scholar] [CrossRef]
- Qu, L.; Fu, B.; Calabrese, L. Beyond the Greenways: A People-Centered Urban Planning and Design Approach for Shenzhen, the’World Factory in Transition. In Proceedings of the 8th Conference of the International Forum Urbanism, Sciforum (MDPI), Incheon, Republic of Korea, 22–24 June 2015. [Google Scholar]
- Force, U.T.; Rogers, R. Towards an Urban Renaissance: Final Report of the Urban Task Force; E & FN Spon: New York, NY, USA, 1999. [Google Scholar]
- Song, X.P.; Tan, Y.T.; Edwards, P.; Richards, D. The economic benefits and costs of trees in urban forest stewardship: A systematic review. Urban For. Urban Green. 2018, 29, 162–170. [Google Scholar] [CrossRef]
- McHarg, I.L. Design with Nature; American Museum of Natural History: New York, NY, USA, 1969. [Google Scholar]
- Steiner, F. Resource suitability: Methods for analyses. Environ. Manag. 1983, 7, 401–420. [Google Scholar] [CrossRef]
- Searns, R.M. The evolution of greenways as an adaptive urban landscape form. Landsc. Urban Plan. 1995, 33, 65–80. [Google Scholar] [CrossRef]
- Miller, W.; Collins, M.G.; Steiner, F.R.; Cook, E. An approach for greenway suitability analysis. Landsc. Urban Plan. 1998, 42, 91–105. [Google Scholar] [CrossRef]
- Zheng, X.; Sun, M.; Chen, Y.; Wang, X. Evaluation of regional ecotourism suitability based on GIS and artificial neural network model: A case study of Zhejiang Province, China. Chin. J. Ecol. 2006, 25, 1435–1441. [Google Scholar]
- Guo, X.; Fan, J.; Zhu, W.; Yan, D. Ecological suitability of olive in Sichuan Province: Fuzzy comprehensive evaluation based on GIS. Chin. J. Ecol. 2010, 29, 586–591. [Google Scholar]
- Wen, Z.; Fan, W. Greenway and its Functions in Urban A reas. Urban Plan. Int. 2000, 3, 40–43. [Google Scholar]
- Tang, Z.; Ye, Y.; Jiang, Z.; Fu, C.; Huang, R.; Yao, D. A data-informed analytical approach to human-scale greenway planning: Integrating multi-sourced urban data with machine learning algorithms. Urban For. Urban Green. 2020, 56, 126871. [Google Scholar] [CrossRef]
- Liu, Y.W.; Li, Z.; Tang, Z.; Zhang, Y.; Ren, P. Greenway network design of Great West River Pilot Area in Changsha City, Hunan Province of South-central China based on suitability analysis and GIS. Chin. J. Ecol. 2012, 31, 426–432. [Google Scholar]
- Teng, M.; Wu, C.; Zhou, Z.; Lord, E.; Zheng, Z. Multipurpose greenway planning for changing cities: A framework integrating priorities and a least-cost path model. Landsc. Urban Plan. 2011, 103, 1–14. [Google Scholar] [CrossRef]
- Conine, A.; Xiang, W.-N.; Young, J.; Whitley, D. Planning for multi-purpose greenways in Concord, North Carolina. Landsc. Urban Plan. 2004, 68, 271–287. [Google Scholar] [CrossRef]
- Dawson, K.J. A comprehensive conservation strategy for Georgia’s greenways. Landsc. Urban Plan. 1995, 33, 27–43. [Google Scholar] [CrossRef]
- Comber, A.; Brunsdon, C.; Green, E. Using a GIS-based network analysis to determine urban greenspace accessibility for different ethnic and religious groups. Landsc. Urban Plan. 2008, 86, 103–114. [Google Scholar] [CrossRef] [Green Version]
- Fumagalli, N.; Colombo, C.; Ferrario, P.S.; Senes, G.; Toccolini, A. Suburban waterfront with ecological and recreational function: Planning based on network analysis. J. Agric. Eng. 2013, 44, 141–152. [Google Scholar] [CrossRef] [Green Version]
- Atkinson, D.M.; Deadman, P.; Dudycha, D.; Traynor, S. Multi-criteria evaluation and least cost path analysis for an arctic all-weather road. Appl. Geogr. 2005, 25, 287–307. [Google Scholar] [CrossRef]
- Snyder, S.A.; Whitmore, J.H.; Schneider, I.E.; Becker, D.R. Ecological criteria, participant preferences and location models: A GIS approach toward ATV trail planning. Appl. Geogr. 2008, 28, 248–258. [Google Scholar] [CrossRef]
- Bloß, L.; Heiland, S.; Hokema, D. A Greenway for Sustainable Mobility. Master’s Thesis, Technische Universität Berlin, Berlin, Germany, 2016. [Google Scholar]
- Giordano, L.d.C.; Riedel, P.S. Multi-criteria spatial decision analysis for demarcation of greenway: A case study of the city of Rio Claro, São Paulo, Brazil. Landsc. Urban Plan. 2008, 84, 301–311. [Google Scholar] [CrossRef]
- Wu, J. Establishment of Vernacular Landscape Corridor in Greenway System: A Case Study of Zengcheng in Guangdong Province. Chin. Landsc. Archit. 2014, 30, 36–39. [Google Scholar]
- Zhou, P.; Wu, X.; Tao, D.; Yan, H. Multi-objectives Green Corridor Planning: The Prairie Silk Road Case. Planners 2014, 30, 121–126. [Google Scholar]
- Yokohari, M.; Amemiya, M.; Amati, M. The history and future directions of greenways in Japanese New Towns. Landsc. Urban Plan. 2006, 76, 210–222. [Google Scholar] [CrossRef]
- Jongman, R.H.; Külvik, M.; Kristiansen, I. European ecological networks and greenways. Landsc. Urban Plan. 2004, 68, 305–319. [Google Scholar] [CrossRef]
- Tan, K.W. A greenway network for Singapore. Landsc. Urban Plan. 2006, 76, 45–66. [Google Scholar] [CrossRef]
- Asakawa, S.; Yoshida, K.; Yabe, K. Perceptions of urban stream corridors within the greenway system of Sapporo, Japan. Landsc. Urban Plan. 2004, 68, 167–182. [Google Scholar] [CrossRef]
- Wen, T. Research on Suitability Evaluation of the GreenWay Route Selection in County Territory—Taking Xingan County of as an Example; Chengdu University of Technology: Chengdu, China, 2018. [Google Scholar]
- Forman, R.T.; Godron, M. Landscape Ecology; John Wiley & Sons: New York, NY, USA, 1986; Volume 4. [Google Scholar]
- Tumer, M.G.; Garner, R.H. Quantitative Methods in Landscape Ecology; Spring: New York, NY, USA, 1991. [Google Scholar]
- Chan, K.M.A.; Shaw, M.R.; Cameron, D.R.; Underwood, E.C.; Daily, G.C. Conservation planning for ecosystem services. PLoS Biol. 2006, 4, e379. [Google Scholar] [CrossRef] [Green Version]
- Termorshuizen, J.W.; Opdam, P.; Van den Brink, A. Incorporating ecological sustainability into landscape planning. Landsc. Urban Plan. 2007, 79, 374–384. [Google Scholar] [CrossRef]
- Grêt-Regamey, A.; Walz, A.; Bebi, P. Valuing ecosystem services for sustainable landscape planning in Alpine regions. Mt. Res. Dev. 2008, 28, 156–165. [Google Scholar] [CrossRef] [Green Version]
- De Groot, R.S.; Alkemade, R.; Braat, L.; Hein, L.; Willemen, L. Challenges in integrating the concept of ecosystem services and values in landscape planning, management and decision making. Ecol. Complex. 2010, 7, 260–272. [Google Scholar] [CrossRef]
- Benedict, M.A.; McMahon, E.T. Green Infrastructure: Linking Landscapes and Communities; Island Press: Washington, DC, USA, 2012. [Google Scholar]
- Gómez-Baggethun, E.; Barton, D.N. Classifying and valuing ecosystem services for urban planning. Ecol. Econ. 2013, 86, 235–245. [Google Scholar] [CrossRef]
- Lant, C.L.; Roberts, R.S. Greenbelts in the Cornbelt: Riparian wetlands, intrinsic values, and market failure. Environ. Plan. A 1990, 22, 1375–1388. [Google Scholar] [CrossRef] [Green Version]
- Mesterton-Gibbons, M. A consistent equation for ecological sensitivity in matrix population analysis. Trends Ecol. Evol. 2000, 15, 115. [Google Scholar] [CrossRef]
- Eggermont, H.; Verschuren, D.; Audenaert, L.; Lens, L.; Russell, J.; Klaassen, G.; Heiri, O. Limnological and ecological sensitivity of Rwenzori mountain lakes to climate warming. Hydrobiologia 2010, 648, 123–142. [Google Scholar] [CrossRef]
- Butt, M.A.; Nisar, K.; Mahmood, S.A.; Sami, J.; Qureshi, J.; Jaffer, G. Toward GIS-based approach for identification of ecological sensitivity areas: Multi-criteria evaluation technique for promotion of tourism in Soon Valley, Pakistan. J. Indian Soc. Remote Sens. 2019, 47, 1527–1536. [Google Scholar] [CrossRef]
- Bai, Y.; Guo, R. The construction of green infrastructure network in the perspectives of ecosystem services and ecological sensitivity: The case of Harbin, China. Glob. Ecol. Conserv. 2021, 27, e01534. [Google Scholar] [CrossRef]
- National Development and Reform Commission of the People’s Republic of China. Guideline for Delineation of Ecological Conservation Redline; 2017. Available online: https://www.mee.gov.cn/gkml/hbb/bgt/201707/W020170728397753220005.pdf (accessed on 8 June 2022).
- Wang, W.Z.; Jiao, J.Y. Qutantitative Evaluation on Factors Influencing Soil Erosion in China. Bull. Soil Water Conserv. 1996, 16, 1–20. [Google Scholar]
- Li, A.; Yue, C.; Meng, Q. Comprehensive Measures of Urbanization Development Quality and Spatial Autocorrelation Features. J. Liupanshui Norm. Univ. 2016, 28, 1–6. [Google Scholar]
- Yuan, Y.; Cheng, Y. Research on Parametric Route Selection in Landscape Environment. Chin. Landsc. Archit. 2015, 31, 36–40. [Google Scholar]
- ESRI. ArcGIS Desktop Help 10.1. Creating the Least Cost Path. 2012. Available online: http://resources.arcgis.com/en/help/main/10.1/index.html#//009z00000021000000 (accessed on 10 April 2016).
- Ministry of Natural Resources of the People’s Republic of China. Guidelines for the Evaluation of the Carrying Capacity of Resources and the Environment and the Suitability of Land and Space Development (for Trial Implementation). 2020. Available online: http://www.gov.cn/zhengce/zhengceku/2020-01/22/5471523/files/7aa9dd04662b49a69bdff41f071e3d85.pdf (accessed on 10 June 2021).
- Zhou, Q. Study on Suitability Evaluation of Route Selection in Rural Industry Greenway. Chin. Landsc. Archit. 2021, 37, 89–94. [Google Scholar]
- The People’s Government of Sichuan Province. Opinions of the Sichuan Provincial Committee of the Communist Party of China and the People’s Government of Sichuan Province on Promoting the High-Quality Development of the Bamboo Industry and Building the Beautiful Rural Bamboo Forest Landscape. 2018. Available online: https://www.sc.gov.cn/10462/10464/10797/2019/1/8/e8c09de8f1d24202859351d6e12275f1.shtml (accessed on 12 June 2021).


| Selection Criteria | Primary Element Layer | Secondary Factor Layer |
|---|---|---|
| Ecological: relying on ecological resources | Ecological base layer | Altitude Slope River system Importance of ecosystem services Ecological sensitivity |
| Landscape: study landscape structure | Landscape pattern layer | Landscape dominance Landscape disturbance degree Landscape fragmentation Landscape separation Landscape vulnerability |
| Orientation: connecting demand subjects | Infrastructure layer | Important connection points Scope of services |
| Particularity: connecting regional industries | Industrial development layer | Primary industry The secondary industry The tertiary industry |
| City or County | Yibin City | Chengdu City | Meishan City | Qingshen County, Meishan City | Hongya County, Meishan City | Luzhou City | Guang’an City | Mianyang City | Leshan City | Guangyuan City | Yingjing County, Ya’an City | Dazhu County, Dazhou City | |
|---|---|---|---|---|---|---|---|---|---|---|---|---|---|
| Regional GDP (100 million yuan) | Primary industry | 277.64 | 612.18 | 199.16 | 10.91 | 19.49 | 216.98 | 204.32 | 302.45 | 242.68 | 153.01 | 12.63 | 60.46 |
| Secondary industry | 1308.92 | 5244.62 | 527.13 | 35.21 | 36.13 | 1021.86 | 410.98 | 1151.34 | 801.88 | 389.68 | 24.17 | 143.17 | |
| Tertiary industry | 1015.33 | 11155.85 | 653.91 | 40.99 | 70.24 | 842.42 | 635.14 | 1402.41 | 818.75 | 399.16 | 37.76 | 167.28 | |
| Primary Elements | Weight | Secondary Factors | Weight | Gradation | GIS Assignment |
|---|---|---|---|---|---|
| Ecological base layer | 0.39 | Importance of ecosystem services | 0.208 | 0–0.098 | 9 |
| 0.098–0.157 | 7 | ||||
| 0.157–0.220 | 5 | ||||
| 0.220–0.300 | 3 | ||||
| 0.300–0.757 | 1 | ||||
| Ecological sensitivity | 0.127 | 0.560–0.984 | 9 | ||
| 0.436–0.560 | 7 | ||||
| 0.336–0.436 | 5 | ||||
| 0.239–0.336 | 3 | ||||
| 0–0.239 | 1 | ||||
| River system | 0.01 | Buffer zone beyond 25 km | 9 | ||
| 10 km buffer zone | 7 | ||||
| 5 km buffer zone | 5 | ||||
| 3 km buffer zone | 3 | ||||
| 1.5 km buffer zone | 1 | ||||
| Slope | 0.02 | >25 degrees | 9 | ||
| 15–25 degrees | 7 | ||||
| 5–15 degrees | 5 | ||||
| 3–5 degrees | 3 | ||||
| <3 degrees | 1 | ||||
| Altitude | 0.025 | 2689–7845 | 9 | ||
| 1775–2689 | 7 | ||||
| 1125–1775 | 5 | ||||
| 659–1125 | 3 | ||||
| 82–659 | 1 | ||||
| Landscape pattern layer | 0.12 | Landscape fragmentation | 0.011 | 0.000000972–0.000001396 | 9 |
| 0.000000591–0.000000972 | 7 | ||||
| 0.000000306–0.000000591 | 5 | ||||
| 0.000000102–0.000000306 | 3 | ||||
| 0.000000027–0.000000102 | 1 | ||||
| Landscape separation | 0.013 | 0.000860776–0.000923264 | 9 | ||
| 0.000505579–0.000860776 | 7 | ||||
| 0.000344425–0.000505579 | 5 | ||||
| 0.000179982–0.000344425 | 3 | ||||
| 0.000084605–0.000179982 | 1 | ||||
| Landscape vulnerability | 0.02 | 0.21 | 1 | ||
| Landscape dominance | 0.055 | 0–0.236 | 9 | ||
| 0.236–0.306 | 7 | ||||
| 0.306–0.367 | 5 | ||||
| 0.367–0.404 | 3 | ||||
| 0.404–0.479 | 1 | ||||
| Landscape disturbance degree | 0.021 | 0.081–0.096 | 9 | ||
| 0.073–0.081 | 7 | ||||
| 0.061– 0.073 | 5 | ||||
| 0.047–0.061 | 3 | ||||
| 0–0.047 | 1 | ||||
| Infrastructure layer | 0.21 | Important connection points | 0.131 | 0 –0.00033497 | 9 |
| 0.00033497–0.000733314 | 7 | ||||
| 0.000733314–0.001185976 | 5 | ||||
| 0.001185976–0.001674852 | 3 | ||||
| 0.001674852–0.00230858 | 1 | ||||
| Scope of services | 0.079 | Buffer zone beyond 25 km | 9 | ||
| 10 km buffer zone | 7 | ||||
| 5 km buffer zone | 5 | ||||
| 3 km buffer zone | 3 | ||||
| 1.5 km buffer zone | 1 | ||||
| Industrial development layer | 0.28 | Primary industry | 0.076 | 10.91–60.45 | 9 |
| 60.45–153.01 | 7 | ||||
| 153.01–204.32 | 5 | ||||
| 204.32–302.45 | 3 | ||||
| 302.45–612.18 | 1 | ||||
| Secondary industry | 0.12 | 24.17–143.16 | 9 | ||
| 143.16–527.13 | 7 | ||||
| 527.13–801.88 | 5 | ||||
| 801.88–1308.92 | 3 | ||||
| 1308.92–5244.62 | 1 | ||||
| Tertiary industry | 0.084 | 37.76–399.16 | 9 | ||
| 399.16–653.91 | 7 | ||||
| 653.91–1015.33 | 5 | ||||
| 1015.33–1402.41 | 3 | ||||
| 1402.41–11,155.85 | 1 |
Publisher’s Note: MDPI stays neutral with regard to jurisdictional claims in published maps and institutional affiliations. |
© 2022 by the authors. Licensee MDPI, Basel, Switzerland. This article is an open access article distributed under the terms and conditions of the Creative Commons Attribution (CC BY) license (https://creativecommons.org/licenses/by/4.0/).
Share and Cite
Zhu, Z.; Wu, L.; Jiang, W.; Wang, W.; Chen, Q. Research on the Establishment of Provincial Characteristic Scenic Lines Based on GIS. Land 2022, 11, 1998. https://doi.org/10.3390/land11111998
Zhu Z, Wu L, Jiang W, Wang W, Chen Q. Research on the Establishment of Provincial Characteristic Scenic Lines Based on GIS. Land. 2022; 11(11):1998. https://doi.org/10.3390/land11111998
Chicago/Turabian StyleZhu, Zhixian, Linjia Wu, Wenyuan Jiang, Weijue Wang, and Qibing Chen. 2022. "Research on the Establishment of Provincial Characteristic Scenic Lines Based on GIS" Land 11, no. 11: 1998. https://doi.org/10.3390/land11111998