Article

Has China’s Pilot Policy of Water Ecological Civilization City Construction Reduced Water Pollution Intensity?

1
School of Economics and Trade, Nanchang Institute of Technology, Nanchang 330099, China
2
Business Administration School, Nanchang Institute of Technology, Nanchang 330099, China
3
Department of Economics, Western Michigan University, Kalamazoo, MI 49008-5330, USA
*
Author to whom correspondence should be addressed.
Land 2022, 11(11), 1999; https://doi.org/10.3390/land11111999
Submission received: 14 October 2022 / Revised: 2 November 2022 / Accepted: 5 November 2022 / Published: 8 November 2022
(This article belongs to the Special Issue Water Resources and Land Use Planning)

Abstract

:
To address the deterioration of the water ecological environment, China’s Ministry of Water Resources launched 105 pilot projects for the construction of water ecological civilized cities in two batches in 2013 and 2014. Based on panel data of 283 cities in China from 2008 to 2020, in this study, we investigate the impact of the pilot policy of water ecological civilization city construction on water pollution intensity using the difference-in-differences method. We found that water pollution intensity in the sample period exhibited a downward trend, decreasing most rapidly during the pilot construction period. Controlling for urbanization level, technological innovation, import and export trade, and foreign investment, our study results show that the pilot policy significantly reduced water pollution intensity. Mechanism analysis shows that the reduction effect was achieved through the channels of optimizing industrial structure, increasing sewage treatment, promoting water recycling, promoting technological progress, and speeding up water price reform. The results of this study also show that the policy effect in terms of reducing water pollution intensity is heterogenous across time, in addition to exhibiting regional heterogeneity owing to differences in levels of economic development, water resource endowment, and environmental regulation intensity. The research results also provide a reference for other countries similar to China to reduce water pollution intensity, address the deterioration of the water ecological environment, and improve the water ecological environment in the process of economic development.

1. Introduction

China’s reform and opening up has led to remarkably rapid economic growth but has also caused deterioration of the water ecological environment [1,2]. In 2020, among the 10,171 groundwater quality monitoring sites in the natural resources department, 86.4% were classified as IV–V. Among the 10,242 groundwater quality monitoring sites (mainly shallow groundwater) in the water resources department, 77.3% were classified as IV–V, with generally poor water quality (data source: Bulletin on China’s Ecological Environment) [1]. In order to curb and reverse the deterioration trend of the water ecological environment from the source, in 2013, the Ministry of Water Resources successively issued several notices and opinions aiming to accelerate the construction of water ecological civilization and to implement a national pilot project of water ecological civilization. Under a pilot policy initiative by the Ministry of Water resources, the construction of 105 water ecological civilization cities was launched in two batches to explore different types of water ecological civilization construction modes and experiences. The Ministry had completed the acceptance and performance assessment of almost all pilot cities in 2018. Because water ecological environment deterioration is manifested by serious water pollution, it is worth studying whether the pilot project of water ecological civilization city construction has significantly reduced water pollution and improved the water ecological environment. In this paper, we investigate the impact of the pilot policy of water ecological civilization city construction on water pollution intensity from 2008 to 2020, with the purpose of using insights gained from the study to help improve the quality of the water ecological environment, promote its sustainable development, and contribute to the harmonious coexistence between man and water.
In the literature, various studies have addressed water pollution characteristics, industry distribution, and spatial layout evolution [2,3,4,5,6,7,8]; provided policy suggestions and treatment effect evaluation of water pollution prevention and control; and investigated the factors influencing water pollution [9,10,11,12,13,14,15,16,17,18]. Most closely related to the subject of this paper are studies on the factors affecting water pollution. Scholars have analyzed this issue on the macro and micro levels. The macro perspective holds that a country’s economic factors (economic growth, industrial structure, industrial agglomeration, FDI, infrastructure construction, urbanization, industrialization, and import and export trade), population factors (population density and population scale) [19,20,21,22,23], environmental factors (ecological compensation, environmental regulation, and water resource endowment) [24,25,26,27], government-level factors (government supervision, collusion between local governments and enterprises, and number of administrative units) [28,29,30], and technical factors have impacts on water pollution [31,32,33]. Most of these macro studies found that (1) economic growth and urbanization are affected by their respective development stages, and there is a nonlinear relationship with water pollution, mainly manifested by a Kuznets curve or threshold effect; (2) industrial structure, industrial agglomeration, ecological compensation, environmental regulation, technological progress, government supervision, the number of administrative units, and other factors help to reduce water pollution emission intensity and reduce water pollution, although the impact is heterogeneous across regions; (3) infrastructure construction, FDI, industrialization, import and export trade, population size, and collusion between local governments and enterprises exacerbate water pollution; (4) and no consensus has been established regarding the impact of population density and water resource endowment on water pollution.
At the micro level, researchers have examined and identified several factors affecting water pollution, including farmers’ willingness to participate, the scale of industrial enterprises, the agglomeration of manufacturing enterprises, enterprise investment in environmental protection, stakeholders, etc. [34,35,36]. Such studies have revealed that there is a positive spatial coupling effect between the scale of industrial enterprises, the agglomeration of manufacturing enterprises, and the degree of water pollution and that the attributes of industry and enterprise types affecting water pollution are heterogeneously distributed [37,38,39].
The above literature provides rich and profound insights that contribute to the understanding of the factors influencing water pollution, laying a solid foundation for the present study. However, scholars have mainly studied the impact of the “Two Control Zones” policy, the “Ten-Point Water Plan”, and the capacity expansion policy in the Yangtze River Delta on water pollution [40,41,42], and none have investigated the impact of the water ecological civilization city construction pilot policy on water pollution, although such a pilot policy provides quasi-natural experimental data that can be used to study the impact of policy on water pollution. In this context, our study contributes to the literature in the following ways: (1) This is the first study on the impact of the water ecological civilization city construction pilot policy on water pollution intensity using the difference-in- differences method and the panel data of 283 cities from 2008 to 2020. (2) The baseline results are verified rigorously by a series of robustness tests, including remeasurement of dependent variables, exclusion of extreme values, consideration of other policies, the use of a placebo test method, the propensity score matching difference-in-differences method (PSM-DID method), the inclusion of additional control variables, consideration of spatial correlation, etc. (3) In this study, we explore the internal mechanism (channels) through which the pilot policy affects water pollution intensity. (4) We further explore the temporal and spatial heterogeneity of the impact of the pilot policy on water pollution intensity.
The remainder of the paper is structured as follows. In Section 2, we discuss our Research Hypotheses. In Section 3, we discuss the Material and Methods. In Section 4, we present a comprehensive analysis of the impact of the water ecological civilization city construction pilot policy on water pollution intensity. Finally, in Section 5, we summarize the results and draw conclusions.

2. Research Hypotheses

2.1. Primary Hypothesis

On 4 January 2013, The Ministry of Water Resources issued a policy statement, “The Opinions on accelerating the construction of water ecological civilization”, resolving to carry out a pilot project of water ecological civilization construction. The policy initiative encompassed the implementation of a strict water resource management system, optimization of water resource allocation, strengthening of water conservation management, strict water resource protection, promotion of water ecosystem protection and restoration, strengthening of ecological protection in water conservancy construction, an improvement in guarantee and support capacity, and extensive public promotion and education. Subsequently, in March 2013, the Ministry of Water Resources issued a notice to “carry out the pilot work of national water ecological civilization construction”, officially starting the pilot work of water ecological civilization construction, and 46 cities, including Jinan, Nanchang, Changsha, and Yangzhou, were approved as pilot cities for water ecological civilization construction. Local governments are required to strictly check and verify the sewage carrying capacity of water areas, formulate opinions on limiting the total amount of sewage discharge, and take the total amount of sewage discharge as an important basis for water pollution prevention and emission reduction. Specifically, local governments are mandated to strengthen the protection of water resources and water pollution prevention and control, strictly supervise and manage the sewage outlets into rivers and lakes, control the total amount of sewage discharge into rivers, and restrict the approval of new water intake and sewage outlets into rivers and lakes in areas where the sewage discharge exceeds the total discharge limit in the water outlet functional area. In July 2013, the Ministry of Water Resources issued a notice to “accelerate the pilot work of water ecological civilization city construction”. The notice stressed that the pilot cities need to implement the strictest water resource management systems; promote the optimal allocation, rational development, efficient utilization, and conservation protection of water resources; and establish water-saving and pollution prevention societies. In 2014, in order to further promote the construction of water ecological civilization, the Ministry of Water Resources expanded the pilot scope of water ecological civilization city construction, adding 59 cities, including Wuhan, Chengde, and Nantong, as pilot cities. By 2017, more than USD 114 billion had been invested in the construction of water ecological civilization cities. In 2020, on the basis of the implementation of the water pollution prevention and control action plan, the implementation of land and water integration, joint prevention and control, and joint basin governance, the two batches of pilot cities successfully completed various construction tasks and passed the acceptance; explored the construction mode and experience under different development levels, different water resource conditions, and different water ecological conditions; and significantly improved the urban water ecological environment.
In light of the above forceful policy notices and mandates, in this paper, we propose Hypothesis 1: the pilot policy of water ecological civilization city construction (hereafter referred as the pilot policy) helps to reduce the intensity of water pollution.

2.2. Mechanism Hypothesis

According to the existing literature, there are many macro factors affecting water pollution intensity, including economy, population, environment, technology, etc. Combining these factors with the pilot policy of water ecological civilization city construction, we hypothesized that the policy mainly affects water pollution intensity through the pathways (channels) of industrial structure, sewage treatment, water recycling, technological progress, and water pricing reform.
First, the construction of water ecological civilization cities helps to optimize the industrial structure and reduce the water pollution intensity. Previous studies have shown that environmental regulation policies are conducive to the green transformation of industrial structure, thereby reducing environmental pollution intensity [43,44]. As an important environmental governance policy, the construction of water ecological civilization cities can encourage local governments to consider water pollution governance and promote urban economic transformation in an environmentally friendly direction, thereby providing an impetus for the green upgrading of industrial structures. The pilot cities of water ecological civilization construction will implement more stringent water resource management systems and strengthen the water resource constraints faced by industrial development; on the one hand, this can reduce the dependence of pilot cities on water-pollution-intensive industries by reducing the proportion of high-water-consumption and high-pollution industries and increasing the proportion of low-water-consumption and low-pollution industries. On the other hand, it can promote the green transformation of related industries and reduce water pollution intensity by improving the green utilization efficiency of water resources. Moreover, pilot cities of water ecological civilization construction will focus attention to the construction of water culture and the inheritance of water civilization, integrate the concept of ecological civilization into daily life, encourage enterprises to supply more high-quality water-saving and emission-reduction products, promote the green upgrading of related industries, and reduce the intensity of water pollution.
Second, the construction of water ecological civilization cities helps to strengthen sewage treatment and reduce water pollution intensity. Previous studies have shown that environmental regulation policies are conducive to improving the enthusiasm of local governments with respect to environmental governance, thereby reducing the environmental pollution intensity. As an important environmental governance policy, the construction of water ecological civilization cities can encourage local governments pay more attention to the quality of the water environment and implement whole-chain governance of source emission reduction, process blocking, and end regulation [45,46]. Furthermore, the construction of water ecological civilization cities can encourage local governments to actively establish an investment mechanism with government guidance, market promotion, diversified investment, and social participation; increase investment in industrial wastewater and domestic sewage treatment facilities; and improve the treatment capacity of wastewater treatment facilities. As a result, the standard achievement rate of domestic sewage and industrial sewage discharge in the first batch of pilot cities increased from 81.5% and 94.1% before the pilot initiative to 93.5% and 99.0%, respectively (data source: China City Statistical Yearbook and China Statistical Yearbook (County-Level)) [47,48]. It appears that the pilot policy strengthens sewage treatment and is conducive to reducing water pollution intensity.
Moreover, the construction of water ecological civilization cities helps to promote water recycling and reduce water pollution intensity. Previous studies have shown that environmental regulation policies encourage local governments to accelerate the development of the green economy and the circular economy, thereby reducing environmental pollution intensity [49,50]. As an important environmental governance policy, the construction of water ecological civilization cities can encourage local governments to pay more attention to the establishment of a high-level water resource recycling system, the reuse of sewage treatment, seawater desalination and direct utilization, the utilization of rainwater and brackish water, etc., thus urging local governments to focus on the construction of repeated water use projects and improve the recycling rate of industrial water and other water resources. As a result, the reuse rate of industrial water in the first batch of pilot cities increased by 11.6% compared with that before pilot city designation (data source: China City Statistical Yearbook) [47]. Therefore, the pilot policy promotes water recycling, which is conducive to reducing water pollution intensity.
In addition, the construction of water ecological civilization cities helps to promote technological progress and reduce water pollution intensity. Previous studies have shown that environmental regulation policies are conducive to improving green technology innovation ability, thereby reducing the environmental pollution intensity [51,52]. As an important environmental governance policy, the construction of water ecological civilization cities has improved water-saving evaluation standards and sewage discharge standards; encouraged the pilot cities to vigorously promote efficient water-saving irrigation technologies, such as pipeline water delivery, sprinkler irrigation, and micro irrigation; and increased attention on research, development, popularization, and application of water ecological protection and restoration technology. Furthermore, the pilot policy encourages enterprises to accelerate the research and development of green innovative technologies, such as water saving, emission reduction, and cleaner production, so as to reduce the intensity of water pollution. Among the first batch of 41 pilot cities, the average effective utilization coefficient of farmland irrigation water was 0.581—higher than the national level of 0.542. The average water consumption of USD 10,000 industrial value added in this batch of pilot cities was 229.5612 cubic meters, which was far lower than the national average of 356.4950 cubic meters (data source: China City Statistical Yearbook and China Statistical Yearbook (County-Level)) [47,48]. The water consumption of USD 10,000 industrial value added in 31 cities decreased to below the national average compared with that before pilot city designation. Therefore, the pilot policy is conducive to technological progress, such as water-saving irrigation, improves water use efficiency, reduces unit water pollution discharge, and reduces water pollution intensity.
Finally, the construction of water ecological civilization cities helps to promote water pricing reform and reduce water pollution intensity. Previous studies have shown that environmental regulation policies can affect environmental pollution intensity by acting on the prices of energy and resources [53,54]. As an important environmental governance policy, the construction of water ecological civilization cities can encourage local governments to pay more attention to the compensated use of water resources, the formation mechanism of water prices, and the improvement of water-saving fiscal and tax policies. Moreover, the construction of water ecological civilization cities can encourage the trading of water rights, the use economic means to promote the conservation and protection of water resources, and exploration and establishment of a long-term water ecological compensation mechanism for water ecological co-construction and benefit sharing with key functional areas as the core. Furthermore, the construction of water ecological civilization cities can actively promote the differentiated water resource fee collection policy to fully reflect the value attributes of water resources. Therefore, the pilot policy has further advanced water pricing reform. On the one hand, it helps to save water, improve water efficiency, and reduce water pollution intensity. On the one hand, it helps to protect water resources and reduce water pollution intensity by increasing the water use cost and pollution cost of high-water-consumption and high-pollution industries.
Based on the above mechanism analysis, in this paper, we propose Hypothesis 2: the pilot policy of water ecological civilization city construction reduces water pollution intensity by optimizing industrial structure, increasing sewage treatment, promoting water recycling, promoting technological progress, and accelerating water pricing reform.

3. Material and Methods

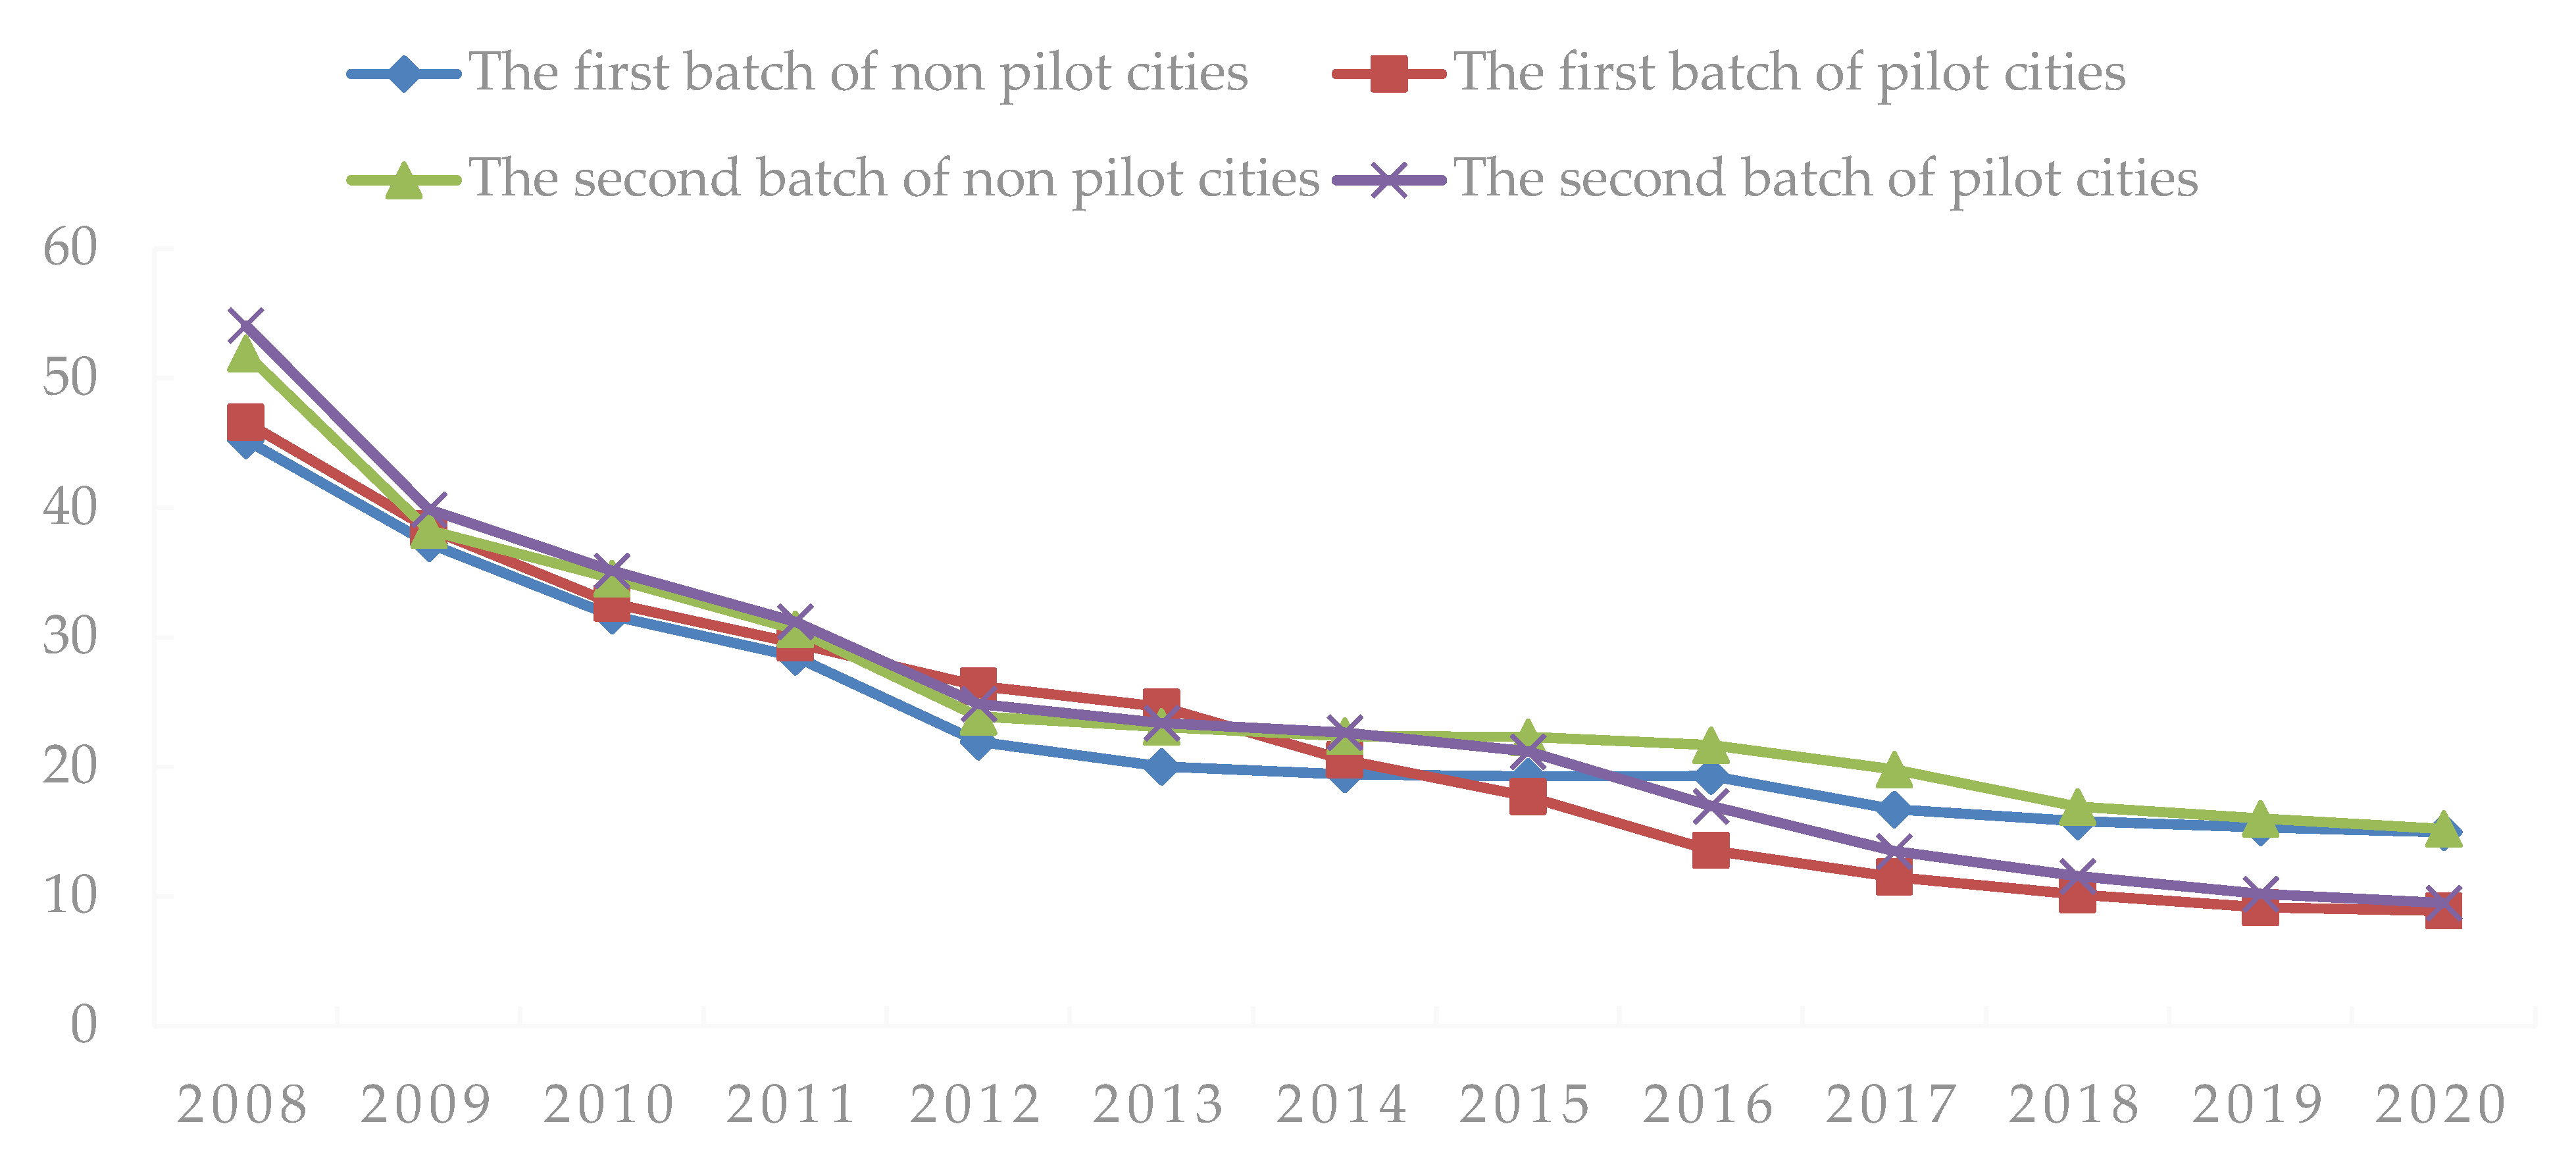
3.1. Characteristics and Facts of Water Pollution Intensity

From 2013 to 2014, the Ministry of Water Resources identified 105 cities with good basic conditions, strong representativeness, and typicality to carry out the pilot construction of water ecological civilization cities in two batches. In order to describe the water pollution intensity of the above pilot cities, we divided the research period for the first batch of 46 pilot cities into three stages: before pilot construction (2008–2013), during pilot construction (2014–2016), and after pilot completion (2017–2020). Similarly, the research period of the second batch of 59 pilot cities was divided into three stages: before pilot construction (2008–2014), during pilot construction (2015–2017), and after pilot completion (2018–2020), as shown in Table 1.
Water pollution mainly originates from industrial wastewater, domestic sewage, and agricultural non-point-source pollution. In view of data availability, in this study, we measure the intensity of water pollution by industrial wastewater discharge/gross domestic product (GDP). The original data are from the China Environmental Yearbook, the China City Statistical Yearbook, and the China Statistical Yearbook (County-Level), as well as several statistical yearbooks and water resource bulletins of provinces and cities. As shown in Table 1, for the first batch of pilot cities, the water pollution intensity before the pilot construction was high, with an average of 33.0072 tons per USD 10,000. During the pilot construction period, the average water pollution intensity decreased considerably to 17.2657 tons per USD 10,000. After the pilot, the average water pollution intensity further decreased to 9.9199 tons per USD 10,000. The water pollution intensity showed a steady downward trend during the sample period. The second batch of pilot cities showed the same pattern of continuous decline in water pollution intensity, with average water pollution intensities in the three stages of 33.0239 tons per USD 10,000, 17.2156 tons per USD 10,000, and 10.4199 tons per USD 10,000, respectively. Calculation of the decline rate of water pollution intensity in the three stages shows that before the pilot construction, the water pollution intensity of the first batch and second batch of pilot cities decreased by 7.8641% and 8.3030%, respectively. During the pilot construction period and after the pilot, the water pollution intensity decreased by 11.3322% and 12.1158% and by 5.6434% and 5.9641%, respectively. Therefore, in terms of the decline rate, the water pollution intensity of both batches of pilot cities decreased most rapidly during the pilot construction period, which was not only much higher than that after the pilot but also higher than that before the pilot construction. This preliminary comparison shows that the pilot policy of water ecological civilization city construction has played a clear role in reducing water pollution intensity. In addition, 19 first-batch pilot cities (41.30%), such as Xingtai, Dandong, Hefei, Xi’an, Xianning, Ezhou, Xinyu, Qingdao, Zhengzhou, and Luoyang, and 22 second-batch pilot cities (37.29%), such as Chengde, Baicheng, Nantong, Jiaxing, and Pingxiang, achieved an above-average decline in water pollution intensity during the pilot construction period, whereas 27 first-batch pilot cities (58.70%), such as Nanchang, Changsha, Guangzhou, Ningbo, and Chengdu, and 37 second-batch pilot cities (62.71%), such as Wuhan, Wenzhou, Yancheng, Guiyang, and Yulin, showed a lower than average decline in water pollution intensity. This suggests that the pilot policy of water ecological civilization city construction has a possible heterogeneous impact on water pollution intensity in different cities.
To verify the above preliminary findings, we compared the water pollution intensity between pilot cities and non-pilot cities of two batches from 2008 to 2020, as shown in Figure 1. On the whole, before the pilot construction, the two batches of pilot cities and non-pilot cities show basically the same trend of water pollution intensity, with the non-pilot cities exhibiting a slightly lower water pollution intensity than the pilot cities. After the implementation of the pilot construction policy, the trend of water pollution intensity between the two batches of pilot cities and non-pilot cities diverges, showing a slight decline in water pollution intensity in non-pilot cities and a substantial decline in water pollution intensity in pilot cities, with water pollution intensity in non-pilot cities significantly higher than that in pilot cities. This provides a strong evidence that the pilot policy of water ecological civilization city construction may help to reduce the intensity of water pollution.

3.2. Model Construction and Data Description

3.2.1. Model Construction

Based on the existing literature on the factors impacting water pollution intensity [55,56,57,58,59], we used the panel difference-in-differences method for empirical study and incorporated various control variables, along with individual and time fixed effects to control for city heterogeneity. In this paper, the cities that have implemented the pilot policy of water ecological civilization construction are regarded as the treatment group, and the cities that have not implemented the pilot policy of water ecological civilization construction are regarded as the control group. The specific model construction is as follows:
W p i t = C + β 0 W s i × T m t + λ X i t + u i + φ t + ε i t
where i and t represent city i and year t, respectively; Wp is the water pollution intensity; Ws is the dummy variable, equaling 1 if the city is selected as a pilot city for water ecological civilization construction and 0 otherwise; Tm is a dummy variable with a value of 0 before the pilot construction and 1 otherwise; X is a vector of control variables; and u and φ represent individual and time fixed effects, respectively. The most concerned (focused) coefficient in this paper is β0, which indicates whether the urban water pollution intensity changes (decreases) following the implementation of the pilot project of water ecological civilization construction. That is, when β0 is significantly negative, it provides evidence that the pilot policy of water ecological civilization urban construction reduces water pollution intensity.

3.2.2. Variable Measurement and Data Description

According to the existing literature, in this study, we specified the following control variables as the factors affecting water pollution intensity: urbanization level (Ur), technological innovation (Js), import and export trade (Jc), and foreign capital (Fo), which are measured by the urban resident population/total resident population in the region, science and technology expenditure (USD 100 million), import and export trade volume/GDP, and the amount of actually utilized foreign capital (USD 100 million), respectively. To attenuate possible problems of collinearity and heteroscedasticity so as to make the regression results more reliable, the non-proportional variables were smoothed by logarithmic transformations. The sample comprises 283 cities over the period from 2008 to 2020, with data obtained and compiled from the China City Statistical Yearbook, the China Environmental Yearbook, the China Statistical Yearbook (County-Level), and provincial and municipal statistical yearbooks and water resources bulletins. A few missing values in the data were estimated and filled by the moving weighted average method. The descriptive statistics are presented in Table 2.

4. Results

4.1. Estimation Results

The panel difference-in-differences estimation results are shown in Table 3. Model 1 represents the estimation results without fixed effects and control variables. Model 2 includes fixed effects but without control variables. Model 3 excludes fixed effects but includes control variables, and the full-fledged Model 4 includes fixed effects and control variables. The estimation results of the four models all show that the coefficients of Ws×Tm are negative and statistically significant, indicating that water pollution intensity of the pilot cities has decreased significantly compared with the non-pilot cities. That is, regardless of the inclusion of fixed effects and control variables, the pilot policy of water ecological civilization city construction is conducive to reducing water pollution intensity and improving water quality. Model 4 shows that when the fixed effects and control variables are included, the goodness of fit is significantly increased, and the estimation results are more reliable. It can be concluded that the implementation of the pilot policy of water ecological civilization city construction has reduced water pollution intensity by 0.1241, which confirms Hypothesis 1. Model 4 also shows that technological innovation is conducive to reducing the water pollution intensity and improving water quality, and the urbanization level, import and export trade, and foreign capital are not conducive to reducing the water pollution intensity and deteriorating water quality. Moreover, the regression results of the impact of technological innovation, import and export trade, and foreign capital on water pollution intensity are similar to those reported Yu and Fang et al. on the impact factors of environmental pollution [19,30]. The regression results of the impact of urbanization level on water pollution intensity are similar to those reported by Darko et al., Kan et al. and Margaret et al. on the relationship between urbanization and ecological environment, who found that the effects of urbanization, such as population upsurge, increased industrialization, urban agriculture, and rural–urban migration of persons, exert pressure on the limited water resources in most cities; the urbanization process not only intensifies the emission of water environmental pollution but also improves the water pollution intensity [60,61,62], although these results are inconsistent with the those reported by Al-Mulali et al., Irfan and Shawon, and Kan et al. on the relationship between urbanization and ecological environment, who reported an inverted U curve between urbanization level and the overall quality of the water ecological environment [63,64,65].

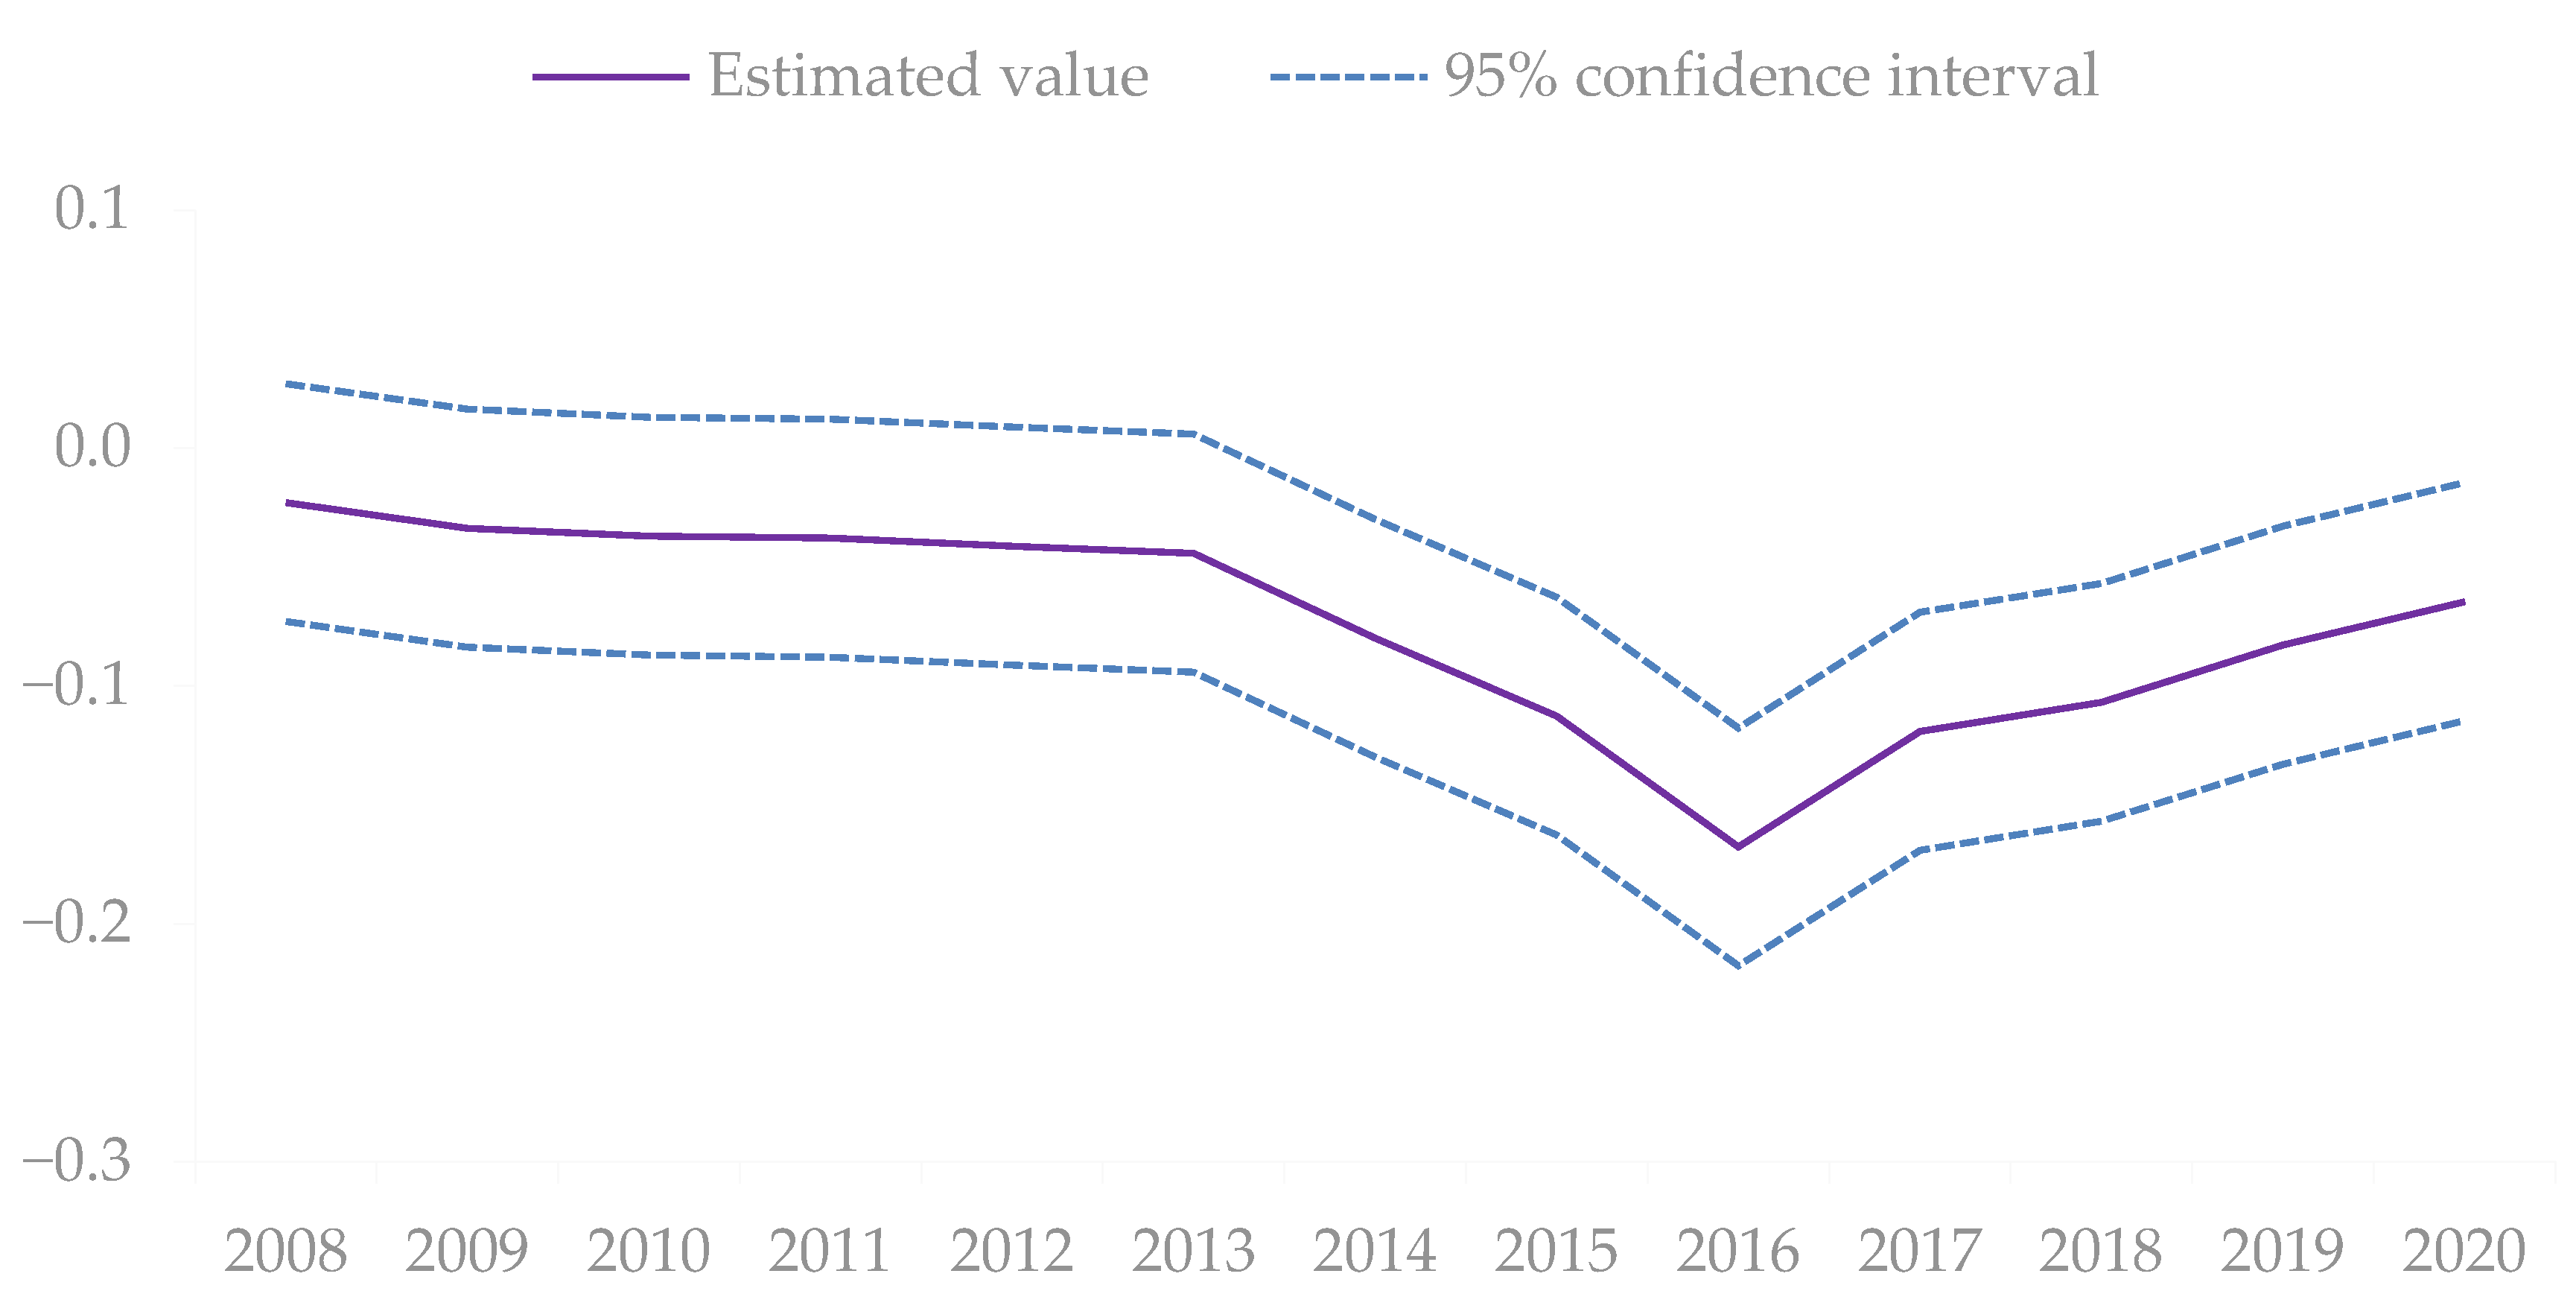
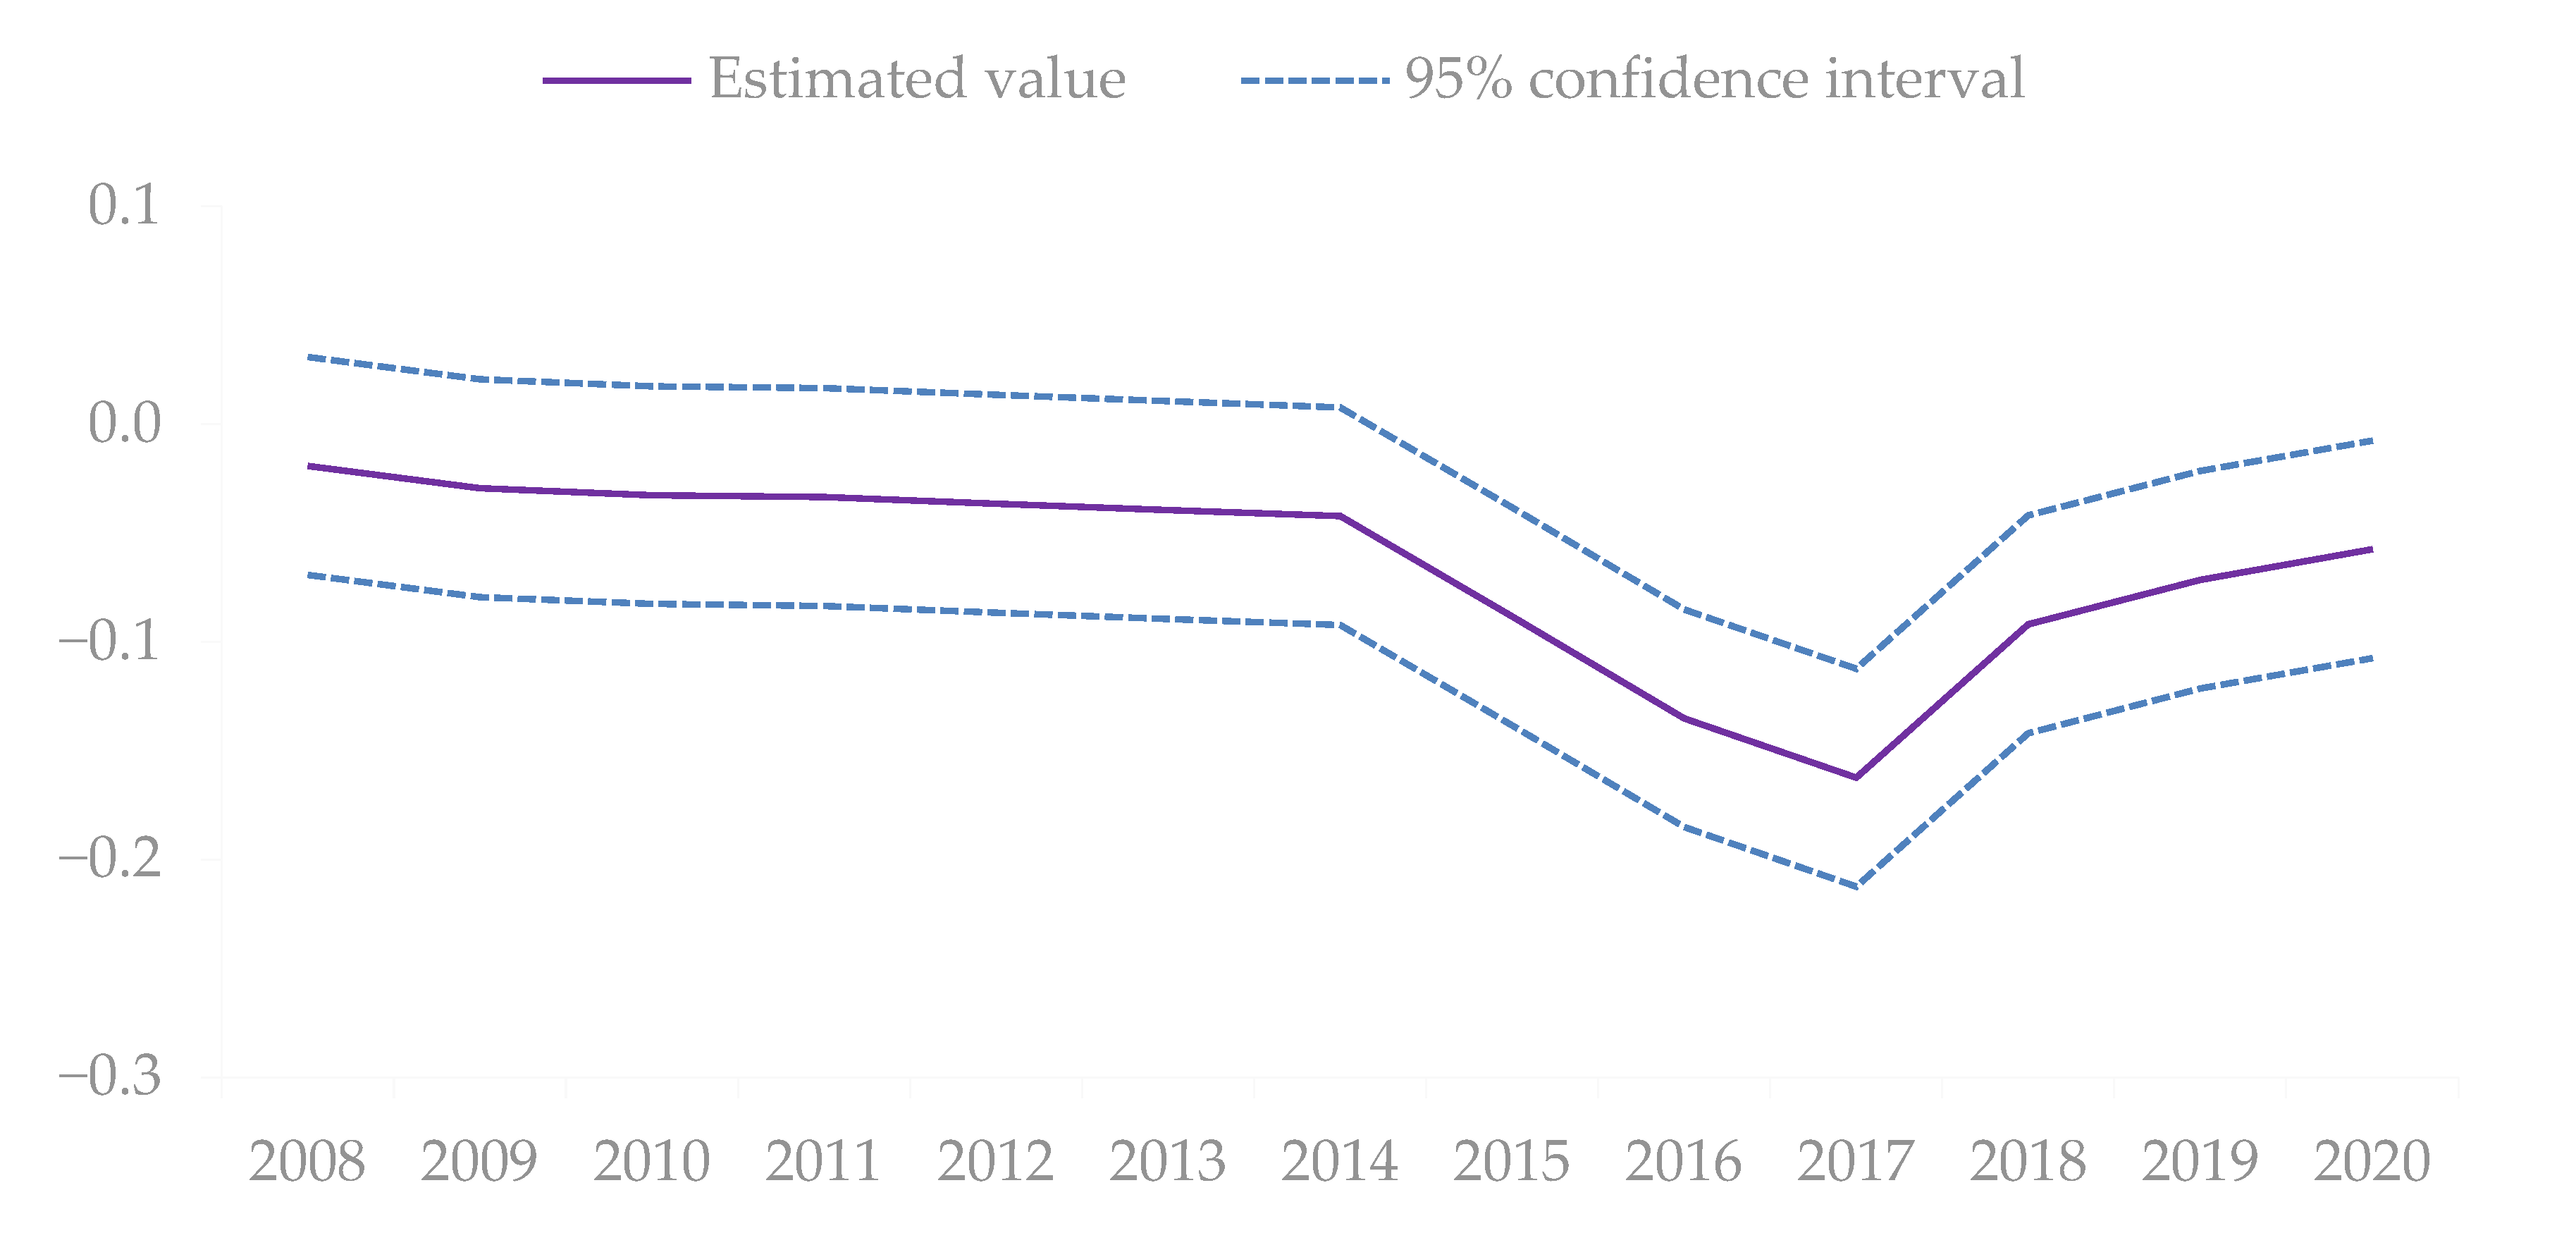
4.2. Parallel Trend Hypothesis Test

It is well-known that the use of the difference-in-differences method for policy evaluation needs to satisfy the parallel trend hypothesis; that is, it is assumed that the treatment group and control group have the same change trend before treatment. In this study, we needed to verify that cities in the treatment group and control group exhibited the same trend before the implementation of the policy. The event analysis method was used to test the parallel trend hypothesis. Taking 2013 and 2014 as the base year of policy implementation for the two respective bathes of pilot cities, the following regression models are constructed:
W p i t = C + k = 6 5 β k W s i × T m t + k + λ X i t + u i + φ t + ε i t
W p i t = C + j = 7 4 β j W s i × T m t + j + λ X i t + u i + φ t + ε i t
where k and j represent a series of estimated values of the two groups of cities from 2008 to 2020, respectively. Other variables in Equations (2) and (3) remain the same as in Equation (1). Figure 2 shows the estimation results of k coefficient under a 95% confidence interval. When k is less than 0, if the trend of k increases or decreases significantly, the parallel trend hypothesis is not satisfied. Conversely, when k is less than 0, if the trend of k is not significant and relatively flat, the parallel trend hypothesis is satisfied. Figure 2 shows that coefficient k is not significant from 2008 to 2013, indicating that there is no significant difference in the trend between the first batch of pilot cities in the treatment group and the control group before the implementation of the pilot policy, which satisfies the parallel trend hypothesis. Coefficient k is significant from 2014 to 2020, indicating that water pollution intensity for the first batch of pilot cities in 2014 is significantly reduced by the pilot policy of water ecological civilization construction. Figure 3 shows that that coefficient j is not significant from 2008 to 2014, indicating that it also satisfies the parallel trend hypothesis. Additionally, coefficient j is significant from 2015 to 2020, indicating that the water pollution degree for the second batch pilot cities in 2015 is affected (significantly reduced) by the pilot policy of water ecological civilization construction.

4.3. Robustness Test

In this study, several robustness tests were carried out by remeasuring dependent variables, excluding extreme values, considering other policies, using a placebo test, using the PSM-DID method, adding control variables, considering spatial correlation, etc. The test results are shown in Table 4.

4.3.1. Remeasurement of Dependent Variables

In this paper, the wastewater discharge per unit of industrial output value is used to re-measure the dependent variable (water pollution intensity), and the panel difference-in-differences method is used to estimate the model again. The results show that the coefficient of Ws×Tm is significantly negative at the 5% level, confirming that the baseline estimation result is robust.

4.3.2. Exclusion of the Influence of Extreme Values

The descriptive statistics presented in Table 2 show that the standard deviation of technological innovation, import and export trade, and foreign capital is greater than the mean, suggesting the existence of large variation or extreme outliers. Therefore, the upper and lower 1% extreme values of the three continuous variables are excluded from the sample. The estimation results after exclusion of extreme values are consistent with the baseline results presented in Table 3.

4.3.3. Considering the Impact of Other Policies

In the process of implementing the pilot policy of water ecological civilization construction, the government also issued the Interim Measures for interview of the Ministry of Environmental Protection and the action plan for water pollution prevention and control in 2014 and 2015, respectively, namely the environmental protection interview policy and the Ten-Point Water Plan. The implementation of these policies may affect or compound the implementation effect of the pilot policy of water ecological civilization construction, causing the impact of the pilot policy on water pollution intensity to be overestimated. To test this possibility, the dummy variables of environmental protection interview policy and the Ten-Point Water Plan were added into the baseline model Equation (1) to separate their impact on water pollution intensity and identify the net effect of the pilot policy on water pollution intensity. The estimation results show that the coefficient of Ws×Tm is still significantly negative at the 5% level, with a slight reduction in the coefficient value, indicating that the impact of the pilot policy on water pollution intensity is slightly overestimated, although the baseline conclusion that the pilot policy reduces water pollution intensity remains solid and robust.

4.3.4. Placebo Test

Because a city’s water pollution intensity is also affected by other policy changes or random factors, we conducted the first placebo test on the implementation time of the pilot policy for the construction of water ecological civilization in order to eliminate the systematic error caused by other policy changes. Specifically, we set a false policy impact year and advanced the implementation time of the pilot policies for the two batches of pilot cities by 3 years so as to retest the impact of the pilot policies on water pollution intensity. The results show that the estimation coefficient of Ws×Tm for false policy impact years is not significant, that is, the pilot policy effect of water ecological civilization construction, if implemented three years in advance, is not significant, which excludes the possibility that the baseline conclusions of this paper are caused by other policy changes, robustly confirming that the pilot policy helps to reduce water pollution intensity. The second placebo test was conducted by constructing a false treatment group to eliminate the systematic error caused by unobservable random factors. Because 105 of the 283 cities comprise the treatment group, we reconstructed a new treatment group by randomly selecting 105 cities from the sample for re-estimation. With the randomly generated false treatment group, as shown in Table 4, the effect of the re-estimated coefficient of Ws×Tm on water pollution intensity is not significant, with a coefficient value near 0, indicating that the impact of the pilot policy with the correctly selected treatment group is stable and robust. In order to avoid the interference of low-probability events, the sampling and estimation were repeated 1000 times, and the kernel density distribution of the estimation coefficients was drawn. The estimation coefficients are symmetrically distributed, in contrast to the estimation coefficients of the baseline model with the correct treatment group, indicating that the baseline estimation results reported above are not associated with low-probability events. In other words, it can be ruled out that the baseline estimation result is a coincidence caused by random factors, confirming its robustness.

4.3.5. PSM-DID Method

To examine whether sample selection errors occurred as a result of individual heterogeneity, causing evaluation bias of pilot policy effects, we used the PSM method to construct a treatment group and control group with strong homogeneity to deal with the problem of sample deviation. Specifically, the control variable was taken as the covariate, and whether the city was selected as a pilot city for water ecological civilization construction was taken as the dependent variable in a logit regression to obtain the propensity score value; the cities with the closest scores were taken as the control group for the pilot policy. After propensity score matching, a balance test was carried out to judge the matching effect. The test results showed that there was no significant difference between the matched treatment group and the control group. Then, the propensity-score-matched groups were re-estimated by the DID method. Table 4 shows that the Ws×Tm coefficient is significantly negative, indicating that the pilot policy of water ecological civilization construction still helps to reduce water pollution intensity, even when considering the sample selection error caused by individual heterogeneity, confirming the robustness of the baseline results.

4.3.6. Addition of Control Variables

Two more control variables were included in the model estimation to capture possible differences between the treatment group and control group: industrial agglomeration and climate factors, which are measured by the Herfindahl–Hirschman index and precipitation, respectively. Table 4 shows that the impact of the pilot policy on water pollution intensity is significantly negative, and the baseline conclusion remains stable and robust.

4.3.7. Considering Spatial Relevance

This test was conducted to consider possible spatial correlation or relevance in the assessment of the impact of the pilot policy on water pollution intensity. Based on the geographical distance weight matrix, the Moran’I index was used to test whether there was spatial autocorrelation in water pollution intensity. We found that the index was greater than 0, with a fluctuating upward trend, indicating a strong spatial correlation in water pollution intensity. The LM and robust LM test results show that the spatial dynamic panel lag model would be appropriate to use. The estimation results presented in Table 4 show that the Ws×Tm coefficient is still significantly negative, indicating that after considering spatial correlation, the baseline conclusion is robust. Moreover, when the partial differential equation is used to decompose the impact of the pilot policy into direct effect (Ws×Tm direct) and indirect effect (Ws×Tm indirect) (the direct effect is the impact of the pilot policy of water ecological civilization construction on water pollution intensity within the area itself, and the indirect effect is the impact of the policies in the surrounding areas on water pollution intensity in the own region), the pilot policy is found to help reduce water pollution intensity in the city, and the policies in the surrounding cities are also found to help reduce water pollution intensity in the considered city. Thus, the pilot policy of water ecological civilization construction has a positive spatial spillover effect.

4.4. Mechanism Test

The above mechanism analysis (Section 2) demonstrates that the pilot policy of water ecological civilization construction reduces the intensity of water pollution through the pathways (channels) of optimization of industrial structure, increase in sewage treatment, promotion of water recycling, promotion of technological progress, and acceleration of water pricing reform. In order to test this mechanism hypothesis, the following model is constructed:
J z i t = C + β 0 W s i × T m t + λ X i t + u i + φ t + ε i t
where the dependent variable Jz includes five mechanism variables—industrial structure (Is), sewage treatment (St), water recycling (Wr), technological progress (Tp), and water pricing reform (Pr)—with the remaining variables the same as those in Equation (1). We used the respective proportion of the output value of the three industries in GDP, the centralized treatment rate of sewage treatment plants, repeated (recycled) water consumption/total industrial water consumption, and GDP/total water consumption to measure industrial structure, sewage treatment, water recycling, and technological progress, respectively. The original data were collected from the China City Statistical Yearbook, the China Environmental Yearbook, the China Statistical Yearbook (County-Level), and provincial and municipal statistical yearbooks and water resources bulletins. The water pricing reform variable is a dummy variable with value of “1” if the construction scheme submitted by the city involves promoting the reform of the water supply pricing method and 0 otherwise.
Table 5 reports the difference-in-differences estimation results. When the dependent variable is the proportion of the output value of the three industries in GDP, the pilot policy of water ecological civilization construction significantly reduced the proportion of the primary industry in GDP, had no significant effect on the proportion of the secondary industry, and significantly increased the proportion of the tertiary industry in GDP. That is, the pilot policy optimized the industrial structure. Similarly, when the dependent variables are sewage treatment, water recycling, technological progress, and water price reform, the coefficients of Ws×Tm are 0.0716, 0.0511, 0.0674, and 0.0908, respectively, all passing the significance test at different levels. The results indicate that the pilot policy of water ecological civilization construction has significantly improved the centralized sewage treatment rate, promoted water recycling and technological progress, and accelerated water price reform. Table 5 further shows that the effects of the estimated coefficients of Ws×Tm on each mechanism variable in 2012 and 2013 are not significant, indicating that these mechanism variables in the two batches of pilot cities as the treatment group are not different than those of the control group before the implementation of the pilot policy of water ecological civilization construction. In order to test Hypothesis 2, we specified industrial structure (the proportion of the output value of the tertiary industry in GDP), sewage treatment, water recycling, technological progress, and water pricing reform as the independent variables, with water pollution intensity as the dependent variable, and included the control variables of Equation (1) for estimation. Table 6 shows that the estimated coefficients of industrial structure, sewage treatment, water recycling, technological progress, and water price reform are −0.1736, −0.1985, −0.1679, −0.2137. and −0.1316, respectively, all passing the significance test at different levels. The results show that industrial structure, sewage treatment, water recycling, technological progress, and water price reform all have significant negative effects on the water pollution intensity. Optimizing industrial structure, increasing sewage treatment, promoting water recycling, improving technology, and accelerating water price reform help to reduce the water pollution intensity. Therefore, Hypothesis 2 is confirmed.

4.5. Heterogeneity Analysis

The above empirical results show that the pilot policy of water ecological civilization city construction helps to reduce water pollution intensity. Here, we further investigate whether this reduction effect varies due to time heterogeneity and regional heterogeneity.

4.5.1. Time Heterogeneity

We tested the time heterogeneity of the water ecological civilization city construction pilot policy by investigating the dynamic effect of the pilot policy on water pollution intensity over time. Because the policy implementation of the two batches of pilot cities began in 2014 and 2015, respectively, the progressive difference-in-differences method was used to estimate the model. Table 7 shows that the estimated coefficients of the first batch of pilot cities (Ws×Tm2014) and the second batch of pilot cities (Ws×Tm2015) are significantly negative with a relatively low magnitude, whereas the estimated coefficients of the first batch of pilot cities (Ws×Tm2015–Ws×Tm2016) and the second batch of pilot cities (Ws×Tm2016–Ws×Tm2017) are significantly negative and relatively large, indicating that in the first year of policy implementation, as the implementation plan submitted by each pilot city had just been executed, the pilot policy had a less significant negative reduction effect on water pollution intensity. Then, with the full promotion and implementation of various work measures, the pilot policy was able to achieve improved pollution reduction results. Further observation of the estimated coefficients after the construction period of the two batches of pilot cities shows that the reduction effect of the pilot policy on water pollution intensity still exists but with a downward trend, indicating that after the pilot construction, the impact of the pilot policy was sustained for certain period of time, but the effect weakened gradually. Altogether, there is evident time heterogeneity in the impact of the pilot policy of water ecological civilization city construction on water pollution intensity.

4.5.2. Regional Heterogeneity

We explored the regional heterogeneity underlying the policy impact of the pilot project of water ecological civilization city construction in three dimensions: the economic development level, the degree of water resource endowment and, the environmental regulation intensity. We explored whether there were significant differences in terms of the impact of the pilot policies on water pollution intensity in cities with differing levels of economic development, differing water resource endowments, and differing environmental regulation intensities.
First of all, we grouped the cities according to their per capita GDP (as a proxy of economic development level) in the year before the implementation of the pilot policy. Cities with a per capita GDP in the 20% quantile and 20–50% quantile were classified as cities with low economic development levels, and cities with a per capita GDP in the 50–80% quantile and 80–100% quantile were classified as cities with high economic development levels. In order to overcome the small-sample bias of the traditional Wald test, the bootstrap method was used to test whether the policy impact on water pollution intensity varies according to the economic development level (the Chow test has strict application conditions, and the seemingly unrelated regression method is not suitable for a panel data model). Specifically referring to the practice of Cleary [66], and Lian et al. [67], the empirical p-value calculated by bootstrap resampling for 1000 times was used for judgment. Table 8 shows that the estimation coefficients of Ws×Tm are significantly negative in all groups of cities, and the estimated coefficient of Ws×Tm in cities with high economic development level is lower than that in cities with low economic development levels. The empirical p-value obtained by the bootstrap method is 0.0427, which is significant at the 5% level, further confirming the statistical significance of the above difference. In other words, the pilot policy of water ecological civilization city construction has a relatively small reduction effect on water pollution intensity in cities with high economic development levels. Some studies have shown that in cities with a high economic development level, enterprises and residents tend to have a stronger awareness of environmental protection. As a result of the shutdown of high-water-consumption and high-pollution industries, the proportion of these industries in the industrial structure is often lower in such cities. They also tend to invest more in sewage treatment, resulting in increased sewage treatment and reuse rates. Meanwhile, cities with a high economic development level have a better soft and hard environment, which is conducive to technology R&D and technology spillover, such as water-saving irrigation, water conservation and emission reduction, water ecological protection and restoration, wastewater treatment, etc., resulting in a relatively lower water pollution intensity in such cities. Moreover, such cities have larger populations, more enterprises, and higher vulnerability of the water ecological environment, which prompts them to actively promote water pricing reform; establish and improve the water price formation mechanism to reflect market supply and demand, resource scarcity, ecological environment damage cost, and repair benefits; and give full play to the role of market mechanism and price leveraging in water pollution prevention and control, leading to a further reduction in water pollution intensity. Altogether, for the aforementioned reasons, the water pollution intensity in cities with high economic development levels is often already lower than that of cities with low economic development levels, leaving cities with high economic development level less room to further reduce the water pollution intensity. Consequently, although the pilot policy of water ecological civilization city construction can still reduce water pollution intensity in cities with high economic development levels, the reduction effect is less than significant than that in cities with low economic development levels.
Second, to explore the effect of heterogeneity of water resource endowment on the impact of water ecological civilization city construction pilot policy on water pollution intensity, we grouped cities according to their per capita water resources in the year before implementation of the pilot policy. Cities with per capita water resources in the 20% quantile and 20–50% quantile were classified as cities with insufficient water resource endowments, and cities with per capita water resources in the 50–80% quantile and 80–100% quantile were classified as cities with abundant water resource endowments. The results presented in Table 8 show that the estimation coefficients of Ws×Tm in all cities are significantly negative; however, the coefficients of Ws×Tm are relatively larger in cities with abundant water resources. The empirical p-value obtained by the bootstrap method is 0.0382, which is significant at the 5% level, further confirming the statistical significance of the above difference. That is, in cities with abundant water resources, the pilot policy of water ecological civilization city construction has a greater impact on water pollution intensity. Generally speaking, compared with cities with insufficient water resources, enterprises and residents in cities with abundant water resources may not have a strong awareness of water resource shortages or the urgency of water saving, resulting in a lower utilization efficiency, reuse rate, and recycling rate of water resources. Industrial development in such cities is relatively more inclined to be water-resource-intensive, and the proportion of high-water-consumption and high-pollution industries may also be higher. Moreover, such cities with abundant water resources may not be as motivated to adopt or develop high-efficiency water-saving irrigation technology, water-saving and emission reduction technology in high-water-consumption industries, domestic water-saving technology, water ecological protection and restoration technology, wastewater treatment technology, etc., resulting in relatively high water pollution intensity in such cities. Furthermore, such cities may not be sufficiently active in promoting water price reform, not feeling the need to save and protect water resources and reduce water pollution intensity through economic means. Therefore, the room and space to reduce water pollution intensity is greater for cities with abundant water resources than cities with insufficient water resources. Consequently, the pilot policy of water ecological civilization city construction can reduce water pollution intensity to a greater extent in cities with abundant water resources.
Third, There are mainly three types of environmental regulations: command control type, economic incentive type, and public participation type. Most studies conducted to date have found that command-controlled environmental regulation tools are the main means of environmental governance to improve environmental quality in China [68,69]. Therefore, we used command-controlled environmental regulation to test whether the impact of the water ecological civilization city construction pilot policy on water pollution intensity is affected by the environmental regulation intensity. This kind of environmental regulation is further measured by the completed investment of wastewater treatment project of the year/GDP. We grouped cities according to the completed investment of wastewater treatment project/GDP in the year before the implementation of the pilot policy. The cities with completed investment of wastewater treatment project/GDP in the 20% quantile and 20–50% quantile were classified as cities with low environmental regulation intensity, and the remaining cities were classified as cities with high environmental regulation intensity. The estimation results presented in Table 8 show that the estimated coefficient of Ws×Tm in cities with high environmental regulation intensity is less than that in cities with low environmental regulation intensity. The empirical p-value obtained by the bootstrap method is 0.0619, which is significant at the 10% level, further confirming the statistical significance of the above difference. This means that the pilot policy of water ecological civilization city construction has less impact on water pollution intensity in cities with high environmental regulation intensity prior to implementation of the pilot policy. Conceivably, the higher the environmental regulation intensity, the greater the illegal sewage discharge risk and the higher the illegal sewage discharge cost, resulting in lower water pollution intensity. Strict environmental regulation may also promote more technical transformation of water conservation and emission reduction in high-pollution industries and increase sewage treatment so as to reduce water pollution intensity. In addition, strict environmental regulation is conducive to the progression of green technology, improving the rate of sewage reuse and water recycling, thereby reducing water pollution intensity. Thus, in cities with high environmental regulation intensity prior to the implementation of pilot policy, the room to further reduce water pollution intensity is smaller than in cities with low environmental regulation intensity. Therefore, when the pilot policy of water ecological civilization city construction is implemented, the decline of water pollution intensity is relatively less in cities with high environmental regulation intensity.

5. Conclusions

Based on the panel data of 283 cities from 2008 to 2019, in this study, we empirically investigated the impact of the pilot policy of water ecological civilization city construction on water pollution intensity using the difference-in-differences method. The main findings are: (1) Overall, water pollution intensity exhibits a clear downward trend. In particular, water pollution intensity decreased most rapidly during the pilot construction period, with extent of decrease not only higher than the post-pilot construction period but also higher than the pre-pilot construction period. Furthermore, the extent of decrease in water pollution intensity in non-pilot cities was small, whereas the decrease in water pollution intensity in pilot cities was large, and the non-pilot cities had a significantly higher water pollution intensity level than pilot cities. (2) With the control variables included, the implementation of the pilot policy significantly contributed to the reduction in water pollution intensity, passing several robustness tests. (3) The pilot policy of water ecological civilization city construction reduces water pollution intensity through the channels (mechanisms) of optimization of the industrial structure, increasing sewage treatment, promotion of water recycling, promotion of technological progress, and acceleration of water pricing reform. (4) The impact of the pilot policy on water pollution intensity changes with the passage of time, i.e., there is a certain time heterogeneity in the policy effect. There is also regional heterogeneity in the policy effect, such that in cities with high economic development levels, insufficient water resource endowments, and high environmental regulation intensity, the pilot policy has a relatively smaller impact on water pollution intensity.
The above findings render the following policy implications: (1) It is possible to improve the relevant supporting policies by drawing from the experience of the pilot cities and extend the improved policies to other parts of the country. (2) To enhance the policy effect and further reduce water pollution intensity, all regions need to phase out high-water-consumption and high-pollution industries in a timely manner and rationalize and upgrade industrial structures by increasing the proportion of high-end manufacturing and high-end modern service industries while promoting the rationalization of industrial structures. (3) All regions need to increase investment in wastewater treatment; improve wastewater treatment capacity; vigorously promote sewage treatment and reuse; actively support the collection, development, and utilization of rainwater, brackish water, and reclaimed water, as well as seawater desalination and comprehensive utilization; and accelerate the construction of water pollution prevention projects and reclaimed water utilization projects. (4) In the process of policy implementation, all regions also need to attempt to build cloud smart ecological cities; increase investment in green technology R&D; and promote the application of cutting-edge technologies, such as big data, cloud computing, and AI in water ecological environment protection so as to reduce water pollution intensity. (5) In the process of policy implementation, all regions need to comprehensively accelerate water price reform, including continuous promotion of the comprehensive reform of agricultural water pricing; improve the residential step water pricing system in a timely manner; implement a progressive price increase system for non-resident water exceeding quota and a water price system for special industries; reform water resource taxation schemes, etc., so as to reduce water pollution intensity. (6) In the process of improving the pilot policy, different policy combinations need to be formulated considering and incorporating the heterogeneities of various cities. Therefore, attention can be directed to cities with greater potential to reduce water pollution intensity. Specifically, economically underdeveloped cities can take measures to change “late developing disadvantage” into “late developing advantage”, simultaneously promoting local economic growth and high-quality development. Cities with abundant water resources can strengthen the awareness of water conservation and emission reduction among residents and non-residents by means of perfecting systems, improving standards, imposing responsibilities, and safeguard measures to improve water use efficiency and sewage treatment rates from the perspective of system and mechanism innovation. Cities with low environmental regulation intensity can adopt multiple measures to comprehensively exploit the three types of environmental regulation tools (command control, economic incentive, and public participation) to promote the comprehensive prevention and control of water pollution and strengthen the supervision of water pollution in an all-round, multi-angle, and multi-level formats.
The results of the present study contribute to the analysis of the factors impacting water pollution intensity, enriching the theory of ecological environment protection and ecological civilization and improving the research content with respect to sustainable development theory. This paper also provides a reference for other developing countries similar to China with respect to how to reduce water pollution intensity and improve the water ecological environment in the process of economic development.

Author Contributions

Conceptualization, L.L. and D.K.; methodology, W.H.; software, W.Y.; validation, L.L., D.K., W.H. and W.Y.; formal analysis, D.K.; resources, L.L.; data curation, W.Y.; writing—original draft preparation, L.L. and D.K.; writing—review and editing, W.H.; visualization, L.L.; supervision, W.H.; project administration, L.L.; funding acquisition, L.L. and D.K. All authors have read and agreed to the published version of the manuscript.

Funding

This research was funded by the Social Science Foundation of Jiangxi Province (grant numbers 21JL08D and 22GL56D), the National Natural Science Foundation of China (grant number 71764018) and the Humanities and Social Sciences Foundation of Jiangxi Province (grant number JJ21212).

Institutional Review Board Statement

Not applicable.

Informed Consent Statement

Not applicable.

Data Availability Statement

Not applicable.

Conflicts of Interest

The authors declare no conflict of interest.

References

  1. Ministry of Ecology and Environment of the People’s Republic of China. Available online: https://www.mee.gov.cn/hjzl/sthjzk/zghjzkgb/202105/P020210526572756184785.pdf (accessed on 10 October 2022).
  2. Luo, Z.; Qi, F.C. The effects of environmental regulation on industrial transfer and upgrading and banking synergetic development: Evidence from water pollution control in the Yangtze River Basin. Econ. Res. J. 2021, 2, 174–189. [Google Scholar]
  3. Chen, X.H.; Cai, S.J.; Wang, Y.J. The institutional and policy logic of the implementation of the environmental protection supervision system in China. J. Manag. World 2020, 11, 160–172. [Google Scholar]
  4. Shi, M.J.; Zheng, D.; Lei, P.; Yuan, J.P. Evolution of spatial pattern of industrial wastewater pollution emission in China. China Popul. Resour. Environ. 2017, 27, 1–7. [Google Scholar]
  5. Chen, Z.; Kahn, M.E.; Liu, Y.; Wang, Z. The consequences of spatially differentiated water pollution regulation in China. J. Environ. Econ. Manag. 2018, 88, 468–485. [Google Scholar]
  6. Lin, L.; Li, J. The network analysis on spatial correlation of environmental pollution in the Yangtze River Economic Belt: Based on the comprehensive indicator of water and air pollution. Econ. Probl. 2019, 9, 86–92, 111. [Google Scholar]
  7. Tian, X.; Chen, S.; Xu, J.T. Environmental regulation, path dependence and distribution of water pollution industries: An empirical analysis based on the Yangtze River Basin. Acta Sci. Nat. Univ. Pekin. 2020, 56, 352–364. [Google Scholar]
  8. Lu, L.W.; Song, D.Y. Temporal and spatial pattern evolution and influencing factors of water pollution intensive industry in the Yangtze River Economic Belt. Resour. Environ. Yangtze Basin 2020, 29, 2597–2606. [Google Scholar]
  9. Song, G.J.; Han, D.M. Research on the performance evaluation of urban domestic sewage management in China. China Soft Sci. 2012, 8, 75–83. [Google Scholar]
  10. Zhang, X. Trend of and the governance system for water pollution in China. China Soft Sci. 2014, 10, 11–24. [Google Scholar]
  11. Jing, S.W.; Zhang, J. Can Xin’anjiang river basin horizontal ecological compensation reduce the intensity of water pollution? China Popul. Resour. Environ. 2018, 28, 152–159. [Google Scholar]
  12. Liao, W.J.; Hu, D.B. Study on the impact of urban water pollution control policies: A case study of Changsha. Sci. Technol. Prog. Policy 2018, 35, 155–163. [Google Scholar]
  13. Sun, Y.Y.; Song, Y.T.; Wang, H.L.; Bu, N.S. Study on industrial water pollution control efficiency of six river basins in China. Stat. Decis. 2018, 34, 100–104. [Google Scholar]
  14. An, M.; He, W.J.; Yuan, L.; Zhang, Z.F. Study on treatment efficiency of industrial and urban water pollution in China. Stat. Decis. 2019, 35, 133–136. [Google Scholar]
  15. Ma, J.; Li, Y.F. Study on the impact of water pollution control policies in Jiangsu Province Based on environmental CGE model. Stat. Decis. 2019, 35, 62–65. [Google Scholar]
  16. Xu, M.; Zhang, T.; Wang, D.; Zhao, Y.; Xie, Y.C.; Ma, L.K. Review and prospect of water pollution prevention and control of China in the forty years of reform and opening-up. Chin. J. Environ. Manag. 2019, 11, 65–71. [Google Scholar]
  17. Li, X.L.; Chen, J. Evaluation on the efficiency of urban wastewater governance in China under the market-oriented reform. J. Arid Land Resour. Environ. 2019, 33, 140–144. [Google Scholar]
  18. Tong, Q.Y.; Sun, F.; Dong, X.; Gao, J. Statistical assessment and determinant analysis of the pollutant removal efficiencies of wastewater treatment plants. China Popul. Resour. Environ. 2019, 29, 49–57. [Google Scholar]
  19. Yu, G.S. Trade openness, FDI and environmental pollution treatment: A case study of the industrial wastewater treatment. Econ. Issues China 2011, 6, 83–89. [Google Scholar]
  20. Guo, Z.Y.; Yao, H.L. Theoretical research and empirical test of industrial water pollution in China. J. Audit. Econ. 2011, 26, 97–103. [Google Scholar]
  21. Xu, P.P.; Dong, L.M. An empirical study on the relationship between urbanization level and non-point source water pollution: Based on the investigation of Erhai Basin. Urban Probl. 2013, 2, 16–20. [Google Scholar]
  22. Hu, Y.; Cheng, H. Water pollution during China’s industrial transition. Environ. Dev. 2013, 1, 57–73. [Google Scholar] [CrossRef]
  23. Zhang, Y.; Jiang, D.C. FDI, government regulation and the water pollution in China: An Empirical Test Based on the decomposition of industrial structure and the technological progress. China Econ. Q. 2014, 13, 491–514. [Google Scholar]
  24. Luo, J.G. Analysis of the relevance between China’s industrial structure and water pollution emissions with DPG method. J. Xiangtan Univ. (Philos. Soc. Sci.) 2014, 38, 59–63. [Google Scholar]
  25. Gao, X. “Tragedy of the Commons” in the management of cross-jurisdiction water pollution: Evidence from Chinese lakes and reservoirs. China Econ. Stud. 2014, 4, 21–29. [Google Scholar]
  26. Ru, L.; Si, W. Environmental regulation, technical efficiency and water pollutants abatement cost: Evidence from China’s sugar industry. J. Beijing Inst. Technol. (Soc. Sci. Ed.) 2015, 17, 15–24. [Google Scholar]
  27. Li, G.P.; Wang, Y.Q. ‘Tragedy of the Commons’ theory and empirical study in the transboundary water pollution treatment. Soft Sci. 2016, 30, 24–28. [Google Scholar]
  28. Zhang, N.; Yang, J. The analysis about change of embodied wastewater emissions of Chinese Industrial foreign trade. Stat. Inf. Forum 2017, 32, 55–62. [Google Scholar]
  29. Zhuang, R.L.; Mi, K.N.; Liang, L.W. China’s industrial wastewater discharge pattern and its driving factors. Resour. Environ. Yangtze Basin 2018, 27, 1765–1775. [Google Scholar]
  30. Fang, L.; Wu, F.P.; Zhang, Q.H. Analysis on industrial wastewater discharge efficiency and mitigation potential from the perspective of heterogeneity. China Popul. Resour. Environ. 2018, 28, 143–151. [Google Scholar]
  31. Lu, Y. Effects of industrial agglomeration on river basin pollution: A case of Haihe River Basin. J. Beijing Jiaotong Univ. (Soc. Sci. Ed.) 2019, 18, 61–68. [Google Scholar]
  32. Murat, O.; Priscilla, A.H. Applying conditional process modelling to investigate factors influencing the adoption of water pollution mitigation behaviors. Sustain. Water Resour. Manag. 2020, 6, 491–506. [Google Scholar]
  33. Zhang, F.; Deng, H.B.; Peng, Y.Z. Spatial spillover effect and threshold characteristics of economic agglomeration on industrial wastewater discharge in the Yangtze River Economic Belt. Resour. Sci. 2021, 43, 57–68. [Google Scholar]
  34. Alex, I.; Michael, W.; Rebecca, W.; Vrain, E.; Lovett, A.; Collins, A.; Jones, I.; Johnes, P.; Cleasby, W. An exploration of individual, social and material factors influencing water pollution mitigation behaviors within the farming community. Land Use Policy 2018, 70, 16–26. [Google Scholar]
  35. Fu, W.F.; Jiang, H.; Fang, J.J. On farmers’ willingness to participate in rural water pollution control and its influence factors. J. Nanjing Agric. Univ. (Soc. Sci. Ed.) 2018, 18, 119–126, 159–160. [Google Scholar]
  36. Murat, O.; Ata, S.Y. Exploring stakeholders’ perceptions of the quality and governance of water resources in the Wenchi municipality. J. Environ. Plan. Manag. 2020, 63, 1375–1403. [Google Scholar]
  37. Gao, S.; Wei, Y.H.; Chen, W.; Zhao, H.X. Study on spacial-correlation between water pollution and industrial agglomeration in the developed region of China: A case study of Wuxi City. Geogr. Res. 2011, 30, 902–912. [Google Scholar]
  38. Zhang, S.S.; Zhang, L.; Zhang, L.C.; Gao, S. Coupling relationship between polluting industrial agglomeration and water environment pollution in Southern Jiangsu of Taihu Lake Basin. Sci. Geogr. Sin. 2018, 38, 954–962. [Google Scholar]
  39. Yu, H.; Zhong, J.; Liu, S.Q.; Yang, D.W. The coupling characteristics between polluting industrial agglomeration and water pollution discharge in Zhangjiakou. J. Nat. Resour. 2020, 35, 1416–1424. [Google Scholar]
  40. Tian, X.; Chen, S.; Xu, J.T. Impacts of environmental regulation on water pollution enterprises in China: An empirical study based on “Two Control Zones” policy. Acta Sci. Nat. Univ. Pekin. 2019, 55, 941–950. [Google Scholar]
  41. Xu, L. Study on water pollution effects of regional integration based on the quasi-natural experiment of the enlargement in Yangtze River Delta. China Popul. Resour. Environ. 2019, 29, 50–61. [Google Scholar]
  42. Lu, J.Y.; Zhou, N.X.; Zhou, Z.F.; Zeng, H.X. Effect and mechanism of the ‘Ten-point Water Plan’ on the intensity of industrial water pollution. China Popul. Resour. Environ. 2021, 31, 90–99. [Google Scholar]
  43. Zhang, G.X.; Zhang, P.D.; Zhang, Z.G.; Li, J.X. Impact of environmental regulations on industrial structure upgrading: An empirical study on Beijing-Tianjin-Hebei region in China. J. Clean. Prod. 2019, 238, 117848. [Google Scholar] [CrossRef]
  44. Tian, P.; Wu, H.Q.; Yang, T.T.; Jiang, F.L.; Zhang, W.J.; Zhu, Z.L.; Yue, Q.M.; Liu, M.X.; Xu, X.Y. Evaluation of urban water ecological civilization: A case study of three urban agglomerations in the Yangtze River Economic Belt, China. Ecol. Indic. 2021, 123, 107351. [Google Scholar] [CrossRef]
  45. Keiser, D.A.; Shapiro, J.S. Consequences of the Clean Water Act and the demand for water quality. Q. J. Econ. 2019, 134, 349–396. [Google Scholar]
  46. Li, J.; Shi, X.; Wu, H.Q.; Liu, L.W. Trade-off between economic development and environmental governance in China: An analysis based on the effect of river chief system. China Econ. Rev. 2020, 60, 101403. [Google Scholar] [CrossRef]
  47. National Bureau of Statistics. China City Statistical Yearbook; China Statistics Press: Beijing, China, 2022; pp. 53–77. [Google Scholar]
  48. National Bureau of Statistics. China Statistical Yearbook (County-Level); China Statistics Press: Beijing, China, 2022; pp. 125–246. [Google Scholar]
  49. Li, B.; Cao, W.L. Study on the influence of environmental regulation on the circular economy performance: Perspective of eco-innovation. China Soft Sci. 2017, 6, 140–154. [Google Scholar]
  50. Wang, X.H.; Feng, Y.C. The influence of environmental regulation on China’s circular economy performance. China Popul. Resour. Environ. 2018, 28, 136–147. [Google Scholar]
  51. Rubashkina, Y.; Galeotti, M.; Verdolini, E. Environmental regulation and competitiveness: Empirical evidence on the Porter Hypothesis from European manufacturing sectors. Energy Policy 2015, 83, 288–300. [Google Scholar] [CrossRef] [Green Version]
  52. Yang, Q.Y.; Gao, D.; Song, D.Y.; Li, Y. Environmental regulation, pollution reduction and green innovation: The case of the Chinese Water Ecological Civilization City Pilot policy. Econ. Syst. 2021, 45, 100911. [Google Scholar] [CrossRef]
  53. Peng, J.C.; Xiao, J.Z. Environmental regulation, energy factor prices and green innovation efficiency: Evidence from the Yangtze River Economic Belt. J. Environ. Econ. 2021, 6, 158–178. [Google Scholar]
  54. Gao, H.G.; Xu, Y.Y.; Zhu, Y.K. Impact of command controlled environmental regulation on carbon price: Experiment based on central environmental protection inspector. J. China Univ. Geosci. 2022, 22, 54–66. [Google Scholar]
  55. Liu, Y.; Yang, L.; Jiang, W. Qualitative and quantitative analysis of the relationship between water pollution and economic growth: A case study in Nansi Lake catchment, China. Environ. Sci. Pollut. Res. 2020, 27, 4008–4020. [Google Scholar] [CrossRef]
  56. Chapagain, S.K.; Mohan, G.; Fukushi, K. An extended input–output model to analyze links between manufacturing and water pollution in Nepal. Water Air Soil Pollut. 2020, 231, 1–11. [Google Scholar]
  57. Cai, H.; Mei, Y.D.; Chen, J.H.; Wu, Z.H.; Lan, L.; Zhu, D. An analysis of the relation between water pollution and economic growth in China by considering the contemporaneous correlation of water pollutants. J. Clean. Prod. 2020, 276, 122783. [Google Scholar]
  58. Tang, W.Z.; Pei, Y.S.; Zheng, H.; Zhao, Y.; Shu, L.M.; Zhang, H. Twenty years of China’s water pollution control: Experiences and challenges. Chemosphere 2022, 295, 133875. [Google Scholar] [CrossRef]
  59. Liu, X.; Wang, X.; Lu, F.; Liu, S.; Chen, K. Evaluation of the Governance Efficiency of Water Environmental Governance Efficiency in Yangtze River Delta from the Perspective of Multivariate Synergies. Int. J. Environ. Res. Public Health 2022, 19, 2347. [Google Scholar] [CrossRef]
  60. Darko, G.; Obiri-Yeboah, S.; Takyi, S.A.; Amponsah, O.; Borquaye, L.S.; Amponsah, L.O.; Fosu-Mensah, B.Y. Urbanizing with or without nature: Pollution effects of human activities on water quality of major rivers that drain the Kumasi Metropolis of Ghana. Environ. Monit. Assess. 2022, 194, 38. [Google Scholar] [CrossRef]
  61. Kan, D.; Ye, X.; Lyu, L.; Huang, W. Study on the coupling coordination between new-type urbanization and water ecological environment and its driving factors: Evidence from Jiangxi Province, China. Int. J. Environ. Res. Public Health 2022, 19, 9998. [Google Scholar] [CrossRef]
  62. Margaret, Y.O.; Adebayo, O.E.; Ifeanyi, E.O. Urbanization and its effects on land and water resources in Ijebuland, southwestern Nigeria. Environ. Dev. Sustain. 2022, 24, 592–616. [Google Scholar]
  63. Al-Mulali, U.; Weng, W.C.; Sheau-Ting, L. Investigating the environmental Kuznets curve (EKC) hypothesis by utilizing the ecological footprint as an indicator of environmental degradation. Ecol. Indic. 2015, 48, 315–323. [Google Scholar] [CrossRef]
  64. Irfan, M.; Shaw, K. Modeling the effects of energy consumption and urbanization on environmental pollution in South Asian countries: A nonparametric panel approach. Qual. Quant. Int. J. Methodol. 2017, 51, 65–78. [Google Scholar] [CrossRef]
  65. Kan, D.; Yao, W.; Lyu, L.; Huang, W. Temporal and spatial difference analysis and impact factors of water ecological civilization level: Evidence from Jiangxi Province, China. Land 2022, 11, 1459. [Google Scholar]
  66. Cleary, S. The relationship between firm investment and financial status. J. Financ. 1999, 54, 673–692. [Google Scholar] [CrossRef]
  67. Lian, Y.J.; Peng, F.P.; Su, Z. Financing constraints and liquidity management behavior. J. Financ. Res. 2010, 10, 158–171. [Google Scholar]
  68. Zeng, Q.; Zeng, X.F.; Liu, J.R. The impact of environmental regulation instruments on environment quality from the perspective of industrial structure. Econ. Surv. 2018, 35, 94–100. [Google Scholar]
  69. Zeng, Q.; Zeng, X.F.; Yue, J.X. Industrial structure, environmental regulation and environment quality: Theory and evidence based on provincial panel data of China. Manag. Rev. 2020, 32, 65–75. [Google Scholar]
Figure 1. Water pollution intensity of pilot cities and non-pilot cities (t/USD 10,000).
Land 11 01999 g001
Figure 2. Parallel trend hypothesis test (the first batch of pilot cities).
Land 11 01999 g002
Figure 3. Parallel trend hypothesis test (the second batch of pilot cities).
Land 11 01999 g003
Table 1. Water pollution intensity of pilot cities from 2008 to 2020 (t/USD 10,000).
StageYearFirst Batch of Pilot CitiesStageYearSecond Batch of Pilot Cities
Before pilot construction200846.6024Before pilot construction200854.0737
200938.3891200939.8556
201032.6279201035.1320
201129.5592201131.2143
201226.2441201224.8599
201324.6208201323.3858
During pilot construction201420.5360201422.6454
201517.7066During pilot construction201521.1896
201613.5545201616.9695
After pilot completion201711.4937201713.4877
201810.1346After pilot completion201811.5625
20199.1520201910.2034
20208.899220209.4936
Table 2. Descriptive statistical results.
VariableMaximumMinimumMeanStandard DeviationNumber of Observations
Wp339.9897 0.1118 25.7001 24.7724 3679
Ws×Tm1 00.1679 0.3181 3679
Ur0.9276 0.1794 0.5393 0.1442 3679
Js70.5890 0.0086 1.7068 4.8179 3679
Jc0.8215 0.0012 0.2135 0.2864 3679
Fo187.3171 0.0034 5.9757 18.6836 3679
Table 3. Panel difference-in-differences estimation results.
VariableModel 1Model 2Model 3Model 4
c2.4752 **
(2.0207)
3.0026 **
(2.0845)
2.7518 *
(1.7632)
2.6073 *
(1.7429)
Ws×Tm−0.2118 ***
(−2.8901)
−0.1619 ***
(−3.7460)
−0.1454 ***
(−3.1839)
−0.1241 **
(−2.1936)
Ur 0.0925 *
(1.7871)
0.0734 *
(1.7515)
Js −0.1306 **
(−2.2187)
−0.1062 **
(−2.1358)
Jc 0.1512 **
(2.2005)
0.1307 **
(2.2123)
Fo 0.0619 *
(1.7134)
0.0465 *
(1.7049)
Individual fixed effect Yes Yes
Time fixed effect Yes Yes
R20.66450.71240.79030.8636
F51.4723 ***52.9261 ***47.6358 ***41.2547 ***
Note: *, **, and *** indicate that the variable is significant at the level of 10%, 5%, and 1%, respectively.
Table 4. Estimation results of robustness test.
VariableRemeasured Dependent VariableExcluding Extreme ValuesConsidering Other PoliciesPlacebo TestPSM-DIDAdditional Control VariableConsidering Spatial Correlation
False PolicyFalse Treatment Group
c2.1458 **
(2.0641)
2.4424 *
(1.7236)
3.1507 **
(2.3493)
3.4255 ***
(5.3029)
2.1946 ***
(3.2215)
3.3903 **
(2.2374)
2.6173 **
(2.1781)
2.0952 **
(2.1178)
Ws×Tm−0.1502 **
(−2.1006)
−0.1003 ***
(−4.5817)
−0.0718 **
(−2.2104)
−0.0946
(−1.1218)
−0.0139
(−1.3224)
−0.1137 ***
(−3.5236)
−0.1051 **
(−1.9895)
−0.0935 *
(−1.7749)
Ws×Tm direct −0.6214 ***
(−3.1537)
Ws×Tm
indirect
−0.3346 **
(−2.0928)
Control variableYesYesYesYesYesYesYesYes
Individual fixed effectYesYesYesYesYesYesYesYes
Time fixed effectYesYesYesYesYesYesYesYes
ρ------------------------------------------0.0521 ***
R281.9039 79.6151 80.7433 85.7550 82.8031 83.3246 81.7378 85.8973
F30.1218 *** 30.8414 *** 43.1769 *** 39.1093 *** 29.5972 *** 33.2710 *** 33.5989 *** ------
Note: *, **, and *** indicate that the variable is significant at the level of 10%, 5%, and 1%, respectively.
Table 5. Estimation results of the impact of pilot policies on mechanism variables.
VariableIndustrial StructureSewage TreatmentWater RecyclingTechnological ProgressWater Price Reform
The Proportion of the Primary IndustryThe Proportion of the Secondary IndustryThe Proportion of the Tertiary Industry
c4.8541 *
(1.7765)
3.8033 ***
(2.9682)
4.1168 **
(2.0827)
5.1860 *
(1.8034)
3.3196 ***
(4.9255)
4.2345 **
(2.0783)
5.5685 *
(1.8134)
Ws×Tm−0.0983 ***
(−3.2129)
0.2349
(0.9657)
0.0904 ***
(3.6519)
0.0716 ***
(4.1627)
0.0511 **
(2.0214)
0.0674 ***
(2.9519)
0.0908 **
(2.0126)
Ws×Tm2012−0.0874
(−1.1902)
0.1721
(0.8118)
0.0823
(0.8982)
0.0459
(1.0810)
0.0323
(0.9398)
0.0470
(0.8695)
0.0631
(0.7347)
Ws×Tm2013−0.0926
(−1.2187)
0.1973
(0.7151)
0.0971
(0.8105)
0.0502
(0.9783)
0.0379
(1.2635)
0.0491
(0.9596)
0.0783
(0.7972)
Control variableYesYesYesYesYesYesYes
Individual fixed effectYesYesYesYesYesYesYes
Time fixed effectYesYesYesYesYesYesYes
R282.092583.326082.638584.895683.124182.939481.2271
F31.0554 ***31.9438 ***31.7067 ***29.0413 ***31.4709 ***32.1822 ***31.8850 ***
Note: *, **, and *** indicate that the variable is significant at the level of 10%, 5%, and 1%, respectively.
Table 6. Estimation results of the mechanism test.
VariableWater Pollution Intensity
c5.1160 *
(1.7687)
3.7446 **
(2.1513)
3.2684 ***
(4.5652)
4.0531 *
(1.8104)
4.1692 **
(1.9868)
Ws×Tm−0.1069 **
(−2.0405)
−0.0947 ***
(−4.8390)
−0.0908 *
(−1.7476)
−0.1076 ***
(−3.4282)
−0.0973 **
(−2.1314)
Is−0.1736 **
(−1.9928)
St −0.1985 *
(−1.8049)
Wr −0.1679 ***
(−4.5345)
Tp −0.2137 **
(−2.0684)
Pr −0.1316 *
(−1.7551)
Control variableYesYesYesYesYes
Individual fixed effectYesYesYesYesYes
Time fixed effectYesYesYesYesYes
R284.179283.584885.765083.975383.7839
F32.2216 ***31.9834 ***29.2937 ***31.7465 ***32.4617 ***
Note: *, **, and *** indicate that the variable is significant at the level of 10%, 5%, and 1%, respectively.
Table 7. Estimation results of time heterogeneity.
VariableFirst Batch of Pilot CitiesSecond Batch of Pilot Cities
c3.1673 *
(1.7280)
2.9842 **
(1.9737)
Ws×Tm2014−0.1300 *
(−1.6948)
------
Ws×Tm2015−0.1627 **
(−2.1015)
−0.1384 *
(−1.7029)
Ws×Tm2016−0.2176 ***
(−4.5439)
−0.1851 ***
(−3.7656)
Ws×Tm2017−0.1690 **
(−2.0682)
−0.2123 **
(−2.1140)
Ws×Tm2018−0.1569 **
(−1.9834)
−0.1420 **
(−2.0318)
Ws×Tm2019−0.1328 *
(−1.7153)
−0.1215 *
(−1.6994)
Ws×Tm2020−0.1075 *
(−1.7306)
−0.0921 *
(−1.7023)
Control variableYesYes
Individual fixed effectYesYes
Time fixed effectYesYes
R276.246273.5349
F41.3535 ***39.2776 ***
Note: *, **, and *** indicate that the variable is significant at the level of 10%, 5%, and 1%, respectively.
Table 8. Estimation results of regional heterogeneity.
VariableHigh Economic Development LevelLow Economic Development LevelAbundant Water Resource EndowmentInsufficient Water Resource EndowmentHigh Environmental Regulation IntensityLow Environmental Regulation Intensity
c4.0468 **
(2.0659)
4.2143 **
(1.9937)
5.2001 *
(1.6765)
3.8815 ***
(3.3386)
5.0087 ***
(3.3043)
4.1569 **
(2.0654)
Ws×Tm−0.0715 ***
(−3.2126)
−0.1786 **
(−2.0543)
−0.1494 ***
(−4.1538)
−0.0931 **
(−2.1074)
−0.1002 **
(−1.9961)
−0.1438 ***
(−4.2742)
Control variableYesYesYesYesYesYes
Individual fixed effectYesYesYesYesYesYes
Time fixed effectYesYesYesYesYesYes
R282.5242 81.3791 79.9189 77.8780 79.5128 80.7827
F42.7923 *** 42.2014 *** 41.4396 *** 35.3293 *** 43.2539 *** 41.8875 ***
Empirical p-value0.0427 **0.0382 **0.0619 *
Note: *, **, and *** indicate that the variable is significant at the level of 10%, 5%, and 1%, respectively.
Publisher’s Note: MDPI stays neutral with regard to jurisdictional claims in published maps and institutional affiliations.

