Article

The Extraction Method of Alfalfa (Medicago sativa L.) Mapping Using Different Remote Sensing Data Sources Based on Vegetation Growth Properties

1
Key Laboratory of Grassland Resources of the Ministry of Education, College of Grassland, Resources and Environment, Inner Mongolia Agricultural University, Hohhot 010018, China
2
Hulunber Grassland Ecosystem National Observation and Research Station, Institute of Agricultural Resources and Regional Planning, Chinese Academy of Agricultural Sciences, Beijing 100081, China
*
Authors to whom correspondence should be addressed.
Land 2022, 11(11), 1996; https://doi.org/10.3390/land11111996
Submission received: 10 October 2022 / Revised: 1 November 2022 / Accepted: 3 November 2022 / Published: 7 November 2022
(This article belongs to the Special Issue Land Cover and Land Use Mapping Using Satellite Image)

Abstract

:
Alfalfa (Medicago sativa L.) is one of the most widely planted forages due to its useful characteristics. Although alfalfa spatial distribution is an important source of basic data, manual surveys incur high survey costs, require large workloads and confront difficulties in collecting data over large areas; remote sensing compensates for these shortcomings. In this study, the time-series variation characteristics of different vegetation types were analyzed, and the extraction method of alfalfa mapping was established according to different spatial- and temporal-resolution remote sensing data. The results provided the following conclusions: (1) when using the wave peak and valley number of normalized difference vegetation index (NDVI) curves, in the study area, the number of wave peak needed to be greater than 2 and the number of wave valley needed to be greater than 1; (2) 91.6% of alfalfa sampling points were extracted by moderate resolution imaging spectroradiometer (MODIS) data using the wave peak and valley method, and 5.0% of oats sampling points were extracted as alfalfa, while no other vegetation types met these conditions; (3) 85.3% of alfalfa sampling points were identified from Sentinel-2 multispectral instrument (MSI) data using the wave peak and valley method; 6.0% of grassland vegetation and 8.7% of oats satisfied the conditions, while other vegetation types did not satisfy this rule; and (4) the temporal phase selection was very important for alfalfa extraction using single-time phase remote sensing images; alfalfa was easily separated from other vegetation at the pre−wintering stage and was more difficult to separate at the spring regreening stage due to the variability in the alfalfa overwintering rate; the overall classification accuracy was 92.9% with the supervised classification method using support vector machine (SVM) at the pre-wintering stage. These findings provide a promising approach to alfalfa mapping using different remote sensing data.

1. Introduction

Alfalfa (Medicago sativa L.), a perennial herb, is widely planted because of its useful characteristics among many forages [1]. Alfalfa has a high nutritional value, and its crude protein content is one of the highest among forages [2,3,4]. The yield of alfalfa is relatively high, and alfalfa should be harvested every 30 d to 35 d during the growing season due to its relatively strong regrowth capability [5]. Fall dormancy is a useful trait for alfalfa, nondormant cultivars generally have poor winter survival rates, while dormant cultivars are very winter-hardy. Different alfalfa varieties can be selected according to the climatic characteristics of different regions [6,7]. As a leguminous forage, alfalfa has a strong nitrogen fixation ability and can improve soil fertility. Research has suggested that alfalfa that stands for as little as 2 years has the potential to significantly benefit the soil nitrogen status [8]. In light of the extraordinarily valuable traits mentioned above, alfalfa is one of the forages with the highest intensive production potential and is cultivated in more than 80 countries [9].
As one of the most important types of basic data, alfalfa planting area data are still dominated by manual surveys, which have some problems, such as high survey costs, large workloads and difficulties in completing large-area surveys [10]. Remote sensing technology is macroscopic, dynamic, fast and efficient, thus compensating for the shortcomings of manual surveys [11,12]. In terms of vegetation classification objects, single plant type or fine classification identification research is increasing, such as in studies that mapped rice (Oryza sativa L.) [13], corn (Zea mays L.) [14], and wheat (Triticum aestivum L.) [15], etc. Moderate resolution imaging spectroradiometer (MODIS), Landsat 8 operational land imager (OLI), Sentinel-2 multispectral instrument (MSI) and other multiplatform and multiresolution remote sensing data have been widely used in vegetation mapping [16,17,18], among which MODIS can provide remote sensing data at a lower spatial resolution and higher temporal resolution, while Landsat 8 OLI and Sentinel-2 MSI data have the opposite characteristics [19,20]. Classification methods include both traditional pixel-based and, more recently, object-based image analysis methods [21]. Classifiers and algorithms have evolved from the minimum distance method, maximum likelihood method, and decision trees, etc., to machine learning and deep learning methods [22,23,24].
At present, some alfalfa studies have been conducted based on remote sensing technology [25,26,27]. Starks et al., considered that canopy reflectance could help in the rapid assessment of nutritive values over large areas devoted to growing alfalfa and in assessing the nutritive quality in real time [28]. Zhou et al., illustrated that combining multiple optical sensors with fine spatial resolutions and/or fusing radar with optical remote sensing to increase the temporal resolution are promising approaches to detect frequent alfalfa-harvesting events and other hay-harvesting activities [29]. Specifically, alfalfa is one of several vegetation types involved in remote sensing mapping [30,31], and a number of studies have focused on the remote sensing identification of alfalfa. Ashourloo et al., developed a new method to detect alfalfa based on the differences in red and near infrared reflectance values between alfalfa and other crops [32]. Hong et al., improved the classification accuracy between alfalfa and grassland by combining structural information from high-resolution scanning synthetic aperture radar (ScanSAR) and MODIS data [33].
The main goal of this study was to find an extraction method for mapping alfalfa from different remote sensing data based on vegetation growth properties. To achieve this goal, field vegetation type surveys were conducted on the intensive forage planting area in Ar Horqin Banner, Chifeng City, Inner Mongolia Autonomous Region, China. Then, the time-series variation characteristics of different vegetation types were analyzed. Finally, the alfalfa mapping extraction method was established according to remote sensing data with different spatial and temporal resolutions.

2. Materials and Methods
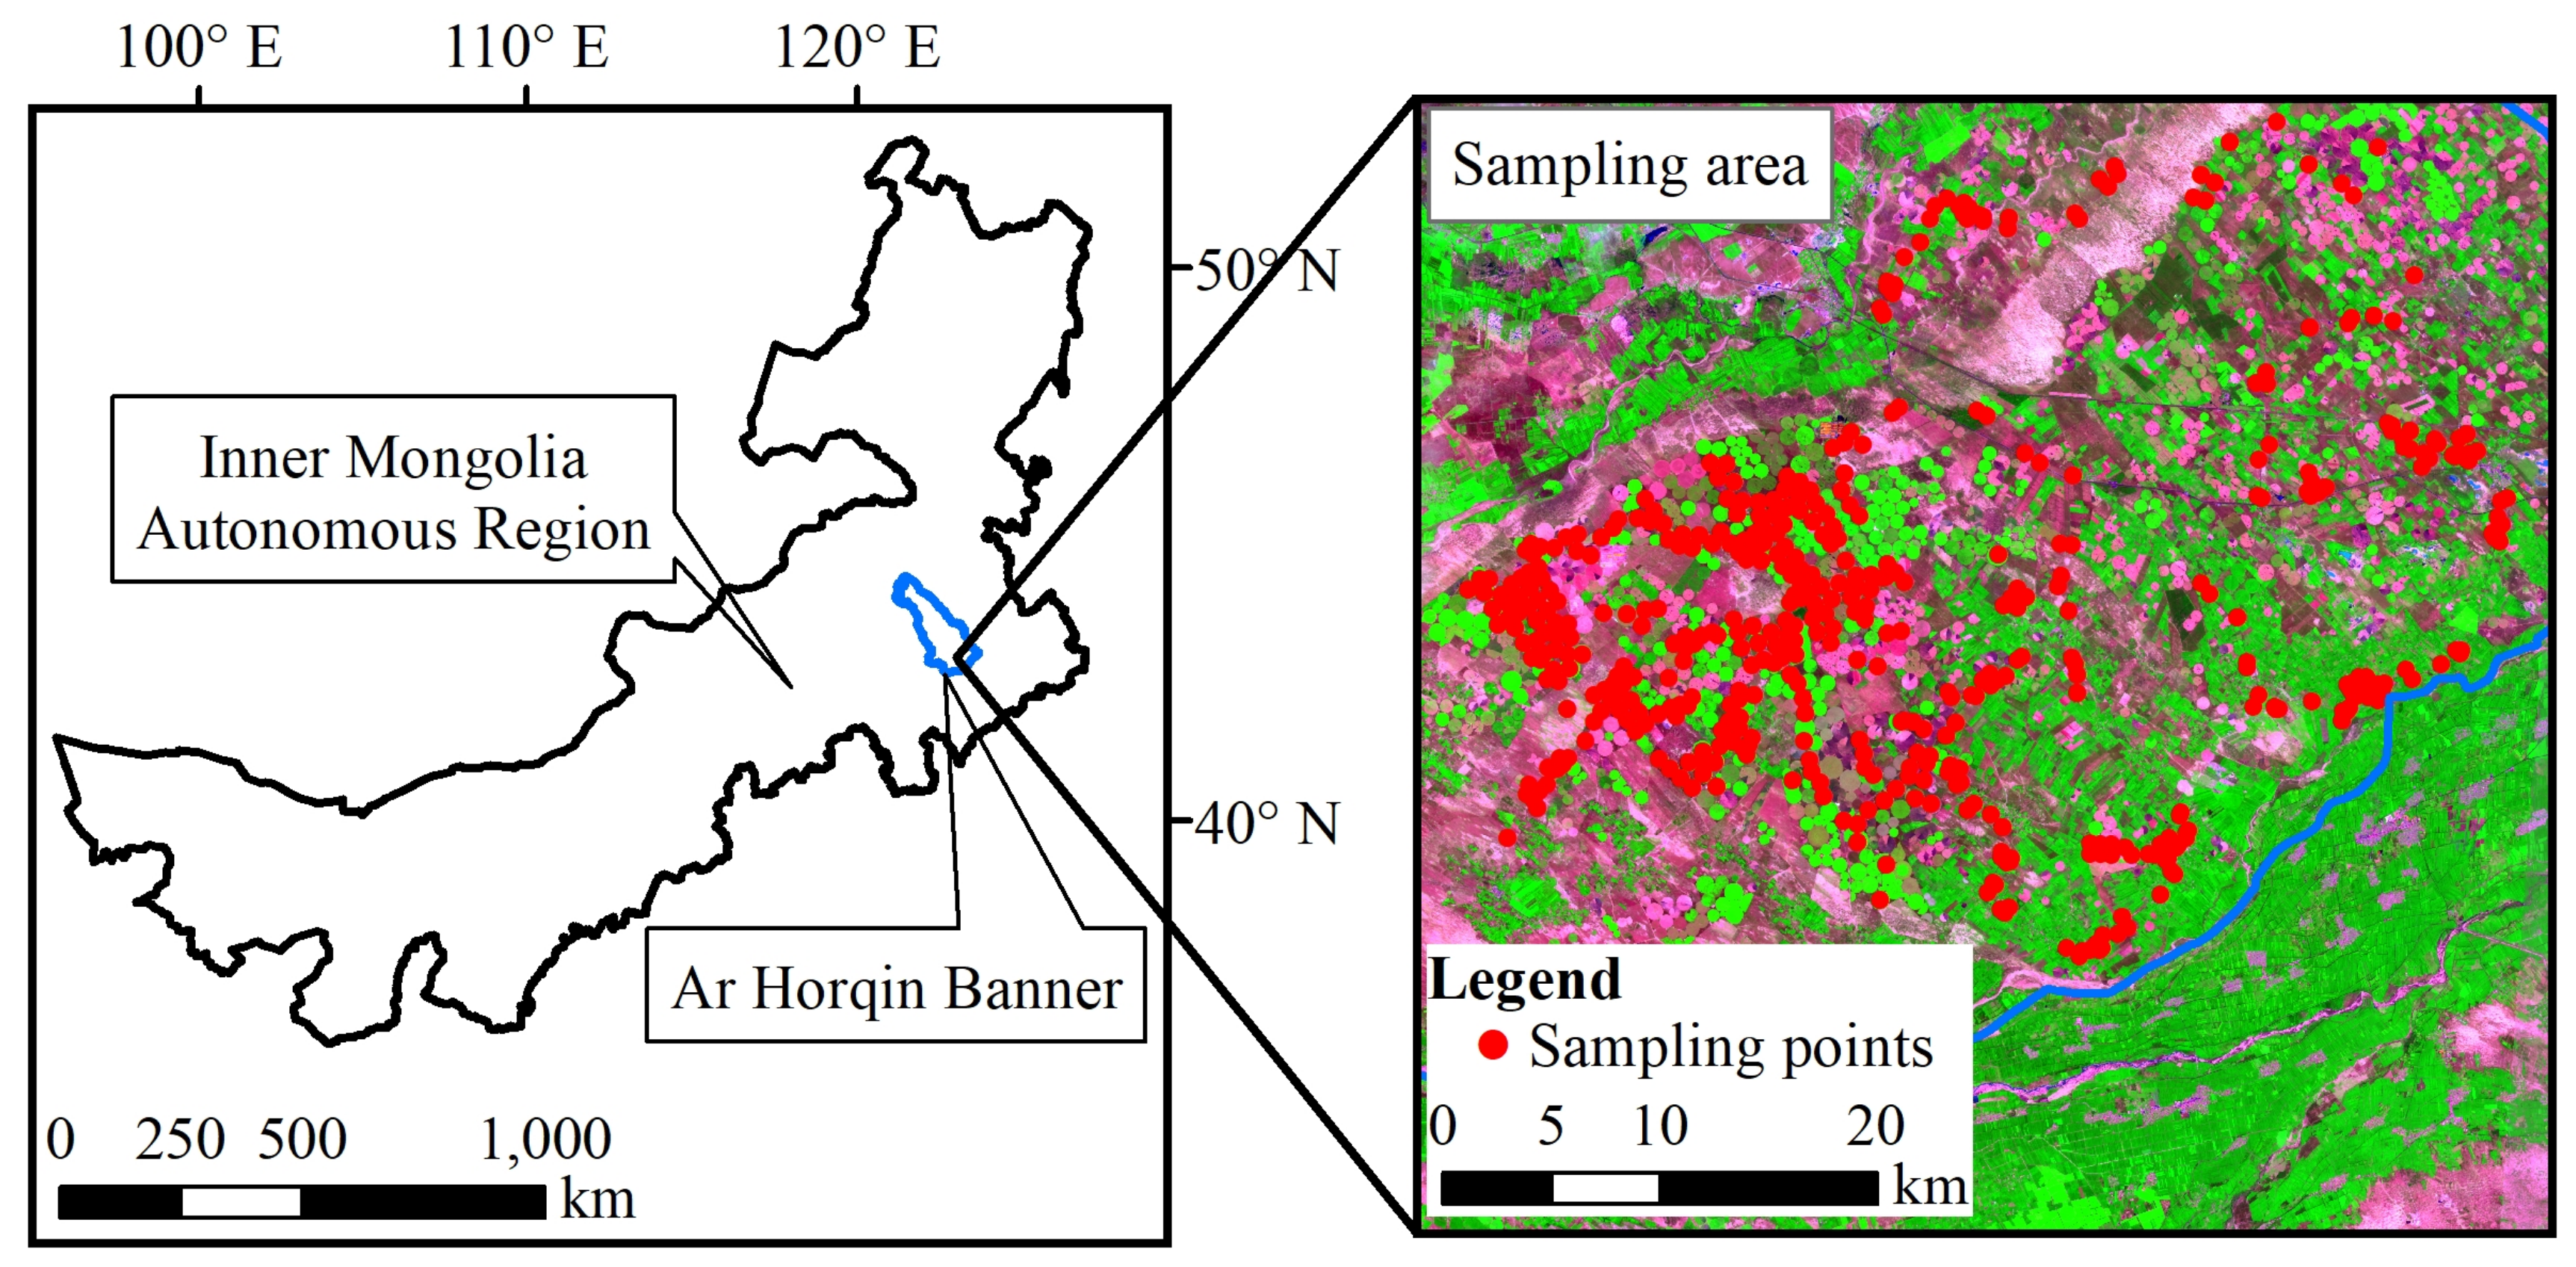
2.1. Study Area

The study area was located in the southern part of Ar Horqin Banner, Chifeng City, Inner Mongolia Autonomous Region, China (Figure 1). The study area has a typical continental climate with an average annual temperature of 6.4 °C, and the annual precipitation ranges from 300 mm to 400 mm. Ar Horqin Banner is an alfalfa-planting standardization demonstration area where the forage-planting area is large. Grassland is the main land cover type in Ar Horqin Banner. The largest area planted with forage comprises alfalfa and oats, and these crops are mainly planted with corn and mung bean (Vigna radiata L.), etc.

2.2. Field Data and Remote Sensing Data

According to the research objectives, a sampling area was set up in the southern region of Ar Horqin Banner, where the distribution of alfalfa and oats is more concentrated and other crops were also widely distributed. The field survey of vegetation types was conducted from July to August 2020 using a global positioning system (GPS, with a position accuracy close to 5 m) to record the latitude and longitude, vegetation types and growth information. The surveyed vegetation types included alfalfa, oats, corn, sunflower and grassland vegetation. Sentinel-2 MSI Level-2A products (20 m spatial resolution) and MODIS surface reflectance products (MOD09Q1, 250 m spatial resolution) were used in this study. It is necessary to ensure that the pixels corresponding to the ground sampling points are pure pixels when analyzing remote sensing images using ground sampling points. A total of 492 ground sampling points were collected and could be analyzed as a pure pixels with the Sentinel-2 MSI data. Some ground sampling points could not be analyzed as a pure pixels due to the MODIS spatial resolution, and 179 ground sampling points were selected by visual interpretation for remote sensing data analysis with the MODIS data (Table 1).
The MOD09Q1 products were obtained from the National Aeronautics and Space Administration (NASA; https://ladsweb.modaps.eosdis.nasa.gov, accessed on 22 May 2022). These products include 8-day surface reflectance data at a 250 m spatial resolution, and the MODIS images were reprojected and converted into Georeferenced Tagged Image File (GeoTIFF) files with the HDF-EOS to GeoTIFF Conversion Tool (HEG). The Sentinel-2 MSI data comprises a constellation of two polar-orbiting satellites (Sentinel-2A and Sentinel-2B, 10 days at the equator with one satellite) and carries an optical instrument payload that samples 13 spectral bands: four bands at the 10 m spatial resolution, six bands at 20 m and three bands at 60 m. The Sentinel-2 MSI Level-2A products were obtained from the European Space Agency (ESA; https://scihub.copernicus.eu, accessed on 16 May 2022). The remote sensing image processing and normalized difference vegetation index (NDVI) calculation were implemented in the ENVI 5.3 software with Universal Transverse Mercator (UTM, zone 50 N) and the geographic coordinate system of World Geodetic System 1984 (WGS84).

2.3. Methodology

2.3.1. Alfalfa Extraction Method

For the MODIS data, the alfalfa extraction method was performed using the characteristics that multiple peaks and valleys are generated in the NDVI curve during alfalfa production due to multiple cuttings. For the Sentinel-2 MSI data, in addition to using the above methods, the analysis focused on the differences between alfalfa and other vegetation at the spring regreening, peak growth and pre-wintering stages; then, machine learning was used for extraction. The ground vegetation type survey data from 2020 were used for the model construction and accuracy evaluation. NDVI was calculated as follows:
NDVI = NIR     RED   NIR + RED
where NIR is the surface reflectance in the near infrared band and RED is the surface reflectance in the red band.

2.3.2. NDVI Smoothing Method

Long-time-series NDVI data need to be smoothed before they can be used due to the presence of multiple interfering factors. The Savitzky-Golay filter is able to maintain the curve shape but requires the data to be distributed at fixed time intervals [34], which may not otherwise be a true reflection of the actual situation. This method was used for the MODIS 8-day reflectance synthesis product, the points of the window were set to 5, and the polynomial order was set to 2. The same method was used for the Sentinel-2 NDVI data, and because the Sentinel-2 NDVI needed to be interpolated into daily data, the window points were set to 15 to maintain relative uniformity with the MODIS NDVI data. This process was implemented in the Origin 2021 software.

2.3.3. Temporal NDVI Interpolation Method

The NDVI data obtained by Sentinel-2 are not fixed time due to the influence of image acquisition features and cloud contamination, so the temporal NDVI data obtained by Sentinel-2 were first interpolated to daily data with a linear interpolation method. This process was implemented in the Origin 2021 software.

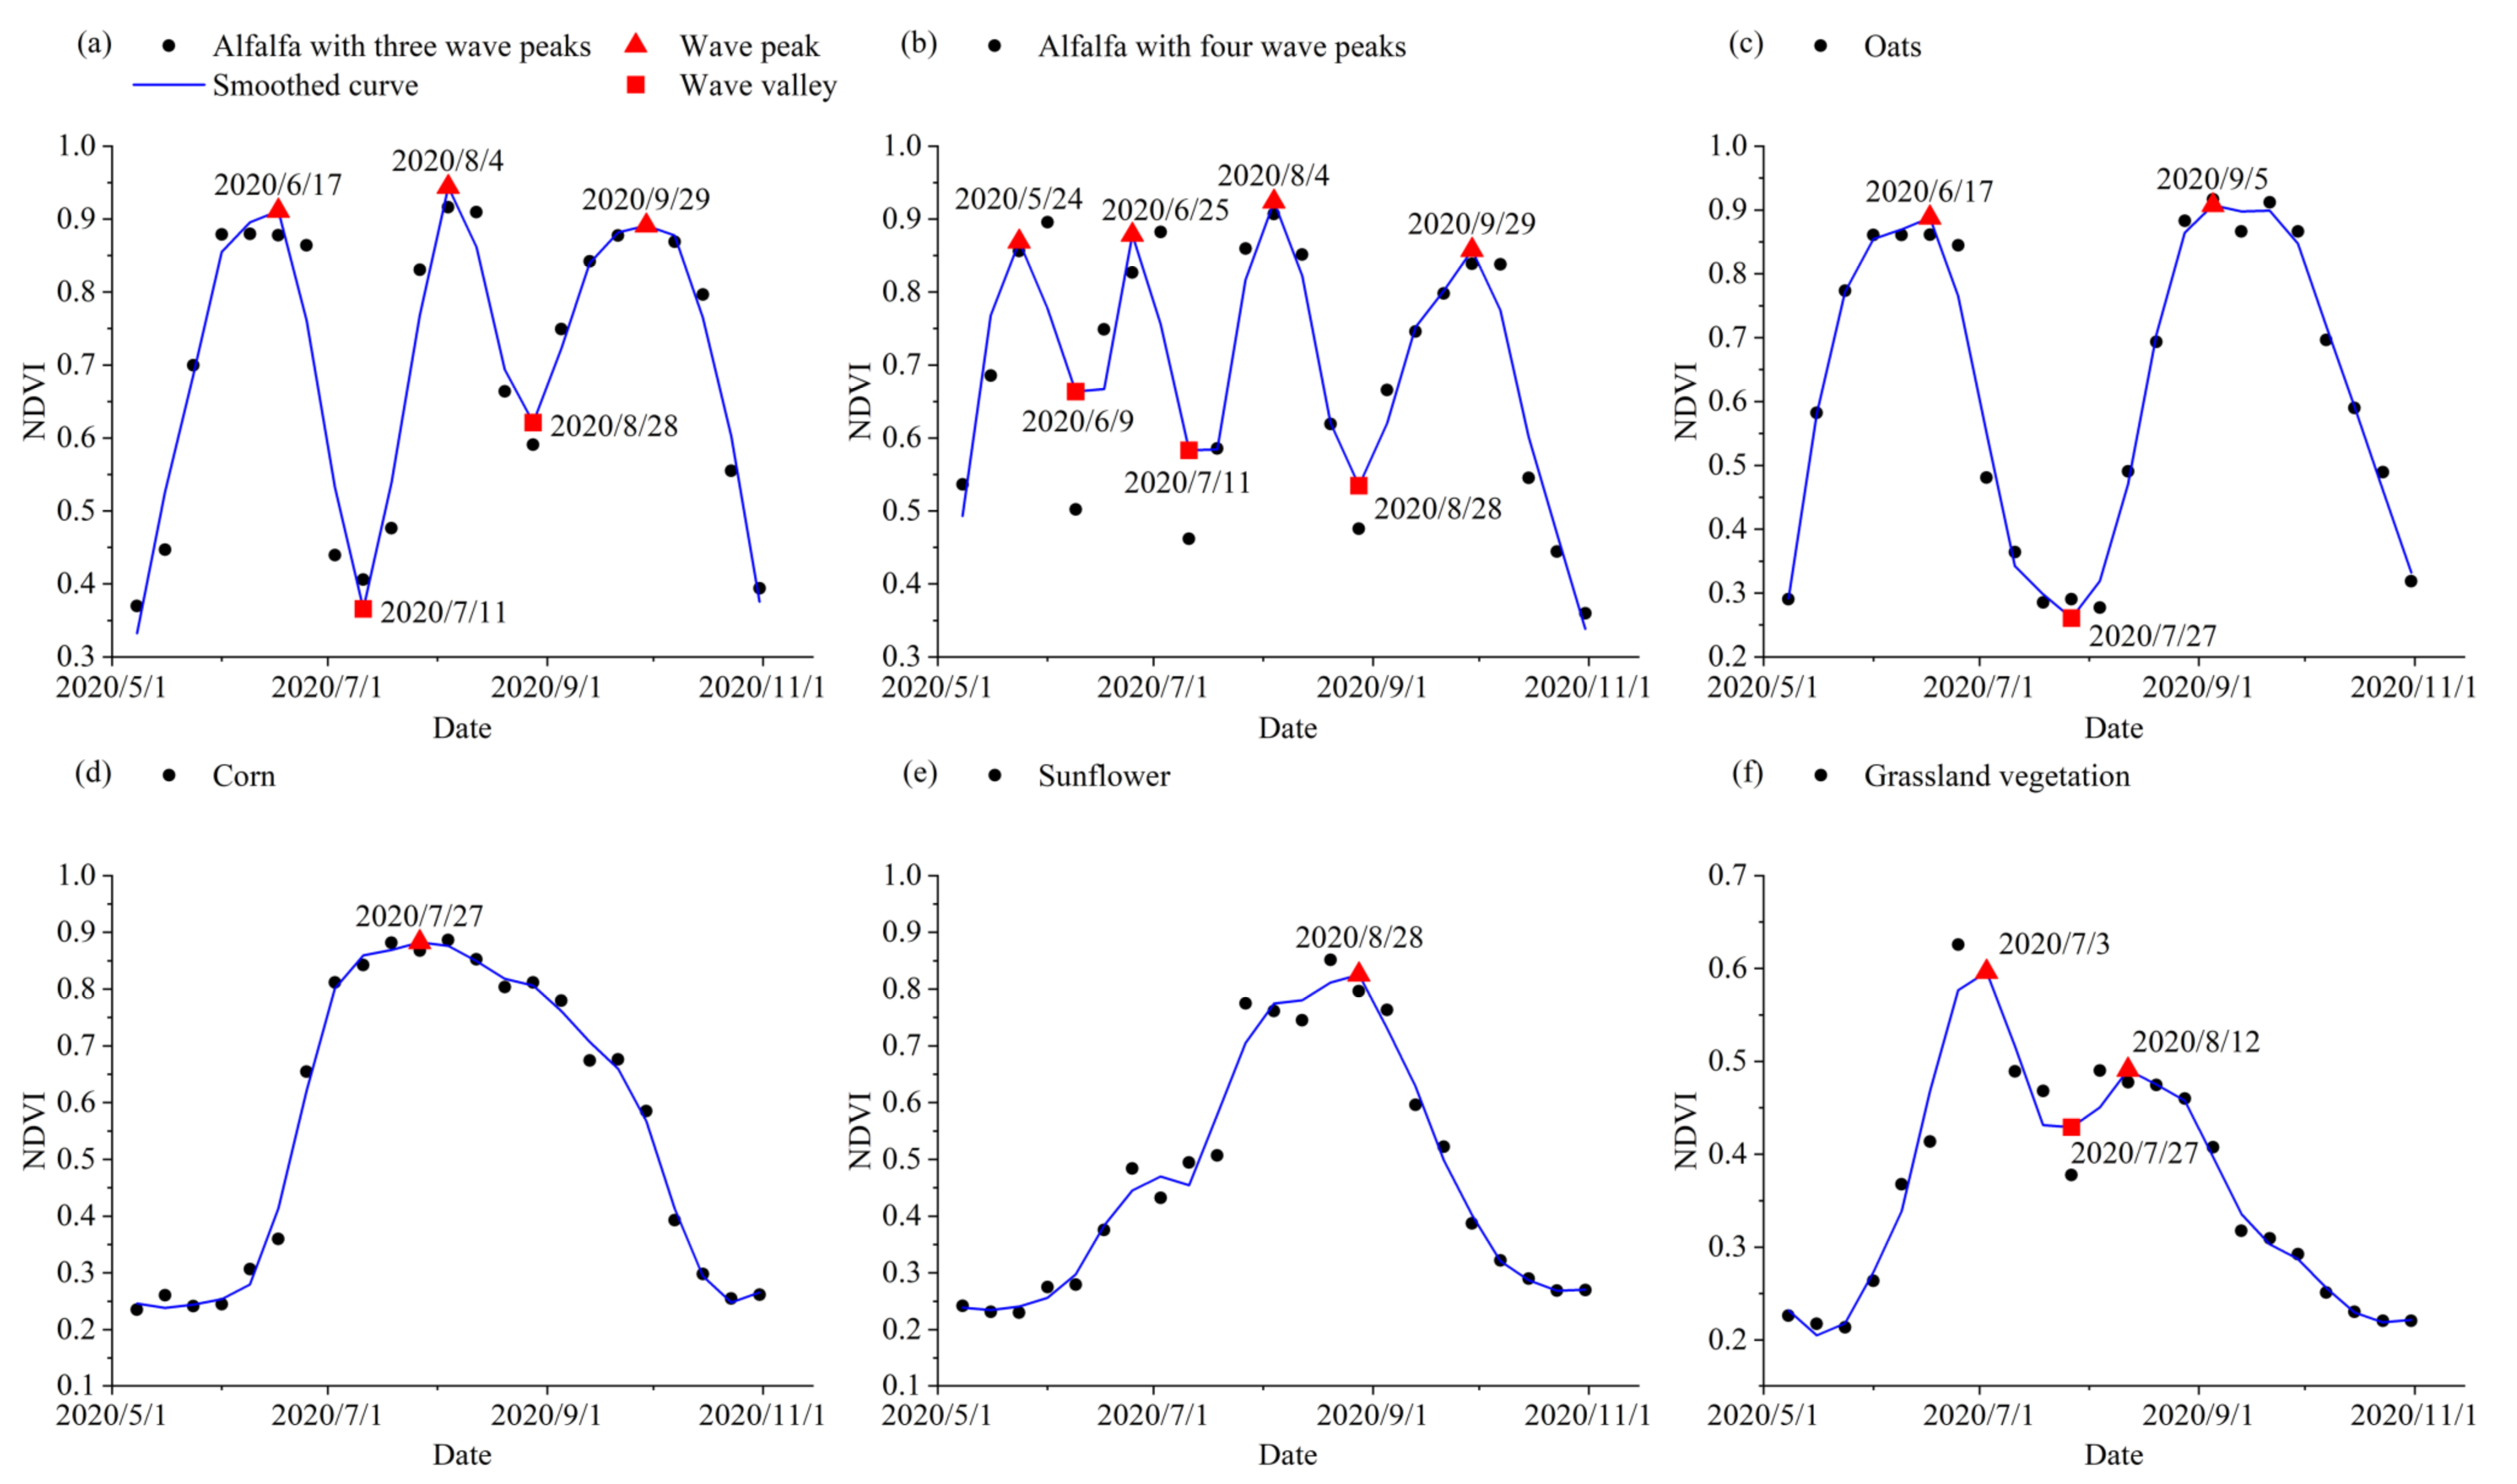
2.3.4. Wave Peak and Valley Identification Method

The MODIS NDVI wave peak baseline used the minimum value; the wave valley baseline used the maximum value; the identification method used the local maximum; and the number of local points was set to 2. The wave peak and valley of the Sentinel-2 NDVI were identified using the same method, with the number of local points set to 15, similar to the smoothing method. This process was implemented in the Origin 2021 software.

3. Results

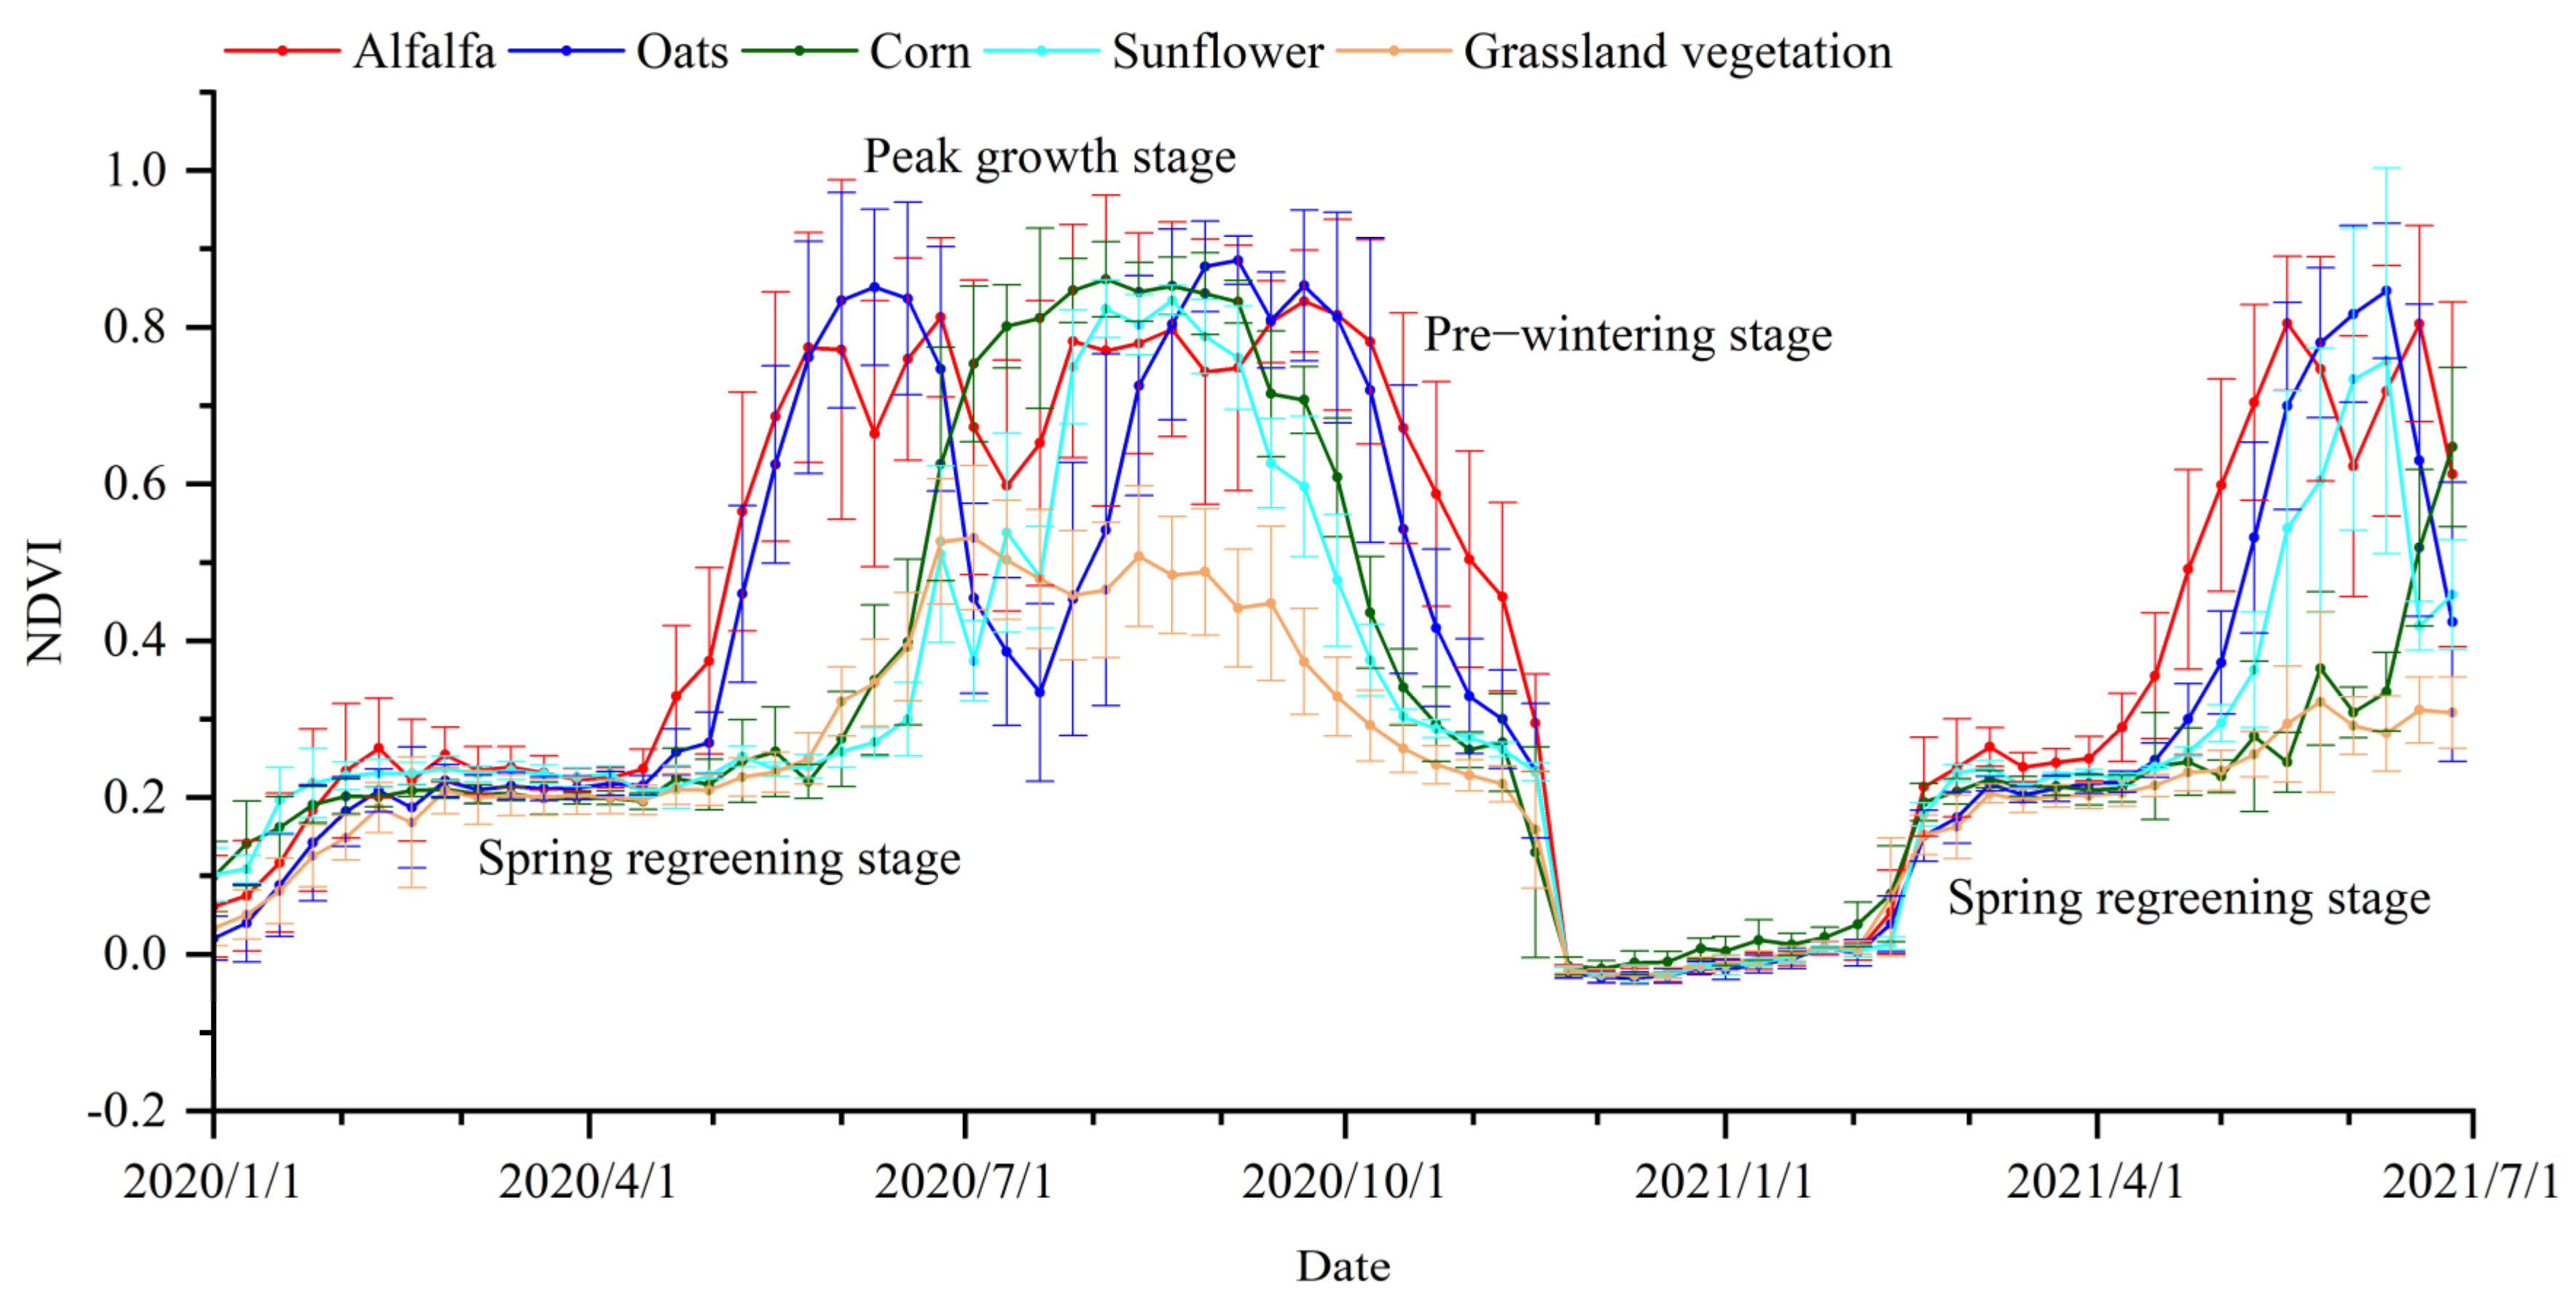
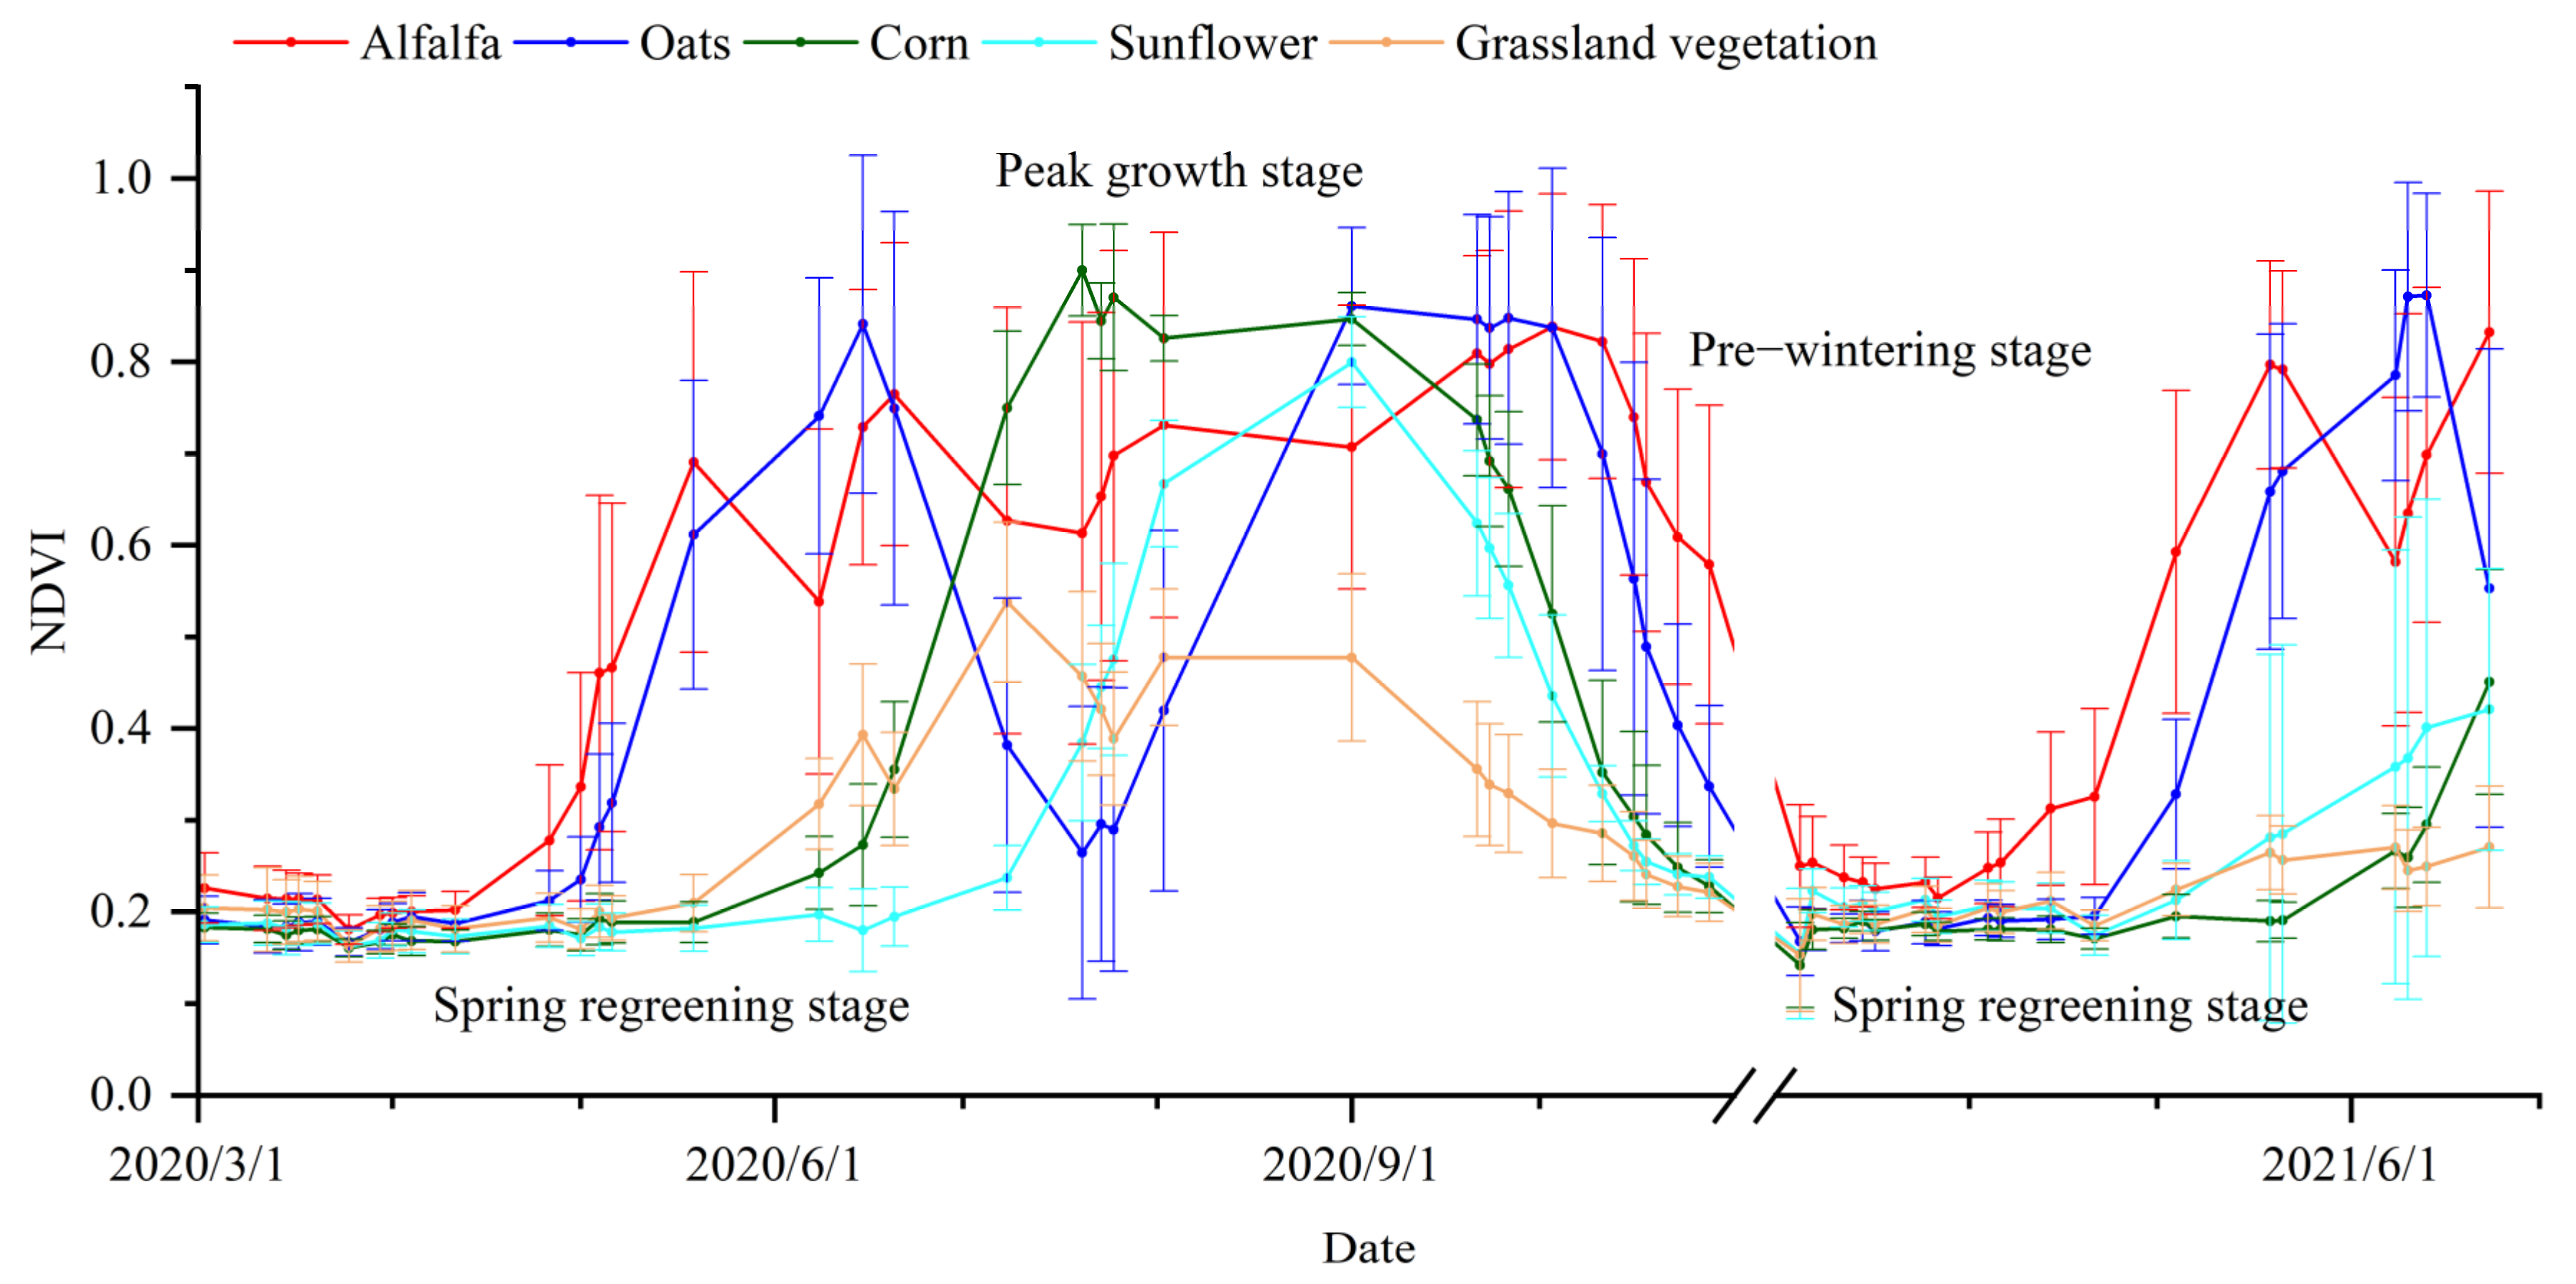
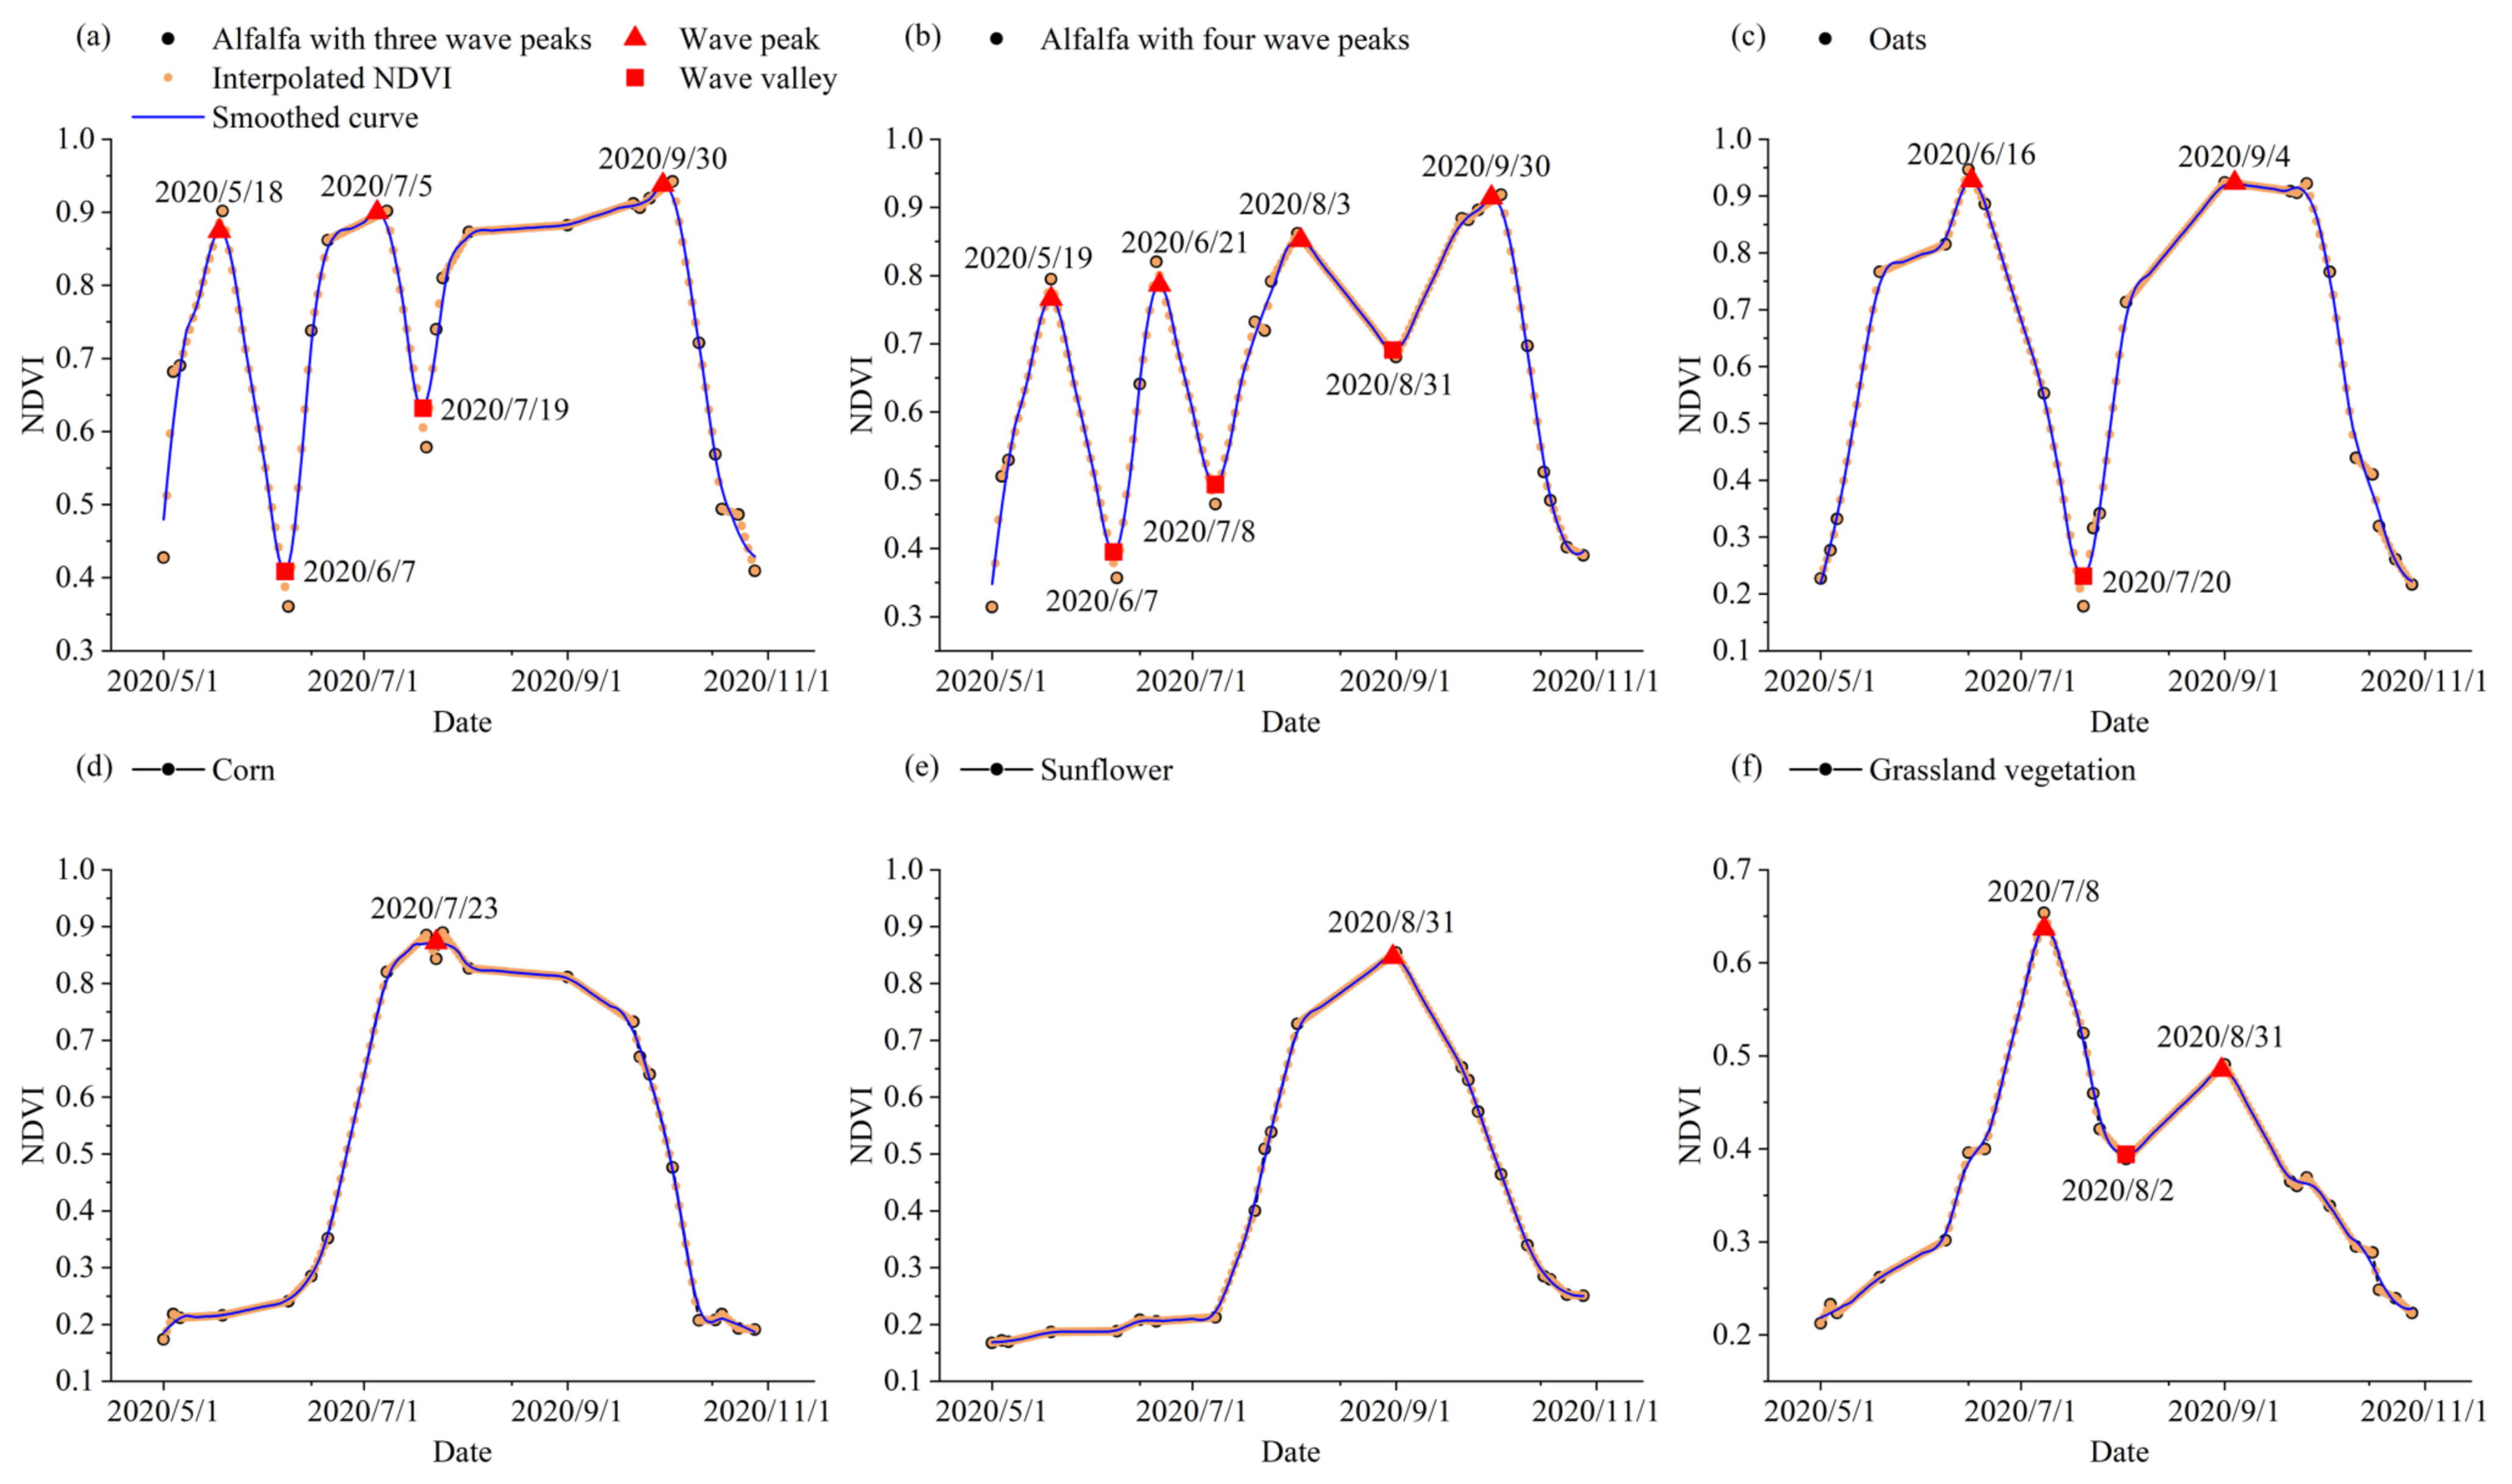
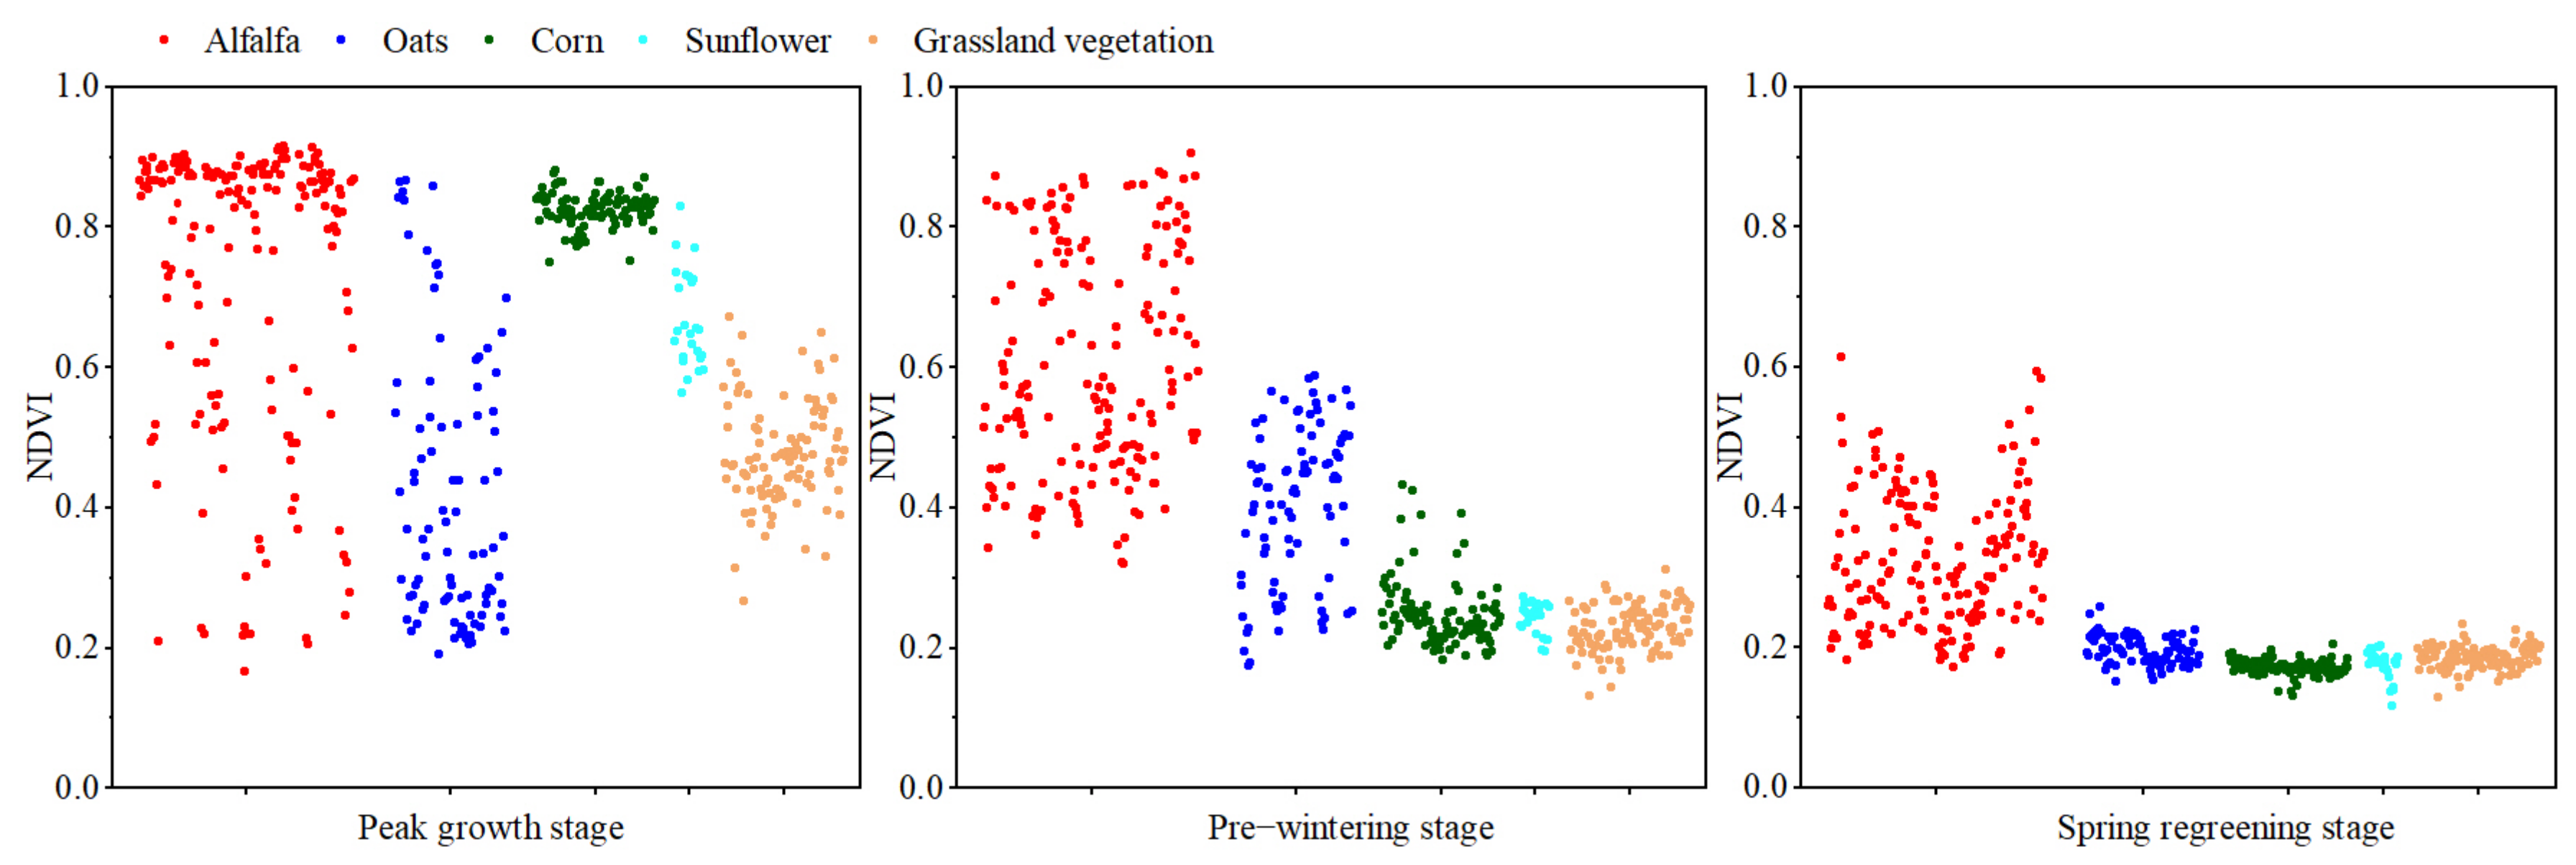
3.1. Temporal NDVI Variation Characteristics of Different Vegetation Types

The biological characteristics of different vegetation types are the basis of remote sensing image classification, and they can provide change characteristics of vegetation growth conditions by using long-series vegetation indices. Figure 2 shows the NDVI of different vegetation types derived from the MODIS data using sampling points from January 2020 to June 2022, the average NDVI reflected the generally growth of different vegetation types, and the higher the value the better the growth. The standard deviation of the NDVI reflected the growth dispersion degree of the same vegetation type.
Alfalfa is a perennial plant and is different from other vegetation types at some growth stages, especially during the spring regreening, peak growth and pre-wintering stages. Alfalfa had the highest average NDVI (0.4915) at the spring regreening stage (23 April 2021), which was significantly different from other vegetation types (Kruskal–Wallis test was implemented in the Origin 2021 software because the data did not conform to the normal distribution, p < 0.01, the following ANOVAs were identical). There was no significant difference between oats, corn, sunflower and grassland vegetation, with average NDVI values of 0.3003, 0.2456, 0.2585 and 0.2320, respectively. Grassland vegetation had the lowest NDVI values at most time points at the peak growth stage (May to September), with values between 0.2 and 0.6, while the NDVI values of alfalfa, oats, corn and sunflower reached 0.2 to 0.9; the standard deviations of the NDVI values of alfalfa and oats were generally larger than those of corn, sunflower and grassland vegetation. Alfalfa also had the highest average NDVI value (0.5876) at the pre-wintering stage (23 October 2020), which was significantly different from those of the other vegetation types; the average NDVI values of oats, corn, sunflower and grassland vegetation were 0.4167, 0.2938, 0.2877 and 0.2418, respectively, and significant differences were found between oats and grassland vegetation, with no significant difference between the other vegetation types.
Alfalfa can be cut several times a year in the study area, and the NDVI values significantly decreased after cutting; thus, there were multiple wave peaks and valleys. Corn and sunflower had only one wave peak and no wave valley because they are harvested only once a year. Although oats are annual plants, their series reflected two wave peaks and one wave valley in the study area because they were mainly harvested for nutrients as forage before the seeds were matured and were then planted a second time. Grassland vegetation, a natural ecosystem type, had two wave peaks and one wave valley due to its regeneration.

3.2. Extraction Method of Alfalfa Mapping from the MODIS Data

Alfalfa can be mapped in large-scale planting areas using the MODIS data. The MODIS NDVI data from May to October were used at the vegetation growth stage to minimize the effects of uncertain NDVI values and great variations in NDVI curves. The NDVI curves had to be smoothed first, and Savitzky-Golay filter was used to very effectively smooth the data. The 8-day NDVI data provided a good reflection of vegetation growth processes (Figure 3). In particular, alfalfa is cut frequently during the growing season, and the times and numbers of cuttings can be effectively captured. The wave peak and valley findings of the NDVI series of different vegetation types are crucial, and the local maximum method can identify the wave peak and valley more accurately (Figure 3). Alfalfa generally has three wave peaks and two wave valleys or four wave peaks and three wave valleys. Oats and grassland vegetation generally have two wave peaks and one wave valley, the NDVI values of the oats wave peaks were closer in time, while the NDVI values of the second grassland wave peak were generally substantially lower than those of the first wave peak. Corn and sunflower had one wave peak with no wave valley.
The alfalfa extraction method was required after the numbers of NDVI wave peak and valley in different vegetation growing seasons were determined. The number of oats, corn, sunflower, and grassland vegetation wave peak should be less than three (zero, one or two) after NDVI smoothing. Corn, sunflower, and grassland vegetation basically satisfied this pattern, with proportions of 63.6%, 100.0% and 100.0%, respectively, but only 45.0% of the oats data satisfied this condition (Table 2). Oats need to be reseeded after the first harvest, which results in the NDVI value of the wave valley being extremely low; hence, the wave valley characteristic was obvious (Figure 3). The proportion of oats wave valley less than two (i.e., zero or one) was 92.5%, while the proportion of alfalfa wave valley greater than one was 91.6%. The alfalfa extraction method was used when the number of wave peak was greater than two and the number of wave valley was greater than one based on the wave peak and valley characteristics of different vegetation types. A total of 98 alfalfa sampling points were extracted from 107 sampling points, a proportion of 91.6%. Only 2 oats sampling points were extracted as alfalfa from 40 sampling points with a proportion of 5.0%, while no other vegetation types met these conditions at the same time.

3.3. Extraction Method of Alfalfa Mapping from the Sentinel-2 Data

3.3.1. Extraction Method of Alfalfa Mapping Based on Supervised Classification

Alfalfa mapping can be conducted in small-scale planting areas using the Sentinel-2 data. Supervised classification is one of the most common methods for remote sensing image classification. The possibility of extracting alfalfa using supervised classification was analyzed at the peak growth stage (2 August 2020), pre-wintering stage (23 October 2020) and spring regreening stage (21 April 2021) based on the dynamic growth change characteristics of different vegetation types. The Jeffries–Matusita (J–M) distance reflects the degree of separation among different classification types; at J–M values in the range of 0–2, they are easily separable when the values are greater than 1.8 and difficult to separate when the values are less than 1.8. As seen from Table 3, there were large disparities between alfalfa and the other vegetation types at different time periods.
Corn and sunflower were easier to distinguish from other vegetation types at the peak growth stage, but the J–M values between alfalfa, oats and grassland vegetation were all less than 1.8, indicating that these three vegetation types were more difficult to separate (Table 3). August is the harvesting period for alfalfa and oats, and the remote sensing image features of these vegetation types after cutting are similar to those of grassland vegetation (Table 4).
The J–M values between alfalfa and the other crops were greater than 1.9 at the pre-wintering stage (Table 3), indicating that alfalfa was more easily separated from other vegetation at this time. Alfalfa and oats were still green in color at this stage due to their regenerative properties before overwintering, while corn showed a light blue color and sunflower showed a similar color to grassland vegetation after harvest (Table 5). The overall classification accuracy was 92.9% by supervised classification (support vector machine, SVM) in this period, in which all alfalfa sampling points could be extracted, though some areas of oats and corn were extracted as alfalfa (Table 6).
Alfalfa started to regreen, and the growth was relatively good compared to other vegetation at the spring regreening stage (21 April 2021), as alfalfa showed a green color while other vegetation did not show a distinct green color (Table 7). This stage is thus theoretically an optimal time window for the extraction of alfalfa using remote sensing, but alfalfa was relatively difficult to separate from oats during the spring regreening stage, with J–M values of 1.6875. This was mainly due to the cold climate in this region and the variability in the overwintering rate of alfalfa. The image characteristics of alfalfa that failed to overwinter are similar to those of oats.

3.3.2. Extraction Method of Alfalfa Mapping Based on NDVI Wave Peak and Valley

The overall NDVI change trend derived from the Sentinel-2 data was similar to that derived from the MODIS data (Figure 4). During the spring regreening stage (21 April 2021), alfalfa had the highest average NDVI value (0.3258), which was significantly different from those of the other vegetation types; the average NDVI values of oats, corn, sunflower and grassland vegetation were 0.1956, 0.1710, 0.1748 and 0.1852, respectively, and there were significant differences between oats and corn and between grassland vegetation and corn. During the peak growth stage (2 August 2020), grassland vegetation had the lowest NDVI values at most time points, and the standard deviations of the NDVI values of alfalfa and oats were generally larger than those of the other vegetation types. During the pre-wintering stage (23 October 2020), alfalfa also had the highest average NDVI value (0.6091), which was significantly different from those of the other vegetation types; the average NDVI values of oats, corn, sunflower and grassland vegetation were 0.4039, 0.2486, 0.2413 and 0.2279, respectively, and the oats value was significantly different from those of corn, sunflower and grassland vegetation, while the other vegetation types were not significantly different.
The wave peak and valley number of the NDVI curves derived from the Sentinel-2 data were also similar to those derived from the MODIS data. Generally, the number of wave peak of alfalfa was greater than two and the number of wave valley was greater than one; oats and grassland vegetation had two wave peak and one wave valley, whereas corn and sunflower had one wave peak with no wave valley.
However, the NDVI series derived from Sentinel-2 cannot provide data at fixed time intervals due to image-acquisition features and cloud contamination. Therefore, the NDVI data derived from Sentinel-2 following smoothing using the Savitzky-Golay filter requires further processing. The results of the temporal NDVI data obtained from Sentinel-2 interpolated to daily data, smoothed by the Savitzky-Golay filter, and from which wave peaks and valleys were identified can be seen in Figure 5; this method can capture the characteristics of different vegetation types throughout the whole growth process.
The wave peak and valley of the NDVI series of different vegetation types were similar overall between the Sentinel-2 and MODIS data (Table 8); the identification accuracies of the oats and corn wave peak were relatively low, while those of corn and sunflower wave valley were also relatively low. Similar to the previous rule based on the number of alfalfa NDVI wave peak and valley, 85.3% of alfalfa could be identified, 6.0% of grassland vegetation and 8.7% of oats satisfied the conditions at the same time, and no corn and sunflower sampling points satisfied this rule.

4. Discussion

4.1. Characteristics of Alfalfa at Different Stages

Alfalfa differs significantly from other vegetation types in terms of its growth characteristics, and characteristics derived from time-series remote sensing imagery provide a valuable information source (Figure 6). Alfalfa generally regreens early as a perennial herbaceous plant, resulting in significantly higher NDVI values than those of other vegetation types. However, a large area of alfalfa may fail to overwinter in this region because of cold meteorological conditions and the winter hardiness of different alfalfa varieties [35]; this explains why this season is a very good time window theoretically, but the actual results are poor. Alfalfa can be cut several times during the growing season [36], and the time and number of cuttings can be obtained from remote sensing data [29]. Alfalfa extractions can be achieved by using a long-series vegetation index based on this feature. In this work, from the regeneration characteristics of alfalfa after cutting, we identified significant differences between alfalfa and other vegetation before overwintering; this stage avoids soil disturbances due to postcutting or from the failure of alfalfa to overwinter after growing for a period of time, and is thus recommended for remote sensing classification tasks based on single time phases.

4.2. Main Influencing Factors of Alfalfa Mapping Extraction Methods

Different methods can be selected to extract alfalfa distributions according to different remote sensing data. In this paper, the MODIS and Sentinel-2 data with different spatial and temporal resolutions were selected, and the possibility of using two alfalfa extraction methods was analyzed according to the remote sensing data characteristics and alfalfa growth characteristics. The extraction method based on the wave peak and valley in a vegetation index series was suitable for obtaining long time-series data, and the more vegetation index data there were available in the growing season, the more favorable this method was for alfalfa extraction. The long time-series vegetation index data had to be smoothed due to data noise, and different smoothing methods and parameter settings affected the smoothing effect [37,38]. The Savitzky-Golay filter was one of the methods applied for vegetation index smoothing and requires a fixed time interval. If the vegetation index cannot provide fixed time interval data, it can be smoothed after a temporal interpolation with a fixed time interval. The determination of wave peak and valley was a key step of the alfalfa extraction method, as the vegetation cutting times, different query methods and parameter settings affected the final results; the local maximum method was determined according to the vegetation growth characteristics in this study. The alfalfa extraction method based on supervised classification requires ground samples to participate in model training [39], and the separability of different vegetation types determines the effectiveness of the classification results. Temporal phase selection is very important for alfalfa extraction.

5. Conclusions

In this study, we focused on deriving a method to extract alfalfa mapping from different remote sensing data sources based on vegetation growth properties. Alfalfa is significantly different from other vegetation types, especially because it can be cut several times throughout the growth stage. The results showed that the utilized method is effective for alfalfa mapping using the wave peak and valley number of the NDVI curves during the growth stage, including curves from the MODIS and Sentinel-2 remote sensing data; in addition, the final classification results were affected by the NDVI data interpolation, smoothing, and wave peak and valley identification methods. Temporal phase selection was found to be very important for extracting alfalfa from single-time phase remote sensing images. Alfalfa was easily separated from other vegetation types during the pre-wintering stage, but was more difficult to separate at the spring regreening stage due to variability in the overwintering rate of alfalfa.
These findings can provide a promising approach to alfalfa mapping using different remote sensing data, and the wave peak and valley number of NDVI curves can be used for alfalfa identification because alfalfa can be cut several times in one year. The images during the pre-wintering stage can be selected for supervised classification based on the regenerative properties of alfalfa.

Author Contributions

R.W.: writing—original draft, data curation, methodology, formal analysis. F.S.: conceptualization, methodology, writing–review and editing, funding acquisition. D.X.: conceptualization, methodology, data curation, visualization, software, writing–review and editing, funding acquisition. All authors have read and agreed to the published version of the manuscript.

Funding

This research was funded by the following projects: Key Projects in Science and Technology of Inner Mongolia (2021ZD0031), Innovation Team of “Genetic Improvement and Utilization of Native Grass Germplasm Resources in Inner Mongolia”, Special Funding for Modern Agricultural Technology Systems from the Chinese Ministry of Agriculture (CARS-34).

Data Availability Statement

The data presented in this study are available on request from the corresponding author.

Conflicts of Interest

The authors declare no conflict of interest.

References

  1. Testa, G.; Gresta, F.; Cosentino, S.L. Dry matter and qualitative characteristics of alfalfa as affected by harvest times and soil water content. Eur. J. Agron. 2011, 34, 144–152. [Google Scholar] [CrossRef]
  2. Lamb, J.F.S.; Sheaffer, C.C.; Rhodes, L.H.; Sulc, R.M.; Undersander, D.J.; Brummer, E.C. Five decades of alfalfa cultivar improvement: Impact on forage yield, persistence, and nutritive value. Crop Sci. 2006, 46, 902–909. [Google Scholar] [CrossRef] [Green Version]
  3. Kallenbach, R.L.; Nelson, C.J.; Coutts, J.H. Yield, quality, and persistence of grazing- and hay-type alfalfa under three harvest frequencies. Agron. J. 2002, 94, 1094–1103. [Google Scholar] [CrossRef]
  4. Buxton, D.R.; Hornstein, J.S.; Wedin, W.F.; Marten, G.C. Forage quality in stratified canopies of alfalfa, birdsfoot trefoil, and red clover. Crop Sci. 1985, 25, 273–279. [Google Scholar] [CrossRef]
  5. Sheaffer, C.C.; Martin, N.P.; Lamb, J.F.S.; Cuomo, G.R.; Jewett, J.G.; Quering, S.R. Leaf and stem properties of alfalfa entries. Agron. J. 2000, 92, 733–739. [Google Scholar] [CrossRef]
  6. Ventroni, L.M.; Volenec, J.J.; Cangiano, C.A. Fall dormancy and cutting frequency impact on alfalfa yield and yield components. Field Crop. Res. 2011, 119, 252–259. [Google Scholar] [CrossRef]
  7. Weishaar, M.A.; Brummer, E.C.; Volenec, J.J.; Moore, K.J.; Cunningham, S. Improving winter hardiness in nondormant alfalfa germplasm. Crop Sci. 2005, 45, 60–65. [Google Scholar] [CrossRef]
  8. Kelner, D.J.; Vessey, J.K.; Entz, M.H. The nitrogen dynamics of 1-, 2- and 3-year stands of alfalfa in a cropping system. Agric. Ecosyst. Environ. 1997, 64, 1–10. [Google Scholar] [CrossRef]
  9. Kayad, A.G.; Al-Gaadi, K.A.; Tola, E.; Madugundu, R.; Zeyada, A.M.; Kalaitzidis, C. Assessing the spatial variability of alfalfa yield using satellite imagery and ground-based data. PLoS ONE 2016, 11, e0157166. [Google Scholar] [CrossRef] [Green Version]
  10. Asgarian, A.; Soffianian, A.; Pourmanafi, S. Crop type mapping in a highly fragmented and heterogeneous agricultural landscape: A case of central Iran using multi-temporal Landsat 8 imagery. Comput. Electron. Agric. 2016, 127, 531–540. [Google Scholar] [CrossRef]
  11. Cai, Y.; Guan, K.; Peng, J.; Wang, S.; Seifert, C.; Wardlow, B.; Li, Z. A high-performance and in-season classification system of field-level crop types using time-series Landsat data and a machine learning approach. Remote Sens. Environ. 2018, 210, 35–47. [Google Scholar] [CrossRef]
  12. Xie, Y.; Sha, Z.; Yu, M. Remote sensing imagery in vegetation mapping: A review. J. Plant Ecol. 2008, 1, 9–23. [Google Scholar] [CrossRef]
  13. Thorp, K.R.; Drajat, D. Deep machine learning with Sentinel satellite data to map paddy rice production stages across West Java, Indonesia. Remote Sens. Environ. 2021, 265, 112679. [Google Scholar] [CrossRef]
  14. Xu, J.; Zhu, Y.; Zhong, R.; Lin, Z.; Xu, J.; Jiang, H.; Huang, J.; Li, H.; Lin, T. DeepCropMapping: A multi-temporal deep learning approach with improved spatial generalizability for dynamic corn and soybean mapping. Remote Sens. Environ. 2020, 247, 111946. [Google Scholar] [CrossRef]
  15. Zhang, X.; Qiu, F.; Qin, F. Identification and mapping of winter wheat by integrating temporal change information and Kullback-Leibler divergence. Int. J. Appl. Earth Obs. Geoinf. 2019, 76, 26–39. [Google Scholar] [CrossRef]
  16. Konduri, V.S.; Kumar, J.; Hargrove, W.W.; Hoffman, F.M.; Ganguly, A.R. Mapping crops within the growing season across the United States. Remote Sens. Environ. 2020, 251, 112048. [Google Scholar] [CrossRef]
  17. Alcantara, C.; Kuemmerle, T.; Prishchepov, A.V.; Radeloff, V.C. Mapping abandoned agriculture with multi-temporal MODIS satellite data. Remote Sens. Environ. 2012, 124, 334–347. [Google Scholar] [CrossRef]
  18. Hemmerling, J.; Pflugmacher, D.; Hostert, P. Mapping temperate forest tree species using dense Sentinel-2 time series. Remote Sens. Environ. 2021, 267, 112743. [Google Scholar] [CrossRef]
  19. Hunt, M.L.; Blackburn, G.A.; Carrasco, L.; Redhead, J.W.; Rowland, C.S. High resolution wheat yield mapping using Sentinel-2. Remote Sens. Environ. 2019, 233, 111410. [Google Scholar] [CrossRef]
  20. Griffiths, P.; Nendel, C.; Hostert, P. Intra-annual reflectance composites from Sentinel-2 and Landsat for national-scale crop and land cover mapping. Remote Sens. Environ. 2019, 220, 135–151. [Google Scholar] [CrossRef]
  21. Hussain, M.; Chen, D.; Cheng, A.; Wei, H.; Stanley, D. Change detection from remotely sensed images: From pixel-based to object-based approaches. ISPRS-J. Photogramm. Remote Sens. 2013, 80, 91–106. [Google Scholar] [CrossRef]
  22. Friedl, M.A.; Brodley, C.E. Decision tree classification of land cover from remotely sensed data. Remote Sens. Environ. 1997, 61, 399–409. [Google Scholar] [CrossRef]
  23. Xu, D.; Chen, B.; Shen, B.; Wang, X.; Yan, Y.; Xu, L.; Xin, X. The classification of grassland types based on object-based image analysis with multisource data. Rangel. Ecol. Manag. 2019, 72, 318–326. [Google Scholar] [CrossRef]
  24. Kussul, N.; Lavreniuk, M.; Skakun, S.; Shelestov, A. Deep learning classification of land cover and crop types using remote sensing data. IEEE Geosci. Remote Sens. Lett. 2017, 14, 778–782. [Google Scholar] [CrossRef]
  25. Chandel, A.K.; Khot, L.R.; Yu, L. Alfalfa (Medicago sativa L.) crop vigor and yield characterization using high-resolution aerial multispectral and thermal infrared imaging technique. Comput. Electron. Agric. 2021, 182, 105999. [Google Scholar] [CrossRef]
  26. Yadav, K.; Geli, H.M.E. Prediction of crop yield for New Mexico based on climate and remote sensing data for the 1920–2019 period. Land 2021, 10, 1389. [Google Scholar] [CrossRef]
  27. Zeyliger, A.M.; Ermolaeva, O.S. Water stress regime of irrigated crops based on remote sensing and ground-based data. Agronomy 2021, 11, 1117. [Google Scholar] [CrossRef]
  28. Starks, P.J.; Brown, M.A.; Turner, K.E.; Venuto, B.C. Canopy visible and near-infrared reflectance data to estimate alfalfa nutritive attributes before harvest. Crop Sci. 2016, 56, 484–494. [Google Scholar] [CrossRef]
  29. Zhou, Y.; Flynn, K.C.; Gowda, P.H.; Wagle, P.; Ma, S.; Kakani, V.G.; Steiner, J.L. The potential of active and passive remote sensing to detect frequent harvesting of alfalfa. Int. J. Appl. Earth Obs. Geoinf. 2021, 104, 102539. [Google Scholar] [CrossRef]
  30. Zhan, Y.; Muhammad, S.; Hao, P.; Niu, Z. The effect of EVI time series density on crop classification accuracy. Optik 2018, 157, 1065–1072. [Google Scholar] [CrossRef]
  31. Seydi, S.T.; Amani, M.; Ghorbanian, A. A dual attention convolutional neural network for crop classification using time-series Sentinel-2 imagery. Remote Sens. 2022, 14, 498. [Google Scholar] [CrossRef]
  32. Ashourloo, D.; Shahrabi, H.S.; Azadbakht, M.; Aghighi, H.; Matkan, A.A.; Radiom, S. A novel automatic method for alfalfa mapping using time series of Landsat-8 OLI data. IEEE J. Sel. Top. Appl. Earth Observ. Remote Sens. 2018, 11, 4478–4487. [Google Scholar] [CrossRef]
  33. Hong, G.; Zhang, A.; Zhou, F.; Brisco, B. Integration of optical and synthetic aperture radar (SAR) images to differentiate grassland and alfalfa in Prairie area. Int. J. Appl. Earth Obs. Geoinf. 2014, 28, 12–19. [Google Scholar] [CrossRef]
  34. Chen, J.; Jonsson, P.; Tamura, M.; Gu, Z.; Matsushita, B.; Eklundh, L. A simple method for reconstructing a high-quality NDVI time-series data set based on the Savitzky-Golay filter. Remote Sens. Environ. 2004, 91, 332–344. [Google Scholar] [CrossRef]
  35. Haagenson, D.M.; Cunningham, S.M.; Volenec, J.J. Root physiology of less fall dormant, winter hardy alfalfa selections. Crop Sci. 2003, 43, 1441–1447. [Google Scholar] [CrossRef] [Green Version]
  36. Brink, G.; Hall, M.; Shewmaker, G.; Undersander, D.; Martin, N.; Walgenbach, R. Changes in alfalfa yield and nutritive value within individual harvest periods. Agron. J. 2010, 102, 1274–1282. [Google Scholar] [CrossRef] [Green Version]
  37. Cai, Z.; Jonsson, P.; Jin, H.; Eklundh, L. Performance of smoothing methods for reconstructing NDVI time-series and estimating vegetation phenology from MODIS data. Remote Sens. 2017, 9, 1271. [Google Scholar] [CrossRef] [Green Version]
  38. Shao, Y.; Lunetta, R.S.; Wheeler, B.; Iiames, J.S.; Campbell, J.B. An evaluation of time-series smoothing algorithms for land-cover classifications using MODIS-NDVI multi-temporal data. Remote Sens. Environ. 2016, 174, 258–265. [Google Scholar] [CrossRef]
  39. Foody, G.M.; Mathur, A. Toward intelligent training of supervised image classifications: Directing training data acquisition for SVM classification. Remote Sens. Environ. 2004, 93, 107–117. [Google Scholar] [CrossRef]
Figure 1. Location of the study area.
Land 11 01996 g001
Figure 2. NDVI values of different vegetation types derived from the MODIS data from January 2020 to June 2022.
Land 11 01996 g002
Figure 3. Smoothing, wave peak and valley identification characteristics of the NDVI series of different vegetation types derived from the MODIS data.
Land 11 01996 g003
Figure 4. NDVI values of different vegetation types derived from the Sentinel-2 data from January 2020 to June 2022.
Land 11 01996 g004
Figure 5. Interpolated, smoothing, wave peak and valley identification characteristics of the NDVI series of different vegetation types derived from the Sentinel-2 data.
Land 11 01996 g005
Figure 6. NDVI values of different vegetation types derived from the Sentinel-2 data at the different growth stages.
Land 11 01996 g006
Table 1. Numbers of sampling points comprising different vegetation types.
AlfalfaOatsCornSunflowerGrassland VegetationTotal
Sentinel-2177929825100492
MODIS1074011516179
Table 2. Wave peak and valley numbers and proportions obtained from the NDVI series of different vegetation types derived from the MODIS data.
AlfalfaOatsCornSunflowerGrassland
Vegetation
Wave peakWave valleyWave peakWave valleyWave peakWave valleyWave peakWave valleyWave peakWave valley
Greater than 2Greater than 1Less than 3Less than 2Less than 2Less than 1Less than 2Less than 1Less than 3Less than 2
Number10498183776511614
Proportion97.2%91.6%45.0%92.5%63.6%54.5%100.0%20.0%100.0%87.5%
Table 3. Separability of different vegetation types at the different growth stages.
Peak Growth Stage (2 August 2020)
AlfalfaOatsCornSunflower
Oats1.5810
Corn2.00001.9965
Sunflower1.91821.98262.0000
Grassland vegetation1.79661.70732.00001.9900
Pre-wintering stage (23 October 2020)
AlfalfaOatsCornSunflower
Oats1.9715
Corn1.99891.9398
Sunflower1.99741.99121.9967
Grassland vegetation1.96301.98441.99881.9478
Spring regreening stage (21 April 2021)
AlfalfaOatsCornSunflower
Oats1.6875
Corn1.92501.6117
Sunflower1.97831.93221.7451
Grassland vegetation1.81971.77081.88201.8763
Table 4. Image features of different vegetation types at the peak growth stage (false color synthesis).
AlfalfaOatsCornSunflowerGrassland
Vegetation
Land 11 01996 i001Land 11 01996 i002Land 11 01996 i003Land 11 01996 i004Land 11 01996 i005Land 11 01996 i006Land 11 01996 i007
Table 5. Image features of different vegetation types at the pre-wintering stage (false color synthesis).
AlfalfaOatsCornSunflowerGrassland
Vegetation
Land 11 01996 i008Land 11 01996 i009Land 11 01996 i010Land 11 01996 i011Land 11 01996 i012
Table 6. Classification results based on SVM at the pre-wintering stage.
AlfalfaOatsCornSunflowerGrassland Vegetation
Alfalfa711400
Oats031000
Corn053500
Sunflower00060
Grassland vegetation000440
Table 7. Image features of different vegetation types at the spring regreening stage (false color synthesis).
AlfalfaOatsCornSunflowerGrassland
Vegetation
Land 11 01996 i013Land 11 01996 i014Land 11 01996 i015Land 11 01996 i016Land 11 01996 i017Land 11 01996 i018
Table 8. Wave peak and valley numbers and proportions obtained from the NDVI series of different vegetation types derived from the Sentinel-2 data.
AlfalfaOatsCornSunflowerGrassland
Vegetation
Wave peakWave valleyWave peakWave valleyWave peakWave valleyWave peakWave valleyWave peakWave valley
Greater than 2Greater than 1Less than 3Less than 2Less than 2Less than 1Less than 2Less than 1Less than 3Less than 2
Number159154398216522548282
Proportion89.8%87.0%42.4%89.1%16.3%53.1%100.0%16.0%82.0%82.0%
Publisher’s Note: MDPI stays neutral with regard to jurisdictional claims in published maps and institutional affiliations.

