Article

Assessing Preferences for Cultural Ecosystem Services in the English Countryside Using Q Methodology

1
Faculty of Humanities, Charles University in Prague, U Kříže 8, 158 00 Prague, Czech Republic
2
School of Water, Energy and Environment, Cranfield University, College Road, Cranfield MK43 0AL, UK
*
Author to whom correspondence should be addressed.
Land 2023, 12(2), 331; https://doi.org/10.3390/land12020331
Submission received: 25 November 2022 / Revised: 10 January 2023 / Accepted: 16 January 2023 / Published: 26 January 2023
(This article belongs to the Special Issue Rural–Urban Gradients: Landscape and Nature Conservation)

Abstract

:
Cultural Ecosystem Services (CES) are difficult to assess due to the subjective and diverse way in which they are experienced. This can make it difficult to apply CES research to enhance human experience of nature. This study applies Q methodology to group people according to their preferences for CES. The Q methodology survey was carried out with 47 local residents and tourists in Wiltshire, in South West England. Four groups of respondents were identified drawing value from nature through: (1) spiritual benefits and mental well-being (Group 1—Inspired by nature); (2) nature and biodiversity conservation (Group 1—Conserving nature); (3) cultural heritage in multifunctional landscapes (Group 3—Countryside mix); and (4) opportunities for outdoor activities (Group 4—Outdoor pursuits). All four groups stated that benefits from nature were enhanced by actually visiting the countryside, through a better understanding of nature itself, and through a range of sensory experiences. They particularly identified relaxation opportunities as a very important CES benefit. These findings, and the demonstrated use of the Q methodology, could support local planning and landscape management in order to provide accessible and functional landscapes that can provide a range of different CES benefits to people.

1. Introduction

Ecosystems, often described in terms of habitats and the constituent natural species, can contribute to a range of non-material, intangible benefits for people [1]. These benefits provide value to people and are often associated with the acquisition of knowledge, of feeling inspired or restored, and of being part of nature, especially linked to a sense of place [2]. Attempts to organise them into categories refer to cultural heritage, sense of place, recreation and ecotourism, aesthetic, inspirational, educational, and spiritual and religious benefits [3]. Such benefits are often referred to as cultural ecosystem services (CES) or non-material nature’s contributions to people (NCP) and are increasingly seen as a potential means of maintaining or improving human health and wellbeing [1,4,5].
Regarding our terminology for this paper, we refer to “value” as it has been defined previously as the “contribution of an action or object” to an individual’s “goals, objectives, or condition” [3], denoting “evaluative beliefs about the worth, importance, or usefulness of something” [6]. More specifically, value refers to the utility of something to individuals or collectives when applying values (a stable set of beliefs about situations and objects in the world that are of merit). A “benefit” derived from CES, we consider to be “a positive change in wellbeing from the fulfilment of wants or needs” [7]. “Wellbeing”, which can be defined at high levels of detail, requiring the investigation of many different dimensions within a set of cultural, social, economic, governance, and health domains [8], we define more simply according to McGinlay et al. [9] as a “holistic positive mental and physical state of an individual or social group”. In so far as people have values relating to specific CES that provide benefits to create wellbeing, individuals may have “preferences” for specific CES. “Preference” means a decision between options for objects or situations which are of greater merit or utility to the individual.
Possibly because CES are non-material and intangible benefits, their importance to wellbeing has often been overlooked. The Millennium Ecosystem Assessment [4] argued that consideration of CES was inadequate in landscape planning and management. Auer et al. [10] noted that CES were given greater value by people than other ecosystem services in industrialised countries. As a result, Puren et al. [11] have argued that greater knowledge of CES is required to improve the future of rural areas.
Evaluating CES has three main challenges: (i) how to define them; (ii) how to measure them; and (iii) how to assign them to a specific place. Tratalos et al. [12] and Church et al. [13] have noted that it is very difficult to distinguish CES in practice because they are so inter-connected and permeable and often occur in bundles. The definition of CES as “intangible” has been criticised by some authors for misinterpreting and underrepresenting the actual services for the subjective benefits they provide [12,14,15] Fish et al. [16] described CES as processes and elements that people create and alter through their interaction with nature. The character and typology of CES is generally quite diverse, variable, and not unified [17,18]. It has also been argued that provisioning and regulating ecosystem services could be perceived as having cultural dimensions [19]. For example, enhancing future food security adds an emotional and subjective dimension that is culturally important to the usual notion of provisioning ecosystem services [2]. That is one of the reasons why Diaz et al. [5] argue that the concept of ecosystem services, which is predominantly based on economics and natural sciences, fails to recognise the real benefits of many services, especially CES, and uses universally applicable categories that are too analytical and sharp. According to Ram and Smith [20], CES categories are strongly interconnected, and an integrated approach to their evaluation is therefore necessary. To better reflect the reality of benefits which people obtain from nature, taking into account social sciences insights, the Intergovernmental Science-Policy Platform on Biodiversity and Ecosystem Services (IPBES) moved towards the NCP framework, based on more fluid and overlapping categories. Nowak-Olejnik et al. [21] also concluded that there was a need to foster interdisciplinary and transdisciplinary research, deepen knowledge of the subjective well-being and how these are affected by perceptions and emotions, and clarify and create shared concepts of CES.
For these reasons, CES are inherently more difficult to assess than provisioning or regulating services [22], perhaps with the exception of recreation, for which market value can be derived [16]. Because of its amenability to market valuation, recreation has been the most frequently assessed and measured CES [14]. Most other CES are, however, very difficult to measure in terms of “equivalent consumption goods” [22]. In addition, many CES are not linked to a specific place or ecosystem [23], which makes their quantification, in terms of both generation and consumption, more difficult. Indeed, CES may be generated indirectly via interaction with modern media and therefore may not be directly linked to a specific location [9].
Thus, methods used to assess CES usually contain a psycho-cultural dimension that allows for an appropriate reflection on the well-being effect on an individual or a community. Provisioning and regulating ecosystem services, by contrast, are frequently evaluated using equivalent exchange prices without taking into account the perception and values of those who do benefit (or lose) from them [19,22,24]. CES values, however, are mainly subjective, do not have commensurate units, and require interpretation that is very context-specific. According to Schmidt et al. [25], the most appropriate methods to assess the social benefits of CES and their effects on human well-being are therefore those involving the stakeholders themselves—that is, those whose wellbeing is affected.
It has been shown that most people perceive CES at the broad landscape scale, and to a lesser extent at the scale of dominant habitats or land-use cover such as woodlands or grasslands, and do not, unless they are specialist, reduce their appreciation of nature to the smaller scales [2]. At the species scale, appreciation of biodiversity often focuses on charismatic plants and animals, such as colourful flowers and song-birds, rather than on the detail of species abundance and mix [26]. Deriving benefit from CES delivered at this scale was generally associated with specialist knowledge often derived through the pursuit of hobbies or training [2,26]. However, because people generally interact with nature mainly at the landscape scale, enjoying long views, viewsheds, viewpoints, and combined nature–culture assemblages, it is difficult and possibly of limited value to separate the benefits of biotic, abiotic, and human-made artefacts in environmental settings [2]. In addition, the study site located as it is in Wiltshire is characterised by a long history of human engagement and influence over the environment, so that the various biotic, abiotic, and human-made elements of the landscape (including houses, farms, and heritage and religious sites) are now deeply entwined and people generally view the human-made artefacts in the area as integral to the countryside and landscape [2]. Agnoletti [27] has argued that landscapes provide a unique opportunity to integrate environmental, social, and economic factors in space in ways that can be used as a framework for development models, including the design of interventions to promote wellbeing benefits for people. For these reasons, whilst the study aims to understand how people interact with nature in rural Wiltshire, it does not attempt to separate the biotic, abiotic, and human-made elements in the landscape that provide CES, but views these different elements all as a whole.
Thus, a key challenge is to understand how people benefit from CES associated with nature and landscapes and how modifications of local landscapes can influence mental and physical well-being, positively or negatively. As part of this, it is important to understand the personal systems of values and the range of perspectives that underpin the generation of CES benefits, which CES are important for which people, and how CES benefits can then be used to generate wellbeing. An important aspect of this is to understand and enhance people’s connection to nature [28]. Connection to nature describes how much individuals perceive themselves to be a part of nature and has been identified as a crucial requirement for attaining sustainable behaviour in people [29]. Whilst enhancing connection to nature can be useful for landscape and conservation management [28], it has been in decline as more people live in urban environments.
In this context, and as part of a larger study that explored the value of biodiversity to people (http://wessexbess.wixsite.com/wessexbess (accessed on 14 January 2023)), our research aim here was to identify people’s preferences with respect to CES and their perception of the value they obtain from nature within a managed landscape. Specifically, we aimed to identify different groupings of people according to their expressed preferences for CES, based on what they perceived in the landscape and how they perceived it. We propose that such a typology of citizens could help provide information to aid decision-making relating to the local and regional natural environment, especially the targeting of interventions to improve connection to nature and hence wellbeing outcomes. We also think the subject matter will appeal to researchers exploring interactions between people and nature more generally and at the local scale in other locations and to those involved in policy and management promoting the take up of CES in the countryside.
The paper is structured as follows. Following this Introduction, which has outlined the importance, challenges, and baseline concepts associated with CES research, the Method describes the case study location and the use of the Q methodology, describing how a set of statements to reflect the concourse were developed, how data were collected from respondents at the case study site, and how factor analysis was used to identify common groupings of CES preferences from the data. The Results describe the sample population, the factor analysis, and interpret and characterise the “factors”, or groupings of people, according to their CES preferences. In the Discussion, these findings are then interpreted in terms of the light this sheds on understanding people’s connectivity with nature, the implications for research, and more pragmatically, for landscape policy and management. The paper ends with key conclusions on the utility of grouping people according to their CES preferences in terms of landscape research and management.

2. Method

The research took place in the Salisbury Plain area of Wiltshire, South West England, focussing on lowland agricultural landscapes in the Salisbury Plain area. As will be explained below, the Q methodology was used to elicit perceptions of values associated with cultural services derived from interactions with nature in the context of a managed landscape.

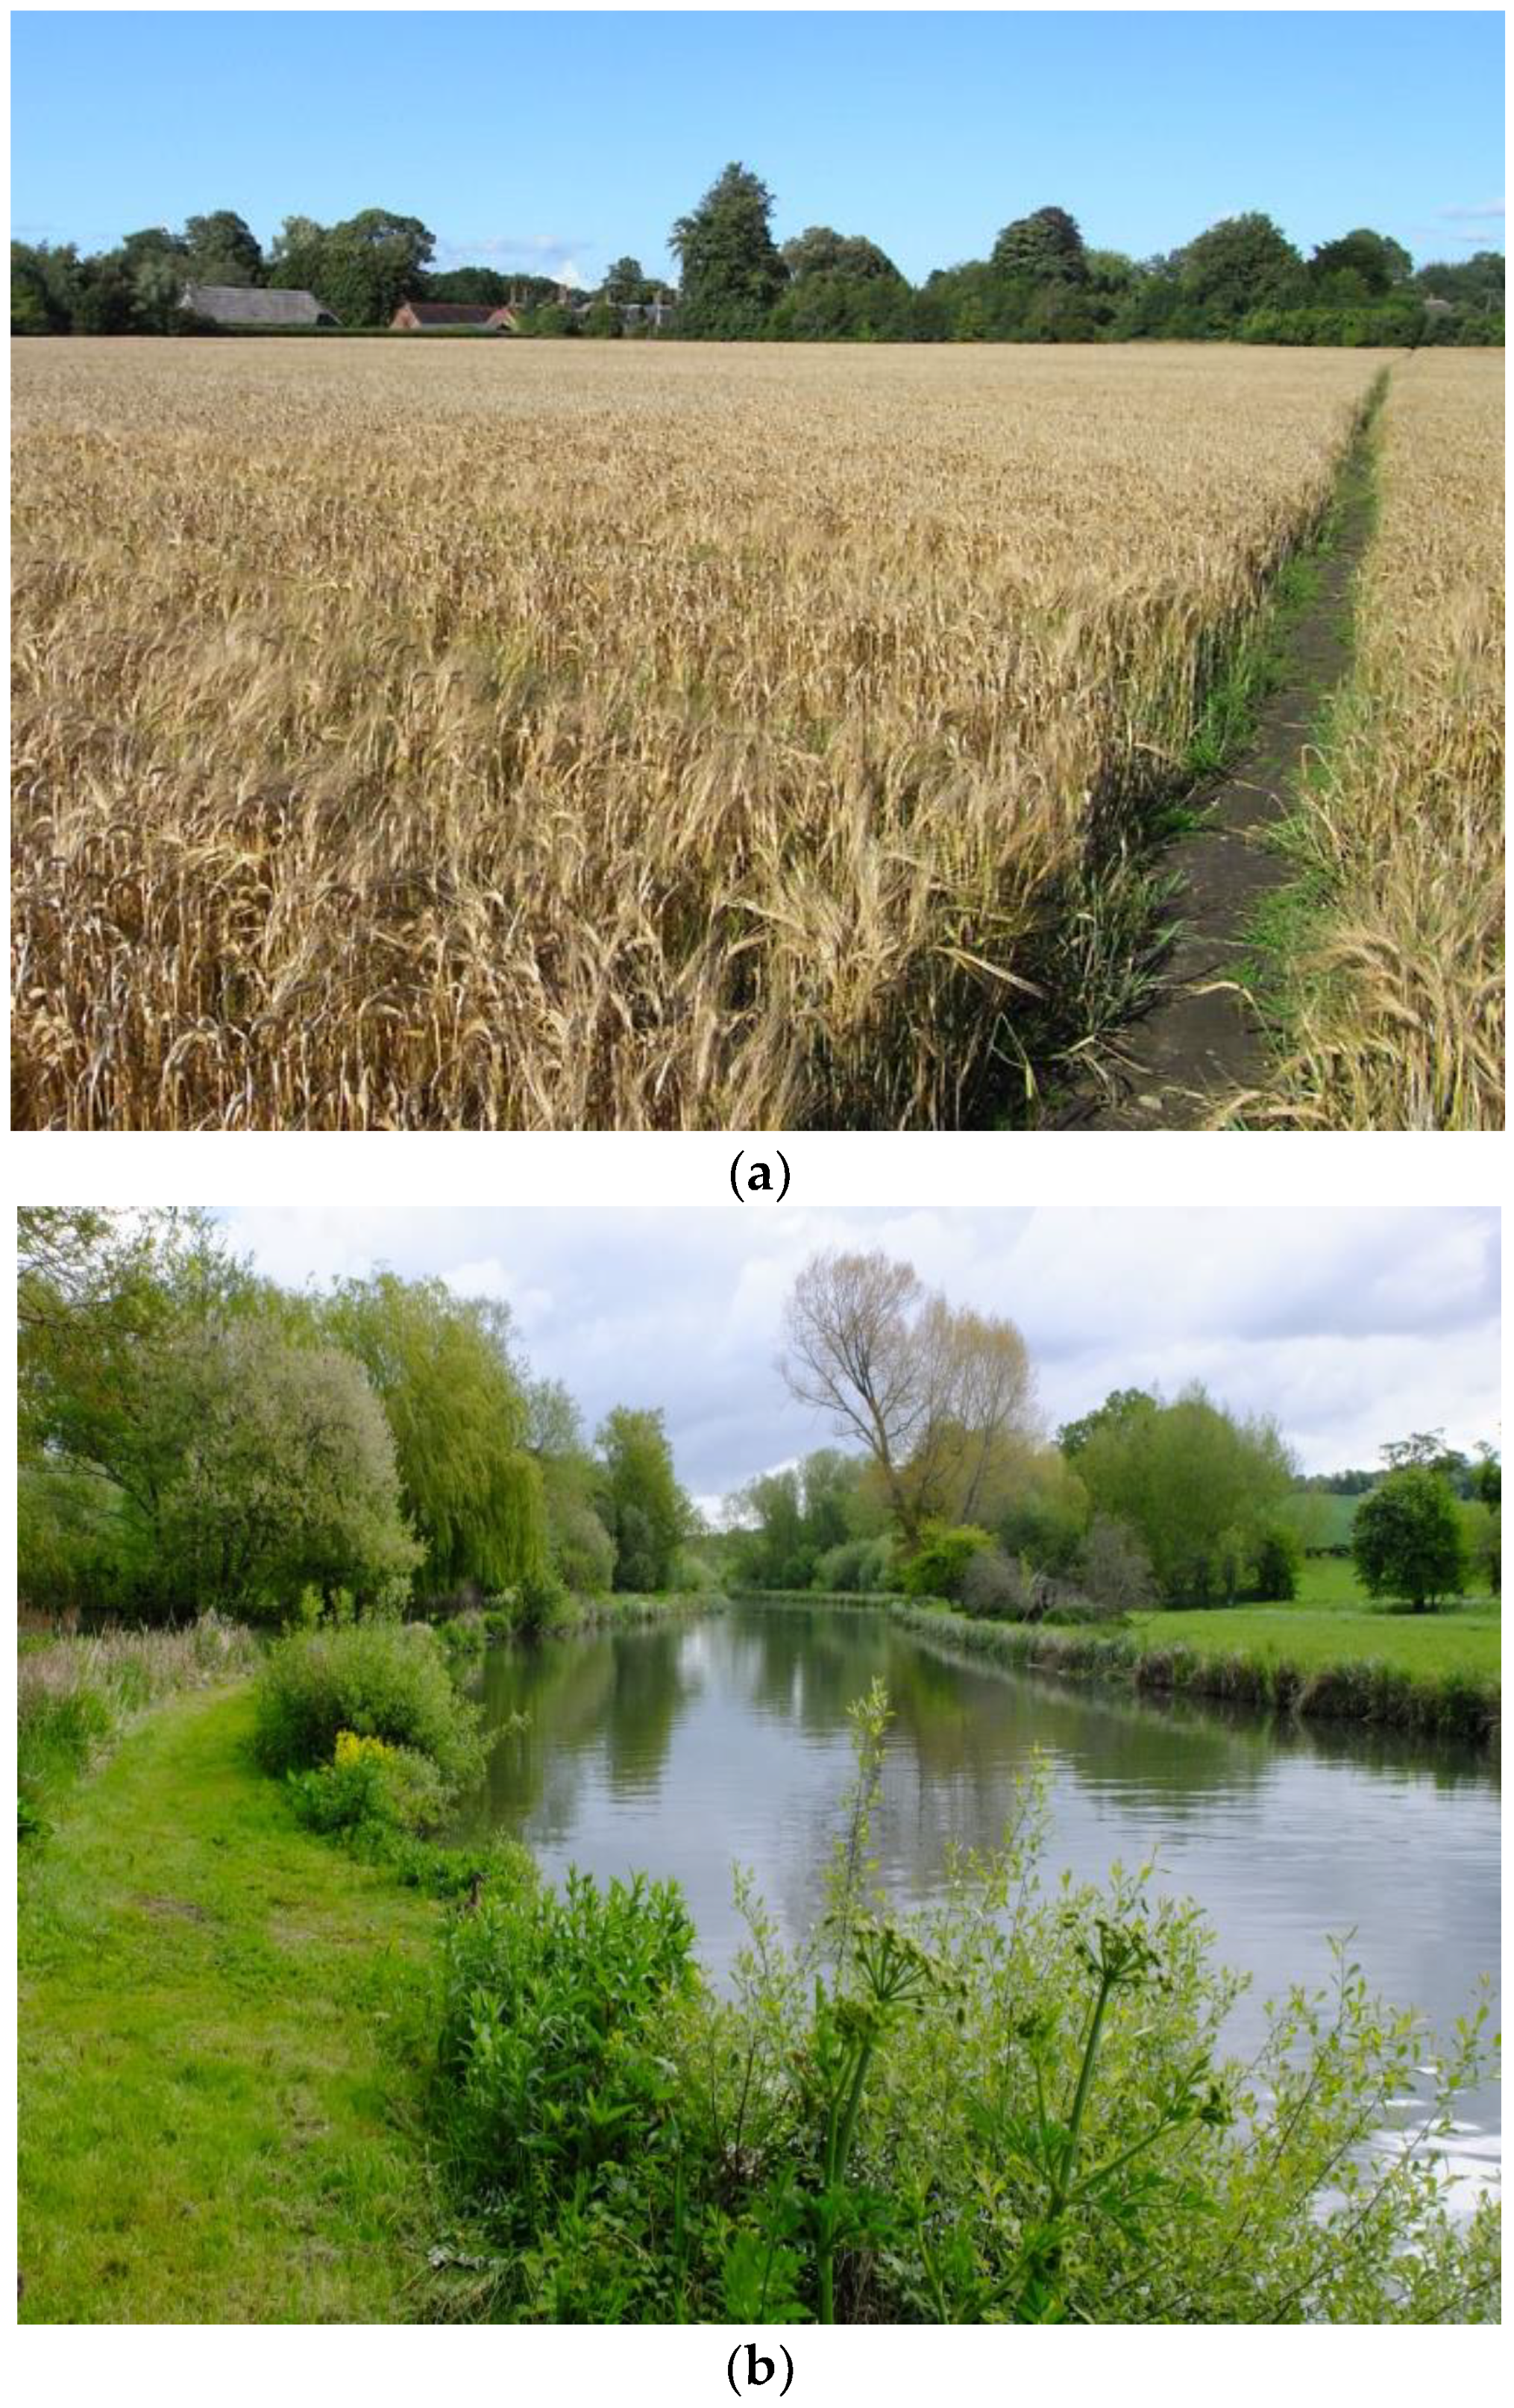
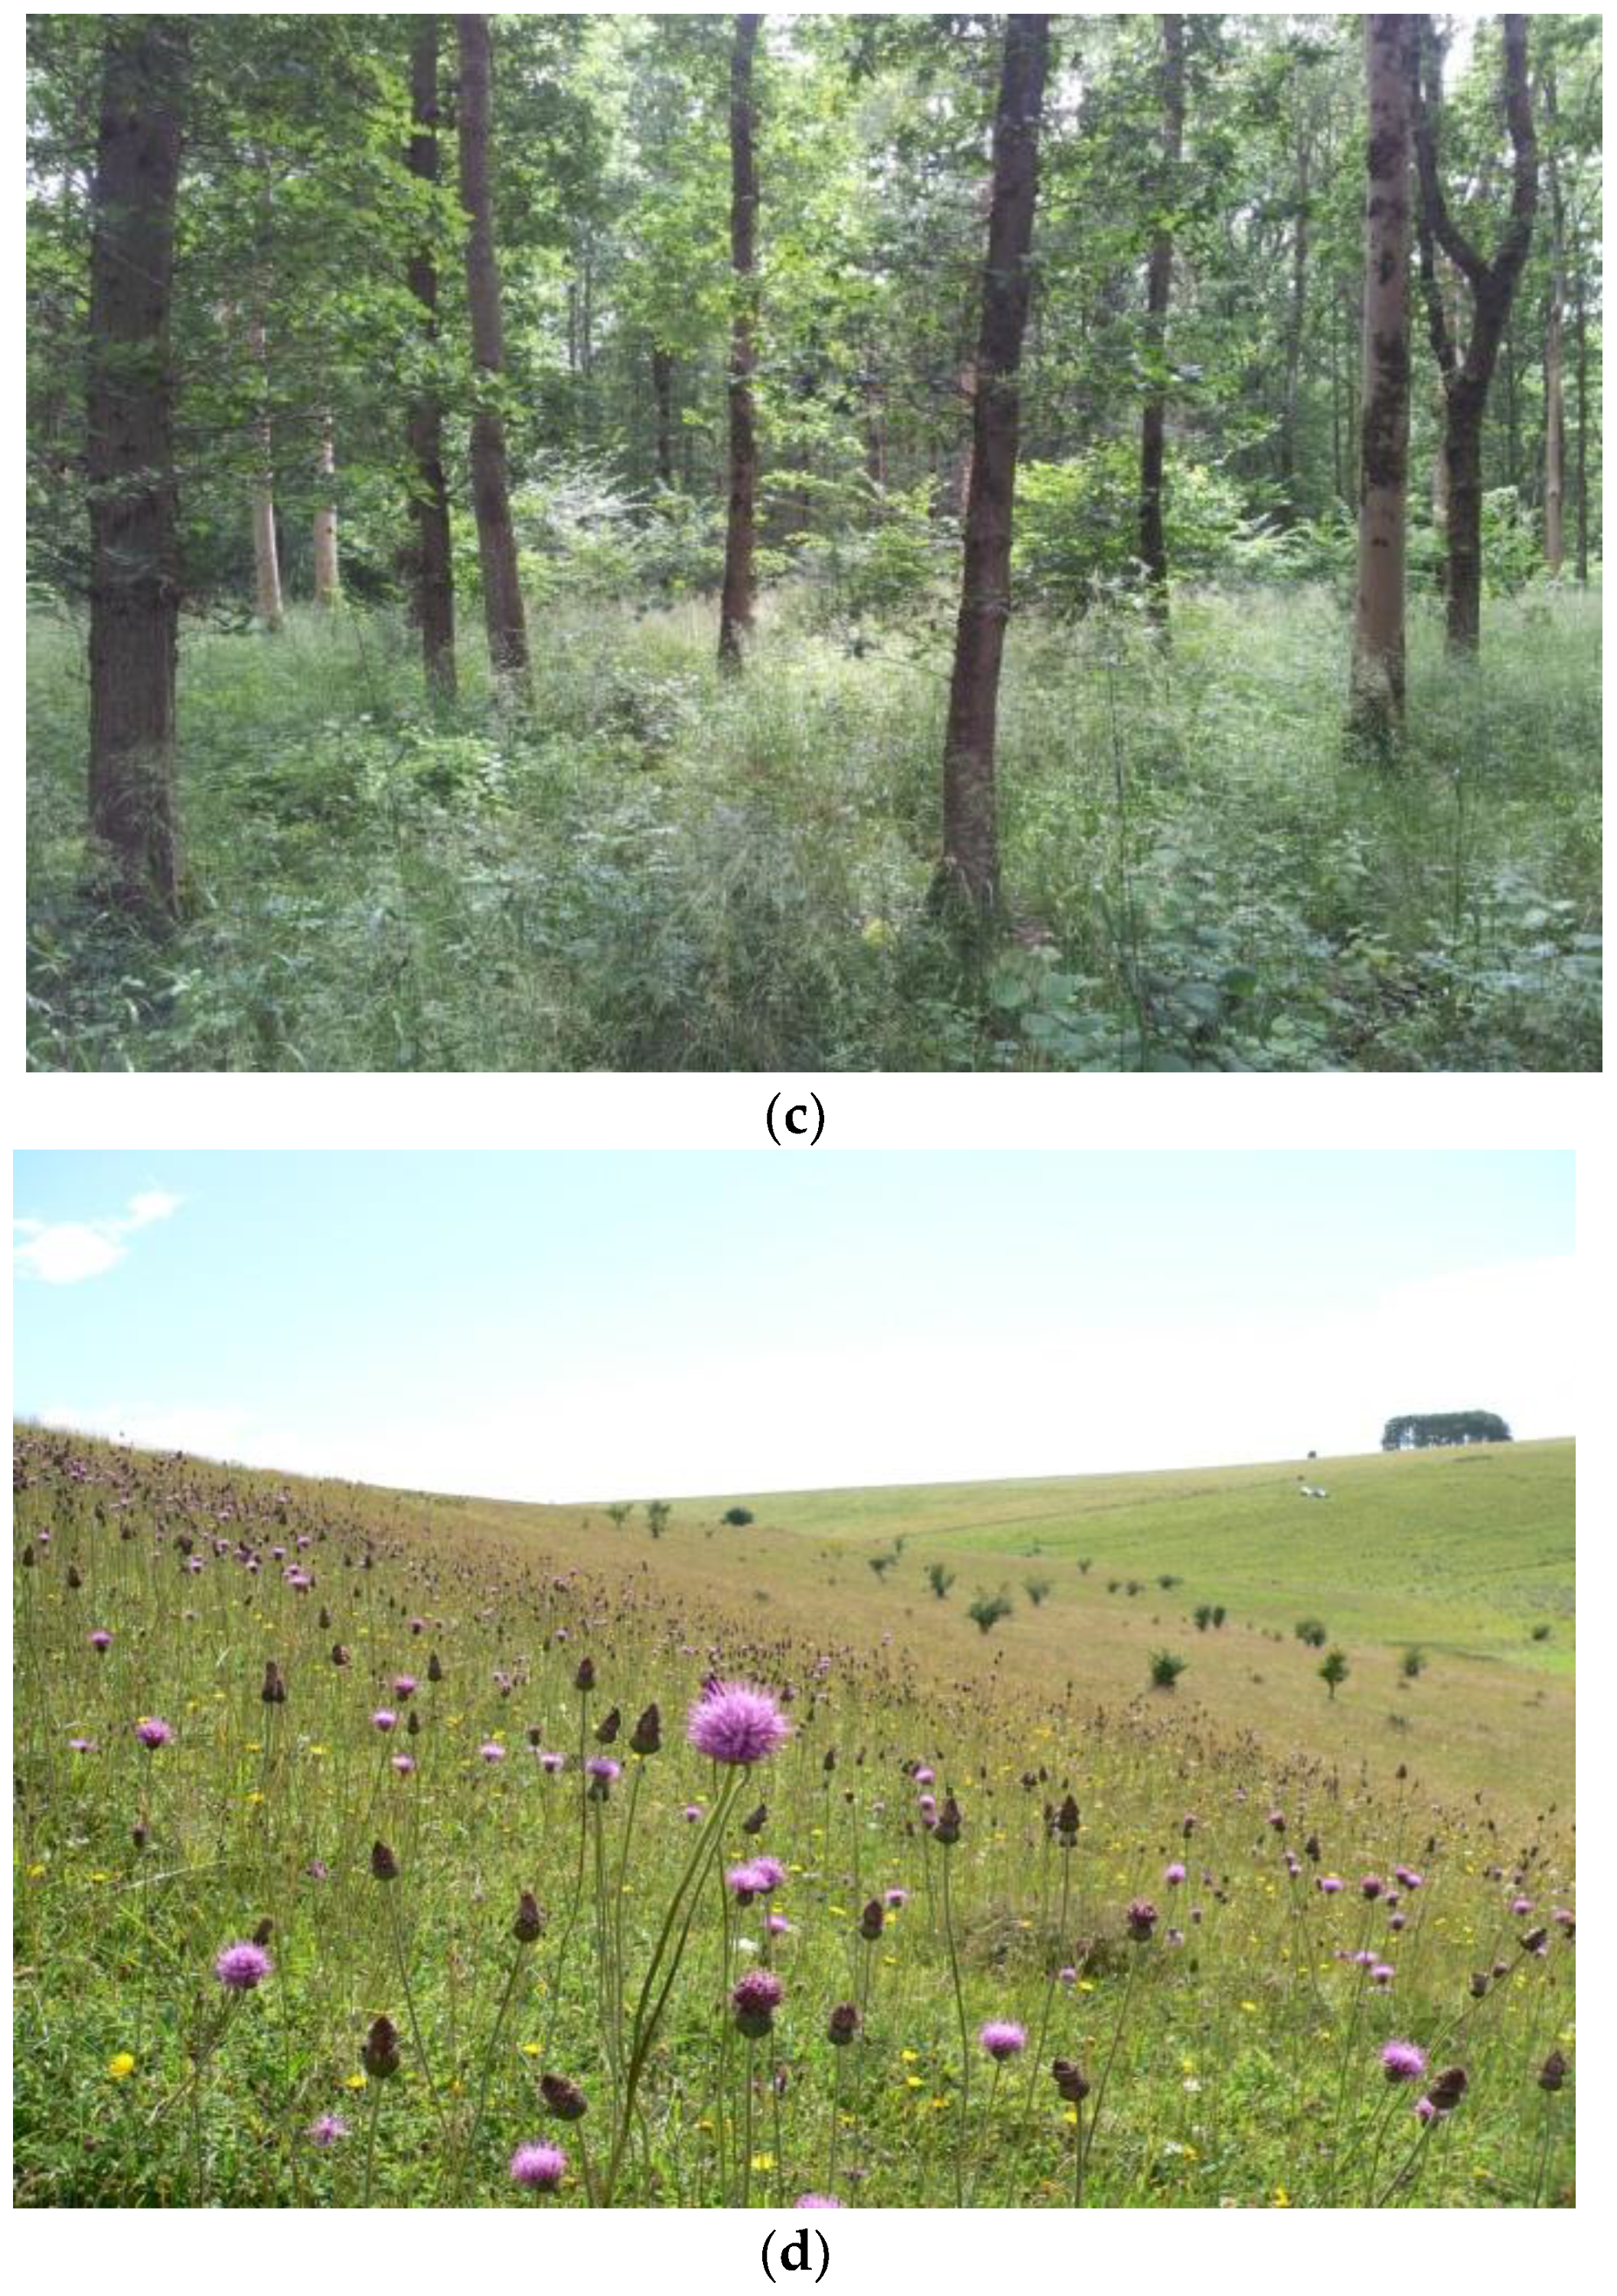
2.1. Description of the Area

Wiltshire was chosen for this study due to the unique character of its chalk grasslands and associated habitats (Figure 1), because of its multi-functional characteristics, diverse landscape, and because of its lowland location.
The habitats and landscapes of Wiltshire are fairly typical of lowland England, where much of the UK population lives. Wiltshire is a landlocked county with an overall area of 3485 km2. It is home to some of the most famous English monuments and historical sites, such as Stonehenge, Avebury, Old Sarum, and Salisbury cathedral. Wiltshire is a rural county with a high proportion of cropland and agricultural grasslands. About one-fifth of the area of Wiltshire is occupied by the Salisbury Plain chalk plateau, which is the greatest remaining area of ancient chalk grasslands in north-west Europe. Much of this area of high biodiversity value is used by the UK Ministry of Defence for military exercises, which has restricted building and arable land use. According to the last census that took place in 2011, there were 470,981 residents in Wiltshire [30].

2.2. Q Methodology

Q methodology was chosen for this study because we wanted to develop a typology of respondents based on their self-reported benefits from CES. First developed in 1930s, Q methodology is a psychometric technique that has been used for the systematic study of subjectivity in many fields, including in the social sciences and humanities [31,32].
Q methodology is used to categorise respondents into groups according to their viewpoints on a particular topic. In order to do this, Q methodology starts with the identification of a concourse, which represents the totality of views and opinions associated with the topic [33]. The concourse is represented in a series of statements, which are then ranked according to respondent preference [31]. Respondents are typically given a set of statements and asked to sort them into a form resembling a normal distribution using a scale that ranges from “most agree” to “most disagree” [33] (Figure 2). This is termed the Q sort. To assure correct interpretation of the Q sort, this is followed by a “debrief” with each respondent, which is used to develop further understanding of why statements were sorted as they were and to ensure that the respondent has understood the statements correctly and does not wish to make any changes [31]. The categorisation of respondent views is then obtained from a factor analysis of the ranked responses and an interpretation made of the grouping [34].
Q methodology using narratives was recognised as a suitable tool for landscape-related research almost four decades ago [35] and has been used in various environmental applications such as ecological research [36], perceptions of biodiversity [37], and farmer motivation and behaviour [38]. More recently, in a review of approaches used in CES research, Cheng et al. [39] proposed that Q methodology and other stated preference approaches potentially provided the opportunity for new or neglected CES to be identified for investigation, which is more challenging when using approaches that rely on existing CES classifications.

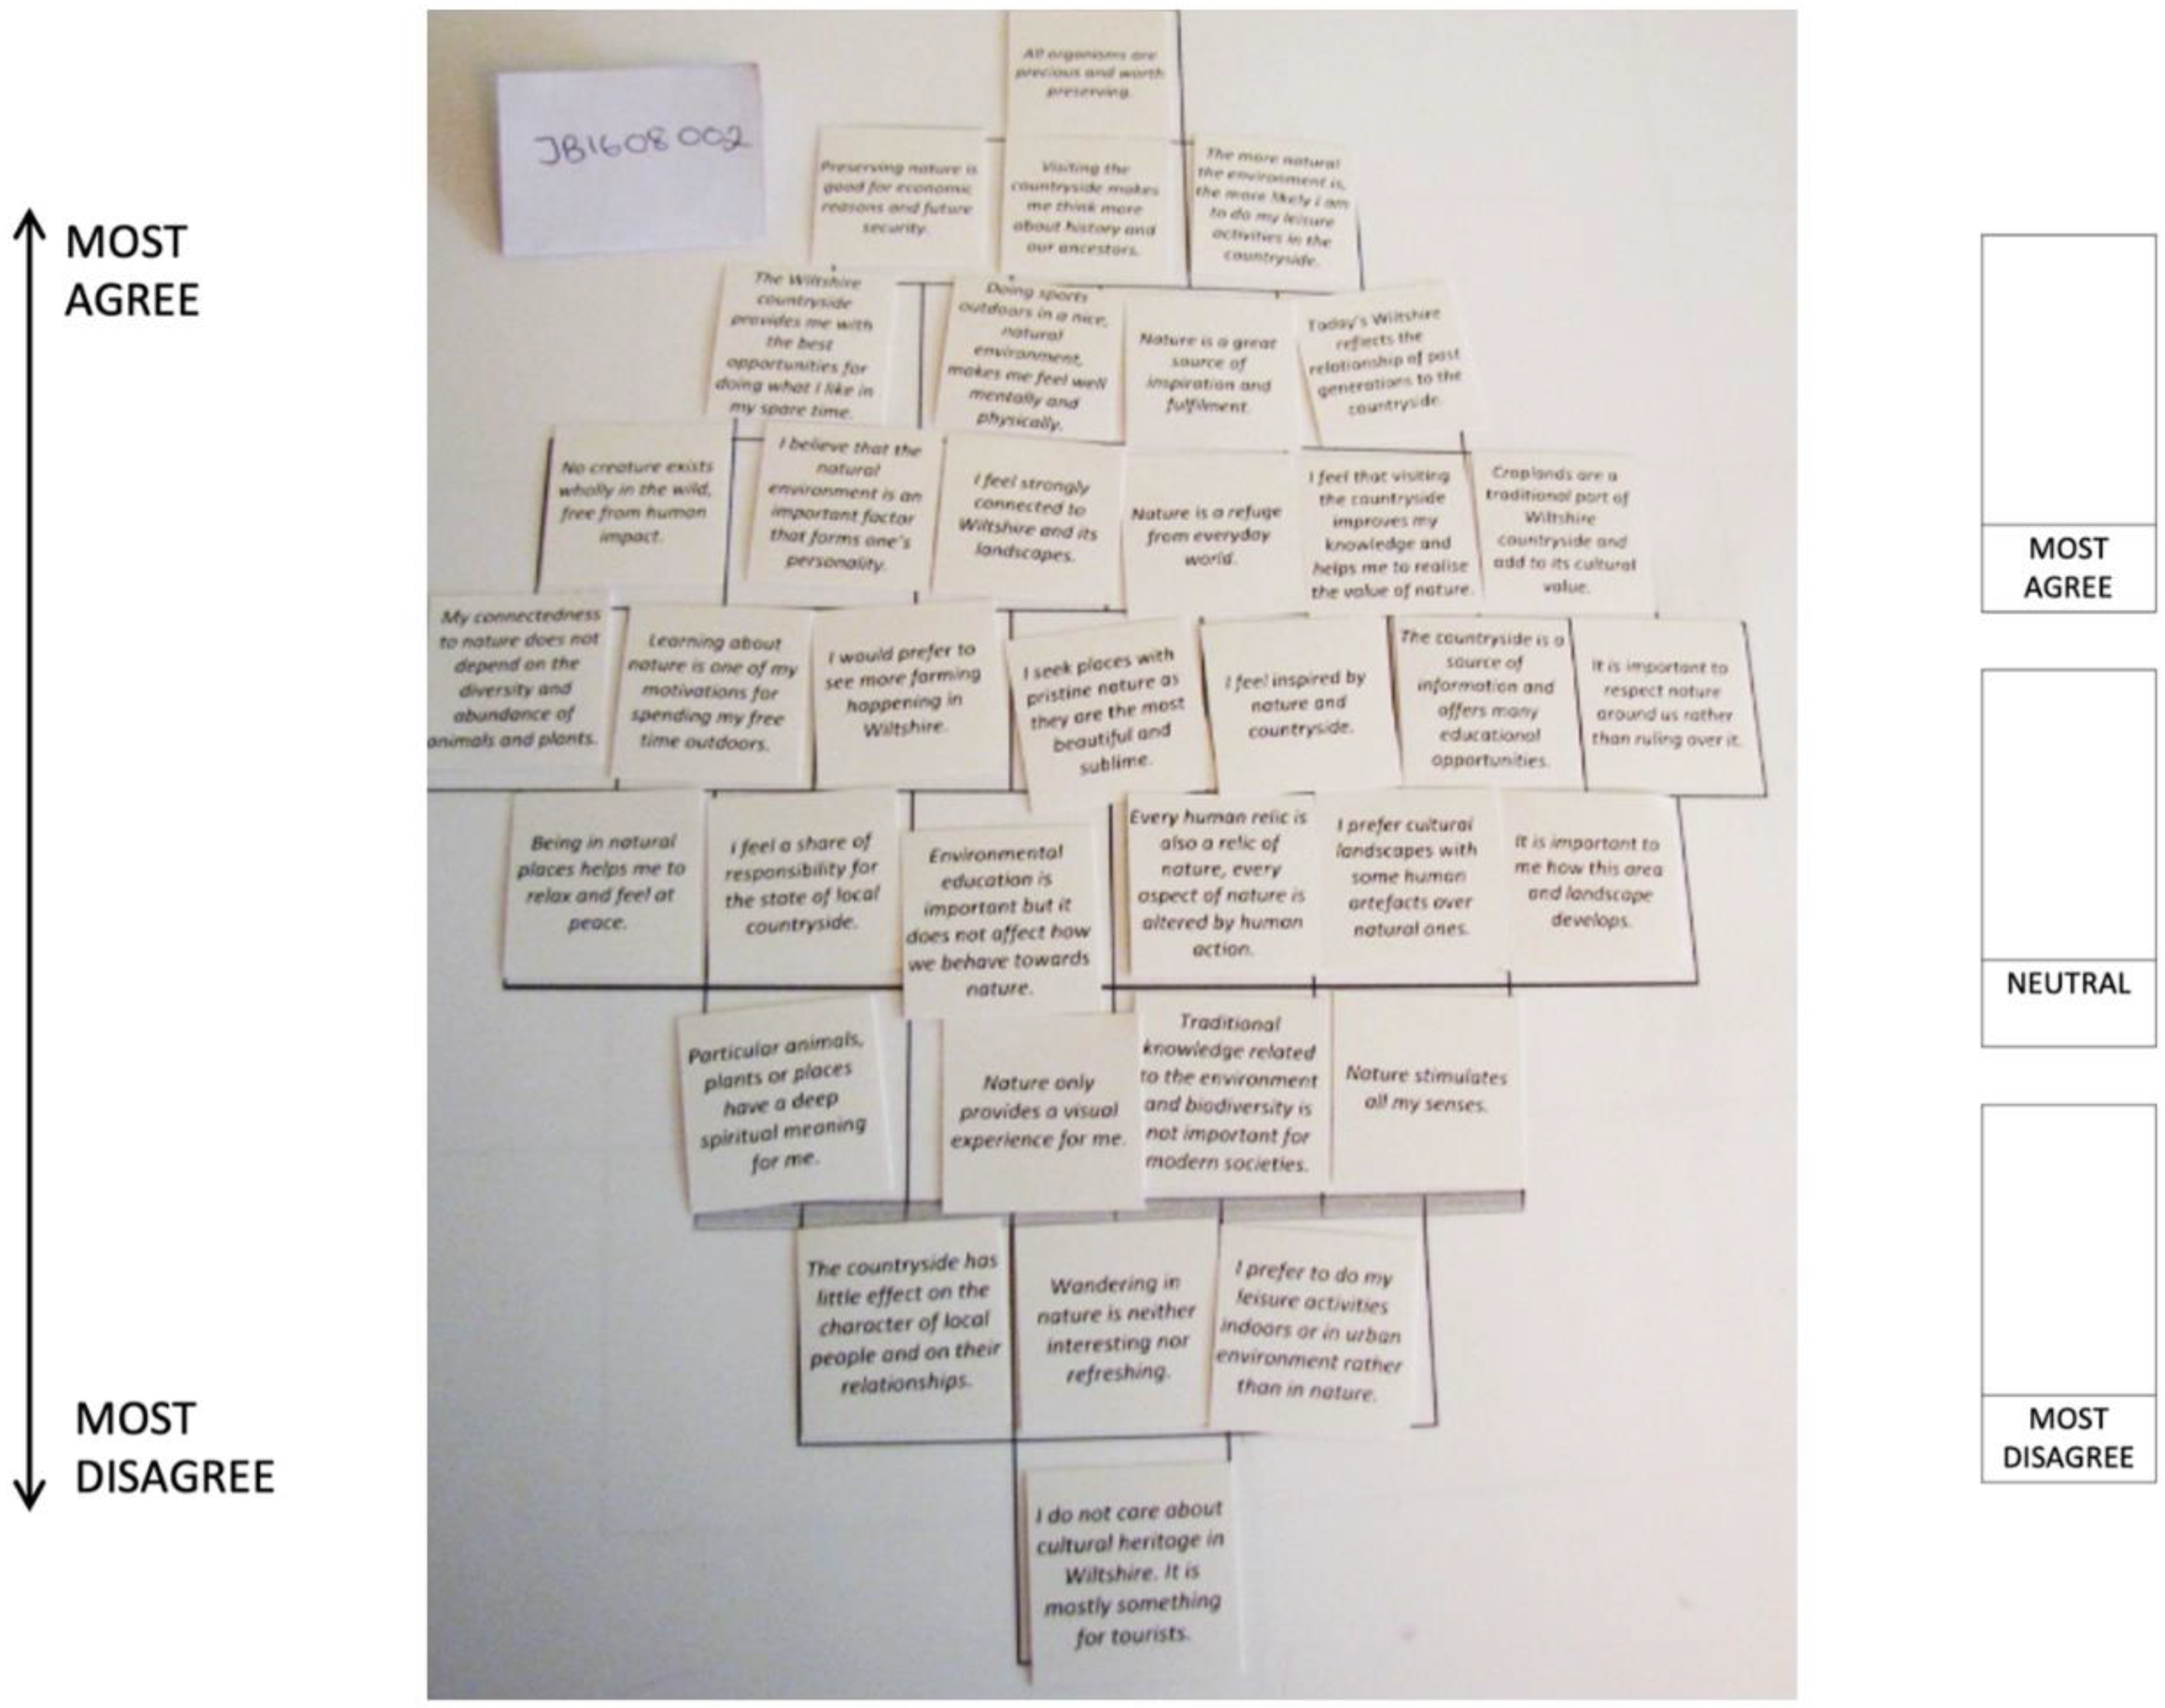
2.3. The Q Sort Design

Following an analysis of the general literature on CES [4,17,40,41,42,43], we constructed a concourse for CES. In synthesising this body of literature, we then divided the CES into seven categories, as shown in Table 1, that corresponded closely with the interpretative pathways to CES benefits identified by King et al. [2] in a study undertaken in England in the Wiltshire countryside. While Diaz et al. [5] have suggested the use of three categories of non-material CES in the NCP framework (learning and inspiration, physical and psychological experiences, supporting identities), for the purposes of this research, we created seven categories in order to provide us with a framework that could be used to develop a more complete set of statements relating to the concourse on CES in the Wiltshire countryside. However, it is worth noting that the categories we develop here also fit within the framework proposed by Diaz et al. [5].
Using these groupings, a set of statements for a range of viewpoints and attitudes was developed using the method described by Brown [31]. Research papers on CES were reviewed and relevant statements generated to reflect these CES. From this pool of statements, five were further developed to represent each of the CES categories (35 statements altogether). In this way, the statements (known as the “Q sample”) were based on the prevailing concourse associated with CES [33], as well as each of the seven categories [44]. They contained both positive and negative narratives in relation to the environment and were worded to use both positive and negative sentence construction (see Table 2).
The 35 statements developed to represent the CES categories were printed out on 5 cm × 5 cm cards. A diamond-shaped Q sort template was then printed out on an A1 sheet. Based on the recommendations of Milcu et al. [18], the template was oriented vertically rather than horizontally in order to make the sorting process easier and more convenient for the respondents. As shown in Figure 2, which illustrates its use during the survey, the vertical orientation meant that the number of places for statements on each row were as follows: 1–3–4–6–7–6–4–3–1.
On the left side of the sheet, there was an arrow advising on the direction of the preference: the closer to the top of the sheet the statement was placed, the greater the agreement. The closer to the bottom of the sheet the statement was placed, the greater was the disagreement.
The Q sort was piloted with a group of eight postgraduate students without any specific links to environmental or social sciences research. The pilot testing involved the Q sort exercise as well as debriefs to discuss the Q sorts and understand respondents’ motivations in sorting the statements in a particular order. After the pilot testing, three statements were modified, and the wording of the main question was slightly altered to improve its clarity for respondents.

2.4. Interviews

According to van Excel and de Graaf [44], there is no absolute rule on the number of participants who should be included for the interviews. However, Brown [45] states that the required number must be large enough to establish the existence of a factor so that one factor can be compared with another. Van Excel & de Graaf [44], however, suggest that there should be at least 4–5 people defining each factor (factors are results from factor analysis, showing segments within the subjective opinions of survey participants). Pereira et al. [38] stated that typically there would be about 20–50 subjects in a Q-methodology study. According to Cheng et al. [39], Q methodology does not require large samples of respondents because its outcome is a detailed insight of different points of views. Previous Q-methodology papers dealing with environmental topics have used between 26 [38] to 129 [46] respondents.
Respondents were identified by the interviewers in order to achieve a spread across key demographic groups. This included a mixture of resident and non-resident respondents, males and females, different age and income groups, and people with various levels of education (see Table A1). Since 93.4% of Wiltshire’s residents were classified as “White British” and 3.2% as “White Other“, ethnicity was not used as a criteria for selecting participants. Altogether, 47 respondents were interviewed, 41 local residents and 6 tourists, and demographic data were used in an attempt to prevent major demographic biases. The final sample was, however, not entirely demographically representative. For example, respondents with education at Level 4 (e.g., Degree/Higher Technical/Other Vocational/Professional) and above were over represented in the sample (50% in the sample, compared with 29.5% in Wiltshire as a whole). However, such biases are inevitable with a small sample, and extrapolation to the wider Wiltshire population must be done cautiously.
The interviews were undertaken one-to-one, face-to-face in different parts of Wiltshire between May and October 2016. They were undertaken by the project researchers and three locally recruited interviewers who had been trained to apply the Q methodology. The project researchers focused on public sites around Salisbury, trying to approach tourists, while the local interviewers sought participants according to demographic characteristics among their contact base. The interviewers were given guidelines on how to undertake the survey, how to assist participants, and how to conduct the follow-up debriefs. They were also trained to deal with issues that had been identified during pilot testing (e.g., respondents not willing to stick to the template or not descriptive enough during the debrief).
Each interview comprised three parts: a short demographic questionnaire, the Q sort activity, and the post-Q sort debrief. The principle of placing the cards on the Q sort template was carefully explained to the respondents. Once seated in front of the statements and template, respondents were asked one question before starting their Q sort in order to contextualise the research: “What best describes your feelings related to the Wiltshire countryside?” Respondents were then asked to read the statements carefully and split them into three groups based on whether they agreed, disagreed, or felt neutral about the statements in relation to the survey question they had been asked. These cards were sorted into the “most agree”, “neutral”, and “most disagree” boxes on the Q sort template. After this, respondents were then asked to place the cards from their “agree” pile on the template. The “agree” pile was then followed by the “neutral” and “disagree” pile. Respondents were given as much time as needed until they were happy with the final Q sort. During the process, respondents were asked about their reasons for placing the statements in the order they eventually defined. The interviews were done indoors due to the rather space- and time-demanding character of the survey method.
When respondents finished their Q sort, interviewers took a photograph of it to record the location of the statements and proceeded to the debrief. The debriefs took the form of a semi-structured discussion and focussed on participant responses to questions during the Q sort and the ordering of statements in the Q sort template. The greatest attention was given to discussing the statements in the top and bottom two rows, closest to the “most agree” and “most disagree” extremes. Respondents were asked why they chose these specific eight statements and what their interpretation of them was. Interviewers also asked how the statements and their meaning linked to the respondents’ everyday lives. At the end of the interview, respondents were asked if there was anything else they wanted to discuss in relation to the topic of the research. All responses were systematically collected and recorded in the form of notes taken by the interviewers to support interpretation of respondent choices in the Q sort. The average time spent on each survey was about one hour for the Q-sort and 15 min for the debrief. The physical record of each interview was a demographic questionnaire, a photograph of the completed Q sort, and written notes from the debrief.

2.5. Analysis

The 47 Q sorts of the respondents were analysed using the PQMethod 2.35 software [47] for the factor analysis and based on the description provided by Brown [31]. Factor analysis shows similarities in the way that respondents sort statements. Participants with similar ranking of statements will have a loading on the same factor and therefore create a pattern [32]. Initially, eight factors were identified, all of them with eigenvalues that were greater than 1.0. Six factors were then identified using the Principal Component Analysis and Varimax rotation [44].
Based on the standard error for factor loading, which for a sort of 35 statements was 0.42 (for significance at p < 0.01), four factors were then extracted. For defining these factors, Q sorts with significant loading on only one factor were used. This grouped together respondents based on similar patterns in the way they sorted the statements. Unallocated respondents with multiple loadings across these factors were then allocated to a particular factor according to their highest factor score.
Categorical narrative analysis of the debriefs was used to interpret the outcomes of the survey. The narratives relating to the selected statements were compared within and between each group to understand the similarities and differences among the groups of respondents. The outcomes of the narrative analysis did not play any role in forming the groups with shared preferences but were used to improve interpretation of the meaning of the statements for each respondent, how they were linked to their lives and experiences of the Wiltshire landscape, and in this way improve the description of the group into which each respondent has been allocated by the factor analysis.

3. Results

The results section provides a brief summary of the demographic background of the participants, followed by result of the factor analysis of the Q sorts and by points of shared preferences and disagreement are discussed. Furthermore, specific groups of preferences are described.

3.1. Demographic Background of Participants

The demographic background of the 47 respondents is described in Appendix A. In comparison with the Wiltshire population, the sample shows a larger proportion of females, a marginally greater proportion in the 25 to 44 and 45 to 64 age categories, marginally lower annual incomes, and a higher level of educational attainment. Respondents in the lowest income range were either retired, students, on maternity leave, or unemployed. “White British” and “White Other” were 87% and 13% of the ethnic background of the sample, respectively.

3.2. Factors Identified

Four factors represented 67% of the total variance of the rotated correlation matrix with 16%, 21%, 14%, and 16% of total variance explained by factors 1, 2, 3, and 4, respectively. Twenty-seven respondents defined the four factors. Out of the remaining 20 respondents, 1 did not have significant loading on any factor and 19 had significant loadings across multiple factors.
Whilst a minimum number of ten respondents is proposed by van Excel and de Graaf [44] in order to be able to identify a minimum of two factors with 4–5 people in each, Fairweather and Swaffield [48] suggested that factors with at least eight respondents are required to provide sufficient information to characterise each factor with confidence.
Initially, the four factors were loaded with 5, 9, 7, and 6 respondents, respectively. Subsequently, respondents with multiple loadings who were not originally used to define factors were then used to provide additional information to characterise each factor. After including respondents with multiple loadings in those factors in which they had the highest factor score, the final loadings were derived using 9, 18, 10, and 9 respondents, respectively. One respondent did not have any loading in any factor and was omitted from further analysis.
Four response patterns were extracted based on statistically different preferences across the range of statements, as shown in Table 2. Each of these factors was also given a group identifier and a title to help describe the dominant theme within nature connectedness, as shown in Table 3. Thus, respondents within Factor 1 (Group 1: Inspired by nature) most appreciated the spirituality and inspiration they gained from nature. Those from Factor 2 (Group 2: Conserving nature) were focused on pristine nature and biodiversity. Respondents from Factor 3 (Group 3: Countryside mix) valued cultural heritage most. Respondents within Factor 4 (Group 4: Outdoor Pursuits) were most interested in opportunities for activities in the countryside. Although most respondents stated that it was important to protect nature and biodiversity, the motivation among the groups was different. While Factors 1 and 2 were more concerned with protection of biodiversity and species (intrinsic and emotional connectivity), Factors 3 and 4 were more concerned with the protection of landscapes and their economic benefits.

3.3. Shared Preferences and Points of Disagreement

Despite the different preferences and background of respondents, some statements had almost identical or very similar preferences across all the four factors. Common preferences are important because they show a consensus of preference, but for the purpose here, they are not a basis for discriminating between groups. Table 2 shows the z-scores for all individual statements converted into a factor array. The z-score is a normalised weighed average statement ranking (strength of preference or indifference) of respondents who defined the particular factor. Z-scores enable a normal distribution to be created for each factor based on average statement ranking and as a result provide an “ideal” composite Q sort, as if created by a hypothetical respondent with a 100% loading on the given factor [44]. Table A2 in the Appendix A shows the loadings for each statement for the four factors, together with rankings, and selected statistics to confirm internal consistency and goodness of fit.
In Table 2, values range between −4 and 4, where −4 means a statement placed at the very bottom of the Q sort (i.e., “most disagree”) and 4 represents a statement at the very top of the Q sort (i.e., “most agree”). The statements in bold were ranked similarly by all four groups. Respondents were indifferent to some statements, showing no strong positive or negative response. These statements, for example, related to the relationship between today’s Wiltshire countryside and past generations and ancestors (statement 21, 22, 23).
Respondents were relatively neutral when it came to statements regarding the effect of the natural environment on people’s personalities (statement 28). However, there appeared to be a slight general disagreement with the statement that it had little effect on the character and relationships of local people as a whole (statement 29). There was general disagreement that nature provides only visual experience, but rather by implication a range of sensory benefits. Some statements, however, provoked more extreme responses and were ranked very negatively by all groups of respondents. These specifically related to the negligible importance of traditional knowledge to modern society (statement 5); the lack of an effect of environmental education on human behaviour towards nature (statement 4); the provision solely of a visual experience from nature (statement 11); and a statement that wandering in nature is neither interesting nor refreshing (statement 20). At the same time, most respondents agreed that being in natural places helps them to relax and feel at peace (statement 17).

3.4. Group 1—Inspired by Nature

There were nine respondents with significant loading in Factor 1, and they expressed the greatest positive preference for statements relating to inspiration and relaxation opportunities provided by nature. They agreed that being in nature was interesting, improved their knowledge, and stimulated all their senses. The statements with the highest z-scores in descending value order were 17, 7, 19, 9. The statements with the lowest z-scores, in ascending value, order were 20, 10, 11, and 4.
In the debriefs, where participants were asked about their choices and motivations, respondents from Group 1 explained their preferences for the natural environment mainly by describing nature as a place that helped them to escape both mentally and physically. They mentioned that nature helped them to get away, for example, not only from noise and traffic but also from everyday stress, work, and personal issues. Others explained that they enjoyed the relaxing, peaceful environment provided by the countryside through a range of activities such as running or walking.
Some respondents described their preferences for specific places or particular ecosystems, for example, forests or rivers. Respondents often mentioned hobbies, such as music, poetry, or photography, that they enjoyed undertaking these activities in natural settings, and that nature inspired them in their artistic creation.
Some respondents stated that they enjoyed other sensory experiences in nature (smelling flowers, tasting berries, touching bark), others referred to the inspiration and relaxation benefits they obtained from being in nature. Many respondents within this group also highlighted the importance of environmental education for influencing people’s behaviour towards nature. Some of them described specific examples of how people changed their behaviour after learning about the implications of their actions.

3.5. Group 2—Conserving Nature

Group 2, which was the largest one, had 18 respondents in total. Some of the most positively or most negatively perceived statements were similar to those for Group 1. However, in this case, the respondents were more focused on nature conservation and the relationship between people and nature. At the same time, they appreciated opportunities for inspiration and relaxation provided by nature. The statements with the highest z-scores, in descending value order, were 32, 17, 30, 9, and those with the lowest z-scores, in ascending value order, were 20, 5, 11, and 10.
Many participants in this group felt there was a general need for conservation and better co-existence of humans with nature. They explained that they were concerned about the impact of human activities on natural ecosystems. They also described the current state of nature as degraded. Some interviewees expressed their concerns for the future and explained that the negative human impacts on nature were much greater than realised. They believed that human activities affected all organisms in the world, no matter how far they were from populated areas. Others, however, pointed out that it was important as far as possible to balance the needs of people and nature.
Some respondents shared their fears on very specific issues in Wiltshire, such as loss of natural ecosystems to agricultural or built land. Some interviewees, however, highlighted the positive conservation effect of military activities in the area. Respondents also explained the importance of traditional knowledge. They stated that sometimes the old way was the best way, expressing the view that not every aspect of human life could be resolved by modern technologies. In the opinion of some in this grouping, traditional knowledge was something gained over centuries by our ancestors and therefore was the most valuable information we could possibly have. Some also referred to herbs and natural remedies and how these could be more effective than modern medicines or food supplements. Others highlighted the importance of traditional knowledge in relation to agricultural management practices. Some respondents mentioned tribal cultures and how tribal peoples could live in harmony with nature. Some people within this group also expressed a preference for pristine nature and a natural environment without traces of human activity.

3.6. Group 3—Countryside Mix

The group of respondents with significant loading on Factor 3 comprised 10 people, and these expressed preferences for statements emphasising nature conservation and the state of the countryside. The highest z-scores in descending value order were assigned to statements 33, 30, 31, 17 and the lowest in ascending value order to statements 20, 25, 11, 13. Unlike for Group 2, participants in this group were concerned about the countryside and landscape as a whole rather than species and biodiversity protection. In this respect, compared with other groups, they tended to prefer multifunctional landscapes comprising natural ecosystems, agricultural land, and human-made structures, combined with landscape and nature conservation.
Respondents often referred to the benefits people gain from nature such as agricultural goods, clean air, or living space. The principles of sustainable development were also mentioned during the interviews, especially in relation to agriculture, conservation of agricultural land, and future food security. Some respondents also shared their fears that there was too much building going on in the area and that buildings would replace not only agricultural land but also places used for outdoor recreation activities, such as footpaths. They shared the opinion that nature does not need to be pristine to be beautiful and even managed agricultural landscapes are visually pleasing. One interviewee believed that it was important to find a balance between natural ecosystems and agricultural land. If either were too dominant, recreation opportunities and access to the land could be limited.
Respondents within this group also mentioned the mutual relationship between countryside and people. While people left their imprints on the countryside, the countryside also shaped them and their personalities. They shared a sense of responsibility for the state of the local countryside and referred to their efforts to protect or improve the state of countryside, for instance by avoiding leaving litter.
Unlike the other groups, people within Group 3 emphasised the importance of cultural heritage in Wiltshire. Some said that not everyone realised how precious these sites were and that people tended to ignore the natural as well as cultural heritage of the countryside. Others described the important role of Wiltshire’s historical sites in local and global contexts.

3.7. Group 4—Outdoor Pursuits

There were nine respondents with a significant loading in Factor 4 and they gave the highest scores to the statements related to physical activities in the countryside and the positive effects of nature on their mental well-being. The highest z-scores in descending value order were given for statements 17, 16, 19, 33 and the lowest in ascending value order to statements 25, 20, 10, and 5.
These respondents appreciated nature as a place for physical activities as well as a refuge where they could rest and relieve everyday stress. At the same time, they felt connected to the Wiltshire countryside and agreed that it offered the best opportunities for their leisure activities. Respondents often described how they engaged in outdoor activities on a daily basis, for example, walking their dog or going for short walks just outside their towns or villages. They stated that Wiltshire’s cultural heritage made it a special and unique region.
People in this group appreciated the traditional aspects of the region, including traditional croplands and historical sites. Most of the respondents were born and raised in Wiltshire, and their families had lived in the region for generations. For that reason, they were also very concerned about the future of the region. In a similar way to respondents from Group 3, interviewees from Group 4 shared their concerns regarding excessive building development in the region and perceived cropland as a traditional part of the Wiltshire landscape. However, unlike the other Groups, they supported the expansion of agriculture in the area and would like to see more land dedicated to farming.

4. Discussion

4.1. Types of Respondents and the Benefits They Gained from the Countryside

The survey helped to identify four types of respondents based on their preferences for seven main groups of CES. These CES were related not only to the general concept of cultural benefits [4,16,49,50] but also to the Wiltshire landscapes, emphasising the unique character of the region and its natural settings.
The results showed that people perceived nature from a range of different perspectives and used it for a wide range of purposes. While there was common agreement on some aspects, the respondents here self-reported different benefits from the countryside and appreciated different elements of landscapes. The analysis showed that their preferences were often highly individual, and this is reinforced by the findings from other authors [24,51], who have noted that preferences for CES are affected by a personal value systems, beliefs, habits, traditions, and lifestyle. McGinlay et al. [9], drawing evidence from the Wiltshire area, also show that personal antecedent factors, such as knowledge of ecology, participation in nature-based activities, and membership of nature organisations can influence people’s expressed preferences for nature. None the less, the assessment here identified significantly different groupings of preferences that have implications for understanding and managing the interaction between people and the natural environment.
The relatively small sample of respondents, which was given by the choice of method, and the small number within each factor group mean that caution is required in any attempt to generalise the results to the population as a whole or to draw firm conclusions based on socio-demographic characteristics. However, the typology identified here is indicative of the commonality and the variation that exists at the larger scale and could help to inform further research on the different ways that people perceive benefits from nature. Moreover, the findings clearly show the subjectivity of CES, where different respondents benefit from the same CES in different ways and in different settings. For example, a majority of respondents claimed that being in natural places helped them to relax and feel peaceful. However, the characteristics of the location and activity related to these benefits differed from person to person.

4.2. Nature Protection and the Definition of Nature

Most respondents across all four groups perceived nature as a place that enabled them to escape from stress. This finding corresponds to those of other authors [52,53]. However, the definition of nature and the extent of its naturalness differed among the four groups. The research questions were directly related to the Wiltshire countryside, and therefore nature in this context was not independent of its settings. The understanding of the terms “nature” and “countryside” differed among the groups. As described in the following paragraph, respondents in Group 2 (Conserving nature) perceived nature mainly as a natural ecosystem, while the other three groups defined nature as countryside, i.e., a multifunctional socio-ecological landscape.
The statements with the greatest rate of disagreement were those related to pristine nature. For respondents in Group 2, nature should have a high degree of pristineness, high biodiversity, and should be without trace of human activity (see Table 2, z-scores for statement 13). On the other hand, respondents in Group 3 (Countryside mix) describe nature as a typical Wiltshire landscape comprising Salisbury Plain with its grasslands, croplands, and cultural heritage. For Group 1 (Inspired by nature) and Group 2, nature was a landscape with some elements that would enable them to access CES in a convenient way, using bridges, footpaths, and other access options, but generally with only a few built structures that looked obviously human-made, such as houses. This was illustrated by the ranking of the statement that “Preserving nature is good for economic reasons and future security”. Whilst respondents from Groups 1 and 2 were rather neutral in relation to this, those from Groups 3 and 4 (Outdoor pursuit) ranked this statement very highly, reflecting a more instrumental and utilitarian perception of the landscape and nature as a resource.
According to Waitt et al. [54], people often perceive close association between nature and human-made structures. Indeed, King et al. [2] working in the Salisbury area found that people closely associate biotic, abiotic, and human-made features in their appreciation of environmental settings. In this context, respondents in Groups 1 and 3 seem to be most functional in terms of the type of countryside they prefer for their purposes, especially for leisure activities. These participants were clear about the specific benefits they gained from nature and the way they consumed these. The presence of the countryside and its accessibility were more important than the type of the landscape. They did not seek a pristine natural environment, and their preference for countryside leisure activities was not affected by how natural the environment was. Tourism and recreation activities reduce the pristine aspect [55,56]. Indeed, as Waitt et al. [54] argue, the concept of pristine nature is probably not realistic in modern society, and it is more suitable to consider “wilderness experiences” gained even from a managed landscape. According to Cronon [57], wilderness is the ultimate place of authenticity with no place for humans.
As pointed out by Castree [58], however, nature has never been simply natural and now is less natural than ever before. Landscape, as we know it today, is, to a large extent, a cultural construct, and its state has been co-created by humans. Most landscapes in Europe have been changing for thousands of years and offer a rich cultural heritage. According to Agnoletti [27], there is, in fact, very little area of untouched natural landscape in Europe (<5% of the total area). Most are cultural landscapes with a strong influence of agriculture and forestry. There is, therefore, a question as to what extent the idea of pristine nature as described by Group 2 is realistic. The interpretation by the other three groups, which perceived nature more as a managed landscape, seems to be more pragmatic, at least for the English countryside of the 21st century. This is consistent with Graumann’s [59] suggestion that the term landscape should go beyond the physical aspect of nature and include social, historical, and religious aspects.
Understanding the perceived synergies and trade-offs in the landscape is critical both for those concerned with promoting wellbeing through “connectivity with nature” and for those concerned with nature conservation. Our research, especially the debriefs, showed that most respondents preferred cultural, multifunctional landscapes [2] to pristine nature. In fact, most respondents perceived cultural landscapes as a part of nature. This was particularly the case for respondents in Groups 1, 3, and 4. The debriefs revealed that most people wanted to get away from their everyday lives and relax. For these people, accessibility and infrastructure were necessary in order to gain CES, and this was more important than the type of ecosystem visited or its degree of naturalness. This applied even for respondents who stated that they did not like large cropland areas and landscapes comprising solely for farmed fields.
Most respondents reported a wide range of CES benefits irrespective of the mix of cultural and natural characteristics of the landscape. An important feature proved to be the spatial distribution of large human-made objects such as major roads, built-up areas, or huge, contiguous fields. These were frequently mentioned during the debriefs. Respondents across all the groups were concerned by the extent of the building occurring in the region, whether on agricultural or other land. This concern was, however, mainly directed at modern constructions because most respondents appreciated the large-scale cultural artefacts of the region, such as Stonehenge or Avebury, and perceived these to be part of the historic landscape. This reflects findings in the literature showing that historical and religious sites are often perceived as elements of a landscape [59] and that cultural heritage artefacts are perceived to be public goods with their presence generally viewed as positive [60].

4.3. The Role of Biodiversity

Most respondents across the four groups were generally neutral about the statement expressing that their connection to nature did not depend on the diversity and abundance of animals and plants (Table 2: statement 26). This was also found to be the case for the statement focused on the need for organism protection and conservation (Table 2: statement 32), especially for respondents within Groups 1, 3, and 4. This was, however, related to the fact that many respondents believed they would be better off without certain organisms, particular those they viewed to be pests and specific insects. Thus, these findings do not necessarily mean that the respondents did not care about wildlife and nature but rather that other CES were more important to them, providing them with greater benefits. As observed by King et al. [2], beyond those with particular ecological knowledge or interest, the majority of people interact with nature at the landscape and broad habitat scale, such that the benefits they derive do not appear to be sensitive to gradients of species abundance or mix. Our observations also support the findings of Keniger et al. [61], who suggested that the characteristics of natural settings (e.g., accessibility, proximity, species richness or abundance) may be of differing importance to people from various regions and cultures, but also socio-economic groups. Responsiveness to biodiversity can also, of course, be very context-specific. Luck et al. [62], working in urban areas, found positive associations between personal well-being and species richness, abundance, vegetation cover, and density.
It was also apparent that opinions on the impact of human behaviour on biodiversity differed amongst our respondents. The predominantly conservationist members of Group 2 believed that human action affected all the organisms in the world. The other three groups had more moderate opinions, and respondents within Group 3 slightly agreed, whilst those in Groups 1 and 4 slightly disagreed.

4.4. Implications for Policy and Practice

The importance of understanding the ways that people interact with the natural environment to generate cultural services processes for landscape planning and management has been recognised by many authors [15,16,22,27,63]. Not only do CES have a positive impact on the mental and physical well-being of residents and visitors, but their importance to residents can often be greater than the importance of other more tangible ecosystem services that have a market value [64]. However, those facilitating access to the countryside and working in conservation have only recently begun to engage with the notion that profiling users can be of benefit to them.
The concept of CES can be especially useful for developing strategies with wide general appeal whilst at the same time providing a means to meet the focussed needs of particular groups. For example, it was found here that our respondents generally expressed a strong agreement that actually visiting and experiencing the countryside is needed in order to obtain the benefits that nature can provide. They also agreed that their appreciation of the countryside was enhanced by improved knowledge of nature, whether based on science or tradition. Respondents expressed a considerable preference for the peacefulness and tranquillity of the countryside, and of a wide range of sensory benefits. These points of wide appeal, consistent with the finding of other researchers, are important for policy makers and conservation managers wishing to promote CES for the benefit of people, whilst also delivering their key aim of protecting and enhancing biodiversity. Policy initiatives and project-scale actions to facilitate access, to build knowledge, and to enhance the visitor experience are key pathways to generating CES benefits.
In addition to these general themes, our analysis shows that there are different groups of users with different needs who have different pathways for gaining benefits from nature. Our four groupings and associated factors differed in terms of the relative intrinsic and functional interactions with the natural environment. Groups 1 and 2 demonstrate a relatively well-developed connection to nature, driven by strong inspirational and intuitive connection, and a commitment to stewardship. These groups are relatively easy to target through existing provisions and promotional campaigns. Groups 3 and 4 are more ambivalent about the environment with a tendency towards functional “user”-oriented relationships. From a conservation-management viewpoint, these groups may be more difficult to reach and target, particularly as they may tend to place relatively low importance on biodiversity, especially where it is perceived to limit or constrain their main countryside interests, whether this is as space for farming or outdoor pursuits. Potential conflicts may arise between the CES preferences of different groups, as these may require different qualities in the natural environment, for example, between preferences for undisturbed habitats, tranquillity, or intense sporting activities. Understanding and seeking to achieve an appropriate balance between these different needs, and addressing tensions where they arise, are key to successful conservation site management.
As found by earlier research in the area [2], respondents identified infrastructure as a key enabler for generating CES provided by the countryside. The most crucial were public rights of way providing access to the countryside, including footpaths, tracks, gateways, and bridges. People also appreciated the added educational value provided by information on some of the historic footpaths in the region. From a policy and practice viewpoint, investment in infrastructure and information to support access to and learning about the countryside is a critical component of strategies to generate CES benefits [65].
The Q method is not without its theoretical and practical challenges, not least constructing the Q concourse and statements and achieving a representative sample. The technique, however, has much potential to explain the heterogeneity and convergence of relationships between people and nature. This confirms the conclusion by Cheng et al. [39] that Q method has an important role in CES research because it allows for a more in-depth assessment of CES at personal level and, unlike other more rigid methods, enables evaluation of often neglected services. Furthermore, the Q method as demonstrated here can provide a systematic participatory learning tool for use by project managers seeking to understand their various user and beneficiary groups. Insights provided by a Q method survey can be extremely helpful for politicians and policy makers in order to design policies and landscapes that would allow as many types of users to access groups of CES in the most effective way and to obtain the highest possible benefits. In our view, the Q method can run alongside other survey methods to assess the use of the countryside, providing rich and measurable insights into the diversity of connections that people have with nature.

4.5. Future Research

Our study has provided an initial and exploratory analysis of how people are grouped by their preferences for CES in Wiltshire. Future work could focus on building on the research undertaken here. A key need is to refine the typology of groups devel-oped here and ensure that it is complete. This could be done by expanding the numbers of respondents and ensuring improved representation of the population that benefits from the countryside. CES are a relatively new and underdeveloped focus for research, and as knowledge of CES grows, the concourse will develop and deepen. New and improved statements for the Q sort will need to be developed to represent this growth in knowledge in the future. Here, the statements representing the concourse were developed primarily through a review of literature, and it is recommended that future re-search should also develop these collaboratively with practitioners in conservation and landscape management as well as the users and beneficiaries of the countryside. Q methodology was used here to identify groupings of people according to their CES preferences. Future research needs to determine how these groupings, and the characteristics that define them, can be used pragmatically in policy and management to improve the benefits of CES to people.

5. Conclusions

The analysis of Q sort data and debriefs showed that people experienced nature from different perspectives and interacted with it for a wide range of purposes, obtaining different benefits from different elements of the landscapes. The ability to derive these benefits was enhanced by visiting the countryside and understanding nature.
Through our use of Q methodology, we identified four different groupings of people with preferences for different combinations of CES benefits from the Wiltshire countryside. The groups comprised those who appreciated inspiration, spirituality, and relaxation opportunities (Group 1—Inspired by nature); those who were focused on the conservation of biodiversity and sought pristine nature (Group 2—Conserving nature); those who most valued cultural heritage and enjoyed multi-functional cultural landscapes (Group 3—Countryside mix); and those who enjoyed nature through various outdoor activities and sports (Group 4—Outdoor pursuits).
While perceptions of nature differed among the groups, most respondents agreed that natural places helped them to relax, escape from stress, and feel at peace. In this respect, access to the countryside is essential and needs to be facilitated in a way that does not lead to the degradation of CES for the different types of users identified. It was shown that different groups of people benefit from different CES and their needs should be taken into account in landscape planning and conservation management. This may help to inform actions to enhance the understanding of, and connectively with, nature in the countryside, as well as manage the potential tensions that may arise between different interests. It was found that facilities that provide access to the countryside are essential for enabling people to benefit from CES. The findings here, along with further use of the Q method, can help to guide future management of multi-functional landscapes in order to provide a wide range of CES for the benefit of nature and people.

Author Contributions

Conceptualization, J.M. (Joe Morris), A.R.G. and D.J.P.; methodology, J.M. (Joe Morris), M.H., A.R.G., D.J.P. and J.M. (James McGinlayand); formal analysis, M.H. and J.M. (Joe Morris); investigation, M.H.; resources, A.R.G. and J.M. (Joe Morris); data curation, M.H.; writing—original draft preparation, M.H. and J.M. (James McGinlayand); writing—review and editing, A.R.G., J.M. (Joe Morris), J.M. (James McGinlayand) and D.J.P.; supervision, A.R.G. and J.M. (Joe Morris); project administration, ARG.; funding acquisition, A.R.G. and J.M. (Joe Morris). All authors have read and agreed to the published version of the manuscript.

Funding

This research was funded by the European Union through an ERASMUS+ traineeship and by the UK Natural Environmental Research Council (NERC) under the “Bio-diversity and the provision of multiple ecosystem services in current and future lowland multi-functional landscapes (Wessex-BESS)” project (grant number: NE/J014710/1).

Institutional Review Board Statement

The study was conducted in accordance with the Declaration of Helsinki, and approved by the Ethics Committee of Cranfield University (project ID 1242 and 6 April 2016).

Informed Consent Statement

Informed consent was obtained from all subjects involved in the study.

Data Availability Statement

The data presented in this study are available on request from the corresponding author.

Acknowledgments

We thank the European Union for the provision of an ERASMUS+ traineeship that provided the initial impetus for this research. Many thanks are also given to the UK Natural Environment Research Council (NERC) for their funding of the “Biodiversity and the provision of multiple ecosystem services in current and future lowland multifunctional landscapes (Wessex-BESS) as part of the overall Biodiversity and Ecosystem Service Sustainability (BESS) programme. We also thank the Wiltshire Wildlife Trust and Wiltshire Council for supporting our research, as well as local residents and respondents who made the time to help us with our interviews.

Conflicts of Interest

The authors declare no conflict of interest.

Appendix A

Table A1. Demographic Background of Participants.
AttributeSurvey Sample (%)Wiltshire (%)Comments
Gender:
Male34.849.2The total sample size was 47, of which 41 were local residents and 6 were tourists
Female65.250.8
Age profile:
16–248.716.2 ** age 15–24
25–4432.625.8
45–643733.5
65–7415.213.2
75+6.511.3
Income bracket
Less than £10,400 per year19.68 **** UK statistic:
Survey of Personal Income, January 2015, ONS. Figures for 2012–2013 for UK.
£10,400–£15,600 per year21.723
£15,600–£20,800 per year13.118
£20,800–£26,000 per year4.314
£26,000–£31,200 per year8.710
£31,200–£41,600 per year6.512Wiltshire median personal income: £23,200
£41,600–£52,000 per year2.26
Over £52,000 per year2.29
Not available21.7
Religion:
Yes39.1 ***65.8 #*** of which most (37%) are Christian denominations
No60.9 (no/not stated)34.2 (no/not stated)# of which most (64.1%) are Christian denominations
Ethnicity:
White British8793.4
White Other133.2
Other03.4
Highest level of education:
None reported2.218.7
Level 1 School Cert.014
Level 2 General Cert./National Cert./Technical21.721.1
Level 3 Advanced Sch. Cert.1112.7
Level 4 Degree/Higher Technical5029.5
Other Vocational/Professional)13.14.2
Employment:
In paid employment69.674.5 ** UK statistic for employment rate age 16–64, April–June 2016
Not in paid employment30.425.5 *
Data Sources for Wiltshire: ONS (2017).
Table A2. Factor Score, Ranks * and Statistics.
StatementF1F2F3F4
Factor ScoreRankFactor ScoreRankFactor ScoreRankFactor ScoreRank
10.34140.46131.2160.2618
20.55120.72110.9580.5710
30.5413−0.1423−0.3423−0.2723
4−1.3332−1.2431−0.7928−1.0829
5−1.2430−2.0134−1.0930−1.4132
6−0.01210.7210−0.74270.649
71.5220.45140.15161.117
80.118−0.31240.37141.286
91.2641.0640.27150.3415
10−1.5734−1.4932−0.4625−1.6433
11−1.3533−1.6533−1.5133−1.0628
12−1.1028−0.8528−1.0829−1.1731
13−0.66250.848−1.4632−0.0519
140.14160190.9490.778
151.1850.799−0.30220.4313
16−0.45230.977−0.28201.452
171.6611.4921.3641.491
180.819−0.0220−0.3021−0.4625
191.3531.0450.44121.393
20−1.7835−2.1135−2.0235−1.9134
210.04190.1180.58110.3116
220.1217−0.04210.67100.317
23−0.55240.1417−0.3724−0.5726
24−1.05270.9860.3913−0.9727
25−1.2429−1.1429−1.6834−1.9235
26−0.8426−0.53260.0319−0.4524
271.088−0.47250.9570.5312
280.16150.66120.0718−0.1121
29−1.3331−1.1730−1.3431−1.0930
301.0971.3531.522−0.1020
310.65110.16161.4330.4214
321.1661.6810.1417−0.2222
330.1200.43151.6611.354
34−0.0522−0.7727−0.67260.5311
350.7910−0.09221.3151.335
No. of defining variables918109
Average rel. coef.0.80.80.80.8
Composite reliability0.9730.9860.9760.973
S.E. of factor Z scores0.1640.1170.1560.164
* ranks (measured on a scale + (high) to − (low)).

References

  1. IPBES. The Methodological Assessment Report on Scenarios and Models of Biodiversity and Ecosystem Services; Ferrier, S., Ninan, K.N., Leadley, P., Alkemade, R., Acosta, L.A., Akçakaya, L., Brotons, W.W.L., Cheung, V., Christensen, K.A., Harhash, J., et al., Eds.; Secretariat of the Intergovernmental Science-Policy Platform on Biodiversity and Ecosystem Services: Bonn, Germany, 2016; 348p. [Google Scholar]
  2. King, H.P.; Morris, J.; Graves, A.; Bradbury, R.B.; McGinlay, J.; Bullock, J.M. Biodiversity and cultural ecosystem benefits in lowland landscapes in southern England. J. Environ. Psychol. 2017, 53, 185–197. [Google Scholar] [CrossRef] [Green Version]
  3. Csurgó, B.; Smith, M.K. The value of cultural ecosystem services in a rural landscape context. J. Rural. Stud. 2021, 86, 76–86. [Google Scholar] [CrossRef]
  4. MA (Millennium Ecosystem Assessment). Ecosystems and Human Well-Being: Synthesis; Island Press: Washington, DC, USA, 2005. [Google Scholar]
  5. Diaz, S.; Pascual, U.; Stenseke, M.; Martin-Lopez, B.; Watson, R.T.; Molnar, Z.; Hill, R.; Chan, K.M.A.; Baste, I.A.; Brauman, K.A.; et al. Assessing nature’s contributions to people. Science 2018, 359, 270–272. [Google Scholar] [CrossRef] [PubMed] [Green Version]
  6. Hirons, M.; Comberti, C.; Dunford, R. Valuing cultural ecosystem services. Annu. Rev. Environ. Resour. 2016, 41, 545–574. [Google Scholar] [CrossRef]
  7. Blicharska, M.; Smithers, R.J.; Hedblomd, M.; Hedenåsd, H.; Mikusińskif, G.; Pedersen, E.; Sandströmd, P.; Svenssoni, J. Shades of grey challenge practical application of the cultural ecosystem services concept. Ecosyst. Serv. 2017, 23, 55–70. [Google Scholar] [CrossRef]
  8. Kaplan-Hallam, M.; Bennett, N.J. Adaptive social impact management for conservation and environmental management. Conserv. Biol. 2017, 32, 304–314. [Google Scholar] [CrossRef] [Green Version]
  9. McGinlay, J.; Parsons, D.J.; Morris, J.; Graves, A.; Hubatova, M.; Bradbury, R.B.; Bullock, J.M. Leisure activities and social factors influence the generation of cultural ecosystem service benefits. Ecosyst. Serv. 2018, 31, 468–480. [Google Scholar] [CrossRef]
  10. Auer, A.; Maceira, N.; Nahuelhual, L. Agriculturisation and trade-offs between commodity production and cultural ecosystem services: A case study in Balcarce County. J. Rural. Stud. 2017, 53, 88–101. [Google Scholar] [CrossRef]
  11. Puren, K.; Roos, V.; Coetzee, H. Sense of place: Using people’s experiences in relation to a rural landscape to inform spatial planning guidelines. Int. Plan. Stud. 2018, 23, 16–36. [Google Scholar] [CrossRef]
  12. Tratalos, J.A.; Haines-Young, R.; Potschin, M.; Fish, R.; Church, A. Cultural ecosystem services in the UK: Lessons on designing indicators to inform management and policy. Ecol. Indic. 2016, 61, 63–73. [Google Scholar] [CrossRef] [Green Version]
  13. Church, A.; Burgess, J.; Ravenscroft, N. Cultural Services; The UK National Ecosystem Assessment Technical Report; UK National Ecosystem Assessment, UNEP-WCMC: Cambridge, UK, 2011. [Google Scholar]
  14. Chan, K.M.A.; Satterfield, T.; Goldstein, J. Rethinking ecosystem services to better address and navigate cultural values. Ecol. Econ. 2012, 74, 8–18. [Google Scholar] [CrossRef] [Green Version]
  15. Hernandez-Morcillo, M.; Plieninger, T.; Bieling, C. An empirical review of cultural ecosystem services indica-tors. Ecol. Indic. 2013, 29, 434–444. [Google Scholar] [CrossRef]
  16. Fish, R.; Church, A.; Winter, M. Conceptualising cultural ecosystem services: A novel framework for research and critical engagement. Ecosyst. Serv. 2016, 21, 208–217. [Google Scholar] [CrossRef] [Green Version]
  17. Daniel, T.C.; Muhar, A.; Arnberger, A.; Aznar, O.; Boyd, J.W.; Chan, K.M.A.; Costanza, R.; Elmqvist, T.; Flint, C.G.; Gobster, P.H.; et al. Contributions of cultural services to the ecosystem services agenda. Proc. Natl. Acad. Sci. USA 2012, 109, 8812–8819. [Google Scholar] [CrossRef] [Green Version]
  18. Milcu, A.I.; Hanspach, J.; Abson, D.; Fischer, J. Cultural Ecosystem Services: A Literature Review and Prospects for Future Research. Ecol. Soc. 2013, 18, 565–598. [Google Scholar] [CrossRef] [Green Version]
  19. Hein, L.; van Koppen, K.; de Groot, R.S.; van Ierland, E.C. Spatial scales, stakeholders and the valuation of ecosystem services. Ecol. Econ. 2006, 57, 209–228. [Google Scholar] [CrossRef]
  20. Ram, Y.; Kay Smith, M. An Assessment of visited landscapes using a Cultural Ecosystem Services framework. Tour. Geogr. 2019, 24, 523–548. [Google Scholar] [CrossRef]
  21. Nowak-Olejnik, A.; Schirpke, U.; Tappeiner, U. A Systematic review on subjective well-being benefits associated with cultural ecosystem services. Ecosyst. Serv. 2022, 57, 101467. [Google Scholar] [CrossRef]
  22. Burkhard, B.; Kroll, F.; Nedkov, S.; Muller, F. Mapping ecosystem service supply, demand and budgets. Ecol. Indic. 2012, 21, 17–29. [Google Scholar] [CrossRef]
  23. Chan, K.M.A.; Balvanera, P.; Benessaiah, M.; Chapman, M.; Díaz, S.; Gómez-Baggethun, E.; Gould, R.; Hannahs, N.; Jax, K.; Klain, S.; et al. Why protect nature? Rethinking values and the environment. Proc. Natl. Acad. Sci. USA 2016, 113, 1462–1465. [Google Scholar] [CrossRef] [Green Version]
  24. Kumar, M.; Kumar, P. Valuation of the ecosystem services: A psycho-cultural perspective. Ecol. Econ. 2008, 64, 808–819. [Google Scholar] [CrossRef]
  25. Schmidt, K.; Sachse, R.; Walz, A. Current role of social benefits in ecosystem service assessment. Landsc. Urban Plan. 2016, 149, 49–64. [Google Scholar] [CrossRef] [Green Version]
  26. McGinlay, J.; Parsons, D.J.; Morris, J.; Hubatova, M.; Graves, A.; Bradbury, R.B.; Bullock, J.M. Do charismatic species groups generate more cultural ecosystem service benefits? Ecosyst. Serv. 2017, 27, 15–24. [Google Scholar] [CrossRef] [Green Version]
  27. Agnoleti, M. Rural landscape, nature conservation and culture: Some notes on research trends and management approaches from a (southern) European perspective. Landsc. Urban Plan. 2014, 126, 66–73. [Google Scholar] [CrossRef]
  28. Restall, B.; Conrad, E. A literature review of connectedness to nature and its potential for environmental management. J. Environ. Manag. 2015, 159, 264–278. [Google Scholar] [CrossRef] [Green Version]
  29. Schultz, W.P. Inclusion with Nature: The Psychology of Human-Nature Relationship. In Psychology of Sustainable Development; Schmuck, P.W., Schultz, W.P., Eds.; Kluwer Academic: Norwell, MA, USA, 2002; pp. 62–78. [Google Scholar]
  30. ONS. 2011 Census Data. In Office for National Statistics. Available online: https://www.ons.gov.uk/census/2011census/2011censusdata (accessed on 14 January 2023).
  31. Brown, S.R. A Primer on Q Methodology. Operant. Subj. 1993, 16, 91–138. [Google Scholar] [CrossRef]
  32. Coogan, J.; Herrington, N. Q methodology: An overview. Res. Teach. Educ. 2011, 1, 24–28. [Google Scholar]
  33. Webler, T.; Danielson, S.; Tuler, S. Using Q Method to Reveal Social Perspectives in Environmental Research; Social and Environmental Research Institute: Greenfield, MA, USA, 2009; Volume 54, pp. 1–45. [Google Scholar]
  34. Pike, K.; Wright, P.; Wink, B.; Fletcher, S. The assessment of cultural ecosystem services in the marine environment using Q methodology. J. Coast. Conserv. 2015, 19, 667–675. [Google Scholar] [CrossRef] [Green Version]
  35. Pitt, D.G.; Sube, E.H. The Q-Sort method: Use in Landscape Assessment Research and Landscape Planning. In Proceedings of the National Landscape: A Conference on Applied Techniques for Analysis and Management of the Visual Resources, Incline Village, NV, USA, 23–25 April 1979; Elsner, G.H., Smarden, R.C., Eds.; Pacific SW Forestry and Range Experimental Station: Berkeley, CA, USA, 1979. [Google Scholar]
  36. Neff, M.W. What research should be done and why? Four competing visions among ecologists. Front. Ecol. Environ. 2011, 9, 462–469. [Google Scholar] [CrossRef] [Green Version]
  37. Blicharska, M.; Grandin, U. Why protect biodiversity? Perspectives of conservation professionals in Poland. Int. J. Biodivers. Sci. Ecosyst. Serv. Manag. 2015, 11, 349–362. [Google Scholar] [CrossRef]
  38. Pereira, M.A.; Fairweather, J.R.; Woodford, K.B.; Nuthall, P.L. Assessing the diversity of values and goals amongst Brazilian commercial-scale progressive beef farmers using Q-methodology. Agric. Syst. 2016, 144, 1–8. [Google Scholar] [CrossRef] [Green Version]
  39. Cheng, X.; Van Damme, S.; Li, L.; Uyttenhove, P. Evaluation of cultural ecosystem services: A review of methods. Ecosyst. Serv. 2019, 37, 100925. [Google Scholar] [CrossRef]
  40. Raymond, C.M.; Bryan, B.A.; MacDonald, D.H.; Cast, A.; Strathearn, S.; Grandgirard, A.; Kalivas, T. Mapping community values for natural capital and ecosystem services. Ecol. Econ. 2009, 68, 1301–1315. [Google Scholar] [CrossRef]
  41. De Groot, R.; Brander, L.; van der Ploeg, S.; Costanza, R.; Bernard, F.; Braat, L.; Christie, M.; Crossman, N.; Ghermandi, A. Global estimates of the value of ecosystems and their services in monetary units. Ecosyst. Serv. 2012, 1, 50–61. [Google Scholar] [CrossRef]
  42. Tengberg, A.; Fredholm, S.; Eliasson, I.; Knez, I.; Saltzman, K.; Wetterberg, O. Cultural ecosystem services provided by landscapes: Assessment of heritage values and identity. Ecosyst. Serv. 2012, 2, 14–26. [Google Scholar] [CrossRef]
  43. Plieninger, T.; Dijks, S.; Oteros-Rozas, R.; Bieling, C. Assessing, mapping and quantifying cultural ecosystem services at community level. Land Use Policy 2013, 33, 118–129. [Google Scholar] [CrossRef] [Green Version]
  44. van Excel, J.; de Graaf, G. Q Methodology: A Sneak Preview. 2005. Available online: www.jobvanexel.nl (accessed on 14 January 2023).
  45. Brown, S.R. Political Subjectivity; Yale University Press: New Haven, CT, USA, 1980. [Google Scholar]
  46. Milcu, A.I.; Sherren, K.; Hanspach, J.; Abson, D.; Fischer, J. Navigating conflict landscape aspirations: Application of a photo-based Q-method in Transylvania (Central Romania). Land Use Policy 2014, 41, 408–422. [Google Scholar] [CrossRef]
  47. Schmolck, P. The QMethod Page. 2014. Available online: http://schmolck.userweb.mwn.de/qmethod/#PQMethod (accessed on 14 January 2023).
  48. Fairweather, J.R.; Swaffield, S.R. Visitor Experiences of Kaikoura, New Zealand: An interpretative study using photographs of landscapes and Q method. Tour. Manag. 2001, 22, 219–228. [Google Scholar] [CrossRef]
  49. Costanza, R.; d’Arge, R.; de Groot, R.; Farber, S.; Grasso, M.; Hannon, B.; Limburg, K.; Naeem, S.; O’Neill, R.V.; Paruelo, J.; et al. The value of the world’s ecosystem services and natural capital. Nature 1997, 387, 253–260. [Google Scholar] [CrossRef]
  50. De Groot, R.S.; Wilson, M.A.; Boumans, R.M.J. A typology for the classification, description and valuation of ecosystem functions, goods and services. Ecol. Econ. 2002, 41, 393–408. [Google Scholar] [CrossRef] [Green Version]
  51. Hansen-Moller, J. Natursyns model: A conceptual framework and method for analysing and comparing views of nature. Landsc. Urban Plan. 2009, 89, 65–74. [Google Scholar] [CrossRef]
  52. Bryce, R.; Irvine, K.N.; Church, A.; Fish, R.; Ranger, S.; Kenter, J.O. Subjective well-being indicators for large-scale assessment of cultural ecosystem services. Ecosyst. Serv. 2016, 21, 258–269. [Google Scholar] [CrossRef] [Green Version]
  53. Anderson, N.M.; Ford, R.M.; Williams, K.J.H. Contested beliefs about land-use are associated with divergent representations of a rural landscape as place. Landsc. Urban Plan. 2017, 157, 75–89. [Google Scholar] [CrossRef]
  54. Waitt, G.; Lane, R.; Head, L. The boundaries of nature tourism. Ann. Tour. Res. 2003, 30, 523–545. [Google Scholar] [CrossRef] [Green Version]
  55. Hannah, L.; Lohse, D.; Hutchinson, C.; Carr, C.; Lankerani, A. A preliminary inventory of human disturbance of ecosystems. AMBIO J. Hum. Environ. 1994, 23, 246–250. [Google Scholar]
  56. Glaser, M. The Social Dimension in Ecosystem Management: Strengths and Weaknesses of Human-Nature Mind Maps. Hum. Ecol. Rev. 2006, 13, 122–142. [Google Scholar]
  57. Cronon, W. The Trouble with Wilderness: Or, Getting Back to the Wrong Nature. Environ. Hist. 1996, 1, 7–28. [Google Scholar] [CrossRef] [Green Version]
  58. Castree, N. Socializing nature: Theory, practice, and politics. In Social Nature: Theory, Practice, and Politics; Castree, N., Braun, B., Eds.; Blackwell Publishers: Malden, MA, USA, 2001; pp. 1–21. [Google Scholar]
  59. Graumann, C.F. The phenomenological approach to people-environment studies. Handb. Environ. Psychol. 2002, 5, 95–113. [Google Scholar]
  60. Navrud, S.; Ready, R.C. Valuing Cultural Heritage. Applying Environmental Valuation Techniques to Historic Buildings, Monuments and Artifacts; Elgar Algar Publishing Ltd.: Cheltenham, UK, 2002. [Google Scholar]
  61. Keniger, L.E.; Gaston, K.J.; Irvine, K.N.; Fuller, R.A. What are the benefits of interacting with nature? Int. J. Environ. Res. Public Health 2013, 10, 913–935. [Google Scholar] [CrossRef] [Green Version]
  62. Luck, G.W.; Davidson, P.; Boxall, D.; Smallbone, L. Relations between urban bird and plant communities and human well-being and connection to nature. Conserv. Biol. 2011, 25, 816–826. [Google Scholar] [CrossRef]
  63. Plieninger, T.; Schleyer, C.; Schaich, H.; Ohnesorge, B.; Gerdes, H.; Hernandez-Morcillo, M.; Bieling, C. Mainstreaming ecosystem services through reformed European agricultural policies. Conserv. Lett. 2012, 5, 281–288. [Google Scholar] [CrossRef] [Green Version]
  64. Guo, Z.; Zhang, L.; Li, Y. Increased Dependence of Humans on Ecosystem Services and Biodiversity. PLoS ONE 2010, 5, e13113. [Google Scholar] [CrossRef]
  65. Morris, J.; Colombo, S.; Angus, A.; Parsons, D.; Brawn, M.; Stacey, K.; Hanley, N. The value of public rights of way: A choice experiment in Bedfordshire, England. Landsc. Urban Plan. 2009, 93, 83–91. [Google Scholar] [CrossRef]
Figure 1. Photographs showing habitats in the Salisbury Plain area of Wiltshire including: (a) cropland; (b) rivers and wetlands; (c) woodlands; and (d) chalk grasslands.
Land 12 00331 g001aLand 12 00331 g001b
Figure 2. Example of the use of the Q sort template for sorting the 35 Q sort statements during interviews with respondents in Wiltshire.
Land 12 00331 g002
Table 1. Categories of CES identified for the CES concourse in Wiltshire.
Category of CESDescriptionStatement Number and Text
Knowledge and educationProvision of education and knowledge about nature, scientific information and evidence1.The countryside is a source of information and offers many educational opportunities.
2.I feel that visiting the countryside improves my knowledge and helps me to realise the value of nature.
3.Learning about nature is one of my motivations for spending my free time outdoors.
4.Environmental education is important but it does not affect how we behave towards nature.
5.Traditional knowledge related to the environment and biodiversity is not important for modern societies.
Creativity and inspirationStimulation of new thoughts, ideas, and creativity6.The more natural the environment is, the more likely I am to do my leisure activities in the countryside.
7.I feel inspired by nature and countryside.
8.The Wiltshire countryside provides me with the best opportunities for doing what I like in my spare time.
9.Nature is a great source of inspiration and fulfilment.
10.I prefer to do my leisure activities indoors or in urban environment rather than in nature.
Aesthetic valuesScenic beauty11.Nature only provides a visual experience for me.
12.I prefer cultural landscapes with some human artefacts over natural ones.
13.I seek places with pristine nature as they are the most beautiful and sublime.
14.Croplands are a traditional part of Wiltshire countryside and add to its cultural value.
15.Nature stimulates all my senses.
Spirituality, body and mindSpiritual inspiration, subjective perception of effects of nature on physical and mental conditions16.Doing sports outdoors in a nice, natural environment, makes me feel well mentally and physically.
17.Being in natural places helps me to relax and feel at peace.
18.Particular animals, plants or places have a deep spiritual meaning for me.
19.Nature is a refuge from everyday world.
20.Wandering in nature is neither interesting nor refreshing.
Cultural heritage and
history
Footprints of past local communities in the nature (temporal aspect)21.Visiting the countryside makes me think more about history and our ancestors.
22.Today’s Wiltshire reflects the relationship of past generations to the countryside.
23.Every human relic is also a relic of nature, every aspect of nature is altered by human action.
24.No creature exists wholly in the wild, free from human impact.
25.I do not care about cultural heritage in Wiltshire. It is mostly something for tourists.
Cultural diversity, local identity and connection to natureHuman attachment to nature and/or to a particular area and the ecosystem conditions with cultural basis (spatial aspect)26.My connectedness to nature does not depend on the diversity and abundance of animals and plants.
27.I feel strongly connected to Wiltshire and its landscapes.
28.I believe that the natural environment is an important factor that forms one’s personality.
29.The countryside has little effect on the character of local people and on their relationships.
30.It is important to respect nature around us rather than ruling over it.
Existence, bequest and
security
Feelings of security provided by landscape, awareness of the value of nature, satisfaction from preserving nature for future generations31.I feel a share of responsibility for the state of local countryside.
32.All organisms are precious and worth preserving.
33.Preserving nature is good for economic reasons and future security.
34.I would prefer to see more farming happening in Wiltshire.
35.It is important to me how this area and landscape develops.
Table 2. Statements, categories, factor Q-sort values for each statement.
FactorF1F2F3F4
Number of Respondents in Factor Grouping918109
Category of CESStatement Number and Text
Knowledge and
education
1.The countryside is a source of information and offers many educational opportunities.112 **0
2.I feel that visiting the countryside improves my knowledge and helps me to realise the value of nature.1121
3.Learning about nature is one of my motivations for spending my free time outdoors.1 **−1−1−1
4.Environmental education is important but it does not affect how we behave towards nature.−3−2−2−2
5.Traditional knowledge related to the environment and biodiversity is not important for modern societies.−2−3 **−2−3
Creativity and
inspiration
6.The more natural the environment is, the more likely I am to do my leisure activities in the countryside.0 **1−1 **1
7.I feel inspired by nature and countryside.3102
8.The Wiltshire countryside provides me with the best opportunities for doing what I like in my spare time.0−1 *12 **
9.Nature is a great source of inspiration and fulfilment.3300
10.I prefer to do my leisure activities indoors or in urban environment rather than in nature.−3−3−1 **−3
Aesthetic values11.Nature only provides a visual experience for me.−3−3−3−2
12.I prefer cultural landscapes with some human artefacts over natural ones.−2−2−2−2
13.I seek places with pristine nature as they are the most beautiful and sublime.−1 **2 **−3 **0 **
14.Croplands are a traditional part of Wiltshire countryside and add to its cultural value.0012
15.Nature stimulates all my senses.21−1 **1
Spirituality, body and mind16.Doing sports outdoors in a nice, natural environment, makes me feel well mentally and physically.−12 *03 *
17.Being in natural places helps me to relax and feel at peace.4334
18.Particular animals, plants or places have a deep spiritual meaning for me.1 **00−1
19.Nature is a refuge from everyday world.321 **3
20.Wandering in nature is neither interesting nor refreshing.−4−4−4−3
Cultural heritage and history21.Visiting the countryside makes me think more about history and our ancestors.0010
22.Today’s Wiltshire reflects the relationship of past generations to the countryside.0010
23.Every human relic is also a relic of nature, every aspect of nature is altered by human action.−10 **−1−1
24.No creature exists wholly in the wild, free from human impact.−12 **1 **−1
25.I do not care about cultural heritage in Wiltshire. It is mostly something for tourists.−2−2−3−4
Cultural diversity, identity, connection26.My connectedness to nature does not depend on the diversity and abundance of animals and plants.−1−10 *−1
27.I feel strongly connected to Wiltshire and its landscapes.2−1 **21
28.I believe that the natural environment is an important factor that forms one’s personality.01 *00
29.The countryside has little effect on the character of local people and on their relationships.−2−2−2−2
30.It is important to respect nature around us rather than ruling over it.2330 **
Existence, bequest and security31.I feel a share of responsibility for the state of local countryside.103 **1
32.All organisms are precious and worth preserving.2 **4 **0−1
33.Preserving nature is good for economic reasons and future security.0 *0 *43
34.I would prefer to see more farming happening in Wiltshire.−1 *−1−11 *
35.It is important to me how this area and landscape develops.1 *−1 **22
Note: * p < 0.05, ** p < 0.01 indicate that the group of respondents with loading on a factor was statistically distinguished from the other groups by significance level of 5% and 1%, respectively. Statements with similar points of view across all the groups are shown in bold. Statements scoring positively denote agreement with the statement with 4 being the strongest level of agreement. Statements scoring negatively denote disagreement with the statement with −4 being the strongest level of disagreement. Statements scoring 0 reflect a neutral view on the statement.
Table 3. Main characteristics of the four groups of preferences.
GroupMain Characteristics
Group 1—Inspired by natureNature used for inspiration and relaxation opportunities, as well as to improve knowledge.
Group 2—Conserving natureFocus on nature conservation and the relationship between people and nature.
Group 3—Countryside mixFocus on multifunctional landscapes and rather material benefits it provides to people. Also emphasis on the relationship between people and the countryside.
Group 4—Outdoor pursuitsUse the countryside for leisure activities, often sports, also appreciation for historical sites and agricultural land.
Disclaimer/Publisher’s Note: The statements, opinions and data contained in all publications are solely those of the individual author(s) and contributor(s) and not of MDPI and/or the editor(s). MDPI and/or the editor(s) disclaim responsibility for any injury to people or property resulting from any ideas, methods, instructions or products referred to in the content.

