Article

Decoupling Relationship between Industrial Land Expansion and Economic Development in China

1
School of Architecture, Si Pailou Campus, Southeast University, Nanjing 210096, China
2
College of Landscape Architecture, Nanjing Forestry University, Nanjing 210037, China
*
Author to whom correspondence should be addressed.
Land 2022, 11(8), 1209; https://doi.org/10.3390/land11081209
Submission received: 24 June 2022 / Revised: 24 July 2022 / Accepted: 29 July 2022 / Published: 31 July 2022
(This article belongs to the Special Issue Spatial Planning and Land-Use Management)

Abstract

:
Economic expansion has caused increasingly serious land resource problems, and the decoupling of urban industrial land expansion from economic development has become a big topic for intensive development. The current research has mainly concerned industrial land efficiency, a single, static indicator, compared to a decoupling model, which takes into account two variables and gives a full expression of the spatio-temporal dynamic characteristics. However, little attention has been paid to the relationship between industrial land expansion and economic development in China from the perspective of decoupling. Based on a combination of Tapio‘s decoupling model and spatial analysis methods, this paper investigates the decoupling relationship between industrial land expansion and economic development in Chinese cities from 2010 to 2019. On that basis, we divided the study area into three policy zones and made differentiated policy recommendations. In addition, based on the decoupling model, we obtained the decoupling indices of the cities and grouped the cities into eight decoupling types. After the spatial autocorrelation analysis, we further verified the spillover effect of decoupling with the results of urban spatial differentiation. This paper draws the following conclusions: (1) Urban industrial land expansion and economic development exhibit marked and increasingly significant spatial heterogeneity and agglomeration. (2) Industry and economy are in weak decoupling in most cities, but there are a growing number of cities in negative decoupling. (3) Decoupled cities are shifting from the southeast coast to the middle and lower reaches of the Yellow River and Yangtze River, while negatively decoupled cities keep spreading from northeast and south China to their periphery, with clear signs of re-coupling. (4) It is necessary to develop urban industrial land supply and supervision policies according to local actuality and to implement differentiated control of industrial land for cities and industrial sectors with different decoupling types. To some extent, this paper reveals the evolution dynamics, performances, and strategies of industrial land, providing a decision basis for industrial land management policies and industrial planning in China and other countries at similar stages.

1. Introduction

Industrialization and urbanization are the driving forces of global modernization and also an inescapable topic of economic development. North America, Europe, and other developed regions have experienced the complete process of “industrialization–deindustrialization–reindustrialization” [1,2]. Industrial land serves as the carrier of industrialization, and the sustainable development of the economy is inseparable from its intensive utilization [3]. The expansion of industrial land not only supports economic development [4], but consumes huge amounts of resources and farmland, threatening food and ecological security [5,6]. In the process of urbanization, urban land encroaches on surrounding land [7], creating many problems of underutilization of resources and unbalanced development. As the core factor of urban land, the issue of intensive and efficient use of industrial land has received widespread attention worldwide.
China has a large amount of industrial land, and its industrial economy is becoming more influential in the world economy, making it an increasingly important player in the world economic system, quite typical in the world. According to the China Bureau of statistics in 2019, the area of industrial land was 11,478.8 km2 [8], and the industrial added value exceeded $5.6 trillion [9]. China has been active in promoting its external investment strategy since the beginning of the 21st century, which has strengthened its own international ties [10] and has contributed to the flourishing of industrial sectors such as energy, finance, and utilities [11], as well as to its economic strength and international competitiveness. Moreover, the global command-and-control function of Chinese cities is rising [12,13], as evidenced by Beijing and Shanghai, which have catapulted themselves to alpha-level international cities [14]. In addition, China is undergoing a transition from an incremental economy mode to a stock economy mode, which is typical for the study. In the context that China is transforming its economy from the industrial sector to the service-oriented sector, the development of the service industry promotes intensified and high-end industrial development, pushing industrial land to the stage of stock optimization, and even reduction and contraction [15]. To date, industrial land in some big cities [16] has undergone the change from “incremental expansion” to “stock optimization” [17]. However, industrial land expansion is still part and parcel for economic development in most cities [18], so there is an urgent need for a method for the rational allocation of industrial land that allows the economy to be gradually decoupled from industrial land expansion while maintaining stable development.
The relationship between industrial land and economic development has received increasing attention in academic circles, and a variety of research directions have been derived. Silva [19], Vandermeer [20], Louw [21], and Folmer [22] all have evaluated and compared the spatial differences of industrial land and its production efficiency, finding that it is related to factors such as development intensity, policy control, and habitat. Langer [23], Chen [24], and Ustaoglu [25] have all focused on industrial land expansion in urban agglomerations and have found that the impact of industrial land expansion on urban economies is significantly spatially heterogeneous and time-lagged and that such expansion has more negative than positive effects for most small cities. Shih [26] and Ouoba [27], from an industrial perspective, have both found that industries at different stages of development vary in adaptability to policies with different impacts on society, economy, and ecology and argued that both the renewal and iteration of production modes contribute to the efficiency of industrial land and the promotion of industrial development and social environment improvement. Some scholars have focused on the expansion of industrial land experienced by China since the beginning of the new century and have found that industrial land is characterized by significant agglomeration [28] and a spillover effect [29] in spatial distribution and economic benefits. There are also some different views on the impact of industrial land expansion on the economy. Some scholars believe that the spread of industrial land inhibits economic development [30,31,32], while others believe that spillover expansion has a better effect on promoting economic efficiency than enclave expansion [33,34].
There are two gaps in the current research. The first is that, from the perspective of topic focus, the studies available have mainly concerned the economic value of industrial land while ignoring the match between economic development and industrial land. Adequate consideration of the change rules of economic development helps to judge the land–economy relationship in a more comprehensive manner. The second is that, from the perspective of research methods, most of the current studies have been conducted on one-dimensional indices, such as land development intensity and output efficiency. However, one-dimensional indices are often composed of many factors, making the physical meaning of the results abstract, with no significant practical guidance. Only by fully considering the physical meaning of evaluation factors can an evaluation method guide practice more accurately. Worthy of note is that decoupling analysis methods have begun to emerge in land-use research. For example, Li [35] and Zhao [36] both have studied the decoupling relationship of construction land and service land with economic development and analyzed the decoupling state of the provinces in China, finding there is significant spatial heterogeneity in the decoupling states of cities. Nevertheless, few scholars have conducted specific studies on industrial land in China. Therefore, it is of great theoretical significance and practical value to study the decoupling relationship between industrial land expansion and economic development.
Based on a case study of 287 cities in China, this paper explores the relationship between economic development and industrial land expansion from the perspective of decoupling with the help of a new view of decoupling, a new method of measuring decoupling models, and a research framework oriented to policy formulation to help achieve scientific allocation, as well as the intensive and efficient development of industrial land. This paper focuses on three questions: What are the spatio-temporal evolution patterns of industrial land expansion and economic development in China? What are the characteristics of the decoupling relationship between urban industrial land expansion and economic growth? How are differentiated land management policies for cities with different decoupling types made?

2. Literature Review

The topic of the relationship between industrial land expansion and economic development has received much attention from the fields of economics [37,38], resource science [39,40], and environmental science [41]. Research methods to explore the relationship between industrial land expansion and economic development are becoming increasingly diverse, including multi-index integrations, coupling analyses, and regression analyses. These three methods provided an important theoretical and methodological basis for this paper. In view of the drawbacks of research using multi-index models and coupling models, this paper employed a decoupling model to measure the relationship between industrial land expansion and economic development and used a spatial autocorrelation model to determine the spatial characteristics of the decoupling model using a spatial regression model.
Most studies have been based on multi-index integrations, such as the Global Non-Radial Directional Distance Function (GNDDF) and the Stochastic Frontier Model (SFM). Xie [42] measured industrial land efficiency based on the GNDDF, finding that industrial efficiency was highest in east China and that the gap between the central and western regions was narrowing. Liu [43] measured the green economic efficiency of industrial land based on SFM, arguing that the level of regional scientific research and technology was positively correlated with economic efficiency. However, for GNDDF and SFM measurements, a variety of land and economic indicators are used, and they are taken as factors in the index calculation. These models dilute the physical meanings of the factors, making the obtained indices abstract and not very instructive for practice.
Some studies have been based on coupling analysis methods, and the more common coupling analyses include the DEA Model and the Coordination Degree Model. Xie [44] compared the urban industrial land use efficiency and the urban industrial land’s total factor productivity of six major urban agglomerations in China based on a DEA-SBM model and found that improving the quality of the industrial economy and the intensity of land use in urban agglomerations could increase the land use efficiency. Liu [29] measured the coupling status of industrial land and economic development in Jilin based on a coupling model and found that Jilin showed a decreasing spatial pattern of population–industry–town coupling degree from the center of the city to the periphery, and this pattern was highly correlated with the urban population density. Coupling models also have some drawbacks. The results of their measurements are one-dimensional indices, and the classification of cities is based on the segmentation of these one-dimensional indices. However, the index segmentation does not allow for a precise classification of city types. Therefore, a more objective classification of city types can only be achieved by determining the development statuses of cities based on a variety of relevant indices together.
Regression models have been used in some studies, but the choice of variables has varied among scholars. Xu [45] performed a regression analysis of land scale and a variety of economic indices and found that the relocation of foreign-owned factories tended to lead to industrial land expansion. Zhou [46] and Huang [47] each directly regressed the land scale on economic output to analyze the differences in the responses of different cities in China to industrial land use policies and conducted spatial correlation analyses using autoregression. They both found that cities at different socio-economic levels have large differences in response to industrial land policies, while the supply of industrial land shows characteristics of a high level in the eastern coastal region and a low level in the western inland region. Regression models focus on measuring the degree of influence of industrial land efficiency factors and can only determine the average degree of influence for all the cities while ignoring the specific situation of each individual city. However, a spatial regression model also takes into account the associations between cities, providing a methodological basis for this paper to determine the associations between the decoupling states of the cities.
The approach of studying the relationship between land resource consumption and economic development based on decoupling models is favored by an increasing number of scholars. However, as a new method for the integrated analysis of land use change and its performance, it still has less support from the literature today. Most papers have now discussed the decoupling relationship between construction land and economic development. For example, Li [48] studied the decoupling relationship between construction land, economic development, and carbon emissions in China, finding that the economic output of land was the main source of carbon emissions and arguing that controlling construction land expansion could effectively decouple the economy from carbon emissions. Zhang [49] analyzed the relationship between economic development and land use in the Three Gorges reservoir area based on an ecological footprint model and a decoupling model, finding that the increase in land use was decoupled from the total economic volume and believing that the current sustainable land use was not yet able to support economic development. Nevertheless, construction land can be divided into a variety of functions, and the demand for land varies widely across functional industrial sectors [50]. Industrial output accounts for a significant share of the economic volume, and industrial land is a type of construction land with huge resource consumption [51] and a high input scale [52] that is more closely linked to the economy [53]. Therefore, it is necessary to explore the relationship between industrial land expansion and economic development using a decoupling model.
In the existing research methods on the relationship between industrial land expansion and economic development, the calculated results are often highly complex and static, and they cannot meet the government’s demand for dynamic, concise, and actionable evaluation results. First, complex evaluation results are prone to a decrease in the explanatory power of the indices, and results that indirectly reflect the land–economy relationship are less liable to be used as an intuitive basis for policy making. Models such as DEA, UILUE, and UILTFP, for example, are complex in operation mode, often requiring the selection of differentiated indices based on the industrial structure of a city, and they are not suitable for large-scale popularization due to the difficulty in explaining the final results. Second, most of these models calculate points in time, making it hard to reflect the dynamic characteristics of the land–economy relationship over time. What is calculated by them is carried out, in general, in year-by-year units, but it takes 3–5 years or more for an investment in land to gain economic returns, a slow process of achieving gains from investment. The results obtained from a decoupling model fully consider the two indices to reflect both the point-in-time characteristics and the state of the relationship within the period, making it more accurate and comprehensive to present the land–economic development relationship. However, decoupling models have not been used systematically and comprehensively to study the relationship between industrial land expansion and economic development in Chinese cities, thus leaving great research potential.

3. Material and Methods
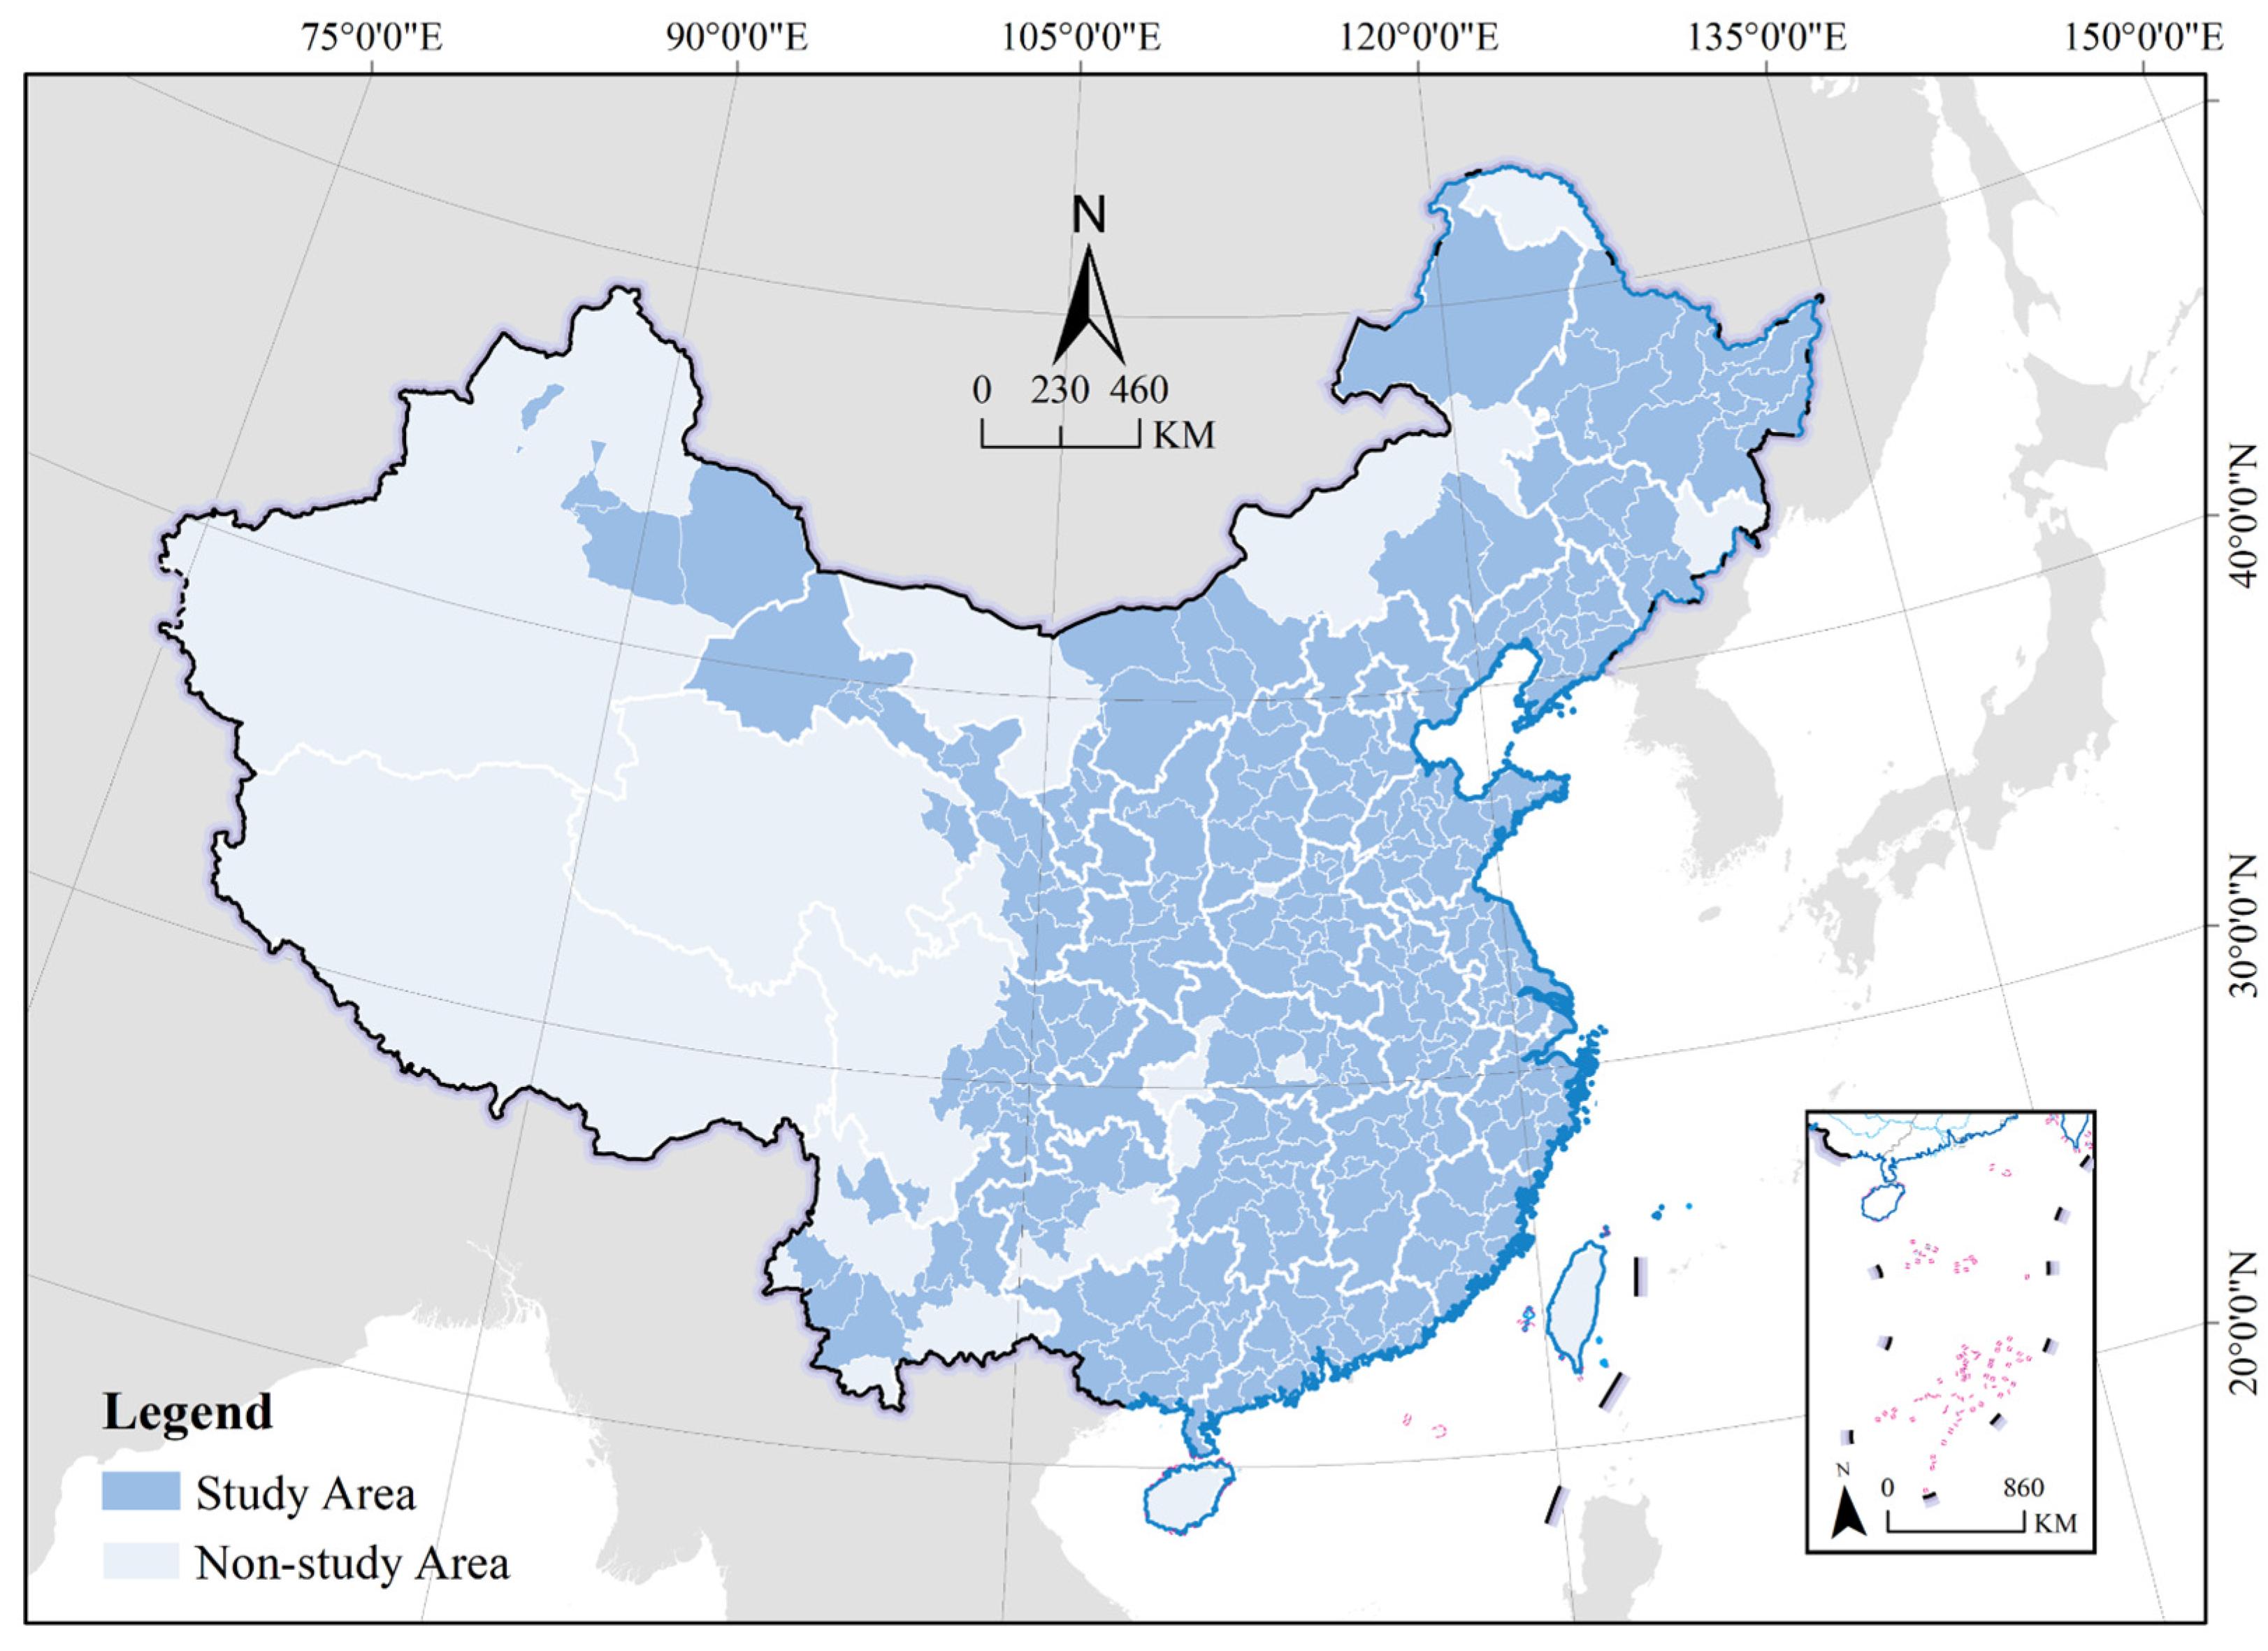
3.1. Study Area

The study was conducted on 287 cities at prefecture level and above in China (Figure 1). Given the availability of data, prefecture-level cities in the Taiwan Province, the Hainan Province, and the Tibet Autonomous Region, as well as autonomous prefectures, counties under provincial-level control, and county-level cities, were not included. The reasons were as follows: (1) different statistical calibers of different district types made it difficult to acquire complete data; and (2) they was not suitable for direct comparison due to the difference in the administrative levels and development capacities of provincial counties, county-level cities, and autonomous regions from those of prefecture-level cities. The study period was chosen to be from 2010–2019 in this paper for the following reasons: (1) China’s economy has continued to slow down after 2010 and has entered a new normal of 6–7% growth. (2) China’s central government proposed a new goal of supply-side structural reform and innovation-driven development in 2013, which was fully implemented during the 13th five-year-plan period (2016–2020), marking China’s entry into a state of transformational development. (3) The outbreak of COVID-19 caused the global economy to stagnate in 2020, with no exception to China, so that year of abnormal economic development was not included. China was at a critical stage of transition from high-speed economic growth to high-quality development during the decade from 2010 to 2019 [54], and thus, that time period was the focus of this paper.

3.2. Method

The OECD (Organization for Economic Cooperation and Development) was the first to put forward the decoupling model to promote the decoupling between economic growth and environmental damage [55]. Later, Tapio classified 8 types of decoupling based on the combination of decoupling models and elasticity coefficient methods [56]. These decoupling types were, from best to worst: strong decoupling, weak decoupling, expansive coupling, expansive negative decoupling, recessive decoupling, recessive coupling, weak negative decoupling, and strong negative decoupling. The improved method has been widely used in the fields of economics [57,58], resource science [38,59,60], and environmental science [61,62,63].
This paper analyzed the relationship between urban industrial land expansion and economic development with the help of the Tapio decoupling model. With α used to denote the decoupling index between industrial land expansion and the economy, the decoupling index equation can be expressed as:
α = Δ L A N D Δ G D P ,   Δ L A N D = L A N D i + n L A N D i n 1 , Δ G D P = G D P i + n G D P i n 1
where, Δ L A N D represents the average annual growth of industrial land; L A N D i and L A N D i + n represent the scales of industrial land in year i and year i + n , respectively; Δ G D P represents the average annual growth of economic-development-related indices; G D P i and G D P i + n represent the annual values of the economic indices in year i and year i + n , respectively; and n represents the study interval of time.
The Tapio decoupling model classifies decoupling into 8 types using 0.8 and 1.2 as classification thresholds (Figure 2). Strong decoupling is the best state, indicating that the economy is growing despite the contraction of industrial land. Cities in weak decoupling have an economic growth slightly faster than land expansion, indicating that the expansion of industrial land promotes economic development. The expansion of industrial land in cities in expansive coupling grows simultaneously with the economy, and according to Gan [64], it is inferred that most of these cities are at the incremental development stage in the state of city–industry integration. Expansive negative decoupling indicates that both industrial land and economic output are growing, but land is being consumed at a faster rate. Cities in recessive coupling experience the expansion of industrial land simultaneously with economic contraction in a state of urban contraction that produces disconnectedness [65]. Recessive decoupling and weak negative decoupling stand for terrible states to show that both industrial land and the economy are contracting, with the difference that the land is contracting faster in the former state, while the economy is contracting more severely in the latter state. Strong negative decoupling is the most terrible state, indicating that industrial land expansion comes with continued economic contraction. According to the method of Zhang [66] for assigning decoupling types, the decoupling types are assigned as 4, 3, 2, 1, −1, −2, −3, and −4 from the best to the worst. A larger value assigned indicates a better decoupling state and a lower level of dependence of the industrial economy on land.

3.3. Research Steps and Data Resource

The study included three stages, as the Figure 3 shown, corresponding to the following three questions. What are the spatio-temporal evolution patterns of industrial land expansion and economic development in China? What are the characteristics of the decoupling relationship between urban industrial land expansion and economic growth? How are differentiated land management policies for cities with different decoupling types made?
The decoupling study involved two perspectives. The first was to study the decoupling relationship of INL–SAV, which represented the economic output efficiency directly brought by industrial land expansion and visualized the decoupling relationship between industrial land and the economy. INL was derived from the industrial land section in the 2011–2020 China Urban Construction Statistical Yearbook, and SAV was derived from the municipal district section of industrial structure in the 2010–2019 China Statistical Yearbook. The second was to study the decoupling relationship of INL–GDP, which comprehensively showed the interaction between industrial land expansion and economic development. As industry is in close cooperation with service and agriculture in part, the development of industry boosts the output efficiency of other sectors, thus promoting the intensive and efficient use of land. The GDP data were obtained from the municipal district section of GDP in the China Statistical Yearbook for 2010–2019.
In the first step, we analyzed the scales and changes of land and economy around their spatio-temporal evolution pattern. As 2015 was a watershed year for two five-year-plan periods with different development goals, we divided 2010–2019 into 2010–2014 and 2015–2019 and recorded them as Period 1 and Period 2, respectively. To calculate the rate of change between the two 5-year periods more concisely, we analyzed the rate of change of the indices in Period 1 and Period 2 based on the data of four critical years: 2010, 2014, 2015, and 2019. In this study, we used the area of the industrial land (INL) to represent the characteristics of industrial land, and we used two variables to represent the characteristics of economic development, which were second-industry added value (SAV) and gross domestic product (GDP).
In the second step, we analyzed the types of decoupling and their changing characteristics in cities around the relationship between industrial land expansion and economic growth using the decoupling model. Based on the calculation the decoupling indices of INL–SAV and INL–GDP, we classified 287 cities into 8 categories according to the model criteria and analyzed the spatial pattern and evolution characteristics of the decoupling states of Chinese cities under Period 1 and Period 2 through geo-visualization. Then, we compared the decoupling types of the cities between the two periods and analyzed the change characteristics of the decoupling states.
In the third step, we made policy recommendations concerning the land-use policy controls for cities with different decoupling types. First, we took the least favorable state of the two decoupling types of INL–SAV and INL–GDP in Period 2 as the basis for the decoupling policy making in each city in line with the least favorable principle. After that, we divided the cities in the study area into three types of policy zones and proposed differentiated industrial land-control policies for different policy zones.
In addition, we supplemented missing yearbook data for some years through averaging and trend extrapolation in this paper. For missing data in year N, with no data missing in years N − 1 and N + 1, an averaging method was applied. For example, for the missing 2018 INL data of Zhuhai, the average of the 2017 and 2019 values was taken as the scale of its industrial land for 2018. Trend extrapolation was applied when data for year N were missing and data for year N − 1 or N + 1 were also missing. For example, for the missing 2019 SAV data of Jilin, the trend was extrapolated based on the 2016–2018 data, and the output value for 2019 was then obtained.

4. Results

4.1. Pattern of Relationship between Industrial Land and Economy

4.1.1. Scale of Industrial Land and Economy

From the perspective of industrial land, the scale of the land showed a trend of gradual decrease from the eastern coast to the western inland areas, but it steadily increased in the eastern region and continuously expanded in the western region, while showing obvious weakness in the northwest and southwest. High-scale areas developed in a belt-like pattern, mainly concentrated early in the northeast, the eastern coastal, and southern economic development areas, with a small number in Sichuan and Chongqing. These western economic areas, having developed mainly relying on the preferential policy of western development, together with central and western regions such as northern Guizhou (western Hubei having developed later), grew into complete, high-scale agglomeration areas along the Yangtze River. The marginal regions of most provinces were medium-scale areas, and their scales fluctuated. Some southeast regions, including Jiangxi and Fujian, developed from low-scale areas. Relatively stable, medium-scale areas included Guangxi, Anhui, and Hebei, while the northeastern regions, such as Inner Mongolia, were contracted to medium-scale areas from high-scale areas. Low-scale areas were relatively stable and increasingly concentrated in the northwest and southwest regions. Figure 4 shows the results of the clustering distribution of industrial land scale in 2010 and 2019.
From the perspective of economic development, SAV and GDP shared roughly the same spatial differentiation, with high-output areas mainly in two types of regions, that is, the eastern coastal zone and the central city of each province. Low-output areas were mostly concentrated in the border areas of provinces, showing a cluster-like development pattern. With the increase in output value, the eastern coastal cities basically reached a high level of production, especially in Jiangsu, where the production reached a high level in the domain and overflowed outside, showing a significant agglomeration characteristic. Most of the medium-output-value areas developed from low-output areas and gathered around high-output areas, especially in southern Guangdong, Guangxi, Hebei, Henan, Sichuan, Guizhou, north China, and Chongqing. Low-output areas were widely distributed throughout the country in the early days, except for north China and the eastern coast, and were then mostly replaced by medium-output areas. The remaining low output cities in the southeast, north China, and south China regions were mostly in the margins of the provinces, except for in northeast and northwest China, such as Heilongjiang, inner Mongolia, Jilin, and Gansu.

4.1.2. Growth Rate of Industrial Land and Economy

China’s industrial land and its economic development indices were characterized by significant spatial heterogeneity and agglomeration, with the differences between land-use indices decreasing, while economic indices increased, as shown in Table 1. A larger coefficient of variation indicated higher degrees of dispersion and variability characteristics, and according to the study, when the degree of variation was greater than 0.36, there was significant heterogeneity between variables [67]. The observation of the index coefficients for the first and second five-year periods showed that the coefficients of variation of SAV and GDP were much larger than 0.36 and were growing larger.
The Global Moran’s I of industrial land change in China is a positive value, while the significance is lower than the spatial autocorrelation index of economic development, indicating that industrial space is agglomerative, but constrained by regional characteristics. The Global Moran’s I values of SAV and GDP in 2010–2014 and 2015–2019 were 0.05, 0.11, 0.22, and 0.33, respectively, and they passed the significance test of 0.01 and above, indicating that the economic development indices generated by industrial land showed a significant agglomeration characteristic at the spatial level and became more concentrated.
By analyzing the positive and negative characteristics of the change rates of industrial land and economic development in the early and late periods, we obtained the results in Figure 5 It was obvious that the fluctuating growth of industrial land in China’s cities over the past decade has not stopped the negative economic growth that is growing worse. Negative growth was also spatially clustered to some extent, mainly distributed in the northeast. There were 32 and 10 cities with negative growth of SAV and GDP, respectively, in the early period, and the numbers increased to 82 and 35, respectively, in the later period. According to the spatial clustering analysis, it was found that cities with negative growth were mainly concentrated north of the Yellow River, especially in the northeast region.

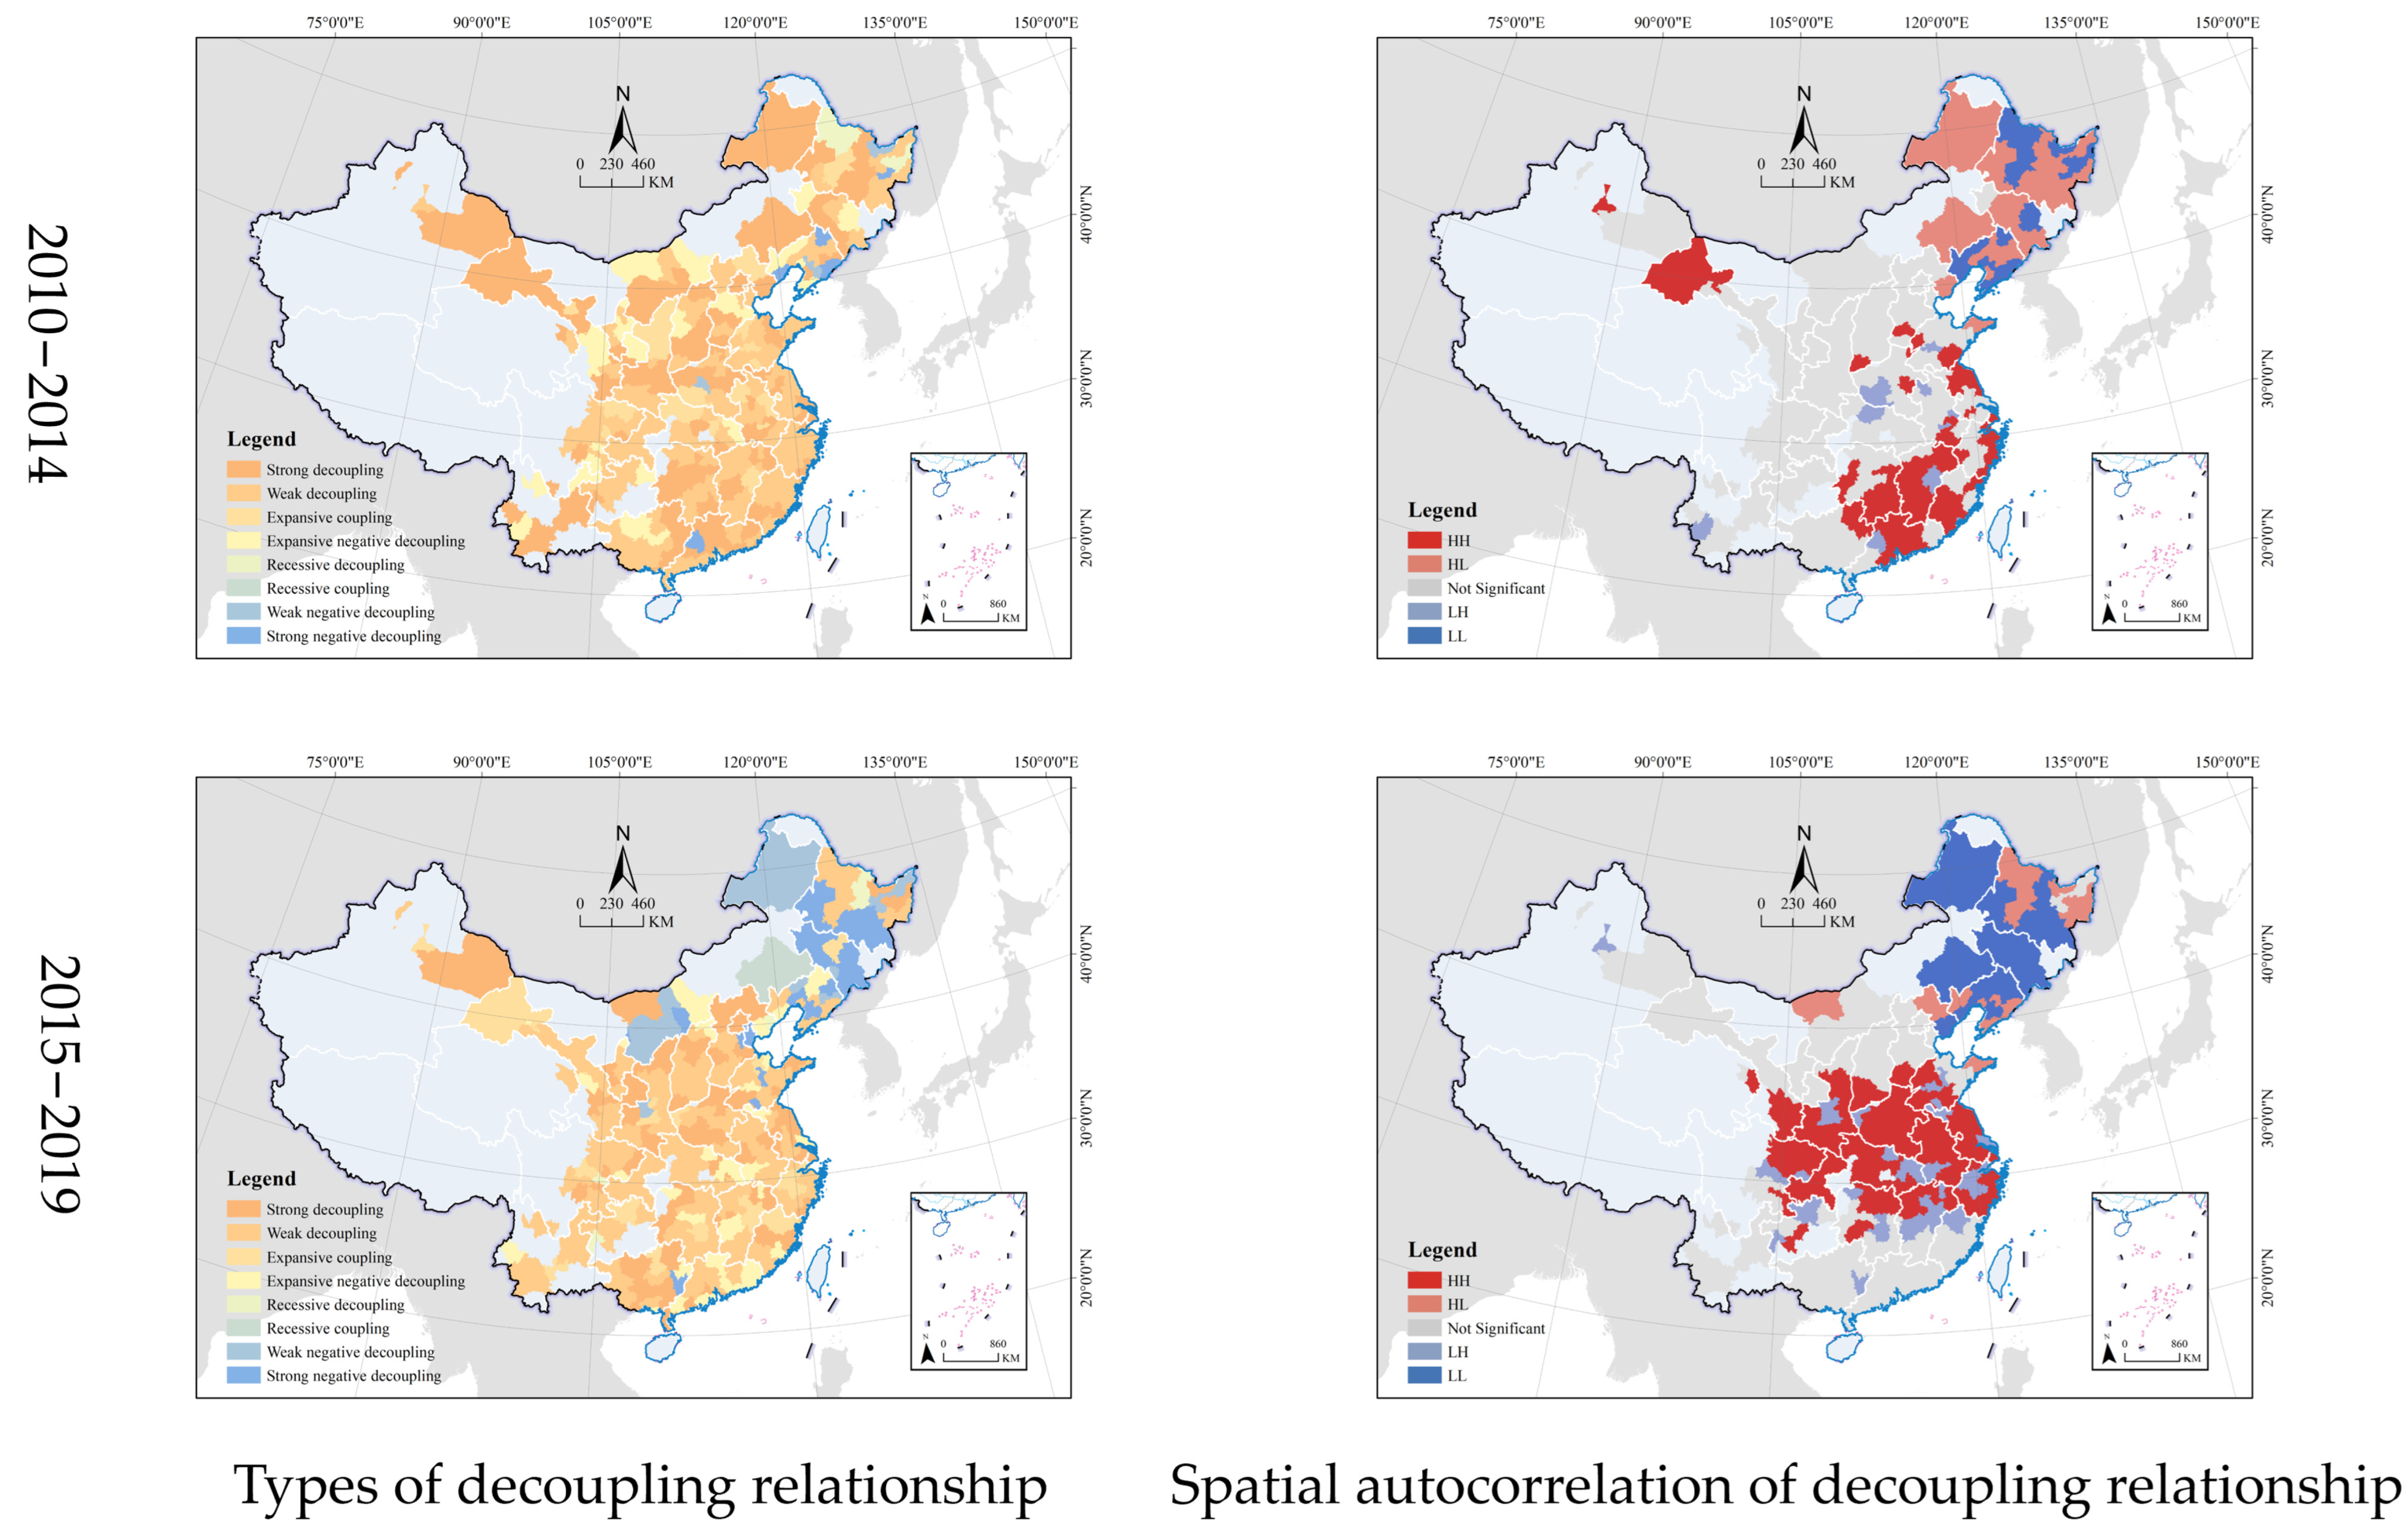
4.2. Decoupling Relationship between Industrial Land and Economy

4.2.1. Relationship between Industrial Land and Second-Industry Added Value

According to the Figure 6, there were seven types of INL–SAV in the early stage, and most cities were in the states of strong and weak decoupling, accounting for about 74.22% of the total. As recessive coupling emerged in the later period, the cities in strong and weak decoupling states reduced to 47.39%, while those in strong and weak negative decoupling states increased up to 23.3%. From the perspective of spatial clustering, cities in strong and weak negative decoupling states were mainly concentrated in some pockets of northeast China in the early period, but they spread to the whole northeast and northwest of China later, even involving some parts of north China; in the later period, cities in the expansive negative decoupling state formed east–west belt clusters in Guangxi, Hunan, Jiangxi, and Fujian.
According to the spatial correlation analysis using GeoDa, different cities were categorized into five characteristic spaces of HH, HL, No Significant, LH, and LL. There were many cities well-decoupled around HH cities, while HL cities were in good decoupling states but were surrounded by those in poor decoupling states. Different from HL cities, LH cities were in poor decoupling states but were surrounded by cities that were well-decoupled. LL cities were surrounded by those also in poor decoupling states. No Significant meant that the decoupling states of these cities were average, and there were no significant agglomeration characteristics.
According to the spatial correlation analysis of INL–SAV, it was found that HH cities were concentrated and distributed in the central regions of Chongqing, Hubei, Hunan, and Jiangxi in the early period, while LL and HL cities were in the northeast region. In the later period, the spatial agglomeration of HH and LL cities increased significantly. The former was mainly found in the middle and lower reaches of the Yellow River, the Yangtze River Delta, and its inland hinterland, while the latter was mainly in the whole northeast region and some northwest regions.
The changes in decoupling of the two periods showed that the decoupling state of INL–SAV was severely degraded in most cities in the northeast and northwest, followed closely by the Pearl River Delta and its inland hinterland. Upgraded cities were mainly concentrated in regional central cities and two provinces. These two provinces are Shaanxi and Shanxi, both of which are major provinces of raw material production and processing. Cities with stable development were mostly along the Yangtze River economic belt.

4.2.2. Relationship between Industrial Land and Gross Domestic Product

INL–GDP shared the same decoupling type as INL–SAV in the early period, but about 79.80% of the cities were in strong and weak decoupling states. The cities in strong decoupling states declined to two-thirds of the previous state in the later period, and some transformed into the states of strong and expansive negative decoupling. From the perspective of spatial cluster analysis, the cities of strong and weak negative decoupling in the early period were mainly in northeast China, especially in Liaoning, and they spread to the whole northeast in the later period.
From the spatial correlation analysis, as the Figure 7 shown, the HH cities were mainly concentrated and distributed in Hunan, Guangdong, Jiangxi, and other south China areas in the early period, with a small number distributed in the eastern coastal region in a band, while HL cities were mainly concentrated in the northeastern region and LL cities were also scattered in the northeastern region, indicating a sign of slowing economic growth in the northeastern region. In the later period, the spatial agglomeration of LL and HH cities was further enhanced, with the former having spread from a few cities in the northeast to the entire northeast and the latter being widely distributed from south of the Yellow River to north of the Yangtze River, covering the western economic zone and including Sichuan, Chongqing, Gansu, and Shaanxi, the north China economic zone (including Henan and Shandong), and the entire middle and lower reaches of the Yangtze River. However, it should be noted that LH cities were still widely dispersed in the provinces of HH cities and showed the same spatial characteristics as those found in the northeast in the early period.
As the Figure 8 shown, the decoupling state of INL–GDP was similar to the results of INL–SAV, with most cities in northeast and northwest China severely degraded, followed by the Pearl River Delta and its inland hinterland. However, the degradation of the Pearl River Delta was much slower because of its richer industrial structure. The upgraded cities were also scattered around the severely degraded cities, reflecting from the side that the neighboring cities had learned from the old industrial structure of the formerly developed industry in the northeast. The cities with stable development were widely distributed in the Yellow River and Yangtze River basins.

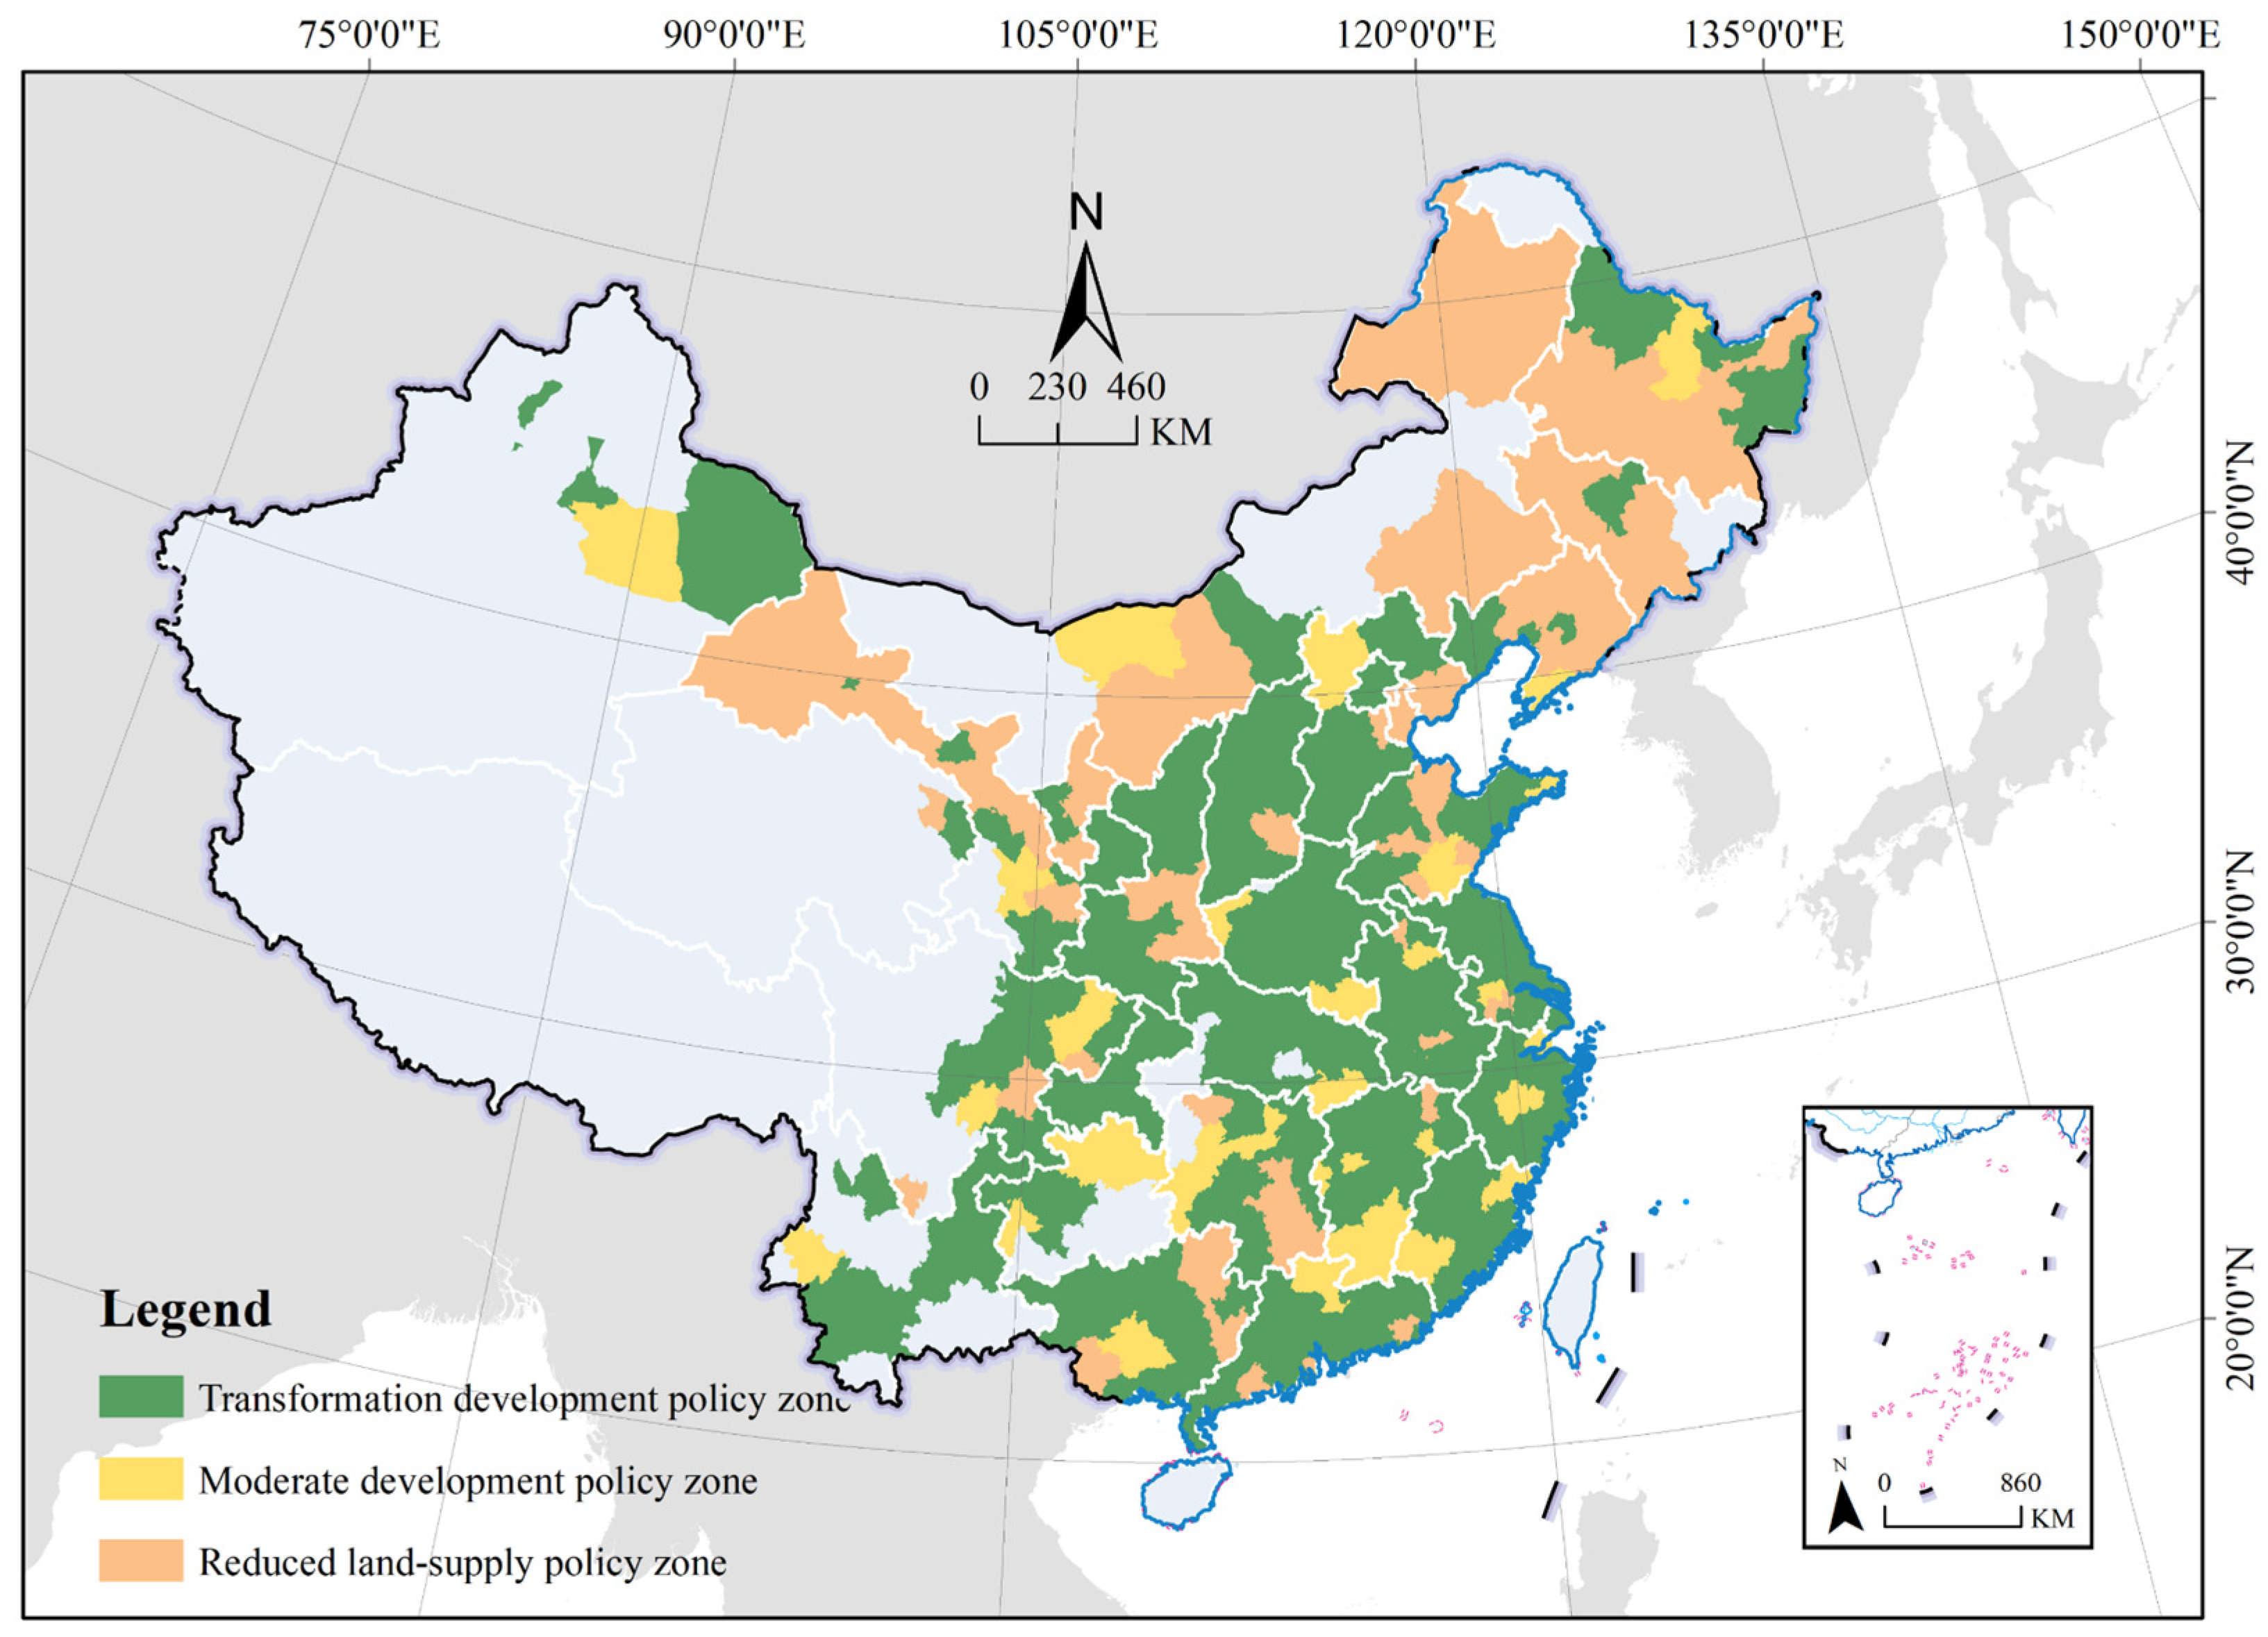
5. Policy Suggestion

Since the decoupling states varied widely among cities, a one-size-fits-all approach to the development of the stock economy could not be applied to all cities [68]. The results acquired based on the decoupling model reflected the matching degree between urban industrial land expansion and economic growth, enabling an accurate reflection of urban development.
In the first step, we superimposed the results of the INL–SAV and INL–GDP decoupling types of cities in China from 2015 to 2019 and obtained the combination results of the decoupling types under two conditions. INL–SAV measured the economic benefits brought by industrial land expansion and directly reflected the industrial and economic conditions of the cities. INL–GDP indicated the contribution of industrial land expansion to the economy and indirectly showed the rationality of the city’s industrial structure. The urban industrial structure includes the agricultural, industrial, and service sectors, which are complementary to each other. The industrial sector drives the development of agriculture and services, which in turn contributes to its own development. A city could only be considered economically healthy when it was in good decoupling under both conditions of INL–SAV and INL–GDP. Therefore, according to the least-favorable principle, the inferior result from the two perspectives of each city was taken as the final decoupling type. The specific results of each combination are shown in Table 2.
In the second step, we grouped the eight decoupling types of cities into three policy orientations, as shown in Table 3. The demand for land from economic development was the basis for land supply, and the land-supply strategy was the feedback for the economic performance of the city. According to the relationship between the supply and demand of land, cities could be divided into three types of balance between supply and demand, short supply, and oversupply. Cities in strong decoupling, weak decoupling, and expansive negative decoupling states were generally considered as cities with balanced supply and demand of land. Their economic development rarely relied on land expansion, and they basically achieved sustainable economic development, with a focus on transitioning to an innovation economy in the future, so their policy orientation should be focused on the transformation development of land. Cities in expansive coupling and recessive decoupling states were mainly those in short supply of land. Their economic development often depended heavily on land expansion to create economies of scale, so the policy orientation of these cities should be mainly focused on the moderate development of land. Cities in recessive coupling, weak negative decoupling and strong negative decoupling states were basically those with an oversupply of land. For them, the supply of land led to a serious waste of resources instead of stopping their continued economic slowdown. These cities should implement reduced land-supply-oriented policies to end the vicious cycle of land–economic relations. We finally obtained the transformation development policy zone, the moderate development policy zone, and the reduced land-supply policy zone, as shown in Figure 9.
Finally, we formulated differentiated control policies for the three policy areas in terms of total control, land supply, usage criteria, and regulatory standards to improve the relevance and effectiveness of policy control and promote the intensive use of industrial land.

5.1. Transformation Development Policy Zone

The transformation development policy zones covered Beijing, Shanghai, Shenzhen, and most cities in Henan, Jiangsu, Anhui, Shanxi, and other regions, mainly concentrated around the middle and lower reaches of the Yellow River and the Yangtze River economic belt as the front-runners of industrial land governance and economic development in China. These cities, due to the continued increase in economic growth despite the reduction of industrial land and the low dependence of economic development on industrial land expansion, should implement the transformational development policy. First, they should withdraw inefficient industrial land in an orderly and moderate manner, control the total land use area when ensuring stable and sustainable economic development, and stop the withdrawal of industrial land when the total land use area is reduced to the bottom line of land required for industrial development indices. Second, they should transform land-preferring policies into innovation-encouraging policies, increase financial support for innovation-based enterprises and talents, promote innovation-driven development, and reduce land waste. Third, they should enable the flexible transformation of existing land and change the pattern of land use that mainly hosts innovative industries and facilitates the transition from inefficient to efficient land use, for example, promoting the use of M0 land. M0 land is a type of urban land belonging to Class M by China’s urban-land-use classification standard. Class M also includes M1 land, M2 land, and M3 land, which are classified by their impacts on the surrounding environment. M1 land has the least impact on the surrounding environment, while M3 land may cause serious pollution. M0 land was put forward for the first time in Shenzhen’s urban planning for the purpose to promote urban innovation activities. M0 land integrates innovative industrial functions such as research and development, creativity, design, pilot testing, and pollution-free production. It mainly carries zero-pollution plants and research and development houses, while serving as commercial, dormitory, municipal, and transportation facilities.

5.2. Moderate Development Policy Zone

Moderate development policy zones were scattered throughout the country, mainly around the central cities of the provinces, including Yangzhou, Jiaxing, and Zhangjiakou. Industrial land expansion in these cities has brought considerable economic development, and since these cities are in a critical period of development and are highly dependent on industrial land expansion, a high-quality supply of industrial land should be maintained. First, industrial land should be supplied within the development boundaries of the towns. Careful consideration should be given to industrial land application, approval, and site selection without breaking the red line of the land. Second, an efficient, enterprise-friendly, land-preferential policy should be constructed. Enterprise efficiency assessment standards should be developed to reduce the land use and operating costs of efficient enterprises, and certain financial subsidies should be provided according to the efficiency rankings of enterprises. Third, policies to promote the transformation of inefficient industrial land should be established. The transformation of M2 land to M1 land should be encouraged to introduce advanced technical talents and equipment to improve the efficiency of industrial-intensive production.

5.3. Reduced Land-Supply Policy Zone

Reduced land-supply policy zones covered cities in Heilongjiang, Jilin, Liaoning, inner Mongolia, and Gansu and were mainly concentrated in northeast and northwest China, as well as south China. These cities have invested large amounts of industrial land, but they have encountered a continuous slowdown in economic growth, resulting in great land waste. Therefore, the withdrawal of industrial land should be strictly implemented, and policies should be developed in line with the principle of transforming inefficient land through efficient enterprises and the orderly withdrawal of inefficient land. First, the supply of industrial land should be compressed, and the application threshold for enterprises should be raised. The efficiencies of industrial enterprises applying for land should be assessed, and the scale of land use should be strictly limited for enterprises with high consumption and low output. Second, land-use standards and costs should be raised. Differentiated land application thresholds should be designated according to industrial sectors to increase their tax shares and land-use costs. Third, existing or potentially inefficient industrial land should be strictly withdrawn. Unused industrial land approved should be revoked, and enterprises that need industrial land should give priority to the reconstruction of existing industrial land. Furthermore, efforts should be made to enhance the dynamic monitoring of the decoupling states of cities, and the land–economic decoupling states should be precise to the year to ensure the stable and efficient use of land on a yearly basis, to force the transformation and upgrading of land use and economic development methods, and to prevent further slippage toward negative decoupling.

6. Discussion

6.1. Theoretical Value

This paper found significant spatial heterogeneity and agglomeration characteristics in the relationship between industrial land expansion and economic development in Chinese cities, which agrees with the conclusions of the previous literature. Kuang [69] found large regional differences in industrial land expansion and its economic development, showing a significant spatial pattern, with the fastest in the coastal region and the slowest in the northeast. Yang [70] found that there were great differences in industrial development between the north and south of Anhui. With the shift in policy orientation, there has been an increasingly significant variability between regions, which further suggests that industries differ in their resilience to policy in different regions and stages [67,68]. Jiang [71] each analyzed the efficiency of industrial land in different countries, and both found a significant spatial agglomeration. Xu [72] found that technology-intensive industrial land in the Beijing–Tianjin–Hebei region was increasingly concentrated in Beijing. Zhang [73] found significant spatial heterogeneity and spillover effects in Guangxi, which were significantly associated with the spatial agglomeration effect of urbanization levels.
In the analysis of the decoupling stages of cities, it was found that different decoupled cities also had significant agglomeration and heterogeneity in spatio-temporal distribution, with the first decoupled cities mostly distributed in the southeast coastal area, while the later ones were mainly in the middle and lower reaches of the Yellow River and Yangtze River. Most cities were in weak decoupling states, but there were still about 20% in strong decoupling states. This is largely consistent with the findings of the decoupling analyses of construction land and economic development by Liu [74], Wang [75], Huang [76], and Bai [77]. It should be noted that there were more and more cities in negative decoupling states. In contrast, Wang [78], when studying the decoupling relationship between urban land expansion and economic growth in Shandong from 2001 to 2016, found that more and more cities were strongly decoupled, and fewer cities were negatively decoupled, a conclusion that diverges from the one reached in this paper due to the differences in the study population and the study period. China’s economy has seen a series of major shifts since 2013, including supply-side structural reforms. In analyzing the land–economy decoupling relationship from 2015 to 2019, this paper found marked recoupling in the evolution of the decoupling states between the former and latter periods, and the cities with recoupling were mostly concentrated in northeast, northwest, and south China. In the context of slowing economic growth, we should be alert to recoupling and reduce the possibility of decoupling cities into the negative decoupling state. These empirical results are the original and new findings of this paper, which have not been mentioned or foreseen in other papers and provide a complement to the theory of urban industrial land development.
The text proposes differentiated land policies based on the decoupling results, and these policy-zoning strategies conform to the findings of the industrial land policy study. Dong [79] argued that adequate land supply and development momentum helped push the upgrading of urban industries. In this paper, cities in both the transformation development policy zone and the moderate development policy zone generally had good development momentum, and they could promote economic development by means of scientific land management. Zheng [80] and Needham [81] each found that labor-intensive enterprises were more sensitive to land policies than technology-intensive enterprises, and reasonable land management approaches could contribute to enterprise upgrading, similar to the development foothold of the reduced land-supply policy zone in the text.

6.2. Limitation and Future Implications

The methods and conclusions used in this paper are applicable not only to China, but also to India, Turkey, Pakistan, and other countries for the following two reasons. First, these countries are all in a stage of transformation from rapid industrial development to high-quality development with an industrial development similar to that of China. Second, they are developing, populous nations with a great need to establish a closed-loop industrial input–consumption–output system, and industrial land control plays a key role in the construction of such a system.
There are some shortcomings in the study of this paper due to the limitation of data. For example, as for the choice of indices, further optimization is needed. The GDP does not all come from industry, but its sources include agriculture and services. However, due to incomplete data on the industrial total output, we only used the GDP as an alternative. In addition, industrial land and economic development are in a complex relationship, and it was difficult to analyze the influencing factors of the two in-depth with the decoupling model alone, leaving the influencing mechanism of the decoupling relationship to be further studied.

7. Conclusions

The “decoupling” of economic development from land expansion has become a key topic in the exploration of intensive economic models. China is transforming from incremental expansion to stock optimization, which is typical in global industry. Based on Tapio’s decoupling model, this paper investigated the decoupling relationship between industrial land expansion and economic development in Chinese cities from 2010–2019 and concluded the following.
In terms of spatial distribution, the changes in urban industrial land showed significant spatial heterogeneity and agglomeration, and cities with high growth of land were decreasing and tended to agglomerate in Sichuan, Chongqing, and the area south of the Yangtze River, while cities with low growth were agglomerating to the northeast and northwest. In terms of evolution characteristics, the development of urban industrial economy was characterized by significant, cluster-like agglomeration, and cities with high SAV and high GDP growth were concentrated in the lower reaches of the Yangtze River, the middle and lower reaches of the Yellow River, and the western economic zone, while cities with low growth stayed concentrated in northeast and northwest China for a long time. In addition, HH cities were mainly concentrated in the Yangtze River Delta and its inland hinterland, Chengdu–Chongqing urban agglomeration, and the eastern coastal areas, while LL and HL cities were mainly in the north of China, especially in the northeast. In terms of the decoupling effect, or the type of decoupling between urban industrial land expansion and economic development, most cities were in a state of weak decoupling, but there was an increasing number of cities in the negative decoupling state. Cities of different types of decoupling showed obvious agglomeration and differentiation in the spatio-temporal distribution, with decoupled cities shifting from the southeastern coastal region to the middle and lower reaches of the Yellow River and Yangtze River, while negatively decoupled cities were mainly concentrated in the northeastern and southern regions of China and were continuously spreading to the peripheries, showing an obvious sign of recoupling. In terms of policies, it was recommended to develop differentiated industrial land-supply and supervision policies based on decoupling evaluations and to apply differentiated land management to cities and industrial sectors of different decoupling types to force the transformation and upgrading of land use and economic development methods and to guard against the recoupling of land–economy relationships.
The conclusions of this paper apply to most developing countries with flourishing industries. The use of decoupling models to analyze the relationship between industrial land change and economic growth is still in the exploratory stage, and we also call on more scholars to join us to find more generalizable conclusions through case studies and empirical research in different countries and regions or to further explore the driving forces behind decoupling development.

Author Contributions

Conceptualization, J.Q. and M.H.; methodology, J.Q.; software, J.Q.; validation, J.Q., J.Z., and M.H.; formal analysis, J.Q.; investigation, J.Q.; resources, J.Q.; data curation, J.Q.; writing—original draft preparation, J.Q.; writing—review and editing, J.Q., B.H., and M.H.; visualization, J.Q.; supervision, H.W. and M.H.; project administration, M.H.; funding acquisition, M.H. All authors have read and agreed to the published version of the manuscript.

Funding

This research received no external funding.

Institutional Review Board Statement

Not applicable.

Informed Consent Statement

Not applicable.

Data Availability Statement

Not applicable.

Conflicts of Interest

The authors declare no conflict of interest.

References

  1. Semova, N.G. Problems of reindustrialization: Approaches to its study at the beginning of the XXI century. Vopr. Istor. 2019, 10, 14–31. [Google Scholar] [CrossRef]
  2. Nagy, B.; Lengyel, I.; Udvari, B. Reindustrialization patterns in the post-socialist EU members: A comparative study between 2000 and 2017. Eur. J. Comp. Econ. 2020, 17, 253–275. [Google Scholar] [CrossRef]
  3. Lei, W.Q.; Jiao, L.M.; Xu, G. Understanding the urban scaling of urban land with an internal structure view to characterize China’s urbanization. Land Use Policy 2022, 112, 105781. [Google Scholar] [CrossRef]
  4. Obeng-Odoom, F. Industrial policy, economic theory, and ecological planning. Int. Rev. Appl. Econ. 2022, 36, 285–290. [Google Scholar] [CrossRef]
  5. Rajinipriya, M.; Nagalakshmaiah, M.; Robert, M. Importance of Agricultural and Industrial Waste in the Field of Nanocellulose and Recent Industrial Developments of Wood Based Nanocellulose: A Review. ACS Sustain. Chem. Eng. 2018, 6, 2807–2828. [Google Scholar] [CrossRef]
  6. Li, T.K.; Liu, Y.; Lin, S.J. Soil Pollution Management in China: A Brief Introduction. Sustainability 2019, 11, 556. [Google Scholar] [CrossRef] [Green Version]
  7. Abrantes, P.; Fontes, I.; Gomes, E.; Rocha, J. Compliance of land cover changes with municipal land use planning: Evidence from the Lisbon metropolitan region (1990–2007). Land Use Policy 2016, 51, 120–134. [Google Scholar] [CrossRef]
  8. Hu, Z.J. China Urban Construction Statistical Yearbook; Ministry of Housing and Urban-Rural Development of the People’s Republic of China: Beijing, China, 2019; pp. 48–83. [CrossRef]
  9. Industry (Including Construction), Value Added (Constant 2015 US$) World Development Indicators. Available online: www.data.worldbank.org/indicator/NV.IND.TOTL.KD (accessed on 15 April 2022).
  10. Taylor, P.J.; Ni, P.; Derudder, B. Measuring the world city network: New results and developments. GaWC Res. Bull. 2010, 300, 1–8. Available online: https://www.lboro.ac.uk/gawc/rb/rb300.html (accessed on 23 June 2022).
  11. Raźniak, P.; Dorocki, S.; Winiarczyk-Raźniak, A. Spatial changes in the command and control function of cities based on the corporate centre of gravity model. Misc. Geogr. 2020, 24, 35–41. [Google Scholar] [CrossRef] [Green Version]
  12. Csomós, G. Cities as Command and Control Centres of the World Economy: An Empirical Analysis, 2006–2015. Bull. Geogr. 2017, 38, 7–26. [Google Scholar] [CrossRef] [Green Version]
  13. Raźniak, P.; Csomós, G.; Dorocki, S.; Winiarczyk-Raźniak, A. Exploring the Shifting Geographical Pattern of the GLobal Command-and-Control Function of Cities. Sustainability 2021, 13, 12798. [Google Scholar] [CrossRef]
  14. Derudder, B.; Cao, Z.; Liu, X. Changing Connectivities of Chinese Cities in the World City Network, 2010–2016. Chin. Geogr. Sci. 2018, 28, 183–201. [Google Scholar] [CrossRef] [Green Version]
  15. Zhang, W.; Wang, J.N.; Zhang, B. Can China Comply with Its 12th Five-Year Plan on Industrial Emissions Control: A Structural Decomposition Analysis. Environ. Sci. Technol. 2015, 49, 4816–4824. [Google Scholar] [CrossRef]
  16. Song, X.X.; Liu, Y.Z.; Zhu, X.N. The impacts of urban land expansion on ecosystem services in Wuhan, China. Environ. Sci. Pollut. Res. 2022, 29, 10635–10648. [Google Scholar] [CrossRef]
  17. Li, C.X.; Gao, X.; Wu, J.Y. Demand prediction and regulation zoning of urban-industrial land: Evidence from Beijing-Tianjin-Hebei Urban Agglomeration, China. Environ. Monit. Assess. 2019, 191, 412. [Google Scholar] [CrossRef]
  18. Liu, S.S.; Liao, Q.P.; Liang, Y. Spatio-Temporal Heterogeneity of Urban Expansion and Population Growth in China. Int. J. Environ. Res. Public Health 2022, 18, 13031. [Google Scholar] [CrossRef]
  19. Silva, F.B.E.; Koomen, E.; Diogo, V. Estimating Demand for Industrial and Commercial Land Use Given Economic Forecasts. PLoS ONE 2014, 9, e91991. [Google Scholar] [CrossRef] [Green Version]
  20. Vandermeer, M.C.; Halleux, J.M. Evaluation of the Spatial and Economic Effectiveness of Industrial Land Policies in Northwest Europe. Eur. Plan. Stud. 2017, 25, 1454–1475. [Google Scholar] [CrossRef] [Green Version]
  21. Louw, E.; van der Krabben, E.; van Amsterdam, H. The Spatial Productivity of Industrial Land. Reg. Stud. 2012, 46, 137–147. [Google Scholar] [CrossRef] [Green Version]
  22. Folmer, E.; Risselada, A. Planning the Neighbourhood Economy: Land-Use Plans and the Economic Potential of Urban Residential Neighbourhoods in the Netherlands. Eur. Plan. Stud. 2013, 21, 1873–1894. [Google Scholar] [CrossRef]
  23. Langer, S.; Korzhenevych, A. The effect of industrial and commercial land consumption on municipal tax revenue: Evidence from Bavaria. Land Use Policy 2018, 77, 279–287. [Google Scholar] [CrossRef]
  24. Chen, W.; Chen, W.J. Exploring the industrial land use efficiency of China’s resource-based cities. Cities 2019, 93, 215–223. [Google Scholar] [CrossRef]
  25. Ustaoglu, E.; Lavalle, C. Examining lag effects between industrial land development and regional economic changes: The Netherlands experience. PLoS ONE 2017, 12, e0183285. [Google Scholar] [CrossRef] [PubMed] [Green Version]
  26. Shih, C.M.; Yen, S.Y. Transformation of the Sugar Industry and Land Use Policy in Taiwan. J. Asian Archit. Build. Eng. 2009, 8, 41–48. [Google Scholar] [CrossRef]
  27. Ouoba, Y. Industrial mining land use and poverty in regions of Burkina Faso. Agric. Econ. 2018, 49, 511–520. [Google Scholar] [CrossRef]
  28. Zhao, X.F.; Zhang, L. Evolution of the Spatiotemporal Pattern of Urban Industrial Land Use Efficiency in China. Sustainability 2018, 10, 2174. [Google Scholar] [CrossRef] [Green Version]
  29. Liu, Y.J.; Zhou, G.L.; Liu, D.G. The Interaction of Population, Industry and Land in Process of Urbanization in China: A Case Study in Jilin Province. Chin. Geogr. Sci. 2018, 28, 529–542. [Google Scholar] [CrossRef] [Green Version]
  30. Tu, F.; Yu, X.F.; Ruan, J.Q. Industrial land use efficiency under government intervention: Evidence from Hangzhou, China. Habitat Int. 2014, 43, 1–10. [Google Scholar] [CrossRef]
  31. Qiao, L.; Huang, H.P. The Identification and Use Efficiency Evaluation of Urban Industrial Land Based on Multi-Source Data. Sustainability 2019, 11, 6149. [Google Scholar] [CrossRef] [Green Version]
  32. Xiong, C.; Lu, J.Y. Urban Industrial Land Expansion and Its Influencing Factors in Shunde: 1995–2017. Complexity 2020, 2020, 6769176. [Google Scholar] [CrossRef]
  33. Li, C.X.; Gao, X.; He, B.J. Coupling Coordination Relationships between Urban-industrial Land Use Efficiency and Accessibility of Highway Networks: Evidence from Beijing-Tianjin-Hebei Urban Agglomeration, China. Sustainability 2019, 11, 1446. [Google Scholar] [CrossRef] [Green Version]
  34. Li, D.; Yang, L.; Lin, J. How industrial landscape affects the regional industrial economy: A spatial heterogeneity framework. Habitat Int. 2020, 100, 102187. [Google Scholar] [CrossRef]
  35. Li, M.; Shi, Y.Y.; Duan, W.K. Spatiotemporal Decoupling of Population, Economy, and Construction Land Changes in Hebei Province. Sustainability 2019, 11, 6794. [Google Scholar] [CrossRef] [Green Version]
  36. Zhao, S.D.; Zhao, K.X.; Yan, Y.R. Spatio-Temporal Evolution Characteristics, and Influencing Factors of Urban Service-Industry Land in China. Land 2022, 11, 13. [Google Scholar] [CrossRef]
  37. Wiedenhofer, D.; Virag, D.; Virag, D. A systematic review of the evidence on decoupling of GDP, resource use and GHG emissions, part I: Bibliometric and conceptual mapping. Environ. Res. Lett. 2020, 15, 65002. [Google Scholar] [CrossRef]
  38. Yasmeen, H.; Tan, Q.M. Assessing Pakistan’s energy use, environmental degradation, and economic progress based on Tapio decoupling model. Environ. Sci. Pollut. Res. 2021, 28, 68364–68378. [Google Scholar] [CrossRef]
  39. Chen, J.D.; Wang, P.; Cui, L.B. Decomposition and decoupling analysis of CO2 emissions in OECD. Appl. Energy 2018, 231, 937–950. [Google Scholar] [CrossRef]
  40. Chen, X.P.; Pang, J.X.; Zhang, Z.L. Sustainability Assessment of Solid Waste Management in China: A Decoupling and Decomposition Analysis. Sustainability 2014, 6, 9268–9281. [Google Scholar] [CrossRef] [Green Version]
  41. Zhao, S.; Yan, Y.; Han, J. Industrial Land Change in Chinese Silk Road Cities and Its Influence on Environments. Land 2021, 10, 806. [Google Scholar] [CrossRef]
  42. Xie, H.L.; Chen, Q.R.; Lu, F.C. Spatial-temporal disparities and influencing factors of total-factor green use efficiency of industrial land in China. J. Clean. Prod. 2019, 207, 1047–1058. [Google Scholar] [CrossRef]
  43. Liu, S.C.; Lin, Y.B. Spatial-temporal characteristics of industrial land use efficiency in provincial China based on a stochastic frontier production function approach. J. Clean. Prod. 2021, 295, 126432. [Google Scholar] [CrossRef]
  44. Xie, H.L.; Wang, W. Spatiotemporal differences and convergence of urban industrial land use efficiency for China’s major economic zones. J. Geogr. Sci. 2015, 25, 1183–1198. [Google Scholar] [CrossRef]
  45. Xu, G.Y.; Geng, M.Z. The effect of industrial relocations to central and Western China on urban construction land expansion. J. Land Use Sci. 2021, 16, 339–357. [Google Scholar] [CrossRef]
  46. Zhou, L.; Tian, L. How did industrial land supply respond to transitions in state strategy? An analysis of prefecture-level cities in China from 2007 to 2016. Land Use Policy 2019, 87, 104009. [Google Scholar] [CrossRef]
  47. Huang, Z.J.; He, C.F. Local government intervention, firm-government connection, and industrial land expansion in China. J. Urban Aff. 2017, 41, 206–222. [Google Scholar] [CrossRef]
  48. Li, Y.N.; Cai, M.M.; Wu, K.Y.; Wei, J.C. Decoupling analysis of carbon emission from construction land in Shanghai. J. Clean. Prod. 2019, 210, 25–34. [Google Scholar] [CrossRef]
  49. Zhang, Z.X.; Hu, B.Q.; Shi, K.F.; Su, K.C.; Yang, Q.Y. Exploring the dynamic, forecast and decoupling effect of land natural capital utilization in the hinterland of the Three Gorges Reservoir area, China. Sci. Total Environ. 2020, 718, 134832. [Google Scholar] [CrossRef]
  50. Zhang, X.; Li, M.; Li, Q. Spatial Threshold Effect of Industrial Land Use Efficiency on Industrial Carbon Emissions: A Case Study in China. Int. J. Environ. Res. Public Health 2021, 18, 9368. [Google Scholar] [CrossRef]
  51. Wang, C.Y.; Liang, S.K.; Li, Y.B. The spatial distribution of dissolved and particulate heavy metals and their response to land-based inputs and tides in a semi-enclosed industrial embayment: Jiaozhou Bay, China. Environ. Sci. Pollut. Res. 2015, 22, 10480–10495. [Google Scholar] [CrossRef]
  52. Ustaoglu, E.; Silva, F.B.E.; Lavalle, C. Quantifying and modelling industrial and commercial land-use demand in France. Environ. Dev. Sustain. 2020, 22, 519–549. [Google Scholar] [CrossRef]
  53. Zhang, D.X.; Zhang, J.F.; Han, R. Two-stage development, allocation strategies’ effect, and industrial land policies’ adjustment, China. Growth Chang. 2022, 53, 890–909. [Google Scholar] [CrossRef]
  54. He, C.F.; Mao, X.Y. Emerging Themes of Environmental Economic Geography in China. Sci. Geol. Sin. 2021, 41, 1497–1504. [Google Scholar] [CrossRef]
  55. Organization for Economic Cooperation and Development. Indicators to Measure Decoupling of Environmental Pressure and Economic Growth; OECD: Paris, France, 2002. [Google Scholar]
  56. Longhofer, W.; Jorgenson, A. Decoupling reconsidered: Does world society integration influence the relationship between the environment and economic development? Soc. Sci. Res. 2017, 65, 17–29. [Google Scholar] [CrossRef]
  57. Zhang, L.H.; Ma, X.; Wang, Y.X. The increasing district heating energy consumption of the building sector in China: Decomposition and decoupling analysis. J. Clean Prod. 2020, 271, 122696. [Google Scholar] [CrossRef]
  58. Zhou, D.Q.; Zhang, L.; Zha, D.L.; Wu, F.; Wang, Q.W. Decoupling and decomposing analysis of construction industry’s energy consumption in China. Nat. Hazards 2019, 95, 39–53. [Google Scholar] [CrossRef]
  59. Naseem, S.; Mohsin, M.; Zia-UR-Rehman, M.; Baig, S.A.; Sarfraz, M. The influence of energy consumption and economic growth on environmental degradation in BRICS countries: An application of the ARDL model and decoupling index. Environ Sci Pollut Res 2021, 29, 13042–13055. [Google Scholar] [CrossRef]
  60. Guo, J.; Li, C.Z.; Wei, C. Decoupling economic and energy growth: Aspiration or reality? Environ. Res. Lett. 2021, 16, 044017. [Google Scholar] [CrossRef]
  61. Dong, F.; Li, J.Y.; Zhang, X.Y.; Zhu, J. Decoupling relationship between haze pollution and economic growth: A new decoupling index. Ecol. Indic. 2021, 129, 107859. [Google Scholar] [CrossRef]
  62. Liu, L.L.; Ding, D.H.; He, J. Fiscal Decentralization, Economic Growth, and Haze Pollution Decoupling Effects: A Simple Model and Evidence from China. Comput. Econ. 2019, 54, 1423–1441. [Google Scholar] [CrossRef]
  63. Lundquist, S. Explaining events of strong decoupling from CO2 and NOx emissions in the OECD 1994–2016. Sci. Total Environ. 2021, 793, 148390. [Google Scholar] [CrossRef]
  64. Gan, L.; Shi, H.; Hu, Y. Coupling coordination degree for urbanization city-industry integration level: Sichuan case. Sustain. Cities Soc. 2020, 58, 102136. [Google Scholar] [CrossRef]
  65. Schwarz, N.; Haase, D.; Seppelt, R. Omnipresent Sprawl? A Review of Urban Simulation Models with Respect to Urban Shrinkage. Environ. Plan. B Plan. Des. 2010, 37, 265–283. [Google Scholar] [CrossRef]
  66. Zhang, P.; Hu, J.; Zhao, K.; Chen, H.; Zhao, S.; Li, W. Dynamics and Decoupling Analysis of Carbon Emissions from Construction Industry in China. Buildings 2022, 12, 257. [Google Scholar] [CrossRef]
  67. Song, M.L.; Wang, S.H.; Wu, K.Y. Environment-biased technological progress and industrial land-use efficiency in China’s new normal. Ann. Oper. Res. 2018, 268, 425–440. [Google Scholar] [CrossRef]
  68. Selvaggi, R.; Pappalardo, G.; Chinnici, G. Assessing land efficiency of biomethane industry: A case study of Sicily. Energy Policy 2018, 119, 689–695. [Google Scholar] [CrossRef]
  69. Kuang, W.H.; Liu, J.Y.; Dong, J.W. The rapid and massive urban and industrial land expansions in China between 1990 and 2010: A CLUD-based analysis of their trajectories, patterns, and driver. Landsc. Urban Plan. 2016, 145, 21–33. [Google Scholar] [CrossRef]
  70. Yang, Y.T.; Jiang, G.H.; Zheng, Q.Y. Does the land use structure change conform to the evolution law of industrial structure? An empirical study of Anhui Province, China. Land Use Policy 2019, 81, 657–667. [Google Scholar] [CrossRef]
  71. Jiang, H.L. Spatial-temporal differences of industrial land use efficiency and its influencing factors for China’s central region: Analyzed by SBM model. Environ. Technol. Innov. 2021, 22, 101489. [Google Scholar] [CrossRef]
  72. Xu, M.Y.; Zhang, Z.F. Spatial differentiation characteristics and driving mechanism of rural-industrial Land transition: A case study of Beijing-Tianjin-Hebei region, China. Land Use Policy 2021, 102, 105239. [Google Scholar] [CrossRef]
  73. Zhang, Y.J.; Su, Z.G. Spatial-Temporal Evolution of Sustainable Urbanization Development: A Perspective of the Coupling Coordination Development Based on Population, Industry, and Built-Up Land Spatial Agglomeration. Sustainability 2018, 10, 1766. [Google Scholar] [CrossRef] [Green Version]
  74. Liu, J.M.; Hou, X.H. Study the effect of industrial structure optimization on urban land-use efficiency in China. Land Use Policy 2021, 105, 105390. [Google Scholar] [CrossRef]
  75. Wang, Y.H.; Hu, S.G. Decoupling Relationship between China’s Construction Land Expansion and Economic Growth and Its Control Strategies. China Land Sci. 2019, 33, 68–76. [Google Scholar]
  76. Huang, M.Y.; Yue, W.Z. Decoupling Relationship between Urban Expansion and Economic Growth and Its Spatial Heterogeneity in the Yangtze Economic Belt. J. Nat. Resour. 2018, 33, 219–232. [Google Scholar]
  77. Bai, Z.J.; Zang, B. On the Degree of Decoupling and Re- coupling of Spatial and Temporal Evolution of Urban Expansion Speed and Economic Development From 2000 to 2010: A Case Study of Chongqing City. Econ. Geogr. 2013, 33, 52–60. [Google Scholar]
  78. Wang, X.Y.; Gao, P.C. Decoupling Analysis between Urban Land Expansion and Economic Growth at the Different Scale: A Case Study of Shandong Province in China. Econ. Geogr. 2021, 41, 97–104. [Google Scholar] [CrossRef]
  79. Dong, Z.Y.Z.; Li, Y.C.; Balland, P.A.; Zheng, S.Q. Industrial land policy and economic complexity of Chinese Cities. Ind. Innov. 2021, 29, 367–395. [Google Scholar] [CrossRef]
  80. Zheng, D.; Shi, M.J. Industrial land policy, firm heterogeneity and firm location choice: Evidence from China. Land Use Policy 2018, 76, 58–67. [Google Scholar] [CrossRef]
  81. Needham, B.; Louw, E.; Metzemakers, P. An economic theory for industrial land policy. Land Use Policy 2013, 33, 227–234. [Google Scholar] [CrossRef]
Figure 1. Study Area. The approval number of the national boundary of China is GS (2020) 4628, which comes from the standard map service system undertaken by the Ministry of Natural Resources of China: http://bzdt.ch.mnr.gov.cn (accessed on 23 June 2022).
Land 11 01209 g001
Figure 2. The decoupling relationship between industrial land (∆LAND) and economic development (∆GDP).
Land 11 01209 g002
Figure 3. The research framework of decoupling degree to evaluation.
Land 11 01209 g003
Figure 4. Distribution of industrial land scale.
Land 11 01209 g004
Figure 5. Distribution of industrial land and economic change rate.
Land 11 01209 g005
Figure 6. Decoupling type and spatial autocorrelation of industrial land and second-industry added value.
Land 11 01209 g006
Figure 7. Decoupling type and spatial autocorrelation of industrial land and gross domestic product.
Land 11 01209 g007
Figure 8. Distribution of decoupling changes between industrial land and economic development.
Land 11 01209 g008
Figure 9. Distribution of policy zones based on INL–SAV and INL–GDP.
Land 11 01209 g009
Table 1. Statistical analysis of average annual growth rate.
IndexMax.Min.MeanCOVMoran’s I
2010–2014INL128.55−39.391.1813.560.035
SAV110.20−46.3912.751.300.050
GDP61.88−10.4013.230.590.109
2015–2019INL68.10−39.143.184.140.042
SAV37.50−36.004.092.390.215
GDP32.93−22.418.420.920.330
Table 2. Statistical analysis of average annual growth rate.
INL–GDP
A 1BCDEFGH
INL–SAVA55 2 (A 3)0 (B)0 (C)0 (D)0 (E)0 (F)0 (G)0 (H)
B0 (B)79 (B)1 (C)0 (D)0 (E)0 (F)0 (G)1 (H)
C0 (C)14 (C)5 (C)2 (D)0 (E)0 (F)0 (G)1 (H)
D0 (D)13 (D)10 (D)24 (D)0 (E)0 (F)0 (G)0 (H)
E9 (E)0 (E)0 (E)0 (E)2 (E)0 (F)0 (G)0 (H)
F2 (F)0 (F)0 (F)0 (F)2 (F)0 (F)0 (G)0 (H)
G2 (G)2 (G)0 (G)0 (G)0 (G)2 (G)8 (G)0 (H)
H0 (H)17 (H)4 (H)13 (H)0 (H)0 (H)0 (H)19 (H)
1 A–H represent eight decoupling types of cities, which are strong decoupling, weak decoupling, expansive decoupling, expansive negative decoupling, recursive decoupling, recursive coupling, weak negative decoupling, and strong negative decoupling, respectively. 2 The numbers represent the number of cities in each combination of decoupling types of INL–SAV and INL–GDP; for example, 55 means there were 55 cities in the combination of A–A. 3 The letters in brackets represent the final decoupling type of cities; for example, A means the final type of cities in the combination of A–A was strong decoupling.
Table 3. Statistical analysis of average annual growth rate.
Decoupling TypeDevelopment StatusPolicy Orientation
Strong decoupling,Healthy development with less dependence on land expansionTransformation development
weak decoupling,
and expansive negative decoupling
Expansive couplingBasic equivalence between urban development and land expansionModerate development
and recessive decoupling
Recessive coupling,Urban development does not need as much land, and the excess supply of land leads to waste of resourcesReduced land supply
weak negative decoupling,
and strong negative decoupling
Publisher’s Note: MDPI stays neutral with regard to jurisdictional claims in published maps and institutional affiliations.

